Embed Size (px)
Citation preview

AD-AI09 723 TRW DEFENSE AND SPACE SYSTEMS GROUP REDONDO BEACH CA F/G 9/1SATELLITE 9443 DSCS I ANOMALY REPORT NARROW COVERAGE DOWNLINK --ETC(U)AUG 81 A P FAY FO4701-8O -C-0022
UNCLASSIFIED TRW-3 AOb-AR-02A-01 SD-TR-81-98 NLEEEEEEEEEEEEIII/////////hhB-//I/I/I/I/hlE/IIII///EEI/Ir EN

f~ll I.0 ~ ~1111125
L IIIQIr
I. IU11111125 Jill=,_ L-4 __
* MI(.RO()F'Y RLS()1Ii1ION II SI I HARI%,',I, , -N T ~

SD-TR-81-98
SATELLITE 9443
DSCS II ANOMALY REPORTNARROW COVERAGE DOWNLINK NOISE
14 AUGUST 1981
Report No. 36060-AR-024-01CORL No. 009A3F04701-80-C-0022
Prepared fori ~JAN 1 9 18
Space Division S,Air Force Systems Command
Los Angeles Air Force Station ..AP.O. Box 92960, Worldway Postal Center
Los Angeles, California 90009
APPROVED FOR PUBLIC RELEASE;DISTRIBUTION UNLIMITED
TRWOne Space Park Redondo Beach, California 90278

This report was submitted by the TRW Defense and Space Systems
Group, Redondo Beach, CA 90278, under Contract F04701-80-C-0022 with the
Space Division, Deputy for Space Communications Systems, P.O. Box 92960,
Worldway Postal Center, Los Angeles, CA 90009. It was reviewed and
approved for TRW Defense and Space Systems Group by R. H. Alborn,
Manager, DSCS II Orbital Operations. Capt John A. Fredricks, SD/YKD was
the project engineer.
This report has been reviewed by the Office of Public Affairs (PAS)
and is releasable to the National Technical Information Service (NTIS).
At NTIS, it will be available to the general public, including foreign
nations.
This technical report has been reviewed and is approved for
publication. Publication of this report does not constitute Air Force
approval of the report's findings or conclusions. It is published only
for the exchange and stimulation of ideas.
JOHf FREDRICKS Cfapain, USAF ALBERT E. ROSS, M , USAFProject Engineer Program Manager, DSCS
FOR THO COMMANDER
AMEE. FREYTAG, Coli9414 AF
/ys)em Program Diredor, OtCSW uty for Space Comm Systems

UnclassmtleaSECURITY CLASSIFICATION OF THIS PAGE (When Dota 9nered)_
READ INSTRUCTIONSREPORT DOCUMENTATION PAGE BEFORE COMPLETING FORM
1. REPORT NUMBER 2 GOVT ACCESSION NO. 3. RECIPIENT'S CATALOG NUMBERSD-TR-81-98 > -; /
4. TITLE (rand Subtilie) S. TYPE OF REPORT & PERIOD COVERED
Satellite 9443 DSCS II Anomaly ReportNarrow Coverage Downlink Noise Final Report
6. PERFORMING 01. REPORT NUMBER
36060-AR-024-017. AUTHOR(s) S. CONTRACT OR GRANT NUMBER(s)
A. P. Fay F04701-80-C-0022
9. PERFORMING ORGANIZATION NAME AND ADDRESS 10. PROGRAM ELEMENT. PROJECT. TASK
TRW Defense and Space Systems Group AREA S WORK UNIT NUMBERSOne Space Park -Redondo Beach, CA 90278
II. CONTROLLING OFFICE NAME AND ADDRESS 12. REPORT DATE
Space Division 14 August1981Dept. of the Air Force Headquarters ,s. NUMBEROFtPAGESP. 0. Box 92960, Los Angeles, CA 90009 48
14. MONITORING AGENCY NAME A AODRESS(II dillferent from Controlling Office) IS. SECURITY CLASS. (of this report)
Unclassified
ISa. DECLASSIFICATION/DOWNGRADINGSCHEDULE
IS. DISTRIBUTION STATEMENT (of this Report)
Approved for public release, distribution unlimited
17. DISTRIBUTION STATEMENT (of the abstract entered in Bfock 20, it different from Report)
IS. SUPPLEMENTARY NOTES
19. KEY WORDS (Continue on reverse side it necessary and Identify by block number)
Travelling Wave Tube Amplifier, DSCS II, Satellite 9443
20. ABSTRACT (Continue on reverse side if necessary and Identify by block number)
Presents the results of an investigation of the cause of noise pulses in theRF downlink, considering orbital data and laboratory simulation. Ascribesthe cause-to an arc in the cathode circuitry of the TWT, which is a functionof the vacuum level.
DD , 1473 EDITIONOF INOVSISOBSOLETE Unclassified
SECURITY CLASSIFICATION OF THIS PAGE (*Won Data Bnted

SATELLITE 9443
DSCS II ANOMALY REPORT
NARROW COVERAGE DOWNLINK NOISE
CDRL No. 009A3
F04701-80-C-002214 August 1981
Prepared by:ay /
Approved: ( 4 Approved: <-. .
H Be ner, r. R. H. AibornMWnager ManagerDSCS II Project DSCS II Orbital Operations
TRW .........
• ' " " ",_" ..... .. .... . ... .. .. ... .." M me .. ..... .. ... . . . . . -ow.. ,

CONTENTS
PAGE
1. INTRODUCTION 1
1.1 Summnary of Investigation 1
2. ORBITAL CHRONOLOGY 4
2.1 Orbital History 4
2.2 Anomaly Chronology 4
3. ANALYSIS OF ORBITAL AND GROUND TEST DATA 6
3.1 On-Orbit Test Analysis 6
3.2 Ground Test Analysis 9
3.2.1 S/N 24-1 Test and Documentation Review 9
3.2.2 General TWTA Anomaly History Review 10
3.2.3 TWTA Laboratory Tests 10
3.2.3.1 Arcing Tests Results 10
3.2.3.2 Conmmand Power Interrupt Tests Results 17
3.2.3.3 Shorted Input Filter Capacitor Tests Results 23
3.2.3.4 Helix Regulator Interrupt Test Results 25
3.2.3.5 TWT Sensitivity to Cathode and Anode Voltage Variations 27
3.2.3.6 Partial Vacuum Spark Test Results 32
3.3 RF Signal Evaluation 37
4. CAUSES OF ANOMALOUS PERFORMANCE 40
4.1 Analysis of Signature 40
4.2 Possible Arc Locations 41
4.3 Arcing at Low Pressures 42
5. RECOMMENDATIONS 4

ILLUSTRATIONS
PAGE
Figure
1.1-1 DSCS II Communications Subsystem Block Diagram 2
1.1-2 Communications Transmitter Section 3
3.1-1 Typical Noise Pulses During One Day (19 March 81) 8
3.2.3.1-1 Spark Test Configuration 12
3.2.3.1-2 Cathode Spark Strip Chart 14
3.2.3.1-3 RF Amplitude Waveform from Spectrum Analyzer 15
3.2.3.1-4A Collector Spark RF Phase Transient 16
3.2.3.1-4B Cathode Spark RF Phase Transient 16
3.2.3.1-5 Collector Spark Strip Chart with Cathode Spare 18k Data Comparison
3.2.3.2-1 Interrupt Test Configuration 19
3.2.3.2-2 Command Interrupt Tests 21
3.2.3.2-3 Power Line Interrupt Test Data, Saturated RF 22Output
3.2.3.3-1 Shorted Filter Capacitor Test Configuration 23
3.2.3.3-2 Filter Capacitor Test Data 24
3.2.3.4-1 Helix Regulator Test Setup 25
3.2.3.4-2 Helix Regulator Schematic 26
3.2.3.4-3 Helix Regulator Output (50V/cm, 20 ms/cm) 28
3.2.3.4-4 Spectrum Analyzer Waveform of RF Output at 10 d8 28Down from Saturation (300 kHz BW, scan mode)
3.2.3.4-5 Helix Regulator Test Strip Charts 29
3.2.3.5-1 RF Power Output Variations About the Nominal Value 31for Three Levels of Power Output Vs Changes in EkMagnitude
3.2.3.5-2 RF Power Output Variations About the Nominal Value 31for Three Levels of Power Output Vs Changes in Ea

ILLUSTRATIONS (Cont'd)
PAGE
Figure
3.2.3.5-3 Variations in RF Output Phase for Two Drive Levels 33Vs Changes in Ek Magnitude
3.2.3.5-4 Variations in RF Output Phase For Two Drive Levels 33
Vs Changes in Ea
3.2.3.6-1 Configuration for Low Pressure Spark Tests 34
3.2.3.6-2 Spark Discharges at Reduced Pressure 36
3.3-1 Harris Test Set-Up 38
3.3-2 Harris Test Measurements 39
iv
- - . . . . . . . . . . . . . . . I I I I. . . . . . . .. I I l . . . . . . . . I . . . I I - " I . . .
1. INTRODUCTION
On February 19, 1981, a narrow coverage high level traveling
wave tube amplifier (NCHLTWTA-2, S/N 24-6) on Satellite 9443 shut off
without warning or receiving ground commands. A redundant HLTWTA
(SN 24-1) was commanded on and communication service was restored.
This occurrence represented the first on-orbit failure of a 40 watt
HLTWTA. Within a few hours after turn-on, several ground stations
reported occasional loss of data on their narrow coverage high
data links which was attributed to noise on the RF link. Monitor-
ing of the narrow coverage down link showed that noise spikes were
occurring at a repetition rate varying from thirty to sixty spikes
per minute. Also observed were quiescent periods lasting several
minutes where no spikes occurred.
An anomaly team was formed to investigate the RF noise spikes.
This report summarizes the investigations and findings of the team
made up of TRW, Hughes, Aerospace, Space Division, and Harris
engineers.
1.1 Summary of Investigation
Figure 1.1-1 shows a block diagram of the communication
transponder and Figure 1.1-2 shows an expanded version of the
transmitter section. Study of these block diagrams shows that a
number of possible sources exist to cause an RF spike on the
narrow coverage output. By performing a series of on-orbit
tests, described in Section 3.1, the primary cause was narrowed
down to the HLTWTA, with a very remote possibility of the LLTWTAor TDSA. Ground testing at Hughes Electron Dynamics Division (HEDD),
as described in Section 3.2, was able to reproduce the on-orbit anomaly
signature by causing arcs to occur in the cathode circuitry. Analysis
of all test data, as described in Section 4.0, led to the conclusion
that the RF spikes were caused by an arc occurring in a relatively high
vacuum (10-5 Torr) from a wire in the cathode circuit of the tube to
the end of the TWTA housing. The arc did not occur in any potting
material.

a 3Wggg 6a - - I* .~t riI ~ ~ ~IIa am 5~ s. Ja* ma u-u gI -'a -, a* -I II -* ~ ~ 'I
a * S
~iI ~ Ij -~ a- * 2K
I I.. a- I* K2~ ~'
I =-- ~ I'- IIII~
I '*) ~n a1~ I
* ~. 4- ~! £ - I
J !~ ~ ~I- ~
"3 I -a-
~; ~ S V
I U I Ij~ ~u a -I -
I I ~na
a -I -
I -I a
* .-.
I "~
* II I
g I~ i~ii -~zjg I
I aI aim I
S ~i~i s~ Ia II
I. ~ ~~iIIt Vtaa~.c .----------- 1

- - - r FILTER/COUPLERt ASSY -11 1 (EARTH COVERAGE)
TRIM TA(ARHFIXED TRIM FPAD~ COVEGE ATTEN7UATOR PAD
FROM ITUNNEL DIODE IIRECEIVERS SLMMING IHBICHANNELS AMPLIFIER -1 HYRIEE AND NE (EARTH COVERAGE) I
L - -
FILTER/COUPLER ASSY(NARROW COVERAGE)
RCIESSUMMING IIHYBRIDCHANNEI AMPLIFIER -2
COVERAGEGE)
m mm mJ L mmm m
NOTE: CIRCULATOR SWITCHES ARE CONTROLLED BY COMMANDSUSED TO TURN HLTWTA'S ON AND OFF.
Figure 1.1-2.

TEST PORT
mSS -11 m m
GE)
CIRCULATOR
PDCOVERAGE) ~ m ig~OUTPUT FILTER ASSY -
I I (EARTH COVERAGE)
TRIMPAD 7250.1 MHz I
BYRID HYBRID BEACF FROM COUPL.....
TRIM GENERATOR I1I Li mi m
...-. J I TRANSMIT LEVEL SENSOR' I (EARTH COVERAGE)
3TO PCM AMPLI- DETEC- TRIMmmm mmm mmENCODER FIER TOR PAD
TEST PORT Lmm n- m
TRIM TO FREQUENCYPAGENERATOR BEACONPAD LEVEL CONTROL
ER ASSY -2 *T EVERAGE) TORE
r r r -- - i rWAVEGUIDEr' - r- -i r-- 'i -- ,CIRCULATOR
1-4. ~ 4ISWITCH -3L -- -J L_. .J L - J - -JW gfm OUTPUT FILTER ASSY -2I ~ (NARROW COVERAGE)
PD 7675.1 MHzLPQUNC 9FF COUPL
TRM GENERATOR gI
IL =.........COUPL' TRANSMIT LEVEL SENSOR
COPLRHYBRID HLWA- m m---.i (NARROW COVERAGE)COVERAGE)I
3TO PCM AML- DTC TRIMENOE FmImER m PAD
TRM TO FREQUENCYL-- m-mmmPAD ~GENERATOR BEACONL
.......
LEVEL CONTROL TO RE
1.-.Commnunications Transmitter Section

EARTH COVERAGE
WAVEGUIDE TRANSMIT
HLTWTA I. CIRCULATOR(EARTH -- SWITCH -2COVERAGE) al rm~ ~-
OUTPUT FILTER ASSY -1~ I (EARTH COVERAGE)
50.1MHz I
EQUENCYIENERATOR
-J
-, L. * ' I (EARTH COVERAGE)
LI
L . . . . . -. ...-
NARROWTO RECEIVER O.M.T. TORAGEIT
WAVEGUIDE RECEIVEr ---- I CIRCULATOR
O U PU - -m mE - - - - m - 2a ISO LATO R
TECO ROM2
HLTWA -?~ - ~ I (NARROW COVERAGE)
BCOVFRAGE IFP 1 BF COPE HTL
ENCODRRAIRTTR
L -- -- - - - - - NO. 1 EAS
TRANSMIT TVANSSEITO
CORECEIVE
TO PM AMLI- ETEC ISOAT3
ENCODR FIR TO
In order to preclude this type of problem in the future, it
is necessary to vent the TWTA housing to space to maintain a high
vacuum (< 10-5 TORR) which will not sustain an arc. As part of
the HLTWTA collector depotting program for F15 and F16, the TWTA
case has had a venting hole added. This fortuitous change will
preclude any arcing of the type seen on 9443.
2. ORBITAL CHRONOLOGY
2.1 Orbital History
Satellite 9443 was launched on November 21, 1979. The number 1
traveling wave tube amplifiers (TWTA's) were commanded ON on
10 December, after allowing time (minimum of 14 days) for out-
gassing. Communications testing performed by the Satellite Control
Facility (SCF) at Camp Parks demonstrated normal operation. On
12 December, the number 2 TWTA's were commanded ON (number 1 OFF),
and again, tests showed normal operation.
On 26 and 27 January, 1980, the Defense Communications Agency
(DCA) performed additional tests, which again confirmed normal
operation. The satellite was then placed in operational service.
2.2 Anomaly Chronology
On 19 February, 1981, the Satellite Test Center (STC) was
notified by DCA that the 9443 NC downlink turned off at 0022Z.
An emergency support was scheduled. When telemetry became
available, the narrow coverage high level TWTA number 2 (NCHLTWTA-2)
parameters were all zero. Commanding the unit on yielded the same
data. The -l amplifier was commanded on at 0055Z, with normal
data resulting.
On 24 February, DCA reported noise problems with the NC down-
link (it was later learned that noise problems were logged shortly
after the NCHL-l was turned on). Only stations using QPSK were
affected; these stations switched to BPSK. Ft. Dietrick performed
tests on the satellite on 24 February, comparing a signal throughthe earth-to-earth (EE) channel with one through the narrow-to-narrow
4

coverage (NN) channel. EE was normal; NN had high bit error
rates using QPSK. Noise pulses were observed approximately every
45 seconds.
On 7 March, Ft. Dietrick again checked the NC downlink, and
observed the pulses at two to three minute intervals. On 11 March,
OCA reported that the noise was much worse, and BPSK was now
unusable also. Most NC links were rerouted by OCA.
On 17 March, a test was run to attempt to ascertain the causeof the noise. Ft. Monmouth monitored the NC downlink. The test
consisted of the following steps:
NC beacon off
Switch frequency generators (-24* -1)
EN and NN receivers -2 off
Transfer shuttle switch to NCA -2, then back to 1/2
EN and NN receivers -ion
Switch communications bus (-2- -1)
Saturate channel NN
None of these steps affected the noise spikes, except that at
saturation the spikes were downward only, without the initial
upward change that was normally seen (see Section 3).
On 26 March, the NN channel was saturated during an eclipse,
providing maximum temperature reduction. This test was similar
to the one performed on 17 March.
On 3 April, the satellite spin rate was changed, initially
from 55.5 rpm to 60.6 rpm. After about an hour at that spin
rate, the spin rate was reduced to 49.1 rpm. rhis test wasperformed to determine possible correlation of the noisb pulse
repetition rate with the spin rate.
On 30 April, a delta velocity maneuver was performed on the
satellite to drift it westward so that Camp Parks could monitor
its performance. This monitoring started on 8 June for five days,
24 hours per day. No pulses were observed. On 15 June, another
5

... .. .. .... _ __n _ __ _ _ _ _ _ _ _ _ _
five days of continuous monitoring was started. On 16 June, a NC
antenna was slewed. Again, no pulses were observed during that
period.
A discussion of these tests and the conclusions are contained
in Section 3.
3. ANALYSIS OF ORBITAL AND GROUND TEST DATA
3.1 On-Orbit Test Analysis
In an effort to define the source of the noise spikes, a
series of on-orbit tests were performed on the satellite. These
tests included switching redundant units, changing RF levels,
changing satellite spin rate, and lowering the TWTA temperature
by changing its operating characteristics. A summary of these
tests is contained in the following sections.
The first series of tests were concerned with establishing
the source of the noise as internal or external to the satellite
and identifying those units within the satellite which could
possibly cause a spike on the RF output. Certain redundant units
were switched and the output observed for any change. The specific
tests performed and the results were as follows:
(a) The transponder TDAL's and mixers were turned-off.
The spikes continued to appear on the beacon signal
thereby proving that the problem was internal to
the satellite and not an external signal being picked
up by the receiver. Also, the cause was isolated to
a point beyond the TDALS's (see Figure 1.1-1).
(b) The beacon was switched off. The spikes continued
on the RF carrier. The redundant frequency generator
was then selected. The spikes continued. Then the
SLA converter was switched to the redundant unit.
Again, the spikes continued. These tests demonstrated
that the spikes were not being caused by the frequency
generator or the transponder DC power supply.
6

(c) The narrow coverage antenna power split was
changed using the shuttle switch. No change was
observed in the spikes. This test isolates the
problem to somewhere before the shuttle switch.
(d) The RF signal was increased, driving the TWTA into
saturation. The spikes reversed direction on the
carrier and on the beacon, with an increase in
relative amplitude on the beacon. No conclusion
could be drawn from this test.
(e) In order to check if the spikes were sensitive to
temperature variations, the TWTA temperature was
reduced by driving the TWTA into saturation just
before the onset of an eclipse. The collector
temperature dropped from 1420F to 122'F in the
middle of the eclipse and then rose back to about
1350 after the eclipse. The change in repetitionrate was within the normal random variationpreviously observea.
(f) The spin rate of the satellite was varied +5 RPM
to determine if the spike repetition rate would
change. No change of the rate could be discerned.
It was therefore concluded that the spiking was not
related to a vibration effect caused by spacecraft
rotation.
The only test not performed was turning off the low level 1WTA
chain which also includes the TDSA. If the spiking disappeared
from the beacon signal, then it could be concluded that the
source was in the LLTWTA chain. This test was not performed
for two reasons. First, no hypothesis could be developed which
explained how the spikes could be produced in the LLTWTA chain
which would appear on the RF output even with no RF signal into
the receiver. Second, there was concern that if the LLTWTA was
turned off, it may not be possible to turn it back on or it may
come on in a degraded mode due to cathode coating separation
7
- .- !

which has been seen on another TWTA. If the satellite becomes
unusable due to the spiking, then this is a test which should be
considered.
Another activity for on-orbit analysis was a corre-
lation analysis of the continuously recorded RF output signal.
This analysis covered about 30 days of data taken over a period
of two months. The data was plotted in a format shown in
Figure 3.1-1, which is a typical day.
60 PER MINUTE -
Q PER MINUTE -
2M PER MINUTE 1';
INTERMITTENT I-
10 PER MINUTE - . -
I PER MINUTE0
9 10 11 12 1 2 3 4 5 6 7 8 9
NOONFT DIETRICK LOCAL TIME
60 PER MINUTE - -
40 PER MINUTE
25 PER MINUTE ---
INTERMITTENT - - - -- -
10PERMINUTE - - - - - -
2 PER MINUTE __A -
1 PER MINUTE0 -_,
9 10 11 12 1 2 3 4 5 6 7 8 9MIDNIGHT
FT DIETRICK LOCAL TIME
Figure 3.1-1. Typical Noise Pulses During One Day (19 & 20 March 81)
8

An attempt was made to correlate spiking activity with
time-of-day but no pattern could be discerned. However, it was
clear that the number of spikes occurring each day was slowly
decreasing as a function of time. At the end of two months,
the spiking rate was significantly lower than at the beginning.
This phenomenon will be discussed in more detail in Section 4.
Telemetry ddLd from the satellite during this period showed
some low or zero readings for the helix current for NCHLTWTA-l.
Helix current is sampled at 8-second intervals, with a sampling
gate of only a few microseconds. Therefore, not many samples
could be expected to be coincident with the noise spikes.
However, a camparison of the times that low readings were
observed on telemetry with the times of occurrence of the noise
spikes showed a good correlation. Generally, the low readings
occurred during periods of high noise spike activity; no low
readings occurred when there were no noise spikes.
3.2 Ground Test Analysis
A number of laboratory tests were performed by Hughes
Electron Dynamics Division in an attempt to simulate the on-orbit
anomaly. In addition to the laboratory tests, Hughes performed
a documentation review on TWTA S/N 24-1 and a general review of
other tube failures to determine if there has been any similarity
in the various anomalies and their causes. This section will
address these specific issues.
3.2.1 S/N 24-1 Test and Documentation Review
Documentation packages for S/N 24-1 (TWTA Type 1241H) were
reviewed to determine if problems occurred during the manufacture or
test of the TWTA that could be related to the orbital anomaly of the
amplifier on 9443. A detailed analysis showed no evidence
of aberration or precursor that would indicate a possible future
condition that would lead to the symptoms observed in orbit.
9

3.2.2 General TWTA Anomaly History Review
The histories of other TWTA's, including DSCS II and designs
related to DSCS II, were also reviewed for similar occurrences in
hardware other than the DSCS II/DSCS III amplifiers. While some
failures have occurred, no comparable anomalies were found.
3.2.3 TWTA Laboratory Tests
A systematic series of tests were performed on a laboratory
power supply and TWT in an attempt to correlate ground performance
with the on-orbit signature. Before the various tests were defined,
preliminary measurements were performed on a DSCS II TWT (Type 293H)
to determine the amplitude and phase characteristics as a function
of cathode and anode voltages. The results of these measurements
showed that only a significant cathode voltage variation had the
possibility of matching the on-orbit behavior. Using this result
as a basis, the following tests were performed.
(a) Arcing of the TWT collector circuit to ground
and TWT cathode to ground.
(b) Interrupt of the ON command signal.
(c) Shorting of the input filter capacitors.
(d) Momentary interrupt of the helix regulator.
(e) RF phase and 4mplitude sensitivity to cathode
and anode voltage variations.
(f) Partial vacuum spark tests.
These tests were performed using the 1241H breadboard and
293HA/D TWT S/N 381. The results of these tests are aT follows.
3.2.3.1 Arcing Tests Results
Periodic sparking from either the cathode or collector
circuits would cause abrupt changes in TWT cathode voltage
followed by a transient recovery period. The effect on the
RF output would likely be a momentary drop in power followed
by an increase. In addition to the power output changes, a
corresponding phase modulation would result.
10
• ..... L " . . ....
. . . . III . . . . .I.. .. .".._

Experiments were performed to simulate periodic sparking
from either the cathode or collector circuits to ground. To
obtain a good representation of the type and magnitude of
discharge likely to occur, a controlled amount of charge was
dumped from the circuit by charging a known capacitance
through a spark gap. The configuration of this spark circuit
is shown in Figure 3.2.3.1-1. Initially, the capacitor is in a
discharged state. The voltage applied to the spark gap through
the resistor causes ignition to occur. The capacitor then
charges, through the fired gap, to the TWT element voltage.
Once charged, the capacitor ceases to sustain current and the
spark is extinguished. The capacitor then discharges through
the resistor until the critical voltage again is placed across
the spark gap. The circuit behaves as a relaxation oscillatorwhose period is determined by the RC time constant. The size
of the capacitor determines the amount of charge extracted from
the circuit during the spark discharge. The mechanism of
limited spark discharge is different from that expected in
space but the effect should be similar.
(a) Cathode Circuit Experiment. With the spark
gap circuit of Figure 3.2.3.1-lB in place
on the TWT cathode lead, the unit was
operated while observing the telemetries
and RF output on the strip chart recorder.
Various values of capacitance from 0.001 to
0.01 pf were used to simulate different amountsof transferred charge. The effects on helix
current (1w) telemetry and RF output amplitude
were particularly noted. The closest match
to orbital symptoms was obtained with 0.01 pf.
RF amplitude spikes were observed for both
saturated drive and for saturation minus
10 dB drive. Both an increase and a decrease
in amplitude could be observed. The apparent
11

-IA. Collector Circuit
COLLECTOR
=2200 V
R7'C
2000V SPARK GAP
-1B. Cathode Circuit
CATHODE=4100V 0
R:
4000V SPARK GAP
HELIX
Figure 3.2.3.1-1 Spark Test Configuration
12
ALAw~

amplitude shift varied from plus 1 dB to
-0.8 dB during saturation and up to plus 3 dB
with saturation minus 10 dB drive. The helix
current showed negative transients similar to
the on-orbit data. A typical section of the
strip chart recording is shown in Figure 3.2.3.1-2.
The true amplitude of the spikes was likely some-
what less than that indicated from the strip chart.
Some ground loop coupling from the spark current
source through the crystal detector output may
have occurred.
Two other tests were made to corroborate
the data from the strip chart. A spectrum
analyzer was used as an amplitude detector
with the horizontal axis acting in time scan.
A typical waveform photograph is shown in
Figure 3.2.3.1-3. From the analyzer photo,
we see that the negative excursion occurs
first and is very narrow. The positive
excursion has a much greater time duration
though lower in peak amplitude. The phase
variation of the RF during the spark was
also measured and is shown in Figure
3.2.3.1-4B. Phase waveforms for both the
cathode circuit spark and the collector circuit
are shown together for comparison. Note that
for the cathode spark, the initial phase
peak was of short duration followed by a long
recovery period.
13

T* IfIATw
1 O 1 .. 0L . i .'
T, Lw TL
7Ai
711:j 1
TT4~~J 1 l~~~~
fit.
Fiue42-L-. CtoeSar ti hr

( Figure 3.2.3.1-3. RF Amplitude Waveform from Spectrum Analyzer
The data from this test was a -lose match
to that observed on orbit.
It is a peculiarity of this power supply
that abrupt changes in tube voltages tend
to produce reversed polarity or drops to
zero in the helix current telemetry. The
strip chart readings show this effect markedly
at this capacitor value, with zero or low
helix current indication at each spike. This
effect can be seen in the results of arcing
at cathode and collector, and is not diagnostic
of any specific condition.
15

150
Phase*EEEE jDegrees 0 mmm mm
100 .. EEEE..-150
0 0.2 0.4 0.6 0.8 0ms
Figure 3.2.3.1-4A. Collector Spark RF Phase Transient
150
100
Phase
Degrees 0
-50
-100 U-150
0 1 2 3 4 5ims
Figure 3.2.3.1-4B. Cathode Spark RF Phase Transient
16
.3 -

(b) Collector Circuit Experiment. The collector
spark test was conducted similarly to the
cathode test with only the change in spark
gap voltage rating as shown in Figure 3.2.3.1-lA.The capacitors used in the collector test varied
from 0.01 to 0.1 1pf. Again the preferred value
was 0.01 pf
The data for this experiment follows closely
that for the cathode circuit test as can be seen
by comparing the collector data of Figure 3.2.3.1-5
with the cathode chart in Figure 3.2.3.1-2.The principal differences were that when the RF
output spikes were similar to the orbital data,
the Iw transients were positive compared with
the negative transients for the cathode. The
1w transients alone cannot distinguish the
validity of the cathode versus collector sparkmechanisms because the polarity of the transients
can vary with the degree of discharge level.This is reported in a HAG report of July 1979.
The phase pulse also was of different character
as can be seen in the photographs of Figures
3.2.3.1-4A and -48. The recovery tail of the
collector pulse is very much shorter.
3.2.3.2 Command and Power Interrupt Tests Results
Momentary interruption in either the ON command or the28 volt power input could result in downward fluctuations in
TWT cathode or anode voltage. Recovery from these transientsmight also be accompanied by some overshoot. Reflected to the
TWT RF output, the voltage transients should be detectable as
amplitude and phase variations.
17

M Ii It Ii! =I,' -4 14 +
H 127 -V I ~ I Z N1v: M3SWVU
ii .JJJ~ i ~T L
ti ;j i
Coleto Cathode - T -7
Figre3.23.-5.ColecorSpak"tri7CarwihCthd7prkDtomaio
18M
k: q I' -

To test this hypothesis, the 1241H breadboard with 293H
TWT S/N 381 was subjected to periodic interruptions of both
command and 28 volt power inputs. An interruption frequency
of 8 Hz was chosen for convenience because that was the lowest
frequency available from the pulse generator used. While the
actual frequency observed from the spacecraft was somewhat under
1 Hz, the difference should not be significant because the EPC
recovery time constant is much less than 0.1 second.
(a) Command Interrup Test. With the breadboard EPC
connected to the TWT and RF power applied, the
command circuit was opened periodically using a
fast operating relay as shown in Figure 3.2.3.2-lA.
-1A. Command Interrupt
PULt' .GEN
-lB. 28V Interrupt
28V INPUT LINE
TRANSIENT INPUT POWER TWIA~~~TEST "TT
BOX
PULSEGEN
Figure 3.2.3.2-1. Interrupt Test Configuration
19
.5.]

Input current, TWT cathode voltage and
current, helix current, and RF outputpower were monitored on a strip chartrecorder. Typical results are shown in
Figures 3.2.3.2-2.
The most significant parameters were helix
current and RF output power. The helixcurrent is shown dropping to zero whichconforms to the orbital data. RF power
output, however, shows almost no activity
when the TWT is saturated. When the RFdrive level is reduced 10 dB, downward
transients of the order of 0.8 dB can beseen (Figure 3.2.3.2-2). Because the output
power conforms so poorly to orbital data,no further tests were warranted.
(b) Power Line Interrupt Test. The test setup
for the 28 volt line interrupt experimentis shown in Figure 3.2.3.2-lB. Measurements
were made similar to those described for
the command interrupt test.
The 28 volts was switched off for about 4 msat an 8 Hz rate. Off time was varied up to
10 ins. When the off time approached 10 ins,the EPC output shut down and the RF output
went to zero. No significant modulation was
evident on the RF output until the shutdowncondition was reached. Neither the saturatednor the -10 dB test yielded RF output tran-sients as were seen on SIN 24-1. A sample of
the strip chart data for the saturated RFoutput case is shown in Figure 3.2.3.2-3. Thereduced drive results are similar.
20

I v/c ,
FL TL L4.
. . . . . . . . .. . . .. ... . .... "r . .....
low M
e o2i02C
COUT
Figure 3.2.3.2-2.
Commrand Interrupt Test with RF Commiand Interrupt Test with RFSaturated Output 10 dB Below Saturation
21

lot4
22

Neither the conmmand nor the 28 volt line interrupt resulted
in an RF envelope characteristic resembling the orbital data.
The line voltage transients were relatively well filtered
from the TWI voltages and did not cause significant RF power
fluctuations. The commuand transients, however, were shown
as downward spikes in RF output of about 0.8 dB at drive levels
10 dB below saturation although with the TWT saturated, the
perturbations were minimal.
3.2.3.3 Shorted Input Filter Capacitor Tests Results
An intermittent short circuit of one of the power line
filter capacitors would cause a momentary decrease in input
k voltage to the main power converter of about 20%. This would
be followed by a similar increase when the short was removed.
These fluctuations, modified by the circuit response, would be
reflected as changes in the TWT element voltages. An experiment
was performed to determine if the modulation thus produced
could cause symptoms similar to the orbital signature of TWTA
S/N 24-1. The test configuration is shown in Figure 3.2.3.3-1
and the observed data are shown in Figure 3.2.3.3-2. The time
axis is from right to left.
*INPUT FILTER
Figure 3.2.3.3-1. Shorted Filter Capacitor Test Configuration
23

............. .. ... . ... ... . ... . .. . .... .. .. .. . .. ... . . . . ..
-4-
44-
24n

Two conditions of RF output are shown; 10 dB below satura-
tion and saturated. The RF output is seen to be effectively
unperturbed by the intermittent short for either level of drive.
It is concluded that this could not be the mechanism of failure
for 9443.
The perturbations in effective input voltage are modified
by the regulation response of the switching regulator, the
filtering of the high voltage dc output of the power supply,
and the helix regulator. The combination of these three circuits
reduces the changes in TWT voltages sufficiently to maintain
nearly constant RF output.
3.2.3.4 Helix Regulator Interrupt Test Results
A possiblity exists that the helix regulator could cause
the RF anomalies since it has a dynamic range of the right order
of magnitude and is closely coupled to the cathode voltage output
of the EPC. While no actual failure mode has been suggested, it
was decided to test the dynamics of the regulator by injecting
noise pulses into the error input and observing the TWTA RF as
well as the regulator output to see if a match of symptoms could
be produced.
The experiment test setup is shown in Figure 3.2.3.4-1.
Figure 3.2.3.4-2 shows the helix regulator schematic diagram
illustrating the test signal input and the regulator output
monitoring point.
1000 pf 500K PULLII
1OOK
Figure 3.2.3.4-1. Helix Regulator Test Setup
25
• _ • -

040
.00.
CD'
In no
04-).4. NM
26

Various pulse widths from 1 ms to 40 mns at amplitudes of
0.5 to 4 volts were injected and the results observed. The
closest approximation to the anomaly signature was for a 10 ins
pulse. The recovery time constant of the helix regulator is
about 5 ins. The 10 mns pulse then allows a maximum amplitude
transient with full recovery for each transition of the
differentiated noise pulse.
The output of the regulator, observed at the "monitor
point" of Figure 3.2.3.4-2, may be seen in Figure 3.2.3.4-3. A
negative swing of 80 volts is followed by a positive recovery
swing of 50 volts. The corresponding RF output pulse,
for drive 10 dB below saturated value, may be seen in the wave-
form photograph of Figure 3.2.3.4-4. The RF envelope was
obtained through a spectrum analyzer set for 300 kHz bandwidth
with a 20 ms/cm scan rate. The waveform is seen to be of about
one dB peak amplitude and to have a wave shape similar to the
voltage output of the regulator. A strip chart recording
corresponding to the photographs of Figures 3.2.3.4-3 and
3.2.3.4-4 is shown in Figure 3.2.3.4- 5 which compares the
results during RF saturation with those for RF drive reduced
10 dB.
It is noted that perturbations of the order of 1 to 2 dB
may be seen in the RF output. The match to the orbital signature,
however, is not satisfactory because the downward swings are more
prominent than the upward swings. While it is probable that the
spacecraft output pulses did include negative swings, they were
of such short durations that they were not recorded by the chartrecorders at Ft. Monmouth. The similarity of positive and
negative recovery characteristics of the regulator preclude a very
fast negative transient followed by a long positive recovery.
3.2.3.5 TWT Sensitivity to Cathode and Anode Voltage Variations
In support of the anomaly investigations, several tests were
run to determine the RF phase and amplitude sensitivity to the
cathode and anode voltage variations. The results of these
27

Figure 3.2.3.4-3. Helix Regulator Output (5OV/cm, 20 ms/cm)
Figure 3.2.3.4-4. Spectrum Analyzer Waveform of RF Output at 10 dB Down
from Saturation (300 kHz BW, scan mode)
28

114 j K 1 -1.vE:~ 77~F rT I7
4: 1 . .. £ -.
7~ ~r :Uri:
mflTTTTA
(Iv
L I, - -
i r
___~~~ .47 L~f~~t
.. .. ... ... DIM ~1 ~
Figure~ =r.34-
HeixReulto TstStipChrt Hli Rguatr es Sri Car10 j; 4eo RF Sauato. a F aurto
11-4 *fl! 29

tests are as follows.
(a) Amplitude Sensitivity. RF power output for
the TWT was measured as a function of variations
in cathode voltage and anode voltage for cons,.ant
input power. The input power reference was that
required to saturate the tube at nominal Ek and
Ea. For the saturation curves, the input power
was held constant while the element voltages were
varied. For the small signal curves, the input
power was reduced 10 dB and 20 dB, respectively,
from the saturation value determined above and
held constant for the duration of the tests.
Curves for the output power variation with
cathode voltage are shown in Figure 3.2.3.5-1.Similar curves for the anode voltage change is
shown in Figure 3.2.3.5-2. The curves for the
three drive levels are superimposed. The changein output is expressed in dB and the absolute
output in dBm has been subtracted out to yield
o dB for the nominal value in each case. In
this way, the relative characteristics can be
easily compared.
Two phenomena are observable in the curves.
Small signal gain dependence is seen in the
curves at 10 and 20 dB down from saturation.
Variation in saturated power output, with
constant input drive power, is also in evidence.
The results show that for the 293HA TWT, there
is a total variation of +0,3 dB for increases
in cathode voltage of 125 volts to -0.7 dB
for a similar decrease in voltage. For small
signal condition, the gain is seen to vary
from -2.5 dB for the increase in cathode
voltage to +1.0 dB for the corresponding
decrease. Anode voltage variation
30

Z13/A/D
APO ___ SA) 0o
0/
UTrU2.A' 1 AL)
-- o ,o -sto - .o ,s.
Figure 3.2.3.5-1. RF Power Output Variations About the Nominal Value ForThree Levels of Power Output Vs Changes in Ek Magnitude
Zq3 ..iq/D
a pa S/A)J
-1 i SATUICJ
60 -lb ILO
Figure 3.2.3.5-2. RF Power Output Variations About the Nominal ValueFor Three Levels of Power Output Vs Changes in Ea
31

curves show a similar pattern except for
the magnitudes and a reversed sense for small
signal gain dependence.
(b) Phase Sensitivity. The sensitivity of RF phase
to changes in cathode voltage is shown inFigure 3.2.3.5-3. Three sets of data were
taken, including the conditions of RF
saturation, 10 dB down from saturation, and
20 dB down from saturation. The three curves
were identical within measurement tolerance
and are shown as a single curve. The change
in cathode voltage magnitude is plotted on
the abscissa with the nominal value at zero.Increase in magnitude is to the right of
zero. The slope of the curve is approximately
1.0 degree per volt for any excitation.
Figure 3.2.3.5-4 shows the relationship of
RF phase to changes in anode voltage. Again,
the voltage magnitude increases toward the
right and the nominal value is shown as zero.
The phase sensitivity is about 0.12 degrees
per volt at saturation declining to 0.1
degree per volt at -20 dB drive.
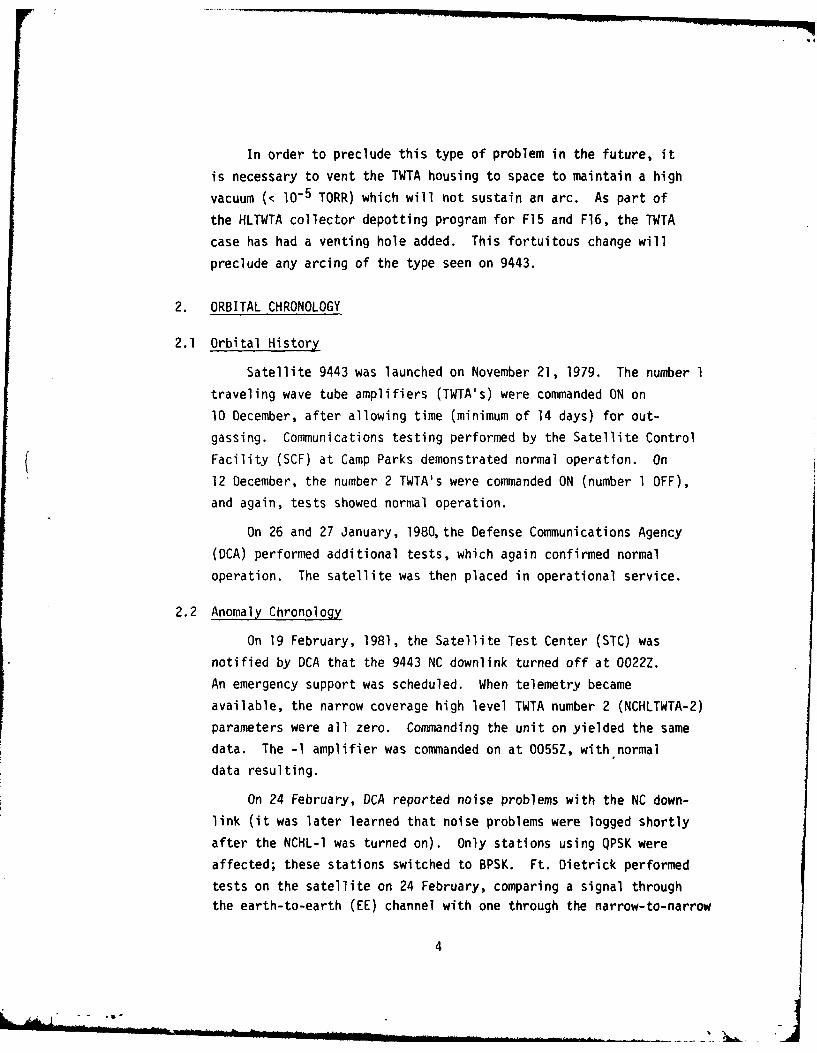
3.2.3.6 Partial Vacuum Spark Test Results
An experiment was designed to verify that relatively long
sparks can occur at reduced pressure. A diagram of theapparatus used is shown in Figure 3.2.3.6-1. To simulate the
condition within the 1241H EPC, a box was assembled consistingof a baseplate, end plate, center gusset, and cover from a
1241H EPC. A high voltage wire was placed within the box at
a location approximately -"ere the wire would enter the TWTin an actual TWTA. This assembly was mounted in a vacuum
chamber with the wire routed out of the chamber to a 4100 volt
32

tooIS
Figur 3- .5-. VaitosinSoupt hs o
AGA~ ,6*t E& *Vait EA. Vol+$*I
Figure 3.2.3.5-3. Variations in RF Output Phase ForTwo Drive Levels Vs Changes in Ekagntd
833

LJ
Icc
za- c~
LLW
i0in
LL, Ljj ICe LJ (n WA
-xc Lii ~coO~
LLS
U3 LU :36A
C-
o 0 10
-> C*4
L0 0
toC: 0iCD
C. '4-P
4.. CL..)
CC
C..)
C..
0 L
CCtn3
I---
4-34

dc power supply as shown in the figure. The lead wire was
monitored with a high voltage divider connected to a strip
chart recorder.
The chamber was pumped to a high vacuum and the dc voltage
was raised to -4100 volts. With the voltage applied to the wire,
the chamber pressure was permitted to rise by using a controlledgas leak until a spark discharge occurred. The spark was
observed visually and the character of the spark was recordedon the chart recorder. This experiment was repeated several
times and the results shown in Figure 3.2.3.6-2. The pressureat which the spark occurred varied but was within the range of
0.01 to 0.5 mTorr. Spark lengths of the order of 200 num were
observed.
Occurrence of discharges over long paths at high voltage
can be predicted by the Townsend or streamer (Kanal) mechanisms.A curve, for uniform field conditions, relating breakdown voltage
to the product of pressure and distance (pd) shows that, as the
pd product diminishes, the breakdown voltage decreases until wereach a minimum at a pd of about 4 Torr nun. The breakdown
voltage at this minimum is approximately 300V rms. As pd isreduced further, the breakdown voltage again rises. This curve
is usually called Paschen's curve. This curve has been verified
for 60 Hz ac for several decades of pd product. The implicationof this function is that for a given voltage between electrodes,
that the spacing alone cannot ensure that no breakdown can occur.
Indeed, since the curve abscissa is the product pd, an increasein distance is offset by a decrease in pressure.
For a voltage of 4000 volts and a spacing of 200 nun, a
pressure of 3.5 mTorr or higher can precipitate a discharge.
The pressure indicated at the time of the sparks recorded in
Figure 3.2.3.6-2 varied from 0.01 to 0.5 mTorr. This is less
than the critical value indicated from the Paschen curve.The curve, however, was derived for Townsend discharge under
uniform field conditions. The field in this experiment wasstrongly nonuniform. This would favor sparking at pressures
35
k I
F-~-T
B. Pressure =0.51 mTorr
___,
-11 T
ti J17 1 .1
C. Pressure =0.5 mTorr
4 I L
D. Pressure 0.07 ruTorr
Figure 3.2.3.6-2. Spark Discharges at Reduced Pressure
36

much less than 3.5 mTorr. We were probably observing a streamer
discharge enhanced by field emission at the point electrode
(wire end).
The character of the spark discharges was of interest.The discharge was not continuous but consisted rather of a
series of discrete sparks in repetition. The mechanism appearsto be an initiation at some voltage, the rapid reduction in voltage
to where the spark extinguishes, voltage increase,then reignition.
These spark trains were not continuous but did serve to show that
under the right conditions of voltage and pressure, that a series
of minor discharges can occur causing perturbation of the power
supply voltage without initiating shutdown of the TWTA.
No effort was made to do an analytical study of the phenomena
but only to demonstrate ad hoc that such discharges can be pro-
duced and that this mechanism must be considered a viable anomaly
candidate in the analysis of the TWTA S/N 24-1 anomaly.
3.3 RF Signal Evaluation
The appearance of the spikes when first recorded at Fort
Monmouth on a strip chart recorder showed a sharp + 2 -3 dB
pulse. When examined on an oscilloscope, however, the shape of
the spike was actually a sharp negative pulse of about 6 dB
followed by an overshoot of 2 dB extending over a relativelylonger time period. On a slow recording strip chart, only the
overshoot pulse could be seen.
In order to characterize the pulse more completely, theassistance of the Harris Corporation was requested since theybuilt the ground demodulators and had available a test ground
station equipped to comhnunicate with the DSCS II spacecraft.The purpose of the tests at Harris was twofold: first, to
determine the exact signature of the pulse including the
carrier phase shift and second, to determine if the demodulatorcould be modified to operate satisfactorily with a high data
rate QPSK signal in the presence of the noise pulses.
37

l1D
a cc00
- j
cc -
LU-
usi cc xdI- cc
NU
3c8

The test set-up to perform these tests is shown in
Figure 3.3-1. On April 7, Harris began a series of tests by
transmitting a CW signal and locking the MD1O02 demodulator to
the downlink carrier. Amplitude and phase variations were
observed at the AGC power detector output and at the phase
detector for the carrier phase-lock-loop (after the squaring
process). These tests were continued a few hours per day over
several days. Unfortunately, the number of spikes occurring at
this time dropped off rapidly and good data was obtained only
on the first day. On the latter days, few or no spikes were
seen and no useful data was obtained.
The amplitude and phase characteristics obtained from these
tests are shown in Figure 3.3-2, plots (a) and (b). Since the
carrier recovery phase-lock-loop phase detector was used, the
data in (b) does not represent the phase shift directly.
+3Cc +2
A) Cc 0
-2
-4
+ 230jps 500 s
+90
NOTE TIME SCALE CHANGE
200u8 400As SOOus 800As ims 2m 3mm 4m 5ms 6mm
Figure 3.3.2. Harris Test Measurements
39

However, since the phase detector output has the typical "S"
curve characteristics, phase shift can be measured from (b),
since one complete cycle at the phase detector output (with
excursions through + 900) represents 3600 of phase shift. From
Figure (b), approximately 7200 of phase shift has occurred
during the initial 640 uisec. The actual phase shift would be
half this value, since the recording includes the effects of
the squaring process of the carrier recovery loop.
The 3600 phase shift in the carrier is of particular
significance since this is the cause of loss of signal lock
and thereby, data. It was planned to modify a breadboard model
of the demodulator to extend the tracking loop and determine if
the system could operate satisfactorily in the presence of noise
spikes. Unfortunately, before this test could be run, the noise
spikes ceased (at least during the period of testing). Therefore,
no conclusions could be reached on the usefulness of modifying
the demodulator.
4. CAUSES OF ANOMALOUS PERFORMANCE
4.1 Analysis of Signature
The appearance of the orbital signature and the results of
the various breadboard tests clearly point to a cathode toground arc as the direct cause of the anomaly. The arc causes
a drop of about 200 volts in the cathode potential, and on
extinction, the power supply overshoots about 100 volts. The RFoutput follows the cathode voltage variation. On the penrecorder at Ft. Monmouth, only this overshoot is visible. Thehelix current telemetry tends to drop towards zero during
transient disturbances of several types, so the occasional
zeros indicated on NCHLTWTA-l are consistent with the arc
phenomena but not diagnostic.
Three peculiarities of the arc need explanation:
1. Hundreds of thousands of arcs occurred withoutapparent degradation of the power supply or
change in waveform.
40

2. The arc extinguishes after pulling the supply
down only 200 volts.
3. The unit passed at least two weeks thermal
vacuum and initial orbital test without
showing the symptoms.
4.2 Possible Arc Locations
The cathode circuitry at -4.2 kv consists of:
a. The cathode structure internal to the tube.
b. The external tube connection and segment of lead
enclosed by the gun potting and cosmetic cover.
c. The exposed cathode lead, in two sections joined
by the splice block.
d. The wiring within the high voltage module
e. The parts in the module, especially the filter
capacitors.
A 200 volt drop at 4.2 kv dissipates in the vicinity of
.2 joules at the arc site (depending on exactly how the supply
responds)*. If the arc were taking place inside an insulator
(locations b, d, or e), there is therefore some 4 kilowatt hours
of power dissipated at the site per 100,000 occurrences.
Arcs inside any potted part are inherently short, typically
less than 2 cm. The pressure for an arc of this length is above
10-3 Torr. Unless otherwise limited, a discharge at pressures
around critical will typically draw substantial current and
persist down to low voltage. Precursor discharges in collector
potting have been recorded which do not behave like this at
first. These are probably occurring in narrow cracks, and
rapidly degenerate to a permanent short (because the surfaces
are rapidly burnt). The large numbers of light discharges in
A .2 pf capacitor dropping from 4.2 to 4 kv gives up .16 joules.
41

S/N 24-1 are thus inconsistent with their occurring inside a
solid insulator. All diagnosed internal potting failures have
either gone to a permanent short at once or in, at most, a few
dozen strikes. Actual cases of cathode arcs in the 1241H
amplifier also tend to damage the EPC, supporting the observa-
tion that the orbital occurrence is drawing relatively low
current.
The possibility that the arc is not from cathode toground but is to some intermediate point must be considered.
If this is modeled by imagining a capacitor abruptly connected
to the cathode, note that by calculation and breadboard simula-
tion the value of this capacitor is in the 0.01 to 0.001 pf
range. With any reasonable dielectric, such a capacitor has a
plate area in the 100 square cm range. Inspection of the power
supply and tube does not reveal any ungrounded object of
sufficient area. It therefore appears the arc must be terminatingat ground. Thus, we are forced to hypothesize locations (a) or
(c) as the only feasible possibilities so far proposed.
in the case of (a), (an arc internal to the tube) twoarguments can be cited against the possibility. First, while
occasional tube internal arcs are known, occurrence of many
thousands in a working tube is unprecedented. Second, thechemical environment created (e.g., liberated metal ions) would
surely have at least degraded the cathode activity by now.Since the amplifier currents and performance are (as far as we
can tell) unchanged, it appears the cathode is in good workingorder. Thus, it seems very unlikely that the problem could beinternal to the tube.
We are led to the conclusion that the ony reasonable
possibility is an arc from the cathode wiring to ground. Require-
ments for the occurrence of such an arc are discussed below.
4.3 Arcing at Low Pressures
The 1241H case venting characteristics were measured during
the 1241HD (depot) development. The box has no positive venting
42
AALS

system, and was found to remain in the 10-3 to 10-4 Torr range
internally for long periods after pump down to hard vacuum.
However, the normal expectation from measurements between
polished large diameter electrodes is that breakdown of air at
this pressure and 4 kv will not occur in the dimensions of the
case (maximum path < 25 cm).
Experiment with a bare high voltage wire and a spare case
showed however that arc discharges do occur at pressures in the10-4 to 1O-5 Torr region. These low pressure arcs are difficult
to initiate, and the phenomena comes and goes apparently at
random. It was found that arcs would only appear with a capa-
citive output impedance of the power supply, and that a pulse
of gas pressure appeared in the vacuum chamber at each discharge.
There were indications that a very low current glow discharge
was present when visible arcs were not happening. There are
hints in the literature that this type of behavior has been
seen before, (for example, Figure 3 of reference 1).
Experiments by H. Shelton (TRW Advanced Technology Division)
indicate that the initiating mechanism for current flow in moderate
to high vacuum is field emission. He reports that substantial
emission can occur from nonmetallic whiskers, (e.g., from the tip
of a glass fiber). He has found that thread-like character marks
in insulators are also fruitful sources of field emission. It
should be noted that published average work-function estimates
on large surfaces do not seem to tell the whole story - on amicroscopic scale materials may contain points of low work
function at which emission is relatively easy to obtain.
The orbital behavior of S/N 24-1 may also correlate with
fast electron (> 2 MeV) events. Detailed environmental data
Ref. 1I "Gas Discharges in Insulating Systems at Pressure BetweenAtmospheric and High Vacuum," Dakin and Works, "Dielectricsin Space" Symposium, June 1963.
43
are not available, but the apparent diurnal variations in spike
frequency and some of the dates of maximum frequency of occur-
rence seem to correspond with fast electron occurrences.
From all available information, (including problems
experienced with a similar but unpotted high voltage supply),
it appears that long path, low current, easily extinguished arcs
can occur at -4 kv in pressures of the lO-4 to lO-5 Torr range.
As mentioned earlier, such arcs were found occasionally when a
cut piece of the high voltage wire used in this amplifier was
exposed in an empty 1241H case. Without attempting to explain
an evidently very complicated phenomena, a reasonable description
of the behavior of S/N 24-1 can be proposed.
It must be supposed that the cathode lead has a minor defect.
This defect need not be as severe as a cut, but could be a
crack or an inclusion in the insulation. During acceptance
thermal vacuum and initial orbital testing, the pressure in the
case does not drop low enough to permit the type of arcing in
question, so no recognizable symptoms occur, which would
not affect amplifier operation but might cause cumulative
damage to the hypothesized weak spot in the insulation.
During the 15 months the unit was off in orbit, presumably
the pressure within the case dropped to a high vacuum. When it
was turned on after the -2 unit failure, some outgassing of the
tube potting and power supply occurred, as some areas reach
temperatures approaching 1000C. While there is no way to
estimate the pressure reached, whatever it was must decay
through the critical 10-4 to l0-5 interval. Arcing between the
insulation fault and some remote ground point started, possibly
facilitated by externally caused ionization. Since the cathode
wire is bundled with the other tube leads, the discharge may be
partly confined, further limiting the current and raising the
extinction voltage. At each arc, a pulse of gas is liberated
(presumably from the paint or conformal coat at the end of the
arc), so the effect is to some extent self-supporting. The
exact mechanism by which field emission provides an environment
44

for the arc, and how it might be triggered by electron irradiation,are matters beyond the scope of an anomaly investigation.
The three peculiarities cited in 4.1 are thus explained as
follows:
Item Explanation
1. Large number of arcs Arc is in the open and currentwithout degradation. limited by low pressure and a
long path.
2. Arc extinguishes after Low gas pressure and tortuoussmall voltage drop. path, plus local gas cloud may
be dissipated by shock ofdischarge.
3. Problem did not show Case pressure was too high beforeup in test. extended time in orbit.
If the above hypothesis is correct, it is probable that
the arcing will slow down and cease after a period of time for
two reasons. First, the local pressure will eventually drop
to the point where an arc is impossible and second, the hypothe-
sized field emission may end due to burning of the site.Further confirmation for this theory is the fact that the arcing
has essentially stopped after three months - probably caused by
the case again reaching a high vacuum.
5. RECOMMENDATIONS
As discussed in Section 4, the cause of the anomalous
performance was an arc in the cathode circuitry which occurred
in a rather high vacuum (10-5 Torr). If the vacuum can beincreased to 10-6 Torr or greater, the arc cannot be triggered.
This can be accomplished by venting the TWTA case, as already
demonstrated in the HLTWTA collector depot program. Since all
the HLTWTA's on F15 and F16 have already been reworked to depot
the collector and add venting holes, no further action isrecommended.
45

FIL