Embed Size (px)
Citation preview
1
EEE 432
Measurement and Instrumentation
Lecture 3
Errors during the measurement process
Prof. Dr. Murat Aşkar İzmir University of Economics Dept. of Electrical and Electronics Engineering
Page 2
Classification of Error
Errors arising during the measurement process can be divided into two
groups, known as systematic errors and
Systematic Errors
Random errors

2
Page 3
Classification of Error Systematic Errors
Systematic errors describe errors in the output readings of a measurement
system that are consistently on one side of the correct reading, i.e. either all
the errors are positive or they are all negative.
The two major sources of systematic errors:
System disturbance during measurement and
The effect of environmental changes (modifying inputs)
Other sources of systematic error include bent meter needles, the use of
uncalibrated instruments, drift in instrument characteristics and poor cabling
practices.
Page 4
Classification of Error Random Errors
Random errors are perturbations of the measurement either side of the true
value caused by random and unpredictable effects, such that positive errors
and negative errors occur in approximately equal numbers for a series of
measurements made of the same quantity. Such perturbations are mainly
small, but large perturbations occur from time to time, again unpredictably.
Random errors often arise when measurements are taken by human
observation of an analogue meter, especially where this involves
interpolation between scale points.
Electrical noise can also be a source of random errors.

3
Page 5
Sources of systematic error
System disturbance due to measurement
Errors due to environmental inputs
Wear in instrument components
Connecting leads
Page 6
Sources of systematic error System disturbance due to measurement - 1
Measurements in electric circuits

4
Page 7
Sources of systematic error System disturbance due to measurement - 2
Measurements in electric circuits
Page 8
Sources of systematic error System disturbance due to measurement - 3
Example
The voltage across AB is measured by a voltmeter whose internal
resistance is 9500 ohm. What is the messurement error caused by
the resistance of the measuring instrument?
5
Page 9
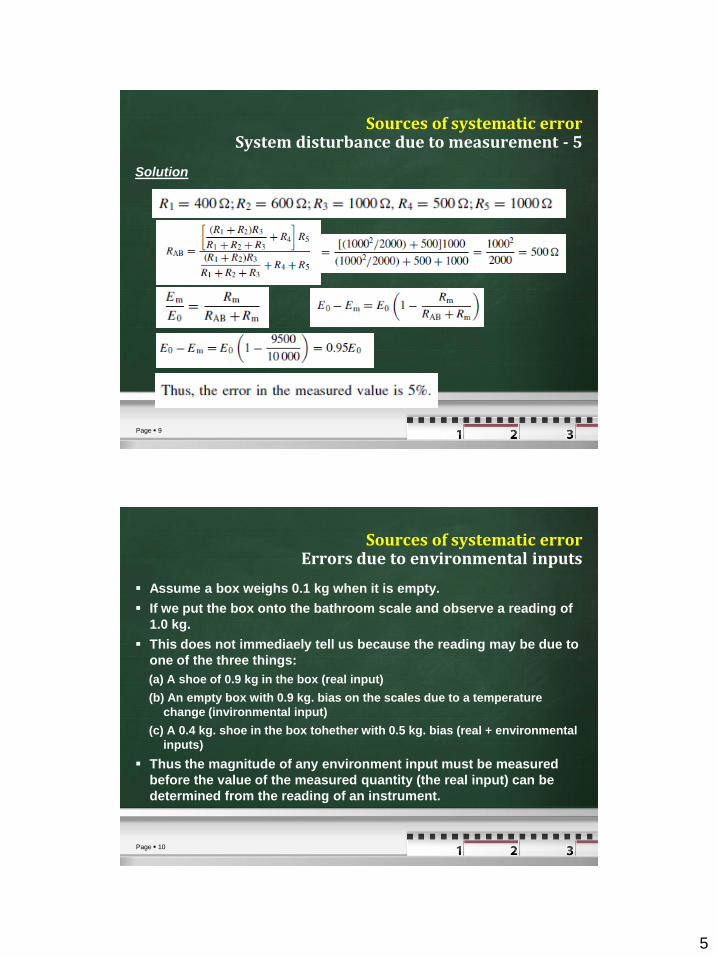
Sources of systematic error System disturbance due to measurement - 5
Solution
Page 10
Sources of systematic error Errors due to environmental inputs
Assume a box weighs 0.1 kg when it is empty.
If we put the box onto the bathroom scale and observe a reading of
1.0 kg.
This does not immediaely tell us because the reading may be due to
one of the three things:
(a) A shoe of 0.9 kg in the box (real input)
(b) An empty box with 0.9 kg. bias on the scales due to a temperature
change (invironmental input)
(c) A 0.4 kg. shoe in the box tohether with 0.5 kg. bias (real + environmental
inputs)
Thus the magnitude of any environment input must be measured
before the value of the measured quantity (the real input) can be
determined from the reading of an instrument.

6
Page 11
Sources of systematic error Wear in instrument components
Systematic errors can frequently develop over a period of time
because of wear in instrument components.
Recalibration often provides a full solution to this problem.
Page 12
Sources of systematic error Connecting leads
In connecting together the components of a measurement system, a
common source of error is the failure to take proper account of the
resistance of connecting leads (or pipes in the case of pneumatically or
hydraulically actuated measurement systems).
For instance, in typical applications of a resistance thermometer, it is
common to find that the thermometer is separated from other parts of the
measurement system by perhaps 100 metres. The resistance of such a
length of 20 gauge copper wire (0,8118 mm) is 7 W, and there is a further
complication that such wire has a temperature coefficient of 1mW/°C.
Assume R = 7 W at T= 200C. With TC = 1mW/°C
At T=500C => R = R0 + T TC

7
Page 13
Reduction of systematic errors
Careful instrument design
Method of opposing inputs
High-gain feedback
Calibration
Manual correction of output reading
Intelligent instruments
Page 14
Reduction of systematic errors Careful instrument design
Careful instrument design is the most useful weapon in the battle against
environmental inputs, by reducing the sensitivity of an instrument to
environmental inputs to as low a level as possible. For instance, in the
design of strain gauges, the element should be constructed from a
material whose resistance has a very low temperature coefficient (i.e. the
variation of the resistance with temperature is very small).
However, errors due to the way in which an instrument is designed are not
always easy to correct, and a choice often has to be made between the
high cost of redesign and the alternative of accepting the reduced
measurement accuracy if redesign is not undertaken.

8
Page 15
Reduction of systematic errors Method of opposing inputs -1
The method of opposing
inputs compensates for the
effect of an environmental
input in a measurement
system by introducing an
equal and opposite
environmental input that
cancels it out. One example
of how this technique is
applied is in the type of
millivoltmeter shown in the
following Figure.
Page 16
Reduction of systematic errors Method of opposing inputs - 2
This consists of a coil suspended in a fixed magnetic field produced by a
permanent magnet. When an unknown voltage is applied to the coil, the
magnetic field due to the current interacts with the fixed field and causes
the coil (and a pointer attached to the coil) to turn. If the coil resistance
Rcoil is sensitive to temperature, then any environmental input to the
system in the form of a temperature change will alter the value of the coil
current for a given applied voltage and so alter the pointer output reading.
Compensation for this is made by introducing a compensating resistance
Rcomp into the circuit, where Rcomp has a temperature coefficient that is
equal in magnitude but opposite in sign to that of the coil. Thus, in
response to an increase in temperature, Rcoil increases but Rcomp
decreases, and so the total resistance remains approximately the same.

9
Page 17
Reduction of systematic errors High-gain feedback - 1
X0 = KC Ks Ei
Page 18
Reduction of systematic errors High-gain feedback - 2
Amplifier is added
with large Ka
Environmental effects
Da, Dc, Ds, Df
E0 = Kf X0

10
Page 19
Reduction of systematic errors Calibration
Instrument calibration is a very important consideration in measurement
systems and calibration procedures will be studied later.
All instruments suffer drift in their characteristics, and the rate at which this
happens depends on many factors, such as the environmental conditions
in which instruments are used and the frequency of their use.
Thus, errors due to instruments being out of calibration can usually be
rectified by increasing the frequency of recalibration.
Page 20
Reduction of systematic errors Manual correction of output reading
In the case of errors that are due either to system disturbance during the
act of measurement or due to environmental changes, a good
measurement technician can substantially reduce errors at the output of a
measurement system by calculating the effect of such systematic errors
and making appropriate correction to the instrument readings.
This is not necessarily an easy task, and requires all disturbances in the
measurement system to be quantified.
This procedure is carried out automatically by intelligent instruments.

11
Page 21
Reduction of systematic errors Intelligent instruments
Intelligent instruments contain extra sensors that measure the value of
environmental inputs and automatically compensate the value of the
output reading.
They have the ability to deal very effectively with systematic errors in
measurement systems, and errors can be attenuated to very low levels in
many cases.
Page 22
Random errors
Random errors in measurements are caused by unpredictable variations
in the measurement system. They are usually observed as small
perturbations of the measurement either side of the correct value, i.e.
positive errors and negative errors occur in approximately equal numbers
for a series of measurements made of the same constant quantity.
Therefore, random errors can largely be eliminated by calculating the
average of a number of repeated measurements, provided that the
measured quantity remains constant during the process of taking the
repeated measurements.
12
Page 23
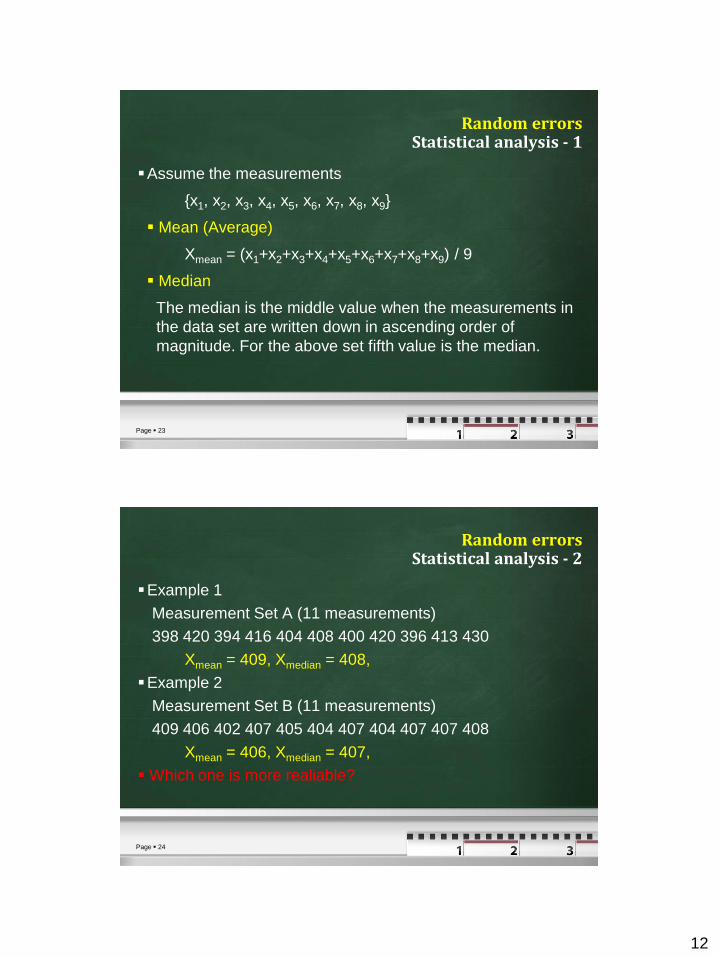
Random errors Statistical analysis - 1
Assume the measurements
{x1, x2, x3, x4, x5, x6, x7, x8, x9}
Mean (Average)
Xmean = (x1+x2+x3+x4+x5+x6+x7+x8+x9) / 9
Median
The median is the middle value when the measurements in
the data set are written down in ascending order of
magnitude. For the above set fifth value is the median.
Page 24
Random errors Statistical analysis - 2
Example 1
Measurement Set A (11 measurements)
398 420 394 416 404 408 400 420 396 413 430
Xmean = 409, Xmedian = 408,
Example 2
Measurement Set B (11 measurements)
409 406 402 407 405 404 407 404 407 407 408
Xmean = 406, Xmedian = 407,
Which one is more realiable?

13
Page 25
Random errors Statistical analysis - 3
Example 3
Measurement Set C (23 measurements)
409 406 402 407 405 404 407 404 407 407 408 406 410
406 405 408 406 409 406 405 409 406 407
Xmean = 406.5, Xmedian = 406,
The median value tends towards the mean value as the
number of measurements increases
Page 26
Random errors Statistical analysis - 4
Variance and Standard Deviation
– Deviation (error) in each measument
– Variance
– Standard Deviation

14
Page 27
Random errors Statistical analysis - 5
Measurement Set A (11 measurements)
398 420 394 416 404 408 400 420 396 413 430
Xmean = 409, V = 137, = 11.7
Measurement Set B (11 measurements)
409 406 402 407 405 404 407 404 407 407 408
Xmean = 406, V = 4.2, = 2.05
Measurement Set C (23 measurements)
409 406 402 407 405 404 407 404 407 407 408 406 410
406 405 408 406 409 406 405 409 406 407
Xmean = 406.5, V = 3.53, = 1.88
Page 28
Random errors Statistical analysis - 6
Note that the smaller values of V and for measurement set
B compared with A correspond with the respective size of the
spread in the range between maximum and minimum values
for the two sets.
Thus, as V and decrease for a measurement set, we are
able to express greater confidence that the calculated mean or
median value is close to the true value, i.e. that the averaging
process has reduced the random error value close to zero.
Comparing V and for measurement sets B and C, V and
get smaller as the number of measurements increases,
confirming that confidence in the mean value increases as the
number of measurements increases.