Embed Size (px)
Citation preview
1
DRUG DISCOVERY
Edward A. Sausville, M.D., Ph.D. Associate Director for Clinical Research
Greenebaum Cancer Center University of Maryland at Baltimore
March 12, 2015
2
OUTLINE OF PRESENTATION
General Introduction
Definition of Drug Targets
Generating Diversity
Definition of Lead Structures
Qualifying Leads for Transition to Early Trials

3
DRUG DISCOVERY: A SUCCESSION OF STYLES
Antiquity to 1960s:
Mixtures of natural products vs. bioassays
(e.g., digitalis, rauwolfia, penicillins, anthracyclines,
vinca, taxol, camptothecins)
1930s to present:
Pure compounds vs. bioassays
(e.g., sulfas, diuretics, hypoglycemics, antiHBP)
1960s to present:
Pure compounds vs. pure enzymes
(e.g., ACE inhibitors, cholesterol-lowering statins,
RT and protease inhibitors)
1980s to present:
Combinatorial methods to bring mixtures of compounds
vs. many targets
4
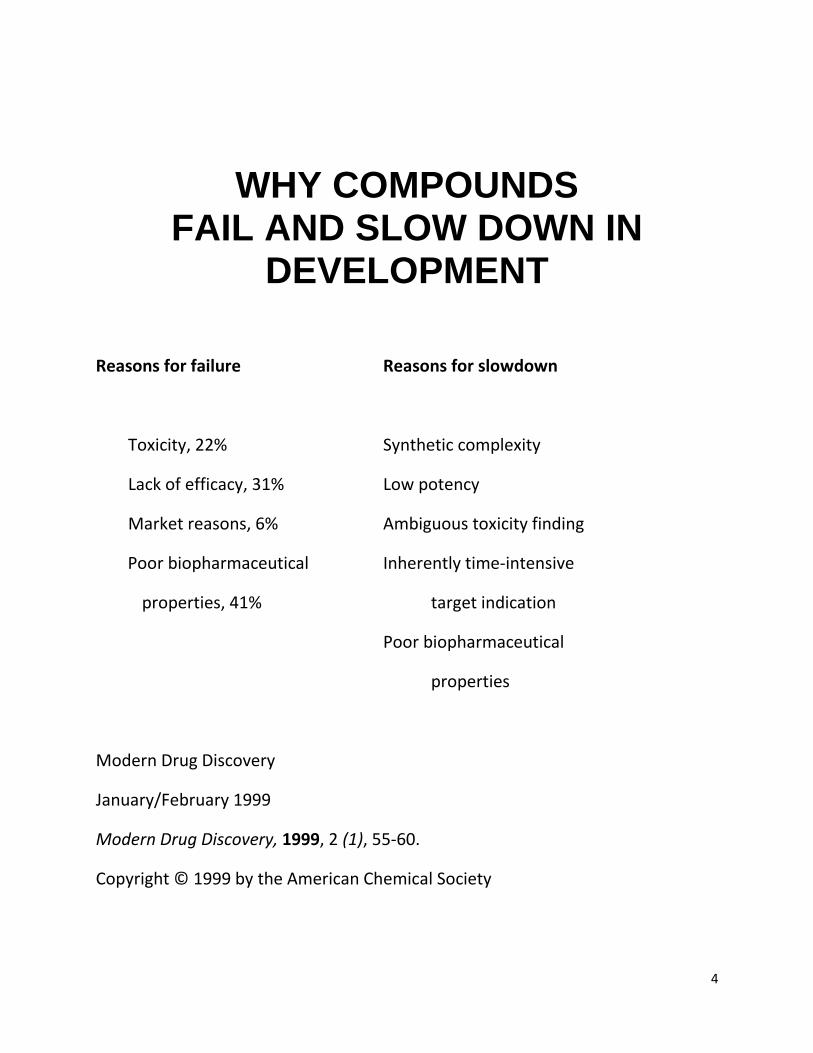
WHY COMPOUNDS
FAIL AND SLOW DOWN IN DEVELOPMENT
Reasons for failure Reasons for slowdown
Toxicity, 22% Synthetic complexity
Lack of efficacy, 31% Low potency
Market reasons, 6% Ambiguous toxicity finding
Poor biopharmaceutical Inherently time-intensive
properties, 41% target indication
Poor biopharmaceutical
properties
Modern Drug Discovery
January/February 1999
Modern Drug Discovery, 1999, 2 (1), 55-60.
Copyright © 1999 by the American Chemical Society

5
TRADITIONAL PHARMACEUTICAL R&D
Suffers High Attrition*
Diagram illustrating the flow from initial candidate compound screening
(103 - 105 compounds per screen) through “hits” and “leads” (100
leads), lead optimization, pre-clinical development (12 drug
candidates) and clinical development (4-5 drug candidates) that results
in only one NDA filing.
* Tufts CSDD, H&Q 1998; The Pfizer Journal, 1/2000

6
OUTLINE OF PRESENTATION
General Introduction
Definition of Drug Targets
Generating Diversity
Definition of Lead Structures
Qualifying Lead for Transition to Early Trials

7
TWO CONTRASTING DRUG-DISCOVERY “PHILOSOPHIES”
• “EMPIRICAL”: Recognize initial drug lead
by functionally useful effect
-E.g. : penicillin (anti-bacterial effect)
rauwolfia (anti-hypertensive)
taxol (anti-tumor)
digoxin (cardiotonic/ antiarrythmic)
• “RATIONAL”: Recognize drug by design or screen
against drug target’s function
-E.g.: HIV-protease inhibitor (anti-infection)
metoprolol (anti-hypertensive)
methotrexate (anti-tumor)
PROBLEM:
HOW TO RECOGNIZE DISEASE RELEVANT TARGETS?

8
sIRNA in drug screening
Diagram of this process

9
MOLECULAR TARGET DEFINITION - HOW TO?
BIOLOGY
* Cytogenetics → Breakpoints → Molecules (bcr-abl)
* “Positive” selection from tumor DNA → Active oncogenes
(signal transduction)
* Tumor gene expression profiling (CGAP)
* siRNA – induced modulation of phenotype
“RETROFIT“ ACTIVE MOLECULES:
* Binding partners (geldanamycin, rapamycin, fumagillin)
* Computational algorithm (molecule ↔ target)
COMPARE
Cluster analysis
“CLASSICAL:”
* Cell metabolism / Biochemistry
* Suggest single targets → Inefficient; Medicinal Chemistry possible
CHEMICAL GENETICS:
* Libraries of molecules and precisely defined organisms

10
Cancer Genome Anatomy Project PROCESS
Tumor material (archival)
“Laser capture microdissection” of tumor
cells from defined sections
Creation of tumor-derived cDNA libraries
Sequence to establish uniqueness
Deposit in public domain

11
Gene Expression: The Cell’s Fingerprint
Bar chart comparing normal cells with cancer cells in
Genes A through H expression. The bar chart shows that
cancer cells out number normal cells in Genes A, C, E,
and H. In H, few cells are normal and the vast majority
are cancer cells. Normal cells out number cancer cells in
Genes B, F, and G and with F there are significantly more
normal cells. For Gene D the normal and cancer cells
appear to be approximately equal.
Establishing for a cell the repertoire of genes expressed, together with
the amount of gene products produced for each, yields a powerful
"fingerprint". Comparing the fingerprints of a normal versus a cancer
cell will highlight genes that by their suspicious absence or presence
(such as Gene H ) deserve further scientific scrutiny to determine
whether such suspects play a role in cancer, or can be exploited in a
test for early detection.
http://cgap.nci.nih.gov
At the bottom left of the slide is a logo from the National Cancer
Institute - The Cancer Genome Anatomy Project.

12
This is information from a National Cancer Institute (NCI)
document or website for the Cancer Genome Anatomy
Project. It lists 5 different NIH ICs that are part of the
CGAP initiatives
http://cgap.nci.nih.gov/

13
GELDANAMYCIN: EXAMPLE OF BINDING PARTNER DEFINING
TARGET
Chemical structure of benzoquinone (ansa ring and
carbamate moieties)
NSC R
Geldanamycin 122750 OMe
17-AAG 330507 NHCH2CH=CH2
14
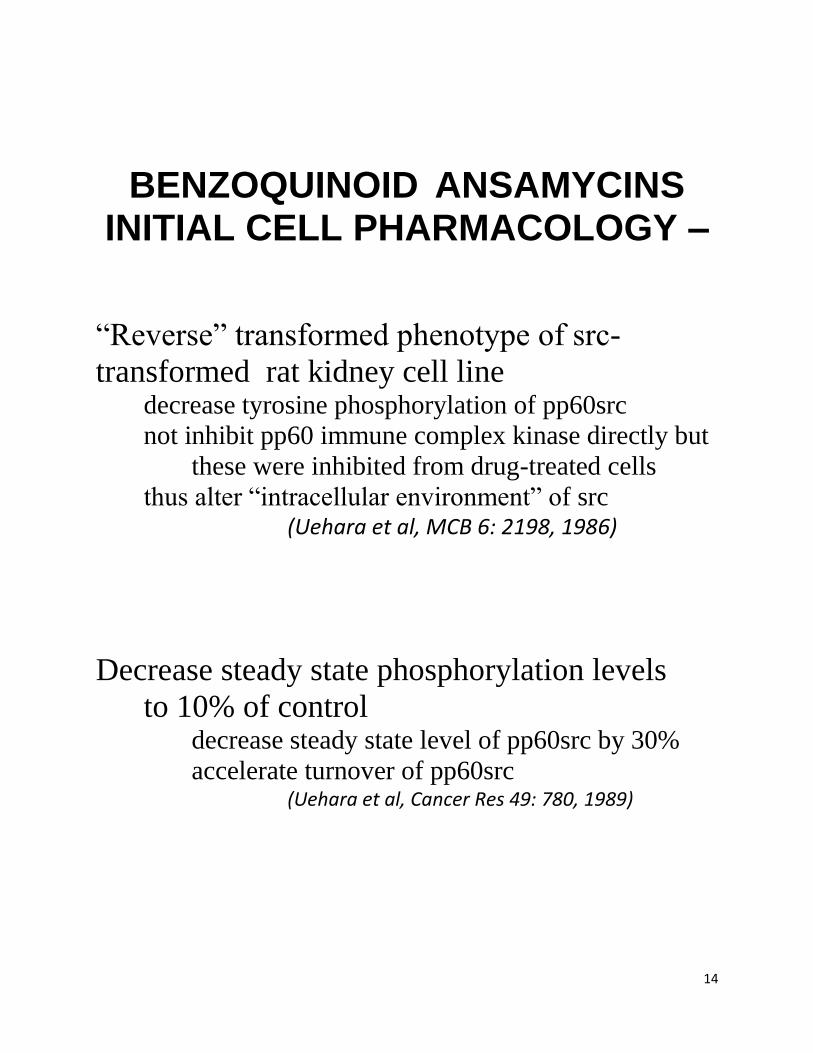
BENZOQUINOID ANSAMYCINS
INITIAL CELL PHARMACOLOGY –
“Reverse” transformed phenotype of src-
transformed rat kidney cell line decrease tyrosine phosphorylation of pp60src
not inhibit pp60 immune complex kinase directly but
these were inhibited from drug-treated cells
thus alter “intracellular environment” of src (Uehara et al, MCB 6: 2198, 1986)
Decrease steady state phosphorylation levels
to 10% of control decrease steady state level of pp60src by 30%
accelerate turnover of pp60src (Uehara et al, Cancer Res 49: 780, 1989)

15
Graphic illustration of a bead and an 18 atom spacer

16
GELDANAMYCIN BEADS IDENTIFY HSP90 AS BINDING PARTNER
1) Bead-Geld 3) Bead-Geld + Geldampicin
2) Bead-Geld + Geld 4) Bead
Neckers et al, PNAS 91:8324, 1994

17
Three graphic illustrations of the role of HSP 90 in
cell function.

18
OUTLINE OF PRESENTATION
General Introduction
Definition of Drug Targets
Generating Diversity
Definition of Lead Structures
Qualifying Lead for Transition to Early Trials
19
Diversity
Graphic illustration of 9 different snowflakes which vary
widely one from another.
It is estimated that there are 1040 compounds in all of
“chemical space”. Since the Big Bang, there have only
been 1017 seconds.
- Peter Wipf

20
SOURCES OF DIVERSITY
“Natural Products” = entities derived from plants,
animals, bacteria, etc. May have
ethnopharmacognosy” to suggest use
“pure compound” collections
extracts: aqueous/organic
genetically altered producer organisms
Target non-selected chemical compound libraries
peptide / protein
non-peptide
Target-directed chemical compound libraries
“classical” medicinal chemistry / bona fide crystal
structure – derived
“docked” lead structures into model

21
Natural Products: Unique arrays of the four “elements” which make a really useful drug
A circle is shown which is divided into four equal
parts. Going clockwise from the top right
segment they are labeled Base (-), Water (low
dielectric), Acid (+), and Oil (high dielectric).

22
Sources of “Modern Drugs”
If one looks at the current drug scene from a chemical
perspective (data from
1981 – 2002) then the following slides show reasonable
approximations of the
sources of drugs currently approved, World-wide, by the FDA
or equivalent body.
Codes are:
N Natural Product
ND Natural Product Derivative
S* Natural Product Pharmacophore
S Synthetic Compound
B/V Biological / Vaccine
(NM) Natural Product Mimic as a subdivision
23
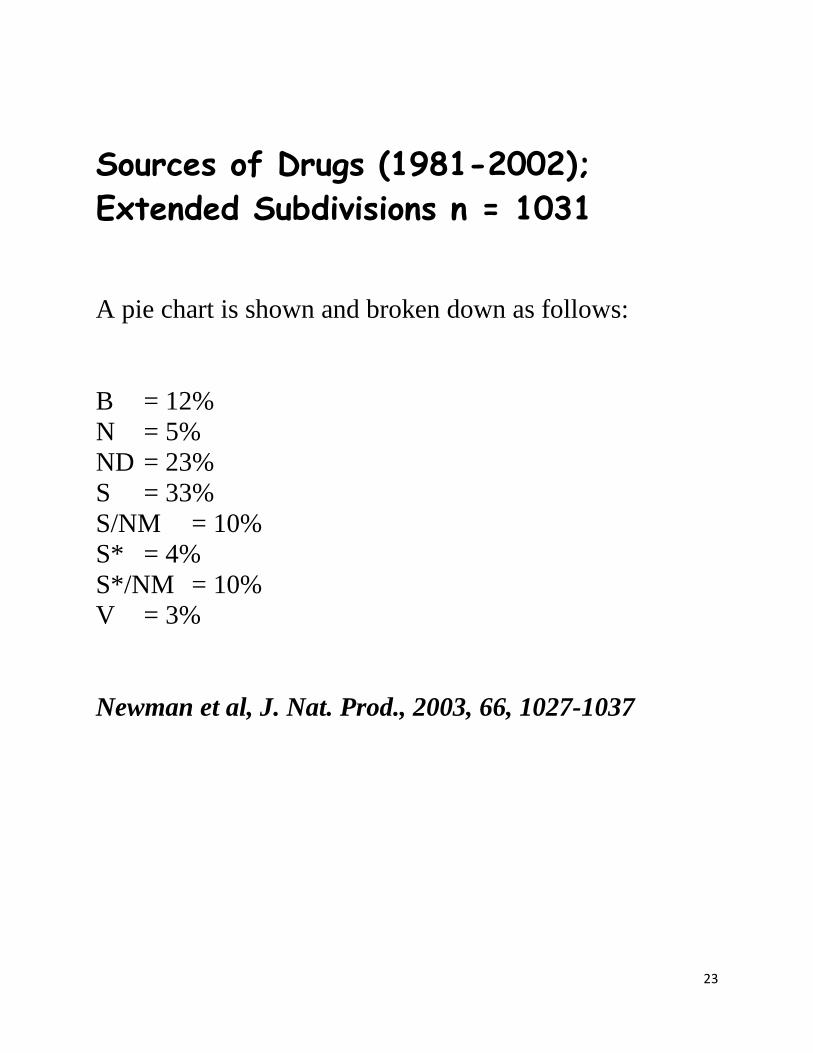
Sources of Drugs (1981-2002);
Extended Subdivisions n = 1031
A pie chart is shown and broken down as follows:
B = 12%
N = 5%
ND = 23%
S = 33%
S/NM = 10%
S* = 4%
S*/NM = 10%
V = 3%
Newman et al, J. Nat. Prod., 2003, 66, 1027-1037

24
EXAMPLES OF NP LEAD GENERATION OF NOVEL SCAFFOLDS Guided by nature a compound library developed around
nakijiquinones, which are natural inhibitors of the receptor tyrosine
kinase called Her-2/Neu, produced analogs that inhibit two other
receptor tyrosine kinases, VEGFR-3 and Tie-2.
Nature leads a library based on a natural product, Galanthamine, an
antidemintia drug, turns up a new compound with a different activity.
Secramine, a galanthamine-based molecule that blocks protein
trafficking

25
Discovery of Lidocaine *Central Asian camels refused to eat a certain type of
reed
*Characterization of gramine as the antifeedant
principle led to the synthesis of isogramine
*Taste-test: numbness; therefore, lead for anesthetic
agent development
Chemical structures of Gramine → Isogramine →
Lidocaine
Courtesy of N. R. Farnsworth

26
Natural Product Isolation Tree
Flow chart illustration

27
“You are what you eat”
Journal of Natural Products, Nov. 1997;60 (11)
Dolabella auricularia
Dolastatins come from a Symploca species that they graze on

28
“Non-culturable” versus “Cultured” microbes
The microbial World has only just been scratched.
Much less than 1% of the available organisms have
even been seen, let alone identified.
In soil, there are estimates of > 1000 species per
gram
very few can be cultured
these may not be representative of the “Soil meta-
Genome”
Over 1000 microbes per mL of seawater can be seen
and only approximately 1% can be cultured using
current methods.

29
SOURCES OF DIVERSITY
“Natural Products” = entities derived from plants, animals, bacteria,
etc. May have “ethnopharmacognosy” to suggest use
“pure compound” collections
extracts: aqueous/organic
genetically altered producer organisms
Target non-selected chemical compound libraries
peptide / protein
non-peptide
Target-directed chemical compound libraries
“classical” medicinal chemistry / bona fide crystal structure –
derived
“docked” lead structures into model

30
TRIPEPTIDE COMBINATORIAL LIBRARY
XXX
Four amino acids in each position
43 = 64
A = Alanine
R = Arginine
T = Threonine
W = Tryptophan
after R. Houghten, 1999
31
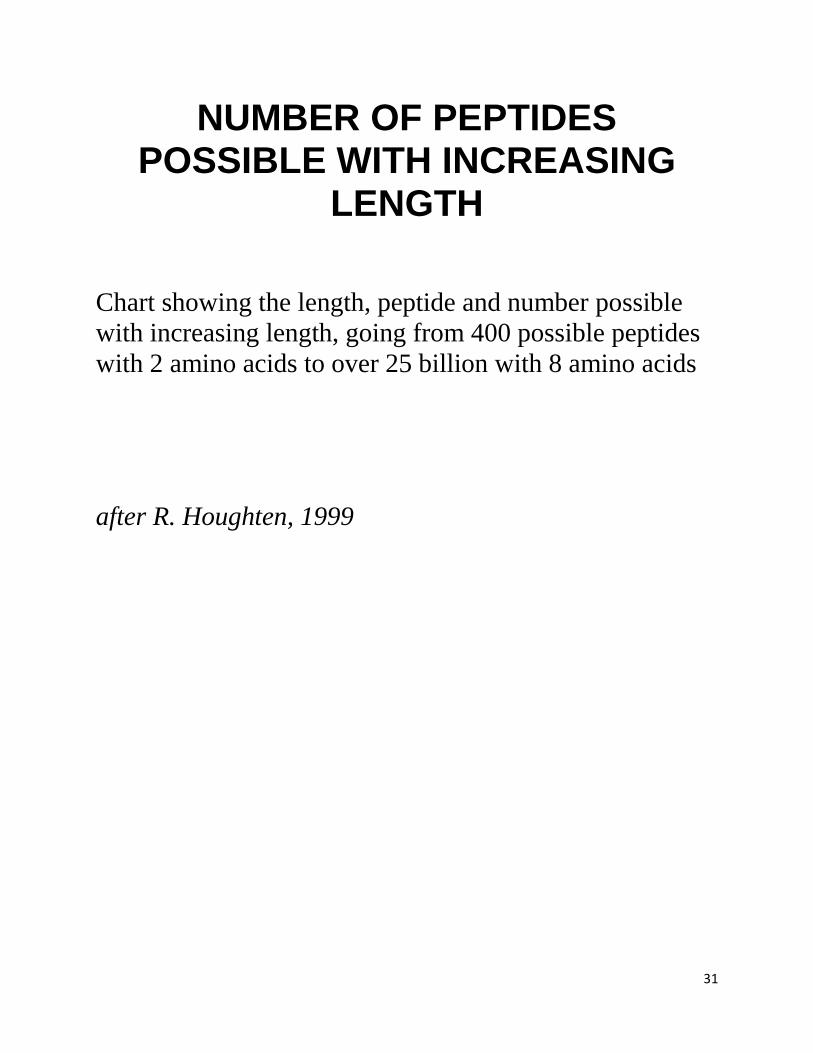
NUMBER OF PEPTIDES POSSIBLE WITH INCREASING
LENGTH
Chart showing the length, peptide and number possible
with increasing length, going from 400 possible peptides
with 2 amino acids to over 25 billion with 8 amino acids
after R. Houghten, 1999
32
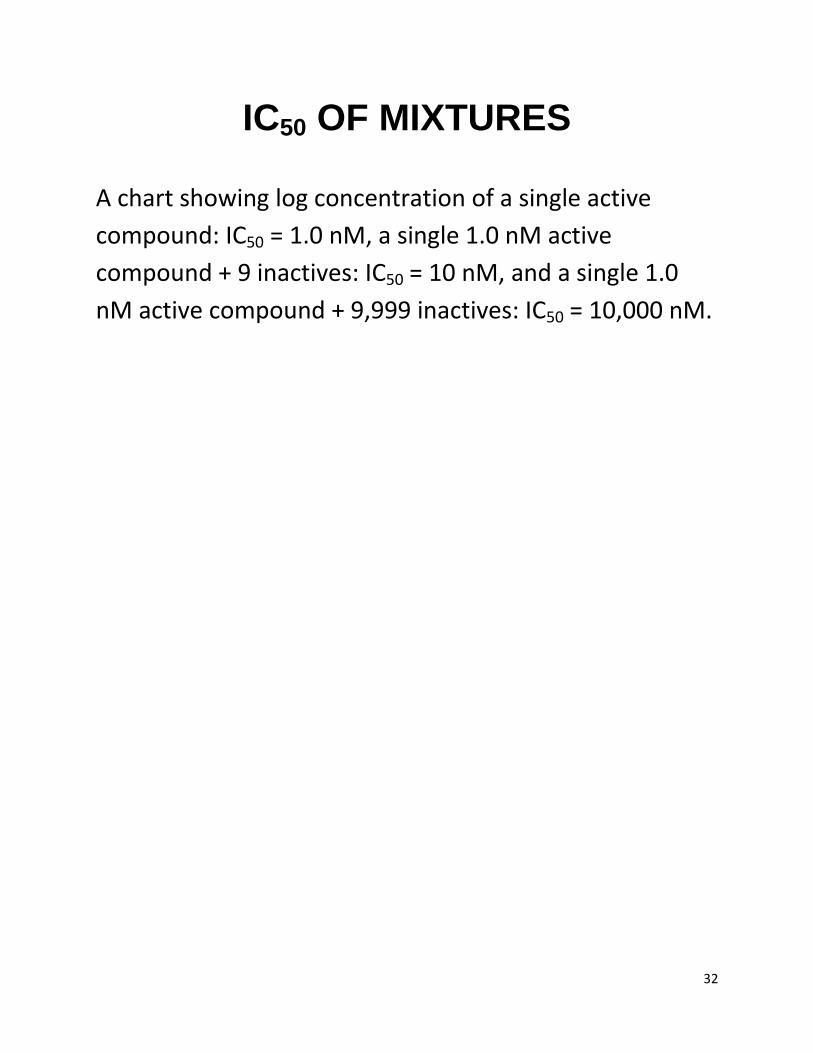
IC50 OF MIXTURES
A chart showing log concentration of a single active
compound: IC50 = 1.0 nM, a single 1.0 nM active
compound + 9 inactives: IC50 = 10 nM, and a single 1.0
nM active compound + 9,999 inactives: IC50 = 10,000 nM.

33
COMBINATORIAL LIBRARIES:
THE MIXTURE QUESTION
Natural Synthetic
Product Combinatorial
Extracts Mixtures
Direct screening of compound mixture Yes Yes
Discovery of highly active compounds Yes Yes
Equal concentrations of compounds No Yes
Chemical structure known No Yes
Synthetic pathway known No Yes
Structure – activity relationship known No Yes
after R. Houghten, 1999
34
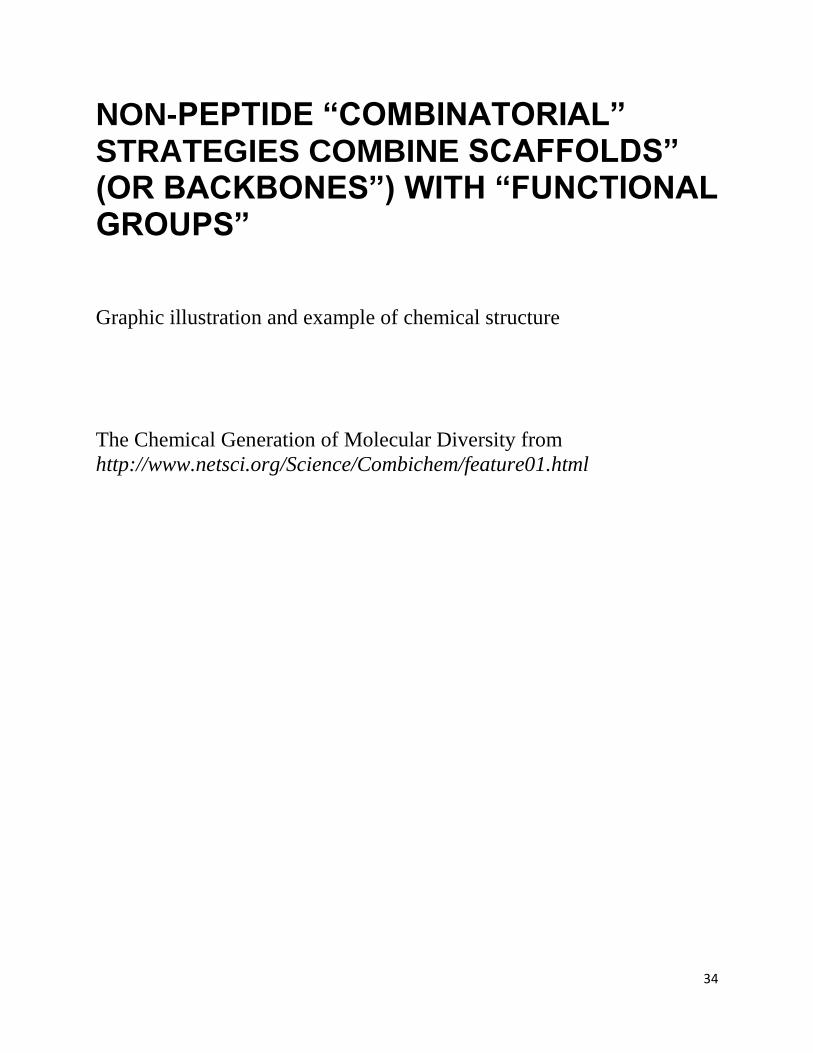
NON-PEPTIDE “COMBINATORIAL” STRATEGIES COMBINE SCAFFOLDS” (OR BACKBONES”) WITH “FUNCTIONAL GROUPS”
Graphic illustration and example of chemical structure
The Chemical Generation of Molecular Diversity from
http://www.netsci.org/Science/Combichem/feature01.html

35
THE RULE OF FIVE An awareness tool for discovery chemists:
Compounds with two or more of the following
characteristics are flagged as likely to have
poor oral absorption
More than 5 H-bond donors
Molecular weight >500
c log P > 5
Sum of N’s and O’s (a rough measure of H-bond acceptors) >
10
Modern Drug Discovery
January/February 1999
Modern Drug Discovery, 1999, 2 (1), 55-60.
Copyright © 1999 by the American Chemical Society

36
COMBINATORIAL LIBRARIES OF BICYCLIC GUANIDINES FROM
REDUCED ACYLATED DIPEPTIDES
Chemical structure and synthesis
1. CSIm2_________ 2. HF/anisole
R1 x R2 x R3 = 49 x 51 x 42 = 104,958 compounds
after R. Houghten, 1999

37
BIOASSAYS (READY APPLICATION OF
SOLUBLE LIBRARIES)
Soluble Acceptors
antibodies
enzymes
Membrane-bound Receptors
tissue homogenate
functional cell based
Microorganisms: Disruption of Function
bacteria
fungi
virus
Differentiation
stem cells
In Vivo
after R. Houghten, 1999

38
POSITIONAL SCANNING
BICYCLIC GUANIDINE LIBRARY ( RECEPTOR)
1/percent bound forR1 position, R2 position, and R3
position.
39
OUTLINE OF PRESENTATION
• General Introduction
• Definition of Drug Targets
• Generating Diversity
• Definition of Lead Structures
• Qualifying Lead for Transition
to Early Trials

40
ONCE YOU HAVE A TARGET AND CADIDATE DRUG MOLECULES:
HOW TO DESIGN A DRUG SCREEN?
• Biochemical "Pure target" Screen (binding, functional):
• Advantage: "Pure" Structural / Functional Outcomes
• Disadvantage: Out of cellular / biochemical context
• Cell-Based • Advantage: Readout in a "living"
system; • Disadvantage: Must deconvolute
mechanism
41
CASE 1: TYROSINE KINASES AS BIOCHEMICAL SCREENING TARGET
• Overexpressed or activated in cancer e.g, EGFR,
Her2/neu, etc)
• Altered activity by mutation (e.g., c-kit)
• Altered activity by translocation(e.g., bcr-abl)
• Overexpression associated with
• advanced stage
• inferior prognosis
42
PROPOSED ENZYMATIC MECHANISM FOR TPKs
Levitsky, FASEB J 6: 3275, 1992

43
STRUCTURAL CLASSES OF
TYRPHOSTIN: mimic the kinase transition state
Chemical structures of Benzene malononitrile, Bisubstrate quinoline, S-Arylbenzene malononitrile and Lavendustin-based
Levitsky, FASEB J 6: 3275, 1992
44
bcr-abl FUSION PROTEIN
McWhirter JR, EMBO 12:1533,
1993

45
INITIAL TYRPHOSTIN SCEEN: CORRELATE p210
bcr/abl AUTOKINASE
WITH K562 GROWTH INHIBITION
IC50, K562
a – control -
b – 50 M AG957 15
c – 50 M AG555 9.2
d – 50 M AG1318 21
Kaur et al, Anti-Cancer Drugs, 5: 213, 1994
46
Chemical structures of
Erbstatin
NSC 606641
and
AG957
NSC 654705

47
EXAMPLE OF “RATIONAL” APPROACH:
bcr-abl directed agents
Natural
product
empiric lead erbstatin lavendustin piceatannol
1st generation
Synthetic AG058 AG1112
2nd generation
synthetic;
in clinic
CGP 57148B = STI571

48
STI571: An oral in vivo bcr-abl kinase inhibitor
Plot showing Tyr phosphorylation in
vivo .
Another plot showing Antitumor activity
in vivo .
le Coutre et al, JNCI 91:163, 1999

49
EFFICACY AND SAFETY OF A SPECIFIC
INHIBITOR OF THE BCR-ABL
TYROSINE KINASE IN CHRONIC MYELOID
LEUKEMIA
BRIAN J.DRUKER,M.D.,MOSHE TALPAZ,M.D.,DEBRA J.RESTA,R.N.,BIN
PENG,PH.D.,
ELISABETH BUCHDUNGER,PH.D.,JOHN M.FORD,M.D.,NICHOLAS
B.LYDON,PH.D.,HAGOP KANTARJIAN,M.D.,
RENAUD CAPDEVILLE,M.D.,SAYURI OHNO-JONES,B.S.,AND CHARLES
L.SAWYERS,M.D.
Plot of white cell count and duration of Treatment with
STI571
Plot of Ph Chromosome + Cells Duration of Treatment
with STI571
NEJM 344: 1031, 2001

50
TIME TO A MAJOR CYTOGENETIC RESPONSE FOR IMATINIB VS. INTERFERON AND LOW-DOSE CYTARABINE IN CHRONIC-PHASE CML
Plot showing major cytogenetic response (%) over
months after randomization for Imatinib
and Combination therapy.
Druker et al, NEJM 348: 994, 2003

51
IMATINIB IN BLAST CRISIS OF CML AND ALL WITH THE PHILADELPHIA CHROMOSOME
Chart showing Time to Relapse in Patients
with Myeloid or Lymphoid Blast Crisis
Who Had a Response to STI571
NEJM 344: 1038, 2001

52
Clinical Resistance to STI-571 Cancer Therapy
Caused by
BCR-ABL Gene Mutation or Amplification
Mercedes E. Gorre,1, 3
Mansoor Mohammed,2 Katharine
Ellwood,1 Nicholas Hsu,
1 Ron Paquette,
1 P. Nagesh
Rao,2 Charles L. Sawyers
1, 3
Science 293: 876, 2001
53
DASATINIB (BMS-354825) ACTIVE AGAINST MOST IMATINIB
RESISTANT MUTANTS
Chemical structure
54
CASE 2: UTILIZING RNAi IN CELL BASED SCREENS TO ENHANCE
DRUG DISCOVERY
Flow chart

55
Iorns et al, Nat Rev Drug Disc 6: 556
(2007)

56
DEVELOPMENT OF HTS
PARP INHIBITOR SENSITIVITY SCREEN
Lord et al, DNA Repair 7: 2010
(2008)

57
CASE 3: CDC25 Phosphatases and
Cancer
• CDC25A and B overexpressed in many cultured
cancer cell lines.
• Cdc25A suppresses apoptosis.
• Overexpression of CDC25A or B has been
detected in human breast, head and neck,
cervical, skin, lymph, lung and gastric cancers.
• Human CDC25A & B cooperated with Ha-
RasG12V
and CDC25A cooperated with Rb -/-
in
the oncogenic focus transformation of mouse
embryonic fibroblasts and tumor formation in
nude mice. Thus, Cdc25A & B may be human
oncogenes.

58
Regulation of Cell Cycle Progression by Cdc25: Cdk
Activation
Graphic illustration

59
Method for identifying Cdc25
phosphatase inhibitors
Graphic illustration

60
Chemical Screening Approach
• Targeted Array Libraries
• Diverse Chemical Libraries

61
Chemical structures
62
Compound 5 inhibits Cdc25
Cdc25B2 Ki ~ 2 M Log [Compound 5] M
Compound Validation
Cellular: Cell Cycle
Biochemical: Substrate
phosphorylation
Genetic: Chemical
complementation

63
tsFT210 Cell System
Graphic illustration with functional
and nonfunctional Cdk1.
64
Compound 5 causes G2/M arrest

65
CASE 4: NMR-BASED SCREENING
1. Screen “fragment” like molecules with “leadlike”
properties (MW <300; ClogP ~1.5)
2. Characterize binding and portion of molecule to which they bind
3. Ligands with weak affinities can be defined (~KD = 5mM)
4. Lead to high affinity binders through iterative screening
5. Can label protein of interest with isotopes “sensitive” to ligand effects (e.g. N15) and utilize proton resonances of drug to simultaneously allow definition of ligand and receptor binding sites
Hajduk et al, J Med Chem 48: 2518, 2005

66
NMR AS MEANS OF DEFINING BINDING SITES
E.G., BLEOMYCIN BINDING TO DNA
Horwitz et al, Biochemistry 16: 3641,
1977

67
BUILDING A DRUG LEAD
Graphic illustration of target molecule,
screening of compound libraries and
selection of lead compounds.
Successive iterations “build” more
potent Kd
68
AFFINITIES OF
SELECTED BIARYL COMPOUNDS FOR BCL-XL
Illustration of 20 chemical structures and their respective
NMR Kd (μM)
Petros et al, J Med Chem 49: 656, 2006

69
SECTION FROM A 15
N HSQC SPECTRUM OF BCL-XL IN THE PRESENCE AND ABSENCE OF
COMPOUND Plot of 15N ppm over 1H ppm
alone
2 mM biaryl acid 1
2 mM biaryl acid 1 and 5 mM naphthol derivative 11
Petros et al, J Med Chem 49: 656, 2006
70
SUPERPOSITION OF SEVEN LOW-ENERGY STRUCTURES CALCULATED FOR BCL-XL
COMPLEXED TO 1 AND 11
Molecular model
Petros et al, J Med Chem 49: 656, 2006

71
OUTLINE OF PRESENTATION
General Introduction
Definition of Drug Targets
Generating Diversity
Definition of Lead Structures
Qualifying Lead for Transition to Early Trials

72
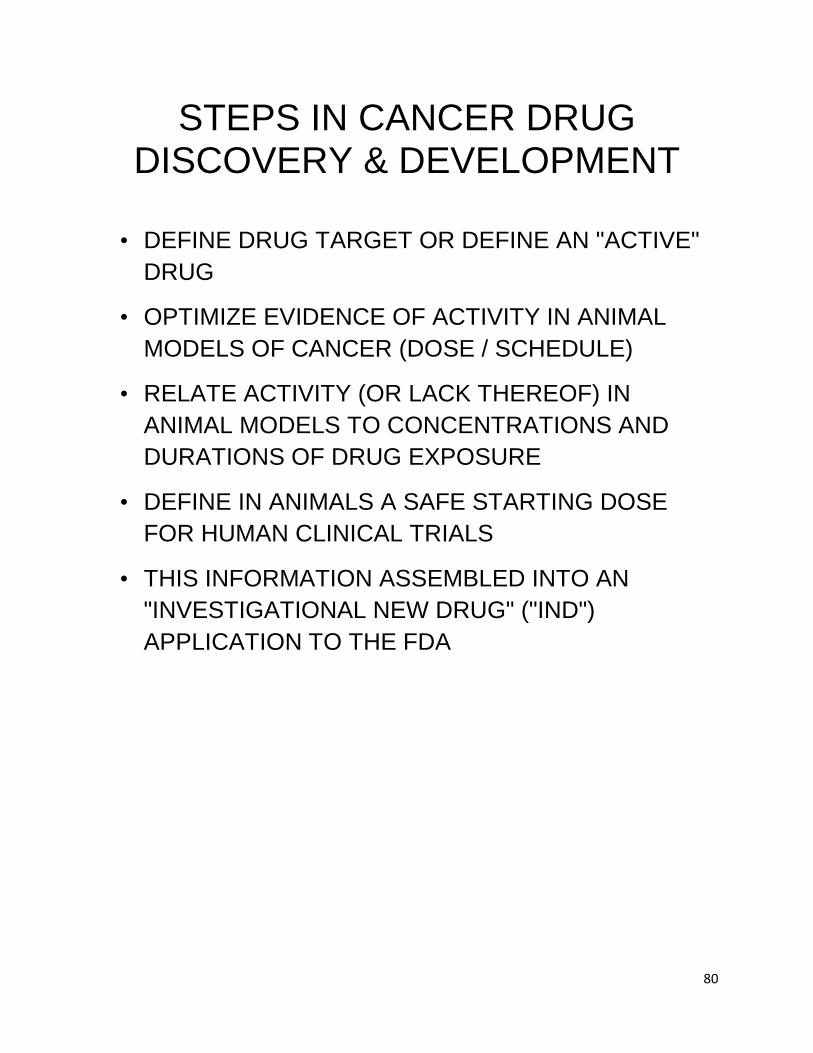
STEPS IN CANCER DRUG
DISCOVERY & DEVELOPMENT
• DEFINE DRUG TARGET OR DEFINE AN "ACTIVE"
DRUG
• OPTIMIZE EVIDENCE OF ACTIVITY IN ANIMAL
MODELS OF CANCER (DOSE / SCHEDULE)
• RELATE ACTIVITY (OR LACK THEREOF) IN
ANIMAL MODELS TO CONCENTRATIONS AND
DURATIONS OF DRUG EXPOSURE
• DEFINE IN ANIMALS A SAFE STARTING DOSE
FOR HUMAN CLINICAL TRIALS
• THIS INFORMATION ASSEMBLED INTO AN
"INVESTIGATIONAL NEW DRUG" ("IND")
APPLICATION TO THE FDA

73
CORRELATION OF IN VIVO ACTIVITY
WITH CLINICAL ACTIVITY BY DISEASE TYPE
Xenograft histology

74
% IN VIVO ACTIVITY vs CLINICAL
ACTIVITY (39 AGENTS)

75
PROBLEMS WITH EMPIRICAL
MODELS
• Lack of predictive power in
vivo
• Poor correlation of non-human
with human pharmacology
• Divorced from biology
• Inefficient: many compounds
screened;
• developed, but have “late” =
clinical trials outcome
• at Phase III to define
“validation” of compound
action
76
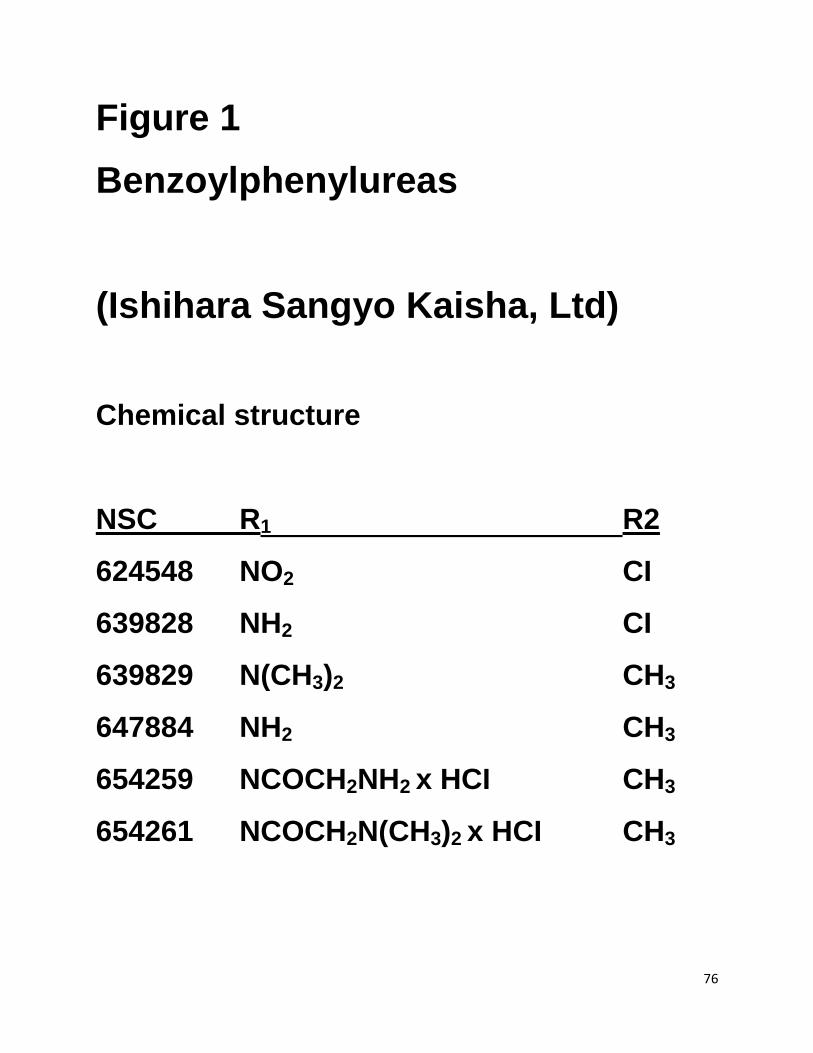
Figure 1
Benzoylphenylureas
(Ishihara Sangyo Kaisha, Ltd)
Chemical structure
NSC R1 R2
624548 NO2 CI
639828 NH2 CI
639829 N(CH3)2 CH3
647884 NH2 CH3
654259 NCOCH2NH2 x HCI CH3
654261 NCOCH2N(CH3)2 x HCI CH3

77
National Cancer Institute
Developmental Therapeutics
Program
Dose Response Curves

78
Figure 4
Efficacy Testing of NSC 639829 in
Human Tumor Xenografts

79
Figure 13
BPU Analogue Concentration (µM
or µM equivalents) over time after
dose (min) for Dimethyl-BPU,
Monomethyl-BPU, and Amino-
BPU.
80
STEPS IN CANCER DRUG DISCOVERY & DEVELOPMENT
• DEFINE DRUG TARGET OR DEFINE AN "ACTIVE"
DRUG
• OPTIMIZE EVIDENCE OF ACTIVITY IN ANIMAL
MODELS OF CANCER (DOSE / SCHEDULE)
• RELATE ACTIVITY (OR LACK THEREOF) IN
ANIMAL MODELS TO CONCENTRATIONS AND
DURATIONS OF DRUG EXPOSURE
• DEFINE IN ANIMALS A SAFE STARTING DOSE
FOR HUMAN CLINICAL TRIALS
• THIS INFORMATION ASSEMBLED INTO AN
"INVESTIGATIONAL NEW DRUG" ("IND")
APPLICATION TO THE FDA

81
FDA PRECLINICAL
PHARMACOLOGY & TOXICOLOGY REQUIREMENTS
Graphic illustrations of a mouse a rat, a dog, and a monkey.
DRUGS
Two Species - Rodent & Non-rodent
Clinical Route & Schedule
Follow NCI Guidelines
Pharmacokinetics - Optional
BIOLOGICALS
Most Relevant Species
Clinical Route & Schedule

82
Benzoylphenylurea Preclinical MTD
& DLTs
Schedule RAT DOG
q4Dx3, PO
____________________________________________
MTD 360 mg/m2
>150<240 mg/m2
(Total Dose)
DLT Bone Marrow Bone Marrow,
GI Tract GI Tract
Starting Dose: 24 mg/m2

83
Problems with “MTD” Driven
Endpoints
• Drugs regulating pathways important in oncogenesis
are effective by combining with high affinity binding
sites; therefore must distinguish “targeted” vs “non-
targeted” toxicity related to these binding sites
• Whether dosing beyond effect on desired target
“buys” therapeutic value not clear
• Therefore must define in pre-clinical studies
“BIOLOGICALLY EFFECTIVE DOSE” and
“MAXIMUM TOLERATED DOSE”
• Use BIOLOGIC rather than TOXIC endpoints in
PhaseI?

84
“Rational” Drug Discovery
Flow chart

85
Correlation Between 20S Proteasome Inhibitory
Potency & Growth Inhibition for 13 Dipeptide Boronic
Acids
Adams et al, Cancer Res 59:2615, 1999

86
Effect of PS-341 on PC-3 Tumor
Growth in Mice
Chart
Adams et al, Cancer Res 59:2615, 1999

87
Effect of PS-341 on 20S Proteasome
Activity
Two bar charts, one of Mouse WBC
and the other of PC-3
Adams et al, Cancer Res 59:2615,
1999

88
PS-341: INTERSPECIES
Q: Is the ‘safe’ dose in animals in the efficacy range for man?
Species Dose Dose % 20S
(mg/Kg) (mg/m2) Proteasome
Inhibition* ________________________________________
Mouse 1.0 3.0 80 Rat 0.25 1.5 80 NHP 0.067 0.8 70 *In white blood cells at 1.0 h, post-dose Ref: Adams, et al, Cancer Res 59:2615, 1999

89
Ex Vivo Proteasome Activity:
1 Hour Post Treatment
90
PRECLINICAL DRUG STUDIES:
SUMMARY
• Aid and promote clinical trials
design
• Assure likely safety of initially
explored regimen
• Provide scientific basis for
assessing clinical effects of agent
• Increasingly to focus on
correlating molecular effects of
agents on intended targets along
with “usual” pharmacologic /
toxicologic endpoints