Embed Size (px)
Citation preview

Update on Differentiated Pay
State Board of Education
Sylvia Flowers | Executive Director of Educator Talent | April 2016

Leveraging Differentiated Pay
• Where are we now?
– Four years of educator evaluation data
– Two years of differentiated pay plans
– Current focus on equity and access

The key lever to drive district improvement is the
quality of its people
Preparation Recruitment HiringEvaluation
and Development
CompensationTeacher
Leadership and Pathways
Effective evaluation implementation allows districts to make
“smarter” decisions about teacher recruitment, selection,
evaluation, development, compensation, and retention.

Tennessee Succeeds Project Plan: Educator
Support
Strategy: Support districts in creating greater differentiation of teacher roles, responsibilities, and salaries
Major Action Steps:• Provide technical assistance to districts to support the creation of
teacher-leader models/roles that align to instructional priorities
• Increase the usage of flexible salary schedules and differentiated pay plans across tiers to align to instructional priorities
Targeted Outcomes: • Districts will provide differentiated compensation to educators based
on the state board guiding principles.
• Districts will maintain or improve the number/percentage of Highly Effective teachers (Level 4 and 5) retained and decrease the number of Level 1 teachers retained.

Tennessee Succeeds Project Plan: All Means All
Strategy: Increase equity of access to highly effective teachers
Major Action Steps:
• Engage districts in understanding local equity gaps
• Report equity gaps publicly on online report card by 2016-17
Targeted Outcomes:
• Districts will reduce equity gaps in math and reading using human
capital strategies.
• The state will generate equity gap information using TVAAS 4-8,
9-12/EOC on an annual basis for districts and for public reporting.
• Educators’ beliefs about the benefits of RTI and access will improve.

Differentiated Pay Policy
• Requires LEAs differentiate how they pay licensed personnel
• No presently employed teacher can earn less than they currently make; they can only make more
• Districts have flexibility under the law to develop and implement pay plans that meet their specific priorities, needs, and context:
– Reward teachers who teach in high needs schools or high needs subject areas
– Reward teachers for performance based on state board approved evaluation criteria
– Additional compensation to teachers who take on additional instructional responsibilities (i.e. teacher mentors, instructional coaches)
– Adopt alternative salary schedules

Annual Submission Process
• Districts submit differentiated pay plan and salary schedule
by June 30th each year
• Educator Talent team reviews each plan and provides
feedback and final approval within three weeks
• FY16 process includes a new section for districts to report on
implementation of the district’s 2014-15 plan

For 2014-15, districts submitted plans containing various
combinations of differentiated pay elements
57
111
69
42
0
20
40
60
80
100
120
Nu
mb
er
of
Dis
tric
ts
Performance Roles Hard-to-Staff Salary Structure Modifications

2014-15 Tiers of Implementation
TierNumber of Differentiated Pay
Criteria
Percentage of Teachers
Impacted
0 Did not implement 0%
1 1 Less than 10%
2 1-2 ~5-40%
3 1-3 ~25-75%
4 2-4 Greater than 50%
5Performance-Based Alternative
Salary Schedule + 2 otherOver 90%

2014-15 Analysis Using the Tier System
Tie
r
Number of
Differentiated Pay
Criteria
Percentage of
Teachers ImpactedNumber of Districts
0 Did not implement 0% 8 districts
1 1 Less than 10% 49 districts
2 1-2 ~5-40% 55 districts
3 1-3 ~25-75% 21 districts
4 2-4 Greater than 50% 3 districts
5
Performance-Based
Alternative Salary
Schedule + 2 other
Over 90% 10 districts

Looking at 2015-16

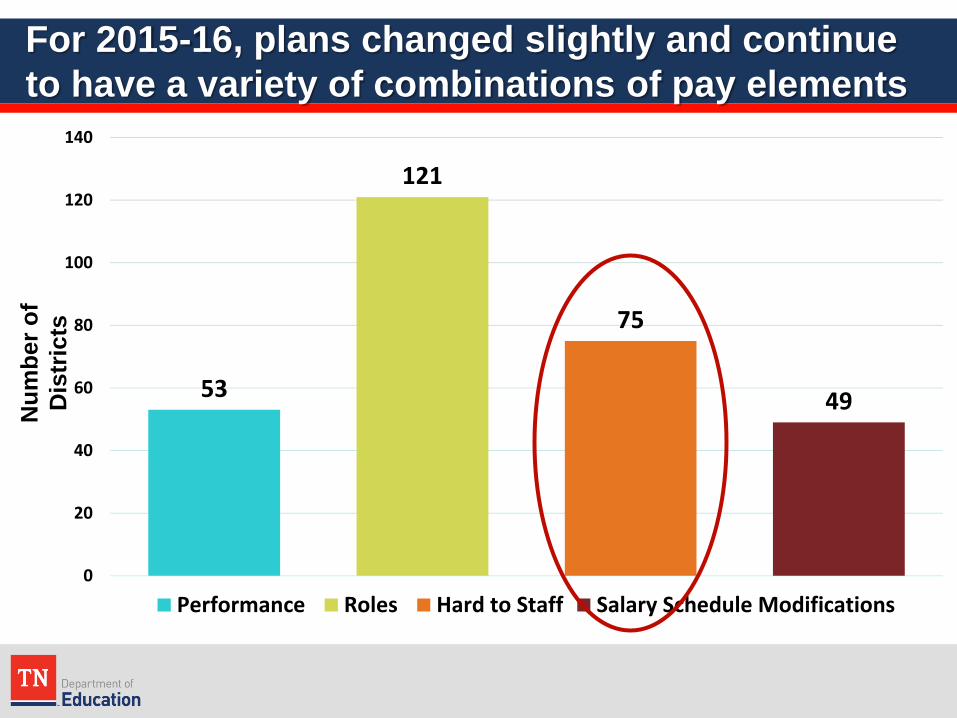
For 2015-16, plans changed slightly and continue
to have a variety of combinations of pay elements
53
121
75
49
0
20
40
60
80
100
120
140
Performance Roles Hard to Staff Salary Schedule Modifications
Nu
mb
er
of
Dis
tric
ts

Comparing 2014-15 plans to 2015-16 plans using
the tier analysis
8
49
55
21
3
10
0
5356
23
3
11
0
10
20
30
40
50
60
Tier 0 Tier 1 Tier 2 Tier 3 Tier 4 Tier 5
Nu
mb
er
of
Dis
tric
ts
2014-15 2015-16

For 2015-16, plans changed slightly and continue
to have a variety of combinations of pay elements
53
121
75
49
0
20
40
60
80
100
120
140
Performance Roles Hard to Staff Salary Schedule Modifications
Nu
mb
er
of
Dis
tric
ts

In 2015-16, more than one-third of districts plan to
implement a performance-based component
• 53 districts developed individual, school, or district performance awards
16
Individual Bonuses, 28
Individual and School
Bonuses, 2
School and/or District Bonus,
2
District Bonuses, 3
Alternative Salary
Schedule, 10
Alternative Salary
Schedule with Bonuses, 8

The structure of performance-based plans varied
according to district needs and goals
• 12 districts are implementing performance based alternative salary schedules
– Kingsport City: Yearly base pay increases of $300-$900 based on level of
overall effectiveness.
• 28 districts are implementing individual bonuses
– Giles County: Eligible for bonuses of $300-$500
– Perry County: $55,000 yearly bonus pool shares for eligible teachers
• 7 districts are implementing a combination of either individual, school and/or
district bonuses
– Bradford SSD: $400 bonus for level 5 school wide TVAAS and individual
bonus from $400-$1000 for level of overall effectiveness
– Van Buren County: Bonus if the district TVAAS composite is effective or
higher
17

For 2015-16, plans changed slightly and continue
to have a variety of combinations of pay elements
53
121
75
49
0
20
40
60
80
100
120
140
Performance Roles Hard to Staff Salary Schedule Modifications
Nu
mb
er
of
Dis
tric
ts

Districts created a variety of new roles for teacher
leaders
121 districts included compensation for additional roles and
responsibilities in their plans
• Instructional Coaches
– Lauderdale County: $2,000 stipend for instructional coach
and $4,000 stipend for curriculum coordinator
– Loudon County: $4,000 stipend for instructional coaches;
level 5 coaches can receive additional $2,000 stipend
• Mentors
– DeKalb County: Level 4 and 5 learning leaders assigned to
support level 1 teachers
• Lead Teachers
– Moore County: Level 3, 4, 5 teachers receive $1,050 stipend
19
For 2015-16, plans changed slightly and continue
to have a variety of combinations of pay elements
53
121
75
49
0
20
40
60
80
100
120
140
Performance Roles Hard to Staff Salary Schedule Modifications
Nu
mb
er
of
Dis
tric
ts

Over one half of districts included hard-to-staff
incentives in their plans
75 districts offered hard-to-staff school or subject incentives
• School Incentives
– Hardeman County: Stipend for high-performing teachers who
transfer to transformation school
– Dickson County: $3,000 stipend for teaching at New Direction
Academy
• Subject Incentives
– Fentress County: $1,000 signing and retention bonus for up
to 3 years for teaching secondary math, chemistry, or foreign
language
– Bledsoe County: $3,000 signing and retention bonus for
speech language pathologists
21
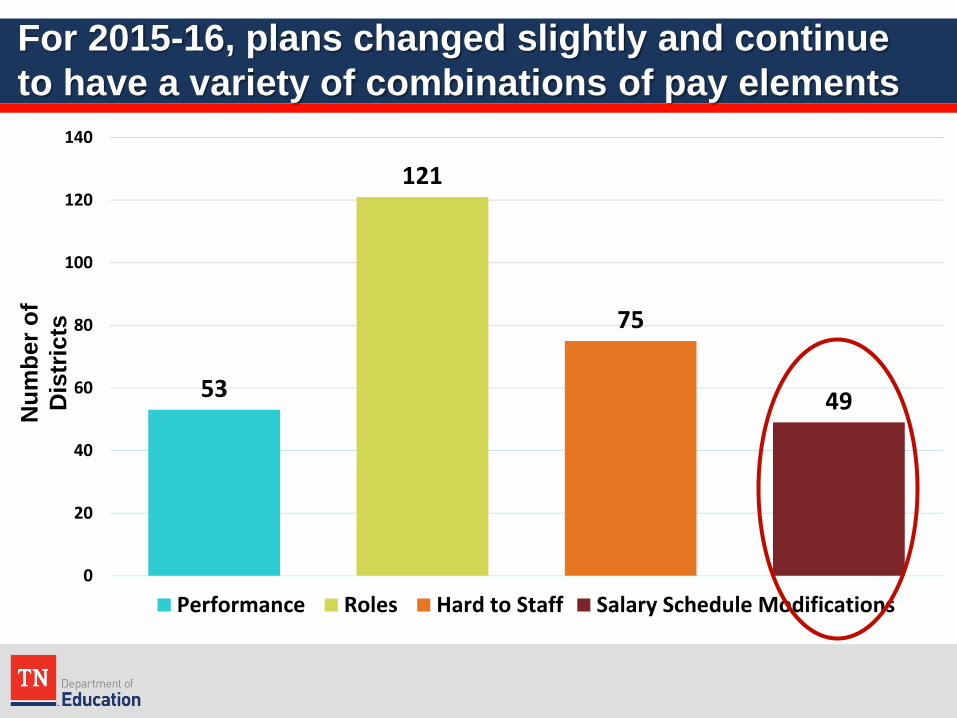
For 2015-16, plans changed slightly and continue
to have a variety of combinations of pay elements
53
121
75
49
0
20
40
60
80
100
120
140
Performance Roles Hard to Staff Salary Schedule Modifications
Nu
mb
er
of
Dis
tric
ts

Salary schedule adjustments are minimal
• State minimum salary schedule allows for districts to have
increased flexibility in modifying their salary schedules to
generate additional funds to invest in compensation.
– Reduce number of advanced degree lanes
– Consolidate experience steps
• Alternative salary schedules
– Base pay increases determined by performance instead of
years of experience
– Education levels no longer automatically recognized
• Require district approval and/or alignment to current duties
23

What about increases in salary?
• Over three-fourths of districts increased the district’s starting
salary and added additional funds to their salary schedules.
• Percentages added to salary schedules varied across the
state.
• Districts that did not increase their salary schedule indicated
that new funds would be directed towards differentiated pay.

Challenges
• Few districts are taking advantage of increased salary schedule flexibility.
• Loss of extended contract funds results in districts transferring pay for additional work-related activities to differentiated pay.
• Hard to staff incentives are not typically leveraged as a strategic recruiting opportunity.
• Districts are creating bonuses that do not meet criteria.
– Input measures such as attendance bonuses
– Bonus awarded to school, not individual teachers

Moving forward into 2016-17
• Work with state board staff to revise and update differentiated pay plan policy language to provide additional clarity for districts.
– Create board policy on differentiated pay
– Clarify language around training and experience in state salary schedule to ensure that advanced degrees are aligned to educator duties
– Establish approval process and renewal cycle for alternative salary schedules
– Define additional roles and responsibilities to align with teacher leader standards
• Continue to work with districts in understanding human capital reports and utilizing the data to drive differentiated pay plan decisions.

Connecting Human
Capital Data Reports to
Differentiated Pay

Human Capital Data Reports Parts 1 and 2
• District reports shared with directors of schools in March 2016
– Part 1 utilizes district’s 2014-15 evaluation data as imported into
TNCompass and focused on evaluation distribution, growth,
recruitment and retention.
– Part 2 utilizes district’s 2014-15 student-teacher assignment data and
2013-14 TVAAS and student performance data to show supply and
effective teaching gaps within and between schools.
• Reports provide data and guiding questions for the following
areas:
– Evaluation
– Growth and Development
– Hiring
– Retention
– Effective Teaching Gaps

Table 1 (Part 1) shows the distribution of effectiveness, which helps
districts forecast the impact of performance based pay.
Using human capital data for performance-based
compensation plans or alternative salary schedules
29

Using human capital data for performance-based
compensation plans or alternative salary schedules
30
Table 6 (Part 1) provides information on persistently high-
performing teachers, which can be used to design incentives
for retaining top talent.
Table 6. Persistently High- and Low-Performing Teachers
Persistently Low Performing Persistently High Performing Total Teachers with 3
Individual Growth Scores
District 8.3%
(2)
29.1%
(7) 24
State 11.7%
(1,747)
35.5%
(5,308)
14,942

Table 7 (Part 1) provides information on retention by level of
overall effectiveness, which can be used to develop strategies
to retain effective teachers through leadership opportunities.
Using human capital data to design career
pathways to teacher leadership roles
31
Table 7. District Retention Rates by Level of Effectiveness (2014-15)
Level of Overall Effectiveness
1 2 3 4 5
Percent of
Teachers
Retained
78.6% 92.9% 85.8% 71.5% 71.5%
Percent of
Teachers who
Moved
Districts
21.4%
(3)
7.1%
(1)
14.2%
(2)
28.5%
(4)
28.5%
(4)

Tables 3 and 4 (Part 2) provide information on school-level
effective teaching gaps, which can help districts prioritize
stipends or incentives to recruit or retain effective teachers in
certain schools or subject areas.
Using human capital data to clearly define hard-to-
staff areas
32
Moving forward into 2016-17
• Work with state board staff to revise and update differentiated pay plan policy language to provide additional clarity for districts.
– Create board policy on differentiated pay
– Clarify language around training and experience in state salary schedule to ensure that advanced degrees are aligned to educator duties
– Establish approval process and renewal cycle for alternative salary schedules
– Define additional roles and responsibilities to align with teacher leader standards
• Continue to work with districts in understanding human capital reports and utilizing the data to drive differentiated pay plan decisions.

Questions?
Name, Position
Date

Districts and schools in Tennessee will exemplify
excellence and equity such that all students are
equipped with the knowledge and skills to
successfully embark on their chosen path in life.
Excellence | Optimism | Judgment | Courage | Teamwork