Embed Size (px)
Citation preview

Educational StandardsCabinet
January 2012

Early Years Performance
The percentage of pupils achieving the target expectations in the Early Years Foundation Stage reached 63%, an increase of 4.8% points on the previous year.
Croydon is outperforming the average for statistical neighbours (SN). The percentage of children judged to be achieving a good level of development (78+ points in total and 6+ in PSE and CLL) is above and improving at a faster rate than the SN average.
The percentage gap between the median (middle score 92) and the bottom 20% is 28.4 – a reduction of 3 percentage points compared to last year (31.4): our children are closing the gap in education between the highest and lowest performers.
The ‘narrowing the gap’ data also shows Croydon has a narrower gap and is reducing the gap at a faster rate than our statistical neighbours.

3.1 EARLY YEARS FOUNDATION STAGE
Percentage of pupils achieving 6+ in PSED and CLL w ith total 78 points or more
0.0
10.0
20.0
30.0
40.0
50.0
60.0
70.0
2007 2008 2009 2010 2011
Year
% o
f p
up
ils
Croydon
SN Average
National Average
Source: Croydon data is from KEYPAS and National data is from DFE Published Data
% achieving target expectations
Percentage gap between median point and lowest achieving 20%
0
5
10
15
20
25
30
35
40
2007 2008 2009 2010 2011
Year
% o
f p
up
ils
Croydon
SN Average
National Average
Gap between average and low performers
Key Stage 2 Performance
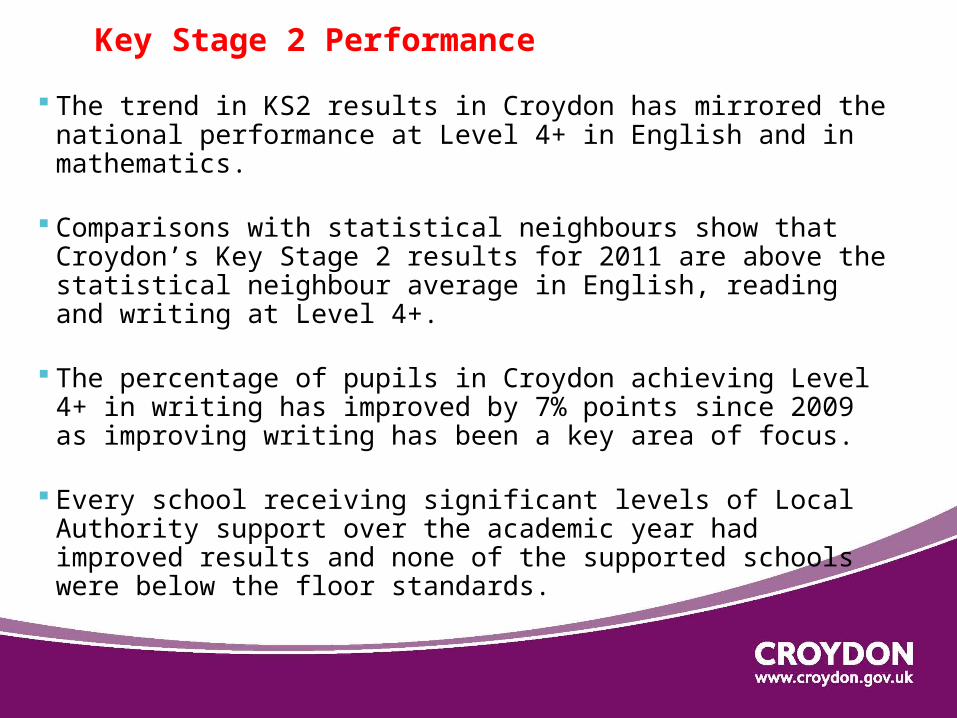
The trend in KS2 results in Croydon has mirrored the national performance at Level 4+ in English and in mathematics.
Comparisons with statistical neighbours show that Croydon’s Key Stage 2 results for 2011 are above the statistical neighbour average in English, reading and writing at Level 4+.
The percentage of pupils in Croydon achieving Level 4+ in writing has improved by 7% points since 2009 as improving writing has been a key area of focus.
Every school receiving significant levels of Local Authority support over the academic year had improved results and none of the supported schools were below the floor standards.
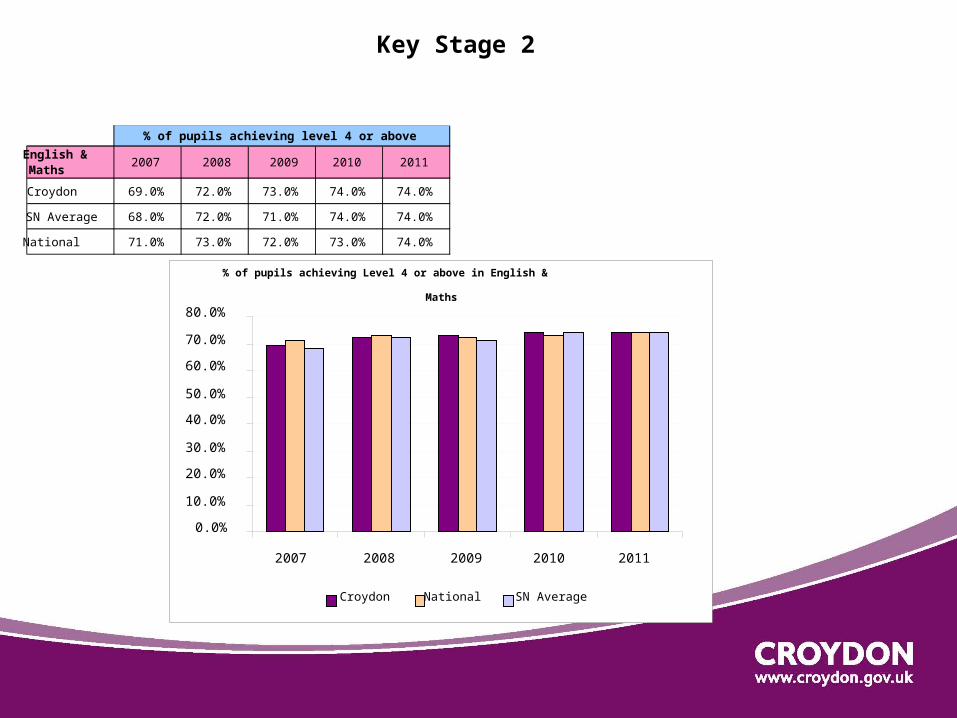
Key Stage 2
English & Maths
2007 2008 2009 2010 2011
Croydon 69.0% 72.0% 73.0% 74.0% 74.0%
SN Average 68.0% 72.0% 71.0% 74.0% 74.0%
National 71.0% 73.0% 72.0% 73.0% 74.0%
% of pupils achieving level 4 or above
% of pupils achieving Level 4 or above in English &
Maths
0.0%
10.0%
20.0%
30.0%
40.0%
50.0%
60.0%
70.0%
80.0%
2007 2008 2009 2010 2011
Croydon National SN Average

Performance of specific groups at KS2 (Level 4+ En & Ma)
Pupils eligible for free school meals attained 62% against 58% nationally. We are closing the gap between this group and those pupils not eligible for free school meal. It has narrowed from 23% in 2010 to 15% in 2011 (below the national gap).
Almost all ethnic groups performed well in relation to the national averages for the same group. Asian pupils performed particularly well, with 82% attaining combined English and mathematics at Level 4+ against 75% nationally. The only ethnic group performing below the national average was White pupils (2% points below the national position).
Pupils whose first language is not English performed very well, with 77% attainment against 72% for the same group nationally.
Pupils with special educational needs but without a statement performed well against national, with 40% attainment against 38% nationally.
Key Stage 4 Performance
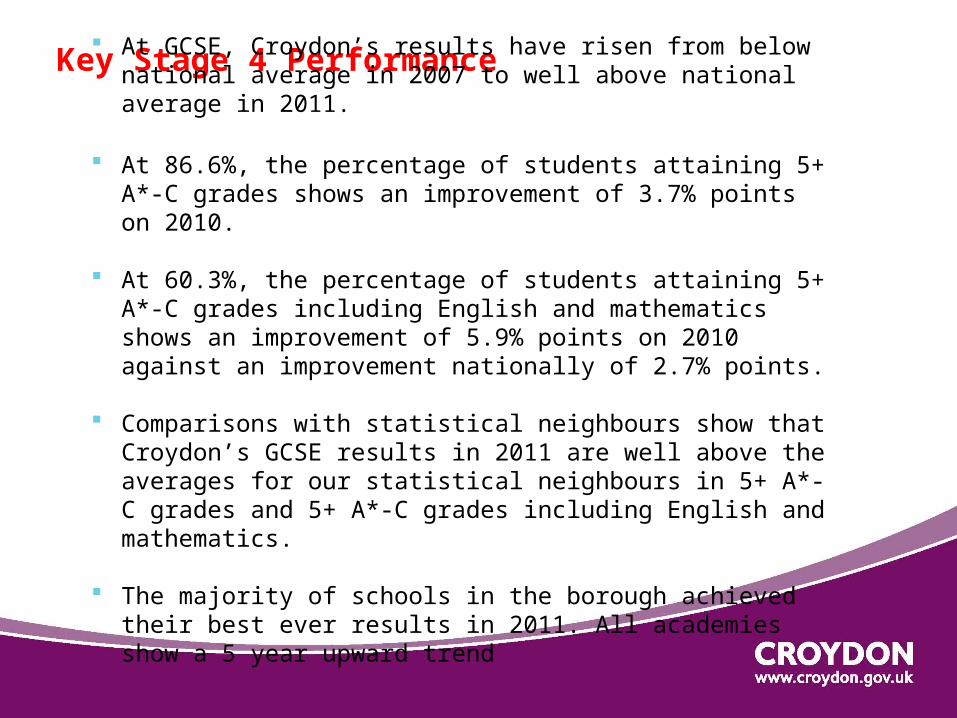
At GCSE, Croydon’s results have risen from below national average in 2007 to well above national average in 2011.
At 86.6%, the percentage of students attaining 5+ A*-C grades shows an improvement of 3.7% points on 2010.
At 60.3%, the percentage of students attaining 5+ A*-C grades including English and mathematics shows an improvement of 5.9% points on 2010 against an improvement nationally of 2.7% points.
Comparisons with statistical neighbours show that Croydon’s GCSE results in 2011 are well above the averages for our statistical neighbours in 5+ A*-C grades and 5+ A*-C grades including English and mathematics.
The majority of schools in the borough achieved their best ever results in 2011. All academies show a 5 year upward trend
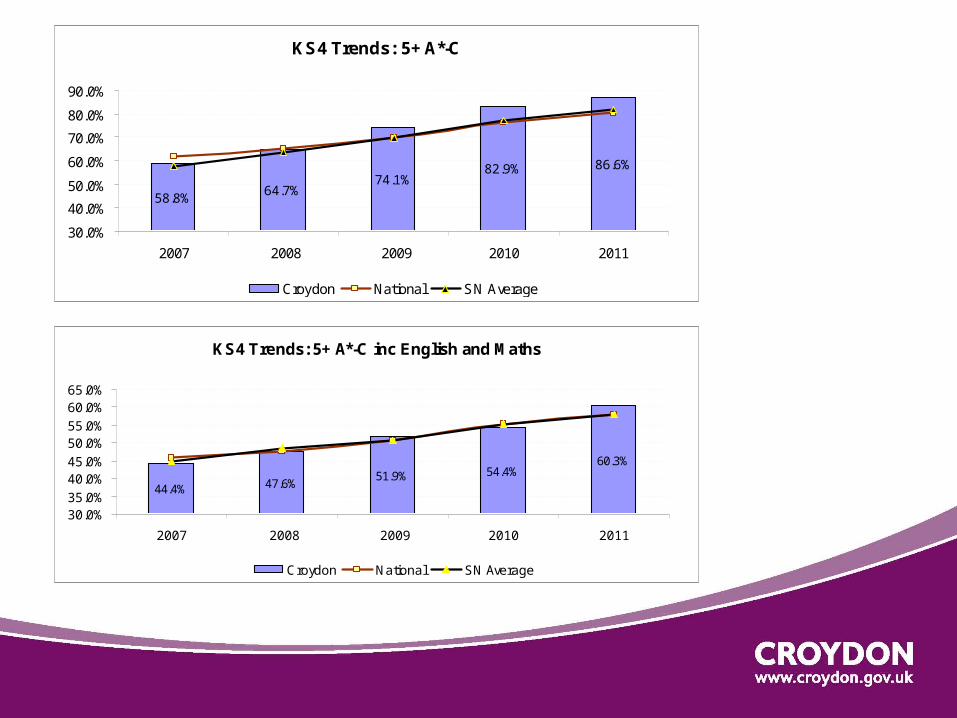
KS4 Trends: 5+ A*-C
58.8%64.7%
74.1%82.9% 86.6%
30.0%
40.0%
50.0%
60.0%
70.0%
80.0%
90.0%
2007 2008 2009 2010 2011
Croydon National SN Average
KS4 Trends: 5+ A*-C inc English and Maths
44.4% 47.6%51.9% 54.4%
60.3%
30.0%35.0%
40.0%45.0%
50.0%55.0%
60.0%65.0%
2007 2008 2009 2010 2011
Croydon National SN Average

Post-16
The Average Point Score per entry shows Croydon post-16 learners achieve slightly higher points per examination entry than average (220 compared to 212) (equivalent to a grade C).
More candidates achieve 2 or more passes than nationally (95.7 compared to 92.2). This includes A-E passes at A level and distinctions, merits and passes in vocational subjects.

Average point score per examination entry
195
200
205
210
215
220
225
2007 2008 2009 2010 2011
Croydon England Average (all schools and FE colleges) England Average (excluding independent schools)
Post-16 Average Point Score per entry

Attendance Croydon reduced secondary persistent absence levels to 4.1% in 2010/11 and
has more than met the national 5% target set for 2011.
Primary overall absence has significantly reduced from 6.6% in 2002/03 to 5.5% in 2010/11.
Overall absence in 2010/11 is better than the statistical neighbour average.
Croydon has achieved significant improvements in reducing secondary overall absence from 8.92% in 2002/03 to 6.06% in 2010/11 and this is (0.46% points) better than the national average, and better than the average for similar areas (statistical neighbours).
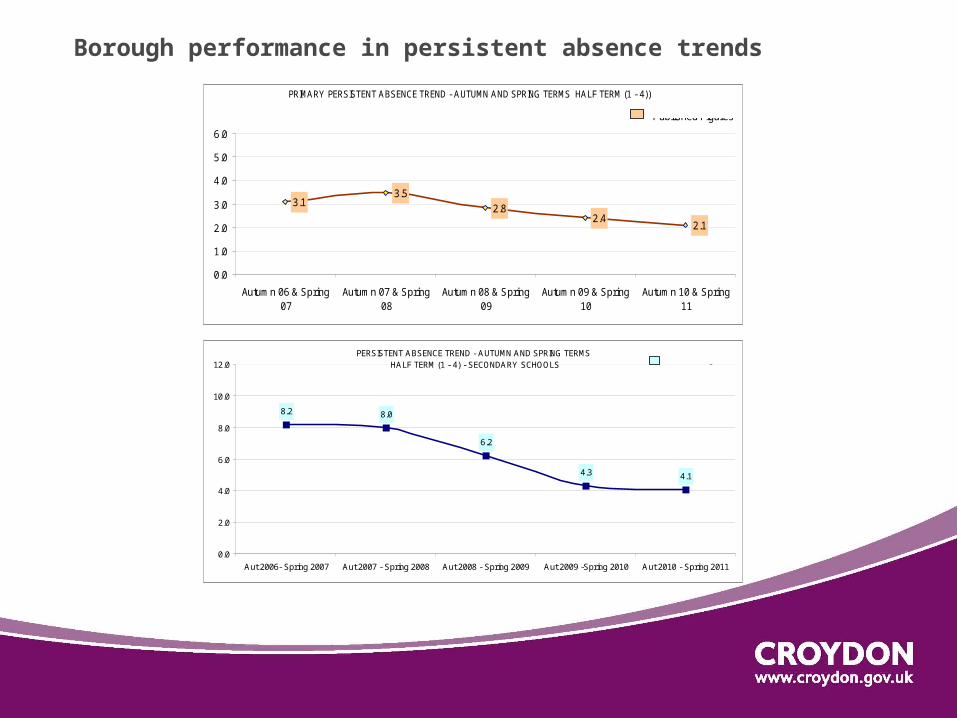
PRIMARY PERSISTENT ABSENCE TREND - AUTUMN AND SPRING TERMS HALF TERM (1 - 4))
3.12.8
2.42.1
3.5
0.0
1.0
2.0
3.0
4.0
5.0
6.0
Autumn 06 & Spring07
Autumn 07 & Spring08
Autumn 08 & Spring09
Autumn 09 & Spring10
Autumn 10 & Spring11
Published Figures
Borough performance in persistent absence trends
PERSISTENT ABSENCE TREND - AUTUMN AND SPRING TERMS HALF TERM (1 - 4) - SECONDARY SCHOOLS
6.2
4.3 4.1
8.2 8.0
0.0
2.0
4.0
6.0
8.0
10.0
12.0
Aut 2006- Spring 2007 Aut 2007 - Spring 2008 Aut 2008 - Spring 2009 Aut 2009 -Spring 2010 Aut 2010 - Spring 2011
Published Figures
Exclusions
There has been a downward trend in Croydon’s exclusion rate over the last five years.
In the primary phase there was significant improvement. Primary permanent exclusions were reduced by nearly half in 2010-11, from 16 (in 2009-10) to 9.
However, last academic year there was a slight increase in overall permanent exclusions. This is attributable to a significant increase in permanent exclusions (17 permanent exclusions) from a single school opened as a new school in September 2010.
OfSTED Inspection Profile
Upward trend in % of primary and secondary schools judged to be good or better by OFSTED:
Between July 2010 and December 2011, the percentage of primary schools has risen from 57% to 63% and secondary schools from 56% to 79%
There has been a reduction in recent months in the number of schools in an OfSTED category. In 2011, 3 schools have come out of a category of concern and are now judged to be satisfactory; only 2 primary schools remain in OFSTED categories of concern and both are making appropriate progress

Executive Summary
Standards of Attainment in Croydon’s schools and settings continue to rise.
Croydon’s children and young people performed well in absolute terms in 2011 and also compared to similar local authorities.
In 2011 many schools secured their best ever results.
School attendance has improved further.
Croydon is not complacent and officers are working in partnership with schools and settings to drive up standards even further.
All those working in education in Croydon can be proud of what has been achieved so far.