Embed Size (px)
Citation preview
EDUCATIONAL PROGRESS INDICATOR
Synthetic Indicator for Monitoring Education
Contribution to Education For All
Boubacar CAMARA

The views expressed by the author are not necessarily those of UNESCO and do not commit the Organisation.
Published by the UNESCO Regional Office in D&u (BREDA) 12, Avenue LCopold Skdar Senghor. BP. 3311, D&r, SENEGAL
@ UNESCO, 1998

Foreword
T his publication is a contribution to Education for All which has won worlwide consensus since 1990. It is aimed particularly at
filling a void symbolized by the inexistence of a comprehensive and operational indicator for monitoring education.
Certainly, there are numerous partial indicators linked to educational sub-systems or some specific aspects. However, there is an increasing need to have a synthetic indicator that takes account of the fundamental aspects of educational progress in a country, a region and at the international level.
Furthermore, the need for comparability is growing with the on-going globalization process together with its counterpart regional and zonal integration. The need is all the more urgent as there is already a comprehensive indicator designed to cover the major aspects of human development. Therefore, the educational system reflecting a greater homogeneity than the socio-economic macro-system, it is quite understandable that an appropriate indicator be assigned to it.
The advent of such an indicator makes it possible to take a fresh look at the trend of education throughout the world, and the progress made as regards the education of women and girls. The issue of gender tackled at various levels, requires undoubtedly, a comprehensive approach, a tool for evaluating overall performances.
The Educational Progress Indicator thus meets a need for innovation in terms of evaluation instruments. Hence, it comes as a supplement to the existing indicators.
I wish to thank all those who, over the last ten years, have participated actively in designing and improving the instruments of socio- economic analysis and evaluation.
To all of them, I am especially indebted.
The author

TABLE OF CONTENTS
Foreword
I. Introduction . . . . . . . . . . . . . . . . . . . . . . . . . . . . . . . . . . . . . . . . . . . . . . . . . . . . . . . . . . . . . . . . . . . . . . . . . . . . . . . . . . . . . . . . . . . . . . . . . . . . . . . . . . . . . . . . . . . . . . ..--.-- 7
II. The Present situation . . . . . . . . . . . . . . . . . . . . . . . . . . . . . . . . . . . . . . . . . . . . . . . . . . . . . . . . . . . . . . . . . . . . . . . . . . . . . . . . . . . . . . . . . . . . . . . . . . . . . . . . . . . . . 9
III. Need for synthesis ..................................................................... ..- ....................................... 11
IV. Constructing the Educational Progress Indicator (EPI) ........................................................ 12
V. Special features and uses . . . . . . . . . . . . . . . . . . . . . . . . . . . . . . . . . . . . . . . . . . . . . . . . . . . . . . . . . . . . . . . . . . . . . . . . . . . . . . . . . . . . . . . . . . . . . . . . . . . . . . . 17
VI. Applications ............................................................................. . ........................................... 19
Regional Selections ............................................................................................................... 19
World Global Trend ............................................................................................................... 30
VII. Monitoring the Education of Women and Girls . . . . . . . . . . . . . . . . . . . . . . . . . . . . . . . . . . . . . . . . . . . . . . . . . . . . . . . . . . . . . . . . . 33
VIII. Prospects . . . . . . . . . . . . . . . . . . . . . . . . . . . . . . . . . . . . . . . . . . . . . . . . . . . . . . . . . . . . . . . . . . . . . . . . . . . . . . . . . . . . . . . . . . . . . . . . . . . . . . . . . . . . . . . . . . . . . . . . . . . . 37
IX. Conclusion ............................................................................................................................ 39
References .............................................................................................................................. 40
EDUCATIONAL PROGRESS INDICATOR
I - Introduction
Throughout the 20 th century and the preceeding centuries, the world has lived without a general indicator that makes it possi- ble to monitor educational progress and facilitate international comparisons at a global level. As we approach the third millenium, the question arises as to whether it is appropriate to operate without a tool for synthesis.
Doubtless, the design of a comprehensive evaluation instrument has become an incontrovertible issue.
To proposed Educational Progress Indicator (EPI), provides an answer to this historical question ; for, at a time that the systemic approach and global perspective are getting increasingly asserted, the educational system should not be behindhand.
To meet the challenge, it is necessary to define the fundamental aspects of education progress from which some basic indicators will be selected.
These aspects reflect the crucial data relating the educational situation.
What method of aggregation or combination should be chosen in line with the objective of evaluating educational progress ?
Since the idea is to evaluate distances bearing in mind some standards, how can these
Introduction
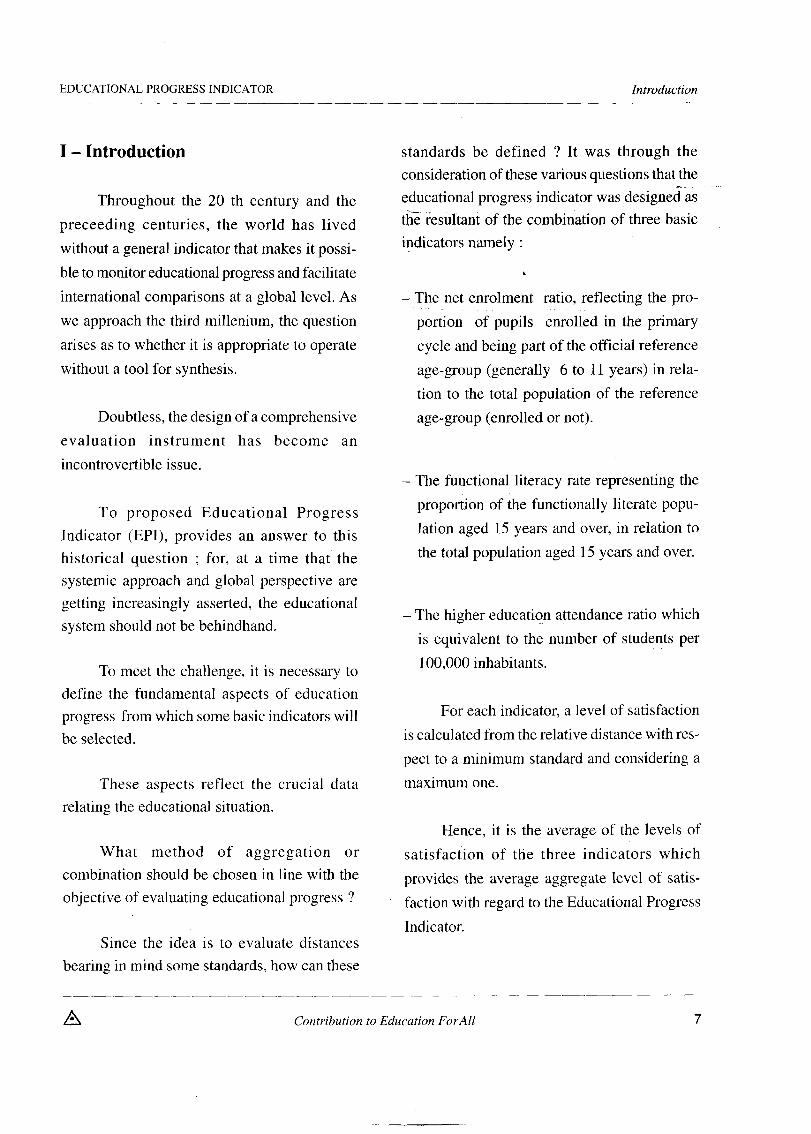
standards be defined ? It was through the consideration of these various questions that the educational progress indicator was designed-as the resultant of the combination of three basic indicators namely :
L
- The net enrolment ratio, reflecting the pro- portion of pupils enrolled in the primary cycle and being part of the official reference age-group (generally 6 to 11 years) in rela- tion to the total population of the reference age-group (enrolled or not).
- The functional literacy rate representing the proportion of the functionally literate popu- lation aged 15 years and over, in relation to the total population aged 15 years and over.
- The higher education attendance ratio which is equivalent to the number of students per 100,000 inhabitants.
For each indicator, a level of satisfaction is calculated from the relative distance with res- pect to a minimum standard and considering a maximum one.
Hence, it is the average of the levels of satisfaction of the three indicators which provides the average aggregate level of satis- faction with regard to the Educational Progress Indicator.
A Contribution to Education ForAll 7
EDUCATIONAL PROGRESS INDICATOR Introduction
The calculation undertaken for the selection of countries by regional groups or development level on the basis of recently available data, shows that countries can be classified into three major groups : countries whose EPI is lower than 60% : these are mainly African countries ; those whose EPI lies between 60% and 75% : most Asian, South American and Central American countries come under this group ; and finally the countries whose EPI va- ries between 75% and 90%, which are the most efficient industrialized countries. None of these countries exceeds at present the 90% threshold. Canada tops the list followed by Australia, Uni- ted States, New Zealand and Finland.
In the African group, Mauritius tops the list followed by Swaziland, Tunisia, Botswana and Algeria. An examination of the EPI at the global level shows that during the last four decades, the EPI remained virtually below 50% Moreover, from decade to decade, the rate of educational progress slowed down. Thus from a variation of 6.8 points between 1960 and 1970, the progression registered was only 5.4 points in 1990 as compared with 1980. The effects of the economic crisis are not foreign to such a decline.
However, with regard to the EPI relating to the female population, there was a slight pro- gression in 19800990 as compared with 1970/ 1980.
But nevertheless, the female EPI was below 47% in 1990.
Concerning all developing countries, the average EPI level and the female specific EPI are greater than the corresponding levels of Africa. Therefore, it is obvious that for Africa, education should take absolute priority.
The different trends observed reflect the results of the educational, socio-economic and cultural policies implemented. Finally, it will be noted that at the current rate of increase of EPI worldwide, a period of at least 7 decades would be required to achieve a 100% EPI, if the socio-economic and cultural conditions do not deteriorate.
What then would happen if the 100% level is attained ? A new historical choice of relevant indicators will be envisaged. Among such indicators, the rate of functional literacy in computer techniques and new communica- tion technologies, the percentage of successful1 secondary school leavers and the number of students per 100,000 inhabitants, together with a new historical objective to be attained, could be experimented as basic indicators to be considered in the calculation of a renovated EPI.
But at present, the aim is especially to take account of the current educational realities experienced by the majority of countries.
8 Contribution to Education ForAll A

EDUCATIONAL PROGRESS INDICATOR The present situation
II - The present situation cost indicators, have engaged the attention of development planners, managers and actors.
The establishment of the information system for development planning and manage- ment is a priority task in most States.
In this investigation dynamics, the problems of definition are certainly of great importance. l
This information base is especially necessary since, for over a quarter of a century , the world economy, particularly the economy of developing countries, has been striving to get out of the crisis and have a new lease of life.
To the requirements of national planning can be added the need for monitoring and evaluation in the development agencies providing technical and financial support.
At the end of the 80s the crisis which had become acute for some countries, particularly those under adjusment, triggered a trend that encouraged the mastery and control of human resources and sustainable development indicators. The idea was to define some new strategies that would make it possible to make significant progress with regard to analytical and evaluation instruments in the 90’s (Miles, 89).2
Measuring the impact of activities and initiatives, evaluating the scope of political, economic, social and cultural measures are all key aspects in the search for efficiency and effectiveness. To this end, the debate on growth and development has triggered an extensive search for socio-economic indicators including growth and social indicators.
Human resources development was at the very centre of sustainable development concerns. Hence, for the design of new indicators, such an orientation is worth taking into account.
The famous per capita GNP was not enough to reflect the level of development. The need to undertake a selection of indicators for the purpose of development management has led to the formulation of numerous proposals for indicators deemed the most adequate. In education in particular, the indicators relating to each sub-system of the educational system as well as agregate indicators and particularly
The year 1990 was a turning point with the advent of the concept of human development and the formulation of a synthetic indicator for the entire national socio-economic system, namely the Human Development Index (HDI)3
1 Social indicators : Problems of definition, UNESCO-P ARK 1974.
2. Human Resources and Sustainable development social indicators, strategies for the 90’s. A discussion note, UNESCO, 1989.
3. Human Development Report, 1990,199 1,1997 UNDP .
A Contribution to Education ForAll 9

EDUCATIONAL PROGRESS INDICATOR
The research conducted in the 80’s finally produced the expected results with this major innovation both at the conceptual level and at the level of measurement methods.’ The refinement of the 1990 proposals led to the con- cept of sustainable human development which took into account the sustainable nature of the development process and meeting people’s needs.
The limitation of basic indicators to three namely, life expectancy, literacy level (and subsequently, level of education) and per capita income constitutes a special datum, which does not necessarily reflect all the principal dimen- sions of socio-economic progress. However, the indicator is a great feat making possible, among other things, international comparability.
As the authors themselves have asserted, the tool is improvable.
Consequently, it is in this context that work is continuing with a view to improving tools. The initiatives of OECD, DAC (Development Assistance Committee) the World Bank and United Nations Agencies relating to the selection of key indicators for development management in shaping the 21st century 2-3 fall within these dynamics.
1. Desai, M (1991). Human development concept and measurement in European Economic Review, vol. 35.
2. Shaping the 21st century : The contribution of development co-operation. OECD, DAC, May 96.
3. Joint OECD/UN/World Bank seminar on indicators of development progress, 20-21 May 1997.
The present situation
In the countries, the activities relating to collection, selection and applied research are mostly embobied in the orientations of the Framework of Action for Meeting Basic Edu- cation Needs and the World Declaration on Edu- cation for All.
Some significant progress has been made in the preparation of educational statistics in the various regions of the world, especially in basic education statistics. The Social Development Summit, the Beijing World Conference on Women and recently the World Conference on Higher Education, emphaszized the issue relating to the access of all to social services equity and the need to anticipate the future and promote peace and sustainable human and so- cial development.
The comprehensive approach reflected by the paradigm << Learning to live together >) has won worldwide consensus.4 How is it possible to reflect this comprehensive, systemic approach in the evaluation of human being improvement, in the evaluation of national, regional and international progress in terms of human resource development?
4. This paradigm corresponds to one of the four pillars proposed by the report of the International commission on education for the 21st century : << Education, The Treasure Within x
10 Contribution to Education ForAll A

EDUCATIONAL PROGRESS INDICATOR Need for synthesis
III - Need for synthesis literacy rate be calculated to reflect the level of education I.
Over and above the approach underscored, Education For All is one of the paramount demands for synthesis. Indeed, Education For All is not confined exclusively to basic education for all which is nontheless a basic component. Education For All, obviously encompasses all levels and forms of education.
Futhermore, the World Declaration on Higher Education stressed the issue of access to higher education for all and without discri- mination.
Do the formulated level indicators resulting from the aggregation of elementary indicators make it really possible to evaluate the progress made in education at the global level ? It is certain that the problems relating to the definition of reference groups, which are varia- ble according to the country, as well as the choice of weighting, all represent the difficulties posed by the problem of comparabilty and relevance given the diversity of realities worldwide.
Accordingly, in educational research and particularly in the design of new and appropriate analytical and evaluation instruments, a synthetic indicator capable of reflecting the trend of education for all is unquestionably topical. The world can no longer be satisfied with only partial indicators corresponding to various levels and forms of education. Several proposals relating to the aggregation of indicators have been formulated, such as the one related to the consolidated enrolment ratio for all reference age-groups combined. The enrolment ratio relating to the 6-23 years age-group was calculated. This ratio reflects the proportion of total enrolments at the three levels (primary, secondary and higher education) in relation to the total population of the reference age-group.
Rather than tackling the issue of synthesis from the standpoint of aggregated educational levels would it not be better to consider it from the angle of the fundamental aspects of educational progress that make it possible to achieve the synthesis of educational progress according to the specified aspects ?
Such an approach resolves the difficulties underscored with respect to the aggregation of level indicators. Thus, aggregation according to the levels, would be substituted for the aggregation based on relative variations in re- lation to specific standards. In other words, the educational progress approach would be given priority consideration in relation to the << level of education attained >> approach. As its name indicates, the Educational Progress Indicator draws on the suggested orientation.
It was also proposed that the weighted average of the consolidated enrolment ratio and
1. Human Development Report 1997, UNDP
A Contribution to Education ForAll 11

EDUCATIONAL PROGRESS INDICATOR Constructing the Educational Pmgress Indicator (EPI)
IV - Constructing the Educational Progress Indicator (EPI)
The Educational Progress Indicator results from the combination of the relative deviations of three basic indicators in relation to the stand- ards defined. These three indicators correspond to the crucial aspects of educational progress.
i) Choice of basic indicators
The choice of indicators is governed by taking into account the primordial aspects relating to meeting educational needs. Among these needs, are the following three aspects :
0 Primary education
Basic education is a prime necessity, a fundamental right which should be guaranteed and preserved through continued efforts at improving the accessibility, access, relevance and quality of learning. _
Although in 1990, over 128 million children of school-going age had no access to basic education, 10 years later, in spite of the real progress made, the needs are still considerable, particularly in regions such as Africa where the number of unschooled children tends to increase, and South Asia. Primary education as the basis of human resource development is therefore viewed as an imperative for sustainable development. Because without it, the future of human
resources is mortgaged and hence, the economic performances which depend on them in the medium and long term.
Thus, the primary education indicator namely, the Net Enroment Ratio (NER) which is equivalent to the ratio of the schooled popu- lation of the official reference age-group to the total population of the same reference age-group corresponds to the first fundamental aspect of educational progress’ retained in the construct- ion of the EPI.
a Functional literacy
The alarm raised about the world ” scourge ” caused by illiteracy reflects undoubtedly, the crucial importance that should be given to the satisfaction of this vital need, for some 900 mil- lion persons one-third of whom are women. THe consequences of illiteracy are numerous with regard to mother and child health, family upkeep, local development of basic communities. It is worth noting today that in some Sahelian African countries in particular, eight to nine women out of ten in the rural area are illeterate.
Yet, these women constitute the principal source of wealth creation in the rural area especially in relatively unurbanized areas.
1. The crucial role of early childhood education leading to primary education is however worth noting. This education level falls within the framework of sharpening the awareness of children, developing their personality and improving the conditions of their access to primary education. It is an integral part of basic education.
12 Contribution to Education ForAll A

EDUCATIONAL PROGRESS INDICATOR
For these reason, meeting the immediate educational needs of the majority of the popu- lations in most developing countries is one of the keys to the achievement of national survival and socio-economic emancipation. The cons- truction of the educational progress indicator cannot afford to exclude such a fundamental aspect.
Thus, the functional literacy rate’ representing the ratio of the functionaly literate population aged 15 years and over to the total population aged 15 years and over was retained as a second basic indicator within the composi- tion of EPI.
l Attendance in higher education
Although the quality of human resources depends basically on the quality of basic education, including the protection of and self- realization in early childhood, followed by the quality of secondary education, it also depends and especially so, on the quality of higher train- ing on which depends in the final analysis the quality of the other levels of education.
Indeed, a qualitative training of trainers programme and the availability of competent researchers, technicians and managers constitute
1. The functional character of literacy was emphasized in order that literacy be delt with as an operational learning leading to directly useful acquisitions in everyday life.
Constructing the Educational Progress Indicator (EPI)
a primordial basis of support for socio-economic and cultural development in general, and educational development in particular.
The access to qualitative higher education without discrimination is an indispensable opening for laying the foundations of a sustainable growth and the basis of a sustainable human development.
This access is not limited to young people but targets also all actors who need to improve
their knowledge, know-how and attitudes in a continous manner throughout life. Thus, the more actors there are in continued learning and training at a higher level, the more the country strenghthens its human resource potential and hence its development potential.
The close linkage between higher education and active professional life corres- ponds to a contemporary need for educational progress and socio-economic and cultural progress. Since the logical outcome of learning processes from the primary to the secondary level is to reach the highest level of acquisition of knowledge, know-how and attitudes, it is appropriate to retain as a third fundamental as- pect, attendance at higher education level.
It is needless to recall that secondary education for its part, corresponds to a very important stage which prepares among other things, the ground for higher education.
A Contribution to Education ForAll 13

EDUCATIONAL PROGRESS INDICATOR Constructing the Educational Progress Indicator (EPI)
Indeed, it constitutes, as stressed above, a link between primary education and higher education. Given the interdependence and the need to take into consideration the final educational product at the end of the learning chain, Higher Education Attendance Ratio (HAR) corresponding to the number of enrolments in higher education (Institutions of higher training and universities) per population of 100.000 inhabitants was selected. This ratio reflects the relative magnitude of higher education attendance in the population of the country under consideration.
Thus, the three basic indicator (NER, LIT, HAR) reflect three fundamental aspects which compose, to a large extent, educational progress synthesis, at present, in a large number of countries.
ii) Methods of determination of EPI
The method used draws on the distances of each level of indicators in relation to a specific minimum standard given a maximum standard.
l Selected standards
The minimum standards selected corres- pond to the historical minima registered for the three indicators during the base year considered here, the year 1995 being the last year for which full data were available fo the majority of countries.
~For the net enrolment ratio, the minimum va- lue for all countries for which data are available
is 25% corresponding to the level attained by Mali. As for the maximum rate it is obviously equal to 100%.
l Concerning the functional literacy rate, the minimum value observed in the base year is equal to 20% ; this corresponds to the level attained by Burkina Faso. The maximum rate for the indicator is indeed 100%
l Concerning the higher education attendance ratio, it will be observed that it is not a rate that represents a proportion as in the case of two preceding indicators. The minimum level registered for the indicator is 40 students per 100,000 inhabitants corresponding to one point close to the level attained by Mozambique in 1995.
As for the historical maximum level, it is equivalent to a ratio of 10,000 students to 100,000 inhabitants i.e. to the first decile (l/10). For the moment, the record levels are below 7000 students per 100,000 inhabitants.
All countries are aspiring for excellence and also for strengthening their human potential and especially their scientific, technical, cultu- ral and managerial potential. Some more or less considerable efforts are being made to imprrove the access to and performances of higher education.
Thus, in the present era, attaining the first decile is a historical objective that Humanity dan set itself.
14 Contribution to Education ForAll A

EDUCATIONAL PROGRESS INDICATOR
l Determination of levels of satisfaction
For each value of the indicator Xi (i representing the country) is calculated a level of satisfaction Si corresponding to the following relative distance :
Xi - min X SIX =
Max X - min X
if Xi is the net enrolment ratio.
Xi - 25 SIX =
100 - 25
Thus, for Benin which had a net rate of 59% in 1995, the level of satisfaction for this indicator is :
59 - 25 SIX = = 45.3 %
100 - 25
For a net rate of 100% the level of satis- faction is indeed maximum (100%). when the net enrolment ratio corresponds to the historical minimum, the level of satisfaction is consequently nil (0%).
25 - 25
SIX = =O% 100-25
Constructing the Educational Pmgress Indicator (EPI)
Thus, for each of the three basic indicators, levels of satisfaction are determined on the basis of fixed standards. It is also worth remembering that for each value lower than the minimum stan- dard, the level of satisfaction is considered to be nil (zero).
l Calculation of EPI
The Educational Progress Indicator will correspond to the average of satisfaction levels calculated for each country
Let (Xi, Yi, Zi) represent the three basic indicators respectively.
Xi - min X SIX =
max X - min X
Yi - min Y SiY=
maxY-minY
Zi - min Z SiZ =
max Z - min Z
EPI, = SIX + SiY+ SiZ
3
CS,m EPI i = ; m E (XXZ)
3
A Contribution to Education ForAll 15

EDUCATIONAL PROGRESS INDICATOR Constructing the Educational Pmgress Indicator (EPI)
For an example, for Canada, the calculation of the EPI for 1995 gives :
95-25 99-20 6984-40 IPE = -+-+ = 87.3 %
100-25 100-20 10000-40
The aggregate average level of educational progress would be 87.3%. This level is at the moment, the highest among all countries.
It is therefore possible to classify all countries having full data for the three indicators.
16 Contribution to Education ForAll

EDUCATIONAL PROGRESS INDICATOR Special Features and Uses
V - Special Features and Uses
The values assumed by the indicator range from 0 to 100%. The value ( 0) corresponds to the EPI of a country which has a level equivalent to the minimim standards (25, 20, 40) for the three basic indicators composing the EPI. On the contrary, the maximum value of 100% cor- responds to the values of basic indicators equivalent to the maximum standards (100,100, 10,000).
Educational Progress Indicator by virtue of its synthetic and holistic character, could be a part of a selection of development indicators and be taken into account in a multi-dimensional analysis of socio-economic and cultural progress.
Indeed, the need for systemic analysis are increasingly compelling the consideration of the educational dimension in the search for solu- tions to the problems of the society.
Thus, the EPI makes possible the comparability between countries in spite of differences of systems, on condition that the basic indicators be made available.
The determination of the female specific EPI also represents a means to evaluate overall performances in relation to the development priority pertaining the promotion of women and girls worldwide.
Furthermore, the Educational Progress Indicator can be applied to a subregion, or a group of countries. This is especially useful within the framework of an integration process aimed at the evaluation of the progress made in the development of human resources and the enhancement of human potential.
The trend in time of the .female EPI appears to be a source of evaluation that makes it possible to draw justified conclusions in rela- tion to gender issue.
Although the comparison with a given date provides a possibility for classification, it is worth emphasizing that monitoring over time the progression of the indicator would be of great help, in that, it makes it possible to have an overall idea of educational progress in each country or group of countries. Different rates of progression by subperiods would emerge.
Indeed, girls and women are taken into account at the initial stages of the calculation of EPI in the light of the very nature of the indicators composing it and covering inter alia, the educational needs of these two categories of beneficiaries.
These variations should be analyzed bearing in mind the socio-economic, political and cultural factors which affect the overall trend of the educational system.
Furthermore, given the considerable inequalities that exist in meeting the educational needs of women and girls in many countries, the female EPI could be used as anindicator for classifying the countries, and finally as a special indicator for evaluating the progress made.
A Contribution to Education ForAll 17

EDUCATIONAL PROGRESS INDICATOR Special Features and Uses
Finally, for retrospective and prospective studies, the EPI would be a useful input in the light of its varied possibilities of use.
18 Contribution to Education ForAll

EDUCATIONAL PROGRESS INDICATOR
VI - Applications
Among the possible applications, it has been deemed useful to select some groups of countries with some economic or geocultural similarities, for which the Educational Progress Indicator is calculated on the basis of the period relating to the last decade of fully available data : 1985-1995. These results include the classification of countries, the determination of the first of each group, the trend of progress between the years 1985 and 1995.
l Selection of industrialized countries
On the basis of the 15 selected countries corresponding to the world’s most industrialized countries, the calculated EPI lies within the range : 75% -90%. Canada thus tops the list with an EPI of 87.3%. It is observed that in the sub- group of the first four in 1985, there were chan- ges in 1995. However, the country at the top of the list remained the same.
TOP 4 EPI 1985 TOP 4 EPI 1995
2 United States 3 New Zealand 4 Australia
2 Australia 3 United States 4 New Zealand
Applications
Australia registered a remarkable leap by climbing up to the 2nd place in 1995 after occupying the fourth place in 1985. The perform- ance could be attributed to the considerable ef- forts which led to the expansion of higher education. In fact, from a level of 2366 students per 100,000 inhabitants in 1985, the higher education attendance ratio rose to 540 1 in 1995 i.e. more than double.
Furthermore, by examining the magnitude of educational progress over the decade, through the calculation of the absolute change in the indicator between 1985 and 1995, Australia is far ahead of other countries with an absolute increase of 10.2 points as against 2.4 for the Uni- ted States, 2.2 points for Canada and 5.5 points for New Zealand.
The classification by order of magnitude of the progress made over the decade period leads to the following distribution.
Contribution to Education ForAEl 19

EDUCATIONAL PROGRESS INDICATOR Applications
Classification according to EPI 1985-l 995Variation - lndustrialized Countries Selection
Canada
United States I I
Japan
Belgium
United Kingdom
France
Netherlands
New Zealand
Spain
+ I I Norway
Australia I I I I
0 2 4 6 EPI Variation 1985-I 995
It emerges from the results that there is a catch up phenomenon between the leading country and the others particularly, Australia, Norway, Spain, New Zealand, the Netherlands and France. These observed significant developments reflect the impact of the implemented policies, as well as the impact of social movements that condition the application of reform measures. As another revelation of the EPI, there is a remarkable difference with the
classification based on the HDI (Human Development Index).
In fact, for the HDI calculated in 1995, the first five are Canada, France, Norway, Uni- ted States and Finland. On the contrary, for EPI, the classification is the one already indicated. As regards the HDI of these countries in ad- dition to education, the growth and life expectancy factors had a crucial influence.
20 Contribution to Education ForAll A

EPI 1995 Indistrialized Countries Selection
COUNTRIES
Canada
France
Norway
United States
Finland
Netherland
Japan
New Zealand
Sweden
Spain
Belgium
Austria
United Kingdom
Australia
Germany
Xi
NER
95.0
99.0
99.0
96.0
99.0
99.0
100
100
100
100
98
100
100
98
100
Xi-25 Yi Yi-20 Zi Zi-40 EPI EPI HDI EPI A EPI
100-25 LIT 100-20 HAR 10.000-40 CSim Rank Rank 1985 19851995 Si X Si Y Si Z 3
0.933 99 0.988 6984 0.697 87.3% 1 1 85% +2.3
0.987 99 0.988 3617 0.359 77.8% 8 2 72.5% +5.3
0.987 99 0.988 4009 0.398 79.1% 6 3 72% +7.1
0.947 99 0.988 5395 0.538 82.4% 3 4 80.0% +2.4
0.987 99 0.988 4033 0.401 79.2% 5 5
0.987 99 0.988 3485 0.346 77.3% 9 6 71.9% +5.4
1 .oo 99 0.988 3139 0.311 76.6% 10 7 72.6% +4.0
1.00 99 0.988 4603 0.458 81.5% 4 8 76.0% +5.5
1 .oo 99 0.988 2810 0.278 75.5% 14 9
1.00 97,l 0.968 3858 0.383 78.2% 7 10 72.6% +5.6
0.973 99 0.988 3206 0.318 76.0% 12 11 71.9% +4.1
1 .oo 99 0.988 2933 0.290 75.9% 13 12
1.00 99 0.988 3126 0.310 76.6% 11 13 72.2% +4.4
0.973 99 0.988 5401 0.538 83.3% 2 14 73.1% +10.2
1 .oo 99 0.988 2649 0.262 75.0% 15 15
Source of basic data : World Education Report, 1998 UNESCO Human Development Report, 199 1 - 1998 UNDP Statistical Yearbook, 199 l- 1997 UNESCO

EDUCATIONAL PROGRESS INDICATOR Applications
l African selection
The determination of Educational Progress Indicator for the African selection in 1995 shows that all the values of the EPI obtained are lower than 60%. Mauritius tops the list with 59.5% followed by Swaziland, Tunisia, Botswana and Algeria.
The comparisons of classification of the first 5 countries between 1985 and 1995 are as follows :
TOP 5 EPI 1985 TOP 5 EPI 1995
One remarkable fact is the exit of Zambia from the group of the first 5 to the advantage of Algeria. Even for Zambia, a regression of 0.9 point in EPI in 1995 compared with 1985 is observed ; this is due to a fall of 13 points in the net enrolment ratio. Such a phenomenon is particularly observed in Lesotho, where the decline by 6 points in the net enrolment ratio between 1985 and 1995 negatively influenced the change in EPI during the period under consideration.
As for the performances in relation to educational progress over the decade period, Malawi stands out prominently as compared with the rest since it registers a positive varia- tion of 31.4 points between 1985 and 1995 followed by Swaziland, a distant second (11.2 points) and then Algeria (10.4 points).
Classification according to EPI 1985-I 995 Wiation - Africa Selection
10 15 20 25 30 35
EPI Variation 1985-I 995
22 Contribution to Education ForAll A
EDUCATIONAL PROGRESS INDICATOR Applications
The specific case of Malawi may be due to the upswing of primary education which could be explained to a large extent, by the abo- lition of school fees. The net enrolment ratio therefore registered a spectacular leap of 57 points in 10 years, thus sanctioning universal primary education.
In the African selection, it is worth noting that there are 4 countries which do not attain an EPI of 20%. These are (in descending order of magnitude) Senegal, Burundi, Mozambique and
Burkina Faso. Concerning the comparison of the HDI classification, with a few exceptions, the order seems to be relatively the same : five countries mantained exactly the same rank. For four other countries, the rank is lagged by one place.
This relative concurrence could be explained by the rigidities exerted on per capita income and longevity, which depend notably, on the generally low level of human resource development.
Contribution to Education ForAll 23

EPI 1995 African Selection
COUNTRIES Xi-
NER
Xi-25
loo-25 Si X
Yi
LIT
Yi-20
100-20 Si Y
Zi
HAR
Zi-40 EPI
10.000-40 CSim Si Z 3
EPI
Rank
HDI
Rank
EPI
1985
A EPI
1985-1995
Algeria 95 0.933 61.6 0.520 1126 0.109 52.1% 5 2 52.1% +12.8
Benin 59 0.453 37 0.213 208 0.017 22.8% 11 8 22.8% +5.5
Botswana 96 0.947 69.8 0.623 403 0.036 53.5% 4 4 47.6% +3.1
Burkina Faso 31 0.080 19.2 0.0 96 0.006 2.9% . 15 15 0% 0
Burundi 52 0.360 35.3 0.191 74 0.003 18.5% 13 14 9.4% +1.9
Lesotho 65 0.533 71.3 0.641 221 0.018 39.7% 8 7 31.4% -13.4
Malawi 100 1 .ooo 56.4 0.455 76 0.004 48.6% 6 12 11.7% +30.7
Morocco 72 0.627 43.7 0.296 1153 0.112 34.5% 9 6 0%
Mauritius 96 0.947 82.9 0.786 564 0.053 59.5% 1 1 16.1% + 7,6
Mozambique 40 0.200 40. I 0.25 1 41 0.0 15.0% 14 13 57.2%
Tanzania 48 0.307 67.8 0.598 43 0.0 30.1% 10 10 9.8% -4.1
Senegal 54 0.387 33.1 0.164 290 0.025 19.2% 12 11 6.4%
Swaziland 95 0.933 76.7 0.709 543 0.05 1 56.4% 2 5 44.5% + 11.5
Tunisia 97 0.960 66.7 0.584 1253 0.122 55.5% 3 3 40.0% +8.8
Zambia 75 0.667 78.2 0.728 241 0.020 47.1% 7 9 43.0%
Source of basic data : World Education Report, 1998 UNESCO Human Development Report, 199 1- 1998 UNDP Statistical Yearbook, 1991- 1997 UNESCO
EDUCATIONAL PROGRESS INDICATOR Applications
l The American selection
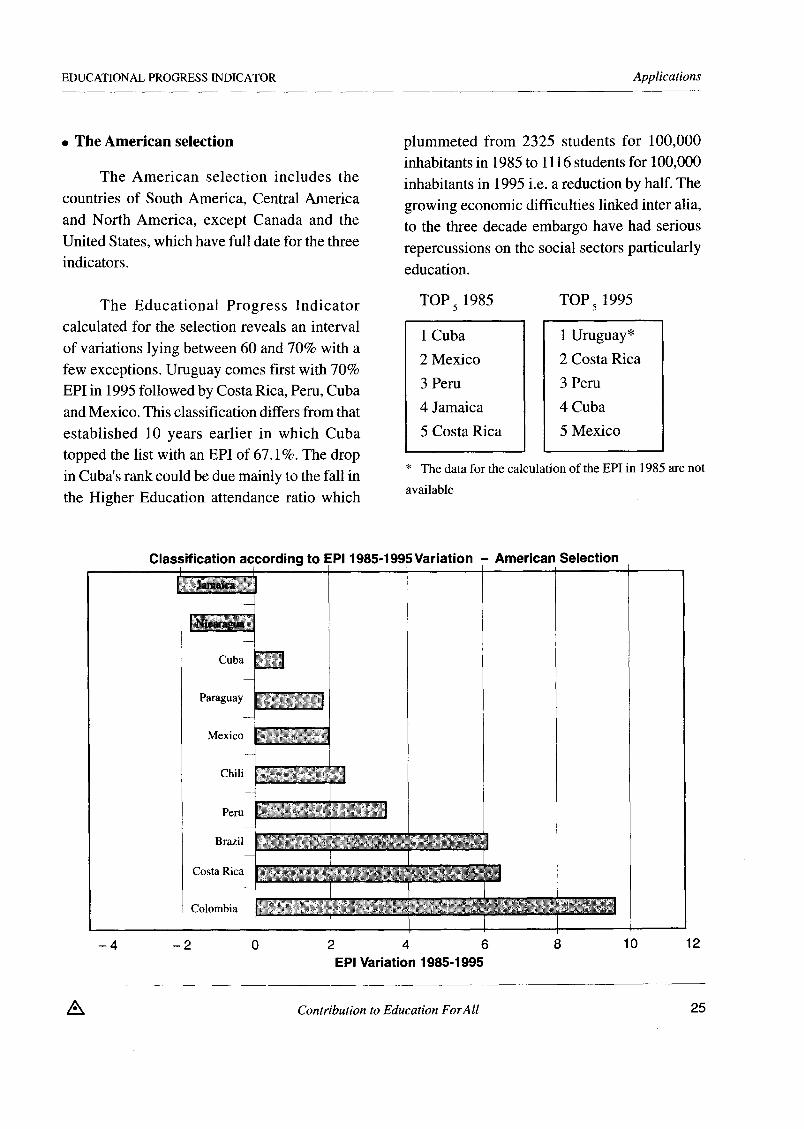
The American selection includes the countries of South America, Central America and North America, except Canada and the United States, which have full date for the three indicators.
The Educational Progress Indicator calculated for the selection reveals an interval of variations lying between 60 and 70% with a few exceptions. Uruguay comes first with 70% EPI in 1995 followed by Costa Rica, Peru, Cuba and Mexico. This classification differs from that established 10 years earlier in which Cuba topped the list with an EPI of 67.1%. The drop in Cuba’s rank could be due mainly to the fall in the Higher Education attendance ratio which
plummeted from 2325 students for 100,000 inhabitants in 1985 to 1116 students for 100,000 inhabitants in 1995 i.e. a reduction by half. The growing economic difficulties linked inter alia, to the three decade embargo have had serious repercussions on the social sectors particularly education.
TOP, 1985
1 Cuba 2 Mexico 3 Peru 4 Jamaica 5 Costa Rica
TOP 5 1995
1 Uruguay* 2 Costa Rica 3 Peru 4 Cuba 5 Mexico
* The data for the calculation of the EPI in 1985 are not
available
Classification accordina to EPI 1985-1995Variation - American Selection
2 4 6
EPI Variation 1985-I 995
A Contribution to Education ForAll 25

EPI 1995 American Selection
COUNTRIES
Costa Rica 92 0.893 94.8
Cuba 99 0.987 95.7
El Salvador 79 0.720 71.5
Honduras 90 0.867 72.7
Jamaica 100 1.0 85.0
Mexico 100 1.0 89.6
Nicaragua 83 0.773 65.7
Trinidad and Tobago 88 0.840 97.9
Brazil 90 0.867 83.3
Chile 86 0.813 95.2
Colombia 8.5 0.800 91.3
Guyana 90 0.867 98.1
Paraguay 89 0.853 92.1
Peru 91 0.880 88.7
Uruguay 95 0.933 97.3
Xi NER
1 Xi-25 100-25 Si X
Yi LIT
Yi-20 100-20 Si Y
0.935
0.946
0.644
0.659
0.812
0.870
0.571
0.974 ’
0.791
0.940
0.891
0.976
0.901
0.859
0.966
Zi
HAR
2919 0.289
1116 0.108
203 1 0.200
985 0.095
667 0.063
1586 0.155
1029 0.099
715 0.068
1094 0.106
2412 0.238
1643 0.161
846 0.08 1
931 0.089
3268 0.324
2223 0.219
Zi-40 10.000-40
Si Z
EPI CSim
3
70.6%
68.0%
52.1%
54.0%
62.5%
67.5%
48.1%
62.7%
58.8%
66.4%
61.7%
64.1%
61.4%
68.7%
70.6%
EPI EPI I A EPI
Rank 1985 /
3985-1995
2
4
14
13
9
5
15
8
12
6
10
7
11
3
1
I 64.1% +6.5
I 67.1% +0.9
I 52.6%
64.6%
65.5%
49.7%
62.8%
52.7%
63.9%
52.2%
59.7% +I.7
65.0% +3.8
+1.4
-2.1
+2.0
-1.6
-0.1
+6.1
+2.5
+9.5
Source of basic data : World Education Report, 1998 UNESCO Human Development Report, 199 1 - 1998 UNDP Statistical Yearbook. 199 I- 1997 UNESCO

EDUCATIONAL PROGRESS INDICATOR Applications
Concerning the performances registered in terms of the trend of educational progress in 1995, as compared with 1985, it is rather Colombia which holds the record with +9.5 in terms of the positive variation of EPI ; it is followed by Costa Rica and Brazil.
Colombia’s record is probably linked to the combination of the net progress registered in the field of primary education, literacy and higher education. The net enrolment ratio increased by 13 points over the period.
Contribution to Education ForAll 27

EDUCATIONAL PROGRESS INDICATOR Applications
l Asian Selection
For all the 16 countries selected, the Edu- cational Progress Indicator lies within an interval of 50% to 75%, with the exception of the Republic of Korea which exceeded the 80% limit in 1995. The 1995 classification on EPI basis puts in se- cond position the Phillipines (73.3%) followed by Kirghizistan, Georgia and Cyprus. Ten years earlier, it was the same countries which asserted themselves as the first and second.
Concerning the absolute variation of the EPI between 1985 aned 1995, the countries
which occupied the first position were : Bru- nei Darussalam (+ 10.9 points), United Arab Emirates (+10.6 points), Saudia Arabia (+8,3), and Republic of Korea (+8,2 points).
Some net declines in EPI were registered for Qatar and Kuwait during the decade period ; this was partly due to the decline in the net enrolment ratio (- 11 points for Qatar and -22 points for Kuwait). The impact of the politico- military situation on education (related to the Gulf crisis) in the second half of the period is one of the crucial causes especially in the specific case of Kuwait.
Classification according to EPI 1985-1995 Wriation - Asian Selection
2 4 6 8 10
EPI Variation 1985-l 995
28 Contribution to Education ForAll

EPI 1995 Asian Selection
COUNTRIES Xi Xi-25 Yi Yi-20 Zi Zi-40 EPI EPI HDI EPI A EPI NER 100-25 100-20 10.000-40 CSim 1985 1985-1995
Si X LIT HAR Rank
Si Y Rank
Si Z 3
Saudi Arabia 62 0.493 63 0.538 1280 0.124 38.5% 16 9 30.2% + 8.3
Brunei-Darussalam 91 0.88 88.2 0.853 514 0.048 59.3% 9 3 48.4% + 10.9
Cyprus 96 0.947 94.0 0.925 1191 0.116 66.2% 5 1 62.7% + 3.5
Jnited Arab Emirates 83 0.773 79.2 0.740 493 0.045 52.0% 14 4 41.3% + 10.7
Indonesia 97 0.960 83.8 0.798 1146 0.111 62.3% 7 11 55.9% + 6,4
Georgia 82 0.760 99 0.988 2845 0.282 67.6% 4 15
Kirghizistan 97 0.960 97.0 0.963 1115 0.108 67.7% 3 16
Kuwait 65 0.533 78.6 0.733 2247 0.222 49.6% 15 5 53.1% -3.5
Malaysia 91 0.88 83.5 0.794 971 0.093 58.9% 10 7
Mongolia 80 0.733 82.9 0.786 1569 0.154 55.8% 12 13
Phillipines 100 1.0 94.6 0.933 2701 0.267 73.3% 2 12 68.2% + 5.1
Qatar 80 0.733 79.4 0.743 1422 0.139 53.8% 13 6 57.4% -3.6
Syrian Arab Republic 9 1 0.88 70.8 0.635 1690 0.166 56.0% 11 10 54.4% + 1.6
Rep. of Korea 99 0.987 98.0 0.975 4955 0.493 81.8% 1 2 73.6% + 8.2
Turkey 96 0.947 82.3 0.779 1930 0.190 63.8% 6 8 58.8% + 5.0
China 99 0.987 81.5 0.769 478 0.044 50.0% 13 14
Source of basic data : World Education Report, 1998 UNESCO Human Development Report, 199 1 - 1998 UNDP Statistical Yearbook. 1991- 1997 UNESCO

EDUCATIONAL PROGRESS INDICATOR
By comparing the levels of EPI and HDI, one major difference emerges. While Cyprus occupies the first position with respect to HDI, it comes fifth in the regional selection. The Republic of Korea and the Philippines occupy respectively the 2nd and 12 th place with re- gard to the HDI for the same selection.
The application of EPI to the regional selections has thus made it possible to take a second look at the performances of educational progress in the various countries.
l World Global trend
Over and above the regional selections, how can we assess the trend of educational progress worlwide.
The application of EPI to the aggregated data shows that between 1960 and 1990, the indicator rose from a 33.4% level to 51.3% i.e. a progression of 17.9 points in 30 years ; this is relatively low (about l/2 point of progression a year).
Applications
The combination of the situation between geo-political and cultural regions, and between industrialized regions and agrarian based economies confers such an orientation on EPI.
On the eve of the next millenium, Humanity, with an educational progress indicator of about 50%, has still some lengthy efforts to make in the field of education in order to meet basic needs. To attain a 100% EPI, education in the most underprivileged regions particularly, the region where the EPI is lower than 50% should be placed at the very centre of development concerns. For, there is no doubt that the number one raw material of the next mil lenium is human resource.
A look at the rate of educational progress from decade to decade reveals a continuous decline in rates since 1960. Indeed, from 6.8 points in 10 years during the decade of the 60s this figure dropped to 5.6 points in the 70’s and 5.4 points in the 80’s.
Xi Xi-25 NER 100-25
I SIX
1960 59 0.453
1970 ~ 65.5 0.540
1980 73.3 0.644
; 1990 ~ 79.0 1 0.72
Yi LIT
60.7
67.6
69.5
75.3
IPE MONDE
Yi-20 ~ Zi Zi-40 EPI 100-20 ’ HAR
SiY I
0.509 425
0.595 751
0.619 1150
0.039 33.4 %
0.07 1 40.2 %
0.111 45.8%
0.691 1300 0.127 51.3 %
10000-40 SiZ
C Sim 3
1
30 Contribution to Education ForAll A

EDUCATIONAL PROGRESS INDICATOR Applications
The decline in rate reflects the growing socio-economic difficulties associated with the still prevailing general crisis. In particular, during the 80’s the crisis reached some unexpected proportions together with its political and social consequences in most regions of the world.
Apart from the global trend. the progres- sion of developing countries deserves special attention. During the decade of pronounced crisis (1980/90), the educational progress for developing countries stood at 44.8% in 1990 after having risen by 7.7 points since 1980.
Among these countries, Africa occupies
a critical position : 28.4% for EPI in 1990 i.e. a difference of more than 16 points in relation to the average level registered by developing countries. It is worth noting that the rate of pro- gression of EPI in Africa from 1980 to 1990 is also lower than the developing countries’ ave- rage : 3.6 points in 10 years as against the 7.7 points mentioned above.
Africa’s situation should not be surprising particularly with the decline in per capita pu- blic expenditure on education, which dropped from $48 in 1980 to 41 $ in 1990, while at the same time, expenditures similar to those at the world level rather increased by more than 60% to reach the level of $202 per capita in 1990.
EPI Gender Gap
60
Africa Developing Countries World
1990 m
A Contribution to Education ForAll 31

EDUCATIONAL PROGRESS INDICATOR Applications
EPI Developing Countries
Years
1980 1990
Xi-25 Xi ___
Yi-20 Yi ____ 100-25 100-20
NER SIX LIT SiY
69.3 0.591 58 0.475 76.5 0.687 67.2 0.590
Zi-40 Zi ___
10000-40 HAR SiZ
503 0.046 707 0.067
EPI
Dim 3
37.1 % 44.8 %
EPI Africa
Xi-25 Xi Yi-20 Yi ____ Zi Zi-40 EPI
Years NER 100-25 LIT 100-20 Six SiY
HAR 10000-40 CSim SiZ 3
40.4 0.205 29.4 0.118 133 0.009 11.1 % 60.3 0.47 1 39.8 0.248 324 0.028 24.9 %
1 57 1 0.427 / 50.8 1 0.385 / 454 1 0.042 1 28.4 %
Over the the same period, for all developing countries, an average progression of 29% was registered.
On the whole, the global trend examined on the basis of the 1960- 1990 three decade period reveals that the 100% EPI would be attained only after a period of 7 decades i.e. by 2071’.
In these circumstances, some billions of persons would be sacrificed. This situation should be avoided. On the contrary, an attitude of indefference cannot resolve the problem ; actig fast and well should be the credo for the current period and the three decades ahead. There is need to make untiring and effectively sustained efforts because the survival of
Does humanity need to wait for 7 decades Humanity is at stake.
to attain the 100% objective ? Trend of Global EPI
60
20
10
0 1 I 1960 1970 1960 1990
1 The adjusted straight line with the equation y = 0.6 x + 33.4 gives for Y = 100, the value of X = 1 II years ( from the origin : 1960).
32 Contribution to Education ForAll A

EDUCATIONAL PROGRESS INDICATOR Monitoring the Education of Mbmen and Girls
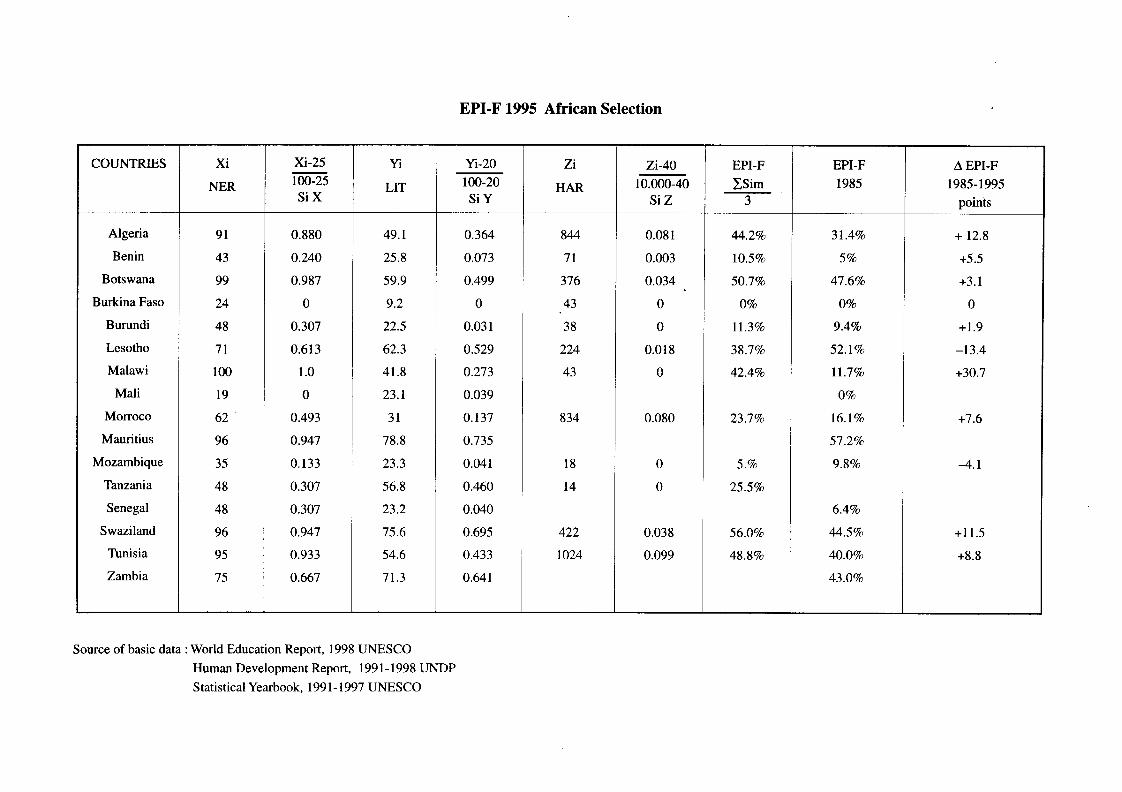
VII - Monitoring the Education of 4,6 points in 1980/90. W ith the low level of EPI-F Women and Girls (29% in 1990), the slowdown observed can be
partly attributed to the consequences of the
The Educational Progress Indicator offers austerity policies implemented.
the possibility of monitoring in terms of gender. The calculation of female sex specific EPI (EPI- However, it is worth noting that the
F) leads to assessing the trend of progress made gender gap with regard to educational progress
with regard to female education. in Africa declined by 2.6 points between 1980 and 1990.
It it observed that at the global level, EPI- F stood at 46.2% in 1990 as against 39.6% in Concerning all developing countries, the
1980 i.e. a progression of 6.6 points which is EPI-F which was 38.1% in 1990 increased by
higher than the progression of the preceding 9.3 points over the 1980 decade, that is, more
decade. In the case of Africa, the progression of than double the African progression. Hence, glo-
EPI-F changed from 13.7 points in 1970&O to bal efforts in the education of girls and women in all other developing countries are more con- clusive than those specific to Africa.
World - EPI-F Female Educational Progress
Xi Six Yi SiY Zi SiZ EPI-F 1970 60.1 0.468 61.9 0.524 569 0.053 34.8 %
1980 67.5 0.567 61.9 0.524 1022 0.099 39.6 %
1990 74.6 0.661 68.7 0.609 1202 0.117 46.2 %
Africa IPE-F
1970
Xi SIX Yi SiY Zi SiZ EPI-F
33.2 0.109 29.4 0.118 60 0.002 7.6 %
1980 53.4 1 0.379 ; 39.8 0.248 174 0.013 21.3 % I
1990 / 52.4 / 0.365 / 50.8 0.385 / 301 / 0.026 / 25.9 % 1
Developing countries IPE-F
1980
1990
Xi SIX Yi SiY Zi SiZ IPE-F
62.4 0.499 46.8 0.335 352 0.03 1 28.8 %
71.3 0.617 57.8 0.473 558 0.052 38.1 %
A Contribution to Education ForAll 33

EDUCATIONAL PROGRESS INDICATOR Monitoring the Education of Wmen and Girls
18 -
14 -
12
10 -
6-
4
2-
0
--
EPI Gender Gap
r
50
45
40
35
30
25
20
15
10
5
0
34
Africa Developing countries
IPE (Female) Comparison
World
IO
Africa Developing countries World-
Contribution to Education ForAll
1980 0
199ory
EDUCATIONAL PROGRESS INDICATOR Monitoring the Education of Wmen and Girls
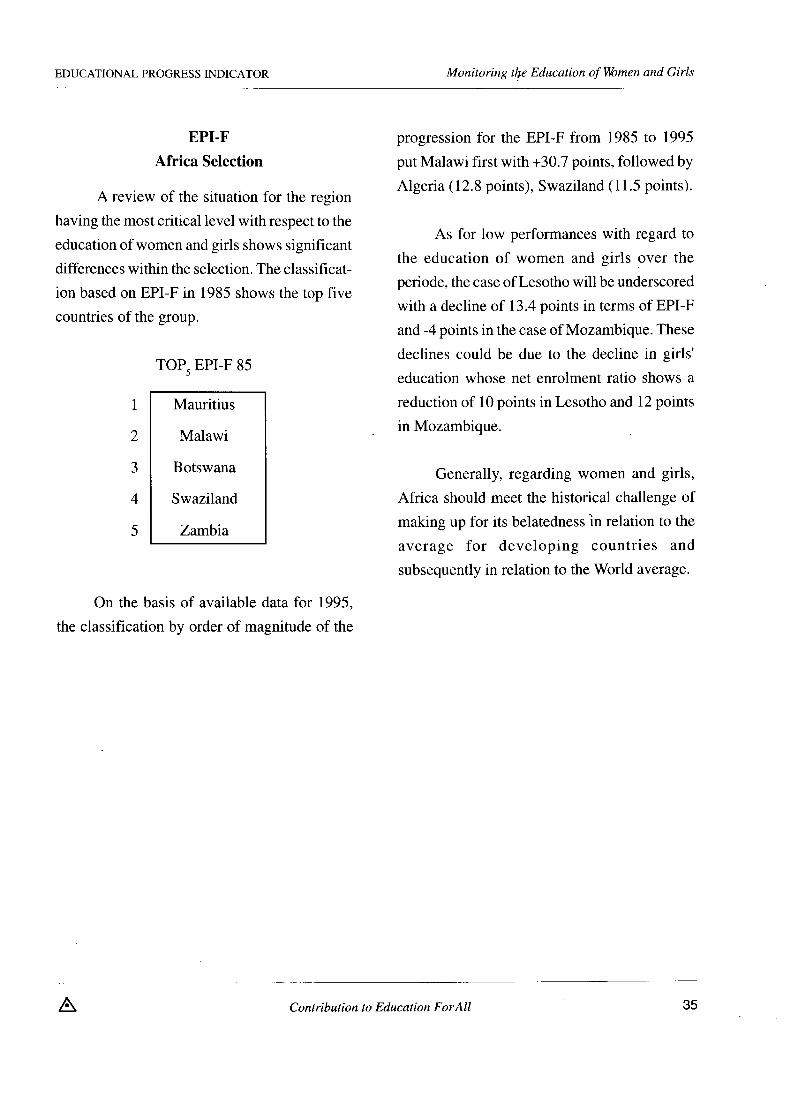
EPI-F Africa Selection
A review of the situation for the region having the most critical level with respect to the education of women and girls shows significant differences within the selection. The classificat- ion based on EPI-F in 1985 shows the top five countries of the group.
TOP, EPI-F 85
Mauritius
Malawi
Botswana
Swaziland
Zambia
On the basis of available data for 1995, the classification by order of magnitude of the
progression for the EPI-F from 1985 to 1995 put Malawi first with +30.7 points, followed by Algeria (12.8 points), Swaziland (11.5 points).
As for low performances with regard to the education of women and girls over the periode, the case of Lesotho will be underscored with a decline of 13.4 points in terms of EPI-F and -4 points in the case of Mozambique. These declines could be due to the decline in girls’ education whose net enrolment ratio shows a reduction of 10 points in Lesotho and 12 points in Mozambique.
Generally, regarding women and girls, Africa should meet the historical challenge of making up for its belatedness in relation to the average for developing countries and subsequently in relation to the World average.
Contribution to Education ForAll 35
EPI-F 1995 African Selection
COUNTRIES
Algeria
Benin
Botswana
Burkina Faso
Burundi
Lesotho
Malawi
Mali
Morroco
Mauritius
Mozambique
Tanzania
Senegal
Swaziland
Tunisia
Zambia
Xi
NER
91
43
99
24
48
71
100
19
62
96
35
48
48
96
95
75
Xi-25
loo-25 Si X
0.880
0.240
0.987
0
0.307
0.613
1.0
0
0.493
0.947
0.133
0.307
0.307
0.947
0.933
0.667
Yi
LIT
49.1
25.8
59.9
9.2
22.5
62.3
41.8
23.1
31
78.8
23.3
56.8
23.2
75.6
54.6
71.3
Yi-20 loo-20
Si Y
0.364
0.073
0.499
0
0.03 1
0.529
0.273
0.039
0.137
0.735
0.041
0.460
0.040
0.695
0.433
0.641
Zi
HAR
844
71
376
43
38
224
43
834
18
14
422
1024
Zi-40 EPI-F 10.000-40 CSim
Si Z 3
0.08 1 44.2%
0.003 10.5%
0.034 50.7%
0 0%
0 11.3%
0.018 38.7%
0 42.4%
0.080 23.7%
0 5.%
0 25.5%
0.038 56.0%
0.099 48.8%
EPI-F 1985
31.4%
5%
47.6%
0%
9.4%
52.1%
11.7%
0%
16.1%
57.2%
9.8%
6.4%
44.5%
40.0%
43.0%
A EPI-F 1985-1995
points
+ 12.8
+5.5
+3.1
0
+1.9
-13.4
+30.7
+7.6
-4.1
+11.5
+8.8
Source of basic data : World Education Report, 1998 UNESCO Human Development Report, 199 1 - 1998 UNDP Statistical Yearbook, 1991- 1997 UNESCO

EDUCATIONAL PROGRESS INDICATOR Prospects
VIII - Prospects
W ith the Educational Progress Indicator, new prospects emerge with regard to interna- tional, regional, subregional comparability and the national monitoring of educational progress. The indicator could be included in the compo- sition of indicators for development.
In the light of the varied levels of development, some countries among the industrialized countries could reach in the not too distant future (one to two decades), the 100% maximum level. On the other hand, many other countries will still require several decades to attain it.
Accordingly, throughout this historical period for which it is not possible to set a deadline, the EPI could play a non-negligible role in the overall and differential evaluation of the educational progress registered, based on gender or other criteria.
When the world reaches the 9th and 10th decile, that is with EPI from 90% to lOO%, a historic choice will emerge for changing the composition of the EPI. For example, two other indicators could be selected inplace of the first two basic indicators : first, the rate of functional literacy in computer techniques and new com- munication technologies. Indeed, the 3rd mil lenium will be marked by some considerable advances in the information revolution
combining communication and articificial in- telligence. The citizens of the globalizing world, who may not be trained to the new language and means of communication, work and leisure will be as handicapped as, if not more handicapped than the illiterates of today.
The second suggested indicator is the percentage of secondary school leaving certificate holders. After universal primary education, interest will now be more specifically focused on the efficiency of learning at the secondary education level. Among the various indicators available, the percentage of secondary school certificate holders would make it possi- ble to partly evaluate the performances registered at that level.
As for the third indicator, it would be the same as in the original version of the EPI : the number of students per 100.000 inhabitants. The new objective however, could be to attain the second decile (2/10) or any other standard approved by common consent.
In tackling the issue of prospects, the need to take into account the quality dimension deserves attention. Although at one same level of EPI there may be qualitative differences in the education system, generally, the improvement of quality is a pre-condition for attaining higher levels for the three basic indicators. Indeed, the quantitative leap will be
A Contribution to Education ForAll 37

EDUCATIONAL PROGRESS INDICATOR Prospects
achieved only if the school is attractive and ac- cessible and if the education offered is efficient and higher education motivating.
Ensuring that the populations believe in education means that education should be rele- vant, qualitative and useful for life.
Furthermore, the countries that have a high level of EPI have had to invest in quality including the improvement of the physical, environmental and psycho-pedagogic conditions
of learning. Finally, for each level of EPI attained, the
countries will ensure that there is increasing quality in the contents and processes of learning as well as in the continued assessment of the Education-Human Development relationship. The specific studies on quality will further strengthen the results obtained with the Educational Progress Indicator.
38 Contribution to Education ForAlE

EDUCATIONAL PROGRESS INDICATOR Conclusion
IX - Conclusion
As a synthetic tool, the Educational Progress Indicator is aimed at facilitating the analytical assessment and projection work of educational planners, managers and actors and also of policymakers. Indeed, it meets an expectation expressed long ago.
Thus, within the framework of progress monitoring in Education For All which goes beyond basic education for all, EPI according to various modes of use could be of great help since the needs are real.
Furthermore, a review of numerous retrospective studies based on the new indicator, provides clues for re-evaluating the progress made and hence, for undertaking a better justified, overall and differential assessment.
Comparability between the countries of one same subregion or region and at the inter- national level would be a source of emulation based on the constant improvement of perfor- mances in the field of education.
Finally, the Education Progress Indicator is a contribution to the advancement of education in the world, a contribution to the progress of Humanity in what it has and considers as sacred, namely the human being.
Contribution to Education ForAll 39

EDUCATIONAL PROGRESS INDICATOR References
REFERENCES
l World Education Report, 1998, UNESCO.
l Human Development Report, 199 I- 1998, UNDP.
l Final Report : Mid-decade meeting of the In- ternational Consultative Forum on Education For All, 16-19 june 1996, Amman Jordan.
l Unesco Statistical Yearbook, 199 1- 1997.
l Shaping the 21st Century : The Contribution of Development Co-operation, OECD, DAC, May 1996.
l Record of Joint OECD/United Nations : World Bank seminar on Indicators of Development Progress. OECD, Paris 20-21 May 1997.
l Gender-Sensitive Education Statistics and Indicators. A Practical Guide, UNESCO. Div. of Statistics, 1997.
l Background Papers. Human Development re- port, 1995, UNDP
l Desai, Meghnad J. (1991) ” Human Development : Concepts and Measurement “. European Economic Review. Vol35,350-357.
l Handbook on Monitoring Learning Achievement Towards Capacity Building Chinapah V. UNESCO-UNICEF, 1997.
l Trends and Projections of Enrolment by Level of Education by Age and by Sex, 1960-2025 (as Assessed in 1993). Division of Statistics, 1993, UNESCO.
l Indicators for Educational P1anning.A
Practical Guide. Sauvageot, C. IIPE, 1997.
l Compendium des statistiques relatives a l’anal- phabetisme, no 35, Ed. 1995, UNESCO.
l Social indicators :Problems of definition, UNESCO-PARIS (1974)., Fanchette S., Helling Z., Ivanovic B.
l Human resources and sustainable develop- ment social indicators, strategies for the 1990’s. A discussion note, UNESCO, 1989.
l Final Report International Congress on Plan- ning and Management of Educational Development. UNESCO, Mexico, 1990.
l Accelerated Educational Benefit. World Bank, 1990, Washington.
l The quality of Education and Economic Development. Heyneman &White ed., A world Bank Symposium, 1986.
l World Declaration on Education For All. WCEFA Jomtien 1990.
l Framework of Action for Meeting Basic Learning Needs. WCEFA, Jomtien 1990.
l The Sex and Age Distribution of the World Po- pulation. The 1996 Revision. United Nations. N.Y. 1997.
l Education for all : The Year 2000 Assessment Technical Guidelines. International Consultative Forum on Education for All. 1998
l World Science Report, 1998, UNESCO .
40 Contribution to Education ForAll A
\