Embed Size (px)
Citation preview

Educational and Operational Efficiency Study: Comparative Analysis of Academic Performance for the Clark County School District
CREDITS
American Institutes for Research
20 North Wacker Drive, Suite 1231 Chicago, IL 60606-2901 800-356-2735 312-288-7600 www.air.org
Gibson Consulting Group, Inc.
1221 South MOPAC Expressway, Suite 355 Austin, TX 78746 512-328-0884 www.gibsonconsult.com
Authors
American Institutes for Research Brenna O’Brien, Ph.D. Natalie Tucker Tara Zuber Contributors
American Institutes for Research Nancy Zajano, Ph.D. Trisha Hinojosa, Ph.D. Kelly Hallberg Special Thank You to the Administration of
Clark County School District Broward County Public Schools Houston Independent School District Miami-Dade County Public Schools Submitted to
Clark County School District 5100 West Sahara Ave. Las Vegas, NV 89146 Phone: 702-799-5000
Contents Executive Summary ........................................................................................................................................ i
Summary of Key Findings and Recommendations ................................................................................ i
Introduction .................................................................................................................................................. 1
Selection Process for the Comparative Analysis ................................................................................... 1
Student Performance Comparison ............................................................................................................... 3
Student Performance Trends ................................................................................................................ 4
Summary of Success Factors from Peer Districts ........................................................................................ 12
Areas of Focus ..................................................................................................................................... 12
Broward County Public Schools .......................................................................................................... 12
General Factors for Success ........................................................................................................... 13
Limited English Proficient Students ................................................................................................ 14
Prekindergarten Education ............................................................................................................ 16
Elementary Math and Reading ...................................................................................................... 17
High School .................................................................................................................................... 18
Houston Independent School District ................................................................................................. 21
General Factors for Success ........................................................................................................... 22
Limited English Proficient Students ................................................................................................ 22
Prekindergarten Education ............................................................................................................ 24
Elementary Math and Reading ...................................................................................................... 25
Middle School Math and Reading .................................................................................................. 26
High School .................................................................................................................................... 27
Miami-Dade County Public Schools .................................................................................................... 29
General Factors for Success ........................................................................................................... 29
Limited English Proficient Students ................................................................................................ 30
Prekindergarten Education ............................................................................................................ 32
Elementary Math and Reading ...................................................................................................... 33
High School .................................................................................................................................... 34
Appendix A: Comparative Analysis of Academic Performance Appendix…….………………………………………..A-1

i Executive Summary Clark County School District (CCSD) requested a comparison of its student academic performance with that of similar districts, and to find out what these districts are doing to promote student success. This comparative analysis was focused on exploring what the peer districts believe are the contributing factors to their most successful programs.
After a systematic selection process, the three peer districts used for this analysis were Broward County Public Schools (Florida), Houston Independent School District (Texas), and Miami-Dade County Public Schools (Florida). The program areas highlighted in the report were selected because these districts appear to be succeeding in areas where CCSD is seeking improvement.
A complete description of the selection process, student performance comparisons, and detailed results from interviews conducted with peer districts are included in this report. A summary of main findings and recommendations is presented below.
Summary of Key Findings and Recommendations
Clear themes emerged from the comparative analysis of CCSD results and those of peer districts related to areas in which academic performance in CCSD is need of substantive improvement. Examination of data from peer districts with similar demographic characteristics but higher student academic performance led the research team to make the following recommendations to CCSD for their future efforts:
1. Curriculum consistency and alignment. A common success factor of the peer districts was the consistency and alignment across its schools in curriculum and programs offered. As stated by one interviewee: “We were spending millions and getting very inconsistent results…It is a fiduciary responsibility [to select a program] and go with it—implement it with fidelity, and give it three to five years to evaluate it over time.” Even in the districts that were more decentralized, it was their structure of networks and consistent communication that helped to keep schools and teachers moving in the same direction.
2. Focused professional development and support. Considered critical to their districts’ improved performance, high quality professional development is offered through ongoing sessions, coaching, support from experts, and resources provided in-person and on-line. Professional development is focused on specific programs and student populations, including limited English proficient (LEP) students. Recommendations are made to better align and streamline professional development offerings in CCSD to serve the needs of teachers and students more efficiently and effectively.
ii
3. Use of data. In peer districts, assessments are used to identify students in need of support and monitor their progress as well as to determine the most appropriate instruction and interventions. Data are made available to teachers and administrators through generated reports and web portals, and the results of these assessments are regularly discussed. CCSD is already moving in this direction with the development of an academic data dashboard that should help facilitate the types of analysis already taking place in the peer districts.
4. Limited English proficient (LEP) students. Additional attention to the needs of the LEP student population is necessary, especially to factors that peer districts report have contributed to their success:
Intense professional development: In the peer districts, teachers who instruct LEP students receive extensive professional development, both internal to the district and through state certification/endorsement specifically related to this student population (required by law in Florida).
Consistent curriculum and oversight of implementation: Peer districts ensure that schools have a consistent curriculum and supplemental materials available to all LEP students. Monitoring also takes place to ensure that these programs are implemented as planned and are moving these students towards English fluency.
Students in grades kindergarten through two: Data analysis revealed that these students are the least likely of all grade levels to be fluent in English within CCSD. The proportion of children in grades K–2 who are fluent in English is much smaller in CCSD than in the peer districts, who cite their intensive intervention programs for young LEP students as a factor in their overall success.
5. Preschool education. Grade 3 students in peer districts perform much better during their first statewide assessments of reading and math than those in CCSD. One potential focus of future efforts could be on preschool education. In contrast to the 9 percent of CCSD students enrolled in preschool, peer districts enroll from 27 to 68 percent. Given the research on the success of quality preschool in preventing later learning difficulties,1 CCSD should consider investing in this area, especially given that many of its youngest students are non-English or limited English speakers.
1 See for example: Schweinhart, L. J., Montie, J., Xiang, Z., Barnett, W. S., Belfield, C. R., & Nores, M. (2005). Lifetime effects: The HighScope Perry Preschool study through age 40. (Monographs of the HighScope Educational Research Foundation, 14). Ypsilanti, MI: HighScope Press. b) Reynolds, A. J., Temple, J. A., Ou S. R., Arteaga, I. A., White, B. A. B. (2011). School-based early childhood education and age-28 well-being: Effects by timing, dosage, and subgroups. Science. Published online June 9, 2011. doi: 10.1126/science.1203618
iii
6. Successful high school completion and college/career readiness. A consistent theme in the peer districts is the effort to engage students early on in their high school education. By focusing on Grade 9 students, dropout rates are lower and students are better prepared for college and careers. As one interviewee stated, “If we lose them in the ninth grade, we lose [them] in graduation.” Peer districts have a variety of student engagement, mentoring, and credit recovery programs that begin with identifying at-risk students using an early warning system. CCSD would benefit by adopting some of these practices:
Ninth grade monitoring: Given that there is no Nevada state assessment for Grade 9 students (unlike in Florida and Texas), CCSD could consider analyzing interim assessment and Criterion Referenced Test (CRT) data from Grade 8 students as one step toward an early warning system. In addition, monitoring the proportion of Grade 9 students who move on to Grade 10 could provide another measure of student engagement in high school.
Positive alternative environments: In all of the peer districts, staff emphasized the importance of addressing students’ needs through choices and a variety of settings. Whether it was through online learning, small learning communities, or specialized magnet school options, providing alternative settings can help motivate students who might otherwise dropout from the traditional high school setting. With the addition of support from mentors and community members, more students can reach graduation in these alternative settings if they are seen as positive environments instead of as a punishment.
1 Introduction As part of the Educational and Operational Efficiency Assessment, Clark County School District (CCSD) requested a comparison of its student academic performance with that of similar districts. This comparative analysis was guided by two primary questions:
1. How does CCSD student performance compare with that of its peer districts?
2. What do the peer districts believe are the contributing factors to their higher performance in certain areas, and how could CCSD benefit from this body of knowledge?
This report briefly describes the selection process for choosing three districts of scale and complexity similar to CCSD. It then compares the available student performance data and summarizes findings from peer district staff interviews regarding the factors contributing to their success.
Selection Process for the Comparative Analysis
A multi-stage approach was used to select the districts similar to CCSD in demographic composition but different on academic performance. For a description of the full selection process, see Appendix A.
Demographic Selection
The demographic variables used for selection included district locale and size, percentage of students with free or reduced-price lunch (FRPL) eligibility, percentage of limited English proficient (LEP) students, and percentage of students receiving special education services (SPED). Teacher-pupil ratio, percentage of Title I schools, and total per-pupil revenue and expenditure also were examined. The demographic and financial data for CCSD and the three selected districts are presented in Table 1.
Student Achievement Selection
In addition to looking at the demographic composition of comparison districts, the team also examined academic performance. The goal was to select districts that were similarly composed and had similar spending, but had higher student achievement in certain areas than CCSD. The data used for this purpose came from information available in the federal Common Core of Data and on district or state websites, and included the following:
District adequate yearly progress (AYP) status Percentage of students in a district at or above proficiency levels established by each state in
reading and mathematics, as measured by state assessments Graduation and dropout rates Percentage of students taking the PSAT, SAT, ACT, and AP exams, and their performance

2
Table 1. District Demographic and Financial Information For Comparison Districts (2009–10)
District Information Clark County
School District Broward County Houston ISD
Miami-Dade County
State Nevada Florida Texas Florida
Locale type Suburb, Large Suburb, Large City, Large Suburb, Large
Number of schools 370 325 309 546
Number of students 307,059 256,137 202,773 345,804
Percent FRPL eligible students 43.8% 52.8% 59.3% 68.0%
Percent LEP students 16.8% 9.5% 28.5% 17.2%
Percent SPED students 10.5% 12.3% 8.1% 11.0%
Teacher-to-pupil ratio 19.95 16.92 16.9 15.98
Percent Title I schools 53.5% 61.2% 88.0% 67.2%
Total per-pupil revenue (2008–09) $11,859 $11,569 $9,867 $13,282
Total per-pupil expenditure (2008–09) $6,877 $7,838 $7,485 $8,826
Source: U.S. Department of Education, National Center for Education Statistics, Common Core of Data (CCD)
Findings led the research team to select three comparison districts. Broward County Public Schools (BCPS) was chosen primarily because it had the highest graduation rate and lowest dropout rate of the comparison districts. Houston Independent School District (HISD) had the best performance for students in elementary grades in the areas of both reading and mathematics. Although Palm Beach County Public Schools was originally selected as the third district, CCSD district leadership instead chose Miami-Dade County Public Schools (M-DCPS) in order to have one comparison district of larger size than CCSD.

3 Student Performance Comparison To report how CCSD student performance compares with that of its peer districts, the most recently available data were compiled for BCPS, HISD, and M-DCPS from the Common Core of Data and district or state websites (See Table 2). When data were unavailable from these sources, the peer districts were asked to share any additional information that might help this project.
Table 2. District Performance Information for Comparison Districts (2009–10)
Student Performance Indicator Clark County
School District Broward County Houston ISD
Miami-Dade County
District AYP status Met2 Not met Not met Not met
% proficient, all grades, reading 66.2% 63% 84% 59%
% proficient, all grades, math 63.5% 72% 81% 66%
% proficient, Grade 3, reading 59.8% 72% 89% 68%
% proficient, Grade 3, math 65.3% 80% 83% 78%
% proficient, Grade 4, reading 64.1% 72% 81% 70%
% proficient, Grade 4, math 65.6% 76% 87% 72%
% proficient, Grade 5, reading 52.3% 70% 89% 66%
% proficient, Grade 5, math 65.6% 68% 92% 60%
% proficient, Grade 6, reading 62.7% 69% 81% 62%
% proficient, Grade 6, math 61.1% 64% 79% 53%
% proficient, Grade 7, reading 72.9% 68% 82% 64%
% proficient, Grade 7, math 63.7% 65% 78% 59%
% proficient, Grade 8, reading 64.9% 60% 91% 51%
% proficient, Grade 8, math 55.4% 72% 83% 63%
% proficient, Grade 9, reading — 48% 88% 42%
% proficient, Grade 9, math — 72% 64% 63%
% proficient, Grade 10, reading 77.6% 39% 87% (ELA) 37%
% proficient, Grade 10, math 49.6% 73% 68% 73%
% proficient, Grade 11, reading 93.5% — 90% (ELA) —% proficient, Grade 11, math 70.6% — 87% —NAEP score, Grade 4, reading a 211 (NV) — 211 221 NAEP score, Grade 4, math a 235 (NV) — 236 236 NAEP score, Grade 8, reading a 254 (NV) — 252 261 NAEP score, Grade 8, math a 274 (NV) — 277 273
2 For the 2009–10 school year CCSD made AYP, but for the 2010–11 school year the district failed to make AYP and has been designated as a “watch” district.
4
Student Performance Indicator Clark County
School District Broward County Houston ISD
Miami-Dade County
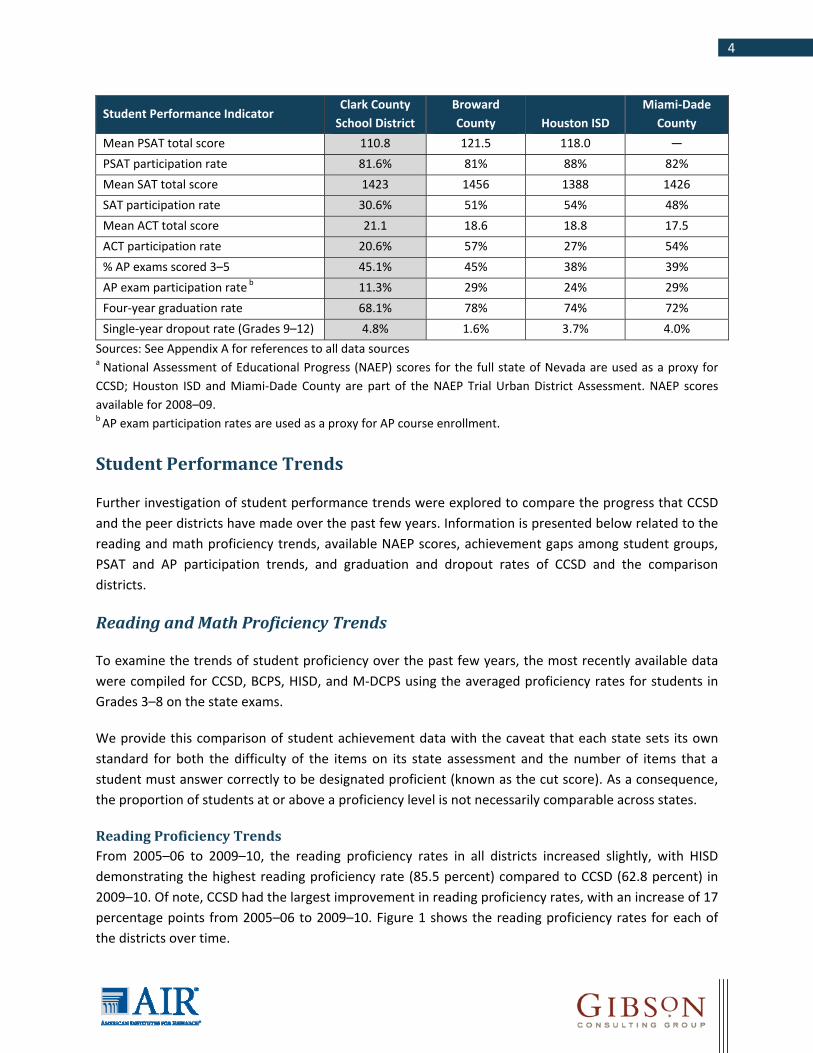
Mean PSAT total score 110.8 121.5 118.0 — PSAT participation rate 81.6% 81% 88% 82% Mean SAT total score 1423 1456 1388 1426 SAT participation rate 30.6% 51% 54% 48% Mean ACT total score 21.1 18.6 18.8 17.5 ACT participation rate 20.6% 57% 27% 54% % AP exams scored 3–5 45.1% 45% 38% 39% AP exam participation rate b 11.3% 29% 24% 29% Four-year graduation rate 68.1% 78% 74% 72% Single-year dropout rate (Grades 9–12) 4.8% 1.6% 3.7% 4.0%
Sources: See Appendix A for references to all data sources a National Assessment of Educational Progress (NAEP) scores for the full state of Nevada are used as a proxy for CCSD; Houston ISD and Miami-Dade County are part of the NAEP Trial Urban District Assessment. NAEP scores available for 2008–09. b AP exam participation rates are used as a proxy for AP course enrollment.
Student Performance Trends
Further investigation of student performance trends were explored to compare the progress that CCSD and the peer districts have made over the past few years. Information is presented below related to the reading and math proficiency trends, available NAEP scores, achievement gaps among student groups, PSAT and AP participation trends, and graduation and dropout rates of CCSD and the comparison districts.
Reading and Math Proficiency Trends
To examine the trends of student proficiency over the past few years, the most recently available data were compiled for CCSD, BCPS, HISD, and M-DCPS using the averaged proficiency rates for students in Grades 3–8 on the state exams.
We provide this comparison of student achievement data with the caveat that each state sets its own standard for both the difficulty of the items on its state assessment and the number of items that a student must answer correctly to be designated proficient (known as the cut score). As a consequence, the proportion of students at or above a proficiency level is not necessarily comparable across states.
Reading Proficiency Trends From 2005–06 to 2009–10, the reading proficiency rates in all districts increased slightly, with HISD demonstrating the highest reading proficiency rate (85.5 percent) compared to CCSD (62.8 percent) in 2009–10. Of note, CCSD had the largest improvement in reading proficiency rates, with an increase of 17 percentage points from 2005–06 to 2009–10. Figure 1 shows the reading proficiency rates for each of the districts over time.

5
Figure 1. Reading Proficiency Rates for Comparison Districts Over Time (Grades 3–8)
Sources: See Appendix A for references to all data sources
Math Proficiency Trends For the math proficiency rates, there was a more noticeable upward trend for all districts, with HISD again demonstrating the highest math proficiency rate (83.7 percent) compared to CCSD (62.8 percent) in 2009–10. From 2005–06 to 2009–10, the CCSD math proficiency rates increased approximately 13 percentage points. Figure 2 shows the math proficiency rates for each of the districts over time.
Figure 2. Math Proficiency Rates for Comparison Districts Over Time (Grades 3–8)
Sources: See Appendix A for references to all data sources
NAEP Score Trends The most comparable results of student performance come from the National Assessment of Educational Progress (NAEP), which periodically tests a national sample of students. According to a
0%
10%
20%
30%
40%
50%
60%
70%
80%
90%
100%
2005-06 2006-07 2007-08 2008-09 2009-10
HISD
BCPS
M-DCPS
CCSD
0%
10%
20%
30%
40%
50%
60%
70%
80%
90%
100%
2005-06 2006-07 2007-08 2008-09 2009-10
HISD
BCPS
M-DCPS
CCSD
6
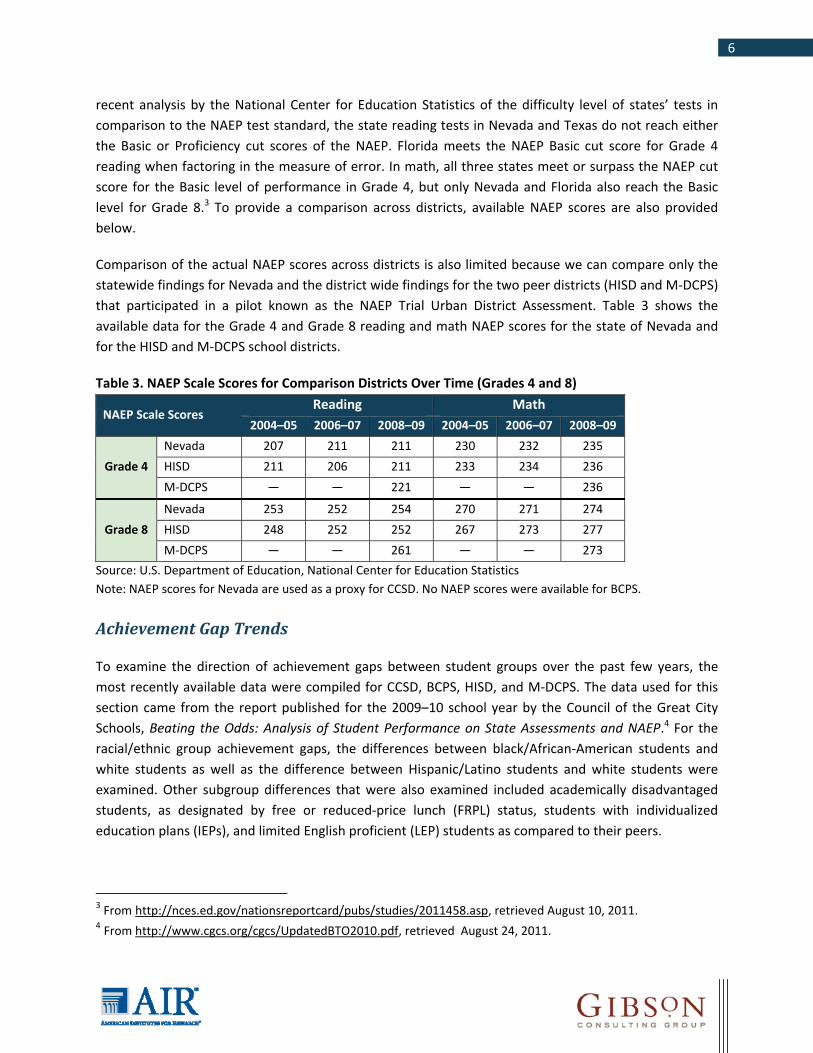
recent analysis by the National Center for Education Statistics of the difficulty level of states’ tests in comparison to the NAEP test standard, the state reading tests in Nevada and Texas do not reach either the Basic or Proficiency cut scores of the NAEP. Florida meets the NAEP Basic cut score for Grade 4 reading when factoring in the measure of error. In math, all three states meet or surpass the NAEP cut score for the Basic level of performance in Grade 4, but only Nevada and Florida also reach the Basic level for Grade 8.3 To provide a comparison across districts, available NAEP scores are also provided below.
Comparison of the actual NAEP scores across districts is also limited because we can compare only the statewide findings for Nevada and the district wide findings for the two peer districts (HISD and M-DCPS) that participated in a pilot known as the NAEP Trial Urban District Assessment. Table 3 shows the available data for the Grade 4 and Grade 8 reading and math NAEP scores for the state of Nevada and for the HISD and M-DCPS school districts.
Table 3. NAEP Scale Scores for Comparison Districts Over Time (Grades 4 and 8)
NAEP Scale Scores Reading Math
2004–05 2006–07 2008–09 2004–05 2006–07 2008–09
Grade 4 Nevada 207 211 211 230 232 235 HISD 211 206 211 233 234 236 M-DCPS — — 221 — — 236
Grade 8 Nevada 253 252 254 270 271 274 HISD 248 252 252 267 273 277 M-DCPS — — 261 — — 273
Source: U.S. Department of Education, National Center for Education Statistics Note: NAEP scores for Nevada are used as a proxy for CCSD. No NAEP scores were available for BCPS.
Achievement Gap Trends
To examine the direction of achievement gaps between student groups over the past few years, the most recently available data were compiled for CCSD, BCPS, HISD, and M-DCPS. The data used for this section came from the report published for the 2009–10 school year by the Council of the Great City Schools, Beating the Odds: Analysis of Student Performance on State Assessments and NAEP.4 For the racial/ethnic group achievement gaps, the differences between black/African-American students and white students as well as the difference between Hispanic/Latino students and white students were examined. Other subgroup differences that were also examined included academically disadvantaged students, as designated by free or reduced-price lunch (FRPL) status, students with individualized education plans (IEPs), and limited English proficient (LEP) students as compared to their peers.
3 From http://nces.ed.gov/nationsreportcard/pubs/studies/2011458.asp, retrieved August 10, 2011. 4 From http://www.cgcs.org/cgcs/UpdatedBTO2010.pdf, retrieved August 24, 2011.

7
Race/Ethnicity Achievement Gaps When comparing the black/African American-white gap in CCSD to other districts for the 2009–10 school year, CCSD is most similar to BCPS with a difference of 26.5 percentage points for both districts, and has a slightly smaller gap than M-DCPS (28.5 percentage points). Of all the peer districts, HISD had the lowest black/African American-white gap with a difference of 14.8 percent between these two groups. The Hispanic/Latino-white gap was more notable in CCSD when compared to other districts, with an achievement gap of 20.8 percentage points. This achievement gap was much smaller in the three peer districts between these two groups, with M-DCPS having the smallest gap at only 7.5 percentage points.
Figure 3. Achievement Gaps for Students in Comparison Districts, By Race/Ethnicity (2009–10)
Source: Beating the Odds: Analysis of Student Performance on State Assessments and NAEP. Note: Achievement gaps calculated based on the average of data available for Grade 4 and Grade 8 on reading and mathematics state assessments. Looking at changes over time, the black/African American-white gap does not appear to be closing in CCSD in math, and may have widened slightly in reading in recent years. For M-DCPS, this gap has narrowed by a few percentage points, and in BCPS this gap has decreased slightly, except for in Grade 4 math where it has actually increased slightly. Of note, in HISD the achievement gap between black/African American students and white students has consistently narrowed over the past four years.
For the Hispanic/Latino-white gap, the difference between these two groups appears to have narrowed in CCSD over the years in both reading and math. For the peer districts, the gap between Hispanic/Latino and white students has also been narrowing in BCPS, HISD, and M-DCPS. Of note, HISD and M-DCPS have shown the best progress in reducing this gap compared to the other districts.
0%
10%
20%
30%
40%
50%
60%
70%
80%
90%
100%
Black/African American-White Gap
Hispanic/Latino-White Gap
CCSD
BCPS
HISD
M-DCPS

8
Subgroup Achievement Gaps (FRPL, IEP, and LEP) The achievement gaps between several subgroups were also explored to determine how CCSD compared to the peer districts in the 2009-10 school year. 5 The gap between FRPL and non-FRPL students in CCSD was 21.8 percentage points, similar to BCPS and M-DCPS (23.0 and 20.8 percentage points, respectively). HISD had the lowest achievement gap with a 12.8 percentage point difference between FRPL and non-FRPL students. For students with IEPs, CCSD had the largest gap between these students and students without IEPs (42.2 percentage points). The other districts had gaps more similar to each other, ranging from 28.0 percentage points for HISD, to 33.8 percentage points for M-DCPS. When LEP students were compared to white students within CCSD, the achievement gap was 45.0 percentage points. This was again the largest observed gap when compared to the other peer districts. HISD had the lowest observed LEP-Not LEP gap, with a 19.0 percentage point difference.
Figure 4. Achievement Gaps for Students in Comparison Districts, by FRPL, IEP, and LEP (2009–10)
Source: Beating the Odds: Analysis of Student Performance on State Assessments and NAEP. Notes: Achievement gaps calculated based on the average of data available for Grade 4 and Grade 8 on reading and mathematics state assessments.
In CCSD, the gap between FRPL and not FRPL students appears to have slightly narrowed over the years in both reading and math. There has also been a slight decrease in this gap in HISD. In the other districts, this gap has fluctuated over the years, but has mostly remained consistent in M-DCPS and BCPS.
The achievement gap between students with IEPs and students without IEPs has increased over the years in CCSD for both reading and math. Overall, the gaps for students with IEPs have narrowed slightly in BCPS and M-DCPS. The IEP-No IEP gap in HISD has fluctuated over the years, and has increased slightly in recent years.
5 For the LEP-Not LEP gap comparison, state averages used for non-LEP student populations. For HISD, state averages also used for the student populations that were not FRPL and did not have IEPs. For CCSD, LEP students were compared against the white students within the district.
0%
10%
20%
30%
40%
50%
60%
70%
80%
90%
100%
FRPL-Not FRPL Gap IEP-No IEP Gap LEP-Not LEP Gap
CCSD
BCPS
HISD
M-DCPS

9
In CCSD, the gap between LEP and non-LEP students became much larger in 2009–10 in both reading and math, after the definition of LEP was revised. In HISD and M-DCPS, the LEP-Not LEP gap has fluctuated over the years but appears to have decreased recently. The difference between LEP and non-LEP students has increased in BCPS over the years, with the largest gap seen in grade 4 math.
PSAT and AP Participation Trends
To examine the trends of high school student participation in college preparation exams and courses over the past few years, the most recently available data were compiled for CCSD, BCPS, M-DCPS, and HISD. This trend analysis focused on the participation of students in the Preliminary Scholastic Aptitude Test (PSAT), specifically Grade 10 students, as well as high school student participation in advanced placement (AP) exams.
PSAT Participation Trends In terms of student involvement in college preparation exams, the available trend data focused on the participation rates of Grade 10 students in the PSAT from the 2005-06 through the 2009-10 school years (Figure 5).
Since 2005–06, the PSAT participation rate has tended to remain fairly consistent until 2009–10, where all districts showed a slight increase with HISD demonstrating the highest participation rate (87.8 percent) compared to CCSD (81.6 percent). Of note, CCSD had the most noticeable improvement in PSAT participation from the year before, with an increase of 12 percentage points from 2008–09.
Figure 5. Percentage of PSAT Exam Takers Over Time (Grade 10)
Sources: See Appendix A for references to all data sources
50%
55%
60%
65%
70%
75%
80%
85%
90%
95%
100%
2005-06 2006-07 2007-08 2008-09 2009-10
HISD
BCPS
M-DCPS
CCSD

10
AP Participation Trends The proportion of students in Grades 10–12 who took AP exams and the percentage of those students who scored a 3, 4, or 5 on those exams were also examined across districts over time (Figure 6). Looking at AP exam participation rates served as a proxy for student participation in AP courses in high school.
Since 2005–06, the percentage of students in Grades 10–12 who took at least one AP exam has slowly increased, with BCPS (29.4 percent) and M-DCPS (28.8 percent) having the highest participation rate compared to CCSD (11.3 percent) in 2009–10. Of those students who took an AP exam, the percentage who scored a 3, 4, or 5 has slowly decreased as more students participated in AP testing. As the pool of test takers increases to accommodate a broader range of students, the percentage who are able to score at the higher level decreases. BCPS has maintained the best percentage of students who scored a 3–5 (45.2 percent) while also increasing the number of AP test takers over time. Although CCSD has an almost equivalent percentage of students who scored a 3–5 (45.1 percent), this is based on a much smaller pool of test takers.
Figure 6. Percentage of AP Exam Takers and AP Exams Scored 3–5 Over Time (Grades 10–12)
Sources: See Appendix A for references to all data sources
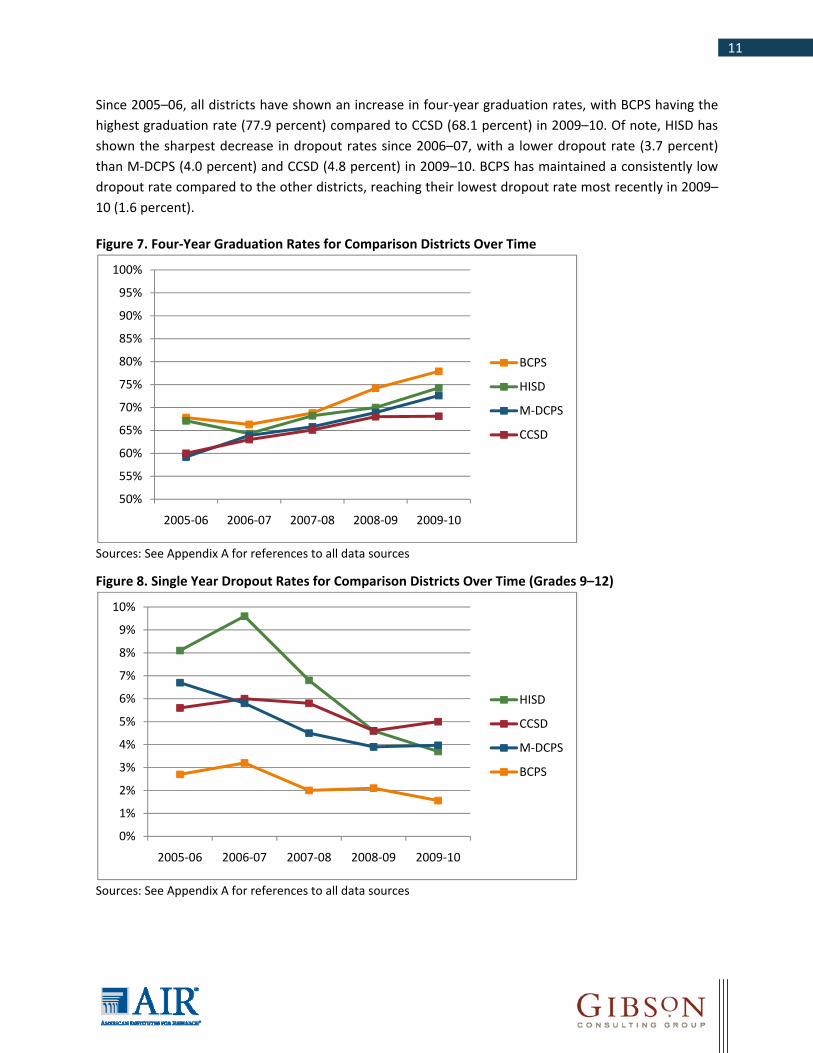
Graduation and Dropout Trends
To examine the trends of high school graduation and dropout rates over the past few years, the most recently available data were compiled for CCSD, BCPS, HISD, and M-DCPS. Figure 7 shows the four-year graduation rates for each of the districts for the 2005-06 through 2009-10 school years, and Figure 8 shows the single year dropout rates for students in Grades 9–12 for the same time period.
0%
10%
20%
30%
40%
50%
60%
70%
80%
90%
100%
2005-06 2006-07 2007-08 2008-09 2009-10
% AP Exams 3-5
BCPS
CCSD
M-DCPS
HISD
% AP Exam Takers
BCPS
CCSD
M-DCPS
HISD
11
Since 2005–06, all districts have shown an increase in four-year graduation rates, with BCPS having the highest graduation rate (77.9 percent) compared to CCSD (68.1 percent) in 2009–10. Of note, HISD has shown the sharpest decrease in dropout rates since 2006–07, with a lower dropout rate (3.7 percent) than M-DCPS (4.0 percent) and CCSD (4.8 percent) in 2009–10. BCPS has maintained a consistently low dropout rate compared to the other districts, reaching their lowest dropout rate most recently in 2009–10 (1.6 percent).
Figure 7. Four-Year Graduation Rates for Comparison Districts Over Time
Sources: See Appendix A for references to all data sources
Figure 8. Single Year Dropout Rates for Comparison Districts Over Time (Grades 9–12)
Sources: See Appendix A for references to all data sources
50%
55%
60%
65%
70%
75%
80%
85%
90%
95%
100%
2005-06 2006-07 2007-08 2008-09 2009-10
BCPS
HISD
M-DCPS
CCSD
0%
1%
2%
3%
4%
5%
6%
7%
8%
9%
10%
2005-06 2006-07 2007-08 2008-09 2009-10
HISD
CCSD
M-DCPS
BCPS

12 Summary of Success Factors from Peer Districts To find out what the peer districts believe are the contributing factors to their most successful programs, the team contacted district leadership at Broward County, Houston ISD, and Miami-Dade County to identify available staff members for phone interviews. A total of 19 staff members across the three districts were interviewed for this report during July and August 2011. The highlighted program areas were selected because these districts appear to be succeeding in areas where CCSD is struggling.
Areas of Focus
CCSD leadership identified the area of LEP students as a concern, so each of the comparison districts was asked about the programs it offers for this population of students. Based on earlier interviews with CCSD staff, the research team learned that CCSD had no district-funded preschool programs. Given that the peer districts had higher Grade 3 proficiency rates, each of the districts was asked about the preschool and other early childhood programs offered that they felt successfully prepared students to be “school ready.” (Because no standardized data were available for students in Grades K–2, the Grade 3 proficiency rates in reading and math served as a proxy for the success of early childhood programs in the peer districts.) In addition to questions related to LEP and preschool programs, district staff were asked what overall factors had contributed to their recent successes.
In Broward County, the interviews focused on elementary math and reading proficiency because their students rated consistently higher than CCSD’s students in these subjects up to Grade 6. Interviews also focused on high school programs because Broward County had the highest graduation rate and lowest dropout rate of the comparison districts. Based on state assessment data, Houston ISD had the highest overall grade-level proficiency rates of the peer districts, so interviews focused on its reading and math programs used at both the elementary and middle school levels. There have also been some recent successes in reducing the dropout rates and increasing graduation rates in Houston ISD, so some of its current high school programs also are highlighted. Miami-Dade County has recently implemented innovative district programs to increase student proficiency and reduce dropout rates, therefore interview questions focused on the elementary reading and math programs as well as high school initiatives. Summaries for the three districts are presented below.
Broward County Public Schools
According to the district website, BCPS is the sixth largest district in the United States and serves a diverse mix of almost 257,000 students, representing 173 countries and 53 languages at its 298 schools. Located in Southern Florida surrounding the Fort Lauderdale metro area, BCPS covers approximately 400 square miles. The district employs nearly 16,000 instructional staff members, 1,662 of whom are National Board Certified Teachers, making the district the second in the nation and first in the state for

13
the number of these highly regarded teachers. The district is currently led by Interim Superintendent Donnie Carter, who has worked with BCPS in one capacity or another since 2001.6
General Factors for Success
Across the eight interviews conducted for BCPS, key personnel repeatedly mentioned the following four qualities that they believed have been major contributors to their district’s success.
Consistency. BCPS is an aligned district in which teachers and students receive the same educational materials and hear a unified message. One interview respondent noted that for a district its size, consistency was critical for BCPS students and teachers. Another respondent added that the district’s cohesive nature helps mitigate the negative effects of teacher and student transience among schools. Consistency in BCPS is maintained through online Web portals, curricular alignment, and three area offices, each of which is led by its own superintendent.
District organization. According to interview respondents, relying on the area offices is a key factor to ensuring that the district runs smoothly. The three area offices are geographically organized: north, south, and central. Each area has its own superintendent, three or four area directors responsible for a different school zone, and support staff (e.g., exceptional student education coordinator, technology specialist, etc.). The area offices are essential to providing oversight and support to the schools and serving as a point of contact for students and parents.
Professional development. BCPS offers regular, continuous professional development and training to teachers during the school year, as well as during the summer. The type of trainings offered are specific to different program areas and may take place at the school, a district training center, or online. One interview respondent said that leaving quality professional development out of the discussion would mean leaving out “a critical component for success.” According to BCPS staff, excellent professional development produced excellent teachers, and this was cited as an important factor in the high teacher quality found in the district.
Data collection and usage. Each school in BCPS collects academic and behavioral data on all of its students. Using these data, the district research department generates regular reports for the district and schools. The research department also conducts in-depth analysis by identifying national research that is relevant to the district and then trying to replicate it in BCPS schools. Resources cited as support for different programs include the What Works Clearinghouse, the Florida Center for Reading Research, and the Consortium on Chicago School Research.
6 From http://www.browardschools.com, retrieved July 25, 2011.
14
Limited English Proficient Students
According to interview respondents, BCPS has seen increases in LEP student proficiency rates on standardized tests over the past three or four years. The areas of greatest increase have been in writing and mathematics. One respondent stated that more than half of the district’s LEP students are on track to reach proficiency targets in math this year. Given that the LEP student population continues to grow in CCSD, BCPS district staff were asked to provide details about the programs they offer for these students that have led to this success in recent years.
Schools in BCPS utilize an inclusion or shelter model for LEP students. Supplemental materials, such as content dictionaries, are provided to LEP students in addition to the regular district curriculum. Some classes also may include a teacher assistant to provide bilingual support. Recent student arrivals at the middle and high school levels attend a course titled “Developmental Language Arts,” which is designed to aid language acquisition. In interviews, district staff identified two key factors in the success of their LEP programs:
Targeted teacher training. The district identifies all teachers who will work with LEP students, including which teachers will work with each fluency level. These teachers receive professional development on research-supported practices and strategies, based on the needs of the various populations. The schools that have not met AYP for the LEP subgroup receive visits from a teacher team assigned to their area office. These teams provide oversight and additional training and support.
Data-driven student placement. The schools analyze district-provided data and ensure that the academic levels of LEP students are identified and that the students are placed in the type of classroom (shelter or inclusion) with the interventions and supplemental materials best suited to their needs.
The research team examined the rates of English proficiency of the LEP student populations in BCPS and CCSD, as determined by the language assessments used in both the districts. BCPS uses data from the Comprehensive English Language Learning Assessment (CELLA) to measure the progress of its LEP students. 7 The CELLA has three tests—Listening/Speaking, Reading, and Writing—to measure an LEP student’s fluency level with the English language. The following four levels on the CELLA indicate the English proficiency attainment of LEP students:
Beginning language proficiency Low intermediate language proficiency High intermediate language proficiency Proficient language proficiency
7 Detailed information about the CELLA test can be found at the Florida Department of Education website, http://www.fldoe.org/aala/cella.asp, retrieved July 25, 2011.

15
CCSD uses the Language Assessment Survey (LAS Links) and the English Language Proficiency Assessment (ELPA) to determine the English fluency of its LEP students. Both of these assessments use a five-point scale, but the levels of English proficiency attainment are different, as shown below:
LAS Links 1 - Beginning 2 - Early Intermediate 3 - Intermediate 4 - Proficient 5 - Above Proficient
ELPA 1 - Entry 2 - Emerging 3 - Intermediate 4 - Advanced Intermediate 5 - Proficient
From the results of one or both of these assessments, CCSD assigns LEP students different English proficiency status (EPS) codes as follows:
Non-English speaker Limited English speaker Fluent English speaker on monitor status
Students who maintain a fluent English speaker level may eventually exit LEP services, based on CCSD exit criteria. Because LEP students in CCSD had an ELPA score, or a LAS Links score, or both in the data set provided to the research team, the overall EPS codes were used for this comparative analysis.
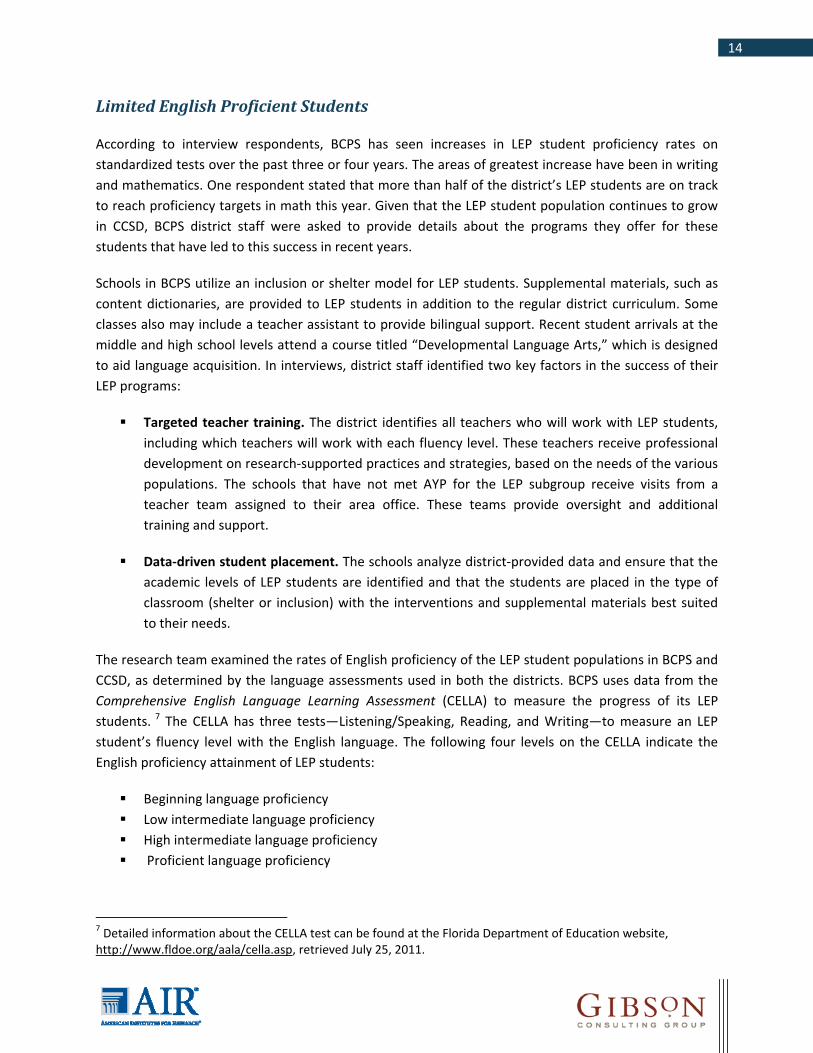
Figure 9 displays the percentages of LEP students who attained the level of fluent English speaker on monitor status in CCSD and the percentages of LEP students in BCPS who reached the proficient language proficiency level on at least one of the CELLA tests. Students who attained a fluent English level and have exited LEP services are not included in these results for either district. The results are reported in grade bands below (i.e., K–2, 3–5, 6–8, and 9–12).
In 2010–11, CCSD has notably lower levels of proficient/fluent LEP students still receiving services when compared with BCPS. This difference is most noticeable at the K–2 grade band where almost all of the Grade K–2 LEP students in CCSD are considered non-English speakers or limited English speakers.
16
Figure 9. Percentage of LEP students Considered English Proficient in CCSD and BCPS (2010–11)
Sources: LEP English proficiency results based on data provided by districts for 2010–11
Prekindergarten Education
According to interview respondents, approximately 27 percent of kindergarten students attend a preschool program in BCPS, compared with approximately 9 percent of kindergarten students in CCSD. Based on available state proficiency data on Grade 3 students, it was observed that BCPS students in early elementary outperformed CCSD students in both reading and math. To provide insight into which early education programs helped prepare students for success, district staff at BCPS were asked to describe the preschool options that are available to their students.
BCPS currently has five programs to help prepare students for entering kindergarten: Head Start, Early Head Start, Early Reading First, Florida First Start, and the statewide Voluntary Pre-Kindergarten (VPK). Each of these preschool programs has its own target population (e.g., students from economically disadvantaged families) and programming. The district operates 16 VPK sites in the school year and five during the summer. Other organizations and sites who meet standards also may offer VPK. The following program components were identified as important to prekindergarten education in BCPS:
Professional support and training. Each preschool classroom is assigned early childhood specialists such as social workers or district staff. The Head Start and Reading First programs also provide mentors. Teachers maintain “constant communication” with the specialists and also have access to face-to-face and online training.
3.2%
33.9%40.4%
25.6% 23.0%30.7%
43.2%47.6%
37.9% 39.9%
0%
10%
20%
30%
40%
50%
60%
70%
80%
90%
100%
K-2 3-5 6-8 9-12 Overall
Grade Bands
CCSD BCPS

17
Alignment. Although a national and federally funded program such as Head Start must follow its own programming and standards, the VPK programs operated by the district are aligned across the district and with the BCPS kindergarten and state standards. Staff members from the preschool department meet with the elementary reading and math coaches to ease the transition into kindergarten for students.
Parental involvement. The district offers programs that include social services and parenting classes. BCPS also offers parent seminars and events, as well as translated materials.
Assessment. Preschool students are assessed to track progress and growth. Assessments may be required by either the preschool program or the district. Teachers measure student development three times a year using various paper and online tools, which can include anecdotal and video evidence. Specialists use these data to schedule their visits and target their support. In addition, all BCPS students are assessed when they enter kindergarten.
Future plans. According to district staff, BCPS intends to start tracking preschool students through the second grade to watch their progress and compare it against that of peers who did not attend a preschool program.
Elementary Math and Reading
When the performance of elementary students (Grades 3–5) on standardized tests in reading and math was examined, BCPS students had higher proficiency rates in both subjects when compared with CCSD students. According to interview respondents, BCPS relies on consistency across the district, ongoing professional development and support, and data-driven decision making to keep student progress on track in elementary school.
Consistency and alignment. The district uses one reading and one mathematics curriculum and a core intervention structure for all schools. An instructional focus calendar for each subject online ensures that pacing is similar across the district. The reading and math departments at the district office have produced “struggling learner charts” as a reference for schools. These charts list research-based, targeted intervention programs based on intensity and focus area, allowing teachers to select the program that best fits students’ individual needs. As noted in the overall successes, each listed intervention program is supported either by the What Works Clearinghouse or the Florida Center for Reading Research. Teachers also meet in vertical teams, both within the elementary school and across to middle school, to discuss the alignment of curriculum and standards.
Professional development and support. Professional development and support are offered in person and online. One interview respondent asserted that “more important than programs is the quality of the teacher.… Staff development is the absolute most important [factor for success].” BCPS leadership feels that investing in high-quality professional development and

18
training leads to high-quality educators in the classrooms. Examples of such support include the following:
- BCPS has a tiered training system for the elementary school level. A small group of district trainers meet with coaches and contacts from the schools and the area office teams. The area offices also have a team of specialists who work with the schools and provide support in target areas, such as with LEP students. Principals may request additional on-site school support and/or ask a specialist to visit and assess their school.
- At the school level are coaches and designated contacts. Coaches support teachers through mentoring, modeling lessons, co-teaching, and also may analyze student data with the teachers. The designated contact is a teacher who meets with the district and area office staff and brings materials, training, and ideas back to his or her fellow teachers.
- Teachers may access additional resources, including lesson plans, class materials, professional development modules, and an instructional focus calendar, through the district’s online teacher portal. The math office maintains a wiki that elementary and secondary teachers may access throughout the day. Also available online is the “virtual counselor,” which serves as a data warehouse for school and assessment data.
Data-driven Interventions. BCPS holds each school responsible for discussing data and making decisions based on those data. One way this is accomplished is through a response-to-intervention (RtI) collaborative problem-solving process. The administrator, coach, exceptional student education specialist, counselor, teacher, and other staff meet to discuss the data of struggling students in the school. They identify and analyze the problem, design an intervention using the student’s data and the reading or math struggling learner chart, and then monitor the student’s progress.
High School
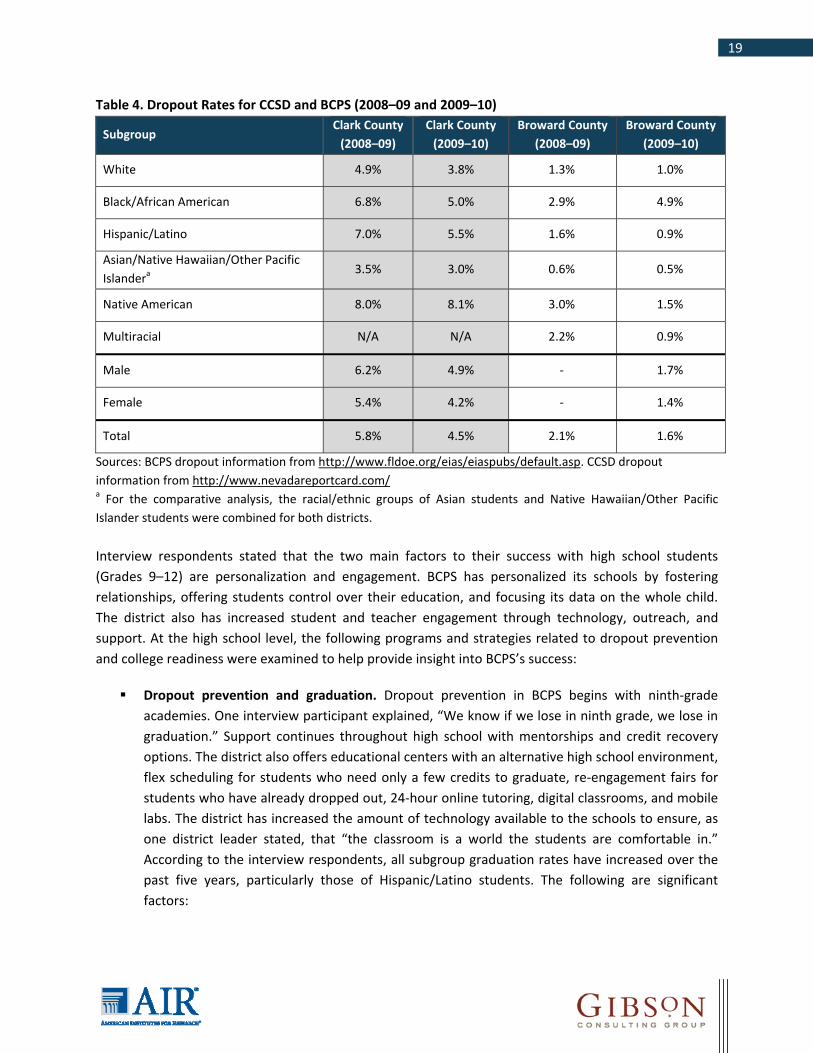
According to interview participants, BCPS has recently (1) increased graduation rates, high school student participation in advanced courses, and standardized test scores and (2) decreased dropout rates overall. In 2009–10, the dropout rates for BCPS were noticeably lower overall when compared to CCSD. The rates were also lower for different subgroups, with the exception of black/African American students who were nearly the same. Of note, the Hispanic/Latino student dropout rate (0.9 percent) in BCPS has decreased to be one of the lowest of the race/ethnicity subgroups in the 2009–10 school year (see Table 4).
19
Table 4. Dropout Rates for CCSD and BCPS (2008–09 and 2009–10)
Subgroup Clark County
(2008–09) Clark County
(2009–10) Broward County
(2008–09) Broward County
(2009–10)
White 4.9% 3.8% 1.3% 1.0%
Black/African American 6.8% 5.0% 2.9% 4.9%
Hispanic/Latino 7.0% 5.5% 1.6% 0.9%
Asian/Native Hawaiian/Other Pacific Islandera
3.5% 3.0% 0.6% 0.5%
Native American 8.0% 8.1% 3.0% 1.5%
Multiracial N/A N/A 2.2% 0.9%
Male 6.2% 4.9% - 1.7%
Female 5.4% 4.2% - 1.4%
Total 5.8% 4.5% 2.1% 1.6%
Sources: BCPS dropout information from http://www.fldoe.org/eias/eiaspubs/default.asp. CCSD dropout information from http://www.nevadareportcard.com/ a For the comparative analysis, the racial/ethnic groups of Asian students and Native Hawaiian/Other Pacific Islander students were combined for both districts. Interview respondents stated that the two main factors to their success with high school students (Grades 9–12) are personalization and engagement. BCPS has personalized its schools by fostering relationships, offering students control over their education, and focusing its data on the whole child. The district also has increased student and teacher engagement through technology, outreach, and support. At the high school level, the following programs and strategies related to dropout prevention and college readiness were examined to help provide insight into BCPS’s success:
Dropout prevention and graduation. Dropout prevention in BCPS begins with ninth-grade academies. One interview participant explained, “We know if we lose in ninth grade, we lose in graduation.” Support continues throughout high school with mentorships and credit recovery options. The district also offers educational centers with an alternative high school environment, flex scheduling for students who need only a few credits to graduate, re-engagement fairs for students who have already dropped out, 24-hour online tutoring, digital classrooms, and mobile labs. The district has increased the amount of technology available to the schools to ensure, as one district leader stated, that “the classroom is a world the students are comfortable in.” According to the interview respondents, all subgroup graduation rates have increased over the past five years, particularly those of Hispanic/Latino students. The following are significant factors:

20
- Ninth-grade academies. In 2006–07, the district mandated that each high school create a ninth-grade academy. Although the district did not describe how the academy should look, it did suggest that the schools base these academies on research. All teachers involved in an academy receive specific professional development. Also, the leaders of each academy meet once a month to discuss best practices. Staff from the area offices review each high school’s academy plan and check that the high schools are implementing their plans with fidelity. Respondents said that the smaller learning environment and the focused, comprehensive attention ninth-grade students experience in these academies have eased the high school transition and led to increased grade point averages.
- Mentorships. BCPS has implemented an intensive mentoring program that includes matching upperclassmen with students, as well as teacher-student mentoring. One respondent mentioned this program as an intervention that has been targeted toward increasing black/African American graduation rates in particular.
- Credit recovery. For students who have failed a course, BCPS offers a computer-based credit recovery program. Counselors identify and meet with students in need of credit recovery. Students complete the programs at their own pace at a school computer while monitored by a teacher familiar with the content area. Student progress is reported to and monitored by the area offices, and the principals at each high school receive progress reports.
College readiness. Related to preparing students for college, in 2003 the research and data department used a regression analysis of middle school academic and behavioral data to flag incoming ninth-grade students who were “likely to succeed” in AP and honors classes. Each area office monitors each high school to ensure that all high schools make an attempt to enroll these identified students in upper-level courses. One interview respondent said that BCPS has “substantially” narrowed the enrollment gap for subgroups in these courses, particularly for black/African American and Hispanic/Latino students. The district also has increased student participation in the PSAT, SAT, and ACT tests. Because of a partnership with the College Board, every 10th-grade student in BCPS takes the PSAT. Schools also offer preparatory classes for the SAT and ACT tests, and some students have the option to pass the Florida reading assessment graduation requirement through the SAT or ACT. Over the past two years, BCPS has decreased the gaps in SAT reading scores between white and Hispanic/Latino students and in SAT math scores between both white and Hispanic/Latino students and white and black/African American students.
Future plans. BCPS has a department dedicated to research and data that is in the process of developing an “at-risk” formula based on research from the Consortium on Chicago School Research. This formula will use key factors such as suspension rates and grades in core classes to flag students who are at risk after their first semester of high school. Eleven of the district’s

21
schools are piloting an even more in-depth whole-child data approach that also considers socioeconomic and psychological issues.
To highlight the success of the ninth-grade academies and other dropout prevention programs in BCPS, the difference between the number of ninth-grade students in one year and tenth-grade students in the following year was examined for CCSD and BCPS. After BCPS implemented ninth-grade academies in 2006–07, a steady increase was observed in the number of ninth-grade students moving to the tenth-grade in the following year. For the 2008–09 ninth-grade cohort, more than 93 percent moved to tenth grade in the following year (2009–10), compared with less than 82 percent in CCSD. Figure 10 illustrates the difference between CCSD and BCPS in ninth-grade students going to tenth grade over the past few years.
Figure 10. Percentage of Ninth-Grade Cohorts Moving on to Tenth Grade in CCSD and BCPS
Source: U.S. Department of Education, National Center for Education Statistics, Common Core of Data (CCD)
Houston Independent School District
According to the district website, Houston Independent School District (HISD) is the seventh largest in the United States and comprises 298 schools, 203,000 students, and more than 29,000 employees. The district covers 301 square miles of the greater Houston area in Texas. As superintendent of schools for HISD since September 2009, Dr. Terry Grier has expressed a commitment to preparing all students for college and career success and attracting and supporting top talent in the district's schools.8
8 From http://www.houstonisd.org, retrieved July 25, 2011.
86.8% 81.1% 85.0% 81.7%86.8% 88.9% 89.5% 93.2%
0%10%20%30%40%50%60%70%80%90%
100%
2005-06 to 2006-07 2006-07 to 2007-08 2007-08 to 2008-09 2008-09 to 2009-10
Perc
ent o
f Nin
th G
rade
rs M
ovin
g to
Ten
th
Grad
e in
Fol
low
ing
Year
Ninth-Grade Cohorts Moving to Tenth-Grade Year
CCSD BCPS

22
General Factors for Success
Across the eight interviews conducted for HISD, key personnel repeatedly mentioned the following three qualities that they believed have been major contributors to their district’s success:
Aligning services despite decentralization. HISD is a decentralized district with a strong belief for school autonomy. Although all district staff reported this viewpoint as a challenge to aligning district services, all reported that they are finding ways to monitor student and school progress and provide appropriate professional development. For example, the district has School Improvement Officers (SIOs) who monitor clusters of schools for progress and support, vertically aligned standards for Prekindergarten through Grade 12, and state- and district-mandated curricula for LEP students and preschool programs.
Data-driven decisions. To help monitor student performance throughout the district, HISD relies heavily on a centralized student data system. At elementary schools, formative assessments are regularly given throughout the year, which drives the interventions provided to struggling students. At secondary schools, students who do not succeed on the state tests are flagged in the district data system to alert teachers and school staff of areas of concern. Additional assessments can be given to these students to pinpoint what skills need to be targeted for interventions. The HISD data system is available to all staff throughout the district, which staff report has been useful given the district’s high student mobility rates.
Support and professional development focused on improvement. The district’s 22 SIOs are responsible for a cluster of schools at the elementary, middle school, or high school level. Each SIO is supported by specialists in key areas such as LEP, numeracy, and literacy. The SIO and specialists are responsible for identifying areas in need of improvement based on data, aligning the curriculum, aligning academic systems with special education, providing support and professional development, and getting schools back on track.
Limited English Proficient Students
According to interview participants, about 30 percent of students in HISD are bilingual students; therefore, these students have had a big influence on the district’s NCLB accountability status. Over the past few years, as the district has focused on this special population it has seen an upward trend in LEP student achievement in reading, math, social studies, and science and some closing of the achievement gap.
In HISD, Spanish-speaking students receive instruction in their native language first and gradually add English until they transition into an English-only classroom in Grade 4 or Grade 5. To address the needs of LEP students, the district primarily uses three models: an early exit model, a later exit model, and a two-way dual language model. Each of these models has shown success in different schools. However, HISD personnel mentioned that fidelity of implementation across the district is a challenge and that
23
campuses have had varying degrees of success with each of these models. In interviews, district staff identified three key factors in the success of their LEP programs, as follows:
State-mandated program and curricula. Texas mandates that school districts offer bilingual education to any school with 20 speakers of any one language at any grade level at the school. In addition, the state mandates that bilingual education use a research-based program approved by the state.
Monitoring implementation. The central office monitors implementation of LEP students through data and classroom observations. A district staff member runs student data on a weekly basis, and a district team visits 2–20 classrooms per week to observe classroom instruction. This observation information is shared with the SIOs who can send in an LEP specialist to work with a teacher if needed.
Collecting assessment data. According to interviews, LEP students take the same assessments as non-LEP students, as well as a Spanish norm-referenced test. This Spanish-language test allows the district to see growth in LEP students, especially at the lower grades, that might not be seen on an English-based test.
The research team examined the rates of English proficiency of the LEP student population in HISD and CCSD, as determined by the language assessments used in both the districts. HISD uses data from the Texas English Language Proficiency Assessment System (TELPAS) to measure the progress of its LEP students. To measure an LEP student’s fluency level with the English language, the TELPAS has four tests: Listening, Speaking, Reading, and Writing.9 The following four levels on the TELPAS indicate the English proficiency attainment of LEP students:
Beginning Intermediate Advanced Advanced high
As discussed previously, for the CCSD data, the EPS codes of LEP students still receiving LEP services were used for this comparative analysis.10 Figure 11 displays the percentages of LEP students who attained the level of fluent English speaker on monitor status in CCSD and the percentages of LEP students in HISD who reached the advanced high level on a composite score of the TELPAS tests. Students who attained a fluent English level and have exited LEP services are not included in these results for either district. The results are reported in grade bands (i.e., K–2, 3–5, 6–8, and 9–12). For the 2010–11 school year, CCSD had lower overall levels of proficient/fluent LEP students still receiving services when compared with HISD.
9 Detailed information about the TELPAS test can be found at the Texas Education Agency website, http://www.tea.state.tx.us/student.assessment/ell/telpas, retrieved July 25, 2011. 10 See previous discussion of how CCSD determines EPS codes on page 16 of this report.
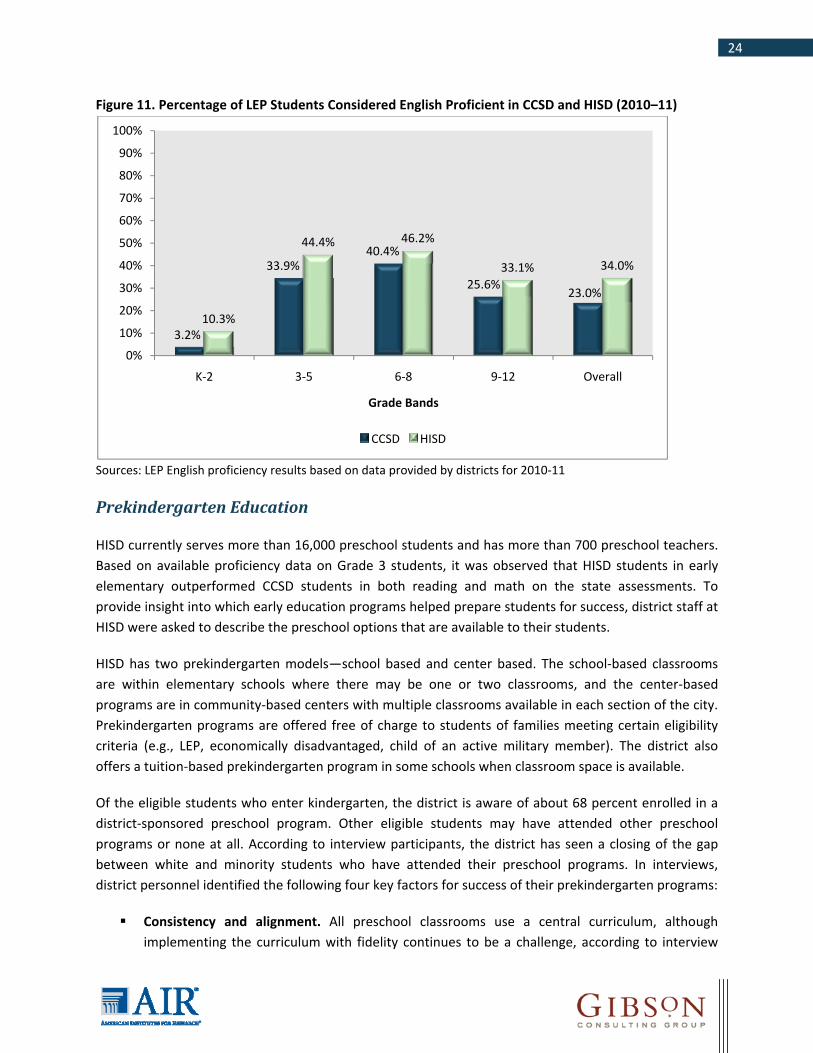
24
Figure 11. Percentage of LEP Students Considered English Proficient in CCSD and HISD (2010–11)
Sources: LEP English proficiency results based on data provided by districts for 2010-11
Prekindergarten Education
HISD currently serves more than 16,000 preschool students and has more than 700 preschool teachers. Based on available proficiency data on Grade 3 students, it was observed that HISD students in early elementary outperformed CCSD students in both reading and math on the state assessments. To provide insight into which early education programs helped prepare students for success, district staff at HISD were asked to describe the preschool options that are available to their students.
HISD has two prekindergarten models—school based and center based. The school-based classrooms are within elementary schools where there may be one or two classrooms, and the center-based programs are in community-based centers with multiple classrooms available in each section of the city. Prekindergarten programs are offered free of charge to students of families meeting certain eligibility criteria (e.g., LEP, economically disadvantaged, child of an active military member). The district also offers a tuition-based prekindergarten program in some schools when classroom space is available.
Of the eligible students who enter kindergarten, the district is aware of about 68 percent enrolled in a district-sponsored preschool program. Other eligible students may have attended other preschool programs or none at all. According to interview participants, the district has seen a closing of the gap between white and minority students who have attended their preschool programs. In interviews, district personnel identified the following four key factors for success of their prekindergarten programs:
Consistency and alignment. All preschool classrooms use a central curriculum, although implementing the curriculum with fidelity continues to be a challenge, according to interview
3.2%
33.9%40.4%
25.6%23.0%
10.3%
44.4% 46.2%
33.1% 34.0%
0%
10%
20%
30%
40%
50%
60%
70%
80%
90%
100%
K-2 3-5 6-8 9-12 Overall
Grade Bands
CCSD HISD

25
respondents. This curriculum works along with the district standards beginning in prekindergarten and is aligned to the skills and knowledge students will need as they progress through their K–12 experience.
Assessments. Over the past three or four years, the district has developed assessments for its prekindergarten students that have provided the district with more information about student achievement in language arts and math. The district also collects assessment data on Spanish-speaking prekindergarten students with a Spanish norm-referenced test.
Partnership with Head Start classrooms. HISD works with Head Start classrooms in two ways. Head Start teachers work alongside HISD teachers in the same preschool classroom. Students are considered dually enrolled in both the district and the federal Head Start program, which provides for all-day services. In addition, Head Start contracts with the district to provide special education services when needed.
Serving special education students. The district begins providing children special education services at age 3. The district offers three services: a preschool program for children with disabilities (PPCD), a multiply impaired (MI) program, and speech services. PPCD is an inclusion model in which special education students attend school with typically developing students.
Elementary Math and Reading
When examining the performance of elementary students (Grades 3–5) on standardized tests in reading and math, the team found that HISD students had higher proficiency rates in both subjects when compared with CCSD students. Higher proficiency rates were also found for HISD students within all racial/ethnic, socioeconomic, and special education subgroups. In interviews, district personnel reported that student proficiency in math has steadily increased over the past few years. There also has been an increase in the percentage of students scoring at the “commended” level on the Texas Assessment of Knowledge and Skills (TAKS). District personnel reported that they have shown some recent progress in closing the achievement gap in math. In particular, they have seen progress in closing the gap between LEP students and economically disadvantaged students compared with average student performance.
According to interview respondents, HISD relies on consistency across the district, data-driven instruction, research-based interventions, and ongoing professional development to keep student progress on track in elementary school.
Consistency and alignment. The district selects the mathematics and reading curriculum for all schools across the district. Campuses are then free to select any supplemental materials. For math, the district adopted a curriculum five years ago that integrated problem-solving into daily instruction. For reading, the district recently adopted two reading curricula, one for English instruction and another for Spanish instruction, emphasizing its support of bilingual education.

26
Data-driven instruction and interventions. District personnel report collecting multiple data sources on student achievement and using these data for driving instruction and interventions. Students take formative assessments in reading and math throughout year. In math, students are assessed every three weeks on standards, and the results are documented on the campus online system. For reading, students take an early reading assessment three times a year. Results from these formative assessments are used for assigning Tier 2 and Tier 3 interventions for struggling students, following a response-to-intervention (RtI) approach.
School-level support. As an example of school-level support, each school has a lead teacher in mathematics. The district math manager works with the lead teachers to provide them with resources and ideas to bring back to their campus. This relationship has been successful for building communication between the district and campuses as well as reducing fragmentation of the programs.
Middle School Math and Reading
When the performance of middle school students (Grades 6–8) on state assessments in reading and math was examined, HISD students had higher proficiency rates in both subjects compared with CCSD students. District personnel reported that they have seen great growth at the middle school level in the past four or five years in the areas of math, science, and writing. This growth was especially apparent in LEP middle school students. In interviews, district personnel mentioned that they have seen some closing of the achievement gap with LEP, special education, black/African American students, and Hispanic/Latino students. According to interviews, HISD relies on streamlined programs across the district and responsive interventions to support student success in middle school.
Consistency and alignment. For English language arts, the district has developed a local curriculum developed around the state standards. This curriculum lays out the scope, sequence, and instructional strategies for each unit. For math, the district has chosen to reduce the number of math curricula used at the middle school level from about 20–30 down to only two or three districtwide. This strategy has made it more manageable for the district to focus on using research-based programs and providing support to the schools. One interviewee noted that before creating a centralized curriculum, “We were spending millions and getting very inconsistent results. … It is a fiduciary responsibility [to select a program] and go with it—implement it with fidelity, and give it three to five years to evaluate it over time.”
Data-driven instruction and interventions. HISD reports success in identifying struggling middle school students using the RtI model. When students are not successful on the state test, they are flagged in the student data system and are given an additional assessment that identifies Tier 1, Tier 2, and Tier 3 intervention needs. In interviews, district staff noted that in several of the intervention programs targeted for LEP students in middle school, the district has seen great gains in student achievement when the programs have been implemented with fidelity.

27
High School
According to interview respondents, in recent years HISD has (1) increased graduation rates, student participation in standardized tests, and college readiness and acceptance; (2) expanded opportunities for college-level work; and (3) decreased dropout rates at the high school level. In 2009–10, the dropout rates for HISD were lower overall compared to CCSD. Rates were also lower for different subgroups, with the exception of black/African American students (see Table 5).
Table 5. Dropout Rates for CCSD and HISD (2008–09 and 2009–10)
Subgroup Clark County
(2008–09) Clark County
(2009–10) Houston ISD
(2008–09) Houston ISD
(2009–10)
White 4.9% 3.8% 1.3% 1.4%
Black/African American 6.8% 5.0% 4.0% 5.0%
Hispanic/Latino 7.0% 5.5% 3.5% 3.5%
Asian/Native Hawaiian/Other Pacific Islandera
3.5% 3.0% 1.0% 1.2%
Native American 8.0% 8.1% 0.0% 3.9%
Multiracial N/A N/A N/A 2.5%
Male 6.2% 4.9% 3.7% 4.2%
Female 5.4% 4.2% 2.9% 3.2%
Total 5.8% 4.5% 3.3% 3.7%
Sources: HISD dropout information from http://www.tea.state.tx.us/acctres/dropcomp/years.html; CCSD dropout information from http://www.nevadareportcard.com/ a For the comparative analysis, the racial/ethnic groups of Asian students and Native Hawaiian/Other Pacific Islander students were combined for both districts. Decreasing dropout rates, increasing graduation rates, and successfully preparing students for life after high school has been a top priority in HISD. The district has found some recent success in a grant-funded ninth-grade transition program that focuses on offering summer activities and classes to incoming freshmen students and monitoring them throughout the school year.11 Interview respondents stated that the focus of programs for high school students (Grades 9–12) related to dropout prevention and college and career readiness. Details follow:
Dropout prevention and graduation. To address the issue of dropout prevention, HISD staff members said that they have used a four-pronged approach at the high school level:
11 Additional information about the Texas Ninth Grade Transition and Intervention grant program is available on the Texas Education Agency’s website, http://www.tea.state.tx.us/index4.aspx?id=2898&menu_id=949, retrieved July 25, 2011.

28
- Early interventions. The district has developed a Dropout Reduction and Prevention (DRP) team at all of the high schools. The goal of the DRPs is to identify and service students before their needs reach crisis mode. Each team meets on a regular basis to review student cases, and the campuses use an RTI model for distributing services.
- A centralized tracking system. This system allows the district to track students and monitor for red flags from the elementary to high school grades. The tracking system is an important tool for addressing student mobility, a common challenge in the district because as students move from school to school their information moves with them.
- Alternative environments and schedules. To address different student needs, the district offers a variety of alternative schooling options and class scheduling for students. These options include charter schools, adult high schools for students up to age 26, and career tech programs.
- A public awareness campaign. To get families more involved, HISD has reached out to parents and the community with a public awareness campaign focused on the message that it is not okay to allow students to drop out.
College and career readiness. HISD offers high school students a variety of opportunities to help prepare them for college or a career. These programs include attendance at early colleges, dual enrollment, Advanced Placement (AP) and International Baccalaureate (IB) courses, and taking college entrance exams.
- Early Colleges. The district provides five early colleges, at least one in each region. These schools provide students with a five-year high school program in which they can graduate with an associate’s degree.
- Partnerships with colleges and universities. HISD currently partners with DeVry Academy and with the local community college. For these dual enrollment programs, students continue their high school studies with the college or university to complete an associate’s degree.
- AP and IB courses. The district previously required that all schools offer at least 10 AP or IB courses on all high school campuses, and this year the requirement will increase to 15 courses. In 2009–10, the district began covering the costs of AP tests, which resulted in a 39 percent increase in the number of tests ordered this year. District personnel reported that a particularly large leap was noticed in the test participation of Hispanic/Latino and black/African American students.
- PSAT and SAT. HISD funds all PSAT testing for Grades 9–11 students in the district. In interviews, staff stated that by providing students with this early exposure to college entrance exams, they have seen these students doing better when they take the SAT.

29
For the 2010–11 school year, the district offered the SAT test to all Grade 11 students free of charge. As a result, 92 percent of district students took the SAT test, up from about 50 percent in previous years. The district is currently waiting to receive the results, but the increase in participation rates was very promising.
Miami-Dade County Public Schools
According to the district website, Miami-Dade County Public Schools (M-DCPS) is the fourth largest school district in the United States and is comprised of 392 schools, 345,000 students, and more than 40,000 employees. Located at the southern end of the Florida peninsula, the school district stretches over 2,000 square miles of diverse communities ranging from rural and suburban to urban cities and municipalities. District students speak 56 different languages and represent 160 countries. Superintendent Alberto M. Carvalho has led the school district since the fall of 2008. During his tenure, the district has received state and national recognition for increases in student achievement and graduation rates.12
General Factors for Success
There were three interviews conducted for M-DCPS, and therefore details from district websites and documents were also included to supplement these interview responses. Based on this information, the following four qualities were identified as major contributors to the district’s success:
Consistency. It is important to M-DCPS to have a consistent curriculum throughout the whole district. The same reading and math programs are offered at all schools, and LEP students are also taught using the same curriculum as the general population, with select supplemental materials. Pacing guides and other curriculum materials are provided to all teachers to ensure that students receive consistent instruction, no matter what school they are attending. In interviews, district staff emphasized that they had a highly mobile student population, and that a single curriculum minimized the difficulties students may have transitioning between buildings. M-DCPS also ensures consistency through weekly briefings from the various offices within the district department of education to the school principals and staff.
Network structure. Unlike most districts, M-DCPS services about 40 different municipalities, each of which has its own needs and goals. According to interviews, collaboration between the municipalities and the various community organizations within them is critical for the success of education in the district. M-DCPS has reached out to the mayors for support and formed compacts with many of them. The district also established the Office of Intergovernmental and Community Participation to serve as a liaison among the main district, and the network of schools and municipalities. This office facilitates communication and collaboration among the various stakeholders. One benefit of strong community ties has been offsetting district budget cuts. For some programs, community organizations have been able to supplement district funds.
12 From http://www.dadeschools.net, retrieved July 25, 2011.

30
Data-driven decisions. Student data from state tests, formative assessments, and interim assessments drive the district’s decisions about the student support services needed as well as where more teacher support is needed. Based on student assessment data, struggling students are provided with targeted interventions to address their specific areas of deficiency. It is also through this data that district staff are able to monitor programs and identify areas of concern where the district may need to step in to get a school back on track.
Teacher support. To promote excellence in teaching, the district supports teachers with professional development, instructional coaches, and paying for educators to attain the certificate endorsements that are required by the state. For example, any teachers who have LEP students in their classrooms must be properly certified or endorsed in this area, therefore M-DCPS offers free endorsement courses to all teachers. The district also provides support through visiting classrooms and modeling lessons to ensure that instruction is meeting district and state standards.
Limited English Proficient Students
According to interviews, M-DCPS has a large immigrant population, with more than 60,000 students enrolled in the English for Speakers of Other Languages (ESOL) district programs. As evidence of success, M-DCPS recently conducted a longitudinal study and found that LEP students who had entered the district in kindergarten were outperforming native English speakers on state tests by the time they reached Grade 3. One district staff member stated, “I think the fact that we are so large and still continue to make progress is remarkable.”
In M-DCPS, the ESOL classes are primarily self-contained for LEP students who enter the district. The ESOL teachers provide instruction to students using the same curriculum as the general education classes, as well as supplemental materials. The district has invested in several different electronic programs to provide computer-assisted instruction to LEP students at both the elementary and secondary levels. During these computer sessions, a certified ESOL teacher is required to be present to provide assistance to students as they work on the programs. In interviews, district staff identified five key factors in the success of their LEP programs:
Consistent curriculum. District staff identified having consistent programs for ESOL students throughout the district as a key to their success. The ESOL teachers use the same reading curriculum as regular classrooms, and can choose from a selection of supplemental materials designated by the district. This is particularly beneficial given the high student mobility rates found within this population in the district.
Early intervention. For students learning English as a second language in Grades K–2, the district provides a computer-based intervention program. The program instructs students in their first language and combines music, bright graphics, games, and exercises (e.g., shadow reading) to help student learn grammar and vocabulary. The program also helps students build an academic
31
vocabulary, which is one of the factors that district staff emphasized has led to their academic success.13
Focus on newcomers. At the middle and high school levels, M-DCPS offers the New Beginning Program designed to address the needs of LEP students who have limited or no prior school experience. Not only do these students lack English proficiency, but they also lack literacy and academic skills in their home language.14 In interviews, district staff stated that these students get a “double dose” of English language arts courses each day, with one focusing on developing fluency and vocabulary skills, and the other being the equivalent of their grade-level English class. This amounts to approximately two hours a day of English instruction for these students.
Professional development. In the state of Florida, the Consent Decree requires that all teachers of LEP students must be highly qualified and endorsed or certified in ESOL instruction.15 M-DCPS offers endorsement courses to all of its teachers, free of charge. District staff stated that providing these courses to the teachers is a huge support in helping them meet the state qualifications.
Teacher support. According to interview participants, M-DCPS has a Division of Bilingual Education and World Languages office that provides support to ESOL teachers and monitors program implementation.
- Instructional support. The bilingual department has professional teachers who are experts in the field, who go to the schools as needed and model lessons for students at different LEP levels. At the elementary level, the reading coaches at the schools also support the teachers and work directly with ESOL students in reading.
- Program monitoring. The district monitors implementation of ESOL services through spot checks and classroom visits. Supervisors and curriculum support specialists make regular visits to classrooms throughout the district.
The research team examined the rates of English proficiency of the LEP student population in M-DCPS and CCSD, as determined by the language assessments used in both the districts. As a Florida school district, M-DCPS also uses data from the CELLA to measure the progress of its LEP students. The highest level a student can reach on the CELLA is proficient language proficiency. As discussed previously, for the CCSD data, the EPS codes of LEP students still receiving LEP services were used for this comparative analysis.16
Figure 12 displays the percentages of LEP students who attained the level of fluent English speaker on monitor status in CCSD and the percentages of LEP students in M-DCPS who reached the proficient
13 From http://www.imaginelearning.com/school/ProgramOverview.html, retrieved August 19, 2011. 14 From http://bilingual.dadeschools.net/BEWL/new_begin.asp, retrieved August 9, 2011. 15 From http://www.fldoe.org/aala/cdpage2.asp, retrieved August 9, 2011. 16 See previous discussion of how CCSD determines EPS codes on page 16 of this report.
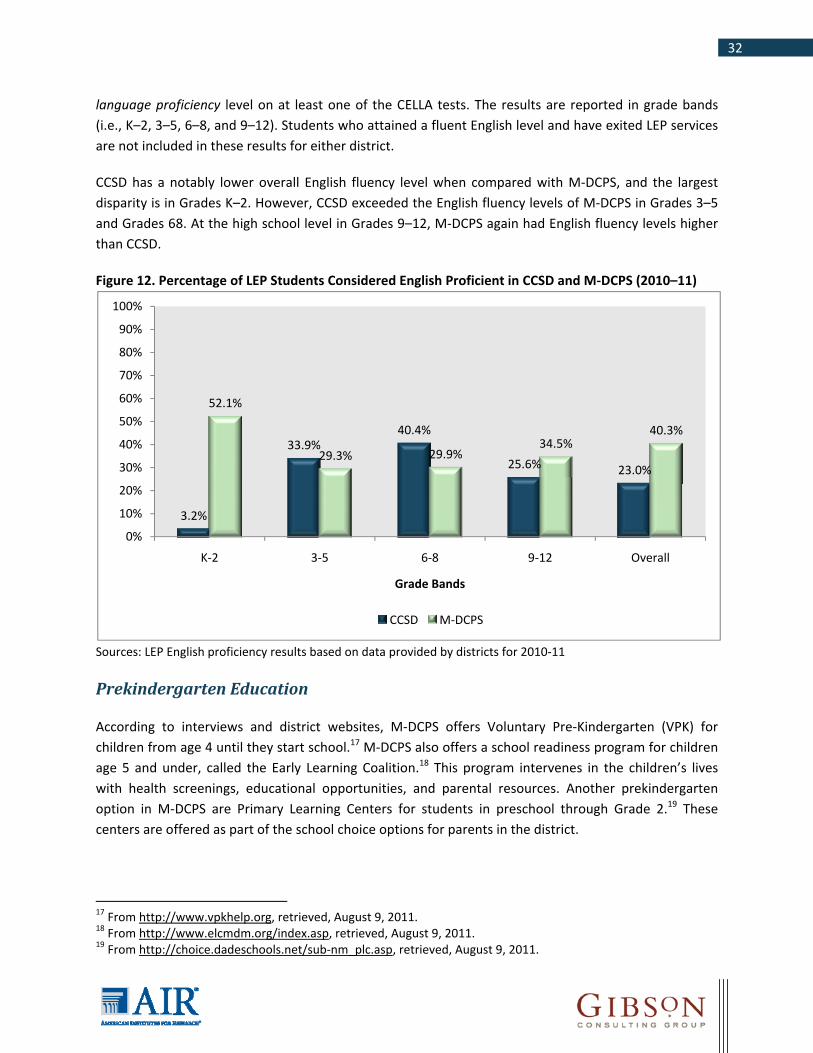
32
language proficiency level on at least one of the CELLA tests. The results are reported in grade bands (i.e., K–2, 3–5, 6–8, and 9–12). Students who attained a fluent English level and have exited LEP services are not included in these results for either district.
CCSD has a notably lower overall English fluency level when compared with M-DCPS, and the largest disparity is in Grades K–2. However, CCSD exceeded the English fluency levels of M-DCPS in Grades 3–5 and Grades 68. At the high school level in Grades 9–12, M-DCPS again had English fluency levels higher than CCSD.
Figure 12. Percentage of LEP Students Considered English Proficient in CCSD and M-DCPS (2010–11)
Sources: LEP English proficiency results based on data provided by districts for 2010-11
Prekindergarten Education
According to interviews and district websites, M-DCPS offers Voluntary Pre-Kindergarten (VPK) for children from age 4 until they start school.17 M-DCPS also offers a school readiness program for children age 5 and under, called the Early Learning Coalition.18 This program intervenes in the children’s lives with health screenings, educational opportunities, and parental resources. Another prekindergarten option in M-DCPS are Primary Learning Centers for students in preschool through Grade 2.19 These centers are offered as part of the school choice options for parents in the district.
17 From http://www.vpkhelp.org, retrieved, August 9, 2011. 18 From http://www.elcmdm.org/index.asp, retrieved, August 9, 2011. 19 From http://choice.dadeschools.net/sub-nm_plc.asp, retrieved, August 9, 2011.
3.2%
33.9%40.4%
25.6% 23.0%
52.1%
29.3% 29.9%34.5%
40.3%
0%
10%
20%
30%
40%
50%
60%
70%
80%
90%
100%
K-2 3-5 6-8 9-12 Overall
Grade Bands
CCSD M-DCPS
33
The district estimates that 30 percent of students entering kindergarten have attended one of the district-sponsored preschool programs. Other students may have attended private preschool programs or none at all. According to interviews, the quality of the VPK programs has increased and the number of low-performing providers has decreased. Successful preschool programs have certified teachers, a low teacher-to-student ratio, and a paraprofessional in every classroom. District personnel identified the following three key factors for success of their prekindergarten programs:
Partnerships. M-DCPS collaborates with numerous organizations, such as Kellogg Foundation and Children’s Trust. These organizations assist with professional development, keynote speakers, and school programs. For example, M-DCPS recently won a grant for $5 million to work in collaboration with their partners to offer free Early Childhood Master’s degrees to 100 early childhood teachers in the county.
Program monitoring. To ensure the quality of their preschool programs, M-DCPS uses a variety of means. The district offers professional development to private preschool providers to inform them of the district’s kindergarten expectations. The state’s readiness screenings at the start of school have also motivated preschool providers to make sure that their students meet those standards before they enter kindergarten. In addition, the district and some of its partners visit the district-sponsored preschool providers to ensure that they are fulfilling the standards and expectations.
Strong support from administration. M-DCPS administration support early childhood education and ensure that the programs receive adequate Title I funding. The district also provides professional development to teachers and staff in Grades K–3 so they know what to expect of students coming from these preschool programs.
Elementary Math and Reading
When examining the performance of M-DCPS elementary students (Grades 3–5) on state assessments in reading and math compared with CCSD students, M-DCPS students had higher proficiency rates in both subjects at all grades, with the exception of Grade 5 math. In recent years, M-DCPS has had the most similar reading and math proficiency rates of all of the peer districts when compared to CCSD. However, district staff are seeing some improvements, as one respondent stated, “We are happy to see that all our subgroups are making progress, and we continue to go up in reading in every subgroup, especially at the elementary level.” It was also noted that in math, student achievement has also steadily increased and the achievement gap has decreased.
According to interview respondents, M-DCPS relies on consistency and alignment across the district, data-driven decisions, early interventions, and ongoing teacher support to help keep student progress on track in elementary school.
Consistency and alignment. M-DCPS staff identified having consistent programs throughout the district as a key to their success. The same reading curriculum series and supplemental materials
34
are used at all elementary and secondary schools. This reading curriculum has been adapted to be aligned with Florida state standards. For math, there is a comprehensive district plan for Grades K–12 that is also aligned with state standards. As part of the math plan, district pacing guides are available to all teachers as well as suggestions for designing appropriate lessons.20
Data collection. The district is constantly monitoring data to track student performance and to make decisions about teacher instruction. Three times a year, a statewide formative assessment is given to students. In addition, the district also collects its own interim assessment data on the progress of students. District staff stated that the student data from these assessments are available to teachers almost immediately. The data are used to identify struggling students, and the district expects teachers to adapt their classroom instruction accordingly.
Targeted interventions. According to interviews, as soon as students at the elementary level fall below the district proficiency level, they are placed in an appropriate intervention. M-DCPS has invested heavily in technology as a means to assist struggling students. Using computer-based programs, identified students receive instruction in areas of deficiency under the supervision of a licensed teacher during the school day.
Teacher support. District staff highlighted that all language arts teachers at the elementary level must be endorsed specifically in reading, and that every elementary school has the services of a reading coach. Lower-achieving schools have full-time reading coach positions, and at higher-achieving schools a coach will come several days per week to help with reading instruction. There is also a cadre of reading support specialists who work in the region that will go to schools to provide additional support, when poor student performance indicates a need.
High School
According to the district website and available documents, in recent years M-DCPS has focused on programs to increase graduation rates and decrease dropout rates. In 2009–10, the overall dropout rate for M-DCPS was lower than the CCSD rate. For the different racial/ethnic subgroups, M-DCPS had lower dropout rates than CCSD, with the exception of black/African American students who were nearly the same (see Table 6).
20 From http://math.dadeschools.net/comprehensiveMathematicsPlan.html, retrieved August 19, 2011.
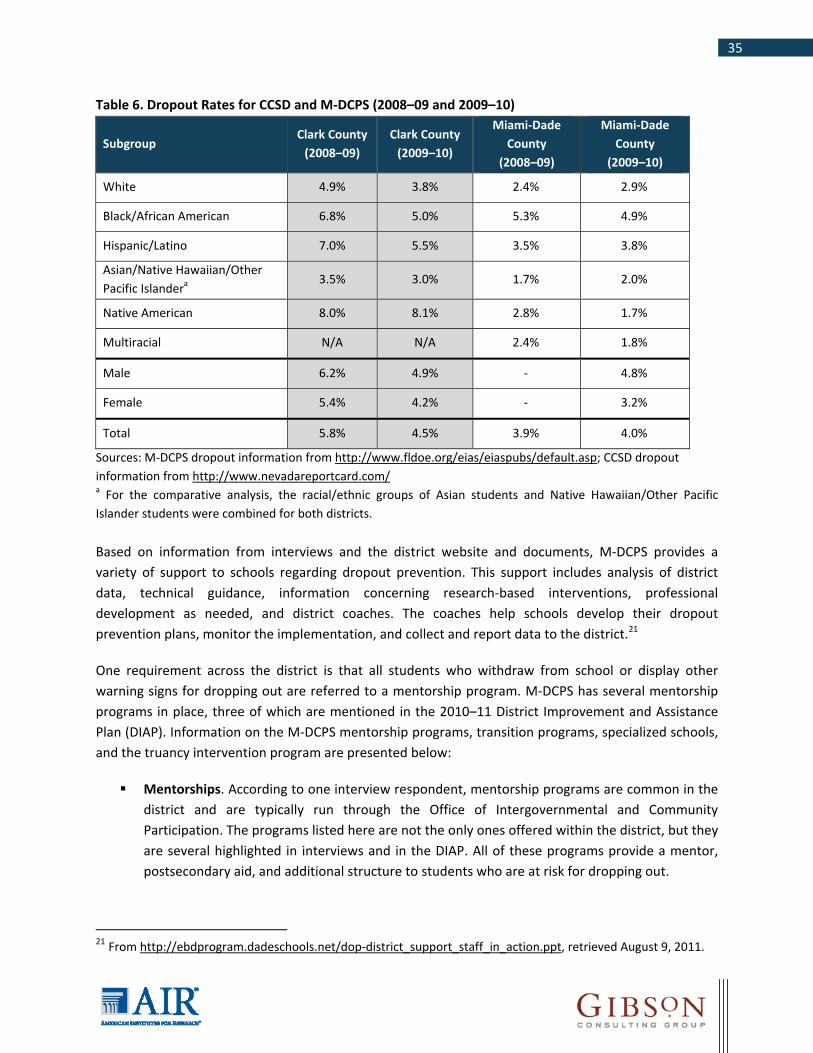
35
Table 6. Dropout Rates for CCSD and M-DCPS (2008–09 and 2009–10)
Subgroup Clark County
(2008–09) Clark County
(2009–10)
Miami-Dade County
(2008–09)
Miami-Dade County
(2009–10)
White 4.9% 3.8% 2.4% 2.9%
Black/African American 6.8% 5.0% 5.3% 4.9%
Hispanic/Latino 7.0% 5.5% 3.5% 3.8%
Asian/Native Hawaiian/Other Pacific Islandera
3.5% 3.0% 1.7% 2.0%
Native American 8.0% 8.1% 2.8% 1.7%
Multiracial N/A N/A 2.4% 1.8%
Male 6.2% 4.9% - 4.8%
Female 5.4% 4.2% - 3.2%
Total 5.8% 4.5% 3.9% 4.0%
Sources: M-DCPS dropout information from http://www.fldoe.org/eias/eiaspubs/default.asp; CCSD dropout information from http://www.nevadareportcard.com/ a For the comparative analysis, the racial/ethnic groups of Asian students and Native Hawaiian/Other Pacific Islander students were combined for both districts. Based on information from interviews and the district website and documents, M-DCPS provides a variety of support to schools regarding dropout prevention. This support includes analysis of district data, technical guidance, information concerning research-based interventions, professional development as needed, and district coaches. The coaches help schools develop their dropout prevention plans, monitor the implementation, and collect and report data to the district.21
One requirement across the district is that all students who withdraw from school or display other warning signs for dropping out are referred to a mentorship program. M-DCPS has several mentorship programs in place, three of which are mentioned in the 2010–11 District Improvement and Assistance Plan (DIAP). Information on the M-DCPS mentorship programs, transition programs, specialized schools, and the truancy intervention program are presented below:
Mentorships. According to one interview respondent, mentorship programs are common in the district and are typically run through the Office of Intergovernmental and Community Participation. The programs listed here are not the only ones offered within the district, but they are several highlighted in interviews and in the DIAP. All of these programs provide a mentor, postsecondary aid, and additional structure to students who are at risk for dropping out.
21 From http://ebdprogram.dadeschools.net/dop-district_support_staff_in_action.ppt, retrieved August 9, 2011.

36
- 5000 Role Models of Excellence connects young minority men between the ages of 9 and 19 with a mentor and a supportive structure. The structure includes a strict dress code and guaranteed postsecondary placement (e.g., college, employment, and/or training). According to this program’s website, “Over 95% of the students who begin the program and graduate have no further negative contact with violations of school conduct codes or the law.”22
- Women of Tomorrow was started by a local reporter and has grown throughout the district. According to interviews, the program pairs at-risk female students with women professionals in the Miami-Dade area. In addition to mentorships, the program now offers multiple scholarships, college campus visits, and field trips to various area businesses and workplaces.23
- Take Stock in Children is a statewide program that provides each student with a mentor and requires students and their guardians to sign a contract committing to positive academic behavior and performance. If students fulfill the requirements, they receive a full tuition scholarship or vocational education through a training program from a community college.24
School transitions. District staff emphasized that M-DCPS recognizes the importance of helping students navigate the transitions between each level of schooling. Schools in the district offer transition courses in the grades on either side of a divide, such as between Grade 8 and Grade 9.
- Middle School to High School. Students receive a preparatory class in eighth grade and then an additional class in ninth grade that focuses on the skills and knowledge they will need in high school. These classes are designed to mentally equip students for their new school environment and to lower the number of students who drop out of school during this transition period.
- High School to Postsecondary Life. The schools also offer courses to help eleventh and twelfth grade students plan and prepare for life after high school. These courses are partially informed by the choices available in the community. According to interviews, these preparatory classes focus on teaching time management and social skills as a response to local colleges and universities saying that many M-DCPS graduates may be ready academically but still fail due to not having developed these “soft skills.”
Specialized schools. School choice is a high priority in M-DCPS. According to an interview respondent, the district recognizes that all students learn differently and therefore wants to offer a variety of school settings to meet their needs. The district is in the process of increasing the choices of schools and improving transportation quality so that more students may have
22 From http://5000rolemodels.dadeschools.net, retrieved August 9, 2011. 23 From http://www.womenoftomorrow.org/strategy, retrieved August 24, 2011. 24 From http://www.takestockinchildren.org/how-it-works, retrieved August 9, 2011.

37
access to a larger number of schools. District staff highlighted that a recently expanded school option is the iPrep academy. These schools, which are typically offered as schools-within-schools, combine traditional classroom settings with a more technologically-focused and relaxed environment. Some of the other school choice options, such as the success academies, are especially targeted toward helping overage students reach graduation, and interview respondents stated that this model has had a positive impact on their district.
A-1
Appendix A Comparative Analysis of Academic Performance Appendix
The research team used a multistage approach to select three districts from the United States that are comparable to Clark County school district (CCSD) on demographic composition but different on academic performance. This approach included making a series of decisions that allowed for a progressive narrowing of districts from which to choose. We first gathered data on the 150 largest districts in the country. We then limited the sample based on the locale code assignment and definitions from the Common Core of Data. Next, we limited the sample based on number of schools in each district. We then examined per-pupil expenditures and compared demographic composition of the districts. Finally, districts were compared on measures of student performance such as percentage of students proficient on standardized state tests; graduation rates; dropout rates; and percentage of students taking PSAT, ACT, SAT, and AP exams. Each of these steps is described more fully below.
Demographic Comparison
To select districts of like scale and complexity to CCSD, a demographic comparison was performed. The data source used was the Common Core of Data provided by the National Center for Education Statistics.25 We took the following four steps to narrow the sample based on demographic factors:
1) Data were gathered for the 150 largest districts in the United States. 2) The sample was limited to include only districts with the locale code 21 (Suburb, Large) or the
locale code 11 (City, Large). Both of these locales include territories with a population of 250,000 or more.
3) The sample was reduced further by including only districts that contained anywhere from 200 fewer schools than CCSD to 200 schools more than CCSD.
4) The sample was limited to include districts with similar per-pupil spending.26 Districts spending approximately 30 percent more per student than CCSD were eliminated from consideration as a feasible match.
The districts in this narrowed set were then compared on a number of demographic variables. These variables included percentage of minority students, percentage of limited-English-proficient (LEP) students, percentage of students eligible for free or reduced-price lunch, and percentage of students receiving special education services (SPED). We also examined teacher-pupil ratio, percentage of schools in corrective action, and total per-pupil revenue. Comparing the set of districts on these variables allowed us to further narrow the sample to eight possible comparison districts. The data for each of these eight districts are presented in Table A.1.
25 CCD has 12 urban central locale codes (http://nces.ed.gov/ccd/). 26 It is worth noting that per-pupil expenditures were not adjusted for differences in cost of living associated with each location.

A-2
Table A.1. District Demographic and Financial Information for Comparison Districts (2009–10)
Clark County School District
Broward County Houston ISD Miami-Dade
County Palm Beach
County Hillsborough
County Orange County
Dallas ISD
San Diego
Unified
State Nevada Florida Texas Florida Florida Florida Florida Texas California
Locale type 21 21 11 21 21 21 21 11 11
Number of schools 370 325 309 546 250 305 256 236 225
Number of students 307,059 256,137 202,773 345,804 172,897 193,265 173,259 157,111 131,417
Percent FRPL-eligible students 43.8% 52.8% 59.3% 68.0% 46.9% 53.7% 50.9% 86.5% 64.5%
Percent LEP students 16.8% 9.5% 28.5% 17.2% 10.5% 11.5% 17.3% 33.4% 28.3%
Percent SPED students 10.5% 12.3% 8.1% 11.0% 15.2% 15.2% 13.1% 7.7% 12.0%
Teacher-to-pupil ratio1 19.95 16.92 16.9 15.98 15.12 14.41 16.65 14.95 20.16
Percent Title I schools2 53.5% 61.2% 88.0% 67.2% 56.4% 59.7% 63.7% 92.8% 81.8%
Total per-pupil revenue
(2008–09)3 $11,859 $11,569 $9,867 $13,282 $13,605 $10,936 $11,668 $10,746 $11,540
Total per-pupil expenditure (2008–09) $6,877 $7,838 $7,485 $8,826 $8,390 $7,283 $7,644 $8,352 $9,057
Source: U.S. Department of Education, National Center for Education Statistics, Common Core of Data (CCD).
1 Teacher-to-pupil ratio is total n of students divided by total n of teacher FTEs. 2 Percent Title I schools is total n Title I schools divided by n schools. 3 Total per-pupil revenue is total revenue divided by total n students contained in the CCD revenue data file.

A-3
Student Achievement Comparison
After the sample was limited on the basis of demographic composition, we turned to measures of academic performance. The goal was to select districts that, similarly composed, with similar spending, are performing better than CCSD. The data used for this purpose came from information available on district and state websites and included the following:
District adequate yearly progress (AYP) status Percentage of students in a district at or above proficiency levels established by each state in
reading and mathematics, as measured by state assessments Graduation and dropout rates Percentage of students taking the PSAT, SAT, ACT, and AP exams PSAT, SAT, ACT, and AP exam performance
The process used for examination of these data was systematic and iterative involving several steps, as follows:
1) Examining overall proficiency ratings for mathematics and reading 2) Focusing on the areas in elementary school in which Clark County showed the most challenge
(i.e., Grade 3 reading, Grade 5 reading, and Grade 8 mathematics) 3) Checking AYP status 4) Examining consistent measures of high school performance, including:
a. Graduation rate b. Dropout rate c. Percentage of students taking the PSAT, SAT, ACT, and AP exams d. Scores on the PSAT, SAT, ACT, and AP exams
Our findings led us to the selection of three comparison districts. We found that Houston Independent School District had the best performance from students in elementary school grades, but not as strong performance at the high school level. Therefore, to select the remaining two districts, we focused on the high school performance measures and recommended Palm Beach County Public Schools and Broward County Public Schools. CCSD district leadership chose Miami-Dade County Public Schools instead of Palm Beach County in order to have one comparison district of larger size than CCSD.
For information on student performance in all possible comparison districts, see Table A.2. All references to data sources can be found in the endnotes to this appendix.

A-4
Table A.2. District Performance Information for Possible Comparison Districts (2009–10)
Student Performance Indicator
Clark County School District
Broward County
Houston ISD
Miami-Dade
County
Palm Beach County
Hills- Borough County
Orange County
Dallas ISD
San Diego
Unified District AYP status Meta Not metb Not metc Not metb Not metb Not metb Not metb Not metc Not metd % proficient, all grades, reading 66.2%e 63%b 84%c,1 59%b 64%b 61%b 62%b 81%c,1 58%d,1 % proficient, all grades, math 63.5%e 72%b 81% c 66%b 72%b 68%b 67%b 76%c 60%d
% proficient, Grade 3, reading 59.8%a 72%f 89%g 68%f 68%f 71%f 71%f 85%g 46%d,1
% proficient, Grade 3, math 65.3%a 80%f 83%g 78%f 79%f 76%f 75%f 78%g 68%d % proficient, Grade 4, reading 64.1%a 72%f 81%g 70%f 72%f 68%f 72%f 78%g 67%d,1 % proficient, Grade 4, math 65.6%a 76%f 87%g 72%f 75%f 73%f 73%f 82%g 71%d
% proficient, Grade 5, reading 52.3%a 70%f 89%g 66%f 70%f 67%f 70%f 86%g 63%d,1
% proficient, Grade 5, math 65.6%a 68%f 92%g 60%f 65%f 63%f 62%f 88%g 63%d
% proficient, Grade 6, reading 62.7%a 69%f 81%g 62%f 68%f 65%f 67%f 78%g 61%d,1
% proficient, Grade 6, math 61.1%a 64%f 79%g 53%f 63%f 57%f 56%f 73%g 55%d
% proficient, Grade 7, reading 72.9%a 68%f 82%g 64%f 71%f 65%f 66%f 77%g 57%d,1
% proficient, Grade 7, math 63.7%a 65%f 78%g 59%f 70%f 62%f 60%f 68%g 49%d
% proficient, Grade 8, reading 64.9%a 60%f 91%g 51%f 58%f 55%f 55%f 89%g 58%d,1
% proficient, Grade 8, math 55.4%a 72%f 83%g 63%f 73%f 67%f 66%f 77%g —
% proficient, Grade 9, reading — 48%f 88%g 42%f 51%f 48%f 45%f 87%g 58%d,1
% proficient, Grade 9, math — 72%f 64%g 63%f 71%f 66%f 62%f 60%g —
% proficient, Grade 10, reading 77.6%h 39%f 87%g,1 37%f 45%f 39%f 37%f 87%g,1 48%d,1
% proficient, Grade 10, math 49.6%h 73%f 68%g 73%f 77%f 72%f 69%f 68%g —
% proficient, Grade 11, reading 93.5%a — 90%g,1 — — — — 91%g,1 46%d,1 % proficient, Grade 11, math 70.6%a — 87%g — — — — 86%g — Four-year graduation rate 68.1%a 77.7%i 74%j 72.1%i 81.9%i 82.3%i 79.0%i 67.6%j 77.4%d,2 Single-year dropout rate (9–12) 4.8%a 1.6% i 3.7%j 4.0% i 2.8% i 0.7% i 0.7% i 3.6%j 6.7%d,2 Mean PSAT total score 110.8k 121.5l 118.0m — — — — — —

A-5
Student Performance Indicator
Clark County School District
Broward County
Houston ISD
Miami-Dade
County
Palm Beach County
Hills- Borough County
Orange County
Dallas ISD
San Diego
Unified PSAT participation rate3 81.6%n 81%o 88%p 82%o 83.3%o 86.8%o 81.8%o — — Mean SAT total score 1423q 1456o 1388r 1426o 1461o 1440o 1474o 1277r,2 1470d,2 SAT participation rate4 30.6%q 51%o 54%r 48%o 57%o 66%o 52%o 54.6%r,2 44.9%d,2 Mean ACT score 21.1s 18.6o 18.8r 17.5o 18.8o 19.3o 19.1o 17.1r,2 21.8d,2 ACT participation rate4 20.6%q 57%o 27%r 54%o 61%o 50%o 55%o 29.9%r,2 17.4%d,2 % AP exams scored 3–5 45.1%t 45.2%o 38%u 38.7%o 48.0%o 37.1%o 41.0%o 22.8%u 47.4%d,2 AP exam participation rate5 11.3%q 29.4%o 24%u 28.8%o 34.5%o 40.7%o 32.3%o 35.1%u 23.0%v,2
NAEP score, Grade 4, reading6 211 (NV)w — 211x 221x — — — — 213x NAEP score, Grade 4, math6 235 (NV)w — 236x 236x — — — — 236x NAEP score, Grade 8, reading6 254 (NV)w — 252x 261x — — — — 252x NAEP score, Grade 8, math6 274 (NV)w — 277x 273x — — — — 277x
1 Mean score for English language arts assessment. 2 Data from 2008–09. 3 Defined as the number of PSAT takers divided by the total number of sophomores. 4 For Nevada, Florida, and California, defined as the number of test takers divided by the number of seniors. For Texas, defined as the number of test takers who were graduates divided by the number of graduates. 5 Defined as the number of AP test takers divided by the number of students in Grades 10 to 12. 6 National Assessment of Educational Progress (NAEP) scores for the full state of Nevada are used as a proxy for CCSD; Houston ISD, Miami-Dade County, and San Diego Unified are part of the NAEP Trial Urban District Assessment. NAEP scores available for 2008–09.

A-6
Data Sources a From http://www.nevadareportcard.com b From http://schoolgrades.fldoe.org c From http://ritter.tea.state.tx.us/ayp/2010/index.html d From http://dq.cde.ca.gov/Dataquest e Weighted average of grade-level proficiencies for Grades 3 to 8 and 11, available at www.nevadareportcard.com f From http://fcat.fldoe.org/fcinfopg.asp g From http://ritter.tea.state.tx.us/cgi/sas/htmSQL/student.assessment/reporting/taksagg/index.hsql h Calculated from High School Proficiency Exam data 2009–10 (provided by CCSD) i From http://www.fldoe.org/eias/eiaspubs/xls/graddroprate0910.xls j From http://www.tea.state.tx.us/acctres/dropcomp/years.html k “Clark County School District Monitoring Report, E-2: Academic Achievement, 2009–10” (provided by CCSD) l From http://www.broward.k12.fl.us/sar/Releases.htm m From http://www.houstonisd.org/ResearchAccountability/Home/SP_PSAT/PSAT_2010.pdf n Calculated using sophomore participation from College Board, “District Integrated Summary 2009–2010, Clark
County School District” (provided by CCSD) o From http://www.fldoe.org/evaluation/act-sat-aparch.asp p From http://www.houstonisd.org/ResearchAccountability/Home/SP_PSAT/Reports/PSAT1011R.pdf q Calculated using number of students tested from “District Integrated Summary 2009–2010, Clark County School
District” (provided by CCSD) and enrollment data from CCD r Texas Education Agency, 2010, “College Admissions Testing of Graduating Seniors in Texas High Schools, Class of
2009, District and Campus Supplement,” available at http://www.tea.state.tx.us/acctres/sat_act_index.html s “American College Testing Program (ACT) Mean Scores” (provided by CCSD) t College Board, “District Integrated Summary 2009–10, Clark County School District” (provided by CCSD) u Texas Education Agency, 2011, “Advanced Placement and International Baccalaureate Examination Results in
Texas, 2009–10,” available at http://www.tea.state.tx.us/acctres/ap_ib_index.html v Calculated using number of students tested from “AP Exam Results Report” (available at http://dq.cde.ca.gov)
and enrollment data from CCD w From http://nces.ed.gov/nationsreportcard/naepdata x From http://nationsreportcard.gov/tuda.asp