Embed Size (px)
Citation preview
Education Statistics: Looking for а Case-study for Modelling
Liubov Panchenko[0000-0002-9979-0625] and Andrii Khomiak[0000-0002-6661-4510]
National Technical University of Ukraine “Igor Sikorsky Kyiv Polytechnic Institute”, 37 Peremohy Ave., Kyiv, 03056, Ukraine
[email protected], [email protected]
Abstract. The article deals with the problem of using modeling in social statistics courses. It allows the student-researcher to build one-dimensional and multidimensional models of the phenomena and processes that are being studied. Social Statistics course programs from foreign universities (University of Arkansas; Athabasca University; HSE University, Russia; McMaster University, Canada) are analyzed. The article provides an example using the education data set – Guardian UK universities ranking in Social Statistics course. Examples of research questions are given, data analysis for these questions is performed (correlation, hypothesis testing, discriminant analysis). During the research the discriminant model with group variable – modified Guardian score – and 9 predictors: course satisfaction, teaching quality, feedback, staff-student ratio, money spent on each student and other) was built. Lower student’s satisfaction with feedback was found to be significantly different from the satisfaction with teaching. The article notes the modeling and statistical analysis should be accompanied by a meaningful interpretation of the results. In this example, we discussed the essence of university ratings, the purpose of Guardian rating, the operationalization and measurement of such concepts as satisfaction with teaching, feedback; ways to use statistics in education, data sources etc. with students. Ways of using this education data in group and individual work of students are suggested.
Keywords: education statistics, Social Statistics courses, Guardian methodology, university score, Excel, SPSS, correlation, hypothesis testing, discriminant analysis
1 Introduction
1.1 Setting of a problem
The modern world is characterized by the diversity of data circulating in society and waiting to be researched [1-3]. The European Digital Competence Framework for Citizens defines information and data literacy as important component of digital competence [2]. The Program for the Development of National Statistics by 2023 [3], adopted by the Cabinet of Ministers of Ukraine (Resolution No. 222 of February 27, 2019), states, in particular, that the level of statistical literacy of the society needs to be
Copyright © 2020 for this paper by its authors. Use permitted under Creative Commons License Attribution 4.0 International (CC BY 4.0).

improved. Therefore, training of the specialists who can make data-based decisions is an important task of both national and international education. One of the important aspects of such training is the formation of student’s competences in building statistics models for studying social phenomena.
The aim of the article, based on the data sets from Guardian UK university ranking show steps for building one-dimensional and multidimensional models in education statistics.
1.2 Analysis of recent research and publications
Researchers who have studied various aspects of statistical (data) literacy are: Iddo Gal, Ellen Mandinach, Chantel Ridsdale, Siu-Ming Tam, Nigel Cross, W. Pat Taylor, Anthony M. Townsend, Jane M. Watson, Rosemary A. Callingham, Robert Gould, Ruth Krumhansl, Catherine D’Ignazio, Rahul Bhargava, William Finzer [4].
Many scholars are interested in the problems that arise in teaching statistics and data analysis. The study of Svetlana Tishkovskaya and Gillian Lancaster [5] summarizes the list of such problems. The main problems are the following:
─ Focus on mathematical and mechanical aspects of knowledge. ─ “Math-phobia”, “statistical anxiety” and lack of interest. ─ Shortage of students with basic statistical knowledge. ─ Statistics courses are conducted without reference to the subject area. ─ Lack of statistical literacy and inability of students to use statistics in daily life. ─ Lack of tools for assessing statistical thinking and statistical literacy of the
population in social settings.
To overcome these problems, the following strategies are proposed based on the analysis of [5]:
─ Integration of statistical thinking and statistical literacy into curricula of different disciplines;
─ Use of media and newspaper articles to evaluate students ‘and students’ ability to interpret statistical thinking.
─ Shifting the focus of statistics into curricula from mathematical calculations to tasks of a practical nature.
─ Problem solving skills development: students are offered open problems and the teacher takes on the role of a “facilitator” in the learning process.
─ Using real life examples in project work. ─ Development of student motivation strategies. ─ Development of statistical literacy and critical thinking skills, use of examples of
incorrect analysis. ─ Focus on daily arguments that use statistics as evidence.
In [4] new forms of student’s activity related to data analysis introduced by academics and practitioners are discussed: building art objects and storytelling based on data;

shared data collection by citizens through mobile devices, “play with data” using modern data visualization services.
The different problem of computer modeling in education are summarized by Ukrainian scientists in framework of CoSinE-2019 workshop. Serhiy O. Semerikov and other studied computer simulation of neural networks using spreadsheets [6]; Oleksandr H. Kolgatin and other discussed about computer simulation as a method of learning research in computational mathematics [7]; Vladimir N. Soloviev and other presented report of modeling of cognitive process using complexity theory methods [8].
The issues of preparing sociology students and future PhDs to use statistics models during analysis social statistics data are debated in papers [9-12].
2 Results of the study
During our research we analyzed several Social Statistics course programs from foreign universities [13-17].
In the research University of Arkansas at Little Rock the SOCI-3381 course is taught to Sociology majors [13]. The course deals with basic statistical techniques and their theoretical premises, which are often used in statistical reasoning in sociology: qualitative variables, characteristics of attributes, variation, correlation, tests of significance. Course consists of three credit hours.
The course Sociology 301: Social Statistics by the Athabasca University provides an overview of the uses of statistical analyses for the social sciences. The textbook for this course is [18]. Course consists of 11 units [14]:
─ Introduction to Statistics and Displaying Information in Tables and Graphs ─ Measures of Central Tendency and Variability ─ Correlation and Prediction ─ Some Key Ingredients for Inferential Statistics: The Normal Curve, Sample versus
Population, and Probability ─ Introduction to Hypothesis Testing ─ Hypothesis Tests with Means of Samples ─ Making Sense of Statistical Significance ─ Introduction to the t Test ─ The t Test for Independent Means ─ Introduction to the Analysis of Variance ─ Chi-Square Tests
The learning goals of the Economic and Social Statistics Course of HSE University (Russia) [15] is understanding basic principles of collecting and using data from various statistical sources; familiarization with main statistical indicators used in different fields of social science; introduction to basic programming tools in STATA programming package. The course covers the following topics: a short introduction into principles of collecting and using data from various data sources; data sources on six topics which include: labor market, household welfare, poverty and inequality, health, education and economic development.

Sociology 6Z03 is an introductory Social Statistics course by the McMaster University, Canada [16]. The principal goal of this course is to introduce students to the fundamentals of statistical reasoning and to the role of statistical methods in social research. At the end of the course students should be able to read sociological research that uses basic statistical methods; to undertake elementary data analysis; and to take more advanced courses in Social Statistics. The textbook for the course is [19]. Course objectives are:
─ Conduct univariate, bivariate, and introductory multivariate analyses and choose an appropriate analytical technique depending on the levels of measurement of variables of student’s interest.
─ Design a quantitative research project and write a research paper that can be presented in an academic sociology conference (e.g. Canadian Sociological Association annual meetings).
─ Operationalize concepts and social phenomena of student’s interest and to derive hypotheses that can be tested using survey data.
─ Write syntax for managing data and conducting analysis using statistical software (SPSS or PSPP).
─ Download public use microdata and read the dataset on SPSS (or PSPP). ─ Analyze public use microdata (e.g. GSS, ISPP, Censuses) using relevant documents
(e.g. codebooks, data dictionaries, questionnaires). ─ Effectively present findings from data analysis using PSPP (or SPSS), Excel, and
PowerPoint. ─ Read and critique academic sociology journal articles that are using basic social
statistics.
Sociology 740 is a second (more advanced) Social Statistics course from McMaster University, Canada. This course focuses on regression analysis, linear models, and generalized linear models, such as logistic regression and Poisson regression. One of the goals of the course is to introduce students to modern statistical computing [17]. The textbooks for the course are [20-21].
Analysis of the courses programs allows making such conclusions. Most Western courses in Social Statistics are introductory statistics courses for sociology majors [13, 14, 16]. We see a slightly different approach in the domestic tradition, where Social Statistics courses are taught to students after taking the introductory course of mathematical and statistical methods. At National Technical University of Ukraine “Igor Sikorsky Kyiv Polytechnic Institute” Social statistics course is a second-year course for sociology majors. This course is preceded by a mathematical methods course (3 semesters), so there is every reason to use these methods when analyzing social statistics data in different areas of social life: education, health, labor, population and other.
An important problem in data analysis teaching is the formation of student’s motivation. One example of the formation of positive educational motivation, in our view, is the use of interesting data sets relevant to learner area. One of the most important sections of social statistics is education statistics. One of the main objectives

of the statistical study of education is the study of the state and development of educational institutions.
University rankings are a useful example of measurement in education statistics. There are many different methodology of universities rankings [13]. In looking for data for our case-study, we settled on the UK experience. Each year, three national university rankings are published there. They are: The Complete University Guide [14-15], The Guardian [16] and the guide jointly published by The Times and The Sunday Times. The primary aim of these rankings is to inform potential undergraduate applicants about UK universities based on a range of criteria.
Consider how you can use the Guardian ranking in teaching the analysis of educational statistics. First, you can show students, by way of example, how to retrieve raw data from web pages and then prepare them for analysis.
So, first, we recommend that students go to the following page: https://www.theguardian.com/education/ng-interactive/2019/jun/07/university-league-tables-2020.
The variables that students see in the table have the following explanation:
1. Guardian ranking for this year 2. Guardian ranking for last year 3. Name of university 4. The Guardian score, out of 100, is a rating of excellence based on a combination of
all the other factors 5. Course satisfaction: the rating for the overall quality of the course, given by the
final-year students in the latest National Student Survey (NSS) 6. Teaching quality: the rating for the quality of teaching on the course, given by the
final-year students in the NSS 7. Feedback: the rating for the quality of feedback and assessment, given by the final-
year students in the NSS 8. Staff-student ratio: the number of students per member of teaching staff 9. Spend per student: money spent on each student, excluding academic staff costs,
given as a rating out of 10 10. Average entry tariff: typical Ucas scores of young entrants (under 21) to the
department 11. Value-added score: this compares students’ degree results with their entry
qualifications, to show how effectively they are taught. It is given as a rating out of 10.
12. Career after six months: percentage of graduates who find graduate-level jobs, or are in further study at professional or HE level, within six months of graduation. It reflects how good the university is at employability.
13. Continuation rate: the percentage of first-year students continuing to second year [16].
The next step is to read the data and transfer it to Excel. The following steps can be followed:
First step: open Excel.

Second step: select Data > From Web. Enter the url of the web-page in the address box of the From Web window, select “Table 0” object, click Transform Data and edit data types in Power Query Editor. Then click Close & Load (Fig. 1).
Fig. 1. Retrieve web page data

This is what the raw data sheet looks like (Fig. 2).
Fig. 2. Raw data
The next, third step is to remove everything from this data sheet, to leave only the data for 121 universities; it is advisable to use sorting by column 2020.
Fig. 3. Data sorting
The fourth step is to change the semicolon in all columns that contain non-integers. As a result (Fig. 4), we get the following table (showing a fragment for 20 universities).
The students then save the file, create a similar file in SPSS, and analyze the data. In the experiment we conducted, the students worked in pairs, they had to put
forward three statistical hypotheses regarding the data and test them. An analysis of students’ work showed that they used correlation confidently and be able to construct a scatterplot; two groups of students conducted cluster analysis, all group used
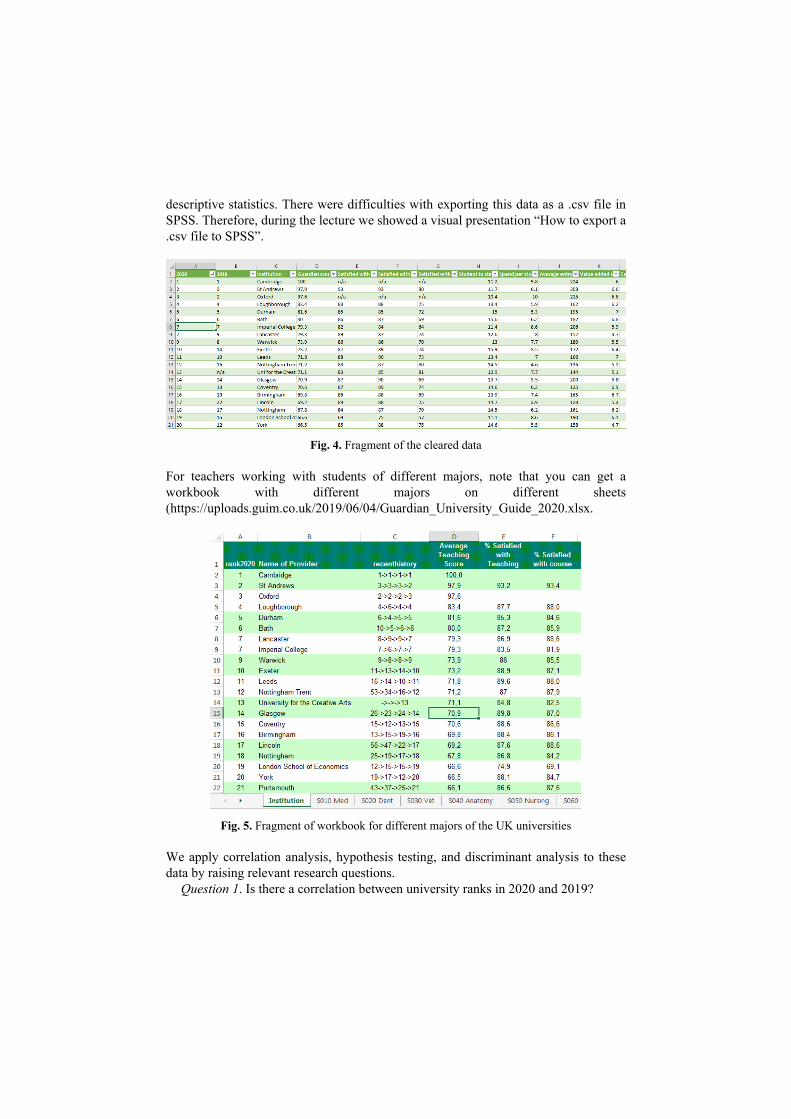
descriptive statistics. There were difficulties with exporting this data as a .csv file in SPSS. Therefore, during the lecture we showed a visual presentation “How to export a .csv file to SPSS”.
Fig. 4. Fragment of the cleared data
For teachers working with students of different majors, note that you can get a workbook with different majors on different sheets (https://uploads.guim.co.uk/2019/06/04/Guardian_University_Guide_2020.xlsx.
Fig. 5. Fragment of workbook for different majors of the UK universities
We apply correlation analysis, hypothesis testing, and discriminant analysis to these data by raising relevant research questions.
Question 1. Is there a correlation between university ranks in 2020 and 2019?

We obtained a significant correlation at the level of 0,001; Spearman correlation coefficient is 0,940 and Kendall’s coefficient is 0,803. That is, university rankings are consistent. Universities that have improved and worsened their ranks should be considered separately.
Fig. 6. Scatter diagram. Correlation between university ranks in 2020 and 2019
We also found a positive correlation between course satisfaction and satisfaction with teaching: Pearson correlation coefficient is 0,871 and it is significant at the level of 0,001. Similarly, we also found a positive correlation between learning satisfaction and feedback satisfaction; Pearson’s correlation coefficient is 0,544 and is significant at 0,001.
Question 2. The next research question is whether the average satisfaction with teaching and the average satisfaction with feedback differ. To answer this question, students can use a Paired Student Test to compare the mean of the two groups
Fig. 7. Paired Samples Test

We can observe that these differences will be significant at the level of 0,001; the Student’s Test value is 36.
Question 3. The next question is whether certain variables will be distributed normally. We use the Kolmogorov-Smirnov Test and construct a histogram with a curve of normal distribution.
Fig. 8. Kolmogorov-Smirnov test
We see that the Kolmogorov-Smirnov criterion indicates a significant difference in distribution from normal for these variables.
Fig. 9. The histogram with a curve of normal distribution for “satisfied with course”

We show how multidimensional methods can be applied to this data, including discriminant analysis. To do this, we introduce new variable with gradations: 1) a low-ranking university, 2) a high-ranking university. These include the first group – universities whose Guardianscore100, below the median; the second group – universities whose Guardianscore100, higher the median.
The median for the Guardianscore100 variable is 53,3. We then transcoded the Guardianscore100 into a new Guardiangroup variable, and received a frequency distribution. The first group included 61 universities, the second 60 (50,4% and 49,6% respectively).
Fig. 10. Frequency distribution by Guardiangroup
We then constructed a discriminant model using the Guardiangroup variable as a group variable and the other variables as the predictors. A linear discriminant analysis was conducted using 9 predictors – independent variables: who defined the affiliation of the university to one of two groups: low-ranking, high-ranking. To determine the coefficients of the discriminant function, a direct method was used in which the discriminant function was calculated with all predictors simultaneously entered. In this case, each independent variable is taken into account.
The Fig. 12 shows group statistics and Fig. 11 – the results of the test about significantly different variables in each group. For this purpose, Wilks-Lambda test value are given and a simple ANOVA is applied. One-way ANOVA showed that groups differ significantly by all variables, except “satisfied with feedback” (at 0,001 level).
Fig. 11. Tests of Equality of Group Means
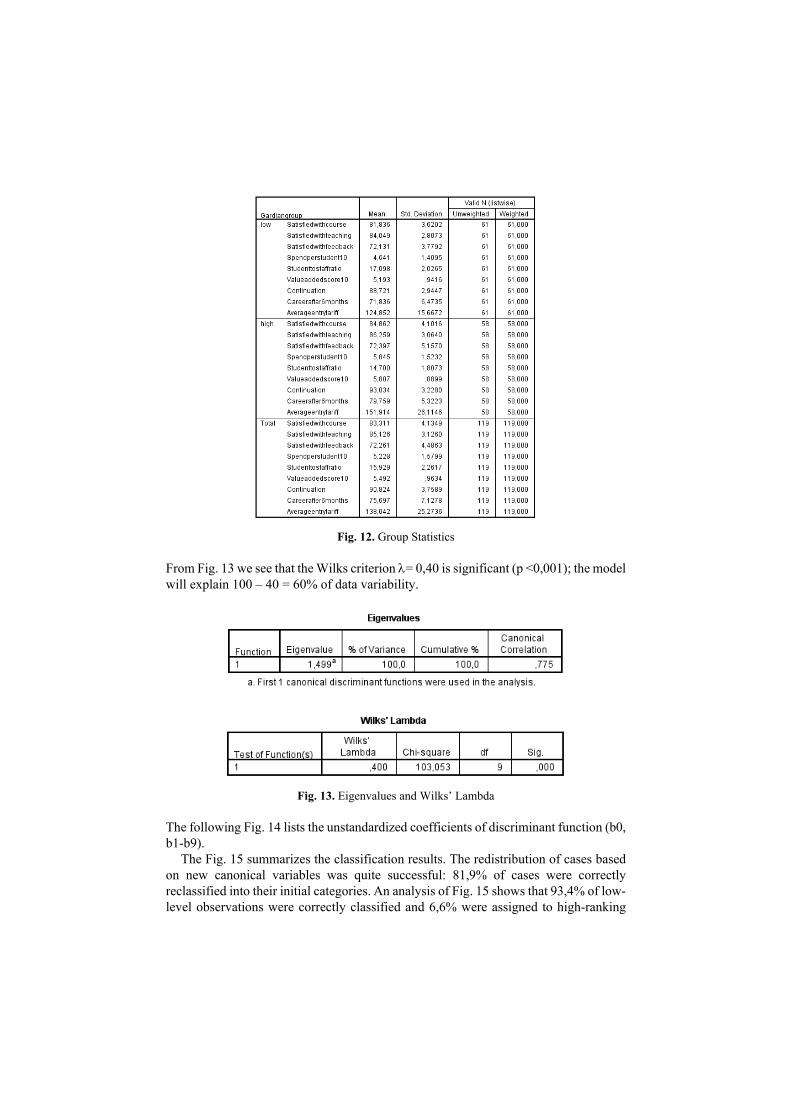
Fig. 12. Group Statistics
From Fig. 13 we see that the Wilks criterion = 0,40 is significant (p <0,001); the model will explain 100 – 40 = 60% of data variability.
Fig. 13. Eigenvalues and Wilks’ Lambda
The following Fig. 14 lists the unstandardized coefficients of discriminant function (b0, b1-b9).
The Fig. 15 summarizes the classification results. The redistribution of cases based on new canonical variables was quite successful: 81,9% of cases were correctly reclassified into their initial categories. An analysis of Fig. 15 shows that 93,4% of low-level observations were correctly classified and 6,6% were assigned to high-ranking

universities. 84,5% of high-level observations were attributed to their group while 15,5% were attributed to the low-rated group.
Fig. 14. The unstandardized coefficients of discriminant function
Fig. 15. Classification results
Note that the statistical analysis should be accompanied by a meaningful interpretation of the results. In this example, we discussed the essence of university ratings, the purpose of these ratings being a guide for the future applicants and their parents, the operationalization and measurement of such concepts as satisfaction with teaching and feedback; ways to use statistics in education, data sources, etc.
The ability to visualize and interpret visual representations is one of the important parts of modeling training. In our course students were using the Education at a Glance infographic [26] for analysis and interpretation, as well as samples for visualizing data in student’s course papers.
3 Conclusions and perspectives of further research
Measurements that are used in modern education statistics are becoming more and more complex. Modeling methodology helps determine the effectiveness of educational innovations in different educational contexts, and study phenomena in their interrelations; understand the influence of latent factors, develop systemic thinking.
The education statistics section in Social Statistics course provides extensive material for training data literate students. The datasets of Universities rankings can be

used in the educational process both for constructing one-dimensional models, and for constructing multidimensional models: cluster, discriminant. A Guardian ranking is accessible, open and contains criteria that are easily understood by students. Also, it is possible to conduct comparative studies with the different university majors.
As our experience shows, such data can be used in various ways. The teacher can formulate various research questions for groups of students and organize the group work; the teacher can conduct module tests on this data set, offering everyone different questions; but the best (while more difficult) way is to ask students to formulate their own questions and get answers to them. Moreover, Guardian ranking methodology can be studied in detail [25].
During this research the discriminant model of Guardian score was built. We were using the Guardiangroup variable as a group variable and the other variables as the predictors. A linear discriminant analysis was conducted using 9 predictors – independent variables that defined the affiliation of the university to one of two groups: low-ranking, high-ranking.
Further development of work in this direction is the creation and study structural equations model [27-28] with data set of migration statistics.
References
1. Ridsdale, C., Rothwell, J., Smit, M., Ali-Hassan, H., Bliemel, M., Irvine, D., Kelley, D., Matwin, S., Wuetherick, B.: Strategies and Best Practices for Data Literacy Education: Knowledge Synthesis Report. Dalhousie University (2015). doi:10.13140/RG.2.1.1922.5044
2. The Digital Competence Framework 2.0. https://ec.europa.eu/jrc/en/digcomp/digital-competence-framework (2019). Accessed 30 Dec 2019
3. Prohrama rozvytku derzhavnoi statystyky do 2023 roku. Postanova KMU vid 27.02.2019 r. No 222. (Program for the development of national statistics until 2023. CMU Resolution of 27.02.2019). https://zakon.rada.gov.ua/laws/show/222-2019-%D0%BF#n10 (2019). Accessed 30 Dec 2019
4. Panchenko, L.F.: Hramotnist v haluzi danykh: vyznachennia pidkhody, napriamky formuvannia (Data Literacy: Definitions, Approaches, Formation Directions). Visnyk Natsionalnoho tekhnichnoho universytetu Ukrainy “Kyivskyi politekhnichnyi instytut”. Politolohiia. Sotsiolohiia. Pravo 3(43), 118–127 (2019)
5. Tishkovskaya, S., Lancaster, G.: Teaching strategies to promote statistical literacy: review and implementation. In: Reading, C. (ed.) ICOTS 8 proceedings: International Conference on Teaching Statistics 2010 Ljubljana, Slovenia. International Association for Statistical Education, Auckland, New Zealand (2010)
6. Semerikov, S.O., Teplytskyi, I.O., Yechkalo, Yu.V., Markova, O.M., Soloviev, V.N., Kiv, A.E.: Computer Simulation of Neural Networks Using Spreadsheets: Dr. Anderson, Welcome Back. In: Ermolayev, V., Mallet, F., Yakovyna, V., Kharchenko, V., Kobets, V., Korniłowicz, A., Kravtsov, H., Nikitchenko, M., Semerikov, S., Spivakovsky, A. (eds.) Proceedings of the 15th International Conference on ICT in Education, Research and Industrial Applications. Integration, Harmonization and Knowledge Transfer (ICTERI, 2019), Kherson, Ukraine, June 12-15 2019, vol. II: Workshops. CEUR Workshop Proceedings 2393, 833–848. http://ceur-ws.org/Vol-2393/paper_348.pdf (2019). Accessed 30 Jun 2019
7. Bilousova, L.I., Kolgatin, O.H., Kolgatina, L.S.: Computer Simulation as a Method of Learning Research in Computational Mathematics. In: Ermolayev, V., Mallet, F., Yakovyna, V., Kharchenko, V., Kobets, V., Korniłowicz, A., Kravtsov, H., Nikitchenko, M., Semerikov, S., Spivakovsky, A. (eds.) Proceedings of the 15th International Conference on ICT in Education, Research and Industrial Applications. Integration, Harmonization and Knowledge Transfer (ICTERI, 2019), Kherson, Ukraine, June 12-15 2019, vol. II: Workshops. CEUR Workshop Proceedings 2393, 880–894. http://ceur-ws.org/Vol-2393/paper_209.pdf (2019). Accessed 30 Jun 2019
8. Soloviev, V.N., Moiseenko, N.V., Tarasova, O.Yu: Modeling of Cognitive Process Using Complexity Theory Methods. In: Ermolayev, V., Mallet, F., Yakovyna, V., Kharchenko, V., Kobets, V., Korniłowicz, A., Kravtsov, H., Nikitchenko, M., Semerikov, S., Spivakovsky, A. (eds.) Proceedings of the 15th International Conference on ICT in Education, Research and Industrial Applications. Integration, Harmonization and Knowledge Transfer (ICTERI, 2019), Kherson, Ukraine, June 12-15 2019, vol. II: Workshops. CEUR Workshop Proceedings 2393, 905–918. http://ceur-ws.org/Vol-2393/paper_356.pdf (2019). Accessed 30 Jun 2019
9. Panchenko, L., Chomiak, A.: Cloud technologies for training future sociologists of visualizing data of social and demographic statistics. Transactions Georgian Technical University. Automated Control Systems 2(26), 153–156 (2018)
10. Panchenko, L.F.: Training Sociology Students in Computer Analysis of Demographic Processes and Structure. Information Technologies and Learning Tools 65(3), 166–183 (2018). doi:10.33407/itlt.v65i3.2034
11. Panchenko, L.F., Khomiak, A.O., Pikilnyak, A.V.: Using Twitter in Ukrainian sociology majors training. In: Kiv, A.E., Shyshkina, M.P. (eds.) Proceedings of the 7th Workshop on Cloud Technologies in Education (CTE 2019), Kryvyi Rih, Ukraine, December 20, 2019, CEUR-WS.org, online (2020, in press)
12. Panchenko, L., Samovilova, N.: Secondary data analysis in educational research: opportunities for PhD students. In: Hamaniuk, V., Semerikov, S., Shramko, Y. (eds.) The International Conference on History, Theory and Methodology of Learning (ICHTML 2020). Kryvyi Rih, Ukraine, May 13-15, 2020. SHS Web of Conferences 75, 04005 (2020). doi:10.1051/shsconf/20207504005
13. SOCI-3381 Social Statistics - Online. University of Arkansas at Little Rock. https://ualr.edu/online/courses/soci-3381-social-statistics (2020). Accessed 9 Jun 2020
14. Social Statistics : Sociology 301 : Courses : Athabasca University. https://www.athabascau.ca/syllabi/soci/soci301.php (2013). Accessed 9 Jun 2020
15. Economic and Social Statistics, 2019/20 Academic year – Courses – Bachelor’s Programme in Sociology – HSE University. https://www.hse.ru/en/ba/soc/courses/292704072.html (2020). Accessed 9 Jun 2020
16. SOCIOLOGY 6Z03: Introduction to Social Statistic. https://sociology.mcmaster.ca/courses/introduction-to-social-statistics/fall-2018/@@display-file/outline_file/2018,%20Fall,%20SOCIOL%206Z03-C01,%20Kaida.pdf (2018). Accessed 9 Jun 2020
17. Sociology 740: Applications of Quantitative Methods. https://socialsciences.mcmaster.ca/jfox/Courses/soc740 (2014). Accessed 9 Jun 2020
18. Aron, A., Aron, E., Coup, E.: Statistics for the Behavioral and Social Sciences: A Brief Course, 5th edn. Pearson, London (2011)
19. Haan, M., Godley, J.: An Introduction to Statistics for Canadian Social Scientists. 3rd edition. Oxford University Press, Oxford (2017)
20. Fox, J.: Applied Regression Analysis and Generalized Linear Models, 2nd edn. Sage, Newbury Park (2008)

21. Fox, J., Weisberg, S.: An R Companion to Applied Regression, 2nd edn. Sage, Newbury Park (2011)
22. Kviiek, M.: Universytet u dobu peremin: instytutsii i akademichni kadry v umovakh zrostaiuchoi konkurentsii (University for a Change Day: Institutions and Academic Staff in a Growing Competition). Takson, Kyiv (2018)
23. University League Tables 2021. The Complete University Guide. https://www.thecompleteuniversityguide.co.uk/league-tables/rankings (2020). Accessed 21 Mar 2020
24. Complete University Guide - University Rankings, Guides and Courses. https://www.thecompleteuniversityguide.co.uk (2020). Accessed 21 Mar 2020
25. Hiely-Rayner, M.: Methodology behind the Guardian University Guide 2020. https://www.theguardian.com/education/2019/jun/07/methodology-behind-the-guardian-university-guide-2020. Accessed 21 Mar 2020
26. Education at a Glance 2019: OECD Indicators. https://www.oecd-ilibrary.org/education/education-at-a-glance-2019_f8d7880d-en (2019). Accessed 21 Mar 2020
27. Panchenko, L.F.: Modeliuvannia strukturnymy rivnianniamy yak instrument pedahohichnoho doslidzhennia (Modeling by structural equations as a tool for pedagogical research). Visn. Luhan. nats. un-tu imeni Tarasa Shevchenka: Pedahohichni nauky 18(277), 108–114 (2013)
28. Panchenko, L.F.: Methodology of Using Structural Equation Modeling in Educational Research. In: Ermolayev, V., Mallet, F., Yakovyna, V., Kharchenko, V., Kobets, V., Korniłowicz, A., Kravtsov, H., Nikitchenko, M., Semerikov, S., Spivakovsky, A. (eds.) Proceedings of the 15th International Conference on ICT in Education, Research and Industrial Applications. Integration, Harmonization and Knowledge Transfer (ICTERI, 2019), Kherson, Ukraine, June 12-15 2019, vol. II: Workshops. CEUR Workshop Proceedings 2393, 895–904. http://ceur-ws.org/Vol-2393/paper_411.pdf (2019). Accessed 30 Jun 2019