Embed Size (px)
Citation preview
Lesotho Government
Education Statistics Bulletin
2010
Planning Unit

i
LIST OF ACRONYMS ACL Anglican Church of Lesotho ADSE Advanced Diploma in Special Education AME African Methodist Episcopal BOS Bureau of Statistics CECE Certificate in Early Childhood Education COSC Cambridge Overseas School Certificate CWIQ Core Wealth Indicator Questionnaire DEP Diploma in Primary Education DTE Diploma in Technology Education DTEP Distance Teachers Education Programme ECCD Early Childhood Care and Development EFA Education For All EGIS Education Geographic Information System EMIS Education Management Information System FPE Free Primary Education GER Gross Enrolment Ratio/Rate GOL Government of Lesotho GPS Geographic Positioning Systems JC Junior Certificate LANFE Lesotho Association of Non-Formal Education LCE Lesotho College of Education LDS Lesotho Demographic Survey LEC Lesotho Evangelical Church LFS Labour Force Survey LP Lerotholi Polytechnic MOE Ministry of Education MOET Ministry of Education and Training NER Net Enrolment Ratio/Rate NCDC National Curriculum Development Centre NFE Non-Formal Education NUL National University of Lesotho PSLE Primary School Leaving Examination PTC Primary Teachers Certificate RCM Roman Catholic Church SEN Special Education Needs STC Secondary Teachers Certificate TVD Technical and Vocational Department TVET Technical and Vocational Education Training
UNESCO United Nations Education Science and Culture Organization
ii
Table of Contents Page List of Acronyms……………………………………………………………………………………………………………………..i
Table of contents……………………………………………………………………………………………………………………ii
List of Tables………………………………………………………………………………………………………………………….vi
List of Figures………………………………………………………………………………………………………………………..xi
Chapter 1
1.0 Introduction ................................................................................................................. 1
1.1 The Education System .................................................................................................. 1
1.2 Data Source and Quality ............................................................................................... 2
1.2.1 Source ................................................................................................................... 2
1.2.2 Quality ................................................................................................................... 2
Chapter 2 ............................................................................................................................ …3
2.0 Introduction………………………………………………………………………………………………………………….3
2.1 Enrolment ................................................................................................................. …3
Chapter 3 ............................................................................................................................... 4
Primary School Education………………………………………………………..................................................4
3.0 Introduction .............................................................................................................. …4
3.1 Enrolment in Registered Primary Schools........................................................................ 4
3.1.1 Accessibility of Education.................................................................................... …7
3.1.1.1 New Entrants in Registered Primary Schools .................................................... …7
3.1.1.2 Registered Primary Schools Apparent Intake Rates (AIR) and Net Intake Rates (NIR)9
3.1.2 Gender Parity Index in Registered Primary Schools ............................................. …9
3.1.3 Coverage of Participation in Primary Education ................................................ ...10
3.2 Disability in Registered Primary Schools...................................................................... 12
3.3 Orphan-hood in Registered Primary Schools ............................................................... 13
3.4 Inputs for Primary Education ...................................................................................... 14
3.4.1 Primary Schools ................................................................................................... 14
3.4.2 Teachers in Registered Primary Schools ............................................................... 16
3.5 Efficiency and Quality of Education........................................................................... ..17
iii
3.5.1 Repeaters in Registered Primary Schools ............................................................. 18
3.5.2 Primary School Leaving Examination (PSLE) Results .......................................... ..19
3.5.3 Transition Rates from Standard 7 to Form A ...................................................... ..20
3.5.4 Cohort Analysis .................................................................................................. ..21
Chapter 4 ........................................................................................................................... ..24
Secondary School Education .............................................................................................. ..24
4.0 Introduction ................................................................................................................. ..24
4.1 Enrolment in Registered Secondary Schools ............................................................. ..24
4.2 Trend Analysis of Registered Secondary Schools Enrolment ...................................... ..26
4.3 New Entrants in Registered Secondary Schools ......................................................... ..26
4.4 Coverage and Participation in Secondary Education ................................................. ..27
4.4.1 Gross and Net Enrolment Rates, Pupils to Teacher Ratios and the...................... ..27
Gender Parity Indices for Registered Secondary Schools ............................................. ..27
4.4.2 Registered Secondary Schools Age Specific Net Enrolment Rates ....................... ..28
4.5 Enrolment of Students with Special Educational Needs in Registered ....................... ..29
Secondary Schools ......................................................................................................... ..29
4.6 Orphans in Registered Secondary Schools ................................................................ ..30
4.7 Inputs for Secondary Education ................................................................................ ..30
4.7.1 Secondary Schools ............................................................................................. ..30
4.7.2 Secondary Schools Teachers .............................................................................. ..31
4.8 Efficiency and Quality of Education in Registered Secondary Schools ........................ ..32
4.8.1 Repeaters in Registered Secondary Schools ....................................................... ..33
4.8.2 Transition Rates from Form C to Form D .............................................................. 34
4.8.3 Examination Results .............................................................................................. ..35
4.8.3.1 Junior Certificate Examination ........................................................................ ..35
4.8.3.2 Cambridge Overseas School Certificate Examination Results ........................... ..36
Chapter 5 ........................................................................................................................... ..37
Technical and Vocational Training ...................................................................................... ..37
5.0 Introduction ............................................................................................................. ..37
5.1 Enrolment ................................................................................................................ ..37
5.2 Teaching Staff........................................................................................................... ..38
Chapter 6 ........................................................................................................................... ..39

iv
Tertiary Education.............................................................................................................. ..39
6.0 Introduction ............................................................................................................. ..39
6.1 National University of Lesotho .................................................................................. ..39
6.1.1 Enrolment ........................................................................................................... 39
6.1.2 Teaching Staff ...................................................................................................... 41
6.2 Lesotho College of Education...................................................................................... 42
6.2.1 Enrolment………………………………………………………………...............................................42 6.2.2 Graduates ............................................................................................................ 42
6.2.3 Teaching Staff ...................................................................................................... 43
6.3 Limkokwing University of Creative Technology ........................................................... 43
6.3.1 Enrolment................................................................................43 6.3.2 Teaching Staff .................................................................................................... ..44
6.4 National Health Training Centre ............................................................................... ..44
6.4.1 Enrolment ......................................................................................................... ..44
6.4.2 Graduates .......................................................................................................... ..45
6.4.3 Teaching Staff .................................................................................................... ..45
6.5 Lerotholi Polytechnic .................................................................................................. 46
6.5.1 Enrolment ........................................................................................................... 46
6.5.2 Graduates ............................................................................................................ 46
6.5.3 Teaching Staff ...................................................................................................... 47
6.6 Centre for Accounting Studies (CAS) ......................................................................... ..47
6.6.1 Enrolment ......................................................................................................... ..47
6.6.2 Graduates .......................................................................................................... ..48
6.6.3 Teaching Staff……………………………………………………………………………………………….………48 6.7 Lesotho Agricultural College (LAC) ............................................................................ ..49
6.7.1 Enrolment ......................................................................................................... ..49
6.7.2 Graduates .......................................................................................................... ..49
6.7.3 Teaching Staff .................................................................................................... ..50
6.8 Institute of Development Management (IDM) .......................................................... ..50
6.8.1 Enrolment ........................................................................................................... 59
Chapter 7 ........................................................................................................................... ..52
Non Formal Education (NFE) .............................................................................................. ..52
v
7.0 Introduction ............................................................................................................. ..52
7.1 Enrolment (Literacy and Numeracy) ......................................................................... ..52
7.2 Enrolment (Continuing education, JC and COSC) ....................................................... ..53
ANNEX I: Technical Notes ................................................................................................... ..54
ANNEX II: SUMMARY OF INDICATORS Primary Education Level .......................................... ..55
ANNEX III: Population projections ...................................................................................... ..57
ANNEX IV: General Information for Secondary schools 2003-2010 ..................................... ..58
ANNEX V: LESOTHO COLLEGE OF EDUCATION TOTAL ENROLMENT FROM 2005 TO 2010 ... ..59
vi
TABLES Title Early Childhood Care and Development (ECCD) Tables Table 2.1 Reception Class Enrolments and Number of Schools, 2006-2010 ... 3
Primary School Tables Table 3.1 Enrolment in registered primary schools by age, grade and gender, 2010 .............................................................................. 4 Table 3.2 Enrolment in registered primary schools by grade and gender, 2006-2010 ..................................................................... 5 Table 3.3 Enrolment in registered primary schools by district and gender, 2008- 2010 ................................................................... 6 Table 3.4 Enrolment in registered primary schools by district, ecological zones and gender, 2010 ............................................................. 7 Table 3.5 Number and percentages of new entrants in registered primary schools by district and gender, 2010 .............................................. 8 Table 3.6 Registered primary schools apparent and net intake rates, gender parity indices and gender, 2000-2010 ............................................. 9 Table 3.7 Registered primary schools gross and net enrolment rates and pupils to teacher ratios, 2000-2010............................................ 10 Table 3.8 Pupils enrolled in Registered Primary Schools by District Number of Teachers and the PTR............................................................................... 11 Table 3.9 Registered primary schools age specific net enrolment rates (NER), 2010 ........................................................................... 12 Table 3.10 Registered primary school enrolment of pupils with special educational needs by type, grade and gender, 2010 .................... 12 Table 3.11 Enrolment of orphans in registered primary schools by type of orphan hood, grade and gender, 2010 ......................................... 13 Table 3.12 Registered primary school total enrolment,
number of schools, number of teachers and percentage change in enrolment, 2001-2010 ................................................... 15

vii
Table 3.13 Number of registered primary schools by district and location, 2010 .......................................................................................... 16 Table 3.14 Number of teachers in registered primary schools by district and location, 201017 Table 3.15 Enrolment of repeaters in registered primary schools by district, location and gender, 2010 ........................................................... 19 Table 3.16 Primary school leaving examination results, 2002–2010 .............. 20 Table 3.17 Transition rates from standard 7 to form A, 2001-2010 ................ 21 Table 3.18 Enrolment and repeaters in primary schools by gender and cohort, 2001-2010............................................................................. 22 Secondary School Tables Table 4.1 Enrolment in registered secondary schools by age, form and gender, 2010 .............................................................................. 25 Table 4.2 Enrolment in registered secondary schools by district, location and gender, 2010 ............................................................. 25 Table 4.3 Enrolment in registered secondary schools by district, gender and percentage share per district, 2008-2010 ................... 26 Table 4.4 Secondary school enrolment rates, gender parity indices and pupils to teacher ratios, 2001-2010 ............................... 28 Table 4.5 Registered secondary schools age specific net enrolment rates (NER), 2010 ..................................................................... 29 Table 4.6 Enrolment of pupils with special educational needs in registered secondary schools by type, form and gender, 2010 ........................................................... 30 Table 4.7 Enrolment of orphans in registered secondary schools by type of orphan-hood, form and gender, 2010 .......................... 30 Table 4.8 Number of registered secondary schools by district and agency, 2010 ................................................................. 31 Table 4.9 Number of teachers in registered secondary schools by district and gender, 2010 ................................................................. 32
viii
Table 4.10 Enrolment of repeaters in registered secondary schools by agency, form and sex, 2010 ....................................... 33 Table4.11 Repeaters in registered secondary schools by district, location and gender, 2010 ........................................................... 34 Table 4.12 Transition rates from form C to form D, 2001-2010 ...................... 34 Table 4.13 Junior certificate examination results, 2002-2010 ......................... 36 Table 4.14 Cambridge overseas school certificate examination Results, 2002-2010 ................................................................................. 36 Technical and Vocational Training Tables Table 5.1 Technical and Vocational Enrolment by District and Gender, 2010 38 Table 5.2 Technical and Vocational Teaching Staff by District and Gender, 2010 .......................................................................... 38 Tertiary Education Tables Table 6.1 NUL Undergraduate Student Population (Part-time and Full-time) 1997/98-2009/10 ..................................... 39 Table 6.2 NUL Undergraduate Student Population By Sex (Full Time), 1997/98-2009/10............................................................................. 40 Table 6.3 Number of NUL Academic Staff by Faculty, Rank and Nationality, 2010 ............................................................................. 41 Table 6.4 Lesotho College of Education Enrolment by Course and Gender, 2010 ........................................................................... 42 Table 6.5 Lesotho College of Education Graduates by Course and Year, 2007-2010 ...................................................................... 42 Table 6.6 Lesotho College of Education Teaching Staff by Department and Gender, 2010 ........................................................................... 43 Table 6.7 Limkokwing University of Creative Technology Enrolment by Faculty and Gender, 2010 .............................................................. 43 Table 6.8 Limkokwing University of Creative Technology Academic

ix
Staff by Faculty, Nationality and Gender, 2010 ............................... 44 Table 6.9 National Health Training Centre Enrolment by Programme and Gender, 2010 ........................................................................... 44 Table 6.10 National Health Training Centre Graduates by Programme and Gender, 2008-2010 .................................................................. 45 Table 6.11 National Health Training Centre Teaching Staff by Department and Gender, 2010 ..................................................... 45 Table 6.12 Lerotholi Polytechnic Enrolment by Course and Gender, 2010 ................................................................................ 46 Table 6.13 Lerotholi Polytechnic Graduates by Department, 2008-2010 ....... 47 Table 6.14 Lerotholi Polytechnic Teaching Staff by Department 2008-2010 ................................................................. 47 Table 6.15 Centre for Accounting Studies Enrolment by Course and Gender, 2008-2010....................................................................... 48 Table 6.16 Centre for Accounting Studies Graduates by Course and Gender, 2009-2010....................................................................... 48 Table 6.17 Centre for Accounting Studies Teaching Staff by Course and Gender, 2008-2010....................................................................... 49 Table 6.18 Lesotho Agricultural College Enrolment by Course and Gender, 2009-2010....................................................................... 49 Table 6.19 Lesotho Agricultural College Graduates by Course, 2008-210 ..... 50 Table 6.20 Lesotho Agricultural College Teaching Staff by Department And Gender, 2010 ........................................................................ 50 Table 6.21 Institute of Development Management (IDM) Enrolment by Programme and Gender, 2010 ..................................................... 51 Table 6.22 Tertiary Enrolment, Graduates and Academic Staff by Gender, 2010 ................................................................................ 51

x
Non Formal Education Tables Table 7.1 Number of Literacy and Numeracy Learners, Books and Learning Posts, 2010 .............................................................. 53 Table 7.2 Number of Learners Enrolled in JC and COSC Programmes, 2010 ......................................................................... 53
xi
FIGURES Title Page Figure 3.1 Number of new entrants in registered primary schools by age and gender, 2010 ................................................................. 8 Figure 32 Enrolment of orphans by type of orphan-hood, sex and grade, 2010............................................................................ 14 Figure 3.3 Percentage distributions of registered primary schools by agency, 2010 ................................................................................ 15 Figure 3.4 Number of repeaters by age, chosen levels and sex, 2010 ................................................................................ 18 Figure 4.1 Number of new entrants in registered secondary schools by age and gender, 2010 .............................................................. 27 Figure 4.2 Percentage distributions of registered secondary schools by ecological zones, 2010 ............................................................ 31 Figure 6.1 Enrolment of NUL Undergraduates by Faculty, 2009 .................... 41

1
Chapter 1 1.0 Introduction
Lesotho is envisaged to improve access, equity and quality in all levels of education as one of the major strategies to enhance its economic growth. The need for accurate, detailed, timely and relevant education statistics cannot be overemphasized. Thus, Education Management Information System (EMIS) produces the report that provides such appropriate statistical information for evidence-based decision making. 1.1 The Education System Educational programs in Lesotho are classified into five levels; pre-primary or kindergarten, elementary or primary school, Secondary education includes junior and senior secondary school, Post secondary (vocational and technical schools) and Tertiary or Higher education. Pre-primary education – At this level children are to acquire the cognitive, motor and communicative skills needed for primary school, and to prepare them emotionally and behaviorally, so that they can achieve their full potential at all levels of the education system. Pre-school education also makes it easier for mothers to participate in the labour market, increases their mobility and enhances their opportunities for life-long learning.
Primary education or elementary education - is preceded by preschool and is followed by secondary education. The major goals of primary education are achieving basic literacy and numeracy amongst all pupils, as well as establishing foundations in science, geography history, math, and other social sciences.
Children are usually placed in classes with one teacher who is primarily responsible for their education and welfare for that year. The continuity with a single teacher and the opportunity to build up a close relationship with the class is a notable feature of the primary education system.
Secondary education - is the stage of education following primary school. In Lesotho it usually takes five years and is attended by students between the ages of 13 and 17. Secondary school teachers help students look more deeply into subjects introduced in elementary school and expose them to more information about the world. Secondary school teachers specialize in a specific subject, such as English, mathematics, history, or biology. They also may teach subjects as career and technical or career-technology. In some schools they also teach some basics in computer skills.
Vocational Training - equips a person for a specific trade or profession. Vocational training may lead to a recognized vocational degree, or it may form part of in-company employee development. It might take the form of a short course, practical training, or part-time or full-time study at a college or university.
2
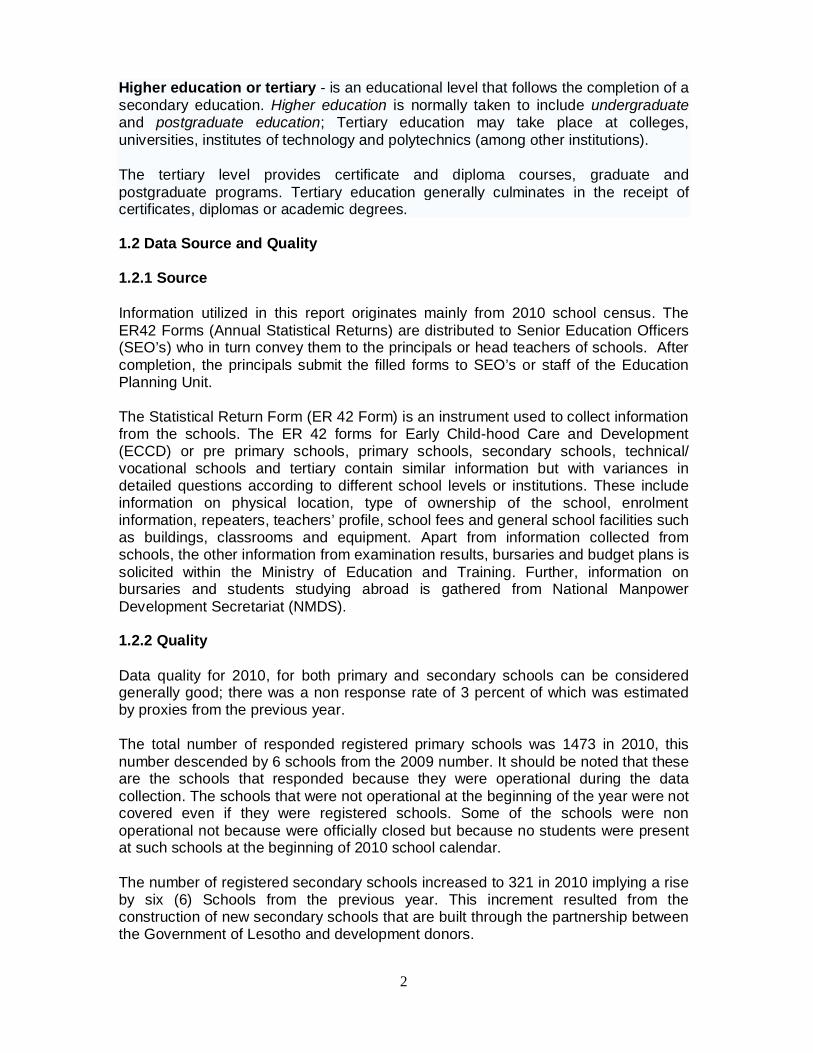
Higher education or tertiary - is an educational level that follows the completion of a secondary education. Higher education is normally taken to include undergraduate and postgraduate education; Tertiary education may take place at colleges, universities, institutes of technology and polytechnics (among other institutions).
The tertiary level provides certificate and diploma courses, graduate and postgraduate programs. Tertiary education generally culminates in the receipt of certificates, diplomas or academic degrees.
1.2 Data Source and Quality 1.2.1 Source Information utilized in this report originates mainly from 2010 school census. The ER42 Forms (Annual Statistical Returns) are distributed to Senior Education Officers (SEO’s) who in turn convey them to the principals or head teachers of schools. After completion, the principals submit the filled forms to SEO’s or staff of the Education Planning Unit. The Statistical Return Form (ER 42 Form) is an instrument used to collect information from the schools. The ER 42 forms for Early Child-hood Care and Development (ECCD) or pre primary schools, primary schools, secondary schools, technical/ vocational schools and tertiary contain similar information but with variances in detailed questions according to different school levels or institutions. These include information on physical location, type of ownership of the school, enrolment information, repeaters, teachers’ profile, school fees and general school facilities such as buildings, classrooms and equipment. Apart from information collected from schools, the other information from examination results, bursaries and budget plans is solicited within the Ministry of Education and Training. Further, information on bursaries and students studying abroad is gathered from National Manpower Development Secretariat (NMDS). 1.2.2 Quality Data quality for 2010, for both primary and secondary schools can be considered generally good; there was a non response rate of 3 percent of which was estimated by proxies from the previous year. The total number of responded registered primary schools was 1473 in 2010, this number descended by 6 schools from the 2009 number. It should be noted that these are the schools that responded because they were operational during the data collection. The schools that were not operational at the beginning of the year were not covered even if they were registered schools. Some of the schools were non operational not because were officially closed but because no students were present at such schools at the beginning of 2010 school calendar. The number of registered secondary schools increased to 321 in 2010 implying a rise by six (6) Schools from the previous year. This increment resulted from the construction of new secondary schools that are built through the partnership between the Government of Lesotho and development donors.
3
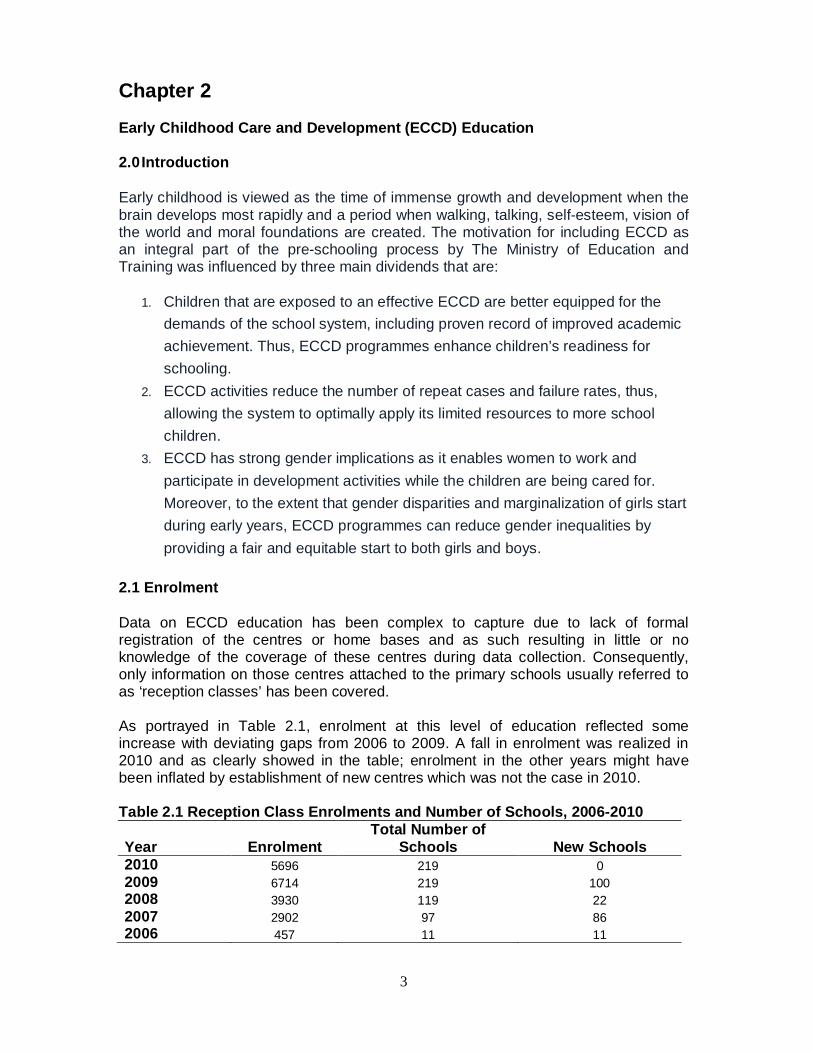
Chapter 2 Early Childhood Care and Development (ECCD) Education 2.0 Introduction Early childhood is viewed as the time of immense growth and development when the brain develops most rapidly and a period when walking, talking, self-esteem, vision of the world and moral foundations are created. The motivation for including ECCD as an integral part of the pre-schooling process by The Ministry of Education and Training was influenced by three main dividends that are:
1. Children that are exposed to an effective ECCD are better equipped for the demands of the school system, including proven record of improved academic achievement. Thus, ECCD programmes enhance children’s readiness for schooling.
2. ECCD activities reduce the number of repeat cases and failure rates, thus, allowing the system to optimally apply its limited resources to more school children.
3. ECCD has strong gender implications as it enables women to work and participate in development activities while the children are being cared for. Moreover, to the extent that gender disparities and marginalization of girls start during early years, ECCD programmes can reduce gender inequalities by providing a fair and equitable start to both girls and boys.
2.1 Enrolment Data on ECCD education has been complex to capture due to lack of formal registration of the centres or home bases and as such resulting in little or no knowledge of the coverage of these centres during data collection. Consequently, only information on those centres attached to the primary schools usually referred to as ‘reception classes’ has been covered. As portrayed in Table 2.1, enrolment at this level of education reflected some increase with deviating gaps from 2006 to 2009. A fall in enrolment was realized in 2010 and as clearly showed in the table; enrolment in the other years might have been inflated by establishment of new centres which was not the case in 2010. Table 2.1 Reception Class Enrolments and Number of Schools, 2006-2010
Year Enrolment Total Number of
Schools New Schools 2010 5696 219 0 2009 6714 219 100 2008 3930 119 22 2007 2902 97 86 2006 457 11 11

4
Chapter 3 Primary School Education 3.0 Introduction
At the 1990 World Conference on Education for All (WCEFA), the government fully endorsed the Education for All (EFA) principle determined to offer basic education for a certain caliber, and the government continues to rely on that EFA principle as a guide in shaping current policy and action. Free Primary Education (FPE) in Lesotho originated in 2000 when the government commenced the implementation of free primary education policy. The policy abolished school fees on annual incremental basis starting with grade one in 2000 until 2006 when all the primary grades had no school fees. Therefore, 2006 was the final year of implementation of free primary education policy in Lesotho. 3.1 Enrolment in Registered Primary Schools
Enrolment in primary schools increased dramatically, from 364951 in 1999 to 410745 in 2000 emanating from introduction of Free Primary Education (FPE) in 2000. Enrolment continued to rise and reached a climax in 2003 with the number of pupils amounting to 429,720. A slight decline was noticed thereafter as enrolment fell by 0.6 percent in 2004 and by a further 1.1 percent in 2005. An appreciation in enrolment of 0.6 percent in 2006 was followed by a continuous down turn in enrolment from 2007 to 2010 (dropping on annual basis by 5.6, 1.2, 1.7 and 0.2 percent respectively). Depicted in Table 3.1 above is the similar scenario as observed in the previous year whereby males’ enrolment from grade 1 to grade 4 was higher than that of females,
Table 3.1 Enrolment in Registered Primary Schools by Age, Grade and Gender- 2010 Age
Standard 1
Standard 2
Standard 3
Standard 4
Standard 5
Standard 6
Standard 7
Total M F M F M F M F M F M F M F
below 6 2188 2304 0 0 0 0 0 0 0 0 0 0 0 0 4492
6 16770 15858 546 753 0 0 0 0 0 0 0 0 0 0 33927
7 11499 9401 7839 9442 550 843 0 0 0 0 0 0 0 0 39574
8 4581 2809 9646 9049 4986 7183 361 755 0 0 0 0 0 0 39370
9 1732 971 6580 4568 7551 8331 3320 5545 309 694 0 0 0 0 39601
10 896 392 4036 2249 7198 5679 6038 7870 2446 4817 284 761 0 0 42666
11 364 138 1803 808 4821 2862 6239 5793 4325 6804 1988 4100 281 731 41057
12 174 82 906 296 2784 1336 5188 3546 5101 5575 3573 6124 1620 3671 39976
13 92 24 422 136 1572 643 3787 1957 4638 3752 4006 5265 3046 5596 34936
14 50 15 209 58 819 268 2491 1073 3944 2351 4351 4128 3675 5385 28817
15 16 7 93 33 360 123 1262 528 2664 1247 3502 2618 3636 4158 20247
16 12 2 39 23 183 66 592 220 1335 679 2370 1592 3101 2783 12997
17 1 2 11 4 51 29 202 96 536 262 1165 558 1956 1341 6214
18 1 2 5 2 21 6 76 36 223 130 536 249 1072 580 2939
19 1 0 4 2 10 11 44 10 92 53 197 79 411 223 1137
20 3 2 1 1 9 2 13 5 46 15 87 19 151 80 434
higher 20
3 1 1 0 4 3 15 4 24 6 42 25 108 61 297
Total 38383 32010 32141 27424 30919 27385 29628 27438 25683 26385 22101 25518 19057 24609 388681
5
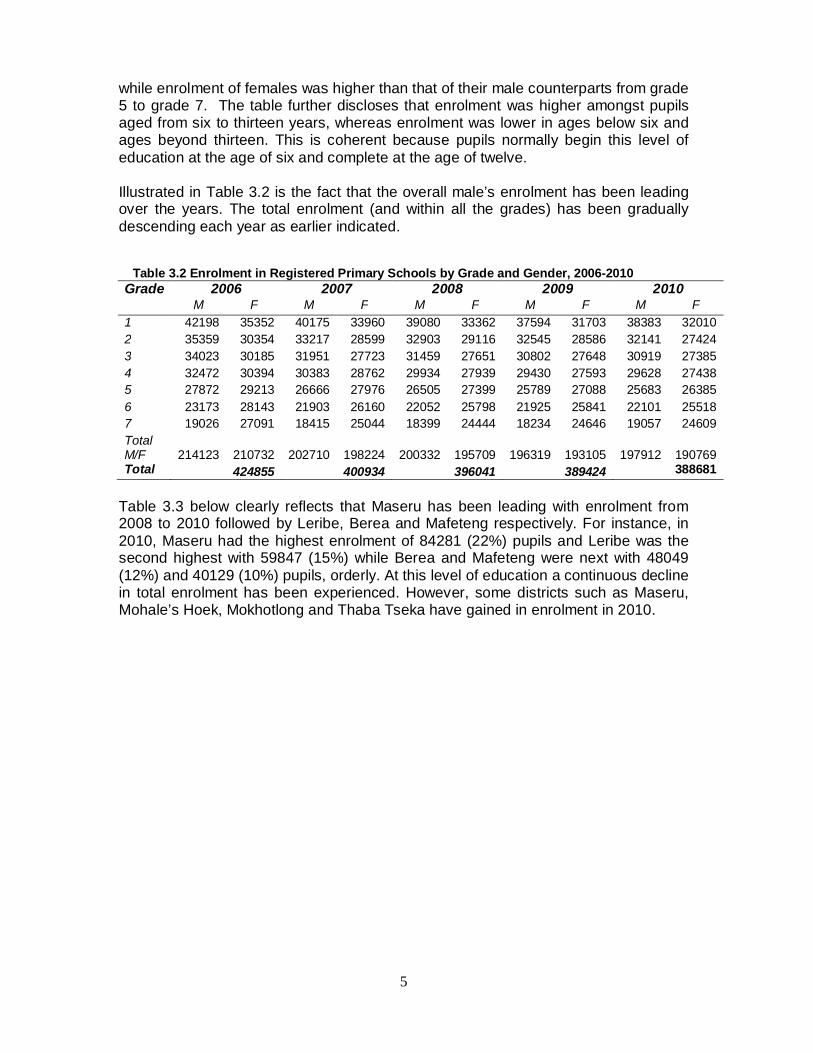
while enrolment of females was higher than that of their male counterparts from grade 5 to grade 7. The table further discloses that enrolment was higher amongst pupils aged from six to thirteen years, whereas enrolment was lower in ages below six and ages beyond thirteen. This is coherent because pupils normally begin this level of education at the age of six and complete at the age of twelve. Illustrated in Table 3.2 is the fact that the overall male’s enrolment has been leading over the years. The total enrolment (and within all the grades) has been gradually descending each year as earlier indicated. Table 3.2 Enrolment in Registered Primary Schools by Grade and Gender, 2006-2010 Grade 2006 2007 2008 2009 2010
M F M F M F M F M F 1 42198 35352 40175 33960 39080 33362 37594 31703 38383 32010 2 35359 30354 33217 28599 32903 29116 32545 28586 32141 27424 3 34023 30185 31951 27723 31459 27651 30802 27648 30919 27385 4 32472 30394 30383 28762 29934 27939 29430 27593 29628 27438 5 27872 29213 26666 27976 26505 27399 25789 27088 25683 26385 6 23173 28143 21903 26160 22052 25798 21925 25841 22101 25518 7 19026 27091 18415 25044 18399 24444 18234 24646 19057 24609 Total M/F 214123 210732 202710 198224 200332 195709
196319
193105
197912
190769
Total 424855 400934 396041 389424 388681 Table 3.3 below clearly reflects that Maseru has been leading with enrolment from 2008 to 2010 followed by Leribe, Berea and Mafeteng respectively. For instance, in 2010, Maseru had the highest enrolment of 84281 (22%) pupils and Leribe was the second highest with 59847 (15%) while Berea and Mafeteng were next with 48049 (12%) and 40129 (10%) pupils, orderly. At this level of education a continuous decline in total enrolment has been experienced. However, some districts such as Maseru, Mohale’s Hoek, Mokhotlong and Thaba Tseka have gained in enrolment in 2010.

6
Table 3.3 Enrolment in Registered Primary Schools by District and Gender, 2008- 2010
Unlike in 2009 whereby enrolment of females exceeded that of males in five districts namely Mohale’s Hoek, Quthing, Qacha’s Nek, Mokhotlong and Thaba Tseka districts, enrolment of females surpassed that of their male counterparts in only three districts in 2010, namely; Quthing, Mokhotlong and Thaba Tseka. Comparison of enrolment by ecological zones demonstrated that there were more males enrolled in the foothills and lowlands while more females were enrolled in the mountains and senqu river valley as illustrated in Table 3.4.
District 2008 2009 2010
M F Total M F Total M F Total
Butha-Buthe
12214
11665
23879
11890
11449
23339
11655
11204
22859
Leribe
31952
29663
61615
31383
29062
60445
31381
28466
59847
Berea
26036
23920
49956
25158
23045
48203
25252
22797
48049
Maseru
43086
41558
84644
42439
41096
83535
43209
41072
84281
Mafeteng
21485
19808
41293
21149
19849
40998
20739
19390
40129
Mohale’s Hoek
18208
18194
36402
17675
18000
35675
18132
17844
35976
Quthing
12819
13110
25929
12389
12625
25014
12194
12204
24398
Qacha’s Nek
8326
8449
16775
8568
8682
17250
8411
8394
16805
Mokhotlong
10557
12058
22615
10244
11780
22024
10867
11944
22811
ThabaTseka
15649
17284
32933
15424
17517
32941
16072
17454
33526
Total
200332
195709
396041
196319
19310
5
38942
4
19791
2
190769
388681

7
Table 3.4 Enrolment in Registered Primary Schools by District and Ecological Zones, 2010
Foothills Lowlands Mountain Senqu River Valley
Total M F M F M F M F Butha-Buthe 4309 4112 5422 5120 1911 1986 0 0 22859 Leribe 7465 6616 20028 17932 3888 3918 0 0 59847 Berea 9503 8667 15589 13878 172 239 0 0 48049 Maseru 7037 6611 32401 30353 3774 4105 0 0 84281 Mafeteng 6497 6322 14425 12885 0 0 0 0 40129 Mohale's Hoek 3446 3327 8843 8139 4531 5122 1312 1256 35976 Quthing 2966 2758 319 249 6721 7097 2188 2100 24398 Qacha's Nek 0 0 0 0 8424 8381 0 0 16805 Mokhotlong 0 0 0 0 10891 11920 0 0 22811 Thaba-Tseka 0 0 0 0 14396 15628 1676 1826 33526
3.1.1 Accessibility of Education Accessibility is defined as the proportion of children who have access to schooling, out of all children of admission age at the corresponding grade, which is age 6 for primary school admission in Lesotho. In this section, the extent of access to the first grade of Primary education is discussed. 3.1.1.1 New Entrants in Registered Primary Schools Enrolment of new entrants in registered primary schools has been marginally fluctuating from 2008 to 2010. Enrolments were 52137 in 2008, 54197 in 2009 and 53911 in 2010 which implied a decline of 0.5 percent of new entrants from the year 2009. Although enrolment of new entrants was lower in 2010, the percentages of new entrants by gender were similar to the previous year whereby boys constituted 52 percent and girls 48 percent. Figure 2.1 reveals that enrolment of new entrants was at the pick exactly at the age of six (the official admission age) for both boys and girls and dramatically fell at ages beyond eight. The figure also portrays that enrolment of new entrants ranges from ages below 6 to age ten.

8
Assessment of new admissions’ enrolment by district demonstrated the same pattern as that of total enrolments in registered primary schools, with the exception of Thaba Tseka that has surpassed some of the lowlands districts in the year under review;. Maseru was in control with 11428 (21%) followed by Leribe, Berea, Thaba Tseka and Mafeteng with 7920 (15%), 6550 (12%), 5691 (11%) and 5620 (10%), respectively. Table 3.5 Number and Percentages of New Entrants in Registered Primary Schools by District and Gender – 2010 District New Entrants Enrolment New Entrants Percentages
M F Total M F Total Butha-Buthe 1363 1353 2716 4.8 5.3 5.0 Leribe 4085 3835 7920 14.5 14.9 14.7 Berea 3449 3101 6550 12.2 12.1 12.1 Maseru 5982 5446 11428 21.2 21.2 21.2 Mafeteng 2987 2633 5620 10.6 10.2 10.4 Mohale’s Hoek 2678 2468 5146 9.5 9.6 9.5 Quthing 1828 1583 3411 6.5 6.2 6.3 Qacha’s Nek 1206 1083 2289 4.3 4.2 4.2 Mokhotlong 1584 1556 3140 5.6 6.0 5.8 Thaba-Tseka 3022 2669 5691 10.7 10.4 10.6 Total 28184 25727 53911 100 100 100
Figure 3.1 New Entrants in Registered Primary Schools by Age and Gender - 2010
01000 2000 3000 4000 5000 6000 7000 8000 9000
10000 11000 12000 13000 14000 15000 16000 17000
below 66 7 8 9 10 11 12 13 14 15 16 17 20
higher 20
Age
Enro
lmen
t M F

9
3.1.1.2 Registered Primary Schools Apparent Intake Rates (AIR) and Net Intake Rates (NIR) The Apparent Intake Rates (AIR) and Net Intake Rate (NIR) for Lesotho from 2000 are shown in Table 2.6. The Apparent and Net intake rates signify accessibility of new entrants of a particular entering age for a particular grade, out of all children of admission age at the corresponding grade, which is age 6 in Lesotho. The two ratios are essential to policy-makers and planners because they indicate the degree of accessibility of primary school education. Apparent intake rate is a crude measure that considers all new entrants irrespective of age while Net intake rate takes into account new entrants of official entrance age. The Apparent Intake Rate (AIR) reached its peak in 2000, increasing from 104.5 in 1999 to 200.9 after which it progressively declined until in 2010. A massive increase in the Apparent Intake Rate (AIR) in 2000 was due to commencement of free primary education that resulted in high enrolment. The Apparent Intake Rate (AIR) evidently signifies that more males had access to primary education than females. On the other side, Net Intake Rate (NIR) has been fluctuating over the years. Unlike the AIR that indicated that males superseded females the analysis of NIR by gender indicated that more girls than boys had access to primary education in 2007 and 2008, with the exception of 2009 and 2010 whereby the opposite held true. Table 3.6 Registered Primary Schools Apparent and Net Intake Rates and Gender Parity Indices and Sex, 2000-2010 Years Apparent Intake Rates (AIR) GPI
(AIR) Net Intake Rates (NIR) GPI
(NIR) Males Females Total Males Females Total 2000 210.9 190.8 200.9 0.90 63.2 65.1 64.1 1.03 2001 150 134 142.1 0.89 61.7 62.8 62.2 1.02 2002 129.2 121 125.1 0.94 60.2 62.5 61.3 1.04 2003 124.9 118 121.5 0.94 61.3 63 62.1 1.03 2004 132.5 120.7 126.6 0.91 55.4 56.2 55.8 1.01 2005 117 110.1 113.6 0.94 53.6 54.1 54.1 1.01 2006 118 111.2 114.6 0.94 55.9 57.9 56.9 1.04 2007 111.5 105.1 108.3 0.94 54.7 55 54.9 1.01 2008 106.1 102.7 104.4 0.97 54.8 56.5 55.6 1.03 2009 105.5 98.8 102.2 0.94 55.4 54.7 55 0.99 2010 106.1 98.2 102.2 0.93 60.8 59.1 60 0.97
3.1.2 Gender Parity Index in Registered Primary Schools A value of more than one (1) portrays that there were more females than males of the appropriate age that enrolled in registered primary schools, while the value below 1 indicates that there were more males than females that enrolled, the value that equals 1 indicates enrolment equity between males and females. The GPI (AIR) In Table 3.6 portrayed that more males than females had access to primary education; this possibly shows that some of males attend school at later ages as they become herd
10
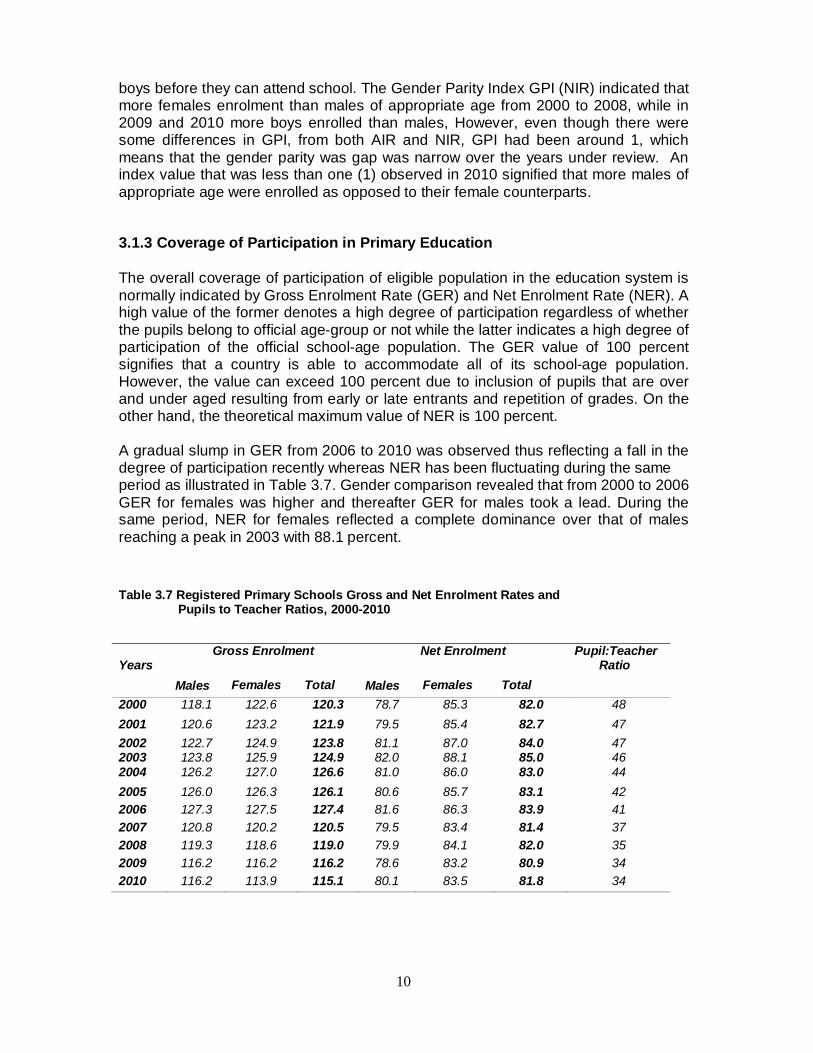
boys before they can attend school. The Gender Parity Index GPI (NIR) indicated that more females enrolment than males of appropriate age from 2000 to 2008, while in 2009 and 2010 more boys enrolled than males, However, even though there were some differences in GPI, from both AIR and NIR, GPI had been around 1, which means that the gender parity was gap was narrow over the years under review. An index value that was less than one (1) observed in 2010 signified that more males of appropriate age were enrolled as opposed to their female counterparts. 3.1.3 Coverage of Participation in Primary Education The overall coverage of participation of eligible population in the education system is normally indicated by Gross Enrolment Rate (GER) and Net Enrolment Rate (NER). A high value of the former denotes a high degree of participation regardless of whether the pupils belong to official age-group or not while the latter indicates a high degree of participation of the official school-age population. The GER value of 100 percent signifies that a country is able to accommodate all of its school-age population. However, the value can exceed 100 percent due to inclusion of pupils that are over and under aged resulting from early or late entrants and repetition of grades. On the other hand, the theoretical maximum value of NER is 100 percent. A gradual slump in GER from 2006 to 2010 was observed thus reflecting a fall in the degree of participation recently whereas NER has been fluctuating during the same period as illustrated in Table 3.7. Gender comparison revealed that from 2000 to 2006 GER for females was higher and thereafter GER for males took a lead. During the same period, NER for females reflected a complete dominance over that of males reaching a peak in 2003 with 88.1 percent. Table 3.7 Registered Primary Schools Gross and Net Enrolment Rates and Pupils to Teacher Ratios, 2000-2010
Years
Gross Enrolment Net Enrolment Pupil:Teacher Ratio
Males Females
Total Males
Females
Total
2000 118.1 122.6 120.3 78.7 85.3 82.0 48 2001 120.6 123.2 121.9 79.5 85.4 82.7 47 2002 122.7 124.9 123.8 81.1 87.0 84.0 47 2003 123.8 125.9 124.9 82.0 88.1 85.0 46 2004 126.2 127.0 126.6 81.0 86.0 83.0 44 2005 126.0 126.3 126.1 80.6 85.7 83.1 42 2006 127.3 127.5 127.4 81.6 86.3 83.9 41 2007 120.8 120.2 120.5 79.5 83.4 81.4 37 2008 119.3 118.6 119.0 79.9 84.1 82.0 35 2009 116.2 116.2 116.2 78.6 83.2 80.9 34 2010 116.2 113.9 115.1 80.1 83.5 81.8 34

11
Provision of quality basic education is one of the strategic goals of Ministry of Education and Training. In order to accomplish this task, The Ministry set itself the targets of reducing pupil to teacher ratio from 46 pupils to 1 teacher in 2003 to 41: 1 in 2007 and to 40: 1 by the year 2015. As demonstrated in Table 3.7, it is feasible that these targets are already attained. In 2007, the ratio was 37 pupils to one teacher which was obviously above the Ministry’s target. The ratio further reduced and was stable at 34 pupils to one teacher in 2009 and 2010. Table 3.8 Pupils Enrolled in Registered Primary Schools by District, Number of Teachers, Gender and the Pupils to Teacher Ratios – 2010
The pupil-teacher ratios by districts revealed that Mokhotlong and Thaba-Tseka were the highest sharing 39 as pupil-teacher ratio in 2010. However, these districts were followed by Maseru and Berea with pupil-teacher ratios of 35 and 34 in 2010 as opposed to the previous year whereby Leribe was among the leading districts with pupil-teacher ratio. Other districts had the same pupil-teacher ratio of 32 excluding Mafeteng that had the least with the pupil-teacher ratio of 31 pupils to 1 teacher as shown in Table 3.9. Table 3.9 below depicts two net enrolment ratios NER1 and NER2 for specific ages at primary level. While the former concentrates on pupils aged 6-12 enrolled only at primary school, the latter includes pupils aged 6-12 enrolled in primary and secondary levels. This is done to reveal whether pupils of primary school attending school age are attending school or not regardless of the level of education. A slight difference or similar values of NER1 and NER2 indicate that majority of pupils of the primary school age were still in primary and very few were in secondary. This, therefore emphasis the fact that 18 percent of the population aged 6-12 that was not at school and was either at home or attending school out of the country
District
Enrolment All Teachers Pupil: Teacher
Ratio
Males Females Total Males Females Total
Butha-Buthe 11655 11204 22859 140 570 710 32 Leribe 31381 28466 59847 365 1524 1889 32 Berea 25252 22797 48049 287 1109 1396 34 Maseru 43209 41072 84281 481 1902 2383 35 Mafeteng 20739 19390 40129 332 947 1279 31 Mohale's Hoek 18132 17844 35976 284 837 1121 32 Quthing 12194 12204 24398 188 563 751 32 Qacha's Nek 8411 8394 16805 142 380 522 32 Mokhotlong 10867 11944 22811 161 430 591 39 Thaba-Tseka 16072 17454 33526 281 585 866 39 Total 197912 190769 388681 2661 8847 11508 34

12
Table 3.9 Registered Primary Schools Age Specific Net Enrolment Rates (NER) - 2010
3.2 Disability in Registered Primary Schools Pupils with special educational needs or disabilities amounted to 20490 (5.3%) out of 388681 pupils that were enrolled in 2010. Gender comparison disclosed that boys with special educational needs topped in all the grades except in grade 7 where the number of girls was marginally higher than that of boys. The number of males with special educational needs or disabilities was also dominant in most types of special needs such as epilepsy, learning difficulty, physical disability and visual impairment while the number of females took a lead in hearing impairment and mental retardation. Table 3.10 Registered Primary School Enrolments of Pupils with Special Educational Needs or Disabilities by Type, Grade and Sex, 2010
Primary Enrolment NER1 Primary age enrolment at (6 to 12)
Population NER2
Age M F Total M F Total M F Total M F Total M F Total 6 17316 16611 33927 66.8 65.2 66.0 17316 16611 33927 25936 25481 51417 66.8 65.2 66.0 7 19888 19686 39574 79.0 79.6 79.3 19888 19686 39574 25165 24725 49890 79.0 79.6 79.3 8 19574 19796 39370 80.5 82.8 81.6 19574 19796 39370 24315 23906 48221 80.5 82.8 81.6 9 19492 20109 39601 81.3 85.4 83.3 19492 20109 39601 23970 23555 47525 81.3 85.4 83.3
10 20898 21768 42666 88.1 93.3 90.7 20898 21768 42666 23715 23339 47054 88.1 93.3 90.7 11 19821 21236 41057 84.0 91.4 87.7 19855 21338 41193 23602 23234 46836 84.1 91.8 88.0 12 19346 20630 39976 82.2 89.0 85.6 19762 21511 41273 23544 23175 46719 83.9 92.8 88.3
Total 136335 139836 276171 80.1 83.5 81.8 136785 140819 277604 170247 167415 337662 80.3 84.1 82.2
Special Educational Needs
Enrolment Total
Standard 1 Standard 2 Standard 3 Standard 4 Standard 5 Standard 6 Standard 7 M F M F M F M F M F M F M F
Epilepsy 1 0 3 1 2 2 0 1 0 0 0 0 2 0 12 Hearing Impairment
169 143 188 131 206 197 267 222 195 277 249 320 134 215 2913
Learning Difficulty
942 608 1022 596 1052 631 969 660 853 604 664 552 471 422 10046
Mental Retardation
10 7 4 6 2 1 1 0 2 1 6 9 0 2 51
Other 210 111 159 87 191 95 188 71 165 90 145 94 121 72 1799 Physical Handicap
220 154 141 87 107 110 108 87 103 95 98 88 54 46 1498
Visual Impairment
218 137 275 177 331 235 377 288 382 377 387 419 268 300 4171
Total 1770 1160 1792 1085 1891 1271 1910 1329 1700 1444 1549 1482 1050 1057 20490
13
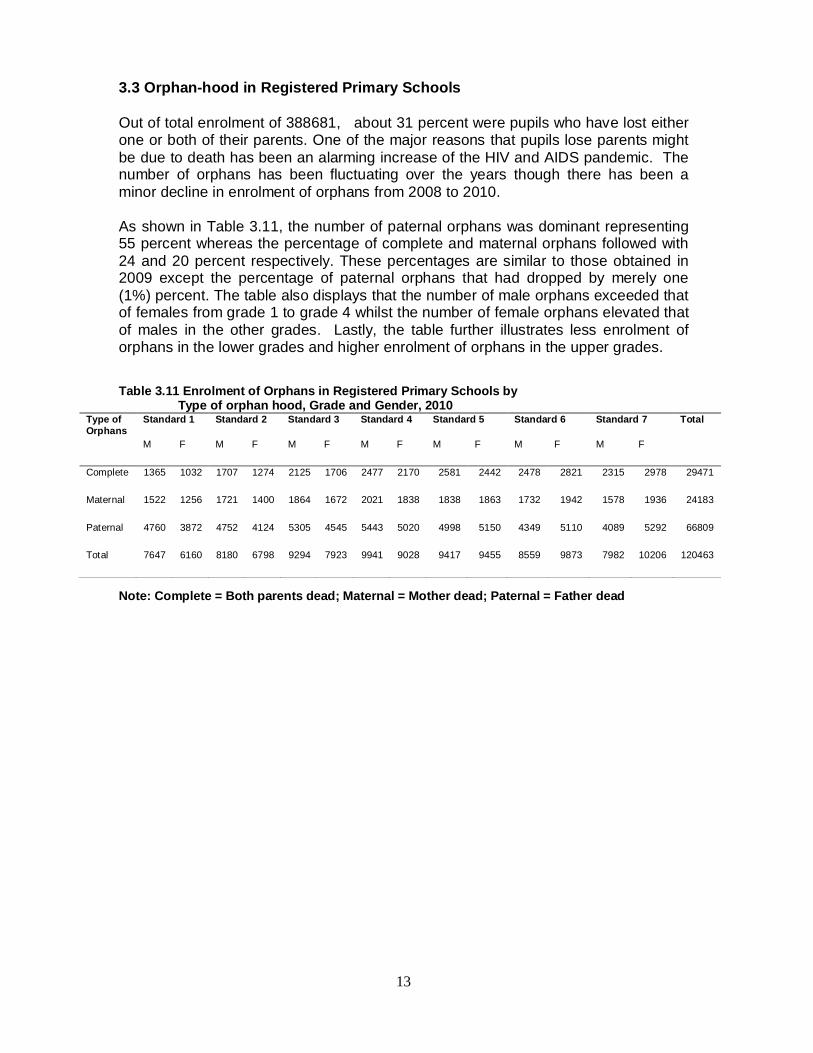
3.3 Orphan-hood in Registered Primary Schools Out of total enrolment of 388681, about 31 percent were pupils who have lost either one or both of their parents. One of the major reasons that pupils lose parents might be due to death has been an alarming increase of the HIV and AIDS pandemic. The number of orphans has been fluctuating over the years though there has been a minor decline in enrolment of orphans from 2008 to 2010. As shown in Table 3.11, the number of paternal orphans was dominant representing 55 percent whereas the percentage of complete and maternal orphans followed with 24 and 20 percent respectively. These percentages are similar to those obtained in 2009 except the percentage of paternal orphans that had dropped by merely one (1%) percent. The table also displays that the number of male orphans exceeded that of females from grade 1 to grade 4 whilst the number of female orphans elevated that of males in the other grades. Lastly, the table further illustrates less enrolment of orphans in the lower grades and higher enrolment of orphans in the upper grades. Table 3.11 Enrolment of Orphans in Registered Primary Schools by Type of orphan hood, Grade and Gender, 2010
Type of Orphans
Standard 1 Standard 2 Standard 3 Standard 4 Standard 5 Standard 6 Standard 7 Total
M F M F M F M F M F M F M F
Complete 1365 1032 1707 1274 2125 1706 2477 2170 2581 2442 2478 2821 2315 2978 29471
Maternal 1522 1256 1721 1400 1864 1672 2021 1838 1838 1863 1732 1942 1578 1936 24183
Paternal 4760 3872 4752 4124 5305 4545 5443 5020 4998 5150 4349 5110 4089 5292 66809
Total 7647 6160 8180 6798 9294 7923 9941 9028 9417 9455 8559 9873 7982 10206 120463
Note: Complete = Both parents dead; Maternal = Mother dead; Paternal = Father dead

14
Figure 3.2 portrays graphical representation of orphan enrolment by age and sex.
3.4 Inputs for Primary Education The Ministry of Education and Training admires inputs to education as key to shifting primary education to the higher stride. To ensure the support to primary education, the Ministry’s huge responsibility involves provision of appropriate buildings, qualified teachers, sufficient facilities and education materials to increase accessibility of schools and sustainable enrolment gains at this level of education. 3.4.1 Primary Schools Generally, the high ownership of the schools at primary level has previously and presently been governed by various churches while the small portion of schools is privately owned and others belonging to government and community. In spite of education being a joint responsibility between the government, churches and the community, the huge responsibility of overseeing, maintenance and financial support of schools is done by the government. In the year under review, about 81 percent of the registered primary schools are owned by the churches while government and community constituted 11 percent and 4 percent respectively. Included among the church owned agencies were; RCM, LEC, ACL and AME. Majority of the church owned registered primary schools belonged to both Roman Catholic Mission (RCM) and Lesotho Evangelical Church (LEC) sharing 33 percent (see Figure 3.3 below).
Figure 3.2 Enrolment of Orphans in Registered Primary Schools by Age and Sex - 2010
0500
100015002000250030003500400045005000550060006500700075008000
below6
6 7 8 9 10 11 12 13 14 15 16 17 18 19 20 higher20
Age
Enro
lmen
t
t
MF

15
Table 3.12 illustrates that primary school enrolment has been varying since 2001 to 2006 and thereafter enrolment has been deteriorating until in 2010. Despite a fall in enrolment in recent years, a slight improvement on enrolment was observed as enrolment declined by only 0.2 percent in 2010 compared to 1.7 percent in 2009. The table further indicates that the total number of schools increased continuously from 2001 to 2009 after which it reduced in 2010. It is evident from Table 3.12 that the number of pupils with special needs or disabilities and orphans has been unstable over the years. Table 3.12 Registered Primary School Enrolment, Number of Schools, Number of Teachers and Percentage Change in Enrolment, 2001-2010
Primary Enrolment
2001 2002 2003 2004 2005 2006 2007 2008 2009 2010
Total 415007 418668 429720 427009 422278 424855 400934 396041 389424 388681 % Change in Enrolment
1.1 0.9 2.6 -0.6 -1.1 0.6 -5.6 -1.2 -1.7 -0.2
Number of schools
1295 1333 1355 1412 1419 1455 1455 1472 1479 1473
Number of teachers
8762 8908 9294 9993 10154 10418 10778 11301 11536 11508
Number of Orphans
- - - 99082 122769 128257 111335 121175 121155 120463
Number of Disabled
_ _ _ 22292 122769 22233 20359 20301 20527 20490
Figure 3.3 Number of Primary Schools by District and Agency - 2010
12% 2%
4%
11%
33% 4% 1%
33% ACL
AMECommunity
Government
LEC
Others
PrivateRCM

16
The allocation of schools by district signified Maseru to be the highest with 251 (17%) schools, followed by Leribe and Mohale’s Hoek with 196 (13%) and 171(12%) respectively. Comparison by ecological zones depicted mountain areas as leading with the number of schools with 581 (39%) followed by lowlands and foothills with 533(36%) and 293 (20%) orderly. Dominance of schools in the mountain areas originates from the terrain in the mountains that results in many dispersed villages and consequently the schools that are characterized by a few number of pupils enrolled. Table 3.13 Number of Registered Primary Schools by District and Location - 2010 District Foothills Lowlands Mountain S R V Total Butha-Buthe 32 28 21 0 81 Leribe 51 109 36 0 196 Berea 46 88 3 0 137 Maseru 55 152 44 0 251 Mafeteng 54 103 0 0 157 Mohale's Hoek 35 60 62 14 171 Quthing 24 4 80 19 127 Qacha's Nek 0 0 116 0 104 Mokhotlong 0 0 111 0 107 Thaba-Tseka 0 0 126 16 142
3.4.2 Teachers in Registered Primary Schools
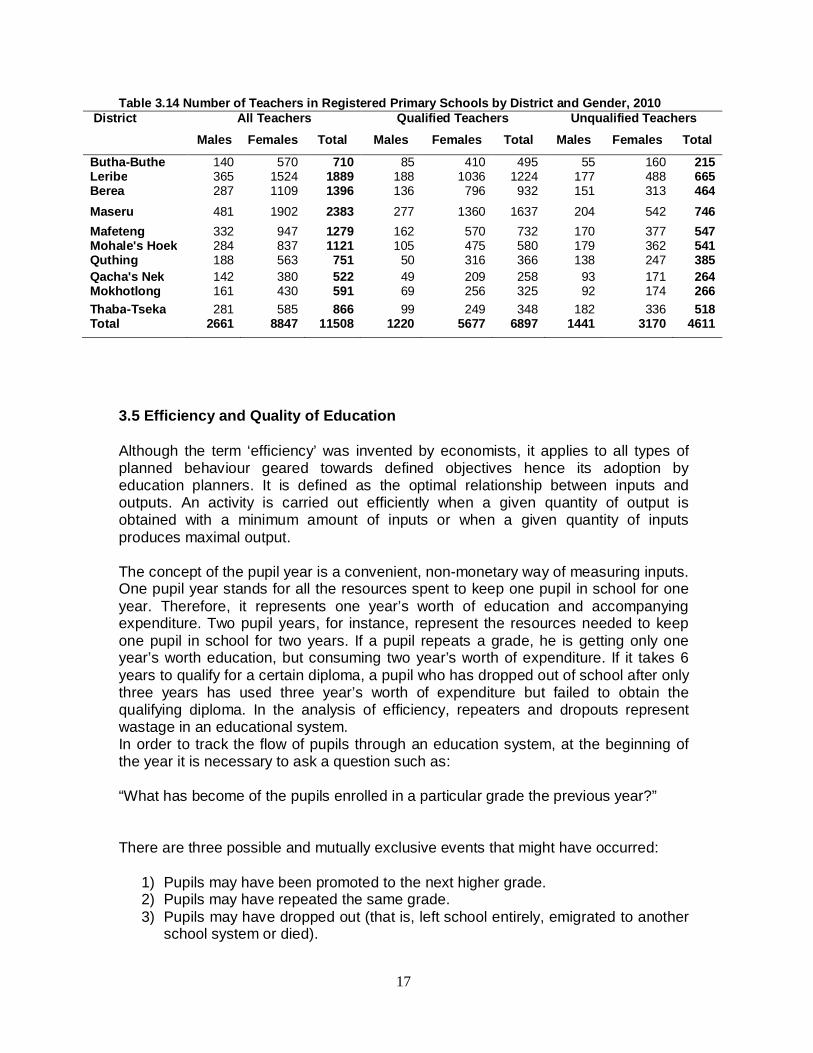
In 2010, the number of employed teachers in the teaching service was 11,508. This number of teachers was slightly lower than 11,536 recorded in 2009. Table 3.14 demonstrates that there were more female teachers (77 percent) than male teachers (23 Percent). Out of the aforesaid total of teachers, 60 percent were qualified while 40 percent were unqualified. Within the number of qualified teachers, about 82 percent were females while males comprised only 18 percent. Distribution of teachers by districts portrayed Maseru as leading not only with the total number of teachers but also with the number of qualified teachers. Leribe and Berea were next with both total number of teachers and qualified teachers. Nevertheless, Maseru and Leribe once more appeared foremost with the number of unqualified teachers whereas Mafeteng and Mohale’s Hoek trailed behind.
17
Table 3.14 Number of Teachers in Registered Primary Schools by District and Gender, 2010
District All Teachers Qualified Teachers Unqualified Teachers Males Females Total Males Females Total Males Females Total
Butha-Buthe 140 570 710 85 410 495 55 160 215 Leribe 365 1524 1889 188 1036 1224 177 488 665 Berea 287 1109 1396 136 796 932 151 313 464 Maseru 481 1902 2383 277 1360 1637 204 542 746 Mafeteng 332 947 1279 162 570 732 170 377 547 Mohale's Hoek 284 837 1121 105 475 580 179 362 541 Quthing 188 563 751 50 316 366 138 247 385 Qacha's Nek 142 380 522 49 209 258 93 171 264 Mokhotlong 161 430 591 69 256 325 92 174 266 Thaba-Tseka 281 585 866 99 249 348 182 336 518 Total 2661 8847 11508 1220 5677 6897 1441 3170 4611
3.5 Efficiency and Quality of Education Although the term ‘efficiency’ was invented by economists, it applies to all types of planned behaviour geared towards defined objectives hence its adoption by education planners. It is defined as the optimal relationship between inputs and outputs. An activity is carried out efficiently when a given quantity of output is obtained with a minimum amount of inputs or when a given quantity of inputs produces maximal output. The concept of the pupil year is a convenient, non-monetary way of measuring inputs. One pupil year stands for all the resources spent to keep one pupil in school for one year. Therefore, it represents one year’s worth of education and accompanying expenditure. Two pupil years, for instance, represent the resources needed to keep one pupil in school for two years. If a pupil repeats a grade, he is getting only one year’s worth education, but consuming two year’s worth of expenditure. If it takes 6 years to qualify for a certain diploma, a pupil who has dropped out of school after only three years has used three year’s worth of expenditure but failed to obtain the qualifying diploma. In the analysis of efficiency, repeaters and dropouts represent wastage in an educational system. In order to track the flow of pupils through an education system, at the beginning of the year it is necessary to ask a question such as: “What has become of the pupils enrolled in a particular grade the previous year?” There are three possible and mutually exclusive events that might have occurred:
1) Pupils may have been promoted to the next higher grade. 2) Pupils may have repeated the same grade. 3) Pupils may have dropped out (that is, left school entirely, emigrated to another
school system or died).
18
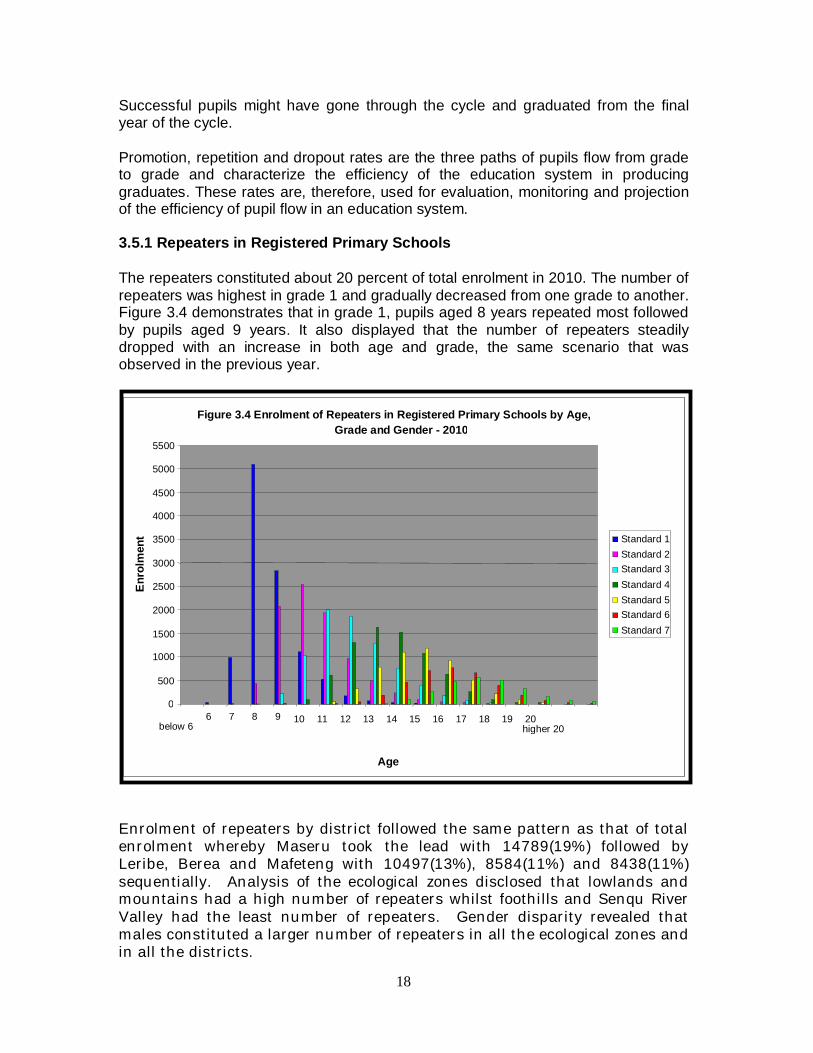
Successful pupils might have gone through the cycle and graduated from the final year of the cycle. Promotion, repetition and dropout rates are the three paths of pupils flow from grade to grade and characterize the efficiency of the education system in producing graduates. These rates are, therefore, used for evaluation, monitoring and projection of the efficiency of pupil flow in an education system. 3.5.1 Repeaters in Registered Primary Schools The repeaters constituted about 20 percent of total enrolment in 2010. The number of repeaters was highest in grade 1 and gradually decreased from one grade to another. Figure 3.4 demonstrates that in grade 1, pupils aged 8 years repeated most followed by pupils aged 9 years. It also displayed that the number of repeaters steadily dropped with an increase in both age and grade, the same scenario that was observed in the previous year.
Enrolment of repeaters by district followed the same pattern as that of total enrolment whereby Maseru took the lead with 14789(19%) followed by Leribe, Berea and Mafeteng with 10497(13%), 8584(11%) and 8438(11%) sequentially. Analysis of the ecological zones disclosed that lowlands and mountains had a high number of repeaters whilst foothills and Senqu River Valley had the least number of repeaters. Gender disparity revealed that males constituted a larger number of repeaters in all the ecological zones and in all the districts.
Figure 3.4 Enrolment of Repeaters in Registered Primary Schools by Age, Grade and Gender - 2010
0
500
1000
1500
2000
2500
3000
3500
4000
4500
5000
5500
below 66 7 8 9 10 11 12 13 14 15 16 17 18 19 20
higher 20
Age
Enr
olm
ent
t
Standard 1Standard 2Standard 3Standard 4Standard 5Standard 6Standard 7

19
Table 3.15 Repeaters in Registered Primary Schools by District, Ecological Zones and Gender, 2010
District Foothills Lowlands Mountain Senqu River Valley
M F M F M F M F Total Butha-Buthe 1165 689 1114 536 626 457 0 0 4587
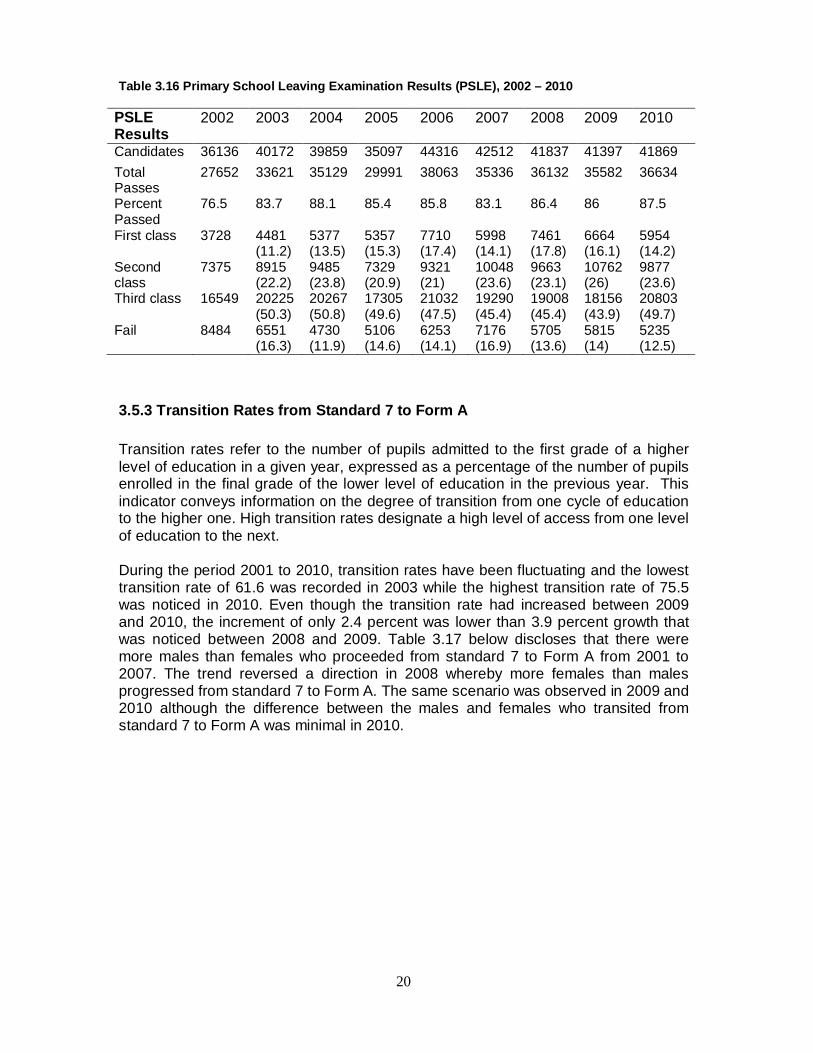
Leribe 1597 883 4068 2396 890 663 0 0 10497 Berea 2150 1383 3207 1787 30 27 0 0 8584 Maseru 1754 1296 5974 3932 1006 827 0 0 14789 Mafeteng 1761 1143 3495 2039 0 0 0 0 8438 Mohale's Hoek 993 678 1719 1110 1328 1318 281 209 7636 Quthing 607 416 71 31 1748 1411 445 340 5069 Qacha's Nek 0 0 0 0 2118 1485 0 0 3603 Mokhotlong 0 0 0 0 3578 2741 0 0 6319 Thaba-Tseka 0 0 0 0 4072 3298 535 367 8272 3.5.2 Primary School Leaving Examination (PSLE) Results In 2010 improvement on the total passes was observed as 87.5 percent was recorded compared to 86 percent was obtained in the previous year, implying an increment of 1.5 percent. The 2010 percentage of total passes was the second largest in the period under review; it seconded 88 percent that was obtained in 2004. Another improvement was noticed on the percentage of failures that dropped by 1.5 percent from 2009 to 2010. Nevertheless, The 2010 results in Table 3.16 below shows that percentages of both first and second class passes have reduced 1.9 percent while 2.4 percent respectively from those of 2009. It is noticeable from Table 3.16 below that, during the period under review, the number of candidates that sat for examinations has been constantly varying.
20
Table 3.16 Primary School Leaving Examination Results (PSLE), 2002 – 2010
PSLE Results
2002 2003 2004 2005 2006 2007 2008 2009 2010
Candidates 36136 40172 39859 35097 44316 42512 41837 41397 41869 Total Passes
27652 33621 35129 29991 38063 35336 36132 35582 36634
Percent Passed
76.5 83.7 88.1 85.4 85.8 83.1 86.4 86 87.5
First class 3728 4481 (11.2)
5377 (13.5)
5357 (15.3)
7710 (17.4)
5998 (14.1)
7461 (17.8)
6664 (16.1)
5954 (14.2)
Second class
7375 8915 (22.2)
9485 (23.8)
7329 (20.9)
9321 (21)
10048 (23.6)
9663 (23.1)
10762 (26)
9877 (23.6)
Third class 16549 20225 (50.3)
20267 (50.8)
17305 (49.6)
21032 (47.5)
19290 (45.4)
19008 (45.4)
18156 (43.9)
20803 (49.7)
Fail 8484 6551 (16.3)
4730 (11.9)
5106 (14.6)
6253 (14.1)
7176 (16.9)
5705 (13.6)
5815 (14)
5235 (12.5)
3.5.3 Transition Rates from Standard 7 to Form A Transition rates refer to the number of pupils admitted to the first grade of a higher level of education in a given year, expressed as a percentage of the number of pupils enrolled in the final grade of the lower level of education in the previous year. This indicator conveys information on the degree of transition from one cycle of education to the higher one. High transition rates designate a high level of access from one level of education to the next. During the period 2001 to 2010, transition rates have been fluctuating and the lowest transition rate of 61.6 was recorded in 2003 while the highest transition rate of 75.5 was noticed in 2010. Even though the transition rate had increased between 2009 and 2010, the increment of only 2.4 percent was lower than 3.9 percent growth that was noticed between 2008 and 2009. Table 3.17 below discloses that there were more males than females who proceeded from standard 7 to Form A from 2001 to 2007. The trend reversed a direction in 2008 whereby more females than males progressed from standard 7 to Form A. The same scenario was observed in 2009 and 2010 although the difference between the males and females who transited from standard 7 to Form A was minimal in 2010.

21
Table 3.17 Transition Rates from Standard 7 to Form A, 2001-2010 Transits From Standard 7 to Form A Transition Rates
Year Males Females Total Males Females Total 2001 9799 13035 22834 67 66.7 66.8 2002 10354 13698 24046 65.3 62.2 63.5 2003 10121 13138 23259 63.6 62.1 61.6 2004 10892 14367 24809 67.5 64.7 66.5 2005 11586 14999 26585 69.6 68.3 68.9 2006 10924 14205 25129 70.3 69.1 69.6
2007 12995 17980 30975 68.3 66.4 67.2 2008 12527 17525 30052 68 70 69.2 2009 13198 18105 31303 71.7 74.1 73.1 2010 13725 18630 32355 75.3 75.6 75.5
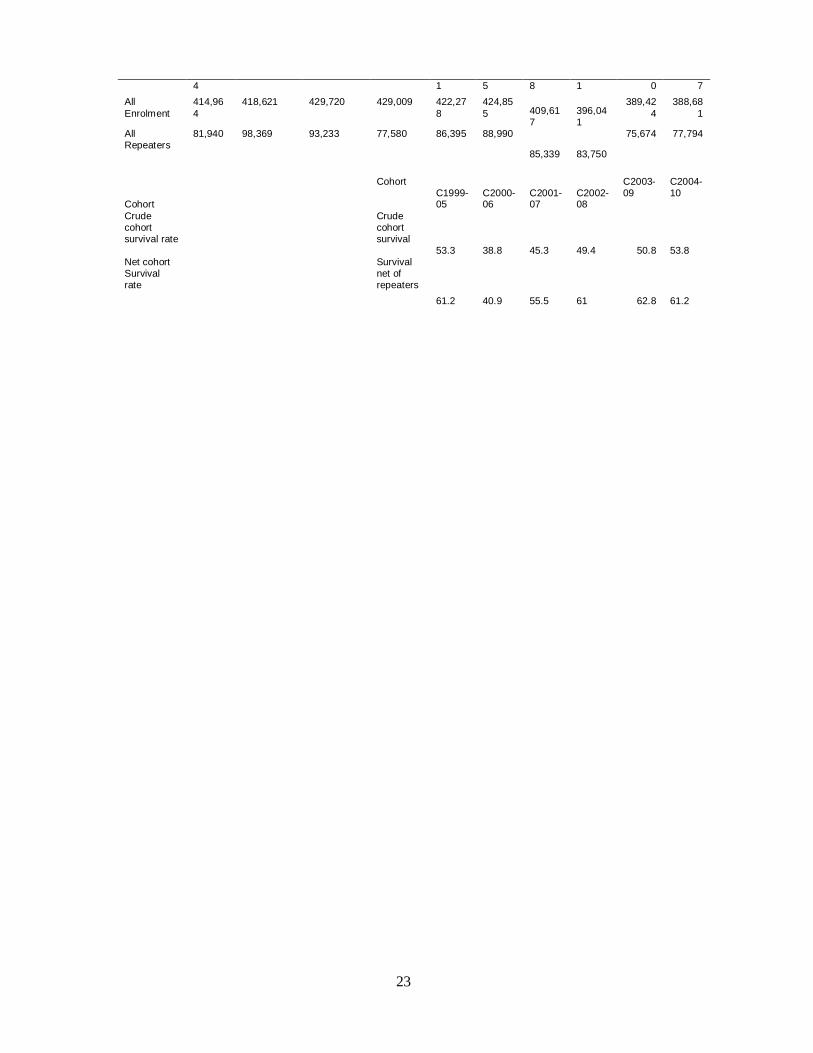
3.5.4 Cohort Analysis Cohort survival represents a life span of a group of pupils as they enter primary schooling in the same year. The survival of pupils is observed in the final grade of primary level and considers how the pupils were affected by drop outs and repetitions as they progressed to the final year. Survival rate is crude when the new entrants comprise repeaters of the previous year’s cohort and the reverse holds true for net survival rate. The net cohort survival rate decreased by 5.5 percent from 2007 to 2008 cohorts after which an improvement of 1.8 percent gain was observed in 2009. Nevertheless, a further collapse in net cohort survival rate was noticed in 2010 when percentage decline of 2.4 was recorded. Despite fluctuations in net cohort survival rate in recent years, this rate has been maintained well above 60 percent.

22
Table 3.18 Enrolment and Repeaters in Primary Schools by Grade and Cohort, 2001-2010
STD1 2001 2002 2003 2004 2005 2006 2007
2009 2010
Net of repeaters
69,606 60,243 59,390 61,717 55,308 55,568
54,375 51,380
51,424 52,555
Total enrolment
97,469 86,643 84,412 81,234 78,232 77,550
76,261 72,442
69,297 70,393
Repeaters 27,863 26,400 25,022 19,517 22,924 21,982
21,886 21,062
17,873 17,838
STD2 Net of repeaters
73,694 59,353 54,535 55,591 50,457 48,938
48,230 47,152
47,813 45,465
Total enrolment
89,929 81,915 75,314 70,598 68,565 65,713
63,391 62,019
61,131 59,565
Repeaters 16,235 22,562 20,779 16,168 16,795 16,775
15,161 14,867
13,318 14,100
STD3 Net of repeaters
40,092 56,419 58,042 55,612 51,093 50,416
47,722 46,036
46,294 45,918
Total enrolment
50,424 78,981 73,578 67,804 65,592 64,208
60,983 59,110
58,450 58,304
Repeaters 10,332 22,562 15,536 12,830 14,235 13,792
13,261 13,074
12,156 12,386
STD4 Net of repeaters
42,372 37,303 59,921 57,189 50,457 49,327
47,507 45,289
45,449 45,178
Total enrolment
53,451 47,819 72,075 68,333 64,266 62,866
60,332 57,873
57,023 57,066
Repeaters 11,079 10,516 12,154 11,677 13,542 13,539
12,825 12,584
11,574 11,888
STD5 Net of repeaters
39,510 38,868 35,597 50,941 49,913 46,687
45,630 44,314
44,076 42,934
Total enrolment
46,951 45,769 43,119 59,598 59,224 57,085
55,634 53,904
52,877 52,068
Repeaters 7,441 6,901 7,522 6,912 9,107 10,398
10,004 9,590
8,801 9,134
STD6 Net of repeaters
35,997 35,711 35,697 34,861 44,922 38,330
42,159 41,381
41,403 41,036
Total enrolment
40,761 40,866 40,954 39,086 50,295 51,316
48,885 47,850
47,766 47,619
Repeaters 4,764 5,155 5,257 4,475 5,232 6,686
6,726 6,469
6,363 6,583
STD7 Net of repeaters
31,753 32,355 33,305 34,222 31,432 40,289
38,655 36,739
37,291 37,801
Total enrolment
35,979 36,628 40,268 40,356 36,104 46,117
44,131 42,843
42880 43,666
Repeaters 4,226 4,273 6,963 6,001 4,560 5,818
5,476 6,104
5,589 5,865
All Grades 333,02 320,252 336,487 350,990 333,08 329,55 324,27 312,29 313,75 310,88
23
4 1 5 8 1 0 7 All Enrolment
414,964
418,621 429,720 429,009 422,278
424,855 409,61
7 396,041
389,424
388,681
All Repeaters
81,940 98,369 93,233 77,580 86,395 88,990
85,339 83,750
75,674 77,794
Cohort
Cohort C1999-05
C2000-06
C2001-07
C2002-08
C2003-09
C2004-10
Crude cohort survival rate
Crude cohort survival
53.3 38.8 45.3 49.4 50.8 53.8 Net cohort Survival rate
Survival net of repeaters
61.2 40.9 55.5 61 62.8 61.2

24
Chapter 4 Secondary School Education 4.0 Introduction
Secondary Education is intermediate level between elementary level and College and/or University. It begins with grade 8 (Form A) to grade 12 (Form E). Form A starts around age 13 or 14 progressing to Form E ending in at or around 17 or 18 years. This level of education generally comprises of junior and senior secondary education. Junior secondary level covers Form A to Form C, and the Junior Certificate (JC) is awarded on successful completion of Form C. Senior Secondary level consists of Form D and Form E, and Cambridge Overseas School Certificate (COSC) is awarded on successful completion of Form E. Usually provided at this level is general, technical or vocational and college preparatory curricula. 4.1 Enrolment in Registered Secondary Schools The total enrolment for the year 2010 was 123,307 in registered secondary schools as demonstrated in Table 4.1, this enrolment figure increased by about 10.6 percent from the total of 111,480 in the previous year. The increment is relatively high compared to the one obtained between 2008 and 2009 which was 7.9 percent. The historic trend at this level has shown that enrolment of girls has always been higher than that of their boys’ counterparts. In 2010 for instance, 58 percent of girls enrolled as opposed to 42 percent of their boys’ counterparts. According to Table 4.1 the gender disparity gap was wide at earlier ages such as at ages ‘below 13’ whereby girls outnumbered their boys’ counterparts by 69 percent. The percentages remained the same at age 13. At age 14, 15 and 16 girls constituted 65, 63, and 60 percent respectively while boys on the other hand amounted to 35, 37 and 40 percent in accord order. It was detected that at some later ages the numbers of males enrolled tend to top the number of females enrolled. For instance, at ages beyond age 16 males tended to enroll more than females. The same scenario was portrayed within the grades, the number of males was higher than the number of females from age 17 to age 23 in form A, age 18 to age 23 in form B, age 20 to age 24 in form C, Age 21 to age 23 in form D and age 23 to age 24 in form E.

25
Table 4.1 Enrolment in Registered Secondary Schools by Age, Form and Gender - 2010 Age
Form A Form B Form C Form D Form E Total M F M F M F M F M F
below 12 34 102 0 0 0 0 0 0 0 0 136 12 416 881 0 0 0 0 0 0 0 0 1297 13 1576 3522 325 723 0 0 0 0 0 0 6146 14 2929 4920 1157 2605 299 648 0 0 0 0 12558 15 3263 4674 2150 4086 1003 2224 296 586 0 0 18282 16 3049 3553 2740 4211 1647 2988 859 1675 248 479 21449 17 2294 2061 2693 3299 1820 2837 1442 2466 736 1255 20903 18 1436 1011 2172 2040 1746 2202 1656 2298 955 1484 17000 19 597 362 1191 970 1270 1294 1315 1736 943 1192 10870 20 283 127 687 459 873 718 1140 1047 816 864 7014 21 93 63 265 155 414 267 672 567 533 547 3576 22 47 21 116 91 231 122 407 304 302 311 1952 23 20 11 53 33 96 66 184 160 205 136 964 24 8 24 19 21 32 30 94 94 100 85 507 higher 24 8 26 13 48 20 43 90 184 70 151 653 Total 16053 21358 13581 18741 9451 13439 8155 11117 4908 6504 123307 The pattern of enrolment in registered secondary schools by district was analogous to that of registered primary schools. Maseru had the highest percentage of 25.8 in 2010 followed by Leribe with 18.8 percent while Thaba-Tseka and Qacha’s Nek were the least with 3.8 and 3.6 percent respectively. When analyzing enrolment by ecological zones, similar to the previous years was the fact that lowlands emerged as the highest in enrollment registering 62 percent. The mountains were next with 15 percent followed by foothills with 14 percent. As shown in Table 3.2, Senqu River valley was the lowest with 8 percent. Analysis by gender also reflected female enrolments as dominant in all the districts and ecological zones. Table 4.2 Enrolment in Registered Secondary Schools by District, Location and Gender, 2010 Foothills Lowlands Mountain S R V Total District M F M F M F M F Butha-Buthe 1233 1790 2185 2938 752 1105 0 0 10003 Leribe 1528 2593 7761 10139 545 718 0 0 23284 Berea 1452 1846 5722 6942 0 0 0 0 15962 Maseru 848 1485 12756 15424 450 892 0 0 31854 Mafeteng 761 1047 4552 5937 0 0 0 0 12297 Mohale's Hoek 729 883 1859 2511 299 583 648 700 8212 Quthing 735 842 371 658 492 1003 1363 1670 7134 Qacha's Nek 0 0 0 0 1905 2644 0 0 4549 Mokhotlong 0 0 0 0 1725 3491 0 0 5216 Thaba-Tseka 0 0 0 0 1380 2637 257 522 4796

26
4.2 Trend Analysis of Registered Secondary Schools Enrolment Table 4.3 shows a trend in enrolment from 2008 to 2010 by gender and district. It is depicted in this table that Maseru has been leading in enrolment from 2008 to 2010, and that Thaba-Tseka had always been the least in those years. The Table also unveiled that total enrolment had increased by 10.6 percent from 2009 to 2010, while an increase of 7.9 percent was observed between 2008 and 2009. Table 4.3 Enrolment in Registered Secondary Schools by District, Gender and Percentage Share per District, 2008-2010
4.3 New Entrants in Registered Secondary Schools In 2010, a total of 46,745 students were new entrants in registered secondary schools. This number had increased by 6.8 percent from the previous year. Out of the total of new entrants, 32,289 were in Form A while 14,745 were in form D. When presented in percentages. Figure 4.1 demonstrated gender disparity among the new entrants. The number of female new entrants was higher than the number of male new entrants. It was also portrayed that at lower ages, there were more new female entrants than males in secondary schools in 2010. The number of females aged below 12 years up to 16 years in junior secondary exceeded the number of males. However, the opposite was observed from age 17 to age 22 implying that, as age increased more males attended junior secondary schools than females. The same picture was observed in senior secondary whereby more female new entrants were enrolled than males. Lastly, the figure depicted a large gap between male and female new entrants at junior secondary and the narrow gap at senior secondary.
District
2008 2009 2010 M F Total %
Share M F Total %
Share M F Total %
Share Butha-Buthe 3676 4912 8588 8.3 3820 5220 9040 8.1 4170 5833 10003 8.1 Leribe 8841 12043 20884 20.2 9424 13237 22661 20.3 9824 13460 23284 18.9 Berea 5607 6658 12265 11.9 6282 7993 14275 12.8 7162 8800 15962 12.9 Maseru 11850 14774 26624 25.8 12801 16132 28933 26.0 14052 17802 31854 25.8 Mafeteng 4637 6122 10759 10.4 5397 7318 12715 11.4 5291 7006 12297 10.0 Mohale's Hoek
3083 4203 7286 7.1 2796 4094 6890 6.2 3535 4677 8212 6.7
Quthing 2549 3440 5989 5.8 2292 3056 5348 4.8 2961 4173 7134 5.8 Qacha's Nek 1279 2147 3426 3.3 1540 2373 3913 3.5 1791 2758 4549 3.7 Mokhotlong 1373 2614 3987 3.9 1112 2613 3725 3.3 1725 3491 5216 4.2 Thaba Tseka 1267 2242 3509 3.4 1416 2564 3980 3.6 1637 3159 4796 3.9 Total 44162 59155 103317 100.0 46880 64600 111480 100.0 52148 71159 123307 100.0

27
4.4 Coverage and Participation in Secondary Education The Gross Enrolment Rate (GER) and Net Enrolment Rate (NER) indicate the overall coverage of an educational system in relation to the population eligible for participation in the system. A high NER denotes a high degree of participation of the official school-age population. The theoretical maximum value is 100 percent. Increasing trends can be considered as reflecting improvement in the participation at the specified level of education. The incidence of under-aged and over-aged enrolment can be observed by the GER. 4.4.1 Gross and Net Enrolment Rates, Pupils to Teacher Ratios and the Gender Parity Indices for Registered Secondary Schools Table 4.4 demonstrates the gross and net enrolment rates, pupils’ teacher ratios and gender parity index for registered secondary schools for the years 2001 to 2010. Compared to the primary level, secondary ratios remained quite low for the period under review. However, unlike in primary schools whereby rates have been decreasing, rates for secondary schools have been increasing over years. The gross enrolment ratio in 2010 was 53.1 percent signifying an increase of 5.4 percent from the 2009 ratio (44.7 percent). Furthermore, increment on male and female gross enrolment ratios were observed from 2009 to 2010. In 2009 GER for females was 55.8 percent and for males was 39.7 percent. In 2010, gross enrolment ratios were
0
500
1000
1500
2000
2500
3000
3500
4000
4500
5000
below 12
12 13 14 15 16 17 18 19 20 21 22 23 24 higher 24
Enro
lmen
t
Age
Figure 4.1 New Entrants in Form A and Form D by Age and Sex - 2010
New entrants Form A M
New entrants Form A F
New entrants Form D M
New entrants Form D F

28
44.4 percent for males and 61.9 for females. These indicate increment of 4.7 percent for males and 6.1 percent for females from 2009 to 2010. The total net enrolment rate also increased from 31.5 percent in 2009 to 34.2 percent in 2010, showing an increment 2.7 percent from the year 2009. On the other hand the NER for both male and female increased by 2.2 percent and 3.1 percent respectively from 2009 to 2010. Since the year 2001 to 2009, the gender parity index from gross enrolment rate remained stable at 1.3 except in 2008, 2009 and 2010 where it increased to 1.4. On the other hand gender parity index from net enrolment rate settled at 1.6 for almost all the years. This signifies the gender disparity that is in favour of females at this level of education. Table 4.4 Secondary School Enrolment Rates, Gender Parity Indices and Pupils Teacher Ratios, 2001-2010
The pupils’ teacher ratios represent the number of students per teacher; the figures from 2001 to 2010 are displayed in Table 4.4. During the period under review, the pupils’ to teacher ratios have been fluctuating between 23 and 27. Although the pupil teacher ratios seemed to be low, some teachers may still somewhat be loaded and teach many children while others may be underutilized. The situation originates from the uneven distribution of enrolments and teachers in registered secondary schools. Many teachers would not like to teach in the remote areas hence, are overpopulated in the schools located in the urban areas or low lands. 4.4.2 Registered Secondary Schools Age Specific Net Enrolment Rates The age Specific net enrolment rates NER1 measures proportion of a population for specific age or age groups, these rates give participation of total appropriate ages of secondary schooling, on the other hand these rates illustrate participation at different ages. NER2 shows the level of participation of children that are supposed to be at secondary. For instance this measure participation of children aged 13 to 17 regardless of whether they are still at primary level or secondary level. The Total NER2
doubled NER1 this gives a picture that most of children delays to attend school so much that at ages when they were supposed to be at secondary schools are still at primary schools. The low rates experienced at secondary education did not mean that about 65 percent of school going age population at secondary schools was out of school but they was still trekking behind at primary level. However a different picture
Year Gross Enrolment Rates Net Enrolment Rates Pupils/Teacher Ratios Total Males Females GPI Total Males Females GPI
2001 32.2 27.9 36.6 1.3 21.3 16.4 26.3 1.6 23.7 2002 33.6 29.0 38.3 1.3 22.0 17.2 27.0 1.6 24.0 2003 34.5 30.1 39.1 1.3 22.8 17.9 27.9 1.6 23.9 2004 36.8 32.2 41.5 1.3 23.8 18.6 29.0 1.5 25.0 2005 39.1 34.2 44.0 1.3 25.4 19.8 31.2 1.6 26.6 2006 39.8 34.8 44.9 1.3 25.7 20.0 31.4 1.6 25.7 2007 41.4 35.5 47.3 1.3 27.0 20.8 33.4 1.6 24.4 2008 43.8 37.1 50.6 1.4 29.0 22.3 35.9 1.6 24.0 2009 47.7 39.7 55.8 1.4 31.5 23.8 39.4 1.7 23.5 2010 53.1 44.4 61.9 1.4 34.2 26.0 42.5 1.6 25.8
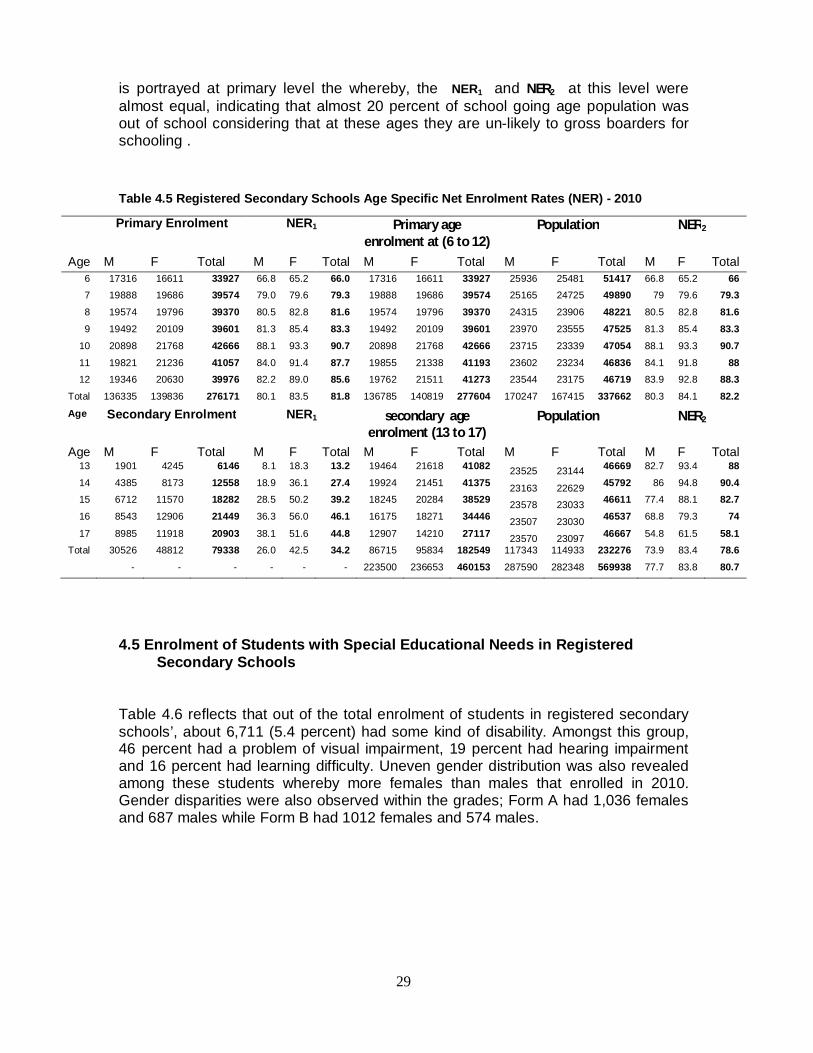
29
is portrayed at primary level the whereby, the NER1 and NER2 at this level were almost equal, indicating that almost 20 percent of school going age population was out of school considering that at these ages they are un-likely to gross boarders for schooling . Table 4.5 Registered Secondary Schools Age Specific Net Enrolment Rates (NER) - 2010
4.5 Enrolment of Students with Special Educational Needs in Registered Secondary Schools Table 4.6 reflects that out of the total enrolment of students in registered secondary schools’, about 6,711 (5.4 percent) had some kind of disability. Amongst this group, 46 percent had a problem of visual impairment, 19 percent had hearing impairment and 16 percent had learning difficulty. Uneven gender distribution was also revealed among these students whereby more females than males that enrolled in 2010. Gender disparities were also observed within the grades; Form A had 1,036 females and 687 males while Form B had 1012 females and 574 males.
Primary Enrolment NER1 Primary age enrolment at (6 to 12)
Population NER2
Age M F Total M F Total M F Total M F Total M F Total 6 17316 16611 33927 66.8 65.2 66.0 17316 16611 33927 25936 25481 51417 66.8 65.2 66 7 19888 19686 39574 79.0 79.6 79.3 19888 19686 39574 25165 24725 49890 79 79.6 79.3 8 19574 19796 39370 80.5 82.8 81.6 19574 19796 39370 24315 23906 48221 80.5 82.8 81.6 9 19492 20109 39601 81.3 85.4 83.3 19492 20109 39601 23970 23555 47525 81.3 85.4 83.3
10 20898 21768 42666 88.1 93.3 90.7 20898 21768 42666 23715 23339 47054 88.1 93.3 90.7 11 19821 21236 41057 84.0 91.4 87.7 19855 21338 41193 23602 23234 46836 84.1 91.8 88 12 19346 20630 39976 82.2 89.0 85.6 19762 21511 41273 23544 23175 46719 83.9 92.8 88.3
Total 136335 139836 276171 80.1 83.5 81.8 136785 140819 277604 170247 167415 337662 80.3 84.1 82.2 Age Secondary Enrolment NER1 secondary age
enrolment (13 to 17) Population NER2
Age M F Total M F Total M F Total M F Total M F Total 13 1901 4245 6146 8.1 18.3 13.2 19464 21618 41082 23525 23144 46669 82.7 93.4 88 14 4385 8173 12558 18.9 36.1 27.4 19924 21451 41375 23163 22629 45792 86 94.8 90.4 15 6712 11570 18282 28.5 50.2 39.2 18245 20284 38529 23578 23033 46611 77.4 88.1 82.7 16 8543 12906 21449 36.3 56.0 46.1 16175 18271 34446 23507 23030 46537 68.8 79.3 74 17 8985 11918 20903 38.1 51.6 44.8 12907 14210 27117 23570 23097 46667 54.8 61.5 58.1
Total 30526 48812 79338 26.0 42.5 34.2 86715 95834 182549 117343 114933 232276 73.9 83.4 78.6 - - - - - - 223500 236653 460153 287590 282348 569938 77.7 83.8 80.7
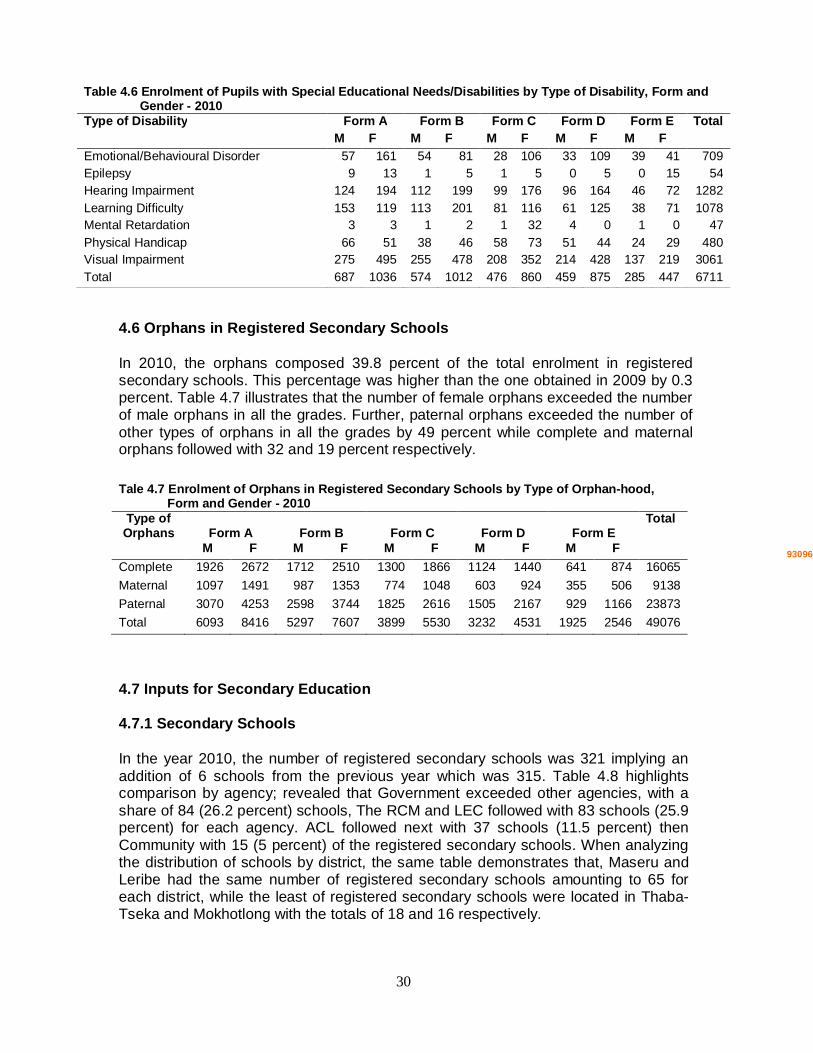
30
4.6 Orphans in Registered Secondary Schools In 2010, the orphans composed 39.8 percent of the total enrolment in registered secondary schools. This percentage was higher than the one obtained in 2009 by 0.3 percent. Table 4.7 illustrates that the number of female orphans exceeded the number of male orphans in all the grades. Further, paternal orphans exceeded the number of other types of orphans in all the grades by 49 percent while complete and maternal orphans followed with 32 and 19 percent respectively.
4.7 Inputs for Secondary Education 4.7.1 Secondary Schools In the year 2010, the number of registered secondary schools was 321 implying an addition of 6 schools from the previous year which was 315. Table 4.8 highlights comparison by agency; revealed that Government exceeded other agencies, with a share of 84 (26.2 percent) schools, The RCM and LEC followed with 83 schools (25.9 percent) for each agency. ACL followed next with 37 schools (11.5 percent) then Community with 15 (5 percent) of the registered secondary schools. When analyzing the distribution of schools by district, the same table demonstrates that, Maseru and Leribe had the same number of registered secondary schools amounting to 65 for each district, while the least of registered secondary schools were located in Thaba-Tseka and Mokhotlong with the totals of 18 and 16 respectively.
Table 4.6 Enrolment of Pupils with Special Educational Needs/Disabilities by Type of Disability, Form and Gender - 2010 Type of Disability Form A Form B Form C Form D Form E Total
M F M F M F M F M F Emotional/Behavioural Disorder 57 161 54 81 28 106 33 109 39 41 709 Epilepsy 9 13 1 5 1 5 0 5 0 15 54 Hearing Impairment 124 194 112 199 99 176 96 164 46 72 1282 Learning Difficulty 153 119 113 201 81 116 61 125 38 71 1078 Mental Retardation 3 3 1 2 1 32 4 0 1 0 47 Physical Handicap 66 51 38 46 58 73 51 44 24 29 480 Visual Impairment 275 495 255 478 208 352 214 428 137 219 3061 Total 687 1036 574 1012 476 860 459 875 285 447 6711
Tale 4.7 Enrolment of Orphans in Registered Secondary Schools by Type of Orphan-hood, Form and Gender - 2010
Type of Orphans
Form A
Form B
Form C
Form D
Form E
Total
M F M F M F M F M F Complete 1926 2672 1712 2510 1300 1866 1124 1440 641 874 16065 Maternal 1097 1491 987 1353 774 1048 603 924 355 506 9138 Paternal 3070 4253 2598 3744 1825 2616 1505 2167 929 1166 23873 Total 6093 8416 5297 7607 3899 5530 3232 4531 1925 2546 49076
93096
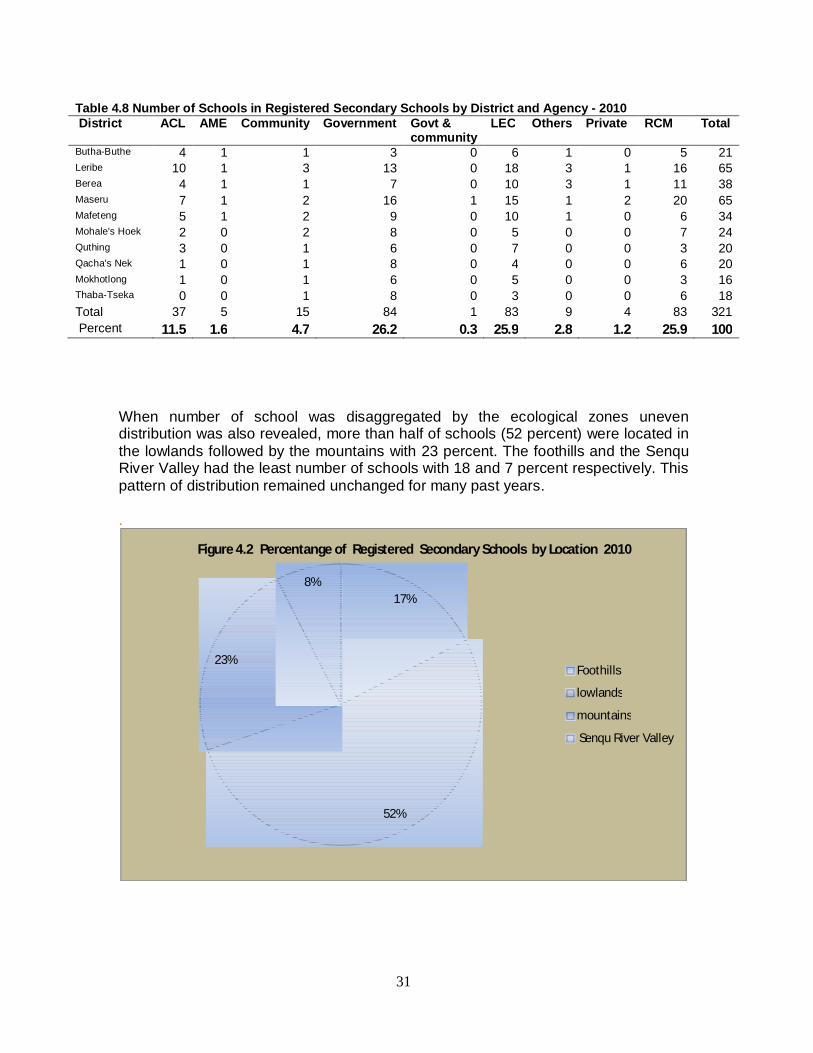
31
When number of school was disaggregated by the ecological zones uneven distribution was also revealed, more than half of schools (52 percent) were located in the lowlands followed by the mountains with 23 percent. The foothills and the Senqu River Valley had the least number of schools with 18 and 7 percent respectively. This pattern of distribution remained unchanged for many past years. .
17%
52%
23%
8%
Foothills
lowlands
mountains
Senqu River Valley
Figure 4.2 Percentange of Registered Secondary Schools by Location 2010
Table 4.8 Number of Schools in Registered Secondary Schools by District and Agency - 2010 District ACL AME Community Government Govt &
community LEC Others Private RCM Total
Butha-Buthe 4 1 1 3 0 6 1 0 5 21 Leribe 10 1 3 13 0 18 3 1 16 65 Berea 4 1 1 7 0 10 3 1 11 38 Maseru 7 1 2 16 1 15 1 2 20 65 Mafeteng 5 1 2 9 0 10 1 0 6 34 Mohale's Hoek 2 0 2 8 0 5 0 0 7 24 Quthing 3 0 1 6 0 7 0 0 3 20 Qacha's Nek 1 0 1 8 0 4 0 0 6 20 Mokhotlong 1 0 1 6 0 5 0 0 3 16 Thaba-Tseka 0 0 1 8 0 3 0 0 6 18 Total 37 5 15 84 1 83 9 4 83 321 Percent 11.5 1.6 4.7 26.2 0.3 25.9 2.8 1.2 25.9 100

32
4.7.2 Secondary School Teachers The number of secondary teachers was 5006 in 2010 and it was 4,735 in 2009, indicating an increment of 5.7 percent, between these years, this was lower than the one which was between 2008 and 2009, which amounted to 9.9 percent. The number of female teachers constituted 56 percent which evidently, implied that more female teachers than male teachers were at secondary level. The same percentages of both males and female teachers were experienced in 2009. The distribution by districts unveiled that about 25 percent of teachers were in Maseru while Leribe and Berea followed with 20 and 12 percent respectively. Thaba-Tseka was the least with the number of teachers in registered secondary schools. The number of teachers by qualifications revealed that there were more qualified teachers than unqualified teachers at secondary level. Qualified teachers increased to 76 percent from 72 percent of 2009. On the other side the unqualified teachers contributed only 24 compared to 28 percent of 2009. Unqualified teachers included those who acquired certificates such as: Joint Matriculation Board Certificate (JMB), Primary Lower Certificate III (P.L.III), Advanced Primary Teacher’s Certificate (APTC), Cambridge Overseas School Certificate (COSC) and Junior Certificate (JC). Table 4.9 Number of Teachers in Registered Secondary Schools by District and Gender- 2010
District All Teachers Qualified Teachers Unqualified Teachers Males Females Total Males Females Total Males Females Total
Butha-Buthe 165 190 355 122 153 275 43 37 80 Leribe 434 491 925 302 390 692 132 101 233 Berea 268 353 621 188 280 468 80 73 153 Maseru 470 738 1208 333 595 928 137 143 280 Mafeteng 223 269 492 158 207 365 65 62 127 Mohale’s Hoek 151 206 357 104 172 276 47 34 81 Quthing 126 131 257 83 97 180 43 34 77 Qacha’s Nek 81 103 184 54 84 138 27 19 46 Mokhotlong 78 117 195 53 94 147 25 23 48 Thaba-Tseka 85 95 180 64 77 141 21 18 39 Total 2081 2693 4774 1461 2149 3610 620 544 1164

33
4.8 Efficiency and Quality of Education in Registered Secondary Schools 4.8.1 Repeaters in Registered Secondary Schools In 2010, repeaters contributed 14 percent of the total enrolment of secondary students and this percent was similar to the one obtained in the previous year. Gender comparison disclosed that there were more female repeaters than male repeaters in all the grades at this level. Table 3.10 shows that amongst 17,234 repeaters, 29 percent in form A which recorded lower percentage compared to the one recorded in 2009 which was 31 percent. In Form B the 33 percent of repeaters in 2010 was lower than the one in 2009 which was 35 percent. In form C the percentage of repeaters amounted to 16 percent in 2010 while in 2009 the figure was 14 percent. In form D the figure for repeaters rose to 19 percent while in 2009 was 18 percent. While in form E the percent for repeaters was as low as 2 percent in 2010. This highlights a slight quality improvement in the lower grades than in the higher grades Analysis by agency in Table 4.10 discloses that LEC and RCM schools constituted 29 and 27 percent of repeaters, respectively, while Government and ACL schools had 21 and 12 percent of those repeaters in respective order., the other agencies had fewer numbers of repeaters.
Further, disaggregation by districts and ecological zones portrayed that the number of repeaters tended to follow the same pattern as that of enrolment. For instance, lowlands emerged as the highest with 62 percent of repeaters followed by foothills, mountains and senqu river valley with 18, 13 and 7 percent respectively. The leading districts in percentages of repeaters were Maseru, Leribe, Berea and Mafeteng with 23, 20, 15 and 13 percent sequentially. Thaba-Tseka and Qacha’s Nek constituted the lowest percent of repeaters in registered secondary schools.
Table 4.10 Enrolment of Repeaters in Registered Secondary Schools by Agency, Form and Gender – 2010 Agency
Form A Form B Form C Form D Form E Total M F M F M F M F M F
ACL 247 279 252 356 110 203 191 229 28 34 1929 AME 5 3 36 61 31 43 30 102 3 5 319 Community 75 98 115 147 23 26 64 77 1 6 632 Government 765 938 627 968 159 281 231 303 5 9 4286 Govt & community 3 7 9 12 3 25 0 0 0 0 59 LEC 677 762 753 928 342 520 423 601 54 36 5096 Others 39 35 85 73 73 77 69 121 1 4 577 Private 4 7 10 3 38 55 5 14 3 16 155 RCM 513 599 586 790 287 402 369 543 46 46 4181 Percent 29 34 16 19 2 100 Total 2328 2728 2473 3338 1066 1632 1382 1990 141 156 17234
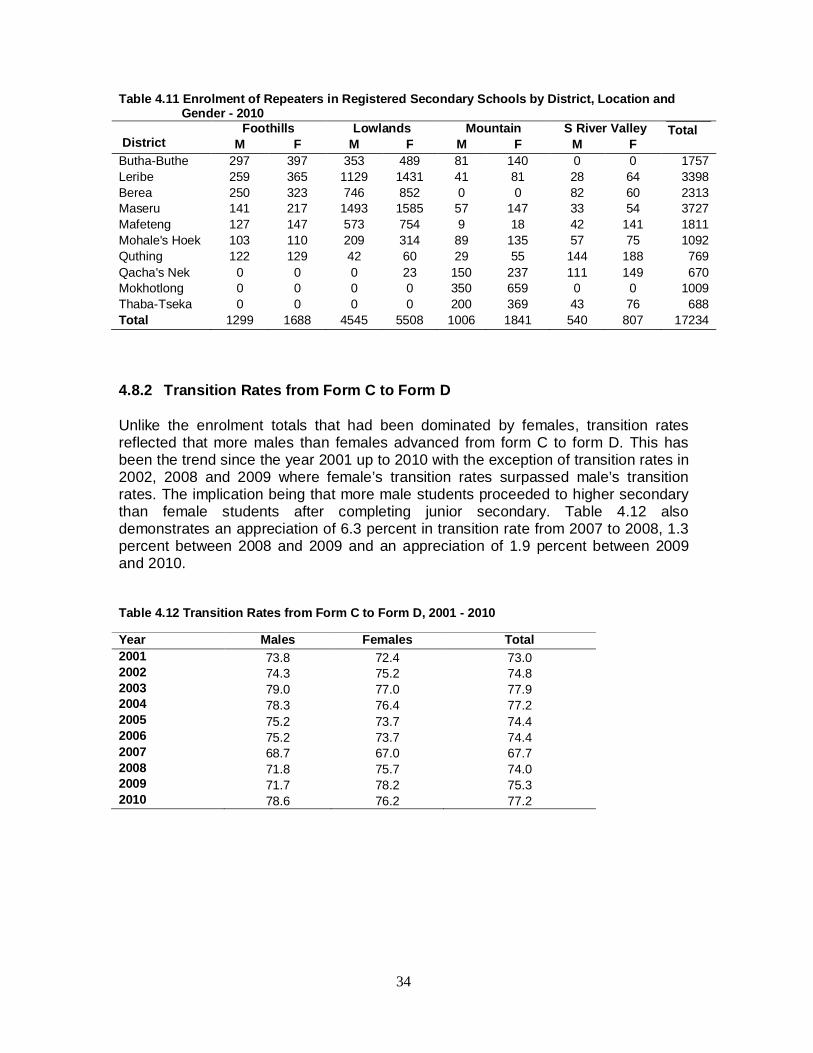
34
4.8.2 Transition Rates from Form C to Form D Unlike the enrolment totals that had been dominated by females, transition rates reflected that more males than females advanced from form C to form D. This has been the trend since the year 2001 up to 2010 with the exception of transition rates in 2002, 2008 and 2009 where female’s transition rates surpassed male’s transition rates. The implication being that more male students proceeded to higher secondary than female students after completing junior secondary. Table 4.12 also demonstrates an appreciation of 6.3 percent in transition rate from 2007 to 2008, 1.3 percent between 2008 and 2009 and an appreciation of 1.9 percent between 2009 and 2010. Table 4.12 Transition Rates from Form C to Form D, 2001 - 2010
Table 4.11 Enrolment of Repeaters in Registered Secondary Schools by District, Location and Gender - 2010 District
Foothills Lowlands Mountain S River Valley Total M F M F M F M F
Butha-Buthe 297 397 353 489 81 140 0 0 1757 Leribe 259 365 1129 1431 41 81 28 64 3398 Berea 250 323 746 852 0 0 82 60 2313 Maseru 141 217 1493 1585 57 147 33 54 3727 Mafeteng 127 147 573 754 9 18 42 141 1811 Mohale's Hoek 103 110 209 314 89 135 57 75 1092 Quthing 122 129 42 60 29 55 144 188 769 Qacha's Nek 0 0 0 23 150 237 111 149 670 Mokhotlong 0 0 0 0 350 659 0 0 1009 Thaba-Tseka 0 0 0 0 200 369 43 76 688 Total 1299 1688 4545 5508 1006 1841 540 807 17234
Year Males Females Total 2001 73.8 72.4 73.0 2002 74.3 75.2 74.8 2003 79.0 77.0 77.9 2004 78.3 76.4 77.2 2005 75.2 73.7 74.4 2006 75.2 73.7 74.4 2007 68.7 67.0 67.7 2008 71.8 75.7 74.0 2009 71.7 78.2 75.3 2010 78.6 76.2 77.2
35
4.8.3 Examination Results 4.8.3.1 Junior Certificate Examination The number of candidates who sat for junior secondary examinations increased by 10.6 percent from the year 2009 to 2010; this was lower than the one from 2008 to 2009 which increased by 16.9 percent. The best results were realized in 2004, whereby about 76 percent of students who sat for junior secondary examinations managed to pass, compared to 70 percent that managed to pass in 2010. The least percent of failures in 2004 (24.4 percent) also emphasized the good results of this year. The percentage of students who passed examinations fluctuated between 70 and 74 percent from 2002 to 2010 except in 2006 and 2009 where the percentages were 65 and 68.4 respectively. An appreciation of 0.6 percent was observed in 2010. Some improvement of those who passed with merit (1.6 percent) was observed in 2010 compared to 1.3 percent of 2009. On the other hand no improvements were recognized from those who obtained second class (51.3 percent) and third class passes (9.7 percent), compared to 49.9 and 9.4 of 2009 in respective order. Nevertheless the number of those who failed improved from 31.6 in 2009 to 30 percent in 2010.

36
Table 4.13 Junior Certificate Examination Results, 2002-2010
4.8.3.2 Cambridge Overseas School Certificate Examination Results In the senior secondary, the percentage of passes signified some slow improvement during the period under review. The percentage of passes had been moderately ascending from 2002 to 2005 and thereafter started to oscillate until 2010. Table 4.14 depicts that a rise of 1.4 percent of passes from 2007 to 2008 and this was followed by 0.6 percent decrease from 2008 to 2009 and an increase of 0.4 percent from 2009 to 2010. The highest percentage of passes was recorded in 2008. On the other hand the percentage of first class passes symbolized steady development from one year to another. The table further demonstrates fluctuations in second class passes and third class passes. The percentages of those obtaining General Certificate of Education (GCE) progressively dropped over the years, with exceptions of 2009 except in 2009 where 1.5 percent increase was viewed. Table 4.14 Cambridge Overseas School Certificate Examination Results, 2002-2010 Year 2002 2003 2004 2005 2006 2007 2008 2009 2010 Candidates 7131 7189 7718 8133 8899 9026 9599 10180 10885 Total passes 3579 3666 4061 4457 4860 5068 5522 5789 6238 Percentage of passes 50.2 51.1 52.6 54.8 54.6 56.1 57.5 56.9 57.3 Number of first class passes 208 235 309 350 372 430 533 584 649 First class percentages 2.9 3.3 4.0 4.3 4.2 4.8 5.6 5.7 5.9 Number of second class passes Second class percentages
1138 1126 16.0 15.7
1287 16.7
1472 18.1
1570 17.6
1690 1853 1823 2034 18.7 19.3 17.9 18.7
Number of third class passes 2233 2305 2465 2635 2918 2948 3136 3382 3555 Third class percentages 31.3 32.1 32.0 32.4 32.8 32.7 32.7 33.2 32.7 Number that obtained GCE 3467 3387 3586 3590 3884 3872 3934 4329 4581 Percent of GCE 48.6 47.1 46.5 44.1 43.6 42.9 41.0 42.5 42.1 Number of failures 85 136 71 86 155 86 63 62 66 Percentages of failures 1.2 1.9 0.9 1.1 1.7 1.0 0.7 0.6 0.6
Year 2002 2003 2004 2005 2006 2007 2008 2009 2010 Candidates 12545 13146 14346 14737 15081 15717 16056 18774 20766 Total passes 9250 9635 10842 10630 9800 11155 11423 12840 14523 Percentage of passes 73.7 73.3 75.6 72.1 65.0 71.0 71.1 68.4 70 Number of first class with merit 120 158 221 127 213 159 233 253 333 Merit percentages 1.0 1.2 1.5 0.9 1.4 1.0 1.5 1.3 1.6 Number of first class passes 812 794 987 742 972 906 997 1451 1524 First class percentages 6.5 6.0 6.9 5.0 6.4 5.8 6.2 7.7 7.3 Number of second class passes 6878 7220 8036 7445 7155 8257 8370 9364 10656 Second class percentages 54.8 55.0 56.0 50.5 47.4 52.5 52.1 49.9 51.3 Number of third class passes 1440 1463 1589 2316 1460 1833 1823 1772 2010 Third class percentages 11.4 11.1 11.1 15.7 9.7 11.7 11.4 9.4 9.7 Number of failures 3295 3511 3504 4107 5281 4562 4633 5934 6243 Percentages of failures 26.3 26.7 24.4 27.9 35.0 29.0 28.9 31.6 30
37
Chapter 5 Technical and Vocational Training 5.0 Introduction The Department of Technical and Vocational Training (TVD) of the Ministry of Education and Training is an authorized regulatory body that aims to improve the quality of delivery systems and mechanisms through:
(a) Curriculum development, (b) Inspection and assessment, (c) Accreditation of programmes and institutions, (d) Administration of trade tests to determine skills proficiency levels of workers, (e) Support in terms of provision of workshops and equipment, (f) Training of staff at TVET institutions and schools and (g) Continual assessment of skills need.
These institutions comprise; Bernarda Home Economics School, Bishop Allard Vocational, Technical School of Leloaleng, St. Elizabeth, St. Mary’s Home, Thaba Tseka Technical Institute (TTI), and Technical School of Leribe. Through its support to education at this level, The Government provides budgetary support mainly for teacher salaries. Besides the institutions supported by TVD, there are many other registered private training institutions and skills training centres and unaccredited programmes and institutions and informal training in the form of traditional unrecognized apprenticeship. TVET institutions offer Post-COSC, post-JC as well as post PSLE courses. 5.1 Enrolment Enrolment in the technical and vocational training was 1746 in 2010 and this included both registered and unregistered institutions. Mohale’s Hoek was leading with 717 enrolled students followed by Maseru, Leribe and Quthing with 406, 282 and 209 respectively. Males constituted 58 percent of enrolment while their female counterparts contributed 42 percent.
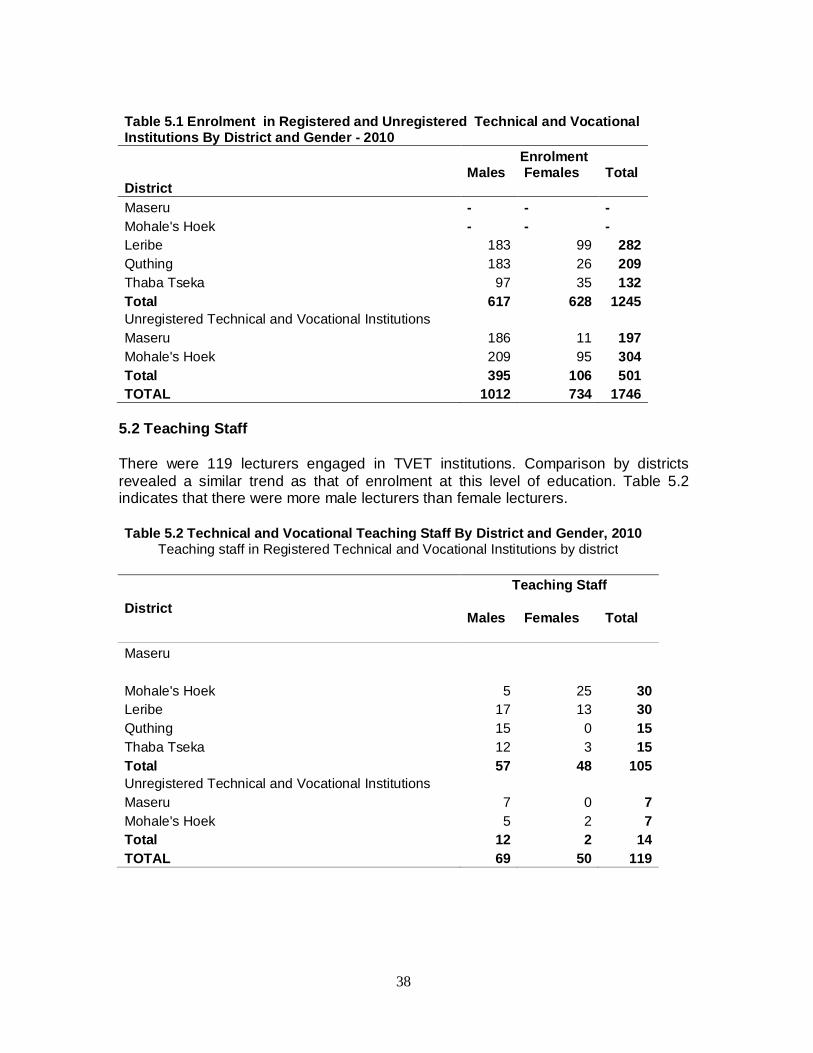
38
Table 5.1 Enrolment in Registered and Unregistered Technical and Vocational Institutions By District and Gender - 2010
District
Enrolment Males
Females
Total
Maseru - - - Mohale's Hoek - - - Leribe 183 99 282 Quthing 183 26 209 Thaba Tseka 97 35 132 Total 617 628 1245 Unregistered Technical and Vocational Institutions Maseru 186 11 197 Mohale's Hoek 209 95 304 Total 395 106 501 TOTAL 1012 734 1746
5.2 Teaching Staff There were 119 lecturers engaged in TVET institutions. Comparison by districts revealed a similar trend as that of enrolment at this level of education. Table 5.2 indicates that there were more male lecturers than female lecturers. Table 5.2 Technical and Vocational Teaching Staff By District and Gender, 2010
Teaching staff in Registered Technical and Vocational Institutions by district
District Teaching Staff
Males
Females
Total
Maseru Mohale's Hoek 5 25 30 Leribe 17 13 30 Quthing 15 0 15 Thaba Tseka 12 3 15 Total 57 48 105 Unregistered Technical and Vocational Institutions Maseru 7 0 7 Mohale's Hoek 5 2 7 Total 12 2 14 TOTAL 69 50 119

39
Chapter 6 Tertiary Education 6.0 Introduction
Tertiary or higher learning in Lesotho is envisaged to produce high quality and large quantity of human resource for enhancement of socio-economic development of a nation. The institutions consist of National University of Lesotho, Limkokwing University of Creative Technology and Lesotho College of education just to mention a few. National University of Lesotho is one of the highest learning institutions mandated to produce magnificent quality and huge quantity of human resource that is labour market oriented and globally competitive. On the other hand, Limkokwing University of Creative Technology founded in 2008, is determined to transform tertiary education and to empower young generation with creative learning with its new teaching methodologies such as thinking skills, innovative mindsets and creativity. Lesotho College of education (LCE) trains teachers for both primary and junior secondary schools. It trains both part-time teachers that are already in-service and full time teachers those that not yet absorbed in the labour market but were able to precede secondary education and met the entry requirement of LCE. 6.1 National University of Lesotho 6.1.1 Enrolment The National University of Lesotho total enrollment has been ascending over the years 1997/98 to 2009/10 for both part-time and full time students. For instance for a period of ten years the number of part-time student and fulltime students more than doubled. Further, enrolment of undergraduates rose from 10,071 in 2008/09 to 11,137 in 2009/10. Out of the aforementioned total enrolment in 2009/10, females constituted 61 percent while males contributed 39 percent. On the other hand the number of postgraduate students was 168 out of which 55 percent were females and 45 percent were their male counterparts. Table 6.1 NUL Undergraduate Student Population (Part-time and Full-time) 1997/98-2009/10 YEAR Part-Time Full-Time TOTAL 2009/10 3093 8044 11137 2008/09 2300 7771 10071 2007/08 2049 7346 9395 2006/07 1784 6724 8508 2005/06 1899 5921 7820 2004/05 2117 5140 7257 2003/04 1949 4765 6714 2002/03 1734 4067 5801 2001/02 1492 3167 4659 2000/01 1332 2812 4144 1999/00 1411 2471 3882 1998/99 886 2208 3094 1997/98 528 2118 2646

40
During the same academic year, out of the full time enrolment of 8,044 of students females’ enrolment was higher with 53 percent while males’ enrolment was 47 percent. Enrolment of full time postgraduate students was 126 whereby enrolment of females trailed that of males by 42 percent. Table 6.2 NUL Undergraduate Student Population By Sex (Full Time) 1997/98 – 2009/10
As demonstrated in figure 4.1, most students were enrolled in the Faculty of Social Sciences (32%) followed by Institute of Extra Mutual Studies (IEMS) and Faculty of Education sharing 15 percent each while Faculty of Science and Technology tracked by 14 percent. Amongst the faculties with small percentage of enrolment were Faculty of Law and Institute of Education (IE).
YEAR MALES FEMALES TOTAL 2009/10 3770 4274 8044 2008/09 3892 4302 8194 2007/08 3473 3873 7346 2006/07 3247 3477 6724 2005/06 2838 3083 5921 2004/05 2439 2701 5140 2003/04 2221 2544 4765 2002/03 1989 2078 4067 2001/02 1503 1664 3167 2000/01 1289 1523 2812 1999/00 1142 1329 2471 1998/99 1004 1204 2208 1997/98 959 1159 2118
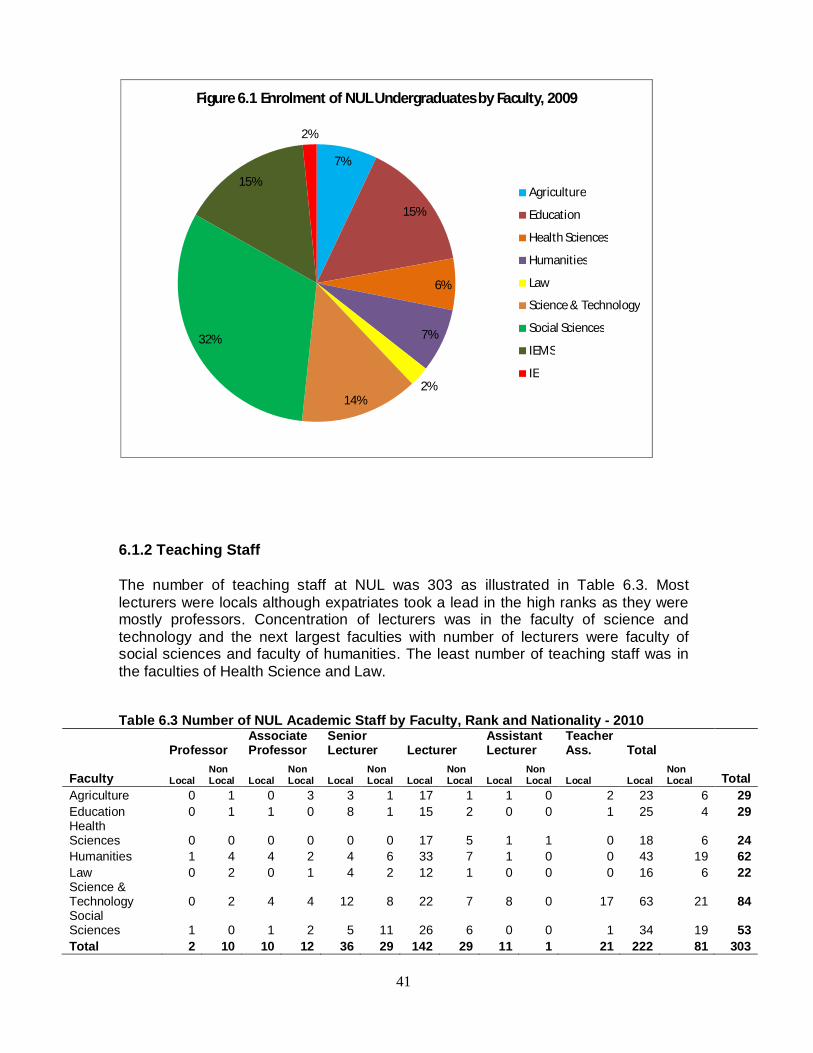
41
6.1.2 Teaching Staff The number of teaching staff at NUL was 303 as illustrated in Table 6.3. Most lecturers were locals although expatriates took a lead in the high ranks as they were mostly professors. Concentration of lecturers was in the faculty of science and technology and the next largest faculties with number of lecturers were faculty of social sciences and faculty of humanities. The least number of teaching staff was in the faculties of Health Science and Law. Table 6.3 Number of NUL Academic Staff by Faculty, Rank and Nationality - 2010
Faculty
Professor Associate Professor
Senior Lecturer Lecturer
Assistant Lecturer
Teacher Ass. Total
Total Local Non Local Local
Non Local Local
Non Local Local
Non Local Local
Non Local Local Local
Non Local
Agriculture 0 1 0 3 3 1 17 1 1 0 2 23 6 29 Education 0 1 1 0 8 1 15 2 0 0 1 25 4 29 Health Sciences 0 0 0 0 0 0 17 5 1 1 0 18 6 24 Humanities 1 4 4 2 4 6 33 7 1 0 0 43 19 62 Law 0 2 0 1 4 2 12 1 0 0 0 16 6 22 Science & Technology 0 2 4 4 12 8 22 7 8 0 17 63 21 84 Social Sciences 1 0 1 2 5 11 26 6 0 0 1 34 19 53 Total 2 10 10 12 36 29 142 29 11 1 21 222 81 303
7%
15%
6%
7%
2%14%
32%
15%
2%
Figure 6.1 Enrolment of NUL Undergraduates by Faculty, 2009
Agriculture
Education
Health Sciences
Humanities
Law
Science & Technology
Social Sciences
IEMS
IE
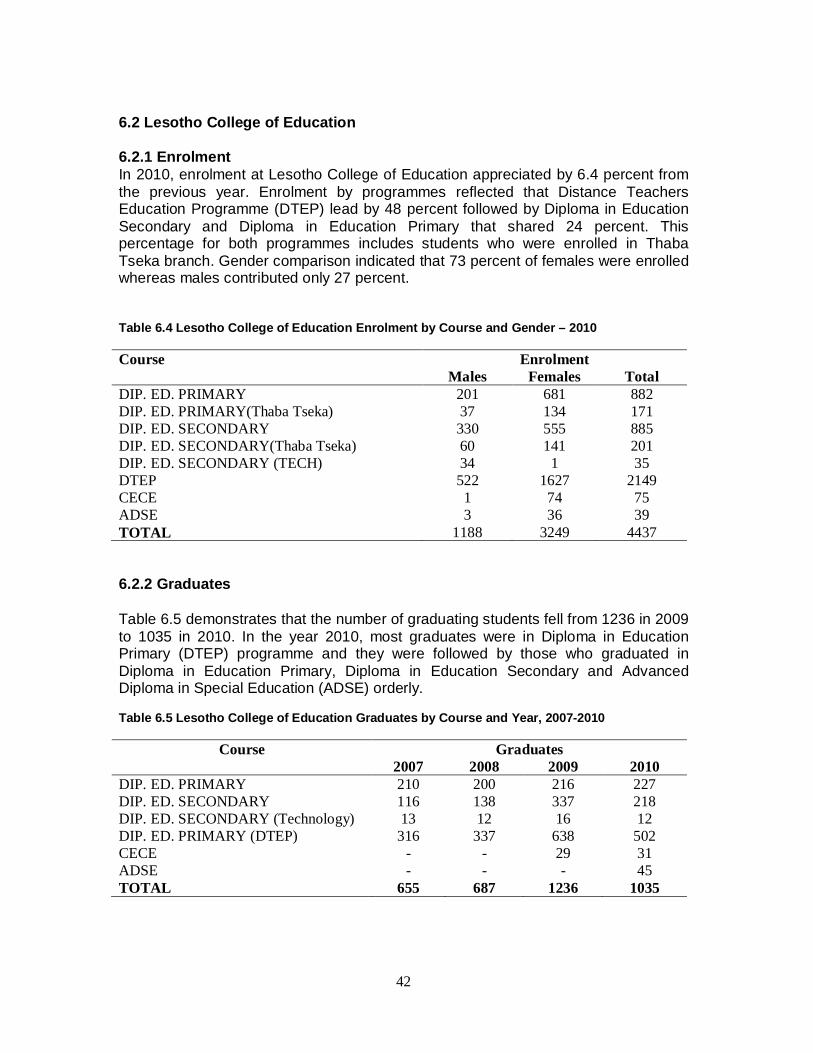
42
6.2 Lesotho College of Education 6.2.1 Enrolment In 2010, enrolment at Lesotho College of Education appreciated by 6.4 percent from the previous year. Enrolment by programmes reflected that Distance Teachers Education Programme (DTEP) lead by 48 percent followed by Diploma in Education Secondary and Diploma in Education Primary that shared 24 percent. This percentage for both programmes includes students who were enrolled in Thaba Tseka branch. Gender comparison indicated that 73 percent of females were enrolled whereas males contributed only 27 percent. Table 6.4 Lesotho College of Education Enrolment by Course and Gender – 2010 Course Enrolment
Males Females Total DIP. ED. PRIMARY 201 681 882 DIP. ED. PRIMARY(Thaba Tseka) 37 134 171 DIP. ED. SECONDARY 330 555 885 DIP. ED. SECONDARY(Thaba Tseka) 60 141 201 DIP. ED. SECONDARY (TECH) 34 1 35 DTEP 522 1627 2149 CECE 1 74 75 ADSE 3 36 39 TOTAL 1188 3249 4437 6.2.2 Graduates Table 6.5 demonstrates that the number of graduating students fell from 1236 in 2009 to 1035 in 2010. In the year 2010, most graduates were in Diploma in Education Primary (DTEP) programme and they were followed by those who graduated in Diploma in Education Primary, Diploma in Education Secondary and Advanced Diploma in Special Education (ADSE) orderly. Table 6.5 Lesotho College of Education Graduates by Course and Year, 2007-2010
Course Graduates 2007 2008 2009 2010
DIP. ED. PRIMARY 210 200 216 227 DIP. ED. SECONDARY 116 138 337 218 DIP. ED. SECONDARY (Technology) 13 12 16 12 DIP. ED. PRIMARY (DTEP) 316 337 638 502 CECE - - 29 31 ADSE - - - 45 TOTAL 655 687 1236 1035

43
6.2.3 Teaching Staff The number of teaching staff in 2010 did not vary from previous year figure of 127. Illustrated in Table 6.6 is that most lecturers were in the department of Social Sciences while departments of Applied Sciences and DTEP tracked with the number of lecturers. Female lectures contributed a larger number in the institution even though male lecturers outnumbered female lectures in the department of Applied Sciences. Table 6.6 Lesotho College of Education Teaching Staff by Department and Gender - 2010 Department Teaching Staff
Males Females Total Social Sciences 16 18 34 Applied Sciences 14 10 24 DTEP 9 15 24 Education 2 11 13 Pure Sciences 6 13 19 Thaba Tseka (Branch) 5 8 13 Total 52 75 127 6.3 Limkokwing University of Creative Technology
6.3.1 Enrolment Enrolment increased from 2,349 a figure recorded in 2009 to 3,108 in 2010. Faculty of Business and Globalization was leading with 35 percent of enrolled students while Faculty of Information Technology and Faculty of Creativity in Tourism and Hospitality followed with 22 and 17 percent consecutively. The least percentage of enrolment was recognized in the Faculty of Architecture and Interior Design with only 3 percent. Gender disparity portrayed female enrolment as higher than that of males recording 56 percent compared to 44 percent of males. Table 6.7 Limkokwing University of Creative Technology Enrolment by Faculty and Gender - 2010 Faculty Students
Males Females Total Business & Globalization 461 620 1081
Information Technology 312 374 686 Architecture & Interior Design 63 33 96
Design Innovation 75 96 171 Communication & Media 138 167 305
Film, Television & Broadcasting 114 123 237 Creativity in Tourism & Hospitality 216 316 532
Total 1379 1729 3108

44
6.3.2 Teaching Staff The number of academic staff in the institution increased from a total of 69 in 2009 to 79 in 2010. Most lecturers were in the Faculty of Business followed by Faculty of Communication and Faculty of Information Technology consecutively. The total numbers of both female and male lecturers were almost equal. However gender inequalities were prominent within the faculties, male lecturers dominated in the faculty of Information and technology and most female lecturers were in the Faculty of Business. Table 6.8 Limkokwing University of Creative Technology Academic Staff by Faculty, Nationality and Gender - 2010
Faculty
Academic Staff Males Females Total
Faculty of Business 11 19 30 Faculty of Information Technology 12 6 18 Faculty of Communication 10 9 19 Faculty of Design Innovation 6 6 12
Total 39 40 79 6.4 National Health Training Centre 6.4.1 Enrolment Table 6.9 below illustrates enrolment at National Health Training Centre (NHTC) by gender and programme. The decline of 8.4 percent in enrolment was experienced between the year 2009 and 2010 (falling from 488 in 2009 to 447 in 2010). Most students enrolled in Diploma in General Nursing Programme, followed by those who enrolled in Certificate in Nursing Assistant and Diploma in Midwifery. Enrolment of females surpassed that of males in almost all the programmes, constituting 76 percent whereas males trailed by 24 percent. However, males’ enrolment was leading in Diploma in Pharmacy Technology. Table 6.9 National Health Training Centre Enrolment by Programme and Gender - 2010 Programme Students
Males Females Total Diploma in General Nursing 18 126 144 Certificate in Nursing Assistant 9 64 73 Certificate in Environmental Health 18 24 42 Diploma in Pharmacy Technology 29 25 54 Diploma in Medical Lab Sciences 23 26 49 Diploma in Ophthalmic Nursing 3 11 14 Diploma in Midwifery 7 61 68 Diploma in Primary Health Care Nursing 0 3 3 Total 107 340 447

45
6.4.2 Graduates Table 6.10, portrays the decrease in number of graduates by 3 percent between 2008 and 2009, it also reports an increase of 28 percent from 2009 to 2010. The Diploma in General nursing programme topped other programmes with the number of graduates in all the years under review. On the other hand the graduates in certificate in Nursing Assistant followed next for the years 2008 and 2009 while Diploma in midwifery held the third position in the same years. On contrary in 2010 the Certificate in nursing assistant was the next highest in number of graduates followed by diploma in midwifery. Table 6.10 National Health Training Centre Graduates by Programme, 2008 – 2010 Programme Graduates
2008 2009 2010 Diploma in General Nursing 46 49 74 Certificate in Nursing Assistant 34 33 39 Certificate in Environmental Health 23 30 21 Diploma in Pharmacy Technology 20 0 15 Diploma in Medical Lab Sciences 13 10 20 Diploma in Psychiatric Nursing 5 0 7 Diploma in Ophthalmic Nursing 0 5 0 Diploma in Midwifery 35 41 38 Diploma in Anaesthetic Nursing 0 0 3 Diploma in Primary Health Care Nursing 0 2 0 Total 176 170 217 6.4.3 Teaching Staff The number of lecturers was 37 as depicted in Table 6.11. The same trend as that of enrolment displayed that General Nursing was leading with the number of teaching staff. Majority of the teaching staff were females and were dominant in all the departments except in Environmental Health department. Table 6.11 National Health Training Centre Teaching Staff by Department and Gender – 2010 Department Teaching Staff
Males Females Total Diploma in General Nursing 2 6 8 Certificate in Nursing Assistant 0 4 4 Certificate in Environmental Health 3 0 3 Diploma in Pharmacy Technology 2 2 4 Diploma in Medical Lab Sciences 3 3 6 Diploma in Psychiatric Nursing 0 3 3 Diploma in Ophthalmic Nursing 0 3 3 Diploma in Midwifery 0 4 4 Diploma in Primary Health Care Nursing 0 2 2 Total 10 27 37

46
6.5 Lerotholi Polytechnic 6.5.1 Enrolment Within the total enrolment of 2,022 registered in 2010, most students were enrolled in Civil Engineering course (15 percent) while the next larger groups of students were enrolled in Office Administration Management and Marketing Management sharing 10 percent each. Males’ enrolment dominated that of females in most courses and collectively contributed 70 percent while females’ enrolment was lower amounting to 30 percent. Table 6.12 Lerotholi Polytechnic Enrolment by Course and Gender - 2010 Course Students
Males Females Total Office Administration and Management 73 137 210 Marketing Management 78 126 204 Business Management 79 123 202 Tourism Management 21 32 53 Hospitality Management 13 10 23 Tailoring 1 11 12 Architectural Technology 44 18 62 Civil Engineering 242 56 298 Construction Engineering 20 7 27 Construction Management 38 7 45 Bricklaying and Plastering 3 0 3 Building Technology 32 5 37 Carpentry and Joinery 33 2 35 Plumbing and Sheetmetal 31 5 36 Mechanical Engineering 135 21 156 Computer Systems Engineering 108 18 126 Electrical and Electronic Engineering 135 15 150 Panel Beating and Spray-painting 49 2 51 Fitting and Machining 101 3 104 Automotive 88 2 90 Electrical Installation 90 8 98 Total 1414 608 2022 6.5.2 Graduates In 2010, the number of graduates was 417 and this figure was lower than 518 and 574 that were observed in 2009 and 2008 respectively. Evident from these graduate totals was that the number of graduates was gradually declining over this period under review. There had been more male graduates than female graduates from 2008 to 2010.

47
Table 6.13 Lerotholi Polytechnic Graduates by Department, 2008 - 2010 School/Department 2008 2009 2010 M F T M F T M F T School of Built Enrolment 71 9 80 81 12 93 84 14 98 School of Enterprise & Management 128 242 370 135 161 296 56 152 208 School of Engineering & Technology 111 13 124 108 21 129 98 13 111 Total 310 264 574 324 194 518 238 179 417 6.5.3 Teaching Staff Table 6.14 illustrates that the number of teachers engaged had been increasing over the years with a large number of lecturers concentrated in the Department of Engineering and Technology. The next largest number of the teaching staff was in the Department of Building and Technology. The table further demonstrated that, the number of male lecturers was dominant during this period under review. Table 6.14 Lerotholi Polytechnic Teaching Staff by Department, 2008 - 2010 School/Department 2008 2009 2010 M F T M F T M F T School of Built Enrolment 24 6 30 26 8 34 26 8 34 School of Enterprise & Management 2 18 20 6 17 23 7 18 25 School of Engineering & Technology 35 4 39 36 5 41 39 5 44 Service 2 4 6 2 4 6 2 5 7 Total 63 32 95 70 34 104 74 36 110 6.6 Centre for Accounting Studies (CAS) 6.6.1 Enrolment During the period under review, enrolment rose by 53 percent in 2009 while the increment was only 4 percent in 2010. Table 6.15 depicts that enrolment of females dominated over the period under review. Mathematically, females dominated by 53 percent since 2008 until in 2010 while males were tracing by 47 percent during the same period.
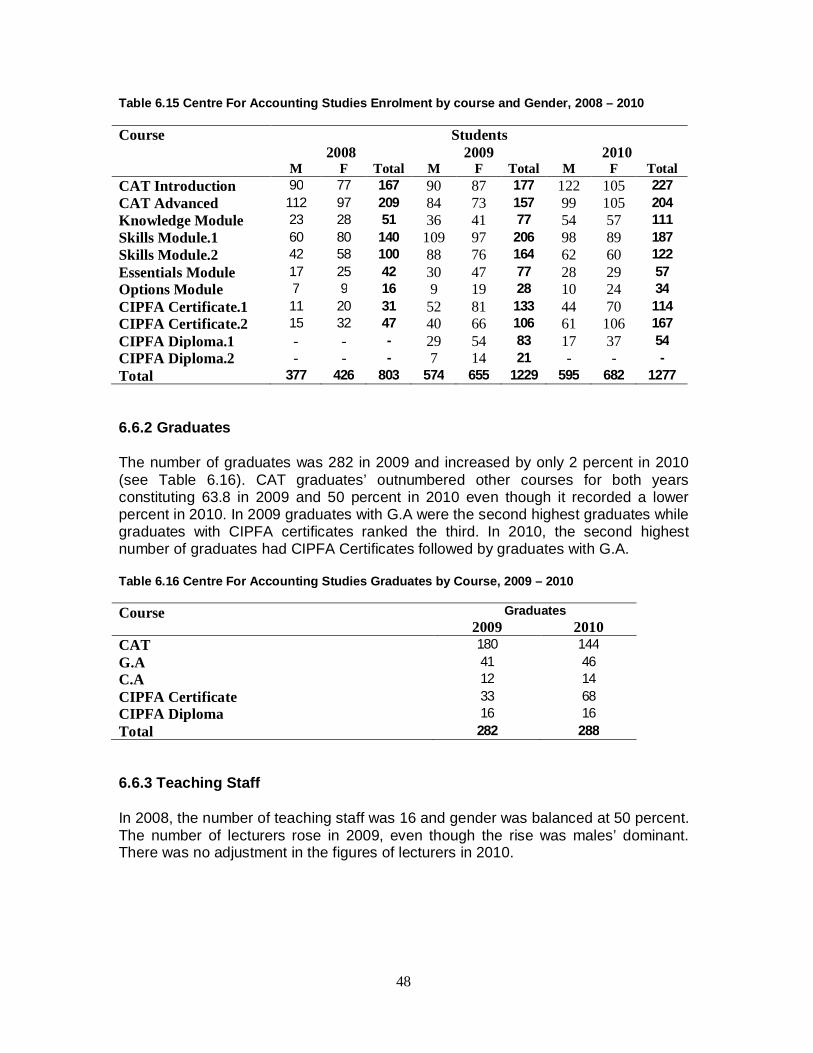
48
Table 6.15 Centre For Accounting Studies Enrolment by course and Gender, 2008 – 2010 Course Students
2008 2009 2010 M F Total M F Total M F Total
CAT Introduction 90 77 167 90 87 177 122 105 227 CAT Advanced 112 97 209 84 73 157 99 105 204 Knowledge Module 23 28 51 36 41 77 54 57 111 Skills Module.1 60 80 140 109 97 206 98 89 187 Skills Module.2 42 58 100 88 76 164 62 60 122 Essentials Module 17 25 42 30 47 77 28 29 57 Options Module 7 9 16 9 19 28 10 24 34 CIPFA Certificate.1 11 20 31 52 81 133 44 70 114 CIPFA Certificate.2 15 32 47 40 66 106 61 106 167 CIPFA Diploma.1 - - - 29 54 83 17 37 54 CIPFA Diploma.2 - - - 7 14 21 - - - Total 377 426 803 574 655 1229 595 682 1277 6.6.2 Graduates The number of graduates was 282 in 2009 and increased by only 2 percent in 2010 (see Table 6.16). CAT graduates’ outnumbered other courses for both years constituting 63.8 in 2009 and 50 percent in 2010 even though it recorded a lower percent in 2010. In 2009 graduates with G.A were the second highest graduates while graduates with CIPFA certificates ranked the third. In 2010, the second highest number of graduates had CIPFA Certificates followed by graduates with G.A. Table 6.16 Centre For Accounting Studies Graduates by Course, 2009 – 2010 Course Graduates
2009 2010 CAT 180 144 G.A 41 46 C.A 12 14 CIPFA Certificate 33 68 CIPFA Diploma 16 16 Total 282 288 6.6.3 Teaching Staff In 2008, the number of teaching staff was 16 and gender was balanced at 50 percent. The number of lecturers rose in 2009, even though the rise was males’ dominant. There was no adjustment in the figures of lecturers in 2010.

49
Table 6.17 Centre For Accounting Studies Teaching Staff by Department and Gender, 2008- 2010 Course Teaching Staff
2008 2009 2010 M F Total M F Total M F Total
ACCA CAT Scheme 1 2 3 2 2 4 1 3 4 Professional Scheme 6 4 10 10 4 14 10 4 14 CIPFA 1 2 3 1 3 4 2 2 4 Total 8 8 16 13 9 22 13 9 22 6.7 Lesotho Agricultural College (LAC) 6.7.1 Enrolment Enrolment increased from 595 in 2009 to 668 in 2010 implying an improvement by 12 percent. Most students were pursuing a Diploma in Agriculture whereas the next larger groups of students were enrolled in Diploma in Forestry and Resource Management and Diploma in Home Economics. Gender disparity revealed that 58 percent of females were enrolled while their male counterparts constituted 42 percent. Table 6.18 Lesotho Agricultural College Enrolment by Programme and Gender, - 2010 Programme Students
Males Females Total
Diploma in Home Economics 7 109 116
Diploma in Home Economics Education 0 55 55
Diploma in Agriculture 121 122 243
Diploma in Forestry & Resource Management 104 87 191
Dip. in Agriculture Engineering & Water Management 51 12 63
Total 283 385 668 6.7.2 Graduates Table 6.19 reflects that the number of graduates had been fluctuating over the period of three years with the year 2009 being the highest in number of graduates. However, the number of graduates slumped sharply in the year 2010, dropping from 266 recorded in 2009 to only 168 in 2010. Total graduates by course have also been fluctuating from one year to another.
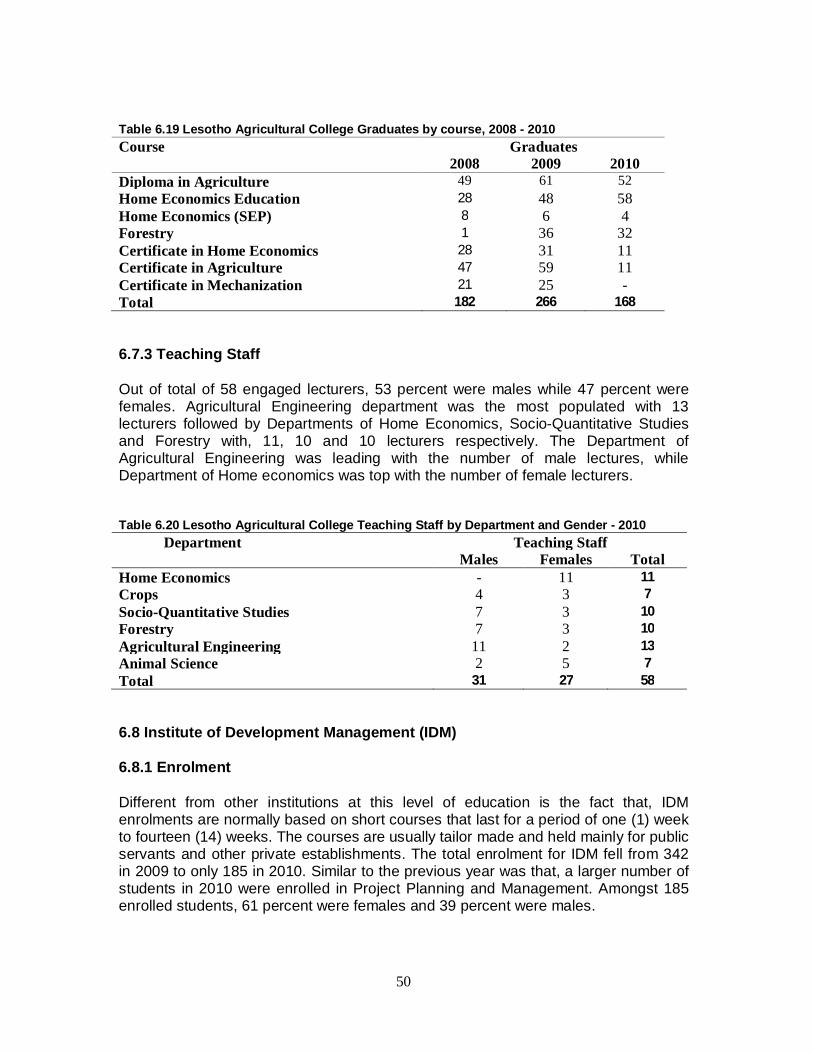
50
Table 6.19 Lesotho Agricultural College Graduates by course, 2008 - 2010 Course Graduates
2008 2009 2010 Diploma in Agriculture 49 61 52 Home Economics Education 28 48 58 Home Economics (SEP) 8 6 4 Forestry 1 36 32 Certificate in Home Economics 28 31 11 Certificate in Agriculture 47 59 11 Certificate in Mechanization 21 25 - Total 182 266 168 6.7.3 Teaching Staff Out of total of 58 engaged lecturers, 53 percent were males while 47 percent were females. Agricultural Engineering department was the most populated with 13 lecturers followed by Departments of Home Economics, Socio-Quantitative Studies and Forestry with, 11, 10 and 10 lecturers respectively. The Department of Agricultural Engineering was leading with the number of male lectures, while Department of Home economics was top with the number of female lecturers. Table 6.20 Lesotho Agricultural College Teaching Staff by Department and Gender - 2010 Department Teaching Staff
Males Females Total Home Economics - 11 11 Crops 4 3 7 Socio-Quantitative Studies 7 3 10 Forestry 7 3 10 Agricultural Engineering 11 2 13 Animal Science 2 5 7 Total 31 27 58 6.8 Institute of Development Management (IDM) 6.8.1 Enrolment Different from other institutions at this level of education is the fact that, IDM enrolments are normally based on short courses that last for a period of one (1) week to fourteen (14) weeks. The courses are usually tailor made and held mainly for public servants and other private establishments. The total enrolment for IDM fell from 342 in 2009 to only 185 in 2010. Similar to the previous year was that, a larger number of students in 2010 were enrolled in Project Planning and Management. Amongst 185 enrolled students, 61 percent were females and 39 percent were males.

51
Table 6.21 Institute of Development Management Enrolment by Programme and Gender - 2010 Programme Enrolment
Males Females Total
HIV/AIDS Counselling 7 17 24 Government Accounting 5 4 9 Basic Computer Application Skills 2 4 6 Diploma in Human Resource Management 1 5 6 Diploma in Information Technology 5 3 8 Project Implementation and Management 15 32 47 Leadership Development Programme (LDP) 12 13 25 Resource Mobilization 3 16 19 Performance Management 4 8 12 Leadership Skills 14 5 19 Priciples of Management 4 6 10 Total 72 113 185 In summary, tertiary enrolment amounted to 19,894 out of which females won a larger share 57 percent and males contributing only 43 percent. The number of graduates at this level was approximated at 3976. In total, there were 775 lecturers engaged with males dominating with 54 percent while the females represented 46 percent. Table 6.22 Tertiary Enrolment, Graduates and Academic Staff by Gender - 2010
Institution Enrolment Graduates Lecturers M F Total Total M F Total
Lesotho College of Education 1188 3249 4437 1035 52 75 127 National University of Lesotho 4459 6846 11305* 1845* 201 135 336 Limkokwing University 1379 1729 3108 - 39 40 79 NHTC 107 340 447 217 10 27 37 Lerotholi Polytechnic 1414 608 2022 417 74 36 110 Centre for Accounting Studies 595 682 1277 288 13 9 22 Lesotho Agricultural College 283 385 668 168 31 27 58 IDM 72 113 185 6 1 5 6 Total 8510 11384 23449 3976 421 354 775
(*) = NUL enrolment is for 2009 while graduates total is for 2008.

52
Chapter 7 Non Formal Education (NFE) 7.0 Introduction Non Formal Education (NFE) may be defined as a type of education in which content is adapted to the unique needs of the students in order to maximize learning and minimize other elements which often exist in formal school such as keeping roll, enforcing discipline and writing reports. NFE is more learners centered than formal education whereby optional curriculum is emphasized rather than the prescribed sequential curriculum found in formal education. Lesotho Distance Teaching Centre (LDTC) was set up in order to complement formal school education; to provide a broader and more practical form of education; and to reach a much larger and more diverse learners. The services offered by LDTC cover the formal and non formal divisions of the country's educational system and confirm the Lesotho government's vision of the role of education in the development process. LDTC provides basic practical skills to large proportion of the population living in the rural areas and offers opportunities for out of school youth and adults to develop their literacy and numeracy skills. The centres further afford distance education that includes correspondence courses at Junior Certificate and Cambridge Overseas School Certificate levels. Among the institutions that participate in NFE there is Lesotho Association of Non Formal Education (LANFE) that provides vocational skills and training and literacy education to herd boys and other orphans and vulnerable children. Other institutions include Lesotho Girl Guides Association (LGGA), Hae Learning Centre, Good Shephard, Lesotho Correctional Services (LCS) and Itjareng. 7.1 Enrolment (Literacy and Numeracy) In total, there were 6,834 literacy and numeracy learners out of which 3,422 (50%) were aged between 6-18 years whereas 3,412 (50%) learners were above 18 years. Out of the aforementioned total number of learners, 73 percent were males while females tracked by 27 percent. The number of learning posts amounted to 351 countrywide and a total of 6,832 books were distributed to aid in the process of learning.

53
Table 7.1 Number of Literacy and Numeracy Learners, Books and Learning Posts, 2010
District
Total Number of Learners
Learners Aged 6-18
Learners Aged Above 18
Total Books
Distributed
Number of Learning
Posts M F Total M F Total M F Total
Thaba Tseka 1000 325 1325 617 156 773 383 169 552 1325 67 Qacha'a Nek 924 376 1300 460 140 600 464 236 700 1300 50 Semonkong 226 100 326 226 0 226 0 100 100 326 18 Mafeteng 737 124 861 302 11 313 435 113 548 861 50 Leribe 356 323 679 27 3 30 329 320 649 675 44 Berea 539 121 660 331 0 331 208 121 329 660 41 Total 3782 1369 5151 1963 310 2273 1819 1059 2878 5147 270 LANFE Mokhotlong 807 274 1081 616 7 623 191 267 458 1081 48 Quthing 119 26 145 93 20 113 26 6 32 145 8 Mohale's Hoek 101 40 141 99 26 125 2 14 16 141 8 Total 1027 340 1367 808 53 861 219 287 506 1367 64 LGGA 56 80 136 56 80 136 0 0 0 136 13 Hae Learning 50 30 80 50 30 80 0 0 0 80 1 Good Shepard 45 0 45 45 0 45 0 0 0 45 1 LCS 30 0 30 2 0 2 28 0 28 32 1 Itjareng 20 5 25 20 5 25 0 0 0 25 1 Total 201 115 316 173 115 288 28 0 28 318 17 Grand Total 5010 1824 6834 2944 478 3422 2066 1346 3412 6832 351 7.2 Enrolment (Continuing education, JC and COSC) Students that enrolled in correspondence courses at Junior Certificate (JC) and Cambridge Overseas School Certificate (COSC) levels were 3,680 in 2010. Unlike in the enrolment of ‘numeracy and Literacy’ where learners who were aged 6-18 were almost equal to learners aged above 18, most that learners enrolled in JC and COSC were aged above 18 years, 96% percent. Table 7.2 Number of Learners Enrolled in JC and COSC Programmes - 2010 District
Total Number of Learners
Learners Aged 6-18
Learners Aged Above 18
Maseru 1960 139 1821 Mokhotlong 234 12 222 Quthing 261 12 249 Leribe 617 20 597 Thaba Tseka 208 7 201 Qacha's Nek 240 11 229 Total 3520 201 3319 Good Shepard 26 26 52 JTC and Female 20 20 40 Hae Learning 60 12 72 LGGA 54 54 108 Total 160 112 272 Grand Total 3680 313 3591
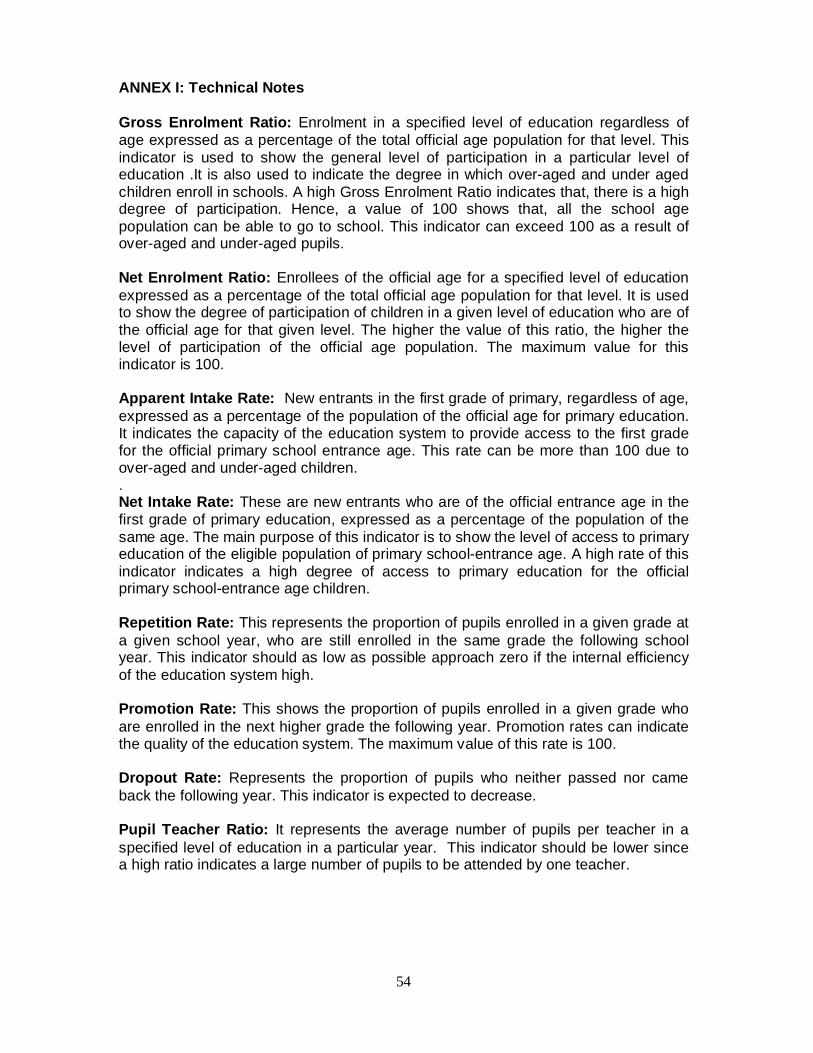
54
ANNEX I: Technical Notes Gross Enrolment Ratio: Enrolment in a specified level of education regardless of age expressed as a percentage of the total official age population for that level. This indicator is used to show the general level of participation in a particular level of education .It is also used to indicate the degree in which over-aged and under aged children enroll in schools. A high Gross Enrolment Ratio indicates that, there is a high degree of participation. Hence, a value of 100 shows that, all the school age population can be able to go to school. This indicator can exceed 100 as a result of over-aged and under-aged pupils. Net Enrolment Ratio: Enrollees of the official age for a specified level of education expressed as a percentage of the total official age population for that level. It is used to show the degree of participation of children in a given level of education who are of the official age for that given level. The higher the value of this ratio, the higher the level of participation of the official age population. The maximum value for this indicator is 100. Apparent Intake Rate: New entrants in the first grade of primary, regardless of age, expressed as a percentage of the population of the official age for primary education. It indicates the capacity of the education system to provide access to the first grade for the official primary school entrance age. This rate can be more than 100 due to over-aged and under-aged children. . Net Intake Rate: These are new entrants who are of the official entrance age in the first grade of primary education, expressed as a percentage of the population of the same age. The main purpose of this indicator is to show the level of access to primary education of the eligible population of primary school-entrance age. A high rate of this indicator indicates a high degree of access to primary education for the official primary school-entrance age children. Repetition Rate: This represents the proportion of pupils enrolled in a given grade at a given school year, who are still enrolled in the same grade the following school year. This indicator should as low as possible approach zero if the internal efficiency of the education system high. Promotion Rate: This shows the proportion of pupils enrolled in a given grade who are enrolled in the next higher grade the following year. Promotion rates can indicate the quality of the education system. The maximum value of this rate is 100. Dropout Rate: Represents the proportion of pupils who neither passed nor came back the following year. This indicator is expected to decrease. Pupil Teacher Ratio: It represents the average number of pupils per teacher in a specified level of education in a particular year. This indicator should be lower since a high ratio indicates a large number of pupils to be attended by one teacher.

55
ANNEX II: SUMMARY OF INDICATORS Primary Education Level
1999 2000 2001 2002 2003 2004 2005 2006 2007 2015
A. Access 1. GER Males 102.3 118.1 120.6 122.7 123.8 126.2 126.0 127.3 120.8 100 Females 110.7 122.6 123.2 124.9 125.9 127.0 126.3 127.5 120.2 100 Total 106.5 120.3 121.9 123.8 124.9 126.6 126.1 127.4 120.5 100 2. NER Males 56.6 78.7 79.5 81.1 82.0 81.0 80.6 81.6 79.5 100 Females 63.8 85.3 85.4 87.0 88.1 86.0 85.7 86.3 83.4 100 Total 60.2 82.0 82.7 84.0 85.0 83.0 83.1 83.9 81.4 100 3.AIR Males 103.9 210.9 150 129.2 124.9 132.5 117.0 118.0 111.5 100 Females 105.0 190.8 134.0 121.0 118.0 120.7 110.1 111.2 105.1 100.0 Total 104.5 200.9 142.1 125.1 121.5 126.6 113.6 114.6 108.3 100.0 4. NIR Males 26.8 63.2 61.7 60.2 61.3 55.4 53.6 55.9 54.7 - Females 28.3 65.1 62.8 62.5 63.0 56.2 54.1 57.1 55.0 - Total 27.5 64.1 62.2 61.3 62.1 55.8 54.1 56.9 75.0 100.0 B. Efficiency 1. Promotions Total 74.1 84.5 87.5 76.5 77.1 75.2 74.2 71.9 - - 2. Repetitions Total 20.1 20.6 19.9 21.4 16.8 19.2 19.7 19.7 14.0 7.0 3. Dropouts Total 7.1 7.3 5.9 4.8 6.0 5.6 6.0 6.0 - - 4. Completion Rates Total 59.3 66.0 64.5 57.5 70.0 73.1 62.9 74.9 83.0 100.0 C. Quality Indicators Pupil:Teacher Ratio 44 48.0 47.0 47.0 46.0 43.0 41.6 37 40.0 40.0 Pupil:Classroom Ratio 63.0 65.0 55.0 40.0 Pupil:Qualified Teacher Ratio
69.0 60.0 40.0
National Performance Level in Numeracy at Grade 6
49.0 55.0 80.0
National Performance Level in Sesotho Literacy at Grade 6
58.0 65.0 90.0
National Performance Level in English Literacy in Grade 6
45.0 50.0 85.0
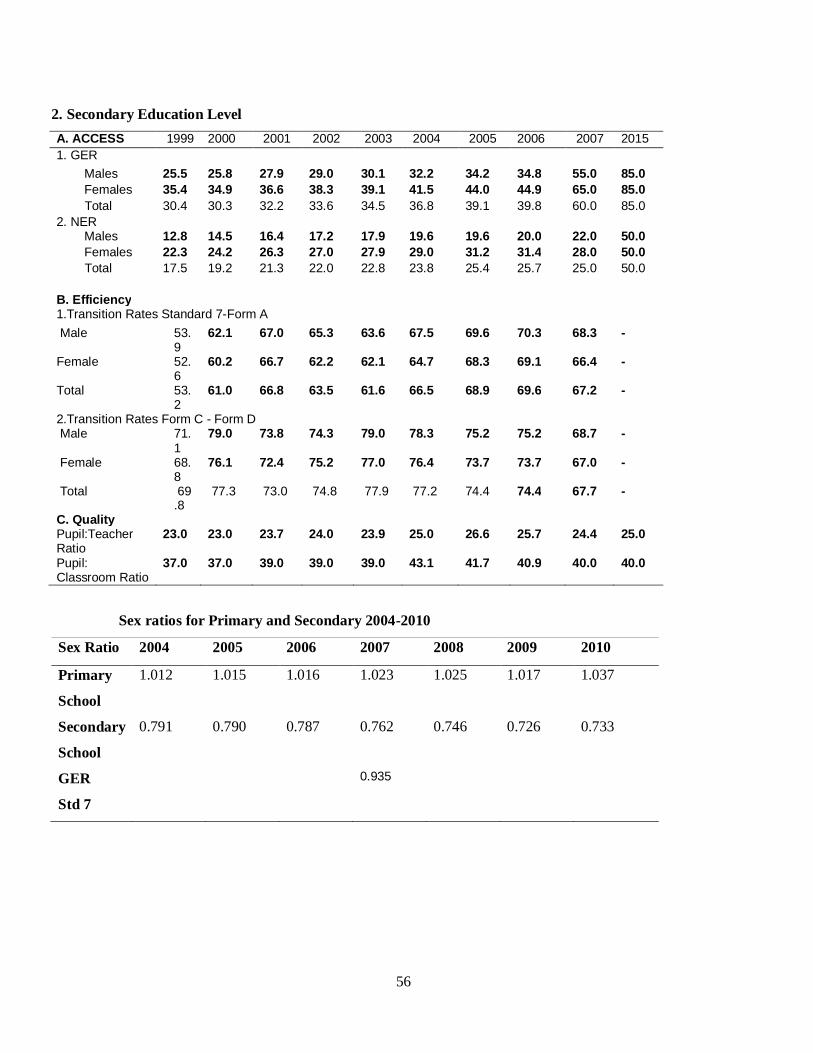
56
2. Secondary Education Level A. ACCESS 1999 2000 2001 2002 2003 2004 2005 2006 2007 2015 1. GER Males 25.5 25.8 27.9 29.0 30.1 32.2 34.2 34.8 55.0 85.0 Females 35.4 34.9 36.6 38.3 39.1 41.5 44.0 44.9 65.0 85.0 Total 30.4 30.3 32.2 33.6 34.5 36.8 39.1 39.8 60.0 85.0 2. NER Males 12.8 14.5 16.4 17.2 17.9 19.6 19.6 20.0 22.0 50.0 Females 22.3 24.2 26.3 27.0 27.9 29.0 31.2 31.4 28.0 50.0 Total 17.5 19.2 21.3 22.0 22.8 23.8 25.4 25.7 25.0 50.0 B. Efficiency 1.Transition Rates Standard 7-Form A Male 53.
9 62.1 67.0 65.3 63.6 67.5 69.6 70.3 68.3 -
Female 52.6
60.2 66.7 62.2 62.1 64.7 68.3 69.1 66.4 -
Total 53.2
61.0 66.8 63.5 61.6 66.5 68.9 69.6 67.2 -
2.Transition Rates Form C - Form D Male 71.
1 79.0 73.8 74.3 79.0 78.3 75.2 75.2 68.7 -
Female 68.8
76.1 72.4 75.2 77.0 76.4 73.7 73.7 67.0 -
Total 69.8
77.3 73.0 74.8 77.9 77.2 74.4 74.4 67.7 -
C. Quality Pupil:Teacher Ratio
23.0 23.0 23.7 24.0 23.9 25.0 26.6 25.7 24.4 25.0
Pupil: Classroom Ratio
37.0 37.0 39.0 39.0 39.0 43.1 41.7 40.9 40.0 40.0
Sex ratios for Primary and Secondary 2004-2010
Sex Ratio 2004 2005 2006 2007 2008 2009 2010
Primary
School
1.012 1.015 1.016 1.023 1.025 1.017 1.037
Secondary
School
0.791 0.790 0.787 0.762
0.746 0.726 0.733
GER
Std 7
0.935

57
ANNEX III: Population projections Table 1A: School Age Population ANNEX IV: General Information for Secondary schools 2003-2010
YEARS
2002 2003 2004 2005 2006 2007 2008 2009 2010
AGE M F M F M F M F M F M F M F M F M F
0 27113 26501 27704 27080 28294 27658 28882 28235 29470 28811 29870 29186 29635 28957 29399 28728 29164 28499 1 25657 25224 26069 25610 26638 26170 27205 26729 27772 27288 28450 27938 28851 28311 28624 28088 28396 27865 2 25293 24892 25297 24882 25711 25266 26273 25819 26834 26372 27402 26937 28072 27580 28483 27957 28258 27737 3 25009 24617 24934 24551 24939 24541 25355 24923 25910 25470 26472 26029 27034 26588 27695 27223 28116 27604 4 24724 24341 24650 24276 24577 24211 24581 24201 25000 24581 25556 25135 26112 25687 26666 26239 27320 26867 0-4 127796 125575 128654 126399 130159 127846 132296 129907 134986 132522 137750 135225 139704 137123 140867 138235 141254 138572
5 24688 24281 24615 24216 24542 24152 24469 24087 24473 24077 24884 24454 25438 25003 25991 25553 26543 26103 6 24342 23804 24656 24230 24583 24165 24510 24101 24437 24036 24516 24086 24831 24383 25384 24932 25936 25481 7 24655 24143 24240 23693 24455 24040 24383 23976 24310 23912 24321 23912 24400 23961 24617 24181 25165 24725 8 24391 24014 24455 23953 24043 23507 24161 23774 24089 23711 24105 23715 24116 23716 24194 23764 24315 23906 9 24267 23978 24172 23810 24235 23750 23827 23307 23850 23497 23867 23502 23882 23506 23892 23507 23970 23555 5-9 122343 120220 122138 119902 121858 119614 121350 119245 121159 119233 121693 119669 122667 120569 124078 121937 125929 123770
10 24278 24033 24097 23817 24003 23650 24065 23590 23660 23150 23674 23330 23690 23335 23706 23339 23715 23339 11 24220 23984 24186 23937 24005 23722 23911 23555 23973 23495 23464 22965 23570 23225 23587 23230 23602 23234 12 24185 23928 24094 23856 24156 23892 23975 23677 23881 23510 23835 23357 23329 22830 23527 23170 23544 23175 13 24260 23934 24100 23829 24010 23757 24167 23876 23986 23662 23785 23402 23740 23249 23235 22724 23525 23144 14 24419 23976 24193 23842 24034 23738 23944 23666 24197 23868 23912 23563 23712 23304 23666 23151 23163 22629 10-14 121362 119855 120670 119281 120208 118759 120062 118364 119697 117685 118670 116617 118041 115943 117721 115614 117549 115521
15 24620 24018 24331 23858 24106 23725 23947 23621 23857 23550 24107 23746 23823 23442 23623 23185 23578 23033 16 24557 23813 24496 23859 24208 23700 23983 23568 23825 23465 23762 23418 23989 23588 23706 23286 23507 23030 17 24495 23623 24432 23643 24347 23665 24060 23507 23837 23376 23711 23300 23648 23253 23852 23397 23570 23097 18 24087 23181 24339 23410 24276 23430 24169 23428 23884 23272 23697 23168 23572 23093 23510 23047 23690 23165 15-18 97759 94635 97598 94770 96937 94520 96159 94124 95403 93663 95277 93632 95032 93376 94691 92915 94345 92325
Total 469260 460285 469060 460352 469162 460739 469867 461640 471245 463103 473390 465143 475444 467011 477357 468701 479077 470188

58
SECONDARY
2003
2004
2005
2006
2007
2008
2009
2010
ENROLMENT M F Total M F Total M F Total M F Total M F Total M F Total M F Total M F Total A 11328 14625 25953 11954 15702 27656 12906 16656 29562 12586 16268 28854 14639 20172 34811 14372 19886 34258 15027 20467 35494 16053 21358 37411 B 9455 12090 21545 9846 12506 22352 10097 13214 23311 10628 13730 24358 10141 13528 23669 11632 15849 27481 12129 17159 29288 13581 18741 32322 C 6563 8428 14991 7137 8928 16065 7316 9185 16501 7420 9410 16830 7335 9461 16796 7663 9726 17389 8621 11970 20591 9451 13439 22890 D 5454 6926 12380 5902 7402 13304 6569 8105 14674 6645 8265 14910 6042 7599 13641 6233 8457 14690 6519 9084 15603 8155 11117 19272 E 3821 4414 8235 4076 4689 8765 4198 4850 9048 4358 5235 9593 4200 4819 9019 4262 5237 9499 4584 5920 10504 4908 6504 11412 T 36621 46483 83104 38915 49227 88142 41086 52010 93096 41637 52908 94545 42357 55579 97936 44162 59155 103317 46880 64600 111480 52148 71159 123307 Teachers T= TOTAL U=UNQUALIFIED T 1572 1898 3470 1477 1927 3404 1543 1952 3495 1653 2020 3673 1756 2250 4006 1756 2426 4182 2077 691 4735 U 191 181 372 240 344 584 690 811 1501 544 478 1022 280 278 558 667 848 1515 2658 639 1330 No. of schools
228 234 235 240 291 308 315 321

59
ANNEX VI: LESOTHO COLLEGE OF EDUCATION TOTAL ENROLMENT FROM 2005 TO 2010 YEAR 1 M F 2005 M F 2006 M F 2007 M F 2008 M F 2009 M F 2010 DIP.ED.PRI 53 130 183 77 153 323 68 154 222 46 119 165 151 284 445 89 336 425 DIP.ED.SEC 75 114 189 76 153 328 97 172 269 106 175 281 120 206 326 124 189 313 DIP.ED.SEC(Thaba Tseka) 0 0 0 50 70 121 0 0 0 23 37 60 15 40 55 23 65 88 DIP.ED.PRI (Thaba Tseka) 0 0 0 50 74 124 18 35 53 0 0 0 35 50 85 20 67 87 DIP.ED. SEC(TECH) 12 2 14 17 1 29 12 2 14 9 1 10 11 0 11 13 0 13 DTEP 93 220 313 158 310 636 149 338 487 158 393 551 160 333 493 150 428 578 CECE - - - - - 33 33 0 0 0 0 32 32 1 43 44 ADSE - - - - - - - - - - 7 40 47 3 36 39 TOTAL ALL 233 466 699 378 691 1440 344 734 1078 342 725 1067 499 985 1484 423 1164 1587 YEAR 2 M F 2005 M F 2006 M F 2007 M F 2008 M F 2009 M F 2010 DIP.EDU.PRI 51 161 212 56 161 277 79 182 261 69 156 225 35 116 151 79 232 311 DIP.ED.PRI (Thaba Tseka) 17 67 84 DIP.EDU.SEC 39 74 113 71 112 183 77 156 233 106 175 281 97 174 271 108 201 309 DIP.ED.SEC (Thaba Tseka) 50 71 121 0 0 0 23 37 60 13 40 53 DIP.SEC. EDU(Tech) 19 0 19 12 2 30 18 1 19 17 36 53 9 1 10 11 0 11 DTEP 87 326 413 106 362 468 172 558 730 149 338 487 162 398 560 131 402 533 CECE 32 0 32 30 0 30 0 31 31 TOTAL ALL 196 561 757 245 637 958 396 968 1364 373 705 1078 356 726 1082 359 973 1332 YEAR 3 M F 2005 M F 2006 M F 2007 M F 2008 M F 2009 M F 2010 DIP.EDU.PRI 57 152 209 51 169 254 56 161 217 74 185 259 156 69 225 33 113 146 DIP.EDU.SEC 50 67 117 44 83 166 71 112 183 83 158 241 83 166 249 98 165 263 DIP.ED.SEC (Thaba Tseka) 50 71 121 0 0 0 24 36 60 DIP.EDU.PR (Thaba Tseka) 0 0 0 36 17 53 - - - DIP.EDU.SEC (05) 65 106 171 0 0 0 - - - DIP.SEC.ED.(Tech05)
0 2 2 0 0 0 - - -
DIP.SEC.EDU (TECH) 16 1 17 16 0 30 9 2 11 11 2 13 11 2 13 10 1 11 DTEP 161 375 536 81 254 335 124 392 516 283 524 807 286 254 540 119 423 542 TOTAL ALL 284 595 879 192 506 785 260 667 927 566 1048 1614 572 508 1080 284 738 1022 YEAR 4 M F 2005 M F 2006 M F 2007 M F 2008 M F 2009 M F 2010 DTEP 140 334 474 90 300 390 124 392 516 318 348 666 122 374 496 GRAND TOTAL 713 1622 2335 955 2168 3657 1090 2669 3759 1405 2870 4275 1745 2567 4312 1188 3249 4437
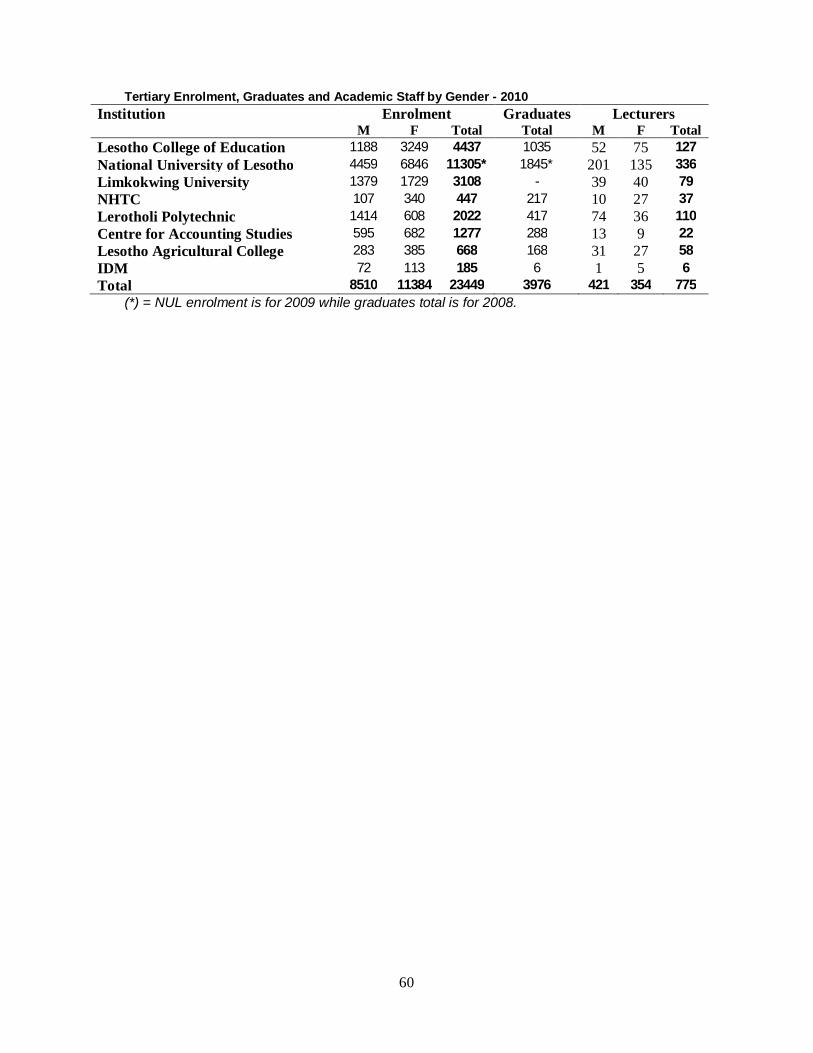
60
Tertiary Enrolment, Graduates and Academic Staff by Gender - 2010 Institution Enrolment Graduates Lecturers
M F Total Total M F Total Lesotho College of Education 1188 3249 4437 1035 52 75 127 National University of Lesotho 4459 6846 11305* 1845* 201 135 336 Limkokwing University 1379 1729 3108 - 39 40 79 NHTC 107 340 447 217 10 27 37 Lerotholi Polytechnic 1414 608 2022 417 74 36 110 Centre for Accounting Studies 595 682 1277 288 13 9 22 Lesotho Agricultural College 283 385 668 168 31 27 58 IDM 72 113 185 6 1 5 6 Total 8510 11384 23449 3976 421 354 775
(*) = NUL enrolment is for 2009 while graduates total is for 2008.