Embed Size (px)
Citation preview

EDUCATION FUNDING IN ARIZONA: CONSTITUTIONAL REQUIREMENT
AND THE EMPIRICAL RECORD
A Report from the Office of the University Economist
January 2009
Dennis Hoffman, Ph.D. Professor of Economics, University Economist,
and Director, L. William Seidman Research Institute
Tom R. Rex, MBA Associate Director, Center for Competitiveness and Prosperity Research
Center for Competitiveness and Prosperity Research L. William Seidman Research Institute
W. P. Carey School of Business Arizona State University
Box 874011 Tempe, Arizona 85287-4011
(480) 965-5362
FAX: (480) 965-5458 EMAIL: [email protected] or [email protected]
www.wpcarey.asu.edu/seid

ii
CONTENTS SUMMARY 1 Constitutional Requirement 1 Education Funding 1 Evaluation of Public Education 4 Conclusion 7 CONSTITUTIONAL REQUIREMENT FOR FUNDING EDUCATION 8 DATA AND METHODOLOGY FOR ASSESSING EDUCATION FUNDING 9 Funding Relative to Personal Income 10 Funding Per Student 11 EXPENDITURES FOR EDUCATION IN ARIZONA 14 Arizona State Government General Fund Expenditures for Education 14 Other Sources of Education Funding 23 Combined State and Local Government Expenditures for Education 24 EVALUATION OF PUBLIC EDUCATION IN ARIZONA 39 Elementary and Secondary Education 39 Higher Education 49 Educational Attainment 51
TABLES
1. Education Expenditures by Category and Subcategory, Selected Years, Arizona State Government General Fund
14
2. Percent Change in Per Student Spending Per $1,000 of Per Capita Personal Income in Arizona, Arizona State Government General Fund
22
3. Education Expenditures by Category and Subcategory, 2006, Arizona State and Local Governments
24
4. Share of Total Population by Age, 1970 Through 2007, Arizona and United States 31 5. Educational Attainment by Age, Arizona Residents in 2000 52 6. Educational Attainment in 2000 of Labor Force Participants Aged 25 to 64 54
iii
CHARTS
1. Share of Total Expenditures by Category, 1979 and 2008, Arizona State Government General Fund
16
2. Expenditures Per $1,000 of Personal Income, 1979 Through 2008, Arizona State Government General Fund
17
3. Elementary and Secondary Education Expenditures Per Student, 1979 Through 2008, Arizona State Government General Fund
19
4. Higher Education Expenditures Per Full-Time-Equivalent Student, 1985 Through 2008, Arizona State Government General Fund
20
5. Community College Expenditures Per Full-Time-Equivalent Student, 1985 Through 2008, Arizona State Government General Fund
21
6. University Expenditures Per Full-Time-Equivalent Student, 1985 Through 2008, Arizona State Government General Fund
22
7. Elementary and Secondary Education Expenditures Per Student Per $1,000 of Per Capita Personal Income, 1999 Through 2008: Combined Total of Arizona State Government General Fund, Permanent State School Fund, and Proposition 301
23
8. General Expenditures Per $1,000 of Personal Income as a Percentage of the National Average, 1964 Through 2006, Arizona State and Local Governments
26
9. General Capital Outlays Per $1,000 of Personal Income as a Percentage of the National Average, 1964 Through 2006, Arizona State and Local Governments
28
10. General Current Operations Spending Per $1,000 of Personal Income as a Percentage of the National Average, 1964 Through 2006, Arizona State and Local Governments
30
11. Elementary and Secondary Education Expenditures Per Student in 2008 Dollars, 1964 Through 2006, Arizona State and Local Governments
32
12. Elementary and Secondary Education Expenditures Per Student Per $1,000 of Per Capita Personal Income, 1964 Through 2006, Arizona State and Local Governments
33
13. Higher Education Expenditures Per Student in 2008 Dollars, 1966 Through 2006, Arizona State and Local Governments
35
14. Higher Education Expenditures Per Student in 2008 Dollars Using the Higher Education Price Index, 1966 Through 2006, Arizona State and Local Governments
36
15. Higher Education Expenditures Per Student Per $1,000 of Per Capita Personal Income, 1966 Through 2006, Arizona State and Local Governments
37
16. Higher Education Current Operations Expenditures Per Student As a Percentage of the National Average, 1985 Through 2006, Arizona State and Local Governments
38

1
SUMMARY The purpose of this paper is to provide insight as to whether existing legislative appropriations for public education meet the requirements of the Arizona Constitution.
Constitutional Requirement Article 11, Section 10 of the Arizona Constitution states that “… the legislature shall make such appropriations, to be met by taxation, as shall insure the proper maintenance of all state educational institutions, and shall make such special appropriations as shall provide for their development and improvement.”
Education Funding A disproportionately high share of Arizona’s children face demographic challenges that have been shown to adversely affect educational achievement, including high poverty rates, low educational attainment of their parents, and lesser frequency of full-time, year-round employment of their parents. In addition, a disproportionately large number of Arizona’s children are English-language learners. All else equal, for the state’s students to realize achievement levels equal to the national average, these demographic challenges mean that the state’s education funding per pupil needs to be greater than the national average. Instead, per student public funding for education — total current operations spending from all funds by all state and local governments, as reported by the U.S. Census Bureau — is among the lowest in the country in Arizona. Expressed per student per $1,000 of personal income, funding has dropped significantly over time (Census Bureau data go back to 1964), relative to past spending in Arizona and relative to the change in spending over time in other states. Education funding per student per $1,000 of personal income is low and falling for public elementary and secondary education and for public higher education. State government general fund expenditures in Arizona — appropriations directly under the control of the Arizona Legislature — cannot be compared to other states. However, state government general fund data from 1979 through 2008 reported by the Arizona Joint Legislative Budget Committee (JLBC) reveal a large drop over time in education funding comparable in magnitude to the decline in total public spending for education in Arizona, with the funding expressed per student per $1,000 of personal income. The conclusions of low and falling funding for public education in Arizona hold regardless of the source of data on education funding or of the measure used to analyze the funding data. Three measures are included in this paper: expenditures per $1,000 of personal income, spending per student adjusted for inflation, and spending per student per $1,000 of per capita personal income (PCPI). The per pupil measures are preferred over the first measure, and the per student measure relative to income is conceptually superior to the other measures in analyzing the change in spending over time. While widely used because of the availability of a long time series of annual data, personal income relative to other income measures understates income in Arizona in comparison to the national average and to other states. On each of the spending measures adjusted by personal

2
income or per capita personal income, Arizona’s relative expenditures would be even lower based on other measures of income. Expenditures for education consist of two types: (1) capital outlays for land, buildings and equipment, and (2) current operations. Capital outlays and total spending are reported in this paper, but the focus is current operations spending, which better gauges support for students. Capital outlays are not included in the JLBC general fund data except for the appropriations for the School Facilities Board since 1999. Funding: Elementary and Secondary Schools Based on the Census Bureau data for state and local governments combined, current operations funding for elementary and secondary (K-12) education in Arizona is very low compared both to other states and to Arizona’s historical record. In the most recent year (2006), education expenditures in Arizona ranked 47th (among the 50 states and the District of Columbia) per $1,000 of personal income, 50th (next to last) on a per student basis, and 51st (lowest) per student per $1,000 of per capita personal income. In contrast, spending in Arizona on each of these measures was above average in the 1960s and 1970s. Since then, public spending for elementary and secondary education has fallen increasingly far below the national average. K-12 spending in Arizona per $1,000 of personal income has fallen throughout the last 40 years, including decreases of 32 percent between 1966 and 2006 and 11 percent between 1992 and 2006. Inflation-adjusted per student spending in Arizona rose considerably through 1988, but has not increased as much since then. These increases, however, have been less than the gains in the real per person economy. Per student expenditures per $1,000 of PCPI in Arizona have dropped, by 13 percent between 1966 and 2006 and by 16 percent between 1992 and 2006. Regardless of the measure used, the decreases in K-12 spending in Arizona are more significant when compared to the national average. K-12 spending per $1,000 of personal income in Arizona was 38 percent above the national average in 1966. By 1992, it was 4 percent below average and in 2006 it had fallen to 17 percent below average. Even during the years in which real per student spending was rising rapidly, Arizona’s increases were less than the U.S. average. Per student spending in Arizona was 7 percent greater than the national average in 1966, but fell to less than the average in 1971, to less than 90 percent of the average in 1989, to less than 80 percent in 1994, and to less than 70 percent in 2004. In 2006, spending was 33 percent below average; it had been 20 percent below average in 1992. By 1993, Arizona’s rank had fallen to 41st; it was 50th in 2006. Since per capita personal income in Arizona is considerably lower than the national average, the per pupil expenditure per $1,000 of PCPI in Arizona is higher as a percentage of the U.S. average than is the per student measure. However, the downward pattern is similar. Arizona’s per student spending per $1,000 of PCPI was 28 percent above the national average in 1966, but fell to below the U.S. average in 1990, to less than 90 percent of the average in 1997, and to less than 80 percent in 2004. Per student spending per $1,000 of per capita personal income was 24

3
percent below average in 2006; it had been only 7 percent below average in 1992. The 2006 figure was the lowest in the nation; Arizona had ranked 37th in 1993. As a percentage of the total state and local government K-12 current operations spending reported by the Census Bureau, expenditures for elementary and secondary education from the state general fund as reported by the JLBC has been variable by year, but no trend in the share is apparent. Thus, while the percent change in spending over any particular time period might be much different based on the JLBC data than the Census Bureau data, the general conclusion is the same: K-12 spending in Arizona has dropped substantially over time relative to personal income, and per pupil spending relative to PCPI has decreased considerably as well. Historically, elementary and secondary education in Arizona was funded at a per student level in excess of the national average. Since 1988, however, Arizona’s funding increases have not been as great as the state’s economic growth rate. Since 1990, funding support for schools has fallen increasingly far below the national norm. Based on the more recent JLBC data, real spending per pupil in 2008 was somewhat higher than in 2006. This modest increase is unlikely to have had much of an effect on Arizona’s ranking among the states based on the Census Bureau’s broader definition of government spending. Funding: Higher Education Based on the Census Bureau’s data for state and local governments combined, current operations funding for public institutions of higher education (community colleges and universities) is very low in Arizona compared both to other states and to Arizona’s historical record. In 2006, Arizona ranked 30th per $1,000 of personal income but was 46th on a per full-time-equivalent (FTE) student basis and 37th per FTE student per $1,000 of per capita personal income. In contrast, spending in Arizona per FTE student had been above average historically. Current operations expenditures for higher education per $1,000 of personal income have decreased over time in Arizona, down 13 percent between 1966 and 2006 and 18 percent between 1992 and 2006. Using a general measure of inflation, real per student spending for higher education has increased over time. However, adjusting for the higher inflation experienced in higher education by using the Higher Education Price Index, spending per student for higher education has shown no trend. Relative to per capita personal income, per student spending fell from the mid-1960s to mid-1970s and has decreased a little further since then. The decrease between 1966 and 2006 was 29 percent. Spending for higher education in Arizona fell much more relative to the national average. Per $1,000 of personal income, Arizona’s spending was 103 percent higher than the U.S. average in 1966, was down to 39 percent higher in 1992, and was only 3 percent higher in 2006. Considering the number of students, however, Arizona’s spending is considerably below average. Per student spending in Arizona was 24 percent below the national average in 2006, though expenditures per FTE student were only 13 percent below average. Since the mid-1990s, Arizona’s per student spending has fallen relative to the national average. The 1992 figures were 19 percent below average per student and 9 percent below average per FTE student. In 2006, per

4
student spending in Arizona was the lowest in the nation; the state had ranked 49th in 1993. Spending per FTE student ranked 47th in 2006, down a bit from 44th in 1993. Per student spending per $1,000 of per capita personal income has been variable over time in Arizona relative to the national average, but has dropped since the mid-1990s. Arizona’s figure was 14 percent below the national average in 2006; it had been 6 percent below average in 1992. Arizona ranked 47th in the nation in 2006; it had ranked 41st in 1993. Per FTE student, the level has not been as low — dropping from 6 percent above average in 1993 to 2 percent below average in 2006 — and the rank has not been as low, falling from 31st to 37th. As a share of the state and local government total reported by the Census Bureau, Arizona state government general fund spending for higher education as reported by the JLBC ranged between 35 percent and 42 percent from 1979 through 2000, but dropped to only 27 percent in 2006. Real spending per student has declined since 2000 by similar amounts for the universities and the community colleges, though on an FTE basis the decline has not been as large for the universities. Thus, funding for higher education in Arizona is low relative to other states and lower than in the past. Based on the more recent JLBC data, real spending per pupil in 2008 was higher than in 2006. This increase may have raised Arizona’s ranking a little among the states based on the broader Census Bureau data. Despite this recent increase in state general fund expenditures, since 2000 general fund spending per higher education student has fallen significantly. Funding: K-12 Relative to Higher Education Since per student funding is greater for higher education than for K-12 education, the best way to compare the funding between K-12 and higher education is through the ratio to the national average of each. In 2006, using the Census Bureau data, per student K-12 spending was 33 percent less than the national average, while expenditures for higher education were not as far below the norm at 24 percent per student and 13 percent per FTE student. Higher education also has not experienced as much of a decrease over time as K-12. However, the situation is reversed when focusing on the state government general fund as defined by the JLBC. Even before accounting for the higher inflation in higher education, per student spending has fallen much more for higher education than for K-12. Relative to PCPI, per student K-12 appropriations dropped 10 percent between 1992 and 2006 while the higher education decline was 27 percent (29 percent based on FTE enrollment). Between 1979 and 2006, the decrease was only 5 percent for K-12 but 37 percent for higher education.
Evaluation of Public Education Despite the demonstrably low public funding for education in Arizona, it might be possible to argue that the constitutional funding requirement is being met if measures of educational achievement indicate that Arizona is in line with the rest of the nation. However, on most measures of elementary and secondary student performance, Arizona ranks among the bottom tier of states.

5
In addition to raw data, most of which comes from the National Center for Education Statistics (NCES), three studies that compare Arizona’s educational system to other states were examined: “Measuring Up 2008”by the National Center for Public Policy and Higher Education, “Quality Counts 2009” by Education Week, and “Educating Arizona” by the Arizona Community Foundation. Evaluation: Elementary and Secondary Schools Assessments of K-12 education typically include analyses in several categories. In addition to the key category of student performance, system indicators such as overall education finance and teacher quality are included. Each study analyzed for this report agrees with the conclusion of the education funding section of this paper: the K-12 educational system in Arizona receives among the least resources in the nation and the amount of funding has dropped substantially over time relative to the rest of the nation. On system indicators other than overall education finance, “Quality Counts” ranks Arizona 41st in the teaching profession category and “Educating Arizona” ranks Arizona 45th on teaching quality. Arizona’s teachers are relatively inexperienced and receive low pay — less relative to the national average than in the past. Average classroom size in Arizona is larger than the U.S. average, with Arizona ranking among the bottom few states on this measure and on related measures of the number of pupils per full-time-equivalent teacher and per total educational system personnel. Arizona has fewer administrative staff than the norm. Arizona compares more favorably on the standards, assessments, and accountability category. “Educating Arizona” gives the state near average marks, but “Quality Counts” ranks Arizona eighth in the nation. One of the key components of student achievement is measured by test scores. Arizona’s elementary school students perform near the national average on norm-referenced tests such as Terra Nova. However, all of the other tests administered to elementary and secondary school students indicate that Arizona students perform among the bottom tier of states. On the NAEP tests administered to fourth and eighth graders, all of the studies agree on Arizona’s poor scores, which are not improving over time relative to other states. On the most recent NAEP tests, Arizona students rank between 37th and 47th. On the Advanced Placement tests, Arizona ranks around 40th. “Measuring Up” places Arizona 50th on college entrance exams. While the average score of Arizonans taking the ACT and SAT tests is near average, only a small proportion of high school students in Arizona take the tests. High school completion rates — high school graduation rates and dropout rates — are other common measures of student achievement. Unfortunately, the data on high school completion rates are not reliable. One related measure is the percentage of high school freshmen enrolling in college four years later. According to “Measuring Up,” Arizona ranks 48th. “Educating Arizona” reports that less than half of those who do graduate from Arizona high schools are eligible for admission to the state’s universities and that many of those admitted have deficiencies.

6
Another means of assessing the high school completion rate is to use the educational attainment reported in the decennial census. The educational attainment, as defined by the percentage obtaining a high school diploma or GED, of those who likely received their K-12 education in Arizona was significantly lower in 2000 than the attainment of Arizonans of the same age who likely received their K-12 education in another U.S. state. Of those educated in the same state in which they lived, the percentage of adults who were high school graduates in Arizona ranked among the bottom few states in the nation. Overall, the preparation for college category of “Measuring Up” ranks Arizona 49th. The K-12 achievement category of “Quality Counts” ranks Arizona 44th in the nation. If not for a somewhat better comparison on the equity portion of the category, Arizona’s rank in “Quality Counts” would be even lower. Arizona’s demographics — such as an above-average child poverty rate and an above-average share of English-language learners — contribute to the poor educational achievement of Arizona’s students in aggregate. However, the achievement of those children without such disadvantages is inferior to the performance of their peers nationally. Evaluation: Higher Education The NCES data agree with the conclusion of the education funding section of this paper: the higher education system in Arizona receives resources far below the national average. Total public revenue per FTE student was 28 percent less than the national average of public institutions in 2005. State appropriations per FTE student were 20 percent below the average. Tuition revenue was 18 percent below average at the state’s public universities and 28 percent below average at the state’s public community colleges. Participation in higher education at public institutions is quite high in Arizona, despite Arizona’s low rankings on the percentage of high school freshmen enrolling in college four years later (48th) and on the percentage of Arizona high school graduates immediately enrolling at an institution of higher learning (44th). Several factors contribute to the high enrollment at public institutions of higher education in Arizona: a higher proportion of high school graduates from Arizona schools who do go on to college enroll at in-state schools, few private four-year schools are present in Arizona, many of the students enrolled moved to Arizona after completing their K-12 education, many are older than traditional college age, and many are enrolled part time. Per capita enrollment at Arizona’s public institutions of higher education is 22 percent above the national average, though the FTE figure is only 7 percent above average. Arizona’s part-time enrollment is 59 percent above average, while the full-time enrollment is 5 percent below average. Enrollment is particularly high at community colleges. The performance of the higher education system in Arizona is difficult to assess. Achievement test scores do not exist in higher education. Arizona’s strong dependence on community colleges and the presence of few private universities relative to many states complicates the analysis. Arizona ranks a little above the middle of the states on the completion category included in “Measuring Up.” However, despite the state’s high participation per capita, the number of

7
degrees awarded per capita is slightly below average, with per capita associate’s degrees, bachelor’s degrees, and advanced degrees all a little below average. The per capita number of degrees is above average in business and education, but is below average in the humanities, social sciences, and natural sciences. The educational attainment, as defined by the percentage obtaining a bachelor’s degree, of those who likely received their K-12 education in Arizona was significantly lower in 2000 than the attainment of Arizonans of the same age who likely received their K-12 education in another U.S. state. Of those educated in Arizona, the percentage with a bachelor’s degree ranks among the bottom 10 states in the nation.
Conclusion According to the Arizona Constitution, “the legislature shall make such appropriations, to be met by taxation, as shall insure the proper maintenance of all state educational institutions, and shall make such special appropriations as shall provide for their development and improvement.” However, the empirical record indicates that the amount of appropriations currently, and for some years in the past, has not been adequate to satisfy this constitutional requirement. Given the unusually large demographic challenges faced by Arizona’s children, the poor performance of Arizona’s elementary and secondary school students even after adjustment for the demographic challenges, the very low public spending relative to other states, and the very significant decrease in spending over time, it is doubtful that the “proper maintenance” clause, much less the “development and improvement” clause, of the Constitution is being met for elementary and secondary education. Funding for higher education is not as far below the national average as K-12 funding, but still is considerably below the median state and has decreased significantly over time. In particular, higher education funding from the state general fund has fallen more over time than has general fund expenditures for elementary and secondary education. Thus, funding for higher education also is not meeting the constitutional requirement. The conclusion of this analysis that existing appropriations for higher education are not adequate to satisfy the constitutional requirement matches that of the February 2006 report “Tuition, Appropriations and Constitutional Mandates in Arizona:”
“Public appropriations, especially for Arizona’s traditional four-year universities, have not advanced at a rate that allows the state to serve a growing student population while competing for resources in the increasingly costly higher-education marketplace. This suggests that the state has not met its obligation to provide for ‘development and improvement’ of the public university system as mandated by the Arizona Constitution. The declining public support is occurring despite increasing evidence that investments in higher education yield quantifiable societal returns in addition to the widely recognized private financial returns.”

8
CONSTITUTIONAL REQUIREMENT FOR FUNDING EDUCATION Article 11, Section 10 of the Arizona Constitution reads (in full):
The revenue for the maintenance of the respective state educational institutions shall be derived from the investment of the proceeds of the sale, and from the rental of such lands as have been set aside by the enabling act approved June 20, 1910, or other legislative enactment of the United States, for the use and benefit of the respective state educational institutions. In addition to such income the legislature shall make such appropriations, to be met by taxation, as shall insure the proper maintenance of all state educational institutions, and shall make such special appropriations as shall provide for their development and improvement.
The first sentence refers to the sale and lease of state trust land. Focusing on the second sentence, the constitutional requirement that the Arizona Legislature shall provide funding for public education from tax revenue is clear. No distinction is made between elementary, secondary, and higher education. What is less clear is whether existing funding appropriated by the Legislature is adequate to provide for the “proper maintenance” and the “development and improvement” of the public educational system. To help interpret the constitutional requirement, the following words are defined:
• Proper: appropriate to the purpose; normal or regular • Maintain: to keep in due condition or operation; to provide for the upkeep or support of • Develop: to bring to a more advanced or effective state; strengthen • Improve: to bring into a more desirable or excellent condition; to increase in value
None of these terms are absolute; some degree of subjectivity is present. In the context of state spending, “proper” might be interpreted as being close to the national average or the median state. The “development and improvement” clause indicates that the writers of the Constitution intended that “all state educational institutions” be enhanced — that “proper maintenance” is not enough. The purpose of this paper is to provide insight as to whether existing legislative appropriations for public education meet the requirements of Article 11, Section 10 of the Arizona Constitution. The focus is an analysis of empirical data on education funding in Arizona, over time and compared to other states. To assist in determining whether existing funding for public education in Arizona meets the constitutional requirement, evaluations of Arizona’s public educational system are reviewed.

9
DATA AND METHODOLOGY FOR ASSESSING EDUCATION FUNDING A factual examination of education funding in Arizona is addressed in the next section of this report. Unless otherwise noted, all references to years are for the end of the fiscal year that runs from July 1 through June 30. Two sources of education funding are analyzed. The Arizona Joint Legislative Budget Committee (JLBC) is the source of state government expenditure data. The focus in this paper is the Arizona state government general fund, since this is the fund that provides most of the state government’s monies for education and because the general fund is under the discretion of the Legislature. The general fund is the largest of numerous funds maintained by the state government. It is the fund currently receiving attention because of its large deficit in the last fiscal year and projected large deficits in the current and succeeding fiscal years. A time series of general fund appropriations is available from 1979 through 2008 from the JLBC. (The initial 2009 appropriations also are available, but are almost certain to be lowered as part of the process of closing the general fund deficit.) While the JLBC data can be used to compare state government general fund expenditures over time, they cannot be directly compared to state government expenditures in other states. The level of government levying taxes and fees and having responsibility for funding programs varies from state to state. Over time, within any state, the responsibility for some revenue and expenditures may shift between state and local governments. Thus, to make accurate state-by-state comparisons, state government finance data must be combined with local government finance data (of counties, cities and towns, school districts, and special districts — such as those created for fire prevention). The primary source of data on public-sector finance across the United States is the “state and local government finances” series compiled by the U.S. Department of Commerce, Census Bureau. While the Census Bureau provides detail specific to “public elementary-secondary education finances,” this series was not used in this paper so that the higher education data are consistent with the elementary and secondary school data. (The elementary and secondary education data are similar but not identical in the two series.) The annual Census Bureau tabulations present revenue and expenditure figures by state, using a consistent accounting system for all states. The Census Bureau aggregates the data across all state and local governments in the nation to create a national total. In the next section, existing education funding in Arizona as reported by the Census Bureau is compared to historical levels as well as to the funding in other states and to the national average. The Census Bureau’s state and local government finance data run from 1964 through 2006, though data for 2001 and 2003 are limited to national totals. In the charts presented in this paper, missing data are estimated as the midpoint between the values of the preceding year and the following year. Every five years (in years ending in ‘2’ and ‘7’), the Census Bureau data come from a census of all governments. In the other years, the Census Bureau collects data from each state government

10
and from a sample of local governments in each state in order to produce estimates of the government finance figures. Most of the detail reported by the Census Bureau is for “general” revenue and expenditures. For state government, the Census Bureau’s definition of “general” is much broader than the general fund reported by the JLBC, including other state government funds. Overall expenditures are divided into capital outlays and current operations. A capital outlay is defined as a public expenditure for construction, the purchase of land and existing structures, and the purchase of equipment. All other expenditures are classified as current operations. The Census Bureau does not split total spending into current operations and capital outlays in all expenditure categories and historical categorical data on current operations and capital outlays are even more limited. The complete time series of data from the JLBC and from the Census Bureau are presented in the next section. Changes since 1992 are particularly examined. That year was selected as a comparison year since it is a census year and since it represents the beginning of the period of ongoing tax reductions by the Arizona Legislature. Since the tax reductions have resulted in reduced state government revenue, and since state government cannot operate at a deficit, reduced revenue has had an impact on education spending. Another reason for selecting 1992 is that for several years before then, spending for capital outlays was unusually high.
Funding Relative to Personal Income In order to compare government finance data over time, the expenditure data reported by the JLBC and the Census Bureau need to be adjusted for inflation, population growth, and real per capita economic growth. To compare the Census Bureau’s government finance data across states, differences in state size also must be accounted for. All of these adjustments can be accomplished simply by dividing the expenditure data by personal income, as reported by the U.S. Department of Commerce, Bureau of Economic Analysis (BEA). Dividing the government revenue or expenditure data by personal income is the most commonly used means of accounting for income differences across states and across time. The result of the division usually is expressed per $1,000 of personal income. Personal income also is used in various Arizona statutes and constitutional clauses for purposes such as the calculation of the appropriation limitation and the operation of the budget stabilization fund. Personal income by state is calculated quarterly and annually. For the analysis in the following section, the annual average of personal income for the four quarters that align with the state government fiscal year was calculated. Personal income typically is used to adjust tax revenue and other government revenue in an effort to estimate the “ability to pay.” Since states cannot run an annual deficit as can the federal government, expenditures cannot exceed revenue. Thus, considering the ability to pay also has relevance to expenditure data. However, personal income is broadly defined and includes nonmonetary income, such as pensions paid by an employer, contributions paid by both the employer and the employee for

11
government social insurance, and the imputed rent received by homeowners. Income received by entities other than individuals, such as businesses, also is included. Since these sources of income are not available to households to apply to tax payments, the use of personal income to adjust public finance data produces a distorted indicator of ability to pay. In contrast, a measure such as household income includes only the money income actually received. Conceptually, money income would be much better as an adjustment to reflect ability to pay, but reliable money income estimates are not available annually by state. One source of household and per capita money income has been the decennial census; the American Community Survey now is beginning to provide an annual time series of these income figures, but the sampling error is large. In Arizona, the difference between personal income as reported by the BEA and decennial census income reported by the Census Bureau relative to other states has been substantial. In 1999, Arizona’s per capita income from the decennial census was 6 percent less than the national average, while per capita personal income was 15 percent less than the national average. The difference between these two measures was greater in Arizona than in any other state. This large difference between the two income measures relative to the national average suggests either that the BEA is underestimating nonmoney income in Arizona in those components for which state-specific data do not exist, or that income other than household money income is very low in Arizona. In either case, the inclusion of nonmoney income in the personal income measure results in the understatement of the ability of Arizonans to pay taxes. Thus, personal income is not a suitable measure of the ability to pay in Arizona, but few alternatives exist. One alternative is to use income reported by the IRS, but this time series is not complete and not all households file a tax return annually. The Tax Foundation has produced an annual measure, going back to 1977, of per capita income by state that adds to and subtracts from the BEA measure to come closer to the concept of money income. Per capita income is higher using the Tax Foundation’s measure than the BEA’s measure. In addition, Arizona is not as far below the national average on the Tax Foundation’s measure as on the BEA’s measure, but is further below average than based on the decennial census data. Estimation errors in the BEA data and in other data used by the Tax Foundation might account for the difference from the decennial census figure. Since the Tax Foundation’s income measure is about the same percentage higher than the BEA’s personal income measure in each year, the trend of education spending is unaffected by which measure is used — the level of spending relative to income is consistently lower using the Tax Foundation’s data. Thus, while the standard BEA measure was used throughout this analysis, it is important to remember that Arizona’s education funding relative to the ability to pay is higher based on the BEA data than on other data.
Funding Per Student In addition to the data shortcomings of the personal income measure, its use to standardize education spending is seriously flawed since it does not consider the number of students being

12
educated. Children and young adults typically have made up a disproportionate share of Arizona’s population. The demand for public education in Arizona also is above average due to the state’s relatively few private schools. Thus, Arizona needs to spend more relative to personal income than other states in order to provide the same quality of public education. To reflect differences in demand for public education over time and across states, governmental education spending should be placed on a per student basis. Enrollment counts were collected primarily from the National Center for Education Statistics (NCES). Fall enrollment by state by year is available for public elementary and secondary (K-12) education back to fall 1963, matching the first year of Census Bureau expenditure data. The latest data available are for fall 2005. While this corresponds to the last fiscal year of data from the Census Bureau (for 2005-06), two additional years of expenditure data are available from the JLBC. Thus, the NCES figures for Arizona were supplemented by K-12 enrollment figures reported by the Arizona Department of Education (ADE). A disadvantage of using the per student measure is the questionable accuracy of the K-12 enrollment figures. A comparison of the enrollment reported by the ADE and the NCES indicates that the figures match or nearly match in some years, but that sizable differences exist in other years. From both sources, the time series includes erratic year-to-year changes that do not coincide with the economic cycle or with annual estimates of total population change. Public higher education enrollment data are available annually from the NCES from fall 1965 through fall 2005. The higher education enrollment time series appears to be accurate. The first time that the higher education enrollment was split into community college and university categories was fall 1982. An alternative time series of full-time-equivalent (FTE) enrollment at community colleges and at universities begins in fall 1984. The NCES data for Arizona were supplemented with more current FTE enrollment data collected by Arizona State University’s Office of Institutional Analysis. However, the FTE enrollment figures from ASU do not match those reported by the NCES. Thus, the time series relationship between the two series was used to estimate enrollment figures for the latest two years that are consistent with the NCES figures for earlier years. To perform a per student analysis over time, the finance data must be inflation adjusted; the gross domestic product implicit price deflator (GDP deflator) is used for this purpose. However, the inflation rate varies by sector. For example, within the gross domestic product, inflation in fixed investment in nonresidential structures has been considerably higher than the overall inflation rate measured by the GDP deflator. Similarly, within the consumer price index (CPI), health care inflation has been much higher than overall inflation. Higher education also has experienced high inflation rates relative to overall inflation as measured by the GDP deflator or the CPI. Except during the mid-to-late 1970s, when overall inflation was quite high, the inflation rate measured by the higher education price index (HEPI) has been higher than the rate measured by the GDP deflator in every year since the beginning of the HEPI in 1961. The annual average differential since 1985 has been 1.5 percentage points. The higher inflation rate in higher education is a result of a number of factors, including labor-market pressures to pay market-driven salaries, the conservatory nature of universities, and the

13
need to incorporate costly cutting-edge technology. Thus, in the analysis in the next section, higher education expenditures per student have been inflation adjusted by the HEPI as well as by the GDP deflator. However, simply adjusting per pupil expenditures for inflation does not reflect changes in the state’s ability to pay for education (and other public services). Over time it is important to consider changes in income when analyzing government finance data. Inflation-adjusted per capita income in the United States rises over time due to productivity gains. In an increasingly affluent society, inflation-adjusted government tax collections per capita can increase at the pace of per capita income growth without the tax burden increasing. Thus, inflation-adjusted spending per student is an inadequate measure. Moreover, a growing and changing economy creates additional costs and additional demand for public services, requiring the growth of public revenue and expenditures to keep pace with economic growth. For example, schools have expended substantial monies to acquire computer hardware and software to keep pace with the technological changes. Such investments would have been impossible if spending increases were limited to inflation and population growth. Another drawback to comparing per pupil measures across states is that the cost of living varies by state. Research has shown that a meld of unadjusted and cost-of-living-adjusted data provides the best comparison across states. However, a state-level index of living costs is not regularly produced. The limitations of the per student measure due to not reflecting the geographic variation in living costs or real per capita economic growth can be overcome by expressing per pupil spending per $1,000 of per capita personal income. Unfortunately, this measure is subject to the shortcomings of the personal income estimates. Thus, because of inadequacies in each measure, three gauges of education funding are examined in the next section: (1) per $1,000 of personal income, (2) per student, inflation adjusted, and (3) per student per $1,000 of per capita personal income. The last measure is conceptually superior.

14
EXPENDITURES FOR EDUCATION IN ARIZONA In this section, education spending is presented first per $1,000 of personal income and then per student adjusted for inflation and per student per $1,000 of per capita personal income. Per pupil spending per $1,000 of per capita personal income is the best measure of education spending, though year-to-year changes in the K-12 measure need to be interpreted cautiously due to the questionable accuracy of the enrollment figures.
Arizona State Government General Fund Expenditures for Education The JLBC accounting of the state general fund includes an overall category of education and a number of subcategories, as seen in Table 1. The Department of Education subcategory consists almost entirely of funding that is distributed to public elementary and secondary schools. Total general fund expenditures in 2008 totaled $10,113 million. (Since actual expenditures for 2009 are likely to be less than the appropriated amount, the latest actual data for 2008 are presented in this section.) Education spending was 57 percent of the total. Health and welfare is the other large category of expenditures, responsible for 27 percent of the total. Protection and safety accounted for 11 percent of the spending, with most of this for corrections. All of the rest of the general fund spending was only 5 percent of the total. In 2008, education expenditures totaled $5,801 million. Elementary and secondary school spending was $4,027 million (40 percent of the total general fund) and another $479 million
TABLE 1 EDUCATION EXPENDITURES BY CATEGORY AND SUBCATEGORY,
SELECTED YEARS, ARIZONA STATE GOVERNMENT GENERAL FUND
Share of Total 2008 2008 1992 1979
TOTAL GENERAL FUND $10,112,751,400 100.0% 100.0% 100.0% Total Education 5,801,312,000 57.4 55.4 69.3 Department of Education 4,027,156,200 39.8 37.5 45.9 School Facilities Board 479,101,400 4.7 0.0 0.0 Community Colleges 167,744,800 1.7 2.4 3.7 Universities/Regents 1,091,780,400 10.8 14.9 19.1 Board of Regents 19,717,500 0.2 0.2 0.3 Arizona State University 482,878,300 4.8 5.8 6.6 Northern Arizona University 158,273,500 1.6 2.0 2.4 University of Arizona 430,911,100 4.3 6.9 9.8 School for the Deaf and the Blind 21,946,600 0.2 0.4 0.5 Other 13,582,600 0.1 0.1 0.1 Commission on the Arts 2,030,700 Historical Society, Arizona 4,430,200 Historical Society, Prescott 762,200 State Board for Charter Schools 1,131,800 Commission for Postsecondary Education 3,727,300 Medical Student Loans Board 1,500,000 Source: Arizona Joint Legislative Budget Committee.

15
went to the School Facilities Board to build and maintain the physical infrastructure of K-12 schools. Expenditures for the Board of Regents and the universities totaled $1,092 million — 11 percent of the total general fund. State general fund spending for community colleges was much lower at $168 million. As large as education’s share of state general fund appropriations was in 2008, it was smaller than in the past, as the share dropped from 69 percent in 1979 to 57 percent in 2008 (see Chart 1). Education’s share of total general fund spending would have dropped even more had funding for school construction (the School Facilities Board category) not been shifted into the general fund in 1999; previously school construction had been funded by school district bonds. Offsetting the decline in the education share was a large gain in the share of expenditures for health and welfare, rising from 16 percent to more than 26 percent. The protection and safety category’s share rose from 6 percent to 11 percent, while the share of all other spending fell from more than 8 percent to 5 percent. Education Funding Per $1,000 of Personal Income State government general fund expenditures per $1,000 of personal income since 1979 are displayed in Chart 2. A large share of total expenditures always has gone to education. The lines plotted in Chart 2 illustrate some cyclicality in expenditures — particularly related to the economic downturn of the early 2000s and the subsequent recovery — as well as a decline over time, particularly for education. The decrease in education spending per $1,000 of personal income between 1979 and 2008 was greater than that of the entire general fund and occurred in each of the major education subcategories. Large declines in share have occurred throughout the period for the community colleges and universities, as seen in Table 1. However, after falling substantially during the 1980s, the K-12 share was slightly higher in 2008 than in 1992. The decrease in overall education spending per $1,000 of personal income totaled 22 percent between the 1981 peak and 2008. Most of the decline occurred during the 1980s. Between 1992 and 2008, the decrease was 5 percent. Initially, decreases in education funding per $1,000 of personal income occurred primarily in the K-12 subcategory. The decline between the 1981 peak and 1989 was 23 percent. Since the late 1980s, spending has hardly changed in K-12. The total decline from the 1981 peak has been 25 percent. In contrast, funding per $1,000 of personal income for the universities has decreased primarily since the early 1990s. Between 1992 and 2008, the drop was a considerable 34 percent. The total decline from 1979 has been 42 percent. Community college funding has fallen throughout the period, but especially during the early 1980s. The total decrease has been 55 percent. Funding for the School Facilities Board has fluctuated with the economic cycle. During periods of budget deficits, rather than funding school construction out of the general fund, long-term financing has been used.

16
CHART 1 SHARE OF TOTAL EXPENDITURES BY CATEGORY, 1979 AND 2008,
ARIZONA STATE GOVERNMENT GENERAL FUND
1979
Education
Health & Welfare
Protection & Safety
Other
2008
Education
Health & Welfare
Protection & Safety
Other
Source: Arizona Joint Legislative Budget Committee.

17
CHART 2 EXPENDITURES PER $1,000 OF PERSONAL INCOME, 1979 THROUGH 2008,
ARIZONA STATE GOVERNMENT GENERAL FUND
$20
$25
$30
$35
$40
$45
$50
$55
1979 1981 1983 1985 1987 1989 1991 1993 1995 1997 1999 2001 2003 2005 2007
Total Education
$0
$5
$10
$15
$20
$25
$30
1979 1981 1983 1985 1987 1989 1991 1993 1995 1997 1999 2001 2003 2005 2007
Elementary & Secondary Universities
Community Colleges School Facilities Board Sources: Arizona Joint Legislative Budget Committee (expenditures) and U.S. Department of Commerce, Bureau of Economic Analysis (personal income).

18
The large decreases in total expenditures per $1,000 of personal income in 2002 and 2003 reflect actions taken to resolve a significant budget deficit. That deficit was partially due to a weak economy but also was a result of the tax decreases passed by the Arizona Legislature in the preceding decade. The revenue lost had not been matched by equivalent declines in spending until the recession forced expenditures to be reduced. Much of the large decrease in education spending in 2002 and 2003 was in the School Facilities Board category. The subsequent increase in expenditures after 2003 reflects a recovery from the record low spending figure, enabled by a surge in state general fund revenue resulting from a strong economic recovery that was enhanced by the real estate boom. Despite the increase in education expenditures per $1,000 in personal income between 2003 and 2008, the 2008 level was lower than in most prior years. The current recession and very large deficit in the state general fund probably will cause spending per $1,000 of personal income to plunge in 2009 and 2010 as it did in 2002 and 2003. Thus, while proponents of spending cuts to balance the current fiscal year’s general fund have justified this position by focusing on the large increase in spending between 2003 and 2008, the longer time series reveals how unrepresentative is the 2003-to-2008 period. Further, other than the return of funding to the School Facilities Board, education funding hardly rose over these five years. Education Funding Per Student General fund expenditures for K-12 education per student have climbed over time on an inflation-adjusted basis, though expenditures fell during each of the economic recessions, as seen in Chart 3. Considering economic growth, however, K-12 expenditures have fallen significantly since the early 1980s. Per $1,000 of per capita personal income (PCPI), elementary and secondary school expenditures have fallen from a peak of $142 in 1983 to $105 in 2008, a decline of 26 percent. The decrease from 1992 through 2008 was 8 percent. An earlier analysis of appropriations for higher education in Arizona was included in the February 2006 report “Tuition, Appropriations and Constitutional Mandates in Arizona,” available at http://wpcarey.asu.edu/seid/ccpr/UEreports.cfm. This report included information specific to Arizona State University and its peer schools. The pattern over time of per student spending for higher education is nearly identical whether total enrollment or FTE enrollment is used. Since more up-to-date estimates of FTE enrollment were obtained and because the FTE data conceptually are more meaningful, most of the following analysis focuses on spending per full-time-equivalent student. Using the GDP deflator to adjust for inflation, general fund expenditures for higher education per FTE student have fluctuated over time with no trend. Decreases occurred during the early 1990s and early 2000s recessions, as seen in Chart 4. A sharp decline from 2001 through 2004 was largely offset by 2008. In contrast, using the HEPI to adjust for inflation, higher education expenditures per FTE student have fallen substantially over time in Arizona. The figure in 2008 was 21 percent less than in 1985 and 11 percent less than in 1992.

19
CHART 3 ELEMENTARY AND SECONDARY EDUCATION EXPENDITURES PER STUDENT,
1979 THROUGH 2008, ARIZONA STATE GOVERNMENT GENERAL FUND
$2,000
$2,250
$2,500
$2,750
$3,000
$3,250
$3,500
$3,750
1979 1982 1985 1988 1991 1994 1997 2000 2003 2006
$90
$95
$100
$105
$110
$115
$120
$125
$130
$135
$140
$145
$150
Real Dollars (Left) Per $1,000 of Per Capita Personal Income (Right) Note: Left scale is inflation adjusted using the gross domestic product implicit price deflator, and is expressed in 2008 dollars. Sources: Arizona Joint Legislative Budget Committee (expenditures); U.S. Department of Education, National Center for Education Statistics, and Arizona Department of Education (enrollment); and U.S. Department of Commerce, Bureau of Economic Analysis (personal income and gross domestic product implicit price deflator).
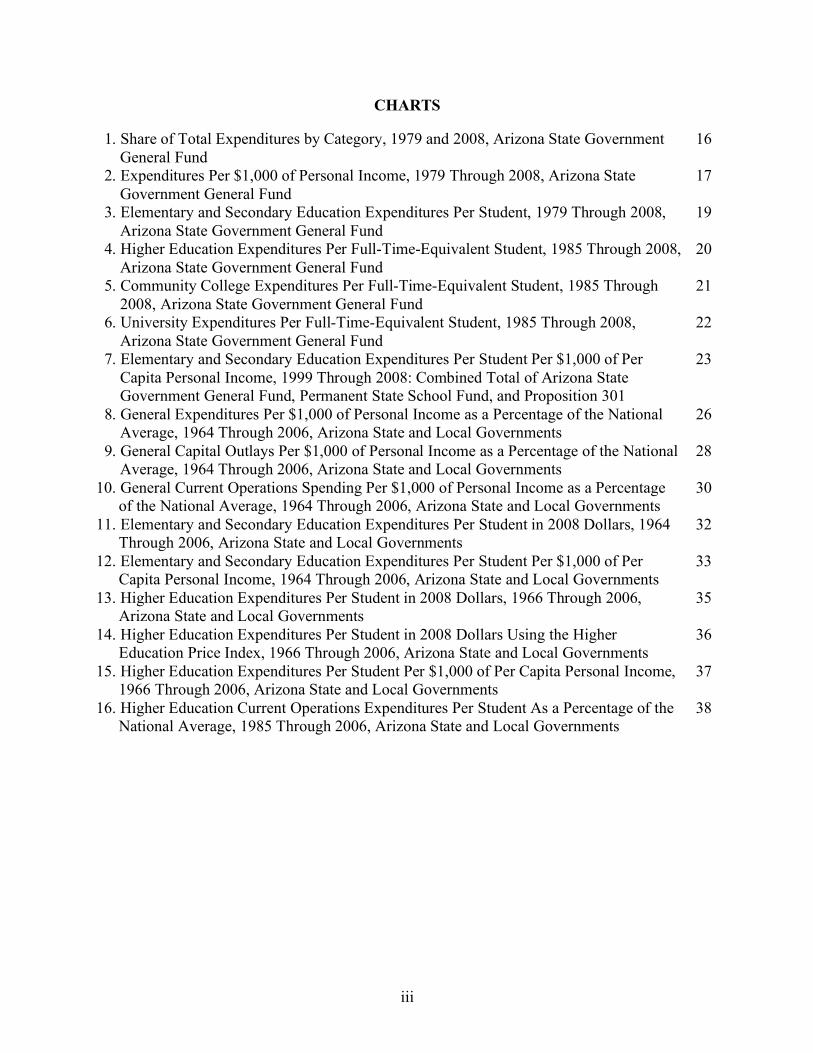
Considering economic growth, higher education expenditures per FTE student have followed a pattern very similar to that of real spending per FTE student adjusted by the HEPI. Per $1,000 of per capita personal income, expenditures dropped from a peak of $252 in 1986 to $157 in 2005 before recovering somewhat to $182 in 2008. The decline was 22 percent between 1985 and 2008; the decrease from 1992 through 2008 was 18 percent. Per FTE student expenditures from the state general fund adjusted by the HEPI have decreased for both community colleges and the university system. The same is true relative to economic growth. As seen in Chart 5, from 1997 through 2008, community college expenditures per FTE student per $1,000 of PCPI fell 27 percent. The decline from 1992 through 2008 was 19 percent; it was 20 percent from 1985 through 2008. General fund expenditures for the universities are displayed in Chart 6. Per FTE student — both adjusted by the HEPI and per $1,000 of PCPI — a sharp decline occurred between 1986 and 2006. The percentage decrease since 1985 has been 15 percent, even with the recovery in spending in 2007 and 2008. Between 1992 and 2008, the decrease was 20 percent. Even without considering economic growth or the higher inflation experienced in higher education, real

20
CHART 4 HIGHER EDUCATION EXPENDITURES PER FULL-TIME-EQUIVALENT STUDENT,
1985 THROUGH 2008, ARIZONA STATE GOVERNMENT GENERAL FUND
$5,000
$5,500
$6,000
$6,500
$7,000
$7,500
$8,000
$8,500
1985 1987 1989 1991 1993 1995 1997 1999 2001 2003 2005 2007
$150
$170
$190
$210
$230
$250
$270
Real Dollars, Using GDP Deflator (Left)
Real Dollars, Using HEPI (Left)
Per $1,000 of Per Capita Personal Income (Right) Note: The inflation-adjusted dollars on the left scale are expressed in 2008 dollars, using the gross domestic product implicit price deflator and the higher education price index, respectively. Sources: Arizona Joint Legislative Budget Committee (expenditures); U.S. Department of Education, National Center for Education Statistics, and Arizona State University (enrollment); U.S. Department of Commerce, Bureau of Economic Analysis (personal income and gross domestic product implicit price deflator), and Commonfund Institute (HEPI).
spending per FTE student was hardly higher in 2008 than in 1986 and was less than in 1999, 2000, and 2001. The percent change in spending per student per $1,000 of per capita personal income is shown for standardized time periods in Table 2. (Total K-12 enrollment is assumed to be the same as FTE enrollment.) Each type of education spending was down over each time period shown. The declines in higher education generally have exceeded those of K-12 education.

21
CHART 5 COMMUNITY COLLEGE EXPENDITURES PER FULL-TIME-EQUIVALENT
STUDENT, 1985 THROUGH 2008, ARIZONA STATE GOVERNMENT GENERAL FUND
$1,400
$1,500
$1,600
$1,700
$1,800
$1,900
$2,000
$2,100
$2,200
$2,300
$2,400
1985 1987 1989 1991 1993 1995 1997 1999 2001 2003 2005 2007
$45
$50
$55
$60
$65
$70
$75
Real Dollars, Using GDP Deflator (Left)
Real Dollars, Using HEPI (Left)
Per $1,000 of Per Capita Personal Income (Right) Note: The inflation-adjusted dollars on the left scale are expressed in 2008 dollars, using the gross domestic product implicit price deflator and the higher education price index, respectively. Sources: Arizona Joint Legislative Budget Committee (expenditures); U.S. Department of Education, National Center for Education Statistics, and Arizona State University (enrollment); U.S. Department of Commerce, Bureau of Economic Analysis (personal income and gross domestic product implicit price deflator), and Commonfund Institute (HEPI).
22
CHART 6 UNIVERSITY EXPENDITURES PER FULL-TIME-EQUIVALENT STUDENT, 1985 THROUGH 2008, ARIZONA STATE GOVERNMENT GENERAL FUND
$8,500
$9,000
$9,500
$10,000
$10,500
$11,000
$11,500
$12,000
$12,500
$13,000
1985 1987 1989 1991 1993 1995 1997 1999 2001 2003 2005 2007
$260
$280
$300
$320
$340
$360
$380
$400
Real Dollars, Using GDP Deflator (Left)
Real Dollars, Using HEPI (Left)
Per $1,000 of Per Capita Personal Income (Right) Note: The inflation-adjusted dollars on the left scale are expressed in 2008 dollars, using the gross domestic product implicit price deflator and the higher education price index, respectively. Sources: Arizona Joint Legislative Budget Committee (expenditures); U.S. Department of Education, National Center for Education Statistics, and Arizona State University (enrollment); U.S. Department of Commerce, Bureau of Economic Analysis (personal income and gross domestic product implicit price deflator), and Commonfund Institute (HEPI).
TABLE 2 PERCENT CHANGE IN PER STUDENT SPENDING
PER $1,000 OF PER CAPITA PERSONAL INCOME IN ARIZONA, ARIZONA STATE GOVERNMENT GENERAL FUND
Total Enrollment Full-Time-Equivalent
Enrollment 1992-2006 1983-2006 1992-2008 1985-2008 Elementary & Secondary -10.3% -27.6% -7.9% -19.9% Higher Education -27.1 -23.5 -18.1 -22.0 Community Colleges -18.9 -20.2 -19.1 -19.8 Universities -27.9 -17.9 -19.8 -15.2
Sources: Arizona Joint Legislative Budget Committee (expenditures); U.S. Department of Education, National Center for Education Statistics, Arizona Department of Education, and Arizona State University (enrollment); and U.S. Department of Commerce, Bureau of Economic Analysis (per capita personal income).

23
Other Sources of Education Funding The general fund is not the only source of state government education funding in Arizona. As indicated in the constitutional clause presented on page 8, the educational system receives funding from the sale and lease of state trust lands. In addition, the voters of Arizona passed Proposition 301 in November 2000, which raised the state sales tax 0.6 percentage points, earmarking the revenue to be used for education. Of the total spent on K-12 education in 2008 by state government, excluding the School Facilities Board but including all of Proposition 301, the general fund was the dominant source, accounting for 86 percent of the total. Proposition 301 revenue accounted for 13 percent, while the proceeds from the state trust lands contributed just 1 percent. The impact of Proposition 301 funds being added in 2002 is seen in Chart 7, causing total per student expenditures per $1,000 of PCPI to increase a little; they would have decreased without the voter-approved proposition.
CHART 7 ELEMENTARY AND SECONDARY EDUCATION EXPENDITURES PER STUDENT
PER $1,000 OF PER CAPITA PERSONAL INCOME, 1999 THROUGH 2008: COMBINED TOTAL OF ARIZONA STATE GOVERNMENT GENERAL FUND,
PERMANENT STATE SCHOOL FUND, AND PROPOSITION 301
$0
$20
$40
$60
$80
$100
$120
$140
1999 2000 2001 2002 2003 2004 2005 2006 2007 2008
Total General Fund Only Sources: Arizona Joint Legislative Budget Committee (expenditures); U.S. Department of Education, National Center for Education Statistics, and Arizona Department of Education (enrollment); and U.S. Department of Commerce, Bureau of Economic Analysis (personal income).

24
These three state government funds are not the only sources of monies expended for education. Funding also comes in the form of federal aid, tuition, other fees, local property taxes, etc. Total spending for education by state and local governments combined is presented in the next subsection.
Combined State and Local Government Expenditures for Education In the analysis of combined state and local government data for Arizona presented in this subsection, Arizona is compared to the national average and is ranked among the 51 “states” (including the District of Columbia). In addition, Arizona is compared to a subset of western or fast-growing states (California, Colorado, Florida, Georgia, Idaho, Nevada, New Mexico, North Carolina, Oregon, Texas, Utah and Washington). Total state and local government general expenditures in Arizona totaled $35.7 billion in 2006 (see Table 3). Total expenditures per capita of $5,900 per Arizona resident were 17.3 percent less than the national average. Arizona’s per capita figure was fifth lowest in the nation and third lowest among 13 western and/or fast-growing states.
TABLE 3 EDUCATION EXPENDITURES BY CATEGORY AND SUBCATEGORY, 2006,
ARIZONA STATE AND LOCAL GOVERNMENTS Dollars in Thousands Share of Total
State and
Local State Local State & Local State Local
TOTAL, CURRENT & CAPITAL TOTAL EXPENDITURES $35,747,327 $14,677,632 $21,069,695 100.0% 100.0% 100.0% Education Services 11,957,872 3,077,156 8,880,716 33.4 21.0 42.1 Education 11,800,497 3,067,294 8,733,203 33.0 20.9 41.4 Higher Education 3,574,947 2,579,486 995,461 10.0 17.6 4.7 Elementary and Secondary 7,737,742 0 7,737,742 21.6 0.0 36.7 Other 487,808 487,808 0 1.4 3.3 0.0 Libraries 157,375 9,862 147,513 0.4 0.1 0.7 CAPITAL OUTLAYS TOTAL EXPENDITURES 5,420,117 1,495,422 3,924,695 100.0 100.0 100.0 Education 1,561,975 329,108 1,232,867 28.8 22.0 31.4 Higher Education 413,965 324,778 89,187 7.6 21.7 2.3 Elementary and Secondary 1,143,680 0 1,143,680 21.1 0.0 29.1 Other 4,330 4,330 0 0.1 0.3 0.0 CURRENT OPERATIONS TOTAL EXPENDITURES 30,327,210 13,182,210 17,145,000 100.0 100.0 100.0 Education 10,238,522 2,738,186 7,500,336 33.8 20.8 43.7 Higher Education 3,160,982 2,254,708 906,274 10.4 17.1 5.3 Elementary and Secondary 6,594,062 0 6,594,062 21.7 0.0 38.5 Other 483,478 483,478 0 1.6 3.7 0.0 Source: U.S. Department of Commerce, Census Bureau.

25
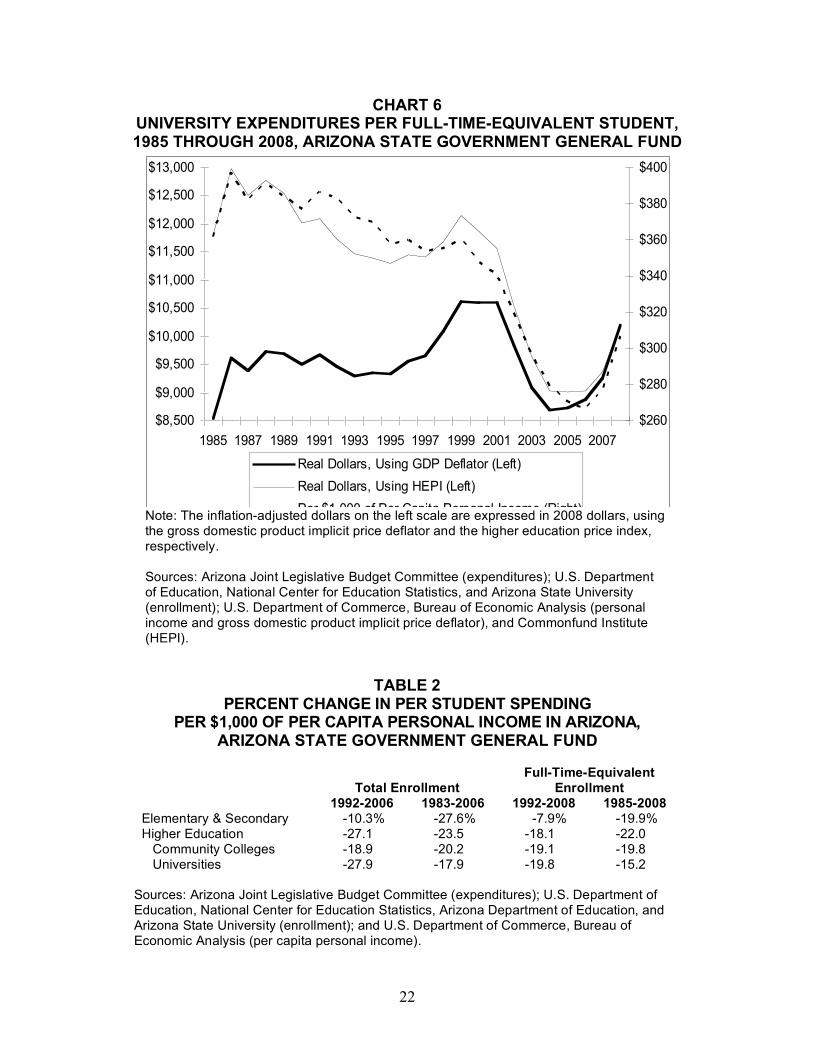
Arizona governments expended nearly $12 billion for educational services in 2006. Education’s share of total expenditures was not as high on a combined state and local government basis as for the state government general fund alone, but still accounted for one-third of total government expenditures in Arizona in 2006. The funding for elementary and secondary education was more than twice as much as for higher education. While the JLBC accounting system places most of the elementary and secondary school spending within the state general fund, the Census Bureau allocates this spending to local governments. The higher education category is not divided by the Census Bureau into community colleges and universities, but the local government spending for higher education presumably is for community colleges. Spending on capital outlays by Arizona governments was $5.4 billion in 2006, or $895 per person, only 3 percent more than the national average (17th in the nation and sixth in the comparison group). These above-average figures are due to the demands placed on infrastructure building from Arizona’s rapid population growth. Historically, Arizona’s capital outlays have been much further above the national average. More than one-fourth of the capital outlays in 2006 were for education. In 2006, capital outlays accounted for 12 percent of the higher education spending and 15 percent of K-12 spending. Expenditures for current operations totaled $30.3 billion in 2006, just more than $5,000 per resident. This was 20 percent less than the national average and the second lowest in the nation. Education received just more than one-third of the total. Per $1,000 of Personal Income As a percentage of the national average, total state and local government expenditures per $1,000 of personal income have fallen substantially since 1990 in Arizona and the 1990 peak was less than the figures in the mid-1960s, as seen in Chart 8. Arizona’s spending relative to personal income since the mid-1990s has been less than the U.S. average, the lowest on record. Total spending per $1,000 of personal income fell from 6 percent above average in 1992 — typical of the period from the 1970s through the early 1990s — to 7 percent below average in 2006, with the rank dropping from 21st to 36th overall and from fifth to ninth among the 13 comparison states. State and local government expenditures for education per $1,000 of personal income in Arizona fell sharply as a percentage of the national average during the 1960s. After fluctuating throughout the 1970s and 1980s at around 120 percent of the national average, the percentage of the national average dropped to less than 100 in 1997 and to 90 in 2006, far below the historical norm. Between 1992 and 2006, the percentage decreased from 114 to 90, the rank among all states dropped from 20th to 42nd, and the rank among the comparison states fell from fifth to 10th. As a percentage of the national average, K-12 spending per $1,000 of personal income in Arizona has decreased since the initial year of data in 1964, when it was 38 percent above average. From 1970 into the 1990s, Arizona’s figure fluctuated between 6 and 21 percent above the national average. In 1997, it fell to below the U.S. average and in 2006, K-12 spending was 14 percent less than the U.S. average per $1,000 of personal income — the fifth lowest in the nation, down from 22nd highest in 1992 when it was 8 percent above average. Only one of the
26
CHART 8 GENERAL EXPENDITURES PER $1,000 OF PERSONAL INCOME AS A PERCENTAGE OF THE NATIONAL AVERAGE, 1964 THROUGH 2006,
ARIZONA STATE AND LOCAL GOVERNMENTS
90%
100%
110%
120%
130%
140%
150%
1964 1967 1970 1973 1976 1979 1982 1985 1988 1991 1994 1997 2000 2003 2006
Total Expenditures Education
70%
80%
90%
100%
110%
120%
130%
140%
150%
160%
170%
180%
190%
200%
210%
220%
1964 1967 1970 1973 1976 1979 1982 1985 1988 1991 1994 1997 2000 2003 2006
K-12 Higher Education Other Education Libraries Note: Data for 2001 and 2003 are estimated. Source: U.S. Department of Commerce, Census Bureau (expenditures) and Bureau of Economic Analysis (personal income).

27
comparison states spent less relative to personal income in 2006; Arizona had ranked sixth in the early 1990s. Even after dropping considerably from the very high levels of the 1960s, Arizona’s spending for higher education relative to personal income remained about 50-to-60 percent higher than the national average. Since 1990, however, the figure has dropped significantly, falling to 3 percent above the national average in 2006. Its national rank relative to personal income fell from 12th in 1992 (when Arizona’s figure was 35 percent above average) to 30th in 2006, and its rank among the comparison states dropped from third to eighth. Expenditures for other education and for libraries are small relative to K-12 and higher education. In all but two years since 1969, spending per $1,000 of personal income for other education in Arizona has been below the national average, usually by 10-to-20 percent. The 2006 figure was 24 percent less. Since the early 1990s, Arizona’s rank generally has been between 30th and 40th nationally, and around eighth in the comparison group. Spending for libraries was above average until recent years; it dropped to 17 percent below average in 2006. After ranking above the median state, the rank in 2006 was 35th nationally and 10th in the comparison group. These overall spending figures are somewhat misleading, however, given the amount Arizona must spend on capital outlays to serve its rapid population growth. Capital outlays are volatile from year to year and account for much of the fluctuations in the lines in Chart 8. As seen in Chart 9, total general capital outlays per $1,000 of personal income have been higher than the national average in every year, usually by 20-to-90 percent. However, capital outlays in recent years have been among the lowest on record relative to the national average, far less than from the early 1980s to the early 1990s. The 2006 figure was 16 percent above the U.S. average, ranking 17th in the nation and fifth among the comparison states. In contrast, Arizona generally has been the second-fastest growing state in the nation. Relative to personal income, capital outlays for education have been above average in every year. From the mid-1970s to the mid-1990s, Arizona’s figure was at least 66 percent higher in every year. The figures since 2000 have been at historical lows at less than 20 percent above average. In 1992, Arizona’s figure was 82 percent higher than the national average, but in 2006 it was only 5 percent more. The rank dropped from third to 20th nationally and from third to ninth in the comparison group between 1992 and 2006. Historically, capital outlays per $1,000 of personal income in Arizona have been considerably above the national average in most years for both K-12 and higher education. Prior to 1992, the median figure for higher education was 65 percent above average. However, since the early 1990s, the higher education figure has fluctuated from below average to about 40 percent above average. The 2006 figure was 1 percent above average, 28th in the nation and ninth in the comparison group. From the 1970s through the mid-1990s, the K-12 figure frequently was double or triple the national average. Since then, it has dropped precipitously to around the U.S. average. It was 2.2 times higher than average in 1992 but only 7 percent above the national average in 2006. Between the early 1990s and 2006, the national rank dropped from second to 14th while the comparison group rank slid from among the top three to ninth.

28
CHART 9 GENERAL CAPITAL OUTLAYS PER $1,000 OF PERSONAL INCOME
AS A PERCENTAGE OF THE NATIONAL AVERAGE, 1964 THROUGH 2006, ARIZONA STATE AND LOCAL GOVERNMENTS
90%
110%
130%
150%
170%
190%
210%
230%
250%
270%
1964 1967 1970 1973 1976 1979 1982 1985 1988 1991 1994 1997 2000 2003 2006
Total Expenditures Education
75%
100%
125%
150%
175%
200%
225%
250%
275%
300%
325%
1964 1967 1970 1973 1976 1979 1982 1985 1988 1991 1994 1997 2000 2003 2006
K-12 Higher Education Note: Data for 2001 and 2003 are estimated. Source: U.S. Department of Commerce, Census Bureau (expenditures) and Bureau of Economic Analysis (personal income).

29
The exclusion of capital outlays from the expenditure figures provides a better measure of public spending on services and is conceptually consistent with the JLBC’s general fund data, minus the School Facilities Board. The amount per $1,000 of personal income that state and local governments have spent on current operations has dropped considerably over time relative to the national average, as seen in Chart 10. Current operations spending during the 1960s was as much as 28 percent above average. From the 1970s into the mid-1990s, Arizona’s spending fluctuated from about 5 percent above to 5 percent below the national average. That is, excluding government expenditures for capital outlays that are closely related to the state’s rapid growth, Arizona’s government spending relative to personal income was around the national average for a span of more than 20 years. Since the mid-1990s, however, Arizona’s public spending relative to personal income has dropped, to 10 percent below average in 2006. Between 1992 and 2006, the 12-percentage-point decrease has corresponded to a decline in rank from 22nd to 42nd nationally and from fifth to 10th in the comparison group. After being far above the national average during the 1960s, Arizona’s current operations spending per $1,000 of personal income for education was 10-to-20 percent above average from the 1970s through the 1980s. The differential from the national average began to fall in 1991 and by 2006, spending in Arizona was 12 percent below average. Arizona ranked 45th among all states and 10th among the 13 states in the comparison group in 2006. Elementary and secondary school spending for current operations per $1,000 of personal income was greater than the U.S. average through the 1970s, then was very close to the national average through 1993. By 2006, Arizona’s figure was 17 percent below the national average, fourth lowest in the nation and in the comparison group. The decline over time in current operations spending per $1,000 of personal income relative to the national average has been even greater for higher education. Arizona’s figure was at least 50 percent higher than the national average through the early 1980s, and still was 39 percent higher in 1992. In 2006, however, Arizona’s figure was only 4 percent above average. Arizona ranked 30th in the nation and eighth in the comparison group in 2006. Per Student Enrollment data for Arizona and the nation for 2006 indicate that the demand for education is higher in Arizona than the national average for both K-12 and higher education, measured both by enrollment per capita and enrollment relative to personal income. Thus, Arizona’s education expenditures are further below the national average per student than as measured relative to personal income. The high demand for education in part is due to a slightly larger share of the Arizona population being of school age, at least at most times since 1970 (see Table 4). Relatively few private schools in Arizona also contribute to the above-average demand for public schools. K-12. Inflation-adjusted spending per K-12 student is shown in the top graph of Chart 11. After rising substantially (139 percent) from 1964 through 1989, total spending since then has fluctuated but has been flat on average, falling 1 percent from 1989 through 2006. Arizona’s rank among the 51 “states” has fallen substantially since the late 1980s to second-lowest in the

30
CHART 10 GENERAL CURRENT OPERATIONS SPENDING PER $1,000 OF PERSONAL
INCOME AS A PERCENTAGE OF THE NATIONAL AVERAGE, 1964 THROUGH 2006, ARIZONA STATE AND LOCAL GOVERNMENTS
80%
90%
100%
110%
120%
130%
140%
150%
160%
1964 1967 1970 1973 1976 1979 1982 1985 1988 1991 1994 1997 2000 2003 2006
Total Expenditures Education
70%
80%
90%
100%
110%
120%
130%
140%
150%
160%
170%
180%
190%
200%
210%
1964 1967 1970 1973 1976 1979 1982 1985 1988 1991 1994 1997 2000 2003 2006
K-12 Higher Education Other Education Note: Data for 2001 and 2003 are estimated. Source: U.S. Department of Commerce, Census Bureau (expenditures) and Bureau of Economic Analysis (personal income).

31
TABLE 4 SHARE OF TOTAL POPULATION BY AGE, 1970 THROUGH 2007,
ARIZONA AND UNITED STATES Ages 5 to 17 Ages 18 to 24 Arizona U.S. Ratio Arizona U.S. Ratio 1970 25.44% 25.82% 0.985 11.94% 11.66% 1.024 1980 21.25 20.93 1.015 13.57 13.25 1.024 1990 18.78 18.19 1.032 10.71 10.75 0.996 2000 19.19 18.87 1.017 10.02 9.65 1.038 2005-07 18.55 17.81 1.042 9.44 9.85 0.958 Source: U.S. Department of Commerce, Census Bureau, decennial censuses and American Community Survey (2005 through 2007 average). country in 2006. Arizona also ranked next-to-last in the comparison group in 2006, down from a rank of sixth in 1993. Inflation-adjusted spending per student rose substantially into the late 1980s for both capital outlays (217 percent increase between 1964 and 1989) and current operations (127 percent increase over those 25 years). Since then, capital outlays have fallen 21 percent while current operations spending has increased 4 percent. Arizona’s rank on capital outlays fell from second in 1993 to 24th in the nation and ninth among the 13 comparison states in 2006. The current operations rank also has dropped, overall from 41st in 1993 to 50th in 2006, and in the comparison group from ninth to 12th. Relative to the national average (the bottom graph of Chart 11), inflation-adjusted spending per K-12 student was essentially flat from 1964 through 1987, but has decreased since then, from 12 percent higher than the national average to 10 percent lower in 1992 and to 31 percent less in 2006. Since 1994, the ratio to the U.S. average has been lower than in all prior years, with the figures of the last three years the lowest on record. The pattern has been very similar for current operations spending, with the 2006 figure the lowest on record. In contrast, capital outlays surged relative to the national average from the late 1960s through 1987 and since has plunged, with the ratios to the U.S average in the last four years lower than in all prior years except 1966 through 1968. In Chart 12, the figures presented in Chart 11 are adjusted by income instead of by inflation. Total spending per K-12 student per $1,000 of PCPI has been variable, higher during the late 1970s and from the late 1980s into the mid-1990s than at other times. Only in 1973 and 1974 was the figure less than in 2006. The 2006 figure was 11 percent less than that of 1964 and 20 percent less than in 1992. Arizona had the lowest figure in the nation in 2006; the rank had been 18th in 1993 (and third in the comparison group). The pattern has been similar for current operations, with Arizona’s spending in 2006 the lowest in the nation, down from a rank of 37th (seventh in the comparison group) in 1993. Capital outlays rose from 1967 through 1987 before falling. Arizona’s capital spending in 1993 was second highest in the nation; by 2006, the rank was down to 21st (and 10th in the comparison group).

32
CHART 11 ELEMENTARY AND SECONDARY EDUCATION EXPENDITURES PER STUDENT IN 2008
DOLLARS, 1964 THROUGH 2006, ARIZONA STATE AND LOCAL GOVERNMENTS
$0
$1,000
$2,000
$3,000
$4,000
$5,000
$6,000
$7,000
$8,000
1964 1967 1970 1973 1976 1979 1982 1985 1988 1991 1994 1997 2000 2003 2006
Total Capital Current AS A PERCENTAGE OF THE NATIONAL AVERAGE
60%
100%
140%
180%
220%
260%
300%
1964 1967 1970 1973 1976 1979 1982 1985 1988 1991 1994 1997 2000 2003 2006
Total Capital Current Sources: U.S. Department Of Commerce, Census Bureau (expenditures); U.S. Department of Education, National Center for Education Statistics (enrollment); and U.S. Department of Commerce, Bureau of Economic Analysis (personal income and gross domestic product implicit price deflator).

33
CHART 12 ELEMENTARY AND SECONDARY EDUCATION EXPENDITURES PER STUDENT PER
$1,000 OF PER CAPITA PERSONAL INCOME, 1964 THROUGH 2006, ARIZONA STATE AND LOCAL GOVERNMENTS
$0
$50
$100
$150
$200
$250
$300
$350
1964 1967 1970 1973 1976 1979 1982 1985 1988 1991 1994 1997 2000 2003 2006
Total Capital Current AS A PERCENTAGE OF THE NATIONAL AVERAGE
70%
80%
90%
100%
110%
120%
130%
140%
1964 1967 1970 1973 1976 1979 1982 1985 1988 1991 1994 1997 2000 2003 2006
Total Current
Sources: U.S. Department Of Commerce, Census Bureau (expenditures); U.S. Department of Education, National Center for Education Statistics (enrollment); and U.S. Department of Commerce, Bureau of Economic Analysis (personal income).

34
As a percentage of the national average (the bottom graph of Chart 12), total spending per K-12 student per $1,000 of PCPI has fluctuated but followed a downward trend since 1964. Arizona’s 2006 figure was 22 percent less than the national average, the lowest on record, and far below the above-average figures that prevailed until the mid-1990s. Current operations spending per K-12 student per $1,000 of PCPI has followed a similar pattern, with the 2006 figure of 24 percent less than the national average in sharp contrast to the 1964 figure of 30 percent above average; the figure was above average as recently as the late 1980s. Capital outlays are not shown in the bottom graph due to the volatility; the pattern is similar to that of the bottom graph of Chart 11. Higher Education. Community college and university data are combined in this subsection. Since the FTE student enrollment data go back only to 1985, while the expenditure data go back to 1964 and the total enrollment data are available back to 1966, the charts in this subsection display spending per student rather than per FTE student. Inflation-adjusted spending per student — calculated using the GDP deflator — is shown in the top graph of Chart 13. After fluctuating from 1966 through 1998, total spending since then has increased by 35 percent, with current operations spending up nearly as much. These increases in spending disappear when HEPI is used to make the inflation adjustment (see Chart 14). Per student spending overall and for capital outlays fell in the 1960s and has been variable since with no trend. Per student spending for current operations has fluctuated around $10,000 since the 1960s. Relative to the national average (the bottom graph of Chart 13), spending per higher education student was variable from 1966 through 1996, but has decreased a little since then. Arizona’s figure was 24 percent less than the national average in 2006, lower than in all years through 1996. The pattern has been very similar for current operations spending, which also was 24 percent below the U.S. average in 2006; the 1992 figure was 19 percent below average. In contrast, capital outlays have been erratic relative to the national average, ranging from much below to above the U.S average. The expenditure relationship to the national average is similar per full-time-equivalent student as per student, though the state’s figures are not as low on a per FTE student basis. Total and current operations spending per FTE student was 14 percent less than the U.S. average in 2006. Overall per student spending for higher education in Arizona was the lowest in the country in both 1993 and 2006. Arizona’s rank on capital outlays per student was 41st in 2006, the same as in 1993 — despite the state’s rapid growth consistently ranking near the top in the nation. The rank for current operations spending per student dropped from 49th in 1993 to last in 2006. Spending patterns since 1985 are similar per full-time-equivalent student as per student, though the state does not rank quite as low on a per FTE student basis: 47th overall in 2006, down from 44th in 1993; 34th on capital outlays, in 2006, up from 38th in 1993; and 46th on current operations in 2006, down from 43rd in 1993. Chart 15 is the complement to Chart 13, adjusting per student spending by income instead of by inflation. Total spending per higher education student per $1,000 of PCPI has been flat since the mid-1970s after dropping considerably from the mid-1960s. The 2006 figure was 42 percent less

35
CHART 13 HIGHER EDUCATION EXPENDITURES PER STUDENT IN 2008 DOLLARS,
1966 THROUGH 2006, ARIZONA STATE AND LOCAL GOVERNMENTS
$0
$1,000
$2,000
$3,000
$4,000
$5,000
$6,000
$7,000
$8,000
$9,000
$10,000
$11,000
$12,000
1966 1969 1972 1975 1978 1981 1984 1987 1990 1993 1996 1999 2002 2005
Total Capital Current AS A PERCENTAGE OF THE NATIONAL AVERAGE
50%
60%
70%
80%
90%
100%
110%
120%
130%
140%
150%
1966 1969 1972 1975 1978 1981 1984 1987 1990 1993 1996 1999 2002 2005
Total Capital Current Sources: U.S. Department Of Commerce, Census Bureau (expenditures); U.S. Department of Education, National Center for Education Statistics (enrollment); and U.S. Department of Commerce, Bureau of Economic Analysis (personal income and gross domestic product implicit price deflator).

36
than that of 1966. The pattern has been similar for current operations, with a decline of 29 percent since 1966, but an increase of 1 percent since 1992. Capital outlays dropped in the 1960s and have been variable since. As a percentage of the national average (the bottom graph of Chart 15), total spending per higher education student per $1,000 of PCPI in Arizona has fluctuated but has generally been below the national average. The figures have been particularly low since the early 1990s. Arizona’s 2006 figure was 15 percent less than the national average. Current operations spending per higher education student per $1,000 of PCPI has followed a similar pattern, with the 2006 figure 14 percent less than average. It was only 6 percent below average in 1992. Capital outlays are not shown in the bottom graph due to the volatility; the pattern is similar to that of the bottom graph of Chart 13. Arizona’s capital spending was 17 percent below average in 2006. Arizona ranked 47th in the nation (ninth in the comparison group) in 2006 on total higher education spending per student per $1,000 of PCPI, down from 41st in 1993. Arizona’s capital outlays also ranked 47th in the nation in 2006, down from a rank of 41st in 1993. Arizona’s capital spending in 2006 was 39th in the nation and 10th in the comparison group.
CHART 14 HIGHER EDUCATION EXPENDITURES PER STUDENT IN 2008 DOLLARS USING THE HIGHER EDUCATION PRICE INDEX, 1966 THROUGH 2006,
ARIZONA STATE AND LOCAL GOVERNMENTS
$0
$1,000
$2,000
$3,000
$4,000
$5,000
$6,000
$7,000
$8,000
$9,000
$10,000
$11,000
$12,000
$13,000
$14,000
$15,000
1966 1969 1972 1975 1978 1981 1984 1987 1990 1993 1996 1999 2002 2005
Total Capital Current Sources: U.S. Department Of Commerce, Census Bureau (expenditures); U.S. Department of Education, National Center for Education Statistics (enrollment); and U.S. Department of Commerce, Bureau of Economic Analysis (personal income), and Commonfund Institute (HEPI).
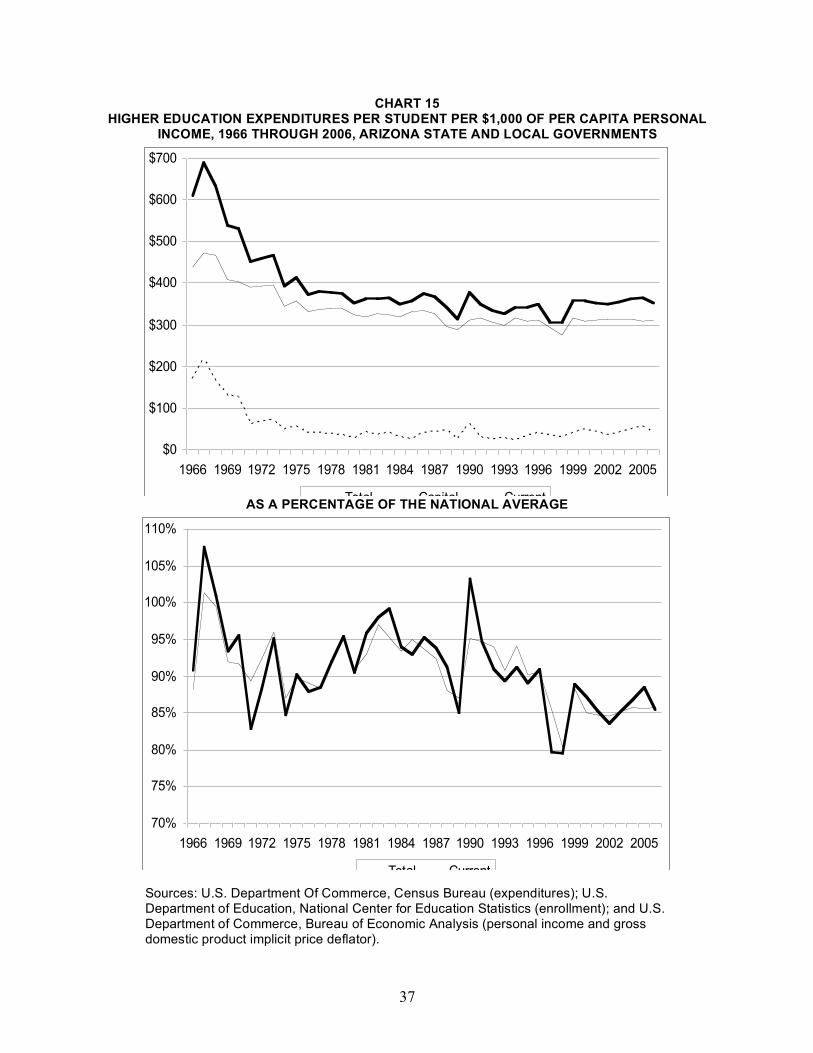
37
CHART 15 HIGHER EDUCATION EXPENDITURES PER STUDENT PER $1,000 OF PER CAPITA PERSONAL
INCOME, 1966 THROUGH 2006, ARIZONA STATE AND LOCAL GOVERNMENTS
$0
$100
$200
$300
$400
$500
$600
$700
1966 1969 1972 1975 1978 1981 1984 1987 1990 1993 1996 1999 2002 2005
Total Capital Current AS A PERCENTAGE OF THE NATIONAL AVERAGE
70%
75%
80%
85%
90%
95%
100%
105%
110%
1966 1969 1972 1975 1978 1981 1984 1987 1990 1993 1996 1999 2002 2005
Total Current
Sources: U.S. Department Of Commerce, Census Bureau (expenditures); U.S. Department of Education, National Center for Education Statistics (enrollment); and U.S. Department of Commerce, Bureau of Economic Analysis (personal income and gross domestic product implicit price deflator).

38
Using FTE enrollment instead, current operations spending in Arizona fell a little more than using total enrollment. The decrease was 11 percent between 1985 and 2006 and 1 percent from 1992 through 2006. However, Arizona’s figure was not as far below the national average at only 2 percent below the national average in 2006, after having been 6 percent above average in 1992 and 11 percent above average in 1985. Arizona does not rank quite as low using FTE enrollment instead of total enrollment, at 36th overall in 2006, down from 31st in 1993; 31st on capital outlays in 2006, compared to 32nd in 1993; and 37th on current operations in 2006, down from 31st in 1993. A comparison between per student and per FTE student spending relative to the national average is shown in Chart 16 for current operations expenditures. Each of the lines follow a similar pattern, with spending lower since the mid-1990s than in earlier years, but the differential from the national average varies by line. Using FTE enrollment and adjusting for per capita personal income, Arizona’s spending in recent years has been only a little below the U.S. average, though the state’s rank in 2006 was 37th. Arizona was furthest below the national average on the per student measure, ranking last in the nation in 2006.
CHART 16 HIGHER EDUCATION CURRENT OPERATIONS EXPENDITURES PER STUDENT
AS A PERCENTAGE OF THE NATIONAL AVERAGE, 1985 THROUGH 2006, ARIZONA STATE AND LOCAL GOVERNMENTS
65%
70%
75%
80%
85%
90%
95%
100%
105%
110%
115%
1985 1987 1989 1991 1993 1995 1997 1999 2001 2003 2005
Per Student Per Student Relative to PCPI
Per FTE Student Per FTE Student Relative to PCPI
Sources: U.S. Department Of Commerce, Census Bureau (expenditures); U.S. Department of Education, National Center for Education Statistics (enrollment); and U.S. Department of Commerce, Bureau of Economic Analysis (personal income and gross domestic product implicit price deflator).

39
EVALUATION OF PUBLIC EDUCATION IN ARIZONA If Arizona’s educational system were performing well, the low funding documented in the prior section of this report would be of lesser significance. This would provide contravening evidence to the contention that the Arizona Legislature is not meeting its constitutional requirement in funding public education, particularly in terms of “development and improvement.” While funding is not the only input into the educational system and therefore not the only factor affecting the performance of Arizona’s educational system, funding is of obvious significance. To expect Arizona’s schools and institutions of higher education to perform well despite the very low funding levels, the quality of the other inputs would need to be very high. However, there is no evidence that funding deficiencies in Arizona are offset by inherently more intelligent or harder-working students, by better-quality teachers, by significantly more efficient use of limited resources by schools and school districts, etc. In fact, as discussed in this section, Arizona’s teachers have less experience than their counterparts nationally. Arizona has a disproportionate share of disadvantaged students — a circumstance requiring above-average rather than below-average funding to overcome. In this section, an evaluation of the performance — primarily outputs related to student achievement — of Arizona’s educational system is undertaken. There are many indicators of education quality, but most of these must be carefully interpreted due to a variety of limitations in their measurement and meaning. Much of the data presented in this section come from the “Digest of Education Statistics,” produced by the National Center for Education Statistics (NCES). This annual report presents the latest data by state on many topics, but by the time the report is published most of these data lag behind by a few years.
Elementary and Secondary Education Various studies have included different types of measures to evaluate the quality of K-12 education. Common categories are student achievement, as measured by test scores; high school completion rates; assessments of resources, including total spending and teacher salaries; and academic standards and accountability. In many cases, the Arizona data are reported by the Arizona Department of Education. Historically, the ADE made many errors in the reporting of data, such that it is difficult to determine changes in the state’s performance on various measures over time. As noted earlier, the enrollment figures are suspect. Other measures, such as teachers’ salaries, also are of questionable accuracy. In the rest of this subsection, a review of K-12 data, mostly as reported by the NCES, is undertaken first. Then, the findings of two comprehensive studies of K-12 education by state and of another study specific to Arizona are presented.
40
Achievement Various tests are used to assess student achievement, comparing one state to itself over time or comparing states at one point in time. These include tests given by grade level, advanced placement tests, and university entrance exams. Some tests are norm-referenced — scores are presented relative to how well other test-takers do. Other tests are criterion-referenced — scores are based on performance relative to certain criteria and are not affected by how well other test-takers do on the test. Each test has shortcomings such that any comparison of Arizona’s performance over time or its performance relative to other states must be made cautiously. Recent results for Arizona vary by test, from Arizona students scoring near the national average and the median of the states to ranking near the bottom of the states. NAEP. The National Assessment of Educational Progress (NAEP), also known as the Nation’s Report Card, is a criterion-referenced test that provides measures of the performance of students in grades 4 and 8 on national standardized tests in four subjects: mathematics, reading, writing, and science. Results for other grades and subjects are available only for the nation. The tests have not been administered on a consistent schedule, by subject or by grade. Since the NAEP is the only test administered in all states, it is the test used in all studies of state-to-state comparisons. The NAEP is administered to a small sample of students. The sample size in Arizona is approximately 1/100 that of other tests and thus is much more subject to sampling error. In addition, the NAEP test is not given under the same circumstances from state to state. All students must take the test in English in Arizona due to a voter-passed initiative, while in a number of other states, English language learners may take the test in Spanish. However, Arizona’s test scores were below average before this requirement took effect. Arizona has consistently scored considerably below the national average in each NAEP subject in each grade over time. In the fourth-grade NAEP reading test, Arizona’s score has been somewhat further below the national average in recent years than in earlier years. In 2007, Arizona ranked 47th among the 51 states and next to last among the comparison states. A higher-than-average proportion of Arizona students did not meet the basic requirements, with lesser proportions at each of the achievement levels: basic, proficient, and advanced. Fourth-grade math scores also have been below average in Arizona, with the state ranking tied for 44th nationally and tied for 10th in the comparison group in 2007. Eighth-grade scores in Arizona have not been quite as far below the national average. In 2007, Arizona ranked tied for 43rd nationally and 10th of the 13 comparison states on the reading test. The state ranked 37th nationally and ninth in the comparison group on eighth-grade math scores in 2007. In the eighth-grade science test, scores of Arizona students were similarly below average. Due to the small sample size, scores are not reported for all states. The NCES reports selected test results by various demographics. In the eighth-grade reading test, Arizona’s scores were below average in each of three geographic areas: central city, urban

41
fringe/large town, and rural/small town. Eighth-grade math scores were tallied by the educational attainment of the parents of the children taking the test; Arizona scored below average regardless of the educational attainment of the parents. The eighth-grade science test results were reported based on eligibility for reduced-price lunch programs — a measure of income — and Arizona scored similarly below average in each category. By race/ethnicity, the science scores were below the national average among whites, Hispanics, and American Indians, but slightly above average among blacks. Thus, Arizona’s below-average NAEP scores cannot be explained by poor performance in any particular category of student. Norm-Referenced Tests. Various norm-referenced tests have been administered in Arizona over the years. The state switched from the Iowa test to the Stanford 9, then in 2005, the Terra Nova test and the AIMS dual purpose assessment replaced the Stanford 9. Because of the switching between tests, it is difficult to determine changes in performance of Arizona’s students over a long time span. Even within the same test, the scores from year to year sometimes change considerably. Arizona students compare more favorably to the national average on the Terra Nova and AIMS tests than on the NAEP test. In general, second through ninth grade students in Arizona scored near the national median in 2008. The test results show the percentile for the math test ranged from 50 to 53 across the grades. The reading percentiles ranged from 47 to 53, while the language results also were between 47 and 53. AP. Advanced placement (AP) courses are offered in numerous subject areas in participating high schools. AP courses are intended to be at a college level of learning. The number of students taking at least one AP exam, the total number of AP exams taken, and the number of AP exams taken scoring 3 or higher are reported by the College Board by state. Exam scores range from 1 to 5, with 3 termed “qualified” (equivalent to a ‘B’ to ‘C’ grade in a college course) and 5 defined as “extremely well qualified” (equivalent to an ‘A’ grade in a college course). For this paper, the percentage of students taking an AP exam was calculated based on enrollment figures that are a proxy for the potential number of students who could take an AP exam. Arizona’s considerably lower-than-average share of students taking an AP exam (in 2006, 17.5 percent of Arizona students versus a national total of 35.7 percent) could result from multiple causes: for example, AP courses may not be offered, or publicized, at some schools. This low percentage could bias the results, depending on the reasons for the low participation in AP courses. For example, if only very highly qualified students in Arizona are taking AP courses, then the average grade in Arizona would be higher than in a state in which a high percentage of the students take one or more AP courses. The percentage of AP exams taken scoring 3 or higher in Arizona has fluctuated over the last decade from a little lower to a little higher than the national total, though the 2007 percentage was further below the national total (53.7 percent versus 57.2 percent). University Entrance Exams. High school students may take either or both of two university entrance exams: the SAT and ACT. The SAT test historically consisted of two parts — critical reading and mathematics — but a third section, writing, was added in 2006. For the ACT test, a

42
composite score and scores for each of the four subjects — English, mathematics, reading, and science — are available. For this paper, the percentage of students taking an entrance exam was calculated based on October 1 enrollment figures. Since some students take SAT and ACT exams prior to the 12th grade, and since the exams are given on various dates, enrollment serves as a proxy for the potential number of students who could take a university entrance exam. In Arizona, the population of test takers is self selected: only those students considering applying to universities typically take these entrance exams and these generally are students with higher achievement levels. In some states, however, these tests are either mandated of all students or are taken by a very high proportion of students. As a result, the percentage of students taking the SAT test in Arizona in 2006 was barely more than half the national average; the proportion taking the ACT was considerably less than half. Two-thirds of the test takers in Arizona ranked in the top 20 percent of their class, versus only 56 percent nationally. Thus, Arizona’s higher scores relative to the national average reflect the more selective nature of Arizona test takers in comparison to the national norm, rather than superior achievement by Arizona students. The NCES reports SAT results. Arizona’s SAT scores in recent years have been less far above the national average than in earlier years. Despite the somewhat higher-than-average scores, Arizona ranked slightly below the median state in 2007: 28th on reading, 27th on math, and tied for 30th on science. Though the percentage of students taking the SAT was far below the national average in 2007, Arizona’s percentage was at the median of the states. High School Completion Rates Dropout rates and high school graduation rates are included in this category, but these measures have very serious limitations. The graduation rate and dropout rate calculations are greatly hampered by the difficulty in tracking individual students over time. Some of those shown as not graduating in reality are in the “status unknown” category. For example, a student who moves to another state without notifying his Arizona school is shown as not graduating. Results are so erratic from year to year and across states that it is not possible to definitively state how Arizona compares to other states or to evaluate Arizona’s progress over time. Thus, considerable caution is advised in using both the graduation rate and dropout rate. High School Graduation. As reported by the Arizona Department of Education, the high school graduation rate measures the graduation rate of public high school students across Arizona. It is based on a measure of four-year graduation as a share of students who comprised the original ninth-grade class, plus transfers in, minus transfers out and minus deceased students. The graduation rate is calculated specific to a cohort: for example, those entering ninth grade in the 2002-03 school year comprised the cohort measured by the 2006 data. The graduation rates in Arizona have been highly erratic from year to year. Between 2001 and 2004, the reported graduation rate rose from 70.8 percent to 76.6 percent, then plunged to 69.9 percent in 2006, but recovered to 73.4 percent in 2007.
43
The NCES figures for Arizona are considerably different from those reported by the ADE, but also are highly erratic from year-to-year, to the extent that it is impossible to say whether the graduation rate in Arizona is higher or lower than the national average. For example, the rate reported for 2004 was much less than the U.S. average and ranked 43rd among the 51 states, while, the reported rate for 2005 was much higher than the national average and ranked eighth among the 51 states. Dropout Rates. Calculated from those who drop out during a single year from grades 7 through 12, the definition and calculation of the dropout rate produced by the Arizona Department of Education has changed somewhat over time in Arizona. Further, the dropout rate calculation also is greatly hampered by the difficulty in tracking individual students over time. Dropout rates in Arizona have trended down over time. The reported dropout rate has decreased in every year since 1999, when it was 8.8 percent. The 2008 rate was down to 3.6 percent. However, it is not clear what proportion of the apparent improvement results from changes in the calculation of the dropout rate or from improved tracking of students. The NCES reports a dropout rate calculated differently (as the percentage of ninth to 12th graders). In 2004, Arizona’s figure of 6.7 percent was considerably higher than the national average of 3.9 percent. Arizona’s figure ranked 48th among the 50 states and last among the 13 comparison states. The dropout rate was higher than average in Arizona in each racial/ethnic group except Asians, with the largest difference from the national average among Hispanics. Resources According to the NCES, total education revenue per student in 2005 in Arizona was 22 percent less than the national average. The bulk of the revenue comes from state and local governments; Arizona’s per pupil figure was 20 percent less than average from state government and 29 percent below average from local government. In contrast, federal funding per student was nearly equal to the national average. Private sources of revenue were 11 percent below average per student in Arizona, but this is an insignificant source of revenue. The NCES reports education spending figures separately from those reported by the Census Bureau. In 2005, total per pupil spending in Arizona was 29 percent below average. Current expenditures per student also were 29 percent below average while capital outlays per student were 26 percent below average. Current operations spending per pupil was far below the national average in almost all categories, including 30 percent below average in the key instructional category. Within the instructional category, per pupil spending on salaries was 21 percent below average, and Arizona’s per pupil figures were at least 40 percent below average in the other subcategories, including employee benefits, purchased services, and supplies. Spending also was far below average in the student support services category at 28 percent below the national average. Though claims have been made of high administrative costs in Arizona, two subcategories of administrative expenditures were even further below average at 40 percent and 37 percent below the national average.

44
Using fall enrollment to adjust the current expenditure figures, spending per pupil in Arizona slipped from approximately 10 percent below average in 1970 and 1980 to 20 percent below average in 1990 and to 29 percent below average in 2005. Arizona’s figure was second-lowest in the nation in 2005. Using another measure of enrollment — average daily attendance — Arizona does not compare quite as unfavorably. In 2005, the state’s figure was 24 percent below average, ranking 48th in the nation and 11th among the comparison states. Classroom Size and Related Measures. As with most topics related to the provision of public services by government, the importance of classroom size to educational achievement is hotly contested. While some studies conclude that classroom size does not matter, the bulk of the carefully conducted studies conclude that classroom size is important, at least in the early grades. In kindergarten through the third grade, studies have found that the maximum number of students per classroom should be between 15 and 18. After third grade — after fundamentals are mastered — classroom size gradually can be increased without negatively affecting student learning. As reported by the NCES, the average classroom size in Arizona in 2004 was 23.0 students in elementary school and 27.0 students in secondary schools. Both figures were higher than the national average (20.4 and 24.7 respectively). Assuming that smaller classroom size is better, Arizona’s elementary school figure ranked 48th of 51 “states” and 10th of 13 comparison states. The secondary school average ranked 45th nationally and eighth in the comparison group. An alternative measure provided by the NCES is the number of pupils per FTE teacher, elementary and secondary schools combined. Arizona’s average of 21.3 is above the national average, by a greater margin since 2003 than in the preceding few years. Only one state, Utah, had a higher figure in 2005. A broader measure is the number of pupils per the total number of educational system staff. Arizona also ranks near the bottom on this measure at 48th nationally and 10th in the comparison group. Arizona’s average was 10.9 in 2005, compared to 8.0 nationally. The differential from the national average increased after 2002. As a share of the overall staff of the educational system, a considerably lesser share in Arizona work for school districts, according to NCES data for 2005. The teacher proportion is the same in Arizona as nationally, though prior to 2005 the share of teachers in Arizona was less than average. Arizona makes more use of support staff, including instructional aides. The average number of students per regular elementary school in Arizona was 10 percent higher than the national average in 2006. In contrast, the average number per regular secondary school was 13 percent lower than average. Teacher Qualifications and Salaries. According to the NCES, the educational attainment of teachers in Arizona was similar to the national average in 2004. However, the number of years of teaching experience was less in Arizona. Higher shares of Arizona teachers had less than three years and less than 10 years of experience, while a lesser share had more than 20 years of experience as a teacher.

45
The NCES indicates that the average teacher salary in Arizona has declined over time relative to the national average. In 1970, it was marginally higher than the U.S. average, but it was approximately 6 percent lower than average in 1980 and 1990, then fell to more than 10 percent below average before recovering a bit to 9 percent less than the national average in 2006. An alternative measure of teacher salaries is reported annually by the American Federation of Teachers (AFT), with the data coming from the state department of education in each state. The question of data accuracy again is present. In Arizona, the figures reported in the early 2000s are inconsistent with those reported earlier or more recently. The AFT data do not match those reported by the NCES. As reported by the AFT, the average teacher salary in Arizona in the late 1980s was only a little (2-to-4 percent) less than the national average and ranked in the middle of the states (23rd or 24th). Over the next several years, increases in Arizona were less than those nationally, such that the Arizona average fell to as much as 17 percent below average, with a rank of 41st, in 2000. Since then, with the passage of Proposition 301 in November 2000, Arizona appears to have regained some of the ground lost during the 1990s. In 2007, the average teacher salary in Arizona was 12 percent less than the national average and Arizona ranked 31st among the 50 states. However, among the 13 comparison states, Arizona ranked 11th, ahead of only New Mexico and Utah. The lower teacher salaries in Arizona are in part due to the lesser experience of teachers in Arizona. According to the AFT, the average salary of a beginning teacher in Arizona is only slightly less than the national average. However, the NCES data for 2004 indicate that the average salary in Arizona is considerably below the U.S. average for each combination of educational attainment and number of years of experience, with the differential from the U.S. average least among teachers with a bachelor’s degree and less than 2 years of experience. “Quality Counts 2009” Annually, Education Week (www.edweek.org/rc) produces “Quality Counts,” an evaluation of K-12 education by state. The latest report released in January 2009 includes six categories. Arizona’s grade is considerably less than the median state in five of the six categories. The first category, Chance for Success, presents an evaluation based on a “cradle-to-career” framework. Arizona ranks 43rd nationally and 11th in the comparison group. Many of this category’s indicators are not specific to the performance of the K-12 system. However, the “early foundations” portion of the category still is valuable to the assessment of K-12 education. In essence, this portion is an evaluation of educational need. It includes four measures linked to educational success, including family income, parent education, parental employment, and linguistic integration. In this subcategory, Arizona’s score is considerably below the national average. Thus, to achieve success in K-12 education, Arizona must overcome negative societal factors to a greater extent than most states. Arizona also compares poorly in the “school years” portion of the Chance for Success category, with a score far below the national average. The six indicators cover school enrollment prior to the first grade, NAEP test scores, high school graduation, and participation in higher education.

46
In contrast, Arizona does not score much below the national average in the “adult outcomes” subcategory, which looks at adult educational attainment, income, and employment. Arizona compares more favorably in this subcategory because those who migrated to Arizona after completing their schooling are included. The second category, K-12 Achievement, is the most relevant to the analysis presented in this paper. Arizona ranks 44th overall and 11th in the comparison group. In addition to achievement in the most recent year, this category looks at the change in student achievement over time. It also evaluates the equity of achievement, by examining poverty-based achievement gaps. Arizona ranks below the middle on all three of these subcategories: tied for 41st nationally and 11th among the comparison states on status, 43rd nationally and 11th in the comparison group on change, and 34th nationally and seventh in the comparison group on equity. Much of this category consists of the most recent NAEP test scores and the change in the scores over time. Arizona ranks far below the median state on both the latest scores and on the change over time. Also included are measures of high school graduation and the change over time; Arizona ranks below the median on each. Arizona’s ranks on the AP test and the change over time are even lower. In contrast, Arizona’s ranks are mixed on the poverty gap and the change in the gap over time, accounting for the state’s somewhat higher rating in the equity subcategory. Arizona also compares poorly (a rank of 41st nationally and 11th in the comparison group) in the Teaching Profession category. Fifty individual measures are included in this category on topics such as initial licensure, evaluating teacher performance, and entry or transfer barriers. Arizona is far below average in the “accountability for quality” and “building and supporting capacity” subcategories, but is a little above average in the “incentives and allocation” component. The results of a study on teacher pay relative to the earnings in 16 occupations deemed to be comparable to teachers shows that in most states, teacher pay is below that of the comparable occupations. Arizona ranks 47th in the nation and 11th in the comparison group. The School Finance category includes measures of spending and of equity. Arizona ranks 42nd (of 49 states with data) nationally and ninth among the 13 comparison states. Arizona scores a little above the median state on the equity of spending across school districts but is very far below average in the spending subcategory, which includes per pupil expenditures adjusted for cost-of-living differences, per pupil spending weighted by the degree to which districts meet or approach the national average for expenditures, the percent of students in districts with per pupil expenditures at or above the national average, and K-12 funding as a percentage of state taxable resources. Arizona receives its best grades in the category of Standards, Assessments, and Accountability, ranking eighth in the nation and highest in the comparison group. This category includes 25 measures, such as whether the state has adopted standards in the core subjects and the nature of tests used to measure student performance. Arizona’s evaluation is well above the median state in each of the three components. Arizona places below the middle of the states (36th nationally and ninth in the comparison group) in the Transitions and Alignment category. Student achievement is not measured in this

47
category. Instead, 14 measures such as whether high school courses are aligned with the postsecondary system and whether the state defines school readiness and college readiness are included. The state’s score is far below the national average in the early-childhood education component. While the score is average in the college readiness subcategory, the grade assigned is a D-. Arizona scores slightly above average in the economy and workforce component. “Measuring Up 2008” “Measuring Up 2008,” produced by the National Center for Public Policy and Higher Education (a nonprofit, nonpartisan, independent group), primarily evaluates higher education by state. However, the first category of this report, Preparation for College, really is an evaluation of the K-12 educational system by state. It includes measures of high school completion, K-12 science and mathematics courses, K-12 student achievement, and teacher quality. Arizona compares unfavorably in this category, ranking 49th nationally and last in the comparison group. The five lowest-rated states are Arizona, New Mexico, Louisiana, Mississippi, and Alabama. Arizona’s low grade reflects low scores on each of the 10 individual indicators for which data are available for Arizona. Five indicators are based on the NAEP tests, with Arizona ranking between 36th and 42nd nationally, and between ninth and 11th among the 13 comparison states, on each measure. Two other indicators also are based on test scores. Arizona ranks next to last (last in the comparison group) on college entrance exam scores. The variability among states in student participation in these tests is adjusted for by counting the number of test takers scoring in the top 20 percent nationally on the SAT and ACT, and dividing this number by the number of high school graduates. Arizona also compares poorly on the number of AP test scores of 3 or higher per the number of high school juniors and seniors, ranking 40th nationally and last in the comparison group. Three indicators other than test scores are included. Arizona ranks 49th nationally and last in the comparison group in the percentage of 18-to-24 year olds with a high school diploma or GED. However, migration of individuals between states means that this is not strictly a measure of educational system performance within Arizona. On the percentage of students taught by teachers with a college major in the subject area taught, Arizona ranked 45th nationally and 12th in the comparison group. Arizona compared a little better on the percentage of eighth-grade students taking algebra, ranking 34th nationally and 12th among the comparison states. “Educating Arizona” In January 2008, the Arizona Community Foundation published the substantial, fact-filled report “Educating Arizona: Assessing Our Education System (Birth-Grade 12).” The report is divided into two sections: student performance and system indicators. The latter section covers standards and accountability, teaching quality, leadership, school choice, and finance. Arizona’s educational system faces several demographic challenges: above-average child poverty, a high percentage of students who are English-language learners, increasing diversity, a rapidly growing population, and high mobility. In particular, a disproportionate share of the children born in Arizona have young, unmarried mothers who have not received a high school diploma. Research has found that such children need more help than others, and that student achievement gaps start as school readiness gaps.

48
These disadvantaged students, however, are not the sole reason for Arizona’s poor educational performance. More privileged students from Arizona score below their national peers. A key set of statistics cited in the report is that of all Arizona students entering ninth grade, only about 70 percent graduate from high school, only 35 percent continue to college, less than 25 percent make it to the second year of college, and less than 20 percent earn a degree. Student Performance. “Educating Arizona” notes the discrepancy in student performance across different tests. Arizona performs poorly on the NAEP criterion-referenced test relative to other states, with only about one-fourth of students meeting the proficiency standards. In contrast, about two-thirds of Arizona students in each grade pass the AIMS test, but the AIMS standards are much less rigorous than those of the NAEP. For example, the standard for receiving a high school diploma is proficiency at the 10th-grade level. On the Terra Nova norm-referenced test, Arizona students perform at the national average. A lower percentage than average of Arizona students take AP courses, and a lesser share receive a score of 3 or more. The relatively high scores on the ACT and SAT tests are traced to the very low percentages of high school students who take these tests. Less than half of Arizona high school graduates are eligible for admission to the state’s universities and many of those admitted must make up deficiencies. Depending on the subject, between 20-and-42 percent of the students in the Maricopa County Community College District are not ready for college-level work. The report also notes that grant aid per student is among the lowest in the country, with the median state providing 30 times more support than Arizona. System Indicators. “Educating Arizona” assesses standards and accountability, the first category of the system indicators, as near the national average in Arizona, but raises the question whether the standards in place are adequate for a high-technology, global future. The state’s biggest shortfalls in this category were cited as low science and mathematics expectations and a lack of connection between pre-kindergarten, K-12, and higher education standards. Teacher quality, the second category, is assessed as being among the worst in the nation in Arizona, and research has found that high-quality teachers are the most important school-based factor affecting student performance. The National Center on Teaching Quality gives the state a grade of D on teacher preparation, with a F in special education. The U.S. Chamber of Commerce also gives the state a D on teacher workforce policies. In particular, the lack of basic skills requirements and testing was cited as shortcomings. Other issues include the lack of a requirement for teachers to have a degree in the subject area taught, a high percentage of teachers teaching on waivers or out of their field, a high percentage of novice teachers, and low salaries. Leadership and governance, the third category, is difficult to measure. The report notes that preparation and salaries for principals and other administrators are inadequate. Arizona is a national leader in school choice, the fourth category, with multiple options available. The last category of school finance is divided into three components. Arizona’s per pupil spending on operations was cited as third lowest in the country, 28 percent less than the national

49
average; funding between school districts was found to be largely equitable; and the efficiency of funding is difficult to assess.
Higher Education While test scores represent a major portion of the evaluation of K-12 education, such scores are not available for higher education. Thus, it is difficult to evaluate the quality of higher education in Arizona. The “Measuring Up” study places Arizona a little above the median state in the completion category. The NCES data indicate that total enrollment at public institutions of higher education relative to the size of the population was 22 percent higher in Arizona than the national average in 2005. The total number of full-time students per 1,000 residents was 5 percent less than the national average, but a very large number of part-time students (59 percent higher than the national per capita average) pushed FTE enrollment to 7 percent above the national average. The higher-than-average public higher education enrollment per capita in Arizona results from heavy use of the community college system. Overall community college enrollment was 61 percent above the national average per 1,000 residents. While this largely resulted from a substantial number of part-time students attending community colleges, the full-time-equivalent enrollment at the community colleges was 37 percent above the U.S. average per 1,000 residents. Total undergraduate enrollment at the community colleges and the universities combined was 25 percent above the national per capita average. Because of the large number of students attending community colleges instead of universities during their first two years of postsecondary education, undergraduate enrollment per 1,000 residents at the universities was 16 percent below average. In contrast, the number of graduate students per 1,000 residents was nearly equal to the U.S. average. Overall, per capita enrollment at the universities was 13 percent less than the national average; the FTE figure was 12 percent below average. While the number of higher education students per capita is quite high by national standards, the number of Arizona high school students going directly on to postsecondary education is quite low. The NCES estimates the percentage of high-school graduates in a state who attend a degree-granting institution of higher education the following fall. In 2004, Arizona’s proportion was estimated to be less than 48 percent, well below the national average of 56 percent. Arizona ranked 44th among the 51 states and eighth among the 13 comparison states. A higher-than-average proportion of those Arizonans attending college went to a school in state. Thus, the proportion of high school graduates going directly on to an in-state institution was not as far below the national norm. Despite the higher-than-average enrollment per capita, the number of degrees granted in Arizona in 2006 at public institutions was 3 percent less than the national per capita average. Arizona’s per capita figure was 2 percent below the national average for associate’s degrees, 5 percent below average for bachelor’s degrees, 1 percent higher than average for master’s degrees, and 5 percent below average for other postbaccalaureate degrees.

50
The NCES data on the number of degrees by field of study combines degrees from private universities with those of public schools. Since the on-line program of the University of Phoenix is included, the number of degrees granted to those physically present in Arizona is overstated. Despite this, the per capita number of degrees granted in Arizona in 2006 was below average in the humanities, social sciences, and natural sciences. In contrast, the number of degrees per capita was very high in business and high in education. The number of bachelor’s degrees in engineering and computer science also was above average. The number of FTE students per FTE staff at public institutions of higher education in Arizona was close to the national average, but the number of FTE students per FTE faculty was above average, particularly at the universities. While the average salary of full-time instructional faculty was above the national average, this in large part was due to the relatively high experience of the faculty in Arizona. The average salaries of full professors and associate professors at public universities in Arizona were slightly below average in 2007, while the average salary of assistant professors was slightly above average. The NCES data show that total public revenue per FTE student in Arizona was 28 percent less than the national average of public institutions of higher education in 2005. While federal funding was average, other sources were considerably below average. State appropriations were 20 percent below the national norm. Average tuition and fees at public institutions in Arizona in 2007 was considerably less than the national average for public institutions, by 18 percent for universities and by 28 percent for community colleges. “Measuring Up 2008” “Measuring Up 2008” (www.highereducation.org) also is known as the “National Report Card on Higher Education.” It grades states in five categories. The first category, Preparation for College, was discussed in the previous subsection. Arizona compares more favorably on the categories specific to higher education than on the Preparation for College category. Arizona is tied for first with Iowa in the participation category, and ranks above the median state in the completion and benefits categories. Like 48 other states, Arizona received a failing grade in affordability. The benefits and affordability categories are not germane to this analysis. Three indicators make up the Participation category. Arizona compares poorly — 48th among the 51 states and 12th among the 13 comparison states — on the percentage of high school freshmen enrolling in college four years later. This is a constructed measure with conceptual difficulties. However, these figures are in line with those from the NCES that show a much below-average share of high school graduates attending a higher-education institution the following fall. In contrast to the low participation of Arizona’s high school graduates, Arizona ranks eighth, and highest in the comparison group, on the percentage of those 18-to-24 years old who are enrolled in college. The net migration to Arizona of college-age individuals accounts for the inconsistency between these two indicators. Arizona ranks first in the nation on the third indicator in the Participation category, the percentage of adults 25-to-49 years old taking a post-

51
secondary course. The high participation both of those 18-to-24 and 25-to-49 years old is in line with the NCES data. The Completion category consists of five measures. Overall, Arizona ranks 17th nationally and fourth in the comparison group. Arizona is in the middle of the states (21st nationally and sixth in the comparison group) on the percentage of community college students returning for a second year. The state ranks lower (35th nationally and seventh in the comparison group) on the percentage of first-year students at four-year universities returning for a second year. On the percentage of students earning a bachelor’s degree within six years, Arizona again ranks in the middle at 21st nationally and fifth in the comparison group. While Arizona ranks near the top (third nationally and first in the comparison group) on the number of certificates, diplomas, and degrees awarded per 1,000 adults without a degree, the state compares poorly at 43rd nationally and 10th in the comparison group on the number awarded per 100 undergraduate students.
Educational Attainment To provide more insight into the educational attainment of Arizonans who received their K-12 education within Arizona relative to those who moved to Arizona after their high school years, data from the Public Use Microdata Sample (PUMS) of the 2000 census were examined. The sample size of the PUMS from the American Community Survey is not adequate to perform the same analysis using more recent data. Based on Place of Birth, By Age It is not possible from the census data to definitively determine if an individual was educated in Arizona. As a proxy, the educational attainment of Arizona residents in 2000 who were born in Arizona was compared to those Arizona residents born in other U.S. states and to those Arizona residents born in other countries. The vast majority of Arizona residents in 2000 who were born in Arizona likely attended elementary and secondary schools in Arizona, regardless of their age. Of those Arizona residents in 2000 who were born elsewhere, the proportion who attended K-12 schools in Arizona likely is considerably smaller, with the percentages presumably varying by age group. Among older adults, a very large share probably migrated to Arizona after age 18. Among young adults, a higher percentage may have received at least some of their K-12 education in Arizona. In each age group, the educational attainment of those born in Arizona and living in the state in 2000 was considerably less than the attainment of those born in another state but living in Arizona in 2000. Of those born in Arizona, twice the percentage had not earned a high school diploma and half the proportion had earned a bachelor’s degree or more (see the top portion of Table 5). In contrast, the educational attainment of those born in Arizona was greater than that of the foreign-born population in each age group, though the foreign-born percentage with a bachelor’s degree was nearly as high among those 19-to-34 years old and was higher than Arizona natives among those 35 or older. The educational attainment of each group of Arizona residents was compared to the attainment of their counterparts in the other states. Among those living in the same state in which they were born, the educational attainment of Arizonans was considerably below the attainment in the median state. For example, among those 19-to-24 years old living in Arizona, the share with at
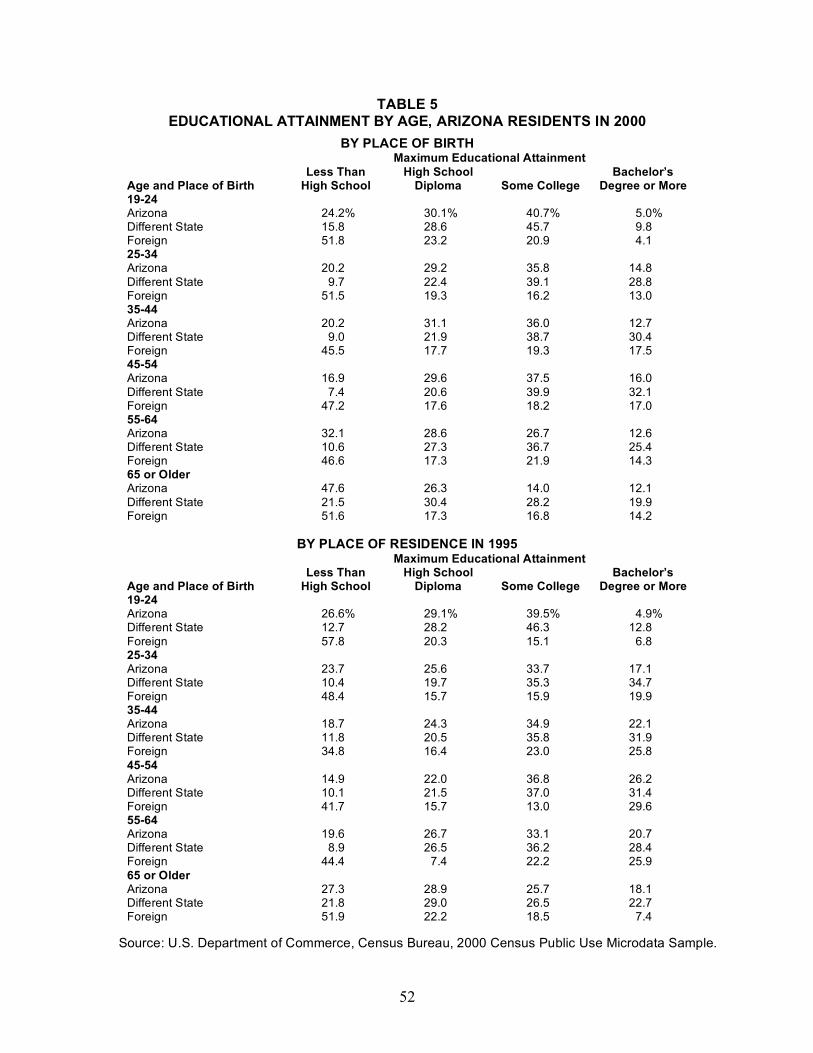
52
TABLE 5 EDUCATIONAL ATTAINMENT BY AGE, ARIZONA RESIDENTS IN 2000
BY PLACE OF BIRTH Maximum Educational Attainment Age and Place of Birth
Less Than High School
High School Diploma
Some College
Bachelor’s Degree or More
19-24 Arizona 24.2% 30.1% 40.7% 5.0% Different State 15.8 28.6 45.7 9.8 Foreign 51.8 23.2 20.9 4.1 25-34 Arizona 20.2 29.2 35.8 14.8 Different State 9.7 22.4 39.1 28.8 Foreign 51.5 19.3 16.2 13.0 35-44 Arizona 20.2 31.1 36.0 12.7 Different State 9.0 21.9 38.7 30.4 Foreign 45.5 17.7 19.3 17.5 45-54 Arizona 16.9 29.6 37.5 16.0 Different State 7.4 20.6 39.9 32.1 Foreign 47.2 17.6 18.2 17.0 55-64 Arizona 32.1 28.6 26.7 12.6 Different State 10.6 27.3 36.7 25.4 Foreign 46.6 17.3 21.9 14.3 65 or Older Arizona 47.6 26.3 14.0 12.1 Different State 21.5 30.4 28.2 19.9 Foreign 51.6 17.3 16.8 14.2
BY PLACE OF RESIDENCE IN 1995
Maximum Educational Attainment Age and Place of Birth
Less Than High School
High School Diploma
Some College
Bachelor’s Degree or More
19-24 Arizona 26.6% 29.1% 39.5% 4.9% Different State 12.7 28.2 46.3 12.8 Foreign 57.8 20.3 15.1 6.8 25-34 Arizona 23.7 25.6 33.7 17.1 Different State 10.4 19.7 35.3 34.7 Foreign 48.4 15.7 15.9 19.9 35-44 Arizona 18.7 24.3 34.9 22.1 Different State 11.8 20.5 35.8 31.9 Foreign 34.8 16.4 23.0 25.8 45-54 Arizona 14.9 22.0 36.8 26.2 Different State 10.1 21.5 37.0 31.4 Foreign 41.7 15.7 13.0 29.6 55-64 Arizona 19.6 26.7 33.1 20.7 Different State 8.9 26.5 36.2 28.4 Foreign 44.4 7.4 22.2 25.9 65 or Older Arizona 27.3 28.9 25.7 18.1 Different State 21.8 29.0 26.5 22.7 Foreign 51.9 22.2 18.5 7.4
Source: U.S. Department of Commerce, Census Bureau, 2000 Census Public Use Microdata Sample.

53
least a high school diploma ranked 45th in the nation and 11th in the comparison group; the share with at least a bachelor’s degree ranked 39th nationally and eighth in the comparison group. The ranks were similar in each of the other age groups, ranging from 37th to 49th nationally and from 10th to 13th in the comparison group, except that the attainment of Arizona natives 65 or older compared favorably on the percentage with a bachelor’s degree or more. In contrast to the low level of attainment among Arizona natives relative to natives in other states, the educational attainment of Arizonans who had been born in another state generally ranked at or a little below the median of the states of interstate migrants, ranking from 23rd to 34th nationally and from seventh to 10th in the comparison group. The exceptions were a less favorable rank among those 19-to-24 based on the percentage with at least a bachelor’s degree and a higher than median rank among those 65 or older and of those 55-to-64 based on the percentage with at least a high school diploma. That is, the educational attainment of those who migrated to Arizona was close to the national average of interstate migrants. Arizona’s differential in attainment between state natives and those migrating from other U.S. states was among the highest in the country. Based on high school graduation, by age group Arizona ranked from 42nd to 50th nationally and from 10th to 13th in the comparison group. Based on those with a bachelor’s degree or more, Arizona ranked from 28th to 42nd nationally and from seventh to 12th in the comparison group. The foreign-born population living in Arizona had among the nation’s lowest educational attainment of immigrants in all age groups, with the ranks generally 44th or lower nationally and 10th or lower in the comparison group. Despite the below-average attainment of Arizona natives, the difference in attainment between the natives and the foreign-born was above average. Based on Place of Residence in 1995, By Age A second proxy divided Arizona residents in 2000 into three categories based on their place of residence in 1995: Arizona, other U.S. state, or other nation. This analysis is particularly useful in comparing the educational attainment of those 19-to-24 years old in 2000 between those who likely received at least part of their K-12 education in Arizona (those living in Arizona in both 1995 and 2000) and those who probably did not attend K-12 schools in Arizona (those who moved to Arizona between 1995 and 2000). The educational attainment of those living in Arizona in both 1995 and 2000 was considerably less than the attainment of those living in another state in 1995 in the 19-to-24 age group. Only 5 percent of those residing in Arizona in both years had earned a bachelor’s degree (ranked 43rd nationally) compared to 13 percent of those living in another state in 1995 (ranked 25th). Of those living in Arizona in both years, the proportion who had not graduated from high school (nearly 27 percent) was twice as high as that of those living in another state. Arizona ranked 48th on the high school graduate percentage among natives and 33rd among migrants from other states. While the proportion without a high school diploma among those living in Arizona in both years was much less than the percentage of those who were living in another country in 1995, a higher

54
proportion of those coming to Arizona from another country within the prior five years had earned a bachelor’s degree. The educational attainment of recent interstate migrants to Arizona was higher than that of those living in Arizona in both 1995 and 2000 in all age groups (see the bottom portion of Table 5), at least in part because the latter classification includes Arizona natives. The largest differential was among those 25-to-34 years old. Other Analyses Similar analyses were included in the November 2005 report “Educational Attainment in Arizona Compared to All States,” available at http://wpcarey.asu.edu/seid/ccpr/P3reports.cfm. Table 6, which comes from that report, is limited to labor force participants between 25 and 64 years old. In each of nine categories defined by place of birth (same state, different state, foreign) and place of residence in 1995 (same state, different state, another country), Arizona’s educational attainment when measured by the percentage with at least a bachelor’s degree was considerably below the national average. The largest differentials from the national average were among immigrants, with migrants from other states closest to the national average. (Arizona’s
TABLE 6 EDUCATIONAL ATTAINMENT IN 2000
OF LABOR FORCE PARTICIPANTS AGED 25 TO 64
At Least High School Graduate
At Least Bachelor’s Degree
Ari-zona
U.S.
Differ-ence
Ari-zona
U.S.
Differ-ence
TOTAL 86.0% 87.7% -1.7 27.4% 28.5% -1.1 Born in same state 85.5 89.4 -3.9 18.2 23.4 -5.2 Born in another state 93.1 92.6 0.5 32.7 36.8 -4.1 Born in another country 57.4 69.1 -11.7 19.1 28.7 -9.6 Living in same state in 1995 85.8 87.7 -1.9 25.7 27.0 -1.3 Living in another state in 1995 91.2 91.9 -0.7 35.9 42.0 -6.1 Living in another country in 1995 60.3 73.3 -13.0 24.0 36.2 -12.2 Native 85.4 89.3 -3.9 17.8 23.0 -5.2 Native (in another state in 1995) 89.8 92.1 -2.3 25.9 35.6 -9.7 Native (in another country in 1995) 75.5 83.9 -8.4 18.9 28.0 -9.1 Earlier Migrant 92.6 92.2 0.4 31.1 35.2 -4.1 Recent Migrant 94.7 94.4 0.3 37.8 43.9 -6.1 Recent Migrant (in another country in 1995) 91.5 93.5 -2.0 34.8 41.4 -6.6 Earlier Immigrant 56.3 68.3 -12.0 16.8 26.1 -9.3 Earlier Immigrant (in another state in 1995) 68.8 78.3 -9.5 28.2 41.4 -13.2 Recent Immigrant 51.4 68.4 -17.0 21.5 36.3 -14.8 Source: U.S. Department of Commerce, Census Bureau, 2000 Census Public Use Microdata Sample.

55
overall attainment was not as far below average as in each of the nine categories because interstate migrants — who have among the highest educational attainment — made up a disproportionately large share of the Arizona workforce.) Measured by the percentage with at least a high school diploma or GED, the educational attainment of Arizona natives also was below the national average for natives living in the same state in 2000. Immigrants living in Arizona also had attainments far below their national counterparts. In contrast, the percentage with a high school diploma was slightly above average among Arizona residents who had been born in another state. Educational attainment also varied widely by race/ethnicity. However, crosstabulating three racial/ethnic categories by the nine categories defined by place of birth/place of residence in 1995 indicated that Arizona’s educational attainment was less than that of the national average in nearly all of the 27 categories. For example, though the educational attainment of non-Hispanic white interstate migrants was comparatively high relative to other categories, the attainment of these migrants to Arizona was considerably less than the average of non-Hispanic white interstate migrants nationally. The low educational attainment of those educated in Arizona is a negative factor in economic development, particularly for companies operating in the knowledge economy. Thus, the high percentage of native Arizonans with limited educational attainment likely has hampered the attraction of high-skill jobs to Arizona — job quality in Arizona is somewhat below the national average. Without these high-skill jobs, the state attracts disproportionately lower numbers of skilled domestic migrants. Comparison of high school completion rates. Based on the 2000 PUMS, among those 19-to-24 years old, the percentage of Arizona residents in 2000 who were born in Arizona who had graduated from high school was 76 percent. Of those Arizona residents living in Arizona in 1995, about 73 percent had graduated from high school. These percentages are higher than the 61-to-65 percent high school graduation rates reported for Arizona by the NCES during the mid-to-late 1990s. Part of the reason for the higher percentages from the Census is that some individuals likely received a high school diploma or GED more than four years after entering ninth grade but by the time they were 24 years old. The other likely explanation of the difference is that the graduation rate is underestimated by the NCES — the shortcomings of the graduation rate calculation were addressed earlier in this paper. Survey error in the PUMS and the inability to definitely know from the PUMS which individuals attended school in Arizona also are possible explanations.