Embed Size (px)
Citation preview

1
0123456789
10
Education Budget as % of GDPAsia & Sth.Pacific
IndonesiaVietnamCambodiaChinapakistanPhilippinesNepalBruneiJapanSingaporeIndiaThailandHong KongKoreaAustraliaMalaysia
Source
0123456789
10
Education Budget as % of GDPMiddle East & Nth.Africa
NigeriaU.A.E.QatarLebanonLibyaOmanTurkeyBahrainSyriaEgyptJordanKuwaitSudanSaudi ArabiaYemenSth.Africa
Source
2
0
1
2
3
4
5
6
7
8
9
10
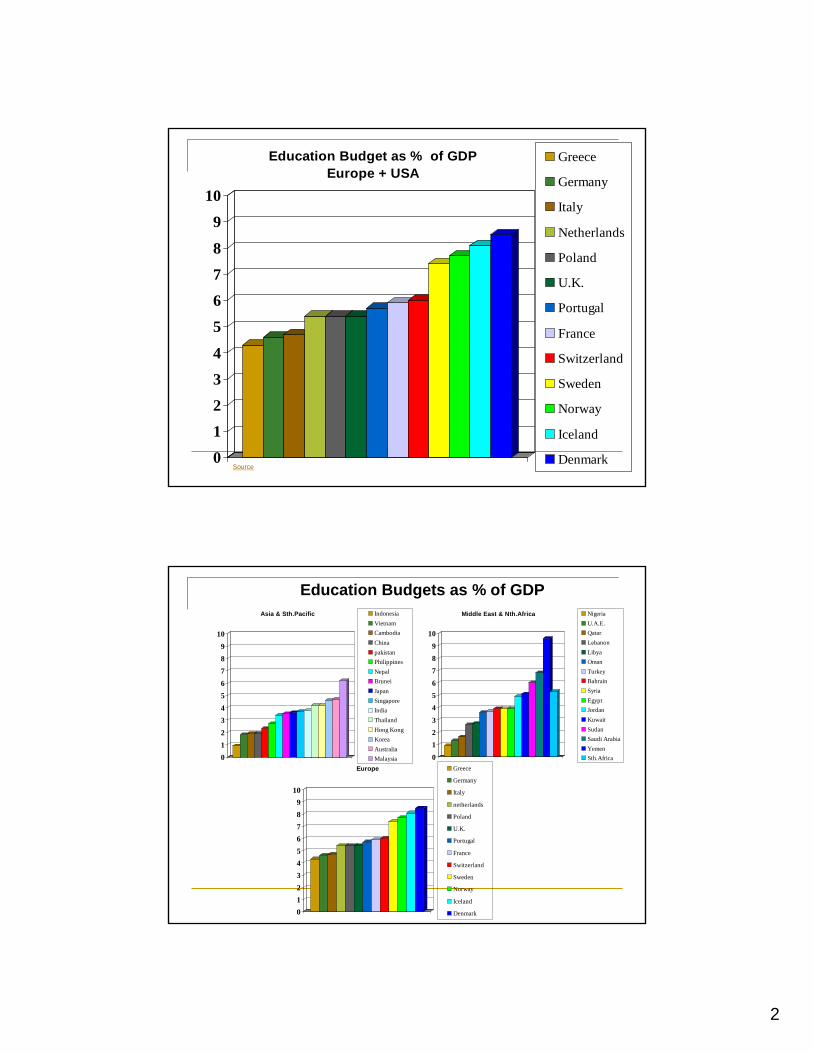
Education Budget as % of GDPEurope + USA
Greece
Germany
Italy
Netherlands
Poland
U.K.
Portugal
France
Switzerland
Sweden
Norway
Iceland
DenmarkSource
Education Budgets as % of GDP
0123456789
10
Asia & Sth.Pacific IndonesiaVietnamCambodiaChinapakistanPhilippinesNepalBruneiJapanSingaporeIndiaThailandHong KongKoreaAustraliaMalaysia 0
123
456789
10
Middle East & Nth.Africa NigeriaU.A.E.QatarLebanonLibyaOmanTurkeyBahrainSyriaEgyptJordanKuwaitSudanSaudi ArabiaYemenSth.Africa
0123456789
10
Europe Greece
Germany
Italy
netherlands
Poland
U.K.
Portugal
France
Switzerland
Sweden
Norway
Iceland
Denmark

3
0
100
200
300
400
500
600
700
800
900
Number of Computers(per thousand people)Asia & South Pacific
PakistanBangladeshBurmaCambodiaLaosNepalIndiaSri LankaVietnamIndonesiaBruneiChinaPhilippinesThailandMalaysiaSouth KoreaJapanHong KongSingaporeAustraliaSource
0
100
200
300
400
500
600
700
800
900
Number of Computers(per thousand people)
Middle East and North Africa
LibyaYemenNigeriaSudanJordanTurkeyOmanSyriaEgyptMoroccoSaudi ArabiaKuwaitU.A.E.QatarBahrainLebanonIranSource

4
0
100
200
300
400
500
600
700
800
900
Number of Computers(per thousand people)
Europe & USASwitzerlandSwedenNetherlandsDenmarkU.K.FranceNorwayGermanyIcelandFinlandItalySpainGreeceUSAsource
0
100
200
300
400
500
600
700
800
900
Asian and Sth Pacific PakistanBangladeshBurmaCambodiaLaosNepalIndiaSri LankaVietnamIndonesiaBruneiChinaPhilippinesThailandMalaysiaSouth KoreaJapanHong KongSingaporeAustralia 0
100
200
300
400
500
600
700
800
900
Middle East & Nth. Africa LibyaYemenNigeriaSudanJordanTurkeyOmanSyriaEgyptMoroccoSaudi ArabiaKuwaitU.A.E.QatarBahrainLebanonIran
0
100
200
300
400
500
600
700
800
900
Europe & USA Switzerland
Sweden
Netherlands
Denmark
U.K.
France
Norway
Germany
Iceland
Finland
Italy
Spain
Greece
USA
Number of Computers (Per Thousand People)

5
0
50
100
150
200
Total Number of Computers (in million)Asian and Sth Pacific Pakistan
BangladeshBurmaCambodiaLaosNepalIndiaSri LankaVietnamIndonesiaBruneiChinaPhilippinesThailandMalaysiaSouth KoreaJapanHong KongSingaporeAustraliaSource
Source0
50
100
150
200
Total Number of Computers (in millions)Middle East & Nth. Africa
LibyaYemenNigeriaSudanJordanTurkeyOmanSyriaEgyptMoroccoSaudi ArabiaKuwaitU.A.E.QatarBahrainLebanonIran
6
0
50
100
150
200
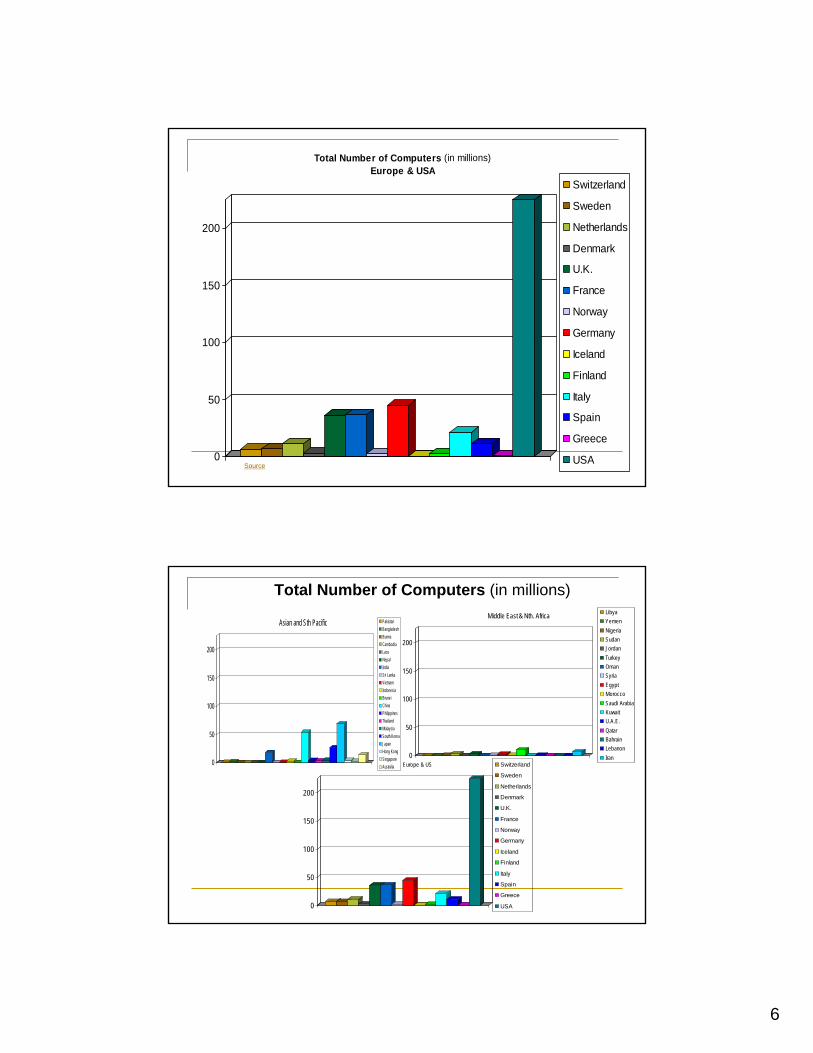
Total Number of Computers (in millions)Europe & USA
Switzerland
Sweden
Netherlands
Denmark
U.K.
France
Norway
Germany
Iceland
Finland
Italy
Spain
Greece
USASource
Total Number of Computers (in millions)
0
50
100
150
200
Europe & US Switzerland
Sweden
Netherlands
Denmark
U.K.
France
Norway
Germany
Iceland
Finland
Italy
Spain
Greece
USA
0
50
100
150
200
Asian and Sth Pacific PakistanBangladeshBurmaCambodiaLaosNepalIndiaSri LankaVietnamIndonesiaBruneiChinaPhilippinesThailandMalaysiaSouth KoreaJapanHong KongSingaporeAustralia
0
50
100
150
200
Middle East & Nth. Africa LibyaYemenNigeriaSudanJordanTurkeyOmanSyriaEgyptMoroccoSaudi ArabiaKuwaitU.A.E.QatarBahrainLebanonIran
7
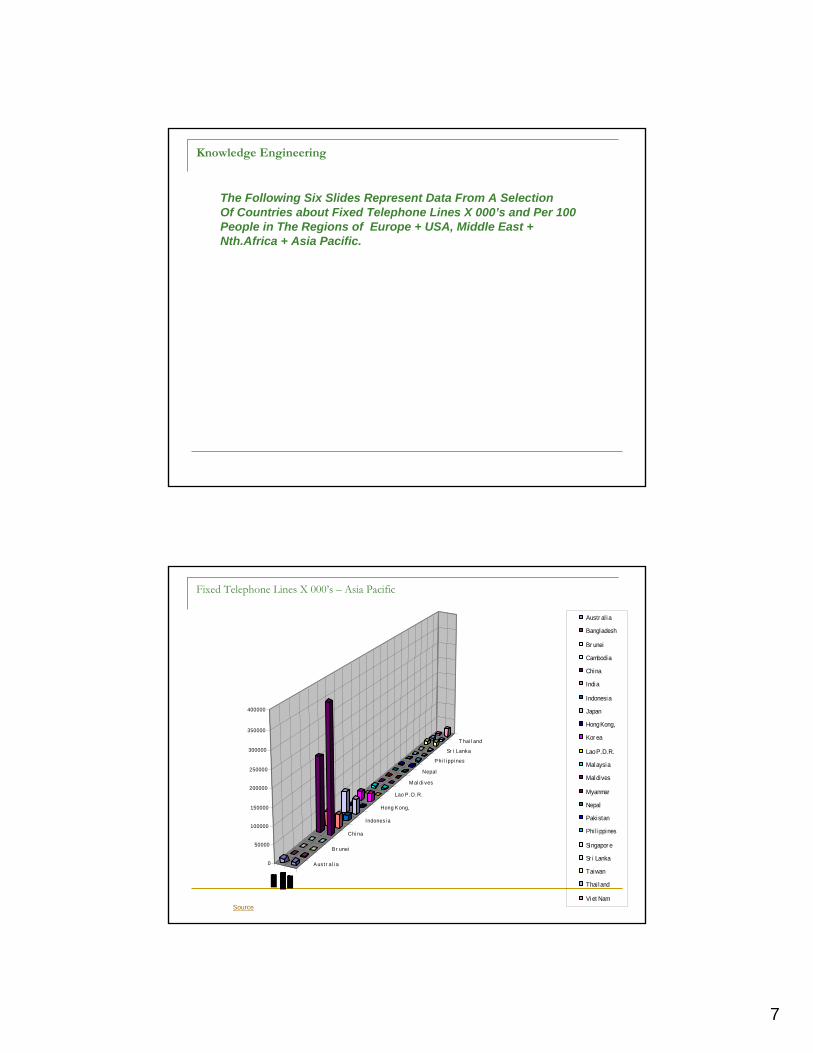
Knowledge Engineering
The Following Six Slides Represent Data From A SelectionOf Countries about Fixed Telephone Lines X 000’s and Per 100 People in The Regions of Europe + USA, Middle East + Nth.Africa + Asia Pacific.
Fixed Telephone Lines X 000’s – Asia Pacific
Aust r al i a
B r unei
Chi na
Indonesi a
Hong Kong,
Lao P .D.R.
M al di ves
Nepal
Phi l i ppi nes
Sr i Lanka
T hai l and
0
50000
100000
150000
200000
250000
300000
350000
400000
Austr al ia
Bangladesh
Br unei
Cambodia
China
India
Indonesia
Japan
Hong Kong,
Kor ea
Lao P.D.R.
Malaysia
Maldives
Myanmar
Nepal
Pakistan
Phi l ippines
Singapor e
Sr i Lanka
Taiwan
Thai land
Viet NamSource

8
Fixed Telephone Lines X 000’s – Middle East + Nth.Africa
2002
(000
s)
2007
Bahrain
Iran (I.R.)
Kuwait
Lebanon
Nigeria
Qatar
Sudan
Turkey
Yemen
0
5000
10000
15000
20000
25000
Bahrain
Egypt
Iran (I.R.)
Jordan
Kuwait
Libya
Lebanon
Morocco
Nigeria
Oman
Qatar
Saudi Arabia
Sudan
Syria
Turkey
UAE
YemenSource
Fixed telephone Lines X 000’s – Europe + USA
2002 2007
Denmark
France
Greece
Italy
Norway
Portugal
Sweden
U K
0
10
20
30
40
50
60
70
80
Telephone Lines Per 100 Persons - Europe - USA Denmark
Finland
France
Germany
Greece
Iceland
Italy
Netherlands
Norway
Poland
Portugal
Spain
Sweden
Switzerland
Source

9
Fixed Telephone Lines X 000’s
Denmar k
Ger many
I tal y
Pol and
Sweden
USA
0
20000
40000
60000
80000
100000
120000
140000
160000
180000
200000
Denmar k
Fi nl and
Fr ance
Ger many
Gr eece
Icel and
I tal y
Nether l ands
Nor way
Pol and
Por tugal
Spai n
Sweden
Swi tzer l and
U K
USA
Bahr ai n
Jor dan
Lebanon
Oman
Sudan
UAE
0
5000
10000
15000
20000
25000
Bahr ai n
Egypt
I r an (I .R. )
Jor dan
Kuwai t
Li bya
Lebanon
M or occo
Ni ger i a
Oman
Qatar
Saudi A r abi a
Sudan
Syr i a
T ur key
UAE
Yemen
Aust r alia
Chin a
Hon g Kon g,
M aldives
Philippin es
Thailan d
0
5 0 0 0 0
10 0 0 0 0
15 0 0 0 0
2 0 0 0 0 0
2 5 0 0 0 0
3 0 0 0 0 0
3 5 0 0 0 0
4 0 0 0 0 0
A ustr al i aB angl adeshB r uneiCambodi aChi naIndi aIndonesi aJapanHong K ong, K or ea Lao P.D.R.M al aysi aM al di vesM yanmarNepalP ak i s tanP hi l i ppi nesSi ngapor eSr i LankaT ai wan
Fixed Telephone Lines Per 100 People – Europe + USA
2002 2007
DenmarkFinland
FranceGermany
GreeceIceland
ItalyNetherlands
NorwayPoland
PortugalSpain
SwedenSwitzerland
U KUSA
0
10
20
30
40
50
60
70
80
DenmarkFinlandFranceGermanyGreeceIcelandItalyNetherlandsNorwayPolandPortugalSpainSwedenSwitzerlandU KUSA
Source

10
Fixed Telephone Lines Per 100 People – Asia Pacific
2002
2007
Australia
Brunei
China
Indonesia
Hong Kong,
Lao P.D.R.
Maldives
Nepal
PhilippinesSri Lanka
Thailand
0
10
20
30
40
50
60
70
Australia
Bangladesh
Brunei
Cambodia
China
India
Indonesia
Japan
Hong Kong,
Korea
Lao P.D.R.
Malaysia
Maldives
Myanmar
Nepal
Pakistan
Philippines
Singapore
Sri Lanka
Taiwan
Thailand
Viet Nam
source
Fixed Telephone Lines Per 100 People – Middle East + Nth.Africa
2002 2007
Bahrain
Egypt
Iran (I.R.)
JordanKuw ait
LibyaLebanon
MoroccoNigeria
OmanQatar
Saudi ArabiaSudan
SyriaTurkey
UAEYemen
0
5
10
15
20
25
30
35
Bahrain
Egypt
Iran (I.R.)
Jordan
Kuw ait
Libya
Lebanon
Morocco
Nigeria
Oman
Qatar
Saudi Arabia
Sudan
Syria
Turkey
UAE
Yemen
source

11
Fixed Telephone Lines Per 100 people
Austr al ia
Cambodia
Indonesia
Kor ea
Maldives
Pakistan
Sr i LankaViet Nam
0
10
20
30
40
50
60
70
Austr al i a
Bangladesh
Br unei
Cambodia
China
India
Indonesia
Japan
Hong Kong,
Kor ea
Lao P.D.R.
Malaysia
Maldives
Myanmar
Nepal
Pakistan
Phi l ippines
Singapor e
Sr i Lanka
Taiwan
Thai land
Viet Nam
2002 200 7
D en m arkF in la nd
F ranc eGe rm an y
Gre eceIc e land
Ita lyN ether lands
N o rw a yP oland
P ortuga lSpain
S w ede nSw i tze rland
U KU SA
0
10
20
3 0
4 0
50
60
70
80
D en m arkF in lan dF ranc eG erm a nyG reec eIc elandIta lyN et her lan dsN orw ayPo lan dPo rtugalSp ainSw e denSw i tze rlandU KU S A
Bahr ai nEgypt
I r an (I .R. )Jor dan
Kuwai tLi bya
LebanonM or occo
Ni ger i aOman
QatarSaudi Ar abi a
SudanSyr i a
T ur keyUAE
Y emen
0
5
10
15
20
25
30
35
Bahr ain
Egypt
Ir an (I.R.)
Jor dan
Kuwai t
Libya
Lebanon
Mor occo
Niger ia
Oman
Qatar
Saudi Ar abia
Sudan
Syr ia
Tur key
UAE
Yemen
Knowledge Engineering
The Following Six Slides Represent Data From A Selection of Countries,About Mobile Telephone Line Subscribers In The Regions Of Europe and USA, Middle East + Nth.Africa and Asia Pacific.

12
0
100,000
200,000
300,000
400,000
500,000
'02 '07
Mobile Cellular Subscribers X 000’s – Europe - USA
DenmarkFinlandFranceGermanyGreeceIcelandIrelandItalyNetherlandsNorwayPolandPortugalSpainSwedenSwitzerlandUKUSA
Source:
0
100,000
200,000
300,000
400,000
500,000
'02 '07
Mobile Cellular Subscribers X 000’s – Asia Pacific
AustraliaBangladeshBruneiCambodiaChinaHong Kong, IndiaIndonesiaJapanKorea Lao P.D.R.MalaysiaMaldivesMyanmarNepalPakistanPhilippinesSingaporeSri LankaTaiwanThailand
Source

13
0
100,000
200,000
300,000
400,000
500,000
'02 '07
Mobile Cellular Subscribers X 000’s – Middle East & Nth. Africa
BahrainEgyptIran (I.R.)JordanLebanonLibyaMoroccoNigeriaOmanQatarSaudi ArabiaSudanSyriaTurkeyUAEYemen
Source
Mobile Cellular Subscribers X 000’s
0
100,000
200,000
300,000
400,000
500,000
'02 '07
Mobile Cellular Subscribers X 000’s – Europe - USA
DenmarkFinlandFranceGermanyGreeceIcelandIrelandItalyNetherlandsNorwayPolandPortugalSpainSwedenSwitzerlandUKUSA
0
100,000
200,000
300,000
400,000
500,000
'02 '07
Mobile Cellular Subscribers X 000’s – Asia Pacific
AustraliaBangladeshBruneiCambodiaChinaHong Kong, IndiaIndonesiaJapanKorea Lao P.D.R.MalaysiaMaldivesMyanmarNepalPakistanPhilippinesSingaporeSri LankaTaiwanThailand
0
100,000
200,000
300,000
400,000
500,000
'02 '07
Mobile Cellular Subscribers X 000’s – Middle East & Nth. Africa
BahrainEgyptIran (I.R.)JordanLebanonLibyaMoroccoNigeriaOmanQatarSaudi ArabiaSudanSyriaTurkeyUAEYemen

14
020406080
100120140160180
'07
Mobile Cellular Subscribers Per 100 people Middle East & Nt.Africa
BahrainEgyptIran (I.R.)JordanLebanonLibyaMoroccoNigeriaOmanQatarSaudi ArabiaSudanSyriaTurkeyUAEYemen
Source
020406080
100120140160180
'07
Mobile Cellular Subscribers Per 100 People Asia + Sth.Pacific
AustraliaBangladeshBruneiCambodiaChinaHong Kong, IndiaIndonesiaJapanKorea Lao P.D.R.MalaysiaMaldivesMyanmarNepalPakistanPhilippinesSingaporeSri LankaTaiwanThailand
Source:

15
020406080
100120140160180
'07
Mobile Cellular Subscribers Per 100 People Europe + U.S.A
DenmarkFinlandFranceGermanyGreeceIcelandIrelandItalyNetherlandsNorwayPolandPortugalSpainSwedenSwitzerlandUKUSA
Source:
Mobile Cellular Subscribers Per 100 People
020406080
100120140160180
'07
Mobile Cellular Subscribers Per 100 people Middle East & Nt.Africa
BahrainEgyptIran (I.R.)JordanLebanonLibyaMoroccoNigeriaOmanQatarSaudi ArabiaSudanSyriaTurkeyUAEYemen
020406080
100120140160180
'07
Mobile Cellular Subscribers Per 100 People Asia + Sth.Pacific
AustraliaBangladeshBruneiCambodiaChinaHong Kong, IndiaIndonesiaJapanKorea Lao P.D.R.MalaysiaMaldivesMyanmarNepalPakistanPhilippinesSingaporeSri LankaTaiwanThailand
020406080
100120140160180
'07
Mobile Cellular Subscribers Per 100 People Europe + U.S.A
DenmarkFinlandFranceGermanyGreeceIcelandIrelandItalyNetherlandsNorwayPolandPortugalSpainSwedenSwitzerlandUKUSA
16
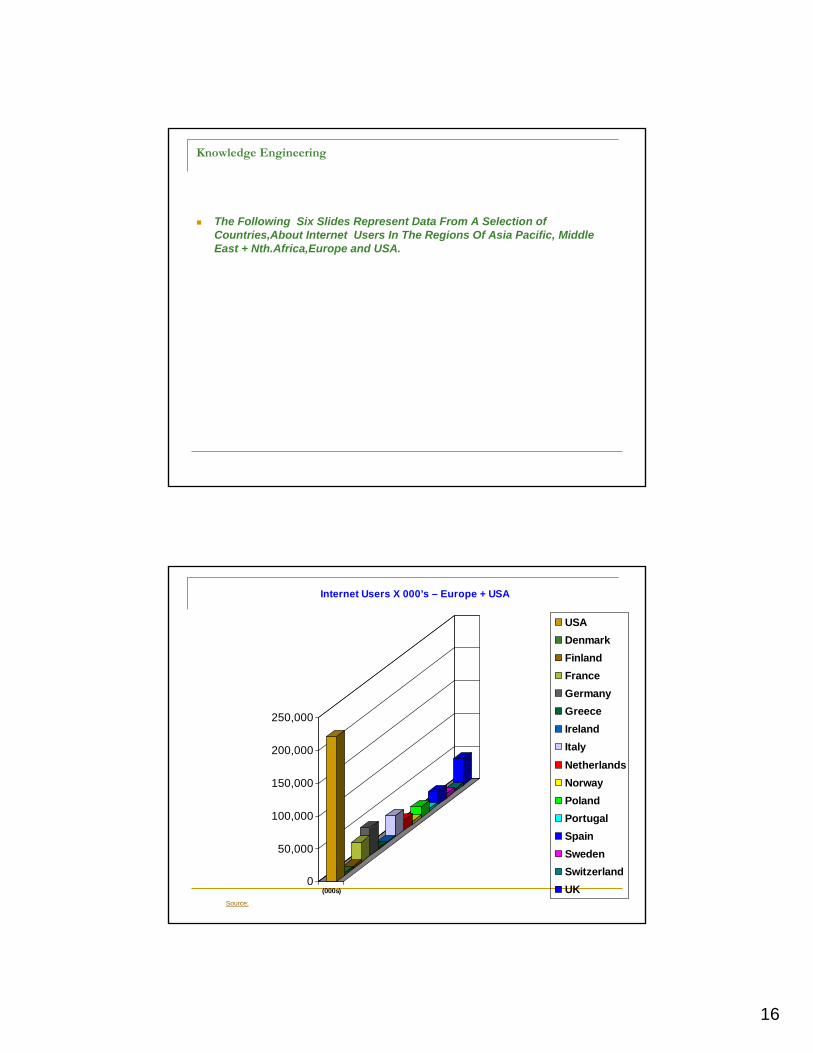
Knowledge Engineering
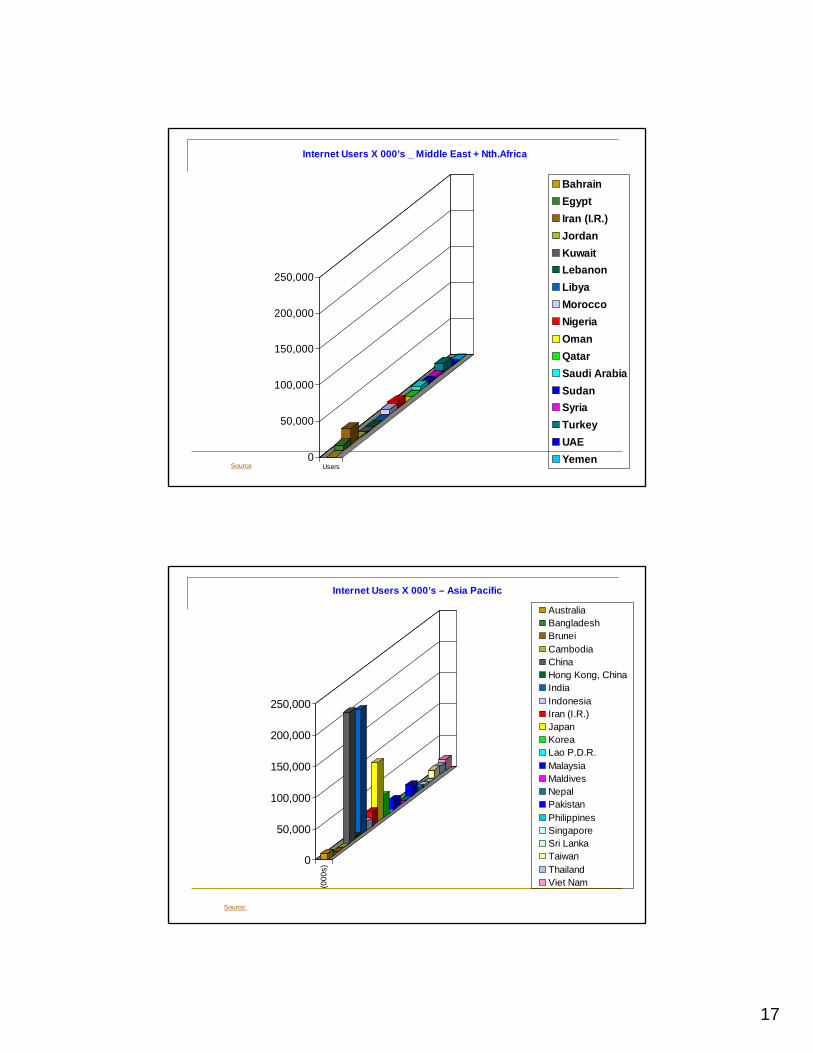
The Following Six Slides Represent Data From A Selection of Countries,About Internet Users In The Regions Of Asia Pacific, Middle East + Nth.Africa,Europe and USA.
0
50,000
100,000
150,000
200,000
250,000
(000s)
Internet Users X 000’s – Europe + USA
USADenmarkFinlandFranceGermanyGreeceIrelandItalyNetherlandsNorwayPolandPortugalSpainSwedenSwitzerlandUK
Source:
17
0
50,000
100,000
150,000
200,000
250,000
Users
Internet Users X 000’s _ Middle East + Nth.Africa
BahrainEgyptIran (I.R.)JordanKuwaitLebanonLibyaMoroccoNigeriaOmanQatarSaudi ArabiaSudanSyriaTurkeyUAEYemen
Source
0
50,000
100,000
150,000
200,000
250,000
(000
s)
Internet Users X 000’s – Asia Pacific
AustraliaBangladeshBrunei CambodiaChinaHong Kong, ChinaIndiaIndonesiaIran (I.R.)JapanKoreaLao P.D.R.MalaysiaMaldivesNepalPakistanPhilippinesSingaporeSri LankaTaiwanThailandViet Nam
Source:

18
0
50,000
100,000
150,000
200,000
250,000
(000s)
Internet Users X 000’s – Europe + USA
USADenmarkFinlandFranceGermanyGreeceIrelandItalyNetherlandsNorwayPolandPortugalSpainSwedenSwitzerlandUK 0
50,000
100,000
150,000
200,000
250,000
Users
Internet Users X 000’s _ Middle East + Nth.Africa
BahrainEgyptIran (I.R.)JordanKuwaitLebanonLibyaMoroccoNigeriaOmanQatarSaudi ArabiaSudanSyriaTurkeyUAEYemen
Internet Users X 000’s
0
50,000
100,000
150,000
200,000
250,000
(000
s)
Internet Users X 000’s – Asia Pacific
AustraliaBangladeshBrunei CambodiaChinaHong Kong, ChinaIndiaIndonesiaIran (I.R.)JapanKoreaLao P.D.R.MalaysiaMaldivesNepalPakistanPhilippinesSingaporeSri LankaTaiwanThailandViet Nam
Internet Users % Population – Europe + USA
100 's
USA
Finland
Germany
Ireland
NetherlandsPoland
SpainSw itzerland
0
10
20
30
40
50
60
70
80
90
100
USA
Denmark
Finland
France
Germany
Greece
Ireland
Italy
Netherlands
Norw ay
Poland
Portugal
Spain
Sw eden
Sw itzerland
UK
Source:

19
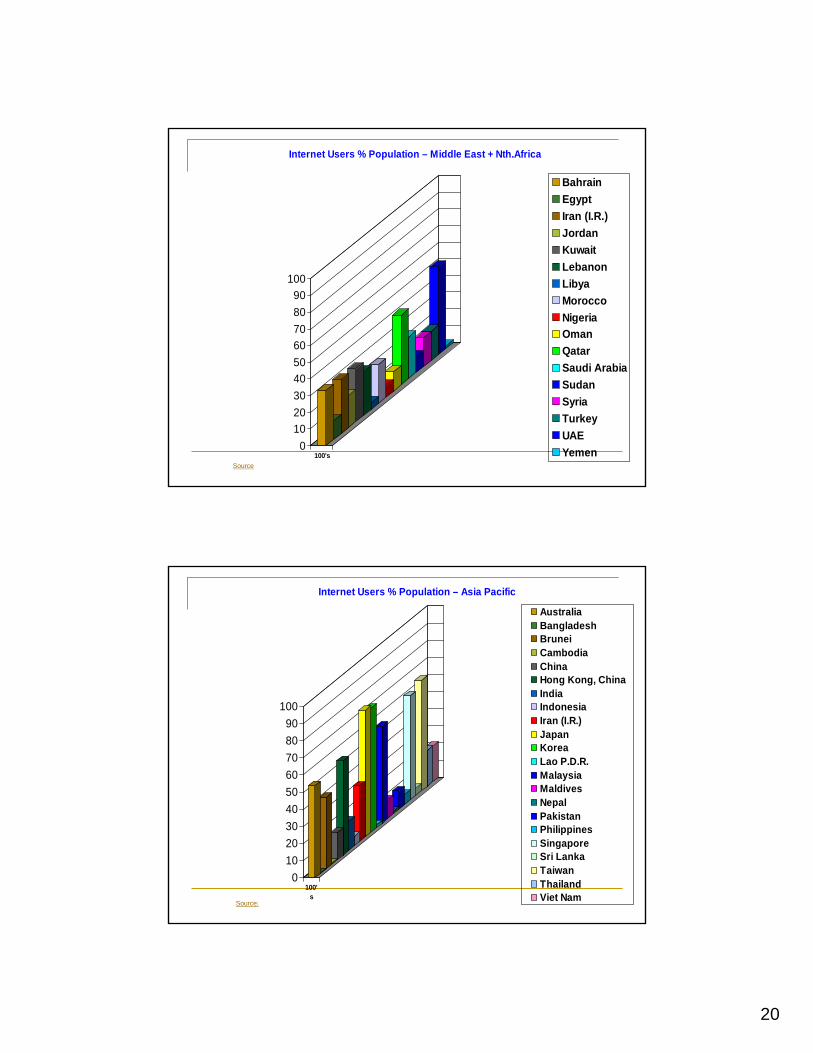
Internet Users % Population – Middle East + Nth.Africa
Use
rs p
er
Bahrain
Jordan
Libya
Oman
Sudan
UAE
0
10
20
30
40
50
60
Bahrain
Egypt
Iran (I.R.)
Jordan
Kuw ait
Lebanon
Libya
Morocco
Nigeria
Oman
Qatar
Saudi Arabia
Sudan
Syria
Turkey
UAE
Y
Source
0102030405060708090
100
100's
Internet Users % Population – Europe + USA
USADenmarkFinlandFranceGermanyGreeceIrelandItalyNetherlandsNorwayPolandPortugalSpainSwedenSwitzerlandUK
Source:
20
0102030405060708090
100
100's
Internet Users % Population – Middle East + Nth.Africa
BahrainEgyptIran (I.R.)JordanKuwaitLebanonLibyaMoroccoNigeriaOmanQatarSaudi ArabiaSudanSyriaTurkeyUAEYemen
Source
0102030405060708090
100
100's
Internet Users % Population – Asia Pacific
AustraliaBangladeshBrunei CambodiaChinaHong Kong, ChinaIndiaIndonesiaIran (I.R.)JapanKoreaLao P.D.R.MalaysiaMaldivesNepalPakistanPhilippinesSingaporeSri LankaTaiwanThailandViet Nam
Source:

21
Internet Users As a % of Population
0102030405060708090
100
100's
Internet Users % Population – Europe + USA
USADenmarkFinlandFranceGermanyGreeceIrelandItalyNetherlandsNorwayPolandPortugalSpainSwedenSwitzerlandUK
0102030405060708090
100
100's
Internet Users % Population – Middle East + Nth.Africa
BahrainEgyptIran (I.R.)JordanKuwaitLebanonLibyaMoroccoNigeriaOmanQatarSaudi ArabiaSudanSyriaTurkeyUAEYemen
0102030405060708090
100
100's
Internet Users % Population – Asia Pacific
AustraliaBangladeshBrunei CambodiaChinaHong Kong, ChinaIndiaIndonesiaIran (I.R.)JapanKoreaLao P.D.R.MalaysiaMaldivesNepalPakistanPhilippinesSingaporeSri LankaTaiwanThailandViet Nam
Knowledge Engineering
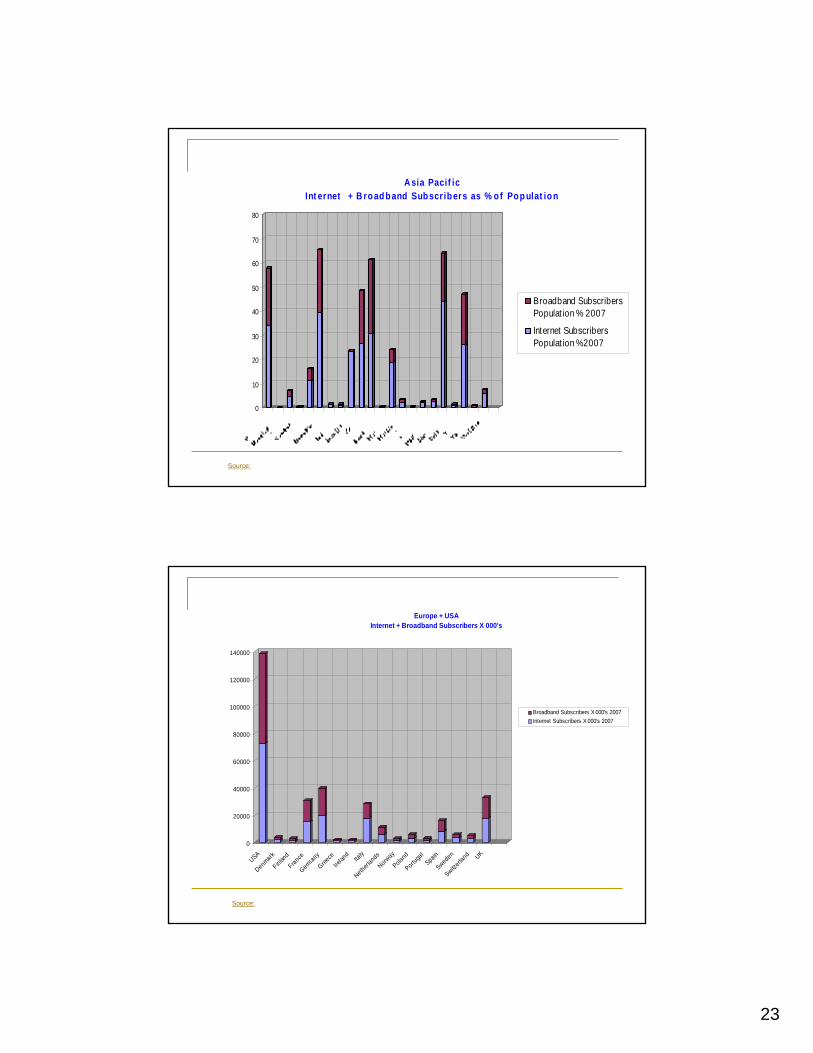
The Following Six Slides represent a Comparison of Internet and Broadband Subscribers in The Regions Of Asia Pacific, Middle East + Nth.Africa,Europe and USA

22
0
10
20
30
40
50
60
70
80
Per 100 100's 2007
Subscribers per 100's. 2007
Europe + USA
Internet and Broadband Subscribers as % of Population
source
0
10
20
30
40
50
60
70
80
Middle East + Nth.Africa Internet and Broadband Subscribers as % of Population
Per 100 100's 2007
Subscribers per 100 's2007
Source:
23
0
10
20
30
40
50
60
70
80
A sia Pacif ic Int ernet + B road band Subscr ibers as % o f Pop ulat ion
Broadband SubscribersPopulat ion % 2007
Internet SubscribersPopulat ion % 2007
Source:
0
20000
40000
60000
80000
100000
120000
140000
USA
Denmark
Finland
France
Germany
Greece
Irelan
dIta
ly
Netherlands
Norway
Poland
Portuga
lSpain
Sweden
Switzerla
nd UK
Europe + USA Internet + Broadband Subscribers X 000's
Broadband Subscribers X 000's 2007Internet Subscribers X 000's 2007
Source:

24
0
2000
4000
6000
8000
10000
12000
14000
16000
18000
Bahrai
n
Iran (
I.R.)
Kuwait
Libya
Nigeria
Qatar
Sudan
Turkey
Yemen
Middle East + Nth.Africa Internet + Broadband Subscribers X 000"s
BroadbandSubscribers X 000's2007
Internet Subscribers X000's 2007
Source:
0
50000
100000
150000
200000
250000
Austra
lia
Bangla
desh
Brunei
Cambodia
China
Hong Kong
India
Indon
esia
Iran (
I.R.)
Japa
nKore
a
Lao P
.D.R
.
Malays
ia
Maldive
sNepa
l
Pakist
an
Philipp
ines
Singap
ore
Sri Lan
ka
Taiwan
Thaila
nd
Viet N
am
Asia Pacific Internet and Broadband Subscribers X 000's
Broadband Subscribers X 000's 2007
Internet Subscribers X 000's 2007
Source:

25
0
10
20
30
40
50
60
70
80
USA
Denmark
FinlandFrance
Germany
Greece
Irelan
dIta
ly
Netherlands
Norway
Poland
Portuga
lSpain
Sweden
Switzerla
nd UK
Europe + USA Internet and Broadband Subscribers as % of Population
Per 100 100's 2007Subscribers per 100 's. 2007
0
10
20
30
40
50
60
70
80
Bahrain
Egypt
Iran (I.R.)
Jordan
Kuwa
it
Lebanon
Libya
Morocco
Nigeria
Oman
Qatar
Saudi Arabia
Sudan
Syria
Turkey
UAE
Yemen
Middle East + Nth.Africa Internet and Broadband Subscribers as % of Population
Per 100 100's 2007Subscribers per 100 's 2007
0
10
20
30
40
50
60
70
80
Austra
lia
Bangla
desh
Brunei
Cambodia
China
Hong Kong
India
Indon
esia
Iran (
I.R.)
Japa
nKore
a
Lao P
.D.R
.
Malays
ia
Maldive
sNepa
l
Pakist
an
Philipp
ines
Singap
ore
Sri Lan
ka
Taiwan
Thaila
nd
Viet N
am
Asia Pacific Internet and Broadband Subscribers as % of Population
Broadband Subscribers Population % 2007Internet Subscribers Population % 2007
Internet + Broadband Subscribers as % of Population
Internet + Broadband Subscribers X 000’s
0
20000
40000
60000
80000
100000
120000
140000
USA
DenmarkFinland
France
Germany
GreeceIre
landIta
ly
Ne therlands
NorwayPoland
Portuga l
Spain
Sweden
Switzer la
nd UK
Europe + USA Internet + Broadband Subscribers X 000's
Broadband Subscribers X 000's 2007Internet Subscribers X 000's 2007
0
0
2000
4000
6000
8000
10000
12000
14000
16000
18000
Bahrai
nEgy
pt
Iran (
I.R.)
Jorda
n
Kuwait
Leba
non
Libya
Morocc
o
Nigeria
OmanQata
r
Saudi
Arabia
Sudan
Syria
Turkey
UAE
Yemen
Middle East + Nth.Africa Internet + Broadband Subscribers X 000"s
Broadband Subscribers X 000's 2007Internet Subscribers X 000's 2007
0
50000
100000
150000
200000
250000
Australia
Bangladesh
Brun
ei
Cambo
dia
China
Hong Kon
g
India
Indone
sia
Iran (I.R.)
Japan
Korea
Lao P.D.R.
Mala
ysia
Mald
ives
Nepal
Pakis
tan
Philip
pines
Singap
ore
Sri Lanka
Taiwan
Thailan
d
Viet Nam
Asia Pacific Internet and Broadband Subscribers X 000's
Broadband Subscribers X 000's 2007Internet Subscribers X 000's 2007
26
0
5000
10000
15000
20000
25000
30000
35000
Bahr
ain
Egyp
tJo
rdan
Kuwa
itLe
bano
nLi
bya
Mor
occo
Nige
riaO
man
Qat
arSa
udi A
rabi
aSu
dan
Syria
Turk
ey
UAE
Yem
en
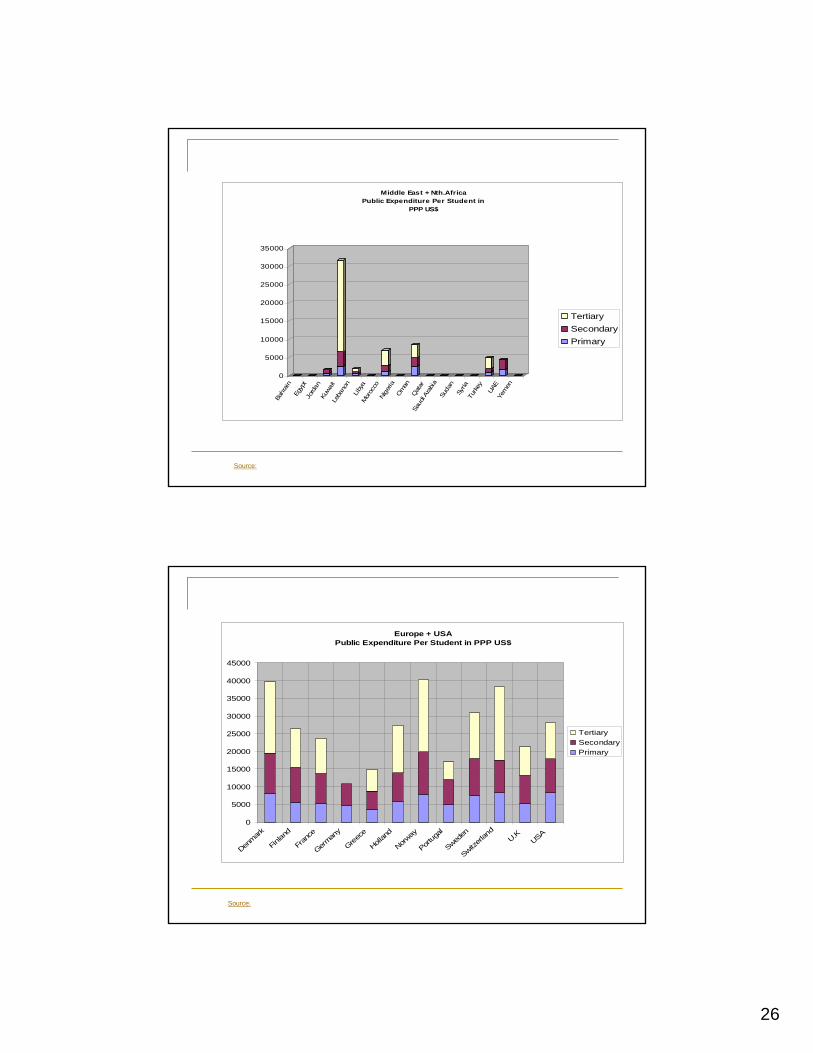
Middle East + Nth.AfricaPublic Expenditure Per Student in
PPP US$
TertiarySecondaryPrimary
Source:
Europe + USA Public Expenditure Per Student in PPP US$
0
5000
10000
15000
20000
25000
30000
35000
40000
45000
Denmark
Finlan
d
Fran
ce
German
y
Greec
e
Hollan
d
Norway
Portug
al
Sweden
Switzerl
and
U.KUSA
TertiarySecondaryPrimary
Source:

27
0
2000
4000
6000
8000
10000
12000
14000
16000
18000
Aust
ralia
Bang
lades
hBr
unei
Cam
bodia
Chin
aIn
done
siaLa
osM
alay
siaPh
ilippin
esSi
ngap
ore
Thail
and
Viet
nam
Asia + Sth.PacificPublic Expenditure Per Student in PPP US$
TertiarySecondaryPrimary
source
Europe + USA Public Expenditure on Education as a % of Government
Expenditure
010203040
Denmark
Finlan
d
France
German
y
Greece
Hollan
d
Norway
Portug
al
Sweden
Switzerl
and
U.KUSA
%
source
28
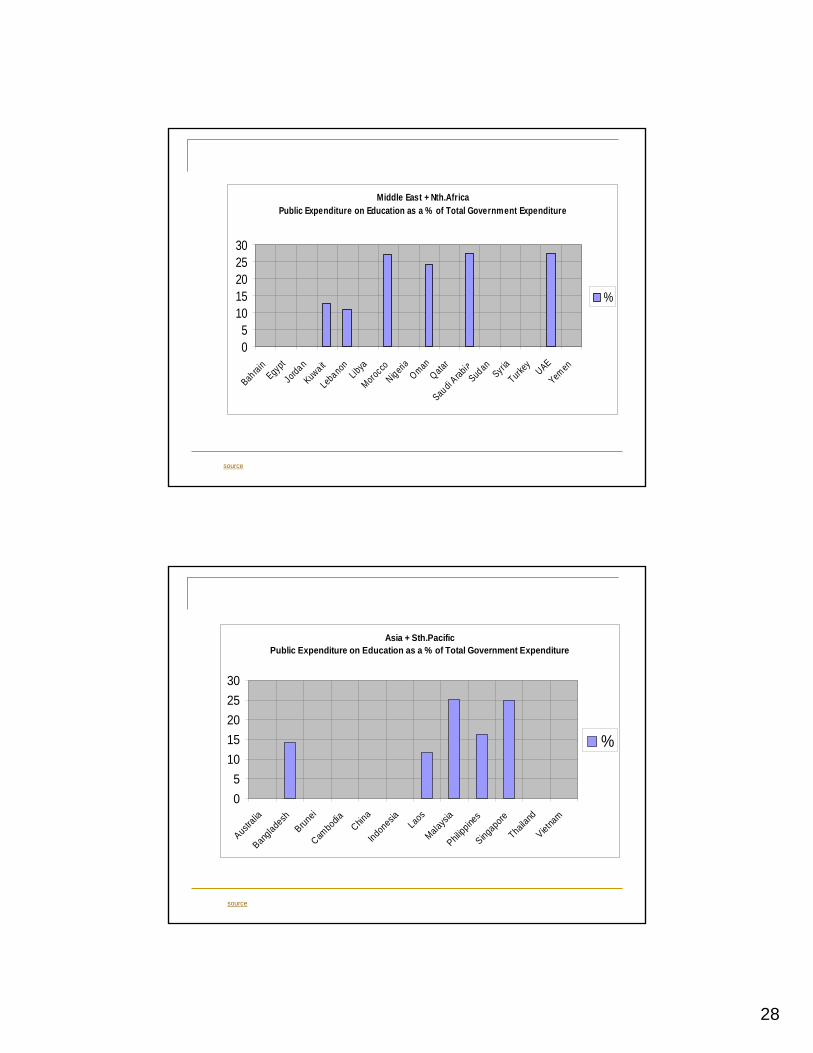
Middle East + Nth.Africa Public Expenditure on Education as a % of Total Government Expenditure
05
1015202530
BahrainEgypt
Jordan
Kuwa it
LebanonLibya
MoroccoNigeria
OmanQatar
Saudi Arabia
SudanSyria
Turkey
UAE
Yemen
%
source
Asia + Sth.Pacific Public Expenditure on Education as a % of Total Government Expenditure
05
1015202530
Australia
Bangladesh
Brunei
Cambod
iaChin
a
Indonesia Laos
Malaysia
Philippine
s
Singapore
Thailand
Vietna
m
%
source
29
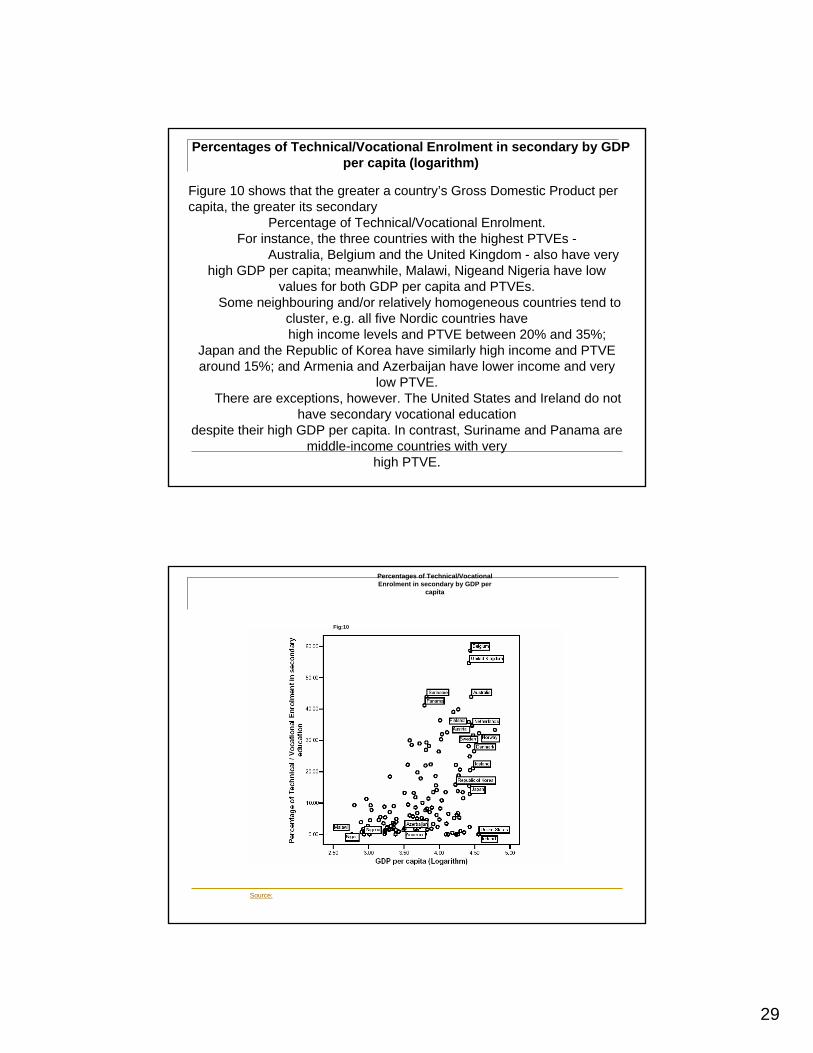
Figure 10 shows that the greater a country’s Gross Domestic Product per capita, the greater its secondary
Percentage of Technical/Vocational Enrolment. For instance, the three countries with the highest PTVEs -
Australia, Belgium and the United Kingdom - also have very high GDP per capita; meanwhile, Malawi, Nigeand Nigeria have low
values for both GDP per capita and PTVEs.Some neighbouring and/or relatively homogeneous countries tend to
cluster, e.g. all five Nordic countries havehigh income levels and PTVE between 20% and 35%;
Japan and the Republic of Korea have similarly high income and PTVE around 15%; and Armenia and Azerbaijan have lower income and very
low PTVE.There are exceptions, however. The United States and Ireland do not
have secondary vocational educationdespite their high GDP per capita. In contrast, Suriname and Panama are
middle-income countries with veryhigh PTVE.
Percentages of Technical/Vocational Enrolment in secondary by GDP per capita (logarithm)
Percentages of Technical/Vocational Enrolment in secondary by GDP per
capita
Fig:10
Source:
30
I.T. and World Development
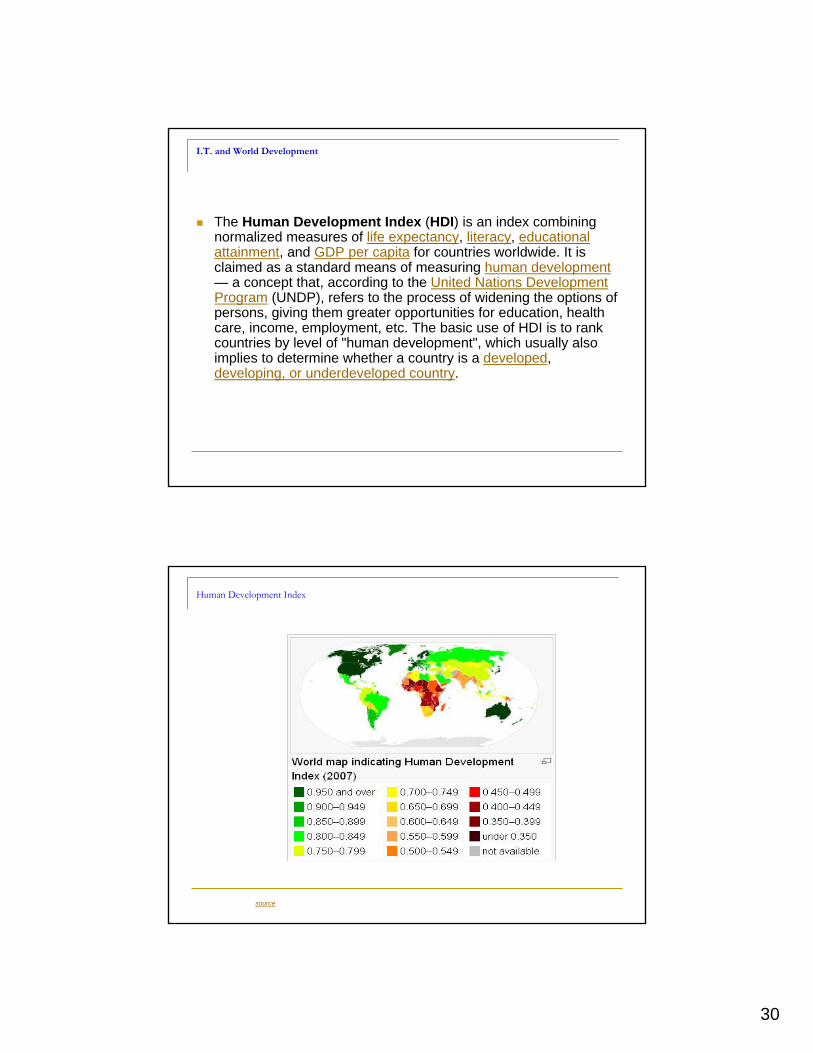
The Human Development Index (HDI) is an index combining normalized measures of life expectancy, literacy, educational attainment, and GDP per capita for countries worldwide. It is claimed as a standard means of measuring human development— a concept that, according to the United Nations Development Program (UNDP), refers to the process of widening the options of persons, giving them greater opportunities for education, healthcare, income, employment, etc. The basic use of HDI is to rank countries by level of "human development", which usually also implies to determine whether a country is a developed, developing, or underdeveloped country.
Human Development Index
source

31
World map indicating Human Development Index (2007
Source:
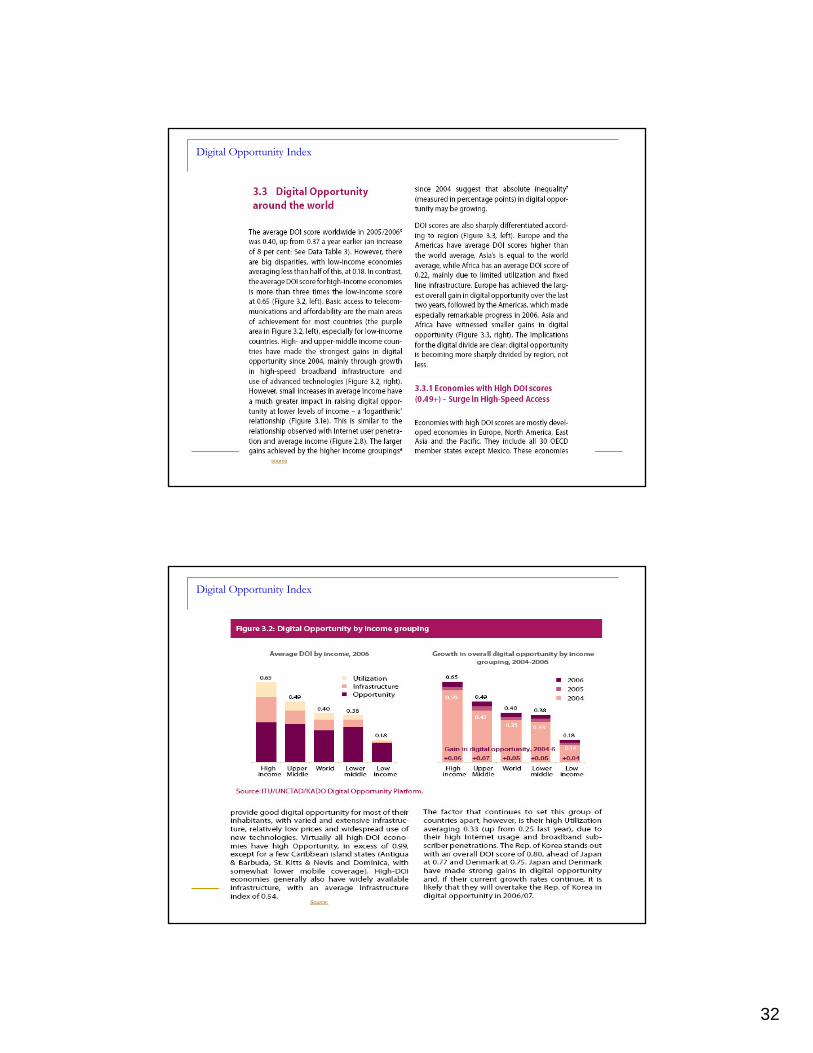
Digital Opportunity Index
Source:
32
Digital Opportunity Index
source
Digital Opportunity Index
Source:

33
Digital Opportunity Index
source
The Digital Divide is real and growing in many casesThe ability to move into the Digital Age will effect each country’s future growth opportunities and impact greatly it’s industries and citizens.Many countries are not well placed at this time and need a Digital Rescue package in order to catch up and compete.An effective national IT policy must be multi-sectored and target changes and give incentives
The Digital DivideThe Digital Divide

34
Digital Opportunity Index
Source:
The Knowledge Economy and Economic Performance
Economic development and knowledge are closely related (figure 4).In fact, the correlation between the accumulation of knowledge, as measured by the KEI, and levels of economic developmentis around 87 percent.Countries with higher KEI values tend to have higher levels of economic development,and vice versa.
This positive correlation does not establish a causal relationship between the KEI and economic development.
In fact, it is very plausible that high-income countries, because they are more affluent, are able to afford more investments in knowledge. The correlation, by itself, does not permit us to predict with any degree of certainly that building up certain forms of knowledge in a poor country will be sure to produce economic growth anytime soon.

35
Technology and Development
Technology and Development


![Speak Asia Online Survey on Union Railway Budget [Tech-Wonders.com]](https://img.dokumen.tips/doc/110x75/55a40f5a1a28ab3a3d8b47af/speak-asia-online-survey-on-union-railway-budget-tech-wonderscom.jpg)
