Embed Size (px)
Citation preview


Education AnalyticsA maturity model and success story

Host
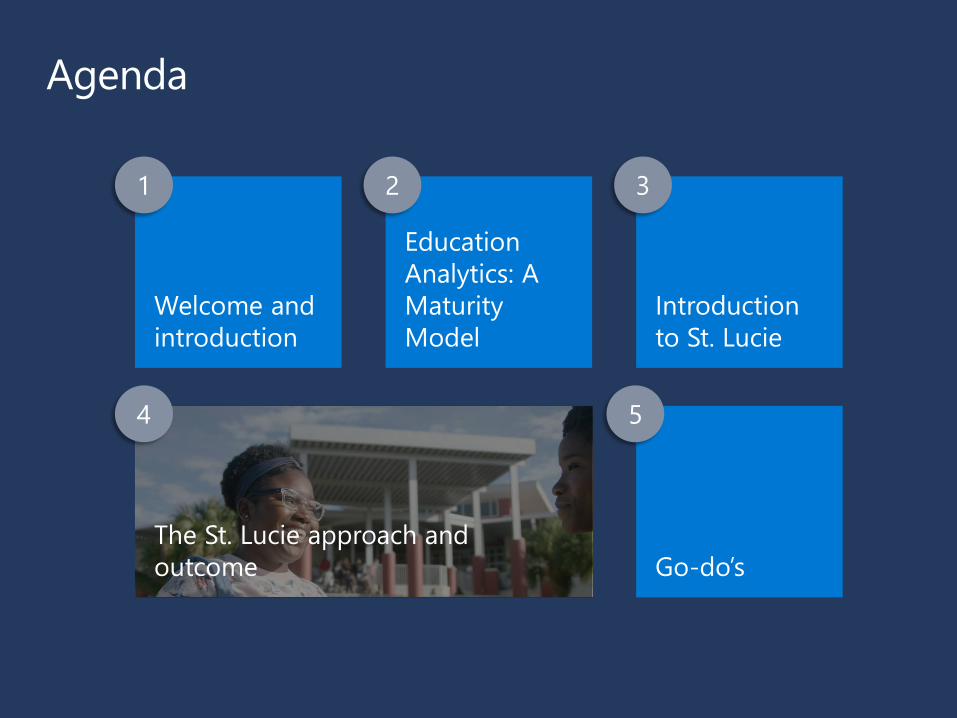
Agenda
Welcome and introductionMark Sparvell
Education Leader
Microsoft
@sparvell
#MicrosoftEdu

Education Analytics: A Maturity ModelDr. Cathy Cavanaugh
Principal Program Manager
Microsoft
@cathycavanaugh
#MicrosoftEdu

Who is at greater risk?

Who is at greater risk?
LOW AVERAGE HIGH
A B
B
B
B
B
B
B
B
B
A
A
A
A
A
A
A
A


Challenges to harnessing data effectively
Absence of unified views of
data prevents schools from
optimizing resources
Lack of insights makes it hard
to identify needs and target support
to all students
Siloed data impedes leaders’ and
teachers’ ability to understand and
predict student outcomes

Plan and Implement Assess ProgressGoals

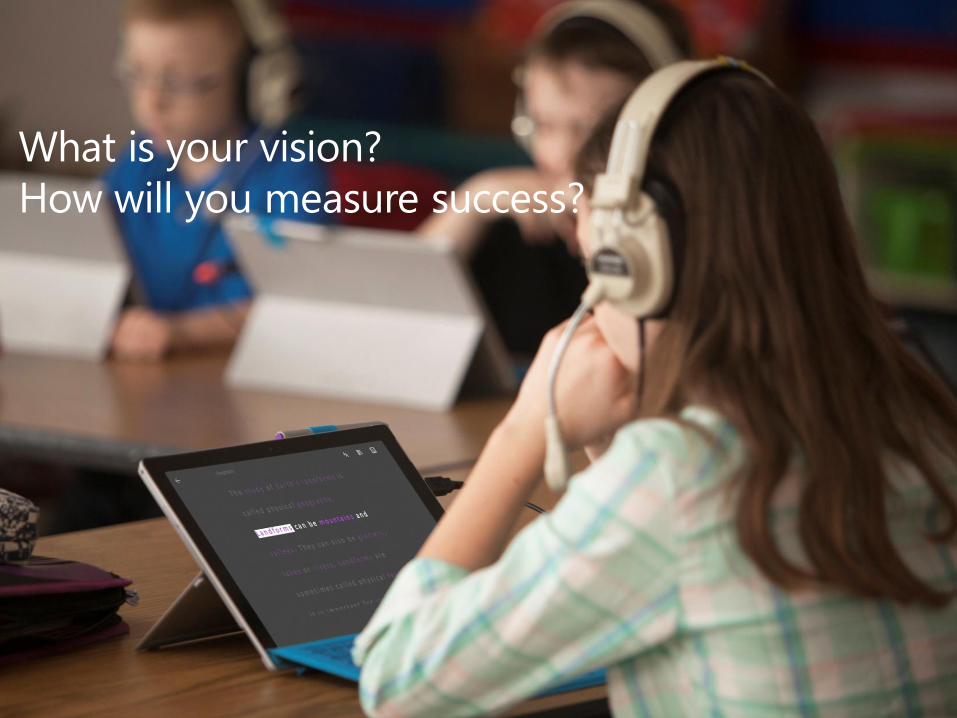
What is your vision?
How will you measure success?
Intro to St. LucieDustin Ryan
Data Platform Solutions Architect
Microsoft
@SQLDusty
#MicrosoftEdu

Data
problems
Disconnected
data sources
Users unable
to efficiently
access data
Data not in
optimal format
for advance
analytics
No self-serve
or data
exploration
Difficult to create
flexible, dynamic
data visualization
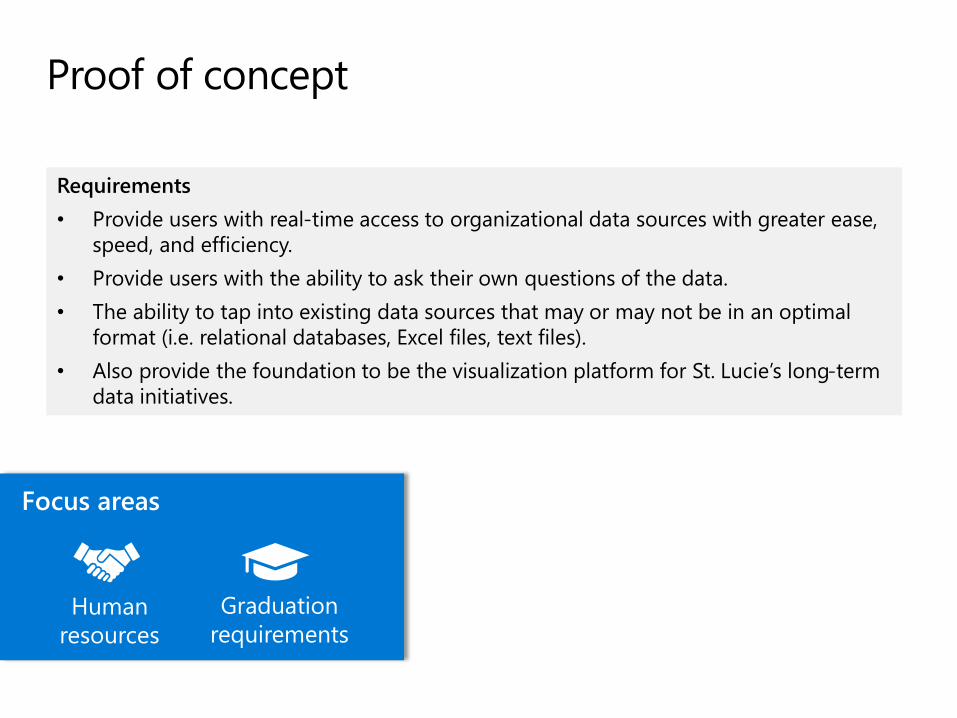
Requirements
• Provide users with real-time access to organizational data sources with greater ease,
speed, and efficiency.
• Provide users with the ability to ask their own questions of the data.
• The ability to tap into existing data sources that may or may not be in an optimal
format (i.e. relational databases, Excel files, text files).
• Also provide the foundation to be the visualization platform for St. Lucie’s long-term
data initiatives.
Human
resources
Focus areas
Graduation
requirements
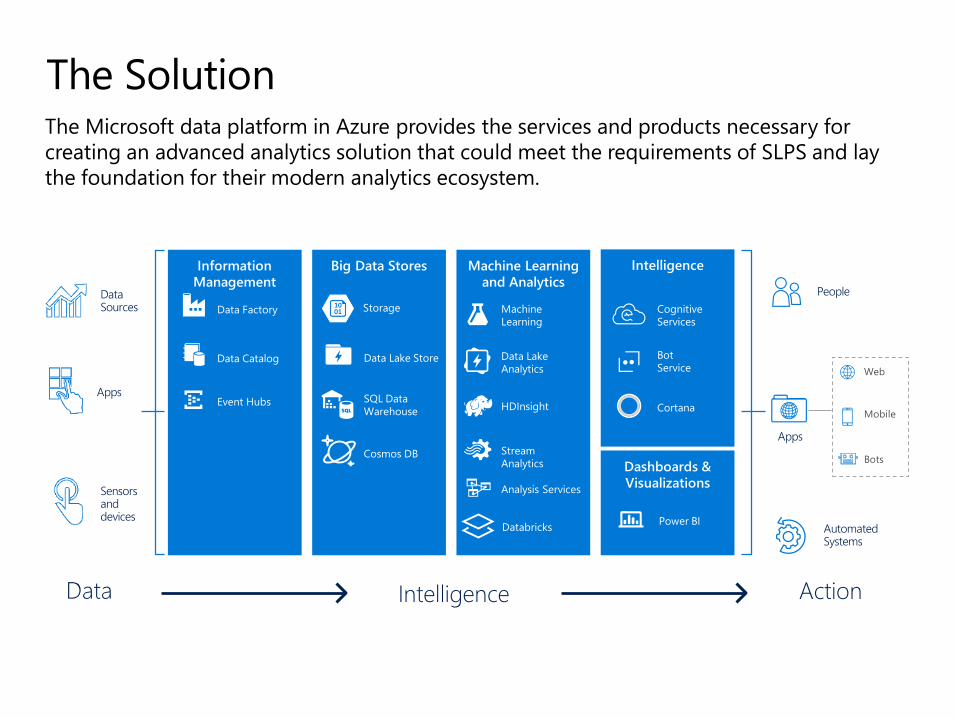
Machine Learning
and Analytics
Big Data StoresInformation
Management
Action
People
Automated Systems
Apps
Web
Mobile
Bots
Data Catalog
Data Factory
Event Hubs
Intelligence
Stream
Analytics
HDInsight
Machine
Learning
Data Sources
Apps
Sensors and devices
Data
Intelligence
Dashboards &
Visualizations
Cortana
Cognitive
Services
Power BI
Bot
Service
Analysis Services
Data Lake
Analytics
SQL Data
Warehouse
Data Lake Store
Databricks
Cosmos DB
Storage

The St. Lucie Approach and OutcomeTerence O’Leary,
Dr. Jon Prince, Deputy Superintendent
@1SLPS

St. Lucie Public Schools
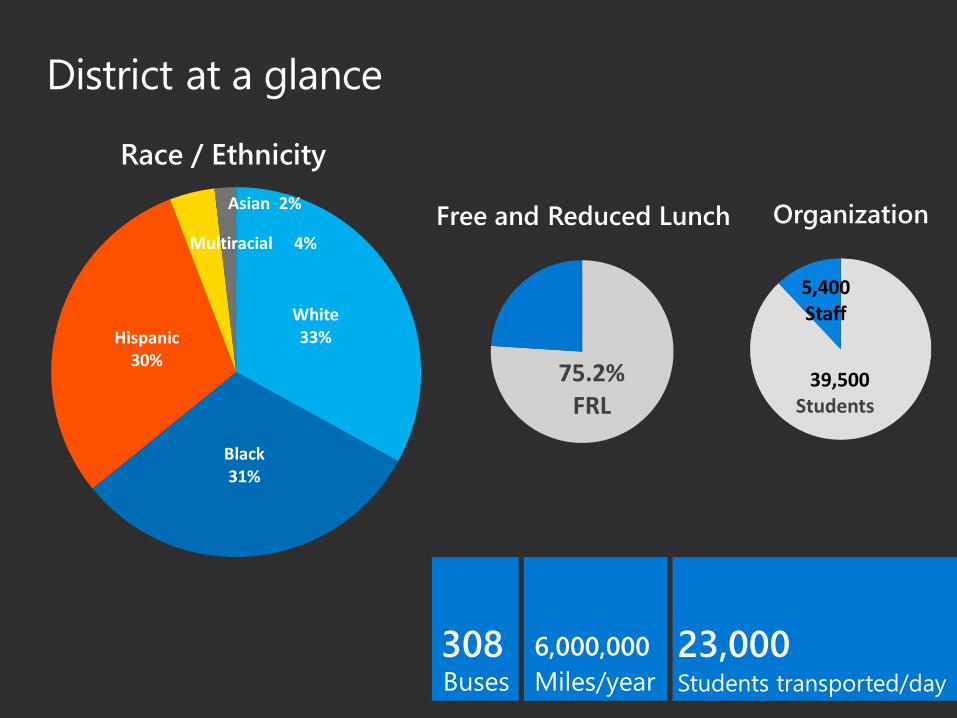
District at a glance
White 33%
Black 31%
Hispanic 30%
Multiracial 4%
Asian 2%
Race / Ethnicity
39,500 Students
5,400 Staff
Organization
75.2%FRL
Free and Reduced Lunch
Buses Students transported/day
308Miles/year
6,000,000 23,000
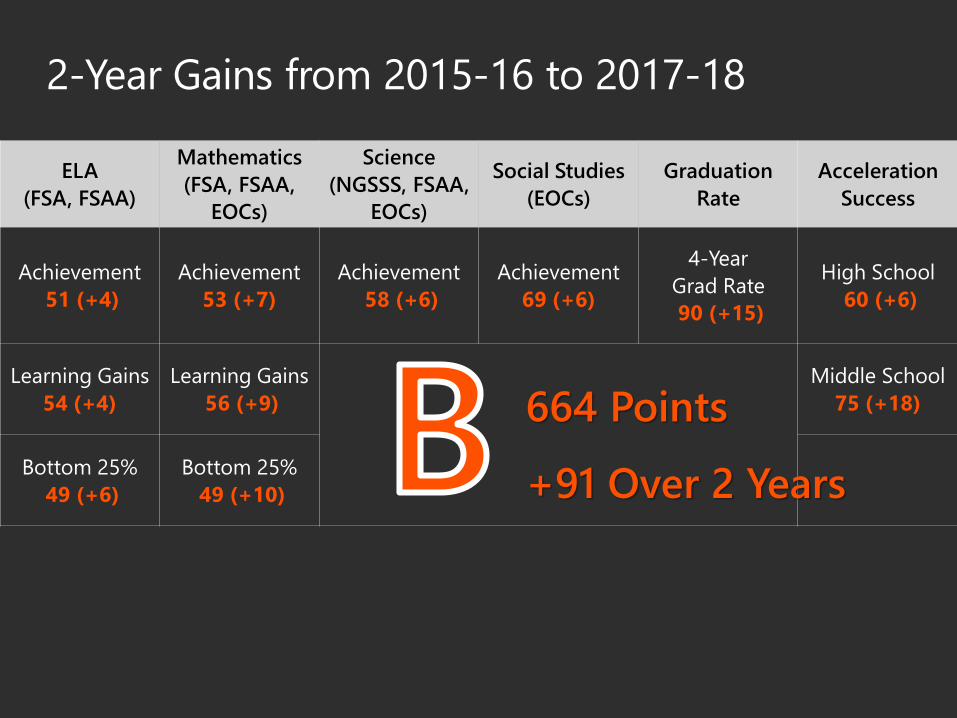
2-Year Gains from 2015-16 to 2017-18
ELA
(FSA, FSAA)
Mathematics
(FSA, FSAA,
EOCs)
Science
(NGSSS, FSAA,
EOCs)
Social Studies
(EOCs)
Graduation
Rate
Acceleration
Success
Achievement
51 (+4)
Achievement
53 (+7)
Achievement
58 (+6)
Achievement
69 (+6)
4-Year
Grad Rate
90 (+15)
High School
60 (+6)
Learning Gains
54 (+4)
Learning Gains
56 (+9)
Middle School
75 (+18)
Bottom 25%
49 (+6)
Bottom 25%
49 (+10)
664 Points
+91 Over 2 Years
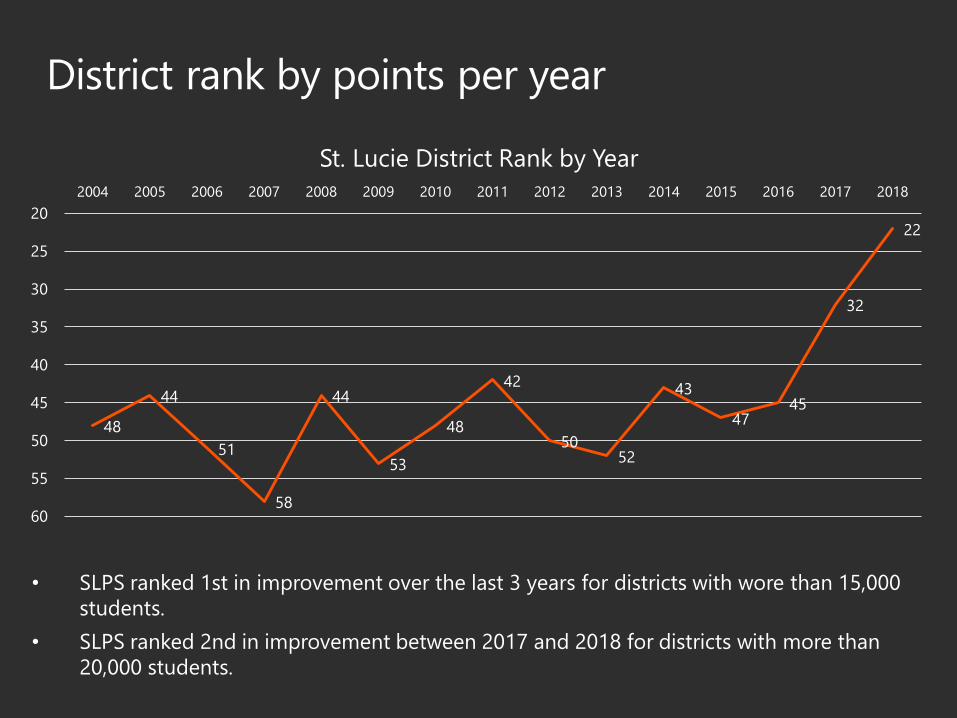
District rank by points per year
48
44
51
58
44
53
48
42
5052
43
4745
32
2220
25
30
35
40
45
50
55
60
2004 2005 2006 2007 2008 2009 2010 2011 2012 2013 2014 2015 2016 2017 2018
St. Lucie District Rank by Year
• SLPS ranked 1st in improvement over the last 3 years for districts with wore than 15,000
students.
• SLPS ranked 2nd in improvement between 2017 and 2018 for districts with more than
20,000 students.

Graduation Rate- District Comparisons
District Graduation RateNumber of
GraduatesFRL
1. Gilchrist 93.4% 156 90.3%
2. Nassau 90.9% 874 49.2%
3. St. Johns 90.9% 2,552 24.1%
4. Suwannee 90.5% 342 92.5%
5. St. Lucie 90.1% 2,761 75.2%
6. Dixie 89.5% 102 97.6%
7. Leon 88.6% 1,978 58.0%
8. Seminole 88.6% 4,680 48.6%
9. Clay 88.4% 2,672 49.4%
10. Collier 88.2% 2,995 64.9%
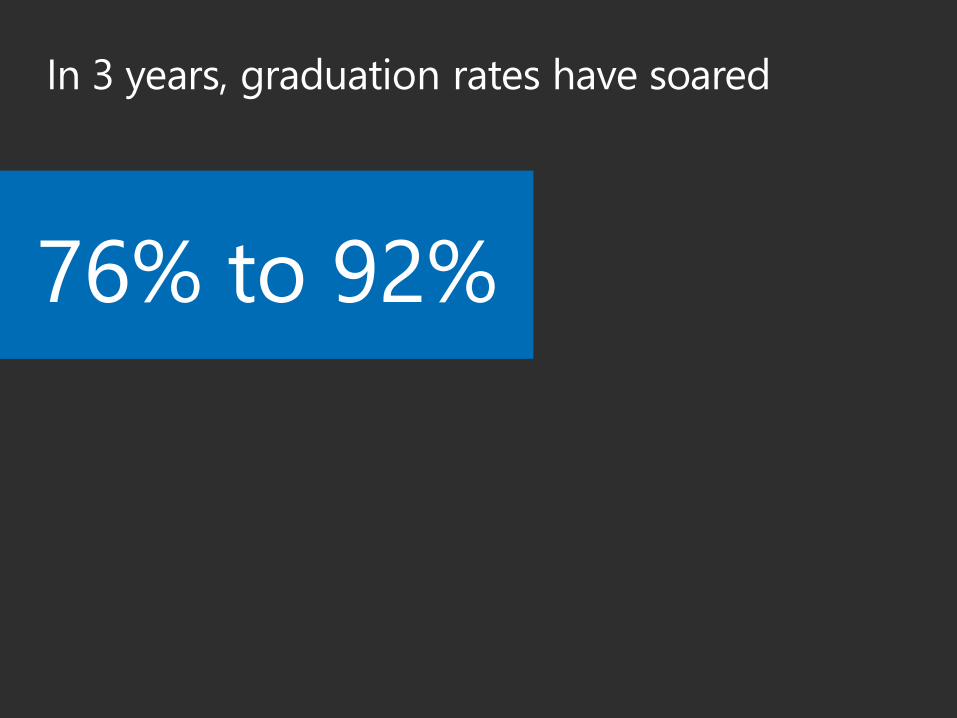
In 3 years, graduation rates have soared
76% to 92%
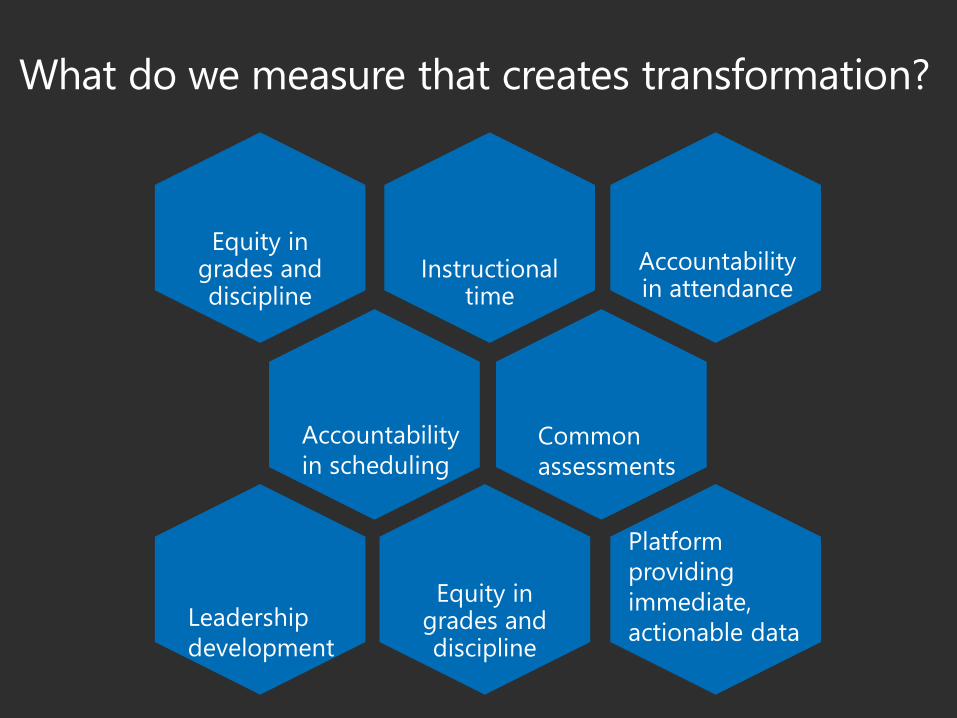
What do we measure that creates transformation?
Equity in grades and discipline
Instructional time
Accountability in attendance
Accountability
in schedulingCommon
assessments
Leadership
development
Equity in grades and discipline
Platform
providing
immediate,
actionable data

How do we measure what creates transformation?
Working collaboratively internally to create a platform providing
immediate, actionable data.
The work began with graduation rate.
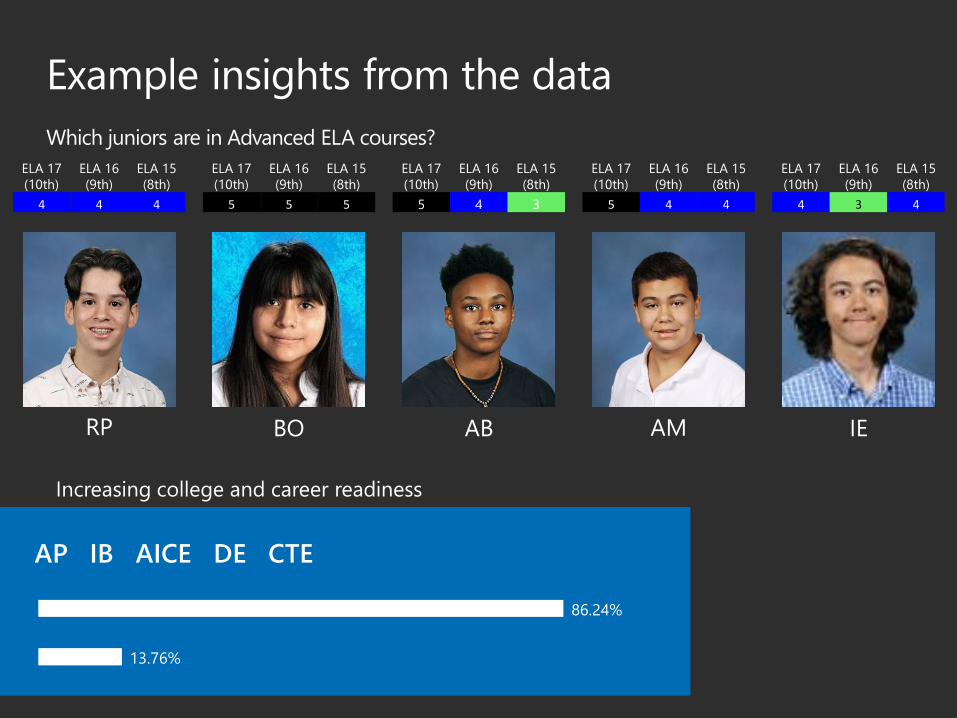
Which juniors are in Advanced ELA courses?
RP AMBO AB IE
ELA 17
(10th)
ELA 16
(9th)
ELA 15
(8th)
5 4 4
ELA 17
(10th)
ELA 16
(9th)
ELA 15
(8th)
5 5 5
ELA 17
(10th)
ELA 16
(9th)
ELA 15
(8th)
5 4 3
ELA 17
(10th)
ELA 16
(9th)
ELA 15
(8th)
4 3 4
ELA 17
(10th)
ELA 16
(9th)
ELA 15
(8th)
4 4 4
Increasing college and career readiness
13.76%
86.24%
AP IB AICE DE CTE
Example insights from the data


Q & A
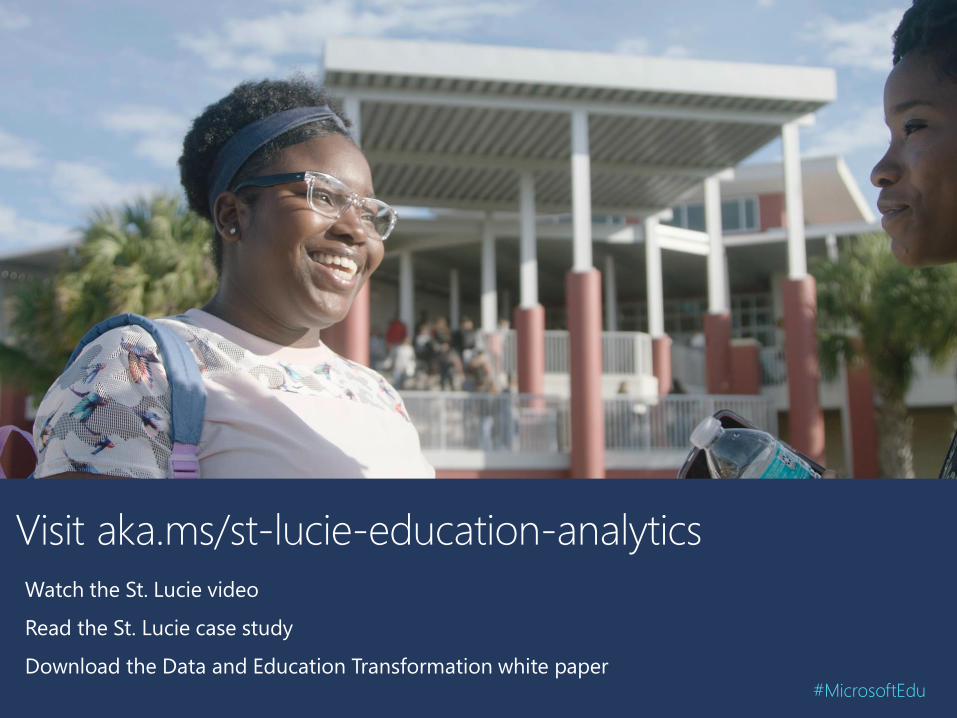
Visit aka.ms/st-lucie-education-analytics
Watch the St. Lucie video
Read the St. Lucie case study
Download the Data and Education Transformation white paper#MicrosoftEdu
#MicrosoftEdu