Embed Size (px)
Citation preview


2008 Gold Bar Wastewater Treatment Plant
Annual Report

GOLD BAR WASTEWATER TREATMENT PLANTTABLE 1: 2008 Plant Performance Summary
2008 Avg 249 00 3 68 193 288 4 1
AvgMinMaxAvg
January
February
March
December
August
September
Month
October
November
April
May
June
July
MinMax
Avg
AvgMinMax
MinMaxAvgMin
AvgMinMaxAvgMinMaxAvgMinMaxAvgMinMax
Min
AvgMinMaxAvg
Max
------------------
MinMaxAvg
TBPMPW
821Total Digested Sludge (ML)
SEFTBP Raw SEF TBP Raw SEF TBP
Total Digested Sludge
PBP Raw SEF
E. coli.CFU/100 mL
SEF
NH3-N(mg N/L)
SEF
(mg/L) (mg/L) (mg P/L)pH
TSS TPBOD5/CBOD5
------------------
------
(ML)
------------
1 950 303 60---------------------------------------------
235 04216 00241 80248 55204 16277 30259 21241 10289 40268 12240 00538 40
284 98242 80506 09272 49244 60327 20292 92253 00401 60260 32233 70324 00260 94242 30439 40243 97227 90258 80244 23236 20261 90239 31211 60263 90
231 84212 70238 40245 34200 33273 10249 22229 80272 90252 16237 40274 90
265 36240 00315 10260 92229 10280 70265 37230 00303 10256 25229 90303 20252 97240 10283 90239 81222 60249 10237 80230 10255 50230 98202 30257 50
3 192 703 402 810 903 833 802 006 502 962 503 30
2 761 703 502 612 103 203 322 504 501 740 004 302 331 503 003 862 506 406 433 747 608 344 00
10 60
---------
355355355209160276267172337
1251091411961263241106813817011921411593137---------------------------
285235355292227437283218408293196394
------------------------------------------------------------------------
6 24 88 74 93 18 04 53 08 44 73 47 2
3 72 55 84 52 86 93 92 56 23 21 95 73 22 35 83 12 25 83 22 15 73 62 34 9
---------
308308308216118272257144368
15270246165383401074720010774172184144224---------------------------
311248420327232600385260980347252756
------------------------------------------------------------------------
6 24 88 77 74 911 08 05 315 08 03 617 0
7 34 524 011 23 120 06 14 110 03 52 26 53 12 34 22 51 73 62 82 13 73 92 76 9
---------
8 608 608 607 586 219 548 314 739 85
5 495 325 637 165 578 845 314 076 716 234 717 415 053 556 55---------------------------
0 490 330 700 890 481 350 780 431 720 870 591 25
0 950 311 701 130 461 830 650 311 340 580 202 770 290 190 690 190 150 250 340 140 950 470 221 22
---------
30 730 730 729 522 036 829 015 235 4
19 417 921 923 415 231 218 913 423 717 514 524 114 49 819 0---------------------------
1 991 373 112 410 944 121 090 481 751 530 482 75
0 770 051 871 00
0 260 080 65
0 282 180 600 10
1 820 226 400 520 151 320 920 092 191 990 047 61
---------1 11 11 10 90 32 21 40 715 2
3 23 23 22 6
3 12 73 9
1 73 52 21 3
1 81 13 03 43 43 4------------------
31383
50
11021
(ML)
70 09
90 55 0
< 1 077 1
65 72
< 1 056 33 0
< 1 0
8 0
67 01
56 11
1 077 65 0
2006 0
69 95
< 1 01,120
1 014011
71 95
2 0
7 0
3 23 0562 66
69 71
Annual Volume (ML)
63 11
94,8693 90 91,134 1,348
69 80
78 77
76 28
2007 Avg1 95 259 20 00 262 7
1 24 2 2 5343 5 9 6 72 0 64249 97 2 54 266
22 81874 1 164 312 8 4 6 62 0 74 21 9 1 93
TBPx 106
1 5 10
5 0< 129 0
2921
SEF
------------------------------------
MonthpH
SEF MPW SEF
Max
SBPPBP Raw
BOD5/CBOD5 TSS E. coli.Total Digested
Sludge(mg/L) (mg/L) (mg P/L) (mg N/L) MPN/100 mLTP NH3-N
SEF TBP SEFTBP Raw SEF TBP(ML)
7 357 118 19
TBP SEF TBP SEFx 106Raw
7 417 197 667 417 067 987 407 057 957 457 177 737 356 908 237 397 177 767 337 127 62
7 39154---
SBP
---------
11 8011 8011 8024 009 60
35 6048 740 10
260 50
104 540 80
220 5020 680 90
95 6041 520 10
165 30
153 30
12 075 20
19 30
VOLUME FLOW
------
---------
4 652 20
VOLUME(ML)
FLOW(ML/day)
(ML/day)
1,993
34 510 2
---
7 10
42 280 90
PBP – Plant Bypass SEF – Secondary Effluent Final TSS – Total Suspended Solids MPW – Membrane Product Water TBP – Total Bypass Plant (including plant and secondary) BOD5 – 5-day Biological Oxygen Demand TP – Total Phosphorus CFU – Colony Forming Units SBP – Secondary Bypass Plant CBOD5 – 5-day Inhibited BOD NH3-N – Ammonia as nitrogen MPN – Most Probable Number

GOLD BAR WASTEWATER TREATMENT PLANT PLANT PERFORMANCE REPORT
Jan 2008
PRIM = Primary SEC = Secondary ML = MegaLiters (1,000,000 Liters)
RAW = Plant Influent (Untreated Wastewater) SEF = Secondary Effluent (Treated Wastewater) TBP = Total Bypass (PRIM Bypass + SEC Bypass)
MPW = Membrane Product Water (Effluent re-use water) CFU = Coliform Forming Units ns = No Sample ws=Wrong E = Estimated Value nr = No Result Sample
* = contact Laboratory for information about the quality assurance associated with the result
Sun 20 0.00 0.00 235.00 231.60 3.40 300 5.9 306 5.0 0.48 2.28 1
Sat 19 0.00 0.00 234.60 231.30 3.30 308 6.4 280 3.7 0.45 1.86 15
Tue 22 0.00 0.00 237.60 234.70 2.90 306 6.4 275 3.6 0.63 2.69 9
Mon 21 0.00 0.00 240.90 237.80 3.10 260 7.8 295 5.6 0.57 3.11 6
Wed 16 0.00 0.00 237.80 234.60 3.20 312 7.3 299 4.1 0.35 1.42 12
Tue 15 0.00 0.00 230.30 227.00 3.30 340 6.8 291 3.8 0.43 2.07 3
Fri 18 0.00 0.00 236.10 232.90 3.20 320 6.3 285 4.3 0.36 1.42 10
Thu 17 0.00 0.00 239.50 236.20 3.30 372 6.2 355 3.9 0.41 1.40 5
Wed 23 0.00 0.00 236.20 233.30 2.90 324 6.0 342 3.8 0.52 2.82 4
Tue 29 0.00 0.00 234.90 232.00 2.90 252 6.3 284 3.4 0.69 1.57 3
Mon 28 0.00 0.00 237.00 233.70 3.30 289 5.6 240 3.7 0.70 1.44 3
Thu 31 0.00 0.00 230.80 228.10 2.70 266 6.8 286 4.9 0.52 1.37 4
Wed 30 0.00 0.00 233.30 230.60 2.70 277 8.7 247 3.6 0.67 2.04 2
Fri 25 0.00 0.00 235.00 231.80 3.20 328 6.2 271 3.6 0.59 1.52 38
Thu 24 0.00 0.00 237.70 234.70 3.00 304 6.3 314 4.7 0.64 2.02 2
Sun 27 0.00 0.00 233.90 230.70 3.20 276 5.6 264 3.5 0.60 1.89 2
Sat 26 0.00 0.00 233.60 230.50 3.10 312 7.2 245 4.0 0.61 1.88 10
Sat 05 0.00 0.00 230.80 227.50 3.30 396 6.8 298 3.6 0.35 1.52 1
Sun 06 0.00 0.00 235.30 232.00 3.30 248 6.8 246 3.8 0.41 2.15 2
Mon 07 0.00 0.00 241.80 238.40 3.40 420 6.3 266 4.8 0.37 1.91 2
Fri 04 0.00 0.00 234.00 230.70 3.30 328 7.3 293 5.4 0.33 1.39 4
Tue 01 0.00 0.00 216.00 212.70 3.30 280 5.0 235 3.0 0.46 2.41 1
Wed 02 0.00 0.00 231.00 227.80 3.20 344 6.8 310 3.5 0.50 2.27 4
Thu 03 0.00 0.00 234.70 231.40 3.30 324 5.3 307 4.1 0.41 1.43 5
Sat 12 0.00 0.00 236.40 233.10 3.30 284 5.1 269 4.8 0.42 2.29 5
Sun 13 0.00 0.00 235.90 232.60 3.30 276 5.2 247 4.3 0.51 2.32 8
Mon 14 0.00 0.00 240.50 237.30 3.20 288 5.8 262 3.7 0.59 2.42 3
Fri 11 0.00 0.00 240.90 237.50 3.40 332 5.0 327 3.7 0.36 2.29 1
Tue 08 0.00 0.00 231.20 227.90 3.30 332 4.9 287 3.3 0.36 1.96 2
Wed 09 0.00 0.00 237.00 233.70 3.30 336 4.8 314 3.5 0.39 2.31 1
Thu 10 0.00 0.00 236.40 233.00 3.40 316 5.4 281 4.0 0.39 2.28 1
TOTAL 0.00 0.00 7,286.10 7,187.10 99.00
GeoMean 0.0 3
AVG 235.04 231.84 3.19 311 6.2 285 4.0 0.49 1.99
DATE Volume of Flow (ML) TSS (mg/L) BOD (mg/L) TP (mg/L) NH3-N (mg/L) E. Coli
BYPASS BOD5 CBOD5 CFU/100mL
Jan PRIM SEC RAW SEF MPW TBP RAW SEC TBP RAW SEF TBP SEF TBP SEF TBP x106 SEF
Digested Sludge: Total Monthly Volume (ML) 70.09

GOLD BAR WASTEWATER TREATMENT PLANT PLANT PERFORMANCE REPORT
Feb 2008
PRIM = Primary SEC = Secondary ML = MegaLiters (1,000,000 Liters)
RAW = Plant Influent (Untreated Wastewater) SEF = Secondary Effluent (Treated Wastewater) TBP = Total Bypass (PRIM Bypass + SEC Bypass)
MPW = Membrane Product Water (Effluent re-use water) CFU = Coliform Forming Units ns = No Sample ws=Wrong E = Estimated Value nr = No Result Sample
* = contact Laboratory for information about the quality assurance associated with the result
Tue 19 0.00 0.00 243.50 240.50 3.00 328 8.6 281 5.7 1.35 1.49 5
Mon 18 0.00 0.00 250.30 247.50 2.80 324 7.2 235 4.3 1.23 2.10 < 1
Thu 21 0.00 0.00 250.90 248.00 2.90 284 8.2 277 5.1 0.71 2.82 3
Wed 20 0.00 0.00 243.10 240.30 2.80 308 7.1 306 4.6 0.71 0.94 3
Fri 15 0.00 0.00 274.20 271.30 2.90 376 8.4 233 5.0 0.86 2.24 2
Thu 14 0.00 0.00 244.60 241.60 3.00 328 7.7 335 4.6 0.87 1.65 3
Sun 17 0.00 0.00 238.80 235.80 3.00 280 8.4 246 5.9 1.09 2.28 9
Sat 16 0.00 0.00 271.80 269.00 2.80 392 10.0 366 5.7 1.05 2.76 5
Wed 27 0.00 0.00 275.80 273.10 2.70 388 9.9 284 8.0 0.98 2.43 7
Tue 26 0.00 0.00 268.30 267.40 0.90 296 10.0 275 6.2 1.01 1.70 4
Fri 29 0.00 0.00 265.00 261.90 3.10 392 8.2 275 5.3 0.48 1.21 3
Thu 28 0.00 11.80 277.30 262.50 3.00 308 600 9.4 355 364 7.8 8.6 0.80 30.7 2.07 1.1 < 1
Sat 23 0.00 0.00 253.60 250.80 2.80 388 10.0 316 4.9 1.05 2.86 10
Fri 22 0.00 0.00 258.20 255.10 3.10 316 11.0 250 6.0 0.87 3.29 10
Mon 25 0.00 0.00 261.00 259.30 1.70 288 9.4 260 5.1 1.29 2.30 3
Sun 24 0.00 0.00 261.10 258.10 3.00 274 8.0 227 4.2 1.32 3.68 3
Mon 04 0.00 0.00 237.80 235.00 2.80 304 6.2 296 5.6 0.86 3.71 3
Tue 05 0.00 0.00 230.10 227.40 2.70 280 6.9 292 4.2 0.75 2.90 6
Wed 06 0.00 0.00 231.20 228.50 2.70 280 5.3 251 3.1 0.73 3.07 2
Fri 01 0.00 0.00 226.80 224.10 2.70 328 7.2 281 3.4 0.53 1.17 4
Sat 02 0.00 0.00 236.10 233.60 2.50 232 8.1 308 4.5 0.54 1.74 1
Sun 03 0.00 0.00 231.80 229.20 2.60 284 4.9 284 4.8 0.70 2.82
Thu 07 0.00 0.00 237.10 234.30 2.80 280 6.2 437 4.1 0.60 3.04 1
Mon 11 0.00 0.00 250.00 247.00 3.00 364 5.8 352 4.3 1.10 3.37 3
Tue 12 0.00 0.00 244.90 242.00 2.90 308 6.1 266 4.1 0.98 1.83 1
Wed 13 0.00 0.00 239.10 236.10 3.00 308 5.9 261 4.3 0.78 1.62 4
Fri 08 0.00 0.00 239.00 236.00 3.00 276 6.2 286 4.1 0.84 3.12 1
Sat 09 0.00 0.00 243.60 240.60 3.00 368 7.3 336 3.8 0.90 1.42 1
Sun 10 0.00 0.00 245.70 242.60 3.10 312 6.2 292 3.6 0.86 4.12 3
TOTAL 0.00 11.80 7,230.70 7,138.60 80.30
GeoMean 1.1 3
AVG 249.33 246.16 2.77 308 327 7.7 355 292 4.9 8.6 0.89 30.7 2.41
DATE Volume of Flow (ML) TSS (mg/L) BOD (mg/L) TP (mg/L) NH3-N (mg/L) E. Coli
BYPASS BOD5 CBOD5 CFU/100mL
Feb PRIM SEC RAW SEF MPW TBP RAW SEC TBP RAW SEF TBP SEF TBP SEF TBP x106 SEF
Digested Sludge: Total Monthly Volume (ML) 65.82

GOLD BAR WASTEWATER TREATMENT PLANT PLANT PERFORMANCE REPORT
Mar 2008
PRIM = Primary SEC = Secondary ML = MegaLiters (1,000,000 Liters)
RAW = Plant Influent (Untreated Wastewater) SEF = Secondary Effluent (Treated Wastewater) TBP = Total Bypass (PRIM Bypass + SEC Bypass)
MPW = Membrane Product Water (Effluent re-use water) CFU = Coliform Forming Units ns = No Sample ws=Wrong E = Estimated Value nr = No Result Sample
* = contact Laboratory for information about the quality assurance associated with the result
Thu 20 0.00 0.00 268.20 262.10 6.10 372 6.1 308 3.5 1.10 1.13 4
Wed 19 0.00 0.00 270.90 266.70 4.20 348 7.6 296 4.4 0.99 1.03 5
Sat 22 0.00 0.00 250.00 244.10 5.90 308 6.9 231 3.1 0.63 1.18 1
Fri 21 0.00 0.00 260.90 255.40 5.50 312 7.2 258 3.0 0.97 1.39 2
Sun 16 0.00 0.00 246.00 242.50 3.50 324 5.3 297 3.8 0.61 1.14 3
Sat 15 0.00 0.00 253.00 249.70 3.30 400 7.7 233 4.1 0.59 0.70 < 1
Tue 18 0.00 9.60 280.70 269.10 2.00 156 312 7.1 219 277 4.1 7.6 0.92 30.6 0.89 1.8 1
Mon 17 0.00 29.30 288.50 256.20 3.00 248 464 9.0 214 273 5.6 7.8 0.91 28.9 1.06 2.2 4
Sun 23 0.00 0.00 248.50 242.00 6.50 308 6.7 269 3.2 0.91 1.70 < 1
Sat 29 0.00 0.00 246.90 243.90 3.00 312 7.0 269 4.3 0.69 1.17 < 1
Fri 28 0.00 0.00 250.20 246.60 3.60 372 7.5 305 3.3 0.67 0.86 < 1
Mon 31 0.00 0.00 245.00 242.10 2.90 368 9.1 289 4.4 1.13 1.35 1
Sun 30 0.00 0.00 241.80 238.90 2.90 260 7.8 286 4.6 0.72 1.53 3
Tue 25 0.00 0.00 253.10 248.00 5.10 344 7.0 245 3.3 1.39 1.48 6
Mon 24 0.00 0.00 258.70 252.40 6.30 404 6.8 338 3.0 1.72 1.75 2
Thu 27 0.00 0.00 248.60 244.30 4.30 368 7.4 330 5.2 0.80 0.68 6
Wed 26 0.00 0.00 250.60 245.50 5.10 324 9.2 274 4.3 0.97 0.64 2
Wed 05 0.00 0.00 245.20 241.90 3.30 440 15.0 299 8.4 0.62 0.75 2
Thu 06 0.00 0.00 248.40 245.20 3.20 316 10.0 * 319 * 5.0 0.45 0.86 5
Fri 07 0.00 20.90 281.00 257.10 3.00 240 460 8.3 225 277 5.9 7.9 0.50 29.9 0.92 0.3 29
Tue 04 0.00 0.00 243.00 239.70 3.30 383 8.7 340 6.0 0.47 0.76 3
Sat 01 0.00 19.40 268.10 245.50 3.20 272 380 9.2 276 248 4.5 9.5 0.43 36.8 1.23 1.4 3
Sun 02 0.00 0.00 246.80 243.40 3.40 380 7.1 268 5.3 0.51 1.31 3
Mon 03 0.00 0.00 255.70 252.40 3.30 612 7.7 408 3.8 0.91 1.75 8
Wed 12 0.00 0.00 275.90 272.40 3.50 332 8.3 255 4.9 0.58 1.15 E 2
Thu 13 0.00 0.00 256.50 253.50 3.00 340 7.6 269 5.1 0.62 1.36 < 1
Fri 14 0.00 0.00 241.10 238.30 2.80 304 6.7 240 4.0 0.63 0.76 3
Tue 11 0.00 13.50 289.40 272.90 3.00 200 352 8.0 182 255 4.6 7.3 0.73 27.8 0.48 E 0.6 1
Sat 08 0.00 35.60 281.50 242.10 3.80 244 980 10.0 180 285 5.3 7.8 0.70 30.8 1.04 1.3 3
Sun 09 0.00 33.10 265.80 229.80 2.90 118 330 7.2 160 299 4.9 6.5 0.55 29.6 1.01 0.3 2
Mon 10 0.00 30.60 275.50 242.10 2.80 246 440 8.2 215 * 218 3.3 6.2 0.63 22.0 0.65 0.9 3
TOTAL 0.00 192.00 8,035.50 7,725.80 117.70
GeoMean 0.9 2
AVG 259.21 249.22 3.80 216 385 8.0 209 283 4.5 7.6 0.78 29.5 1.09
DATE Volume of Flow (ML) TSS (mg/L) BOD (mg/L) TP (mg/L) NH3-N (mg/L) E. Coli
BYPASS BOD5 CBOD5 CFU/100mL
Mar PRIM SEC RAW SEF MPW TBP RAW SEC TBP RAW SEF TBP SEF TBP SEF TBP x106 SEF
Digested Sludge: Total Monthly Volume (ML) 67.01

GOLD BAR WASTEWATER TREATMENT PLANT PLANT PERFORMANCE REPORT
Apr 2008
PRIM = Primary SEC = Secondary ML = MegaLiters (1,000,000 Liters)
RAW = Plant Influent (Untreated Wastewater) SEF = Secondary Effluent (Treated Wastewater) TBP = Total Bypass (PRIM Bypass + SEC Bypass)
MPW = Membrane Product Water (Effluent re-use water) CFU = Coliform Forming Units ns = No Sample ws=Wrong E = Estimated Value nr = No Result Sample
* = contact Laboratory for information about the quality assurance associated with the result
Sun 20 0.00 0.00 243.10 240.00 3.10 252 8.6 281 5.7 0.93 2.75 2
Sat 19 0.00 0.00 245.00 242.00 3.00 292 7.9 312 5.1 0.90 2.13 1
Tue 22 0.00 0.00 244.30 241.30 3.00 316 17.0 * 272 * 7.2 1.13 1.60 6
Mon 21 0.00 0.00 246.90 243.80 3.10 300 7.4 300 3.5 1.25 1.94 2
Wed 16 0.00 0.00 249.30 246.00 3.30 292 5.7 307 4.6 0.65 1.08 2
Tue 15 0.00 0.00 247.10 244.10 3.00 312 7.0 296 4.8 0.72 0.99 50
Fri 18 0.00 0.00 249.60 246.40 3.20 292 7.4 265 5.1 0.87 1.40 4
Thu 17 0.00 0.00 248.40 245.20 3.20 332 6.6 326 5.3 0.61 1.56 2
Mon 28 0.00 0.00 276.00 273.00 3.00 564 8.0 394 3.7 0.94 1.55 3
Sun 27 0.00 16.50 278.00 258.30 3.20 144 388 7.2 263 310 4.4 8.8 0.68 35.4 1.30 15.2 2
Wed 30 0.00 260.50 538.40 274.90 3.00 320 756 6.8 * 172 196 * 3.8 4.7 0.63 15.2 0.48 0.7 1
Tue 29 0.00 0.00 270.70 267.90 2.80 308 8.1 249 3.4 1.04 1.43 3
Thu 24 0.00 0.00 264.80 261.70 3.10 332 9.1 284 5.3 0.76 1.50 2
Wed 23 0.00 3.50 269.40 262.90 3.00 300 392 7.6 337 285 4.8 8.5 0.79 28.7 1.68 1.1 6
Sat 26 0.00 52.50 307.90 252.60 2.80 236 412 12.0 198 247 4.2 7.9 0.61 24.8 0.58 1.2 2
Fri 25 0.00 10.10 275.80 262.80 2.90 252 300 7.8 301 260 4.7 9.9 1.14 32.9 1.59 1.4 4
Mon 14 0.00 0.00 256.20 253.10 3.10 306 6.1 263 4.0 0.97 1.57 1
Fri 04 0.00 0.00 248.70 245.90 2.80 308 3.6 364 4.5 1.02 1.73 1
Sat 05 0.00 23.90 266.10 239.20 3.00 368 460 5.7 280 278 3.7 9.3 0.59 33.1 1.79 0.7 2
Sun 06 0.00 22.80 285.60 259.70 3.10 180 304 6.8 320 291 5.0 9.1 0.74 32.9 1.63 0.9 2
Tue 01 0.00 0.00 240.00 237.40 2.60 292 E 9.5 320 E 5.0 E 1.03 E 1.10 1
Wed 02 0.00 0.00 242.00 239.50 2.50 308 7.7 290 4.8 0.72 1.14 2
Thu 03 0.00 0.00 244.10 241.50 2.60 320 8.0 295 4.6 0.79 1.13 6
Mon 07 0.00 0.10 275.50 272.30 3.10 260 8.1 283 4.5 1.09 1.91 1
Fri 11 0.00 0.00 256.10 253.40 2.70 324 7.4 233 5.5 0.77 1.43 2
Sat 12 0.00 0.00 253.10 250.20 2.90 304 8.6 * 335 * 5.8 0.82 1.40 2
Sun 13 0.00 0.00 252.10 249.10 3.00 308 9.3 296 4.8 0.89 2.43 2
Tue 08 0.00 0.00 259.80 256.90 2.90 296 8.8 271 4.4 0.98 2.23 5
Wed 09 0.00 0.00 254.80 252.00 2.80 500 7.3 * 324 * 4.4 0.83 1.64 < 1
Thu 10 0.00 0.00 254.70 251.70 3.00 280 8.6 356 4.6 1.23 1.29 2
TOTAL 0.00 389.90 8,043.50 7,564.80 88.80
GeoMean 1.4 2
AVG 268.12 252.16 2.96 257 347 8.0 267 293 4.7 8.3 0.87 29.0 1.53
DATE Volume of Flow (ML) TSS (mg/L) BOD (mg/L) TP (mg/L) NH3-N (mg/L) E. Coli
BYPASS BOD5 CBOD5 CFU/100mL
Apr PRIM SEC RAW SEF MPW TBP RAW SEC TBP RAW SEF TBP SEF TBP SEF TBP x106 SEF
Digested Sludge: Total Monthly Volume (ML) 56.11

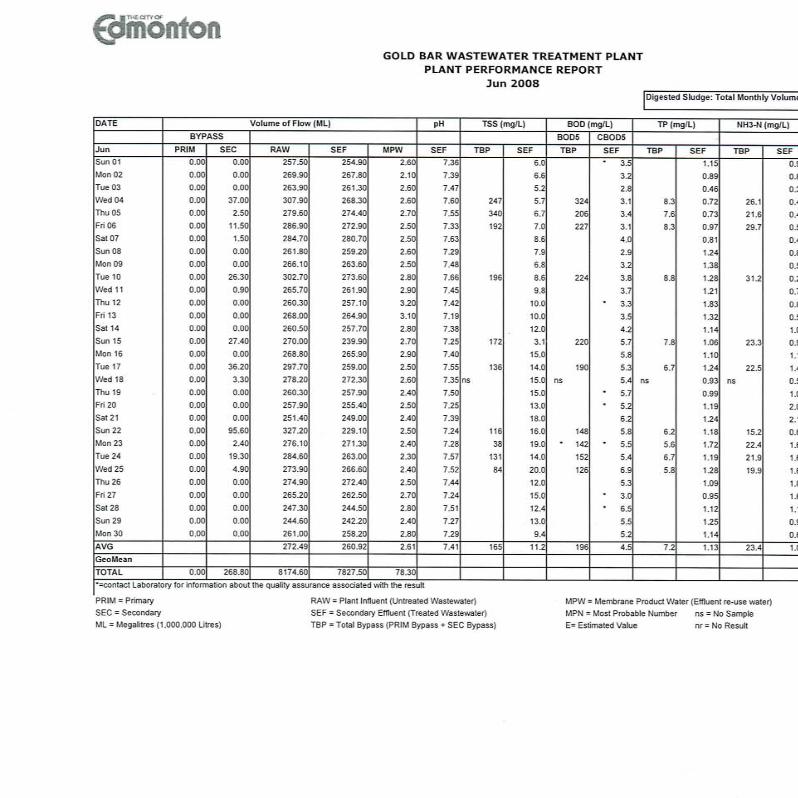


Table 2. 2008 ENVIRONMENTAL RELEASE REPORTS TO ALBERTA ENVIRONMENT
AE REFERENCE NO. DATE, TIME & LOCATION
AMOUNT & TYPE OF RELEASE
CAUSE OF RELEASE IMMEDIATE RESPONSE PLANS TO PREVENT SIMILAR RELEASE? WRITTEN REPORT REQUESTED?
ASSET MANAGEMENT & PUBLIC WORKS DEPARTMENT – DRAINAGE SERVICES BRANCH – Wastewater Treatment AE 197868 February 27 @ 10:15 Gold Bar WWTP – Digester 6
1000 cubic metres Digester Biogas (Not contained)
As part of 2008 plant maintenance, Digester #6 was removed from service and prepared for scheduled maintenance. The preparation involved the purging of the headspace of digester biogas with nitrogen and venting to the atmosphere.
No action taken as this was a planned maintenance activity.
As much Biogas as possible is removed from the headspace prior to the nitrogen displacement and venting. AE: Yes
AE 199219 April 2 @ 10:00 Digester Gas Room #2 Goldbar WWTP
1 cubic metre/8 ppm Digester Biogas (Not contained)
Controlled bleed off to atmosphere from the mixing compressors discharge header line to the digester mixing header. Need to install a blind between 2 flanges for proper isolation.
A 0.5 inch hose was directed outside to atmosphere to bleed off any possible gas in the line. The line was purged.
Install a blind between the 2 flanges to ensure proper isolation. AE: Yes
AE 201184 May 21 @ 07:39 Goldbar WWTP
2 Megalitres Partially treated sewage (Not contained)
Planned power switch over from Hardisty to Kennedale.
On both days, as power was being restored throughout the waste water treatment plant the UV system gradually came back on. Within a few minutes of the initial power disruption the UV disinfection system was back in full operation.
This switch was required for maintenance purposes and was planned well in advance with EPCOR. AE: Yes
AE 201869 May 22 @ 06:50 Goldbar WWTP
4 Megalitres Partially treated sewage (Not contained)
Planned power outage for the wastewater treatment plant to accommodate a switch from the main electrical power feeder to the backup feeder, then back to the main feeder the following day.
On both days, as power was being restored throughout the waste water treatment plant the UV system gradually came back on. Within a few minutes of the initial power disruption the UV disinfection system was back in full operation.
This switch was required for maintenance purposes and was planned well in advance with EPCOR. AE: Yes
AE 203228 July 5 @ 15:20 GoldBar WWTP 10977 – 50 Street
Unknown – small amount Partially treated wastewater (Not contained)
After heavy rainfall, Grit tanks 1 & 2 overflowed as crew was unable to open Grit #3 Influent Channel gate. This caused spillage onto road into catch basins connected to Bypass Outfall.
N/A Grit tank 3 will be cleaned more frequently during digester 6 cleaning activities. AE: Yes
AE 203838 July 8 @ 21:42 10977 – 50 Street Gold Bar WWTP
0.32 Megalitre Untreated wastewater 9.0 ML partially treated wastewater (Not contained)
Channel 2 overflowed static weir prior to reaching 910 ML/day – primary treatment capacity.
N/A Ease influent channel and primaries 7 & 8 will be put back into service once isolation gate installation is completed. AE: Yes

AE REFERENCE NO. DATE, TIME & LOCATION
AMOUNT & TYPE OF RELEASE
CAUSE OF RELEASE IMMEDIATE RESPONSE PLANS TO PREVENT SIMILAR RELEASE? WRITTEN REPORT REQUESTED?
ASSET MANAGEMENT & PUBLIC WORKS DEPARTMENT – DRAINAGE SERVICES BRANCH – Wastewater Treatment (continued) AE 203406 June 15 @ 14:10 (reported to AE on July 8 @ 14:30 10977 – 50 Street Gold Bar WWTP
1 Megalitre Partially treated wastewater (Not contained)
Sustained influent flow of 420 – 450 ML/day (due to rain) Flow transmitter indicated <420 ML/day when secondary bypass initiated.
N/A Ensure secondary bypasses only initiated once final effluent flow meter reaches 420 ML/day. AE: Yes
AE 203433 July 9 @ 13:30 10977 – 50 Street Gold Bar WWTP
3.4 MegaLitres Partially Treated Sewage (Not contained)
East primary influent channel and primaries 5-8 out of service for gate installation. Primaries 1-4 and 9-12 in service for rated capacity of >910 ML/day.
Pump used to minimize overflow of primary effluent into EPE distribution chamber.
Gates at EPE distribution chamber to be extended to prevent future overflows. AE: Yes
AE 204914 August 18 @ 07:53 Gold Bar WWTP 10977 – 50 Street
2.8 Megalitres Partially treated sewage (Not contained)
Pre-arranged with EPCOR scheduled shut down – power feed switched to backup feeder and then back the next day.
Required for maintenance purposes. Well planned in advance with EPCOR.
AE was informed of the planned power outage that would cause a small volume of un-disinfected effluent to enter the river. AE: Yes
AE 205112 August 19 @ 07:28 Gold Bar WWTP 10977 – 50 Street
2 Megalitres Partially treated sewage (Not contained)
Pre-arranged with EPCOR scheduled shut down – power feed switched to backup feeder and then back the next day.
Required for maintenance purposes. Well planned in advance with EPCOR.
AE was informed of the planned power outage that would cause a small volume of un-disinfected effluent to enter the river. AE: Yes

Approval 639-02-00 Wastewater Treatment Monthly Operational Summary Prepared for Alberta Environment January 2008 Supervising Operators
• Geoff Heise • Ken Grossell
Level IV Operators • Ray Gale • Lonnie Waterhouse
Functional Location
& Description
Operating Condition
Comments
C-WW-BLD Buildings
Normal
C-WW-BYP Bypass
Normal • No Secondary Bypass Events occurred greater than 2 hours in duration.
C-WW-CBF Clover Bar Biosolids Recycling Facility
Normal • Biosolids application to farmland ended on October 12th. Target of 10,000 dry tones was met.
C-WW-CEX Centre of Excellence
Normal
C-WW-DIG Digesters
Normal • 5 of 6 Digesters in-service; Digester 6 taken out of service (thinned with final effluent) on January 14, 2008.
• High-efficiency flares out-of-service due to construction activities to mitigate winter operation issues; stand-by flares in service
C-WW-DIS Disinfection
Normal • Disinfection process (as measured by Fecal Coliforms and E.coli) performed within Approval requirements.
C-WW-FER Fermentation
Out of Service • Blend Tanks and Fermenter will be out-of-service until upgrades are completed as part of the Fermenter Capital Project (Fall 2008)
C-WW-LAB Laboratory
Normal
C-WW-LAB-(Process Samplers) Laboratory
Normal
C-WW-OUT Outfall
Normal
C-WW-PCS Process Control System
Normal
C-WW-PRI Primary
Normal Summer Mode
DRAINAGE SERVICES WASTEWATER TREATMENT SECTION 10977 – 50 STREET EDMONTON, AB T6A 2E9 FAX: (780) 496-4694
ASSET MANAGEMENT AND PUBLIC WORKS

Functional Location
& Description
Operating Condition
Comments
C-WW-PTR Pretreatment
Normal Summer Mode
• Grit tank 4 – out-of-service (15 days) • Grit tank 5 – out-of-service (31 days) • Grit tank 7 – out-of-service (16 days)
C-WW-SEC Secondary
Normal Summer Mode
• 10 bioreactors in service; all operating in summer mode
• Bioreactor/Clarifier 3 – out-of-service (31 days) • Total Suspended Solids, Biochemical Oxygen
Demand and Nitrogen/Phosphorus Removal Processes (Nitrification and Denitrification) performed within Approval requirements
C-WW-SSP Sludge /Supernatant Piping
Normal • Supernatant Piping Systems and Decant Systems have been in service. Available system in full operation to return as much supernatant as possible.
C-WW-UTL Utilities
Normal
C-WW-WAS Waste Activated Sludge Thickening Facility
Normal
Prepared by Date Geoff Heise General Supervisor, Process Operations
February 25, 2008

Approval 639-02-00 Wastewater Treatment Monthly Operational Summary Prepared for Alberta Environment February 2008 Supervising Operators
• Geoff Heise • Ken Grossell
Level IV Operators • Ray Gale • Lonnie Waterhouse
Functional Location
& Description
Operating Condition
Comments
C-WW-BLD Buildings
Normal
C-WW-BYP Bypass
Normal • One (1) Secondary Bypass Event occurred greater than 2 hours in duration.
C-WW-CBF Clover Bar Biosolids Recycling Facility
Normal • Biosolids application to farmland ended on October 12th. Target of 10,000 dry tones was met.
C-WW-CEX Centre of Excellence
Normal
C-WW-DIG Digesters
Cleaning #6 • Digester 6 out-of-service (29 days) • High-efficiency flares out-of-service due to
construction activities to mitigate winter operation issues; stand-by flares in service
C-WW-DIS Disinfection
Normal • Disinfection process (as measured by Fecal Coliforms and E.coli) performed within Approval requirements.
C-WW-FER Fermentation
Out of Service • Blend Tanks and Fermenter will be out-of-service until upgrades are completed as part of the Fermenter Capital Project (Fall 2008)
C-WW-LAB Laboratory
Normal
C-WW-LAB-(Process Samplers) Laboratory
Normal
C-WW-OUT Outfall
Normal
C-WW-PCS Process Control System
Normal
C-WW-PRI Primary
Normal Summer Mode
DRAINAGE SERVICES WASTEWATER TREATMENT SECTION 10977 – 50 STREET EDMONTON, AB T6A 2E9 FAX: (780) 496-4694
ASSET MANAGEMENT AND PUBLIC WORKS
Functional Location
& Description
Operating Condition
Comments
C-WW-PTR Pretreatment
Normal Summer Mode
• Grit tank 4 – out-of-service (16 days) • Grit tank 5 – out-of-service (29 days) • Grit tank 7 – out-of-service (14 days) • Screen 4 – out-of-service (14 days) • Screen 5 – out-of-service (14 days) • Screen 6 – out-of-service (14 days) • Screen 8 – out-of-service (8 days)
C-WW-SEC Secondary
Normal Summer Mode
• 10 bioreactors in service; all operating in summer mode
• Bioreactor/Clarifier 5 – out-of-service (29 days) • Total Suspended Solids, Biochemical Oxygen
Demand and Nitrogen/Phosphorus Removal Processes (Nitrification and Denitrification) performed within Approval requirements
C-WW-SSP Sludge /Supernatant Piping
Normal • Supernatant Piping Systems and Decant Systems have been in service. Available system in full operation to return as much supernatant as possible.
C-WW-UTL Utilities
Normal
C-WW-WAS Waste Activated Sludge Thickening Facility
Normal
Prepared by Date Geoff Heise General Supervisor, Process Operations
March 18, 2008

Approval 639-02-00 Wastewater Treatment Monthly Operational Summary Prepared for Alberta Environment March 2008 Supervising Operators
• Geoff Heise • Ken Grossell
Level IV Operators • Ray Gale • Lonnie Waterhouse
Functional Location
& Description
Operating Condition
Comments
C-WW-BLD Buildings
Normal
C-WW-BYP Bypass
Normal • Eight (8) Secondary Bypass Events occurred greater than 2 hours in duration.
C-WW-CBF Clover Bar Biosolids Recycling Facility
Normal • 2008 Biosolids application to farmland to commence in May with an application target of 10,000 dry tones for the year.
C-WW-CEX Centre of Excellence
Normal
C-WW-DIG Digesters
Cleaning #6 • Digester 6 out-of-service (31 days) • High-efficiency flares out-of-service due to
construction activities to mitigate winter operation issues; stand-by flares in service
C-WW-DIS Disinfection
Normal • Disinfection process (as measured by Fecal Coliforms and E.coli) performed within Approval requirements.
C-WW-FER Fermentation
Out of Service • Blend Tanks and Fermenter will be out-of-service until upgrades are completed as part of the Fermenter Capital Project (Fall 2008)
C-WW-LAB Laboratory
Normal
C-WW-LAB-(Process Samplers) Laboratory
Normal
C-WW-OUT Outfall
Normal
C-WW-PCS Process Control System
Normal
C-WW-PRI Primary
Normal Summer Mode
DRAINAGE SERVICES WASTEWATER TREATMENT SECTION 10977 – 50 STREET EDMONTON, AB T6A 2E9 FAX: (780) 496-4694
ASSET MANAGEMENT AND PUBLIC WORKS

Functional Location
& Description
Operating Condition
Comments
C-WW-PTR Pretreatment
Normal Summer Mode
• Grit tank 1 – out-of-service (5 days) • Grit tank 2 – out-of-service (1 day) • Grit tank 3 – out-of-service (13 day) • Grit tank 4 – out-of-service (31 days) • Grit tank 5 – out-of-service (31 days) • Screen 1 – out-of-service (5 days) • Screen 3 – out-of-service (12 days) • Screen 4 – out-of-service (31 days) • Screen 5 – out-of-service (31 days) • Screen 6 – out-of-service (28 days)
C-WW-SEC Secondary
Normal Summer Mode
• 10 bioreactors in service prior to spring run-off period (first 7 days of March); 11 bioreactors in service for remainder of month through spring run-off period; all operating in summer mode
• Bioreactor/Clarifier 5 – out-of-service (7 days) • Total Suspended Solids, Biochemical Oxygen
Demand and Nitrogen/Phosphorus Removal Processes (Nitrification and Denitrification) performed within Approval requirements
C-WW-SSP Sludge /Supernatant Piping
Normal • Supernatant Piping Systems and Decant Systems have been in service. Available system in full operation to return as much supernatant as possible.
C-WW-UTL Utilities
Normal
C-WW-WAS Waste Activated Sludge Thickening Facility
Normal
Prepared by Date Geoff Heise General Supervisor, Process Operations
April 23, 2008

Approval 639-02-00 Wastewater Treatment Monthly Operational Summary Prepared for Alberta Environment April 2008 Supervising Operators
• Geoff Heise • Ken Grossell
Level IV Operators • Ray Gale • Lonnie Waterhouse
Functional Location
& Description
Operating Condition
Comments
C-WW-BLD Buildings
Normal
C-WW-BYP Bypass
Normal • Seven (7) Secondary Bypass Events occurred greater than 2 hours in duration.
C-WW-CBF Clover Bar Biosolids Recycling Facility
Normal • 2008 Biosolids application to farmland to commence in May with an application target of 10,000 dry tones for the year.
C-WW-CEX Centre of Excellence
Normal
C-WW-DIG Digesters
Cleaning #6 • Digester 6 out-of-service (30 days) • High-efficiency flares out-of-service due to
construction activities to mitigate winter operation issues; stand-by flares in service
C-WW-DIS Disinfection
Normal • Disinfection process (as measured by Fecal Coliforms and E.coli) performed within Approval requirements.
C-WW-FER Fermentation
Out of Service • Blend Tanks and Fermenter will be out-of-service until upgrades are completed as part of the Fermenter Capital Project (Fall 2008)
C-WW-LAB Laboratory
Normal
C-WW-LAB-(Process Samplers) Laboratory
Normal • Final effluent sample on April 1 reported as estimated due to collection error.
C-WW-OUT Outfall
Normal
C-WW-PCS Process Control System
Normal
C-WW-PRI Primary
Normal Summer Mode
DRAINAGE SERVICES WASTEWATER TREATMENT SECTION 10977 – 50 STREET EDMONTON, AB T6A 2E9 FAX: (780) 496-4694
ASSET MANAGEMENT AND PUBLIC WORKS

Functional Location
& Description
Operating Condition
Comments
C-WW-PTR Pretreatment
Normal Summer Mode
• Grit tank 3 – out-of-service (14 days) • Grit tank 4 – out-of-service (30 days) • Grit tank 5 – out-of-service (30 days) • Screen 3 – out-of-service (14 days) • Screen 4 – out-of-service (13 days) • Screen 5 – out-of-service (30 days) • Screen 6 – out-of-service (13 days) • Screen 8 – out-of-service (2 days)
C-WW-SEC Secondary
Normal Summer Mode
• 10 bioreactors in service; all operating in summer mode
• Bioreactor/Clarifier 7 – out-of-service (27 days) for chain/flight replacement
• Total Suspended Solids, Biochemical Oxygen Demand and Nitrogen/Phosphorus Removal Processes (Nitrification and Denitrification) performed within Approval requirements
C-WW-SSP Sludge /Supernatant Piping
Normal • Supernatant Piping Systems and Decant Systems have been in service. Available system in full operation to return as much supernatant as possible.
C-WW-UTL Utilities
Normal
C-WW-WAS Waste Activated Sludge Thickening Facility
Normal
Prepared by Date Geoff Heise General Supervisor, Process Operations
May 26, 2008
Approval 639-02-07 Wastewater Treatment Monthly Operational Summary Prepared for Alberta Environment May 2008 Supervising Operators
• Geoff Heise • Ken Grossell
Level IV Operators • Ray Gale • Lonnie Waterhouse
Functional Location
& Description
Operating Condition
Comments
C-WW-BLD Buildings
Normal
C-WW-BYP Bypass
Normal • Four (4) Secondary Bypass Events occurred greater than 2 hours in duration.
C-WW-CBF Clover Bar Biosolids Recycling Facility
Normal • 2008 Biosolids application to farmland to commence in May with an application target of 10,000 dry tones for the year.
C-WW-CEX Centre of Excellence
Normal
C-WW-DIG Digesters
Cleaning #6 • Digester 6 out-of-service (31 days) • High-efficiency flares out-of-service due to
construction activities to mitigate winter operation issues; stand-by flares in service
C-WW-DIS Disinfection
Normal • Disinfection process (as measured by Fecal Coliforms and E.coli) performed within Approval requirements. Planned power outage on May 21 and 22. AENV report no’s 201184 and 201869.
C-WW-FER Fermentation
Out of Service • Blend Tanks and Fermenter will be out-of-service until upgrades are completed as part of the Fermenter Capital Project (Fall 2008)
C-WW-LAB Laboratory
Normal
C-WW-LAB-(Process Samplers) Laboratory
Normal
C-WW-OUT Outfall
Normal
C-WW-PCS Process Control System
Normal
C-WW-PRI Primary
Normal Summer Mode
DRAINAGE SERVICES WASTEWATER TREATMENT SECTION 10977 – 50 STREET EDMONTON, AB T6A 2E9 FAX: (780) 496-4694
ASSET MANAGEMENT AND PUBLIC WORKS

Functional Location
& Description
Operating Condition
Comments
C-WW-PTR Pretreatment
Normal Summer Mode
• Grit tank 2 – out-of-service (2 days) • Grit tank 3 – out-of-service (11 days) • Grit tank 4 – out-of-service (31 days) • Grit tank 5 – out-of-service (31 days) • Screen 3 – out-of-service (4 days) • Screen 4 – out-of-service (1 days) • Screen 5 – out-of-service (4 days) • Screen 6 – out-of-service (24 days)
C-WW-SEC Secondary
Normal Summer Mode
• 10 bioreactors in service; all operating in summer mode
• Bioreactor/Clarifier 7 – out-of-service (31 days) for chain/flight replacement
• Total Suspended Solids, Biochemical Oxygen Demand and Nitrogen/Phosphorus Removal Processes (Nitrification and Denitrification) performed within Approval requirements
C-WW-SSP Sludge /Supernatant Piping
Normal • Supernatant Piping Systems and Decant Systems have been in service. Available system in full operation to return as much supernatant as possible.
C-WW-UTL Utilities
Normal
C-WW-WAS Waste Activated Sludge Thickening Facility
Normal
Prepared by Date Geoff Heise General Supervisor, Process Operations
June 24, 2008

Approval 639-02-07 Wastewater Treatment Monthly Operational Summary Prepared for Alberta Environment June 2008 Supervising Operators
• Geoff Heise • Ken Grossell
Level IV Operators • Ray Gale • Lonnie Waterhouse
Functional Location
& Description
Operating Condition
Comments
C-WW-BLD Buildings
Normal
C-WW-BYP Bypass
Normal • Seven (7) Secondary Bypass Events occurred greater than 2 hours in duration.
C-WW-CBF Clover Bar Biosolids Recycling Facility
Normal • 2008 Biosolids application to farmland to commence in May with an application target of 10,000 dry tones for the year.
• Clover Bar pump house flooded. Some damage to equipment; however system was restored in <48 hours.
C-WW-CEX Centre of Excellence
Normal
C-WW-DIG Digesters
Cleaning #6 • Digester 6 out-of-service (30 days) • High-efficiency flares out-of-service due to
construction activities to mitigate winter operation issues; stand-by flares in service
C-WW-DIS Disinfection
Normal • Disinfection process (as measured by Fecal Coliforms and E.coli) performed within Approval requirements.
C-WW-FER Fermentation
Out of Service • Blend Tanks and Fermenter will be out-of-service until upgrades are completed as part of the Fermenter Capital Project (Spring 2009)
C-WW-LAB Laboratory
Normal
C-WW-LAB-(Process Samplers) Laboratory
Normal
C-WW-OUT Outfall
Normal • On June 15th, premature secondary bypass occurred prior to reaching 420 ML/day at outfall flow transmitter. Reported on July 8th to AENV ref no. 203406.
C-WW-PCS Process Control System
Normal
C-WW-PRI Primary
Normal Summer Mode
• Primary clarifiers 9 through 12 available for service as conventional primaries to allow isolation of primaries 5 through 8 for gate
DRAINAGE SERVICES WASTEWATER TREATMENT SECTION 10977 – 50 STREET EDMONTON, AB T6A 2E9 FAX: (780) 496-4694
ASSET MANAGEMENT AND PUBLIC WORKS

Functional Location
& Description
Operating Condition
Comments
C-WW-PTR Pretreatment
Normal Summer Mode
• Grit tank 1 – out-of-service (3 days) • Grit tank 2 – out-of-service (2 days) • Grit tank 3 – out-of-service (16 days) • Grit tank 4 – out-of-service (30 days) • Grit tank 5 – out-of-service (30 days) • Screen 1 – out-of-service (2 days) • Screen 2 – out-of-service (2 days) • Screen 3 – out-of-service (10 days) • Screen 6 – out-of-service (27 days)
C-WW-SEC Secondary
Normal Summer Mode
• 9 bioreactors in service due to summer Preventative Maintenance Program; all operating in summer mode
• Bioreactor/Clarifier 3 – out-of-service (18 days) • Bioreactor/Clarifier 7 – out-of-service (30 days)
for chain/flight replacement • Total Suspended Solids, Biochemical Oxygen
Demand and Nitrogen/Phosphorus Removal Processes (Nitrification and Denitrification) performed within Approval requirements
C-WW-SSP Sludge /Supernatant Piping
Normal • Supernatant Piping Systems and Decant Systems have been in service. Available system in full operation to return as much supernatant as possible.
C-WW-UTL Utilities
Normal
C-WW-WAS Waste Activated Sludge Thickening Facility
Normal
Prepared by Geoff Heise General Supervisor, Process Operations

Approval 639-02-07 Wastewater Treatment Monthly Operational Summary Prepared for Alberta Environment July 2008 Supervising Operators
• Geoff Heise • Ken Grossell
Level IV Operators • Ray Gale • Lonnie Waterhouse
Functional Location
& Description
Operating Condition
Comments
C-WW-BLD Buildings
Normal
C-WW-BYP Bypass
Normal • Eleven (11) Secondary Bypass Events occurred greater than 2 hours in duration. Two (2) instances of Plant Bypass occurred. Plant bypass on July 8th due to premature spillage over static bypass weir, AENV release report no. 203838.
C-WW-CBF Clover Bar Biosolids Recycling Facility
Normal • 2008 Biosolids application to farmland to commence in May with an application target of 10,000 dry tones for the year.
C-WW-CEX Centre of Excellence
Normal
C-WW-DIG Digesters
Cleaning #6 • Digester 6 out-of-service (31 days) • South candlestick flare in service. North flare
offline. C-WW-DIS Disinfection
Normal • Disinfection process (as measured by Fecal Coliforms and E.coli) performed within Approval requirements.
C-WW-FER Fermentation
Out of Service • Blend Tanks and Fermenter will be out-of-service until upgrades are completed as part of the Fermenter Capital Project (Spring 2009)
C-WW-LAB Laboratory
Normal
C-WW-LAB-(Process Samplers) Laboratory
Normal
C-WW-OUT Outfall
Normal
C-WW-PCS Process Control System
Normal
DRAINAGE SERVICES WASTEWATER TREATMENT SECTION 10977 – 50 STREET EDMONTON, AB T6A 2E9 FAX: (780) 496-4694
ASSET MANAGEMENT AND PUBLIC WORKS

Functional Location
& Description
Operating Condition
Comments
C-WW-PRI Primary
Normal Summer Mode
• Primary clarifiers 9 through 12 available for service as conventional primary clarifiers. Partially treated sewage released to new EPT outfall on July 9th due to primaries 5 through 8 out of service for gate installation. AENV release report no. 203433.
C-WW-PTR Pretreatment
Normal Summer Mode
• Grit tank 1 – out-of-service (1 day) • Grit tank 3 – out-of-service (22 days) • Grit tank 4 – out-of-service (31 days) • Grit tank 5 – out-of-service (31 days) • Screen 1 – out-of-service (1 day) • Screen 3 – out-of-service (19 days) • Screen 4 – out-of-service (2 days) • Screen 6 – out-of-service (5 days) • Release of partially treated sewage to outfall
due to Grit 3 out of service for heavy rain event on July 5th. AENV release report no. 203228.
C-WW-SEC Secondary
Normal Summer Mode
• 9 bioreactors in service due to summer Preventative Maintenance Program; all operating in summer mode
• Bioreactor/Clarifier 3 – out-of-service (24 days) • Bioreactor/Clarifier 5 – out-of-service (6 days) • Bioreactor/Clarifier 7 – out-of-service (31 days)
for chain/flight replacement • Total Suspended Solids, Biochemical Oxygen
Demand and Nitrogen/Phosphorus Removal Processes (Nitrification and Denitrification) performed within Approval requirements
C-WW-SSP Sludge /Supernatant Piping
Normal • Supernatant Piping Systems and Decant Systems have been in service. Available system in full operation to return as much supernatant as possible.
C-WW-UTL Utilities
Normal
C-WW-WAS Waste Activated Sludge Thickening Facility
Normal
Prepared by Geoff Heise General Supervisor, Process Operations

Approval 639-02-07 Wastewater Treatment Monthly Operational Summary Prepared for Alberta Environment August 2008 Supervising Operators
• Geoff Heise • Ken Grossell
Level IV Operators • Ray Gale • Lonnie Waterhouse
Functional Location
& Description
Operating Condition
Comments
C-WW-BLD Buildings
Normal
C-WW-BYP Bypass
Normal • Five (5) Secondary Bypass Events occurred greater than 2 hours in duration.
C-WW-CBF Clover Bar Biosolids Recycling Facility
Normal • 2008 Biosolids application to farmland to commence in May with an application target of 10,000 dry tones for the year.
C-WW-CEX Centre of Excellence
Normal
C-WW-DIG Digesters
Cleaning #6 • Digester 6 out-of-service (31 days) • South candlestick flare available for service.
North flare in-service. C-WW-DIS Disinfection
Normal • Disinfection process (as measured by Fecal Coliforms and E.coli) performed within Approval requirements. Planned power outage on Aug 18 and 19; AENV release report no’s 204914 and 205112.
C-WW-FER Fermentation
Out of Service • Blend Tanks and Fermenter will be out-of-service until upgrades are completed as part of the Fermenter Capital Project (Spring 2009)
C-WW-LAB Laboratory
Normal
C-WW-LAB-(Process Samplers) Laboratory
Normal
C-WW-OUT Outfall
Normal
C-WW-PCS Process Control System
Normal
DRAINAGE SERVICES WASTEWATER TREATMENT SECTION 10977 – 50 STREET EDMONTON, AB T6A 2E9 FAX: (780) 496-4694
ASSET MANAGEMENT AND PUBLIC WORKS
Functional Location
& Description
Operating Condition
Comments
C-WW-PRI Primary
Normal Summer Mode
• Primary clarifiers 9 through 12 available as conventional primary clarifiers.
C-WW-PTR Pretreatment
Normal Summer Mode
• Grit tank 2 – out-of-service (2 days) • Grit tank 3 – out-of-service (31 days) • Grit tank 4 – out-of-service (31 days) • Grit tank 5 – out-of-service (31 days) • Grit tank 6 – out-of-service (22 days) • Screen 3 – out-of-service (31 days)
C-WW-SEC Secondary
Normal Summer Mode
• 9 bioreactors in service due to summer Preventative Maintenance Program; all operating in summer mode
• Bioreactor/Clarifier 2 – out-of-service (13 days) • Bioreactor/Clarifier 5 – out-of-service (31 days) • Bioreactor/Clarifier 7 – out-of-service (15 days)
for chain/flight replacement • Total Suspended Solids, Biochemical Oxygen
Demand and Nitrogen/Phosphorus Removal Processes (Nitrification and Denitrification) performed within Approval requirements
C-WW-SSP Sludge /Supernatant Piping
Normal • Supernatant Piping Systems and Decant Systems have been in service. Available system in full operation to return as much supernatant as possible.
C-WW-UTL Utilities
Normal
C-WW-WAS Waste Activated Sludge Thickening Facility
Normal
Prepared by Geoff Heise General Supervisor, Process Operations

Approval 639-02-07 Wastewater Treatment Monthly Operational Summary Prepared for Alberta Environment September 2008 Supervising Operators
• Geoff Heise • Ken Grossell
Level IV Operators • Ray Gale • Lonnie Waterhouse
Functional Location
& Description
Operating Condition
Comments
C-WW-BLD Buildings
Normal
C-WW-BYP Bypass
Normal • Two (2) Secondary Bypass Events occurred greater than 2 hours in duration.
C-WW-CBF Clover Bar Biosolids Recycling Facility
Normal • 2008 Biosolids application to farmland to commence in May with an application target of 10,000 dry tones for the year.
C-WW-CEX Centre of Excellence
Normal
C-WW-DIG Digesters
Cleaning #6 • Digester 6 out-of-service (31 days) • South candlestick flare available for service.
North flare in-service. C-WW-DIS Disinfection
Normal • Disinfection process (as measured by Fecal Coliforms and E.coli) performed within Approval requirements.
C-WW-FER Fermentation
Out of Service • Blend Tanks and Fermenter will be out-of-service until upgrades are completed as part of the Fermenter Capital Project (Spring 2009)
C-WW-LAB Laboratory
Normal
C-WW-LAB-(Process Samplers) Laboratory
Normal
C-WW-OUT Outfall
Normal
C-WW-PCS Process Control System
Normal
DRAINAGE SERVICES WASTEWATER TREATMENT SECTION 10977 – 50 STREET EDMONTON, AB T6A 2E9 FAX: (780) 496-4694
ASSET MANAGEMENT AND PUBLIC WORKS
Functional Location
& Description
Operating Condition
Comments
C-WW-PRI Primary
Normal Summer Mode
• Primary clarifiers 9 through 12 available as conventional primary clarifiers.
C-WW-PTR Pretreatment
Normal Summer Mode
• Grit tank 3 – out-of-service (30 days) • Grit tank 4 – out-of-service (24 days) • Grit tank 5 – out-of-service (30 days) • Grit tank 6 – out-of-service (19 days) • Grit tank 7 – out-of-service (11 days) • Screen 3 – out-of-service (30 days)
C-WW-SEC Secondary
Normal Summer Mode
• 9 bioreactors in service due to summer Preventative Maintenance Program; all operating in summer mode
• Bioreactor/Clarifier 1 – out-of-service (1 day) • Bioreactor/Clarifier 2 – out-of-service (27 days) • Bioreactor/Clarifier 3 – out-of-service (1 day) • Bioreactor/Clarifier 4 – out-of-service (11 days) • Bioreactor/Clarifier 5 – out-of-service (14 days) • Bioreactor/Clarifier 10 – out-of-service (2 days) • Total Suspended Solids, Biochemical Oxygen
Demand and Nitrogen/Phosphorus Removal Processes (Nitrification and Denitrification) performed within Approval requirements
C-WW-SSP Sludge /Supernatant Piping
Normal • Supernatant Piping Systems and Decant Systems have been in service. Available system in full operation to return as much supernatant as possible.
C-WW-UTL Utilities
Normal
C-WW-WAS Waste Activated Sludge Thickening Facility
Normal
Prepared by Geoff Heise General Supervisor, Process Operations

Approval 639-02-07 Wastewater Treatment Monthly Operational Summary Prepared for Alberta Environment October 2008 Supervising Operators
• Geoff Heise • Ken Grossell
Level IV Operators • Ray Gale • Lonnie Waterhouse
Functional Location
& Description
Operating Condition
Comments
C-WW-BLD Buildings
Normal
C-WW-BYP Bypass
Normal • One (1) Secondary Bypass Event occurred greater than 2 hours in duration.
C-WW-CBF Clover Bar Biosolids Recycling Facility
Normal • 2008 Biosolids application to farmland to commence in May with an application target of 10,000 dry tones for the year. Target exceeded.
C-WW-CEX Centre of Excellence
Normal
C-WW-DIG Digesters
Cleaning #6 • Digester 6 out-of-service (31 days) • South candlestick flare available for service.
North flare in-service. C-WW-DIS Disinfection
Normal • Disinfection process (as measured by Fecal Coliforms and E.coli) performed within Approval requirements.
C-WW-FER Fermentation
Out of Service • Blend Tanks and Fermenter will be out-of-service until upgrades are completed as part of the Fermenter Capital Project (Spring 2009)
C-WW-LAB Laboratory
Normal
C-WW-LAB-(Process Samplers) Laboratory
Normal
C-WW-OUT Outfall
Normal
C-WW-PCS Process Control System
Normal
DRAINAGE SERVICES WASTEWATER TREATMENT SECTION 10977 – 50 STREET EDMONTON, AB T6A 2E9 FAX: (780) 496-4694
ASSET MANAGEMENT AND PUBLIC WORKS

Functional Location
& Description
Operating Condition
Comments
C-WW-PRI Primary
Normal
C-WW-PTR Pretreatment
Normal Summer Mode
• Grit tank 3 – out-of-service (31 days) • Grit tank 4 – out-of-service (31 days) • Grit tank 5 – out-of-service (31 days) • Grit tank 7 – out-of-service (31 days) • Screen 3 – out-of-service (31 days)
C-WW-SEC Secondary
Normal Summer Mode
• 9 bioreactors in service due to summer Preventative Maintenance Program; all operating in summer mode
• Bioreactor/Clarifier 1 – out-of-service (7 day) • Bioreactor/Clarifier 4 – out-of-service (24 days) • Bioreactor/Clarifier 8 – out-of-service (13 days) • Total Suspended Solids, Biochemical Oxygen
Demand and Nitrogen/Phosphorus Removal Processes (Nitrification and Denitrification) performed within Approval requirements
C-WW-SSP Sludge /Supernatant Piping
Normal • Supernatant Piping Systems and Decant Systems have been in service. Available system in full operation to return as much supernatant as possible.
C-WW-UTL Utilities
Normal
C-WW-WAS Waste Activated Sludge Thickening Facility
Normal
Prepared by Geoff Heise General Supervisor, Process Operations

Approval 639-02-07 Wastewater Treatment Monthly Operational Summary Prepared for Alberta Environment November 2008 Supervising Operators
• Geoff Heise • Ken Grossell
Level IV Operators • Ray Gale • Brian Schneider
Functional Location
& Description
Operating Condition
Comments
C-WW-BLD Buildings
Normal
C-WW-BYP Bypass
Normal • No Secondary Bypass Events occurred greater than 2 hours in duration.
C-WW-CBF Clover Bar Biosolids Recycling Facility
Normal
C-WW-CEX Centre of Excellence
Normal
C-WW-DIG Digesters
Cleaning #6 • Digester 6 out-of-service (31 days) • South candlestick flare available for service.
North flare in-service. C-WW-DIS Disinfection
Normal • Disinfection process (as measured by Fecal Coliforms and E.coli) performed within Approval requirements.
C-WW-FER Fermentation
Out of Service • Blend Tanks and Fermenter will be out-of-service until upgrades are completed as part of the Fermenter Capital Project (Spring 2009)
C-WW-LAB Laboratory
Normal
C-WW-LAB-(Process Samplers) Laboratory
Normal
C-WW-OUT Outfall
Normal
C-WW-PCS Process Control System
Normal
DRAINAGE SERVICES WASTEWATER TREATMENT SECTION 10977 – 50 STREET EDMONTON, AB T6A 2E9 FAX: (780) 496-4694
ASSET MANAGEMENT AND PUBLIC WORKS

Functional Location
& Description
Operating Condition
Comments
C-WW-PRI Primary
Normal
C-WW-PTR Pretreatment
Normal Summer Mode
• Grit tank 3 – out-of-service (31 days) • Grit tank 4 – out-of-service (31 days) • Grit tank 5 – out-of-service (31 days) • Grit tank 7 – out-of-service (31 days) • Screen 3 – out-of-service (12 days) • Screen 4 – out-of-service (26 days) • Screen 5 – out-of-service (26 days) • Screen 6 – out-of-service (26 days)
C-WW-SEC Secondary
Normal Summer Mode
• 10 bioreactors in service; all operating in summer mode
• Bioreactor/Clarifier 1 – out-of-service (24 days) • Bioreactor/Clarifier 7 – out-of-service (7 days) • Total Suspended Solids, Biochemical Oxygen
Demand and Nitrogen/Phosphorus Removal Processes (Nitrification and Denitrification) performed within Approval requirements
C-WW-SSP Sludge /Supernatant Piping
Normal • Supernatant Piping Systems and Decant Systems have been in service. Available system in full operation to return as much supernatant as possible.
C-WW-UTL Utilities
Normal
C-WW-WAS Waste Activated Sludge Thickening Facility
Normal
Prepared by Geoff Heise General Supervisor, Process Operations
Approval 639-02-07 Wastewater Treatment Monthly Operational Summary Prepared for Alberta Environment December 2008 Supervising Operators
• Geoff Heise • Ken Grossell
Level IV Operators • Ray Gale • Brian Schneider
Functional Location
& Description
Operating Condition
Comments
C-WW-BLD Buildings
Normal
C-WW-BYP Bypass
Normal • No Secondary Bypass Events occurred greater than 2 hours in duration.
C-WW-CBF Clover Bar Biosolids Recycling Facility
Normal
C-WW-CEX Centre of Excellence
Normal
C-WW-DIG Digesters
Cleaning #6 • Digester 6 out-of-service (31 days) • South candlestick flare available for service.
North flare not in-service due to freeze-up issues.
C-WW-DIS Disinfection
Normal • Disinfection process (as measured by Fecal Coliforms and E.coli) performed within Approval requirements.
C-WW-FER Fermentation
Out of Service • Blend Tanks and Fermenter will be out-of-service until upgrades are completed as part of the Fermenter Capital Project (Spring 2009)
C-WW-LAB Laboratory
Normal
C-WW-LAB-(Process Samplers) Laboratory
Normal
C-WW-OUT Outfall
Normal
C-WW-PCS Process Control System
Normal
DRAINAGE SERVICES WASTEWATER TREATMENT SECTION 10977 – 50 STREET EDMONTON, AB T6A 2E9 FAX: (780) 496-4694
ASSET MANAGEMENT AND PUBLIC WORKS

Functional Location
& Description
Operating Condition
Comments
C-WW-PRI Primary
Normal
C-WW-PTR Pretreatment
Normal Summer Mode
• Grit tank 2 – out-of-service (31 days) • Grit tank 4 – out-of-service (31 days) • Grit tank 5 – out-of-service (31 days) • Grit tank 7 – out-of-service (31 days) • Screen 2 – out-of-service (31 days) • Screen 4 – out-of-service (31 days) • Screen 5 – out-of-service (31 days) • Screen 6 – out-of-service (31 days)
C-WW-SEC Secondary
Normal Summer Mode
• 10 bioreactors in service; all operating in summer mode
• Bioreactor/Clarifier 4 – out-of-service (13 days) • Bioreactor/Clarifier 7 – out-of-service (28 days) • Failure of Blower 1 and 4 due to electrical feed
issue; returned to service in one week. • Failure of Blower 6 due to starter/PLC
communication issue. Major rebuild required. • Total Suspended Solids, Biochemical Oxygen
Demand and Nitrogen/Phosphorus Removal Processes (Nitrification and Denitrification) performed within Approval requirements
C-WW-SSP Sludge /Supernatant Piping
Normal • Supernatant Piping Systems and Decant Systems have been in service. Available system in full operation to return as much supernatant as possible.
C-WW-UTL Utilities
Normal
C-WW-WAS Waste Activated Sludge Thickening Facility
Normal
Prepared by Geoff Heise General Supervisor, Process Operations

Collection Date Collected By Sampling Site Problem Action Taken
31-Jan KG MPW
Less than 1 L collected because carboy was not lined up under nozzle properly.
Sample results reported as NS (no sample) and SAP written to add a bracket to back of fridge door to keep carboy in correct position.
1-Apr CM FEC
Sampler was restarted and somehow carboy's ended up in wrong position. In morning, sampling into Tuesday instead of Wednesday, which already had 8 L and Tuesday had only 5L. Sample for 01 & 02 were mixed.
Sample from both carboys were mixed together and registered as Tuesday April 1 sample and all results were reported as estimates. Nonconformance report completed.
July 24-25 n/a RawSampling suspended because of sampling for Gold Bar Model Development Testing. none
25-Jul n/a PESampling suspended because of sampling for Gold Bar Model Development Testing. none
Aug 30-31 SJ RawSampler plugged
none, Sampler was left plugged until MH returned Sep 2, 2008 when he unplugged it. Non-conformance report filled out.
12-Aug BN/KG PE
Sample chamber's wing nuts not tightened properly, vacuum too weak because of improper seal.
KG investigated and tightened wing nuts, MH filled out non-conformance Sept 2, 2008
Aug 14-28 n/a MPWSampler shutdown for maintenance in Membrane Water Plant.
No samples taken until notified by Brad Salter that sampler had been re-activated.
26-Sep BN Raw Sampler arm mis-aligned KG re-aligned arm, non-conformance reported and NS recorded.
13-Sep ES PE
Sample chamber's wing nuts not tightened properly, vacuum too weak because of improper seal.
ES investigated and tightened wing nuts, non-conformance reported, NS recorded.
Nov 8 to Nov 12 Various RawRefrigerator leaked refrigerant, sample temperature too high.
Informed Brad Salter and he had repaired. Estimated results for the 5 days.
26-Nov MH PEPower outage caused clock to be out. Samples mixed on Nov 27th. Restarted sampler.
18-Nov BN FEC
Low sample volume. Maintenance installed a hose that was too short to reach FEC supply.
Replaced hose immediately, told BN to insure hoses labelled properly. Enough sample was collected for it to be considered representative.
4-Nov BN MPW
Sample temperature too high, fridge turned off for defrosting.
Non-conformance written, samples to be reported as estimates, techs doing defrosting will create reminders to insure fridge is turned back on as soon as possible.
GOLD BAR WASTEWATER TREATEMENT PLANTTable 3. 2008 SAMPLER NON-CONFORMANCE SUMMARY

Name Title WWT Certification Level
Corkery,Vince M Director, Wastewater Treatment IV
Heise,Geoffry R General Supervisor, Process Operations I
Grossell,Ken M Operations Coordinator III
Gale,Ray E WWTP Foreman-Certified IV
Schneider,Brian P WWTP Foreman-Certified IV
Paszkiewicz,Marek WWTP Foreman-Uncertified III
Kerr,David A WWTP Foreman-Uncertified III
Feltmate,Colleen J WWTP Foreman-Uncertified III
Graham,Thomas A WWTP Operator IV
Rindero,Billy J WWTP Operator III
Jones,Kira I WWTP Operator III
Kwan,Tom WWTP Operator III
Blatz,Kevin M WWTP Operator III
Barrett,Jeremy L WWTP Operator III
Mota,Ricardo L WWTP Operator II
Dawson,Terena M WWTP Operator II
Mann,Kelly WWTP Operator II
Ropchan,Ross M WWTP Operator II
Li,Bing BL WWTP Operator II
Gurney,Roger S WWTP Operator II
Marcinek,David A WWTP Operator II
Holman,Kenneth E WWTP Operator II - Restricted
Burton,Morley WWTP Operator I
Budden,Curt W WWTP Operator I
Kingdon,Craig N WWTP Operator I
Resler,Kenny A WWTP Operator I - Restricted
Hillaby,Greg WWTP Operator I - Restricted
Atkinson,Mike W WWTP Operator In-Training
Espinosa,Diego F WWTP Operator In-Training
Table 4. 2008 List of Certified Wastewater Treatment Operators

Chemical Name Alum Caustic Soda (Bagged) Citric Acid Hydrogen Peroxide Liquid Nitrogen Polymer Sodium Bisulfite Softner Salt
Chemical Formula Al2(SO4)3•14H2O NaOH C6H8O7 H2O2 N2 Zetag 7689 / 8180 NaHSO3 NaCl
Chemical Supplier Univar ClearTech Industries Inc.
ClearTech Industries Inc. US Peroxide LLC Air Liquide Canada
Inc.CIBA Specialty
ChemicalsClearTech
Industries Inc.ClearTech
Industries Inc.ClearTech
Industries Inc.Various-City
Stores Inventory
Purpose Used/Dosage point
Phosphate trimming in secondary effluent / Mixed liquor channel to secondary clarifier
Chemical cleaning of sludge lines
Odour Control - pH adjustment / Odour Control Facilties
Membrane cleaning - pH adjustment / Membrane tanks
Chemical cleaning of ultrafiltration membranes - reverses inorganic fouling / Membrane tanks
Odour Control - oxidizes H2S / Plant Influent Channels 1 and 2
Purging of biogas system / Digester Headspace and biogas piping
Flocculating agent for Waste Activated Sludge (WAS) / Dissolved Air Flotation Thickening Facility
Chlorine neutralizing agent for ultrafiltration membrane cleaning / Membrane tanks
East Scrubber: Odour Control - oxidizes of H2S / Odour Control Facilities
A. Chemical cleaning of ultrafiltration membranes - reverses biofouling of membranes / Membrane tanks
B. Maintain chlorine residual in product water distribution to Strathcona County / Contact tanks
Water Softening for Odour Control Chemical Solution / Odour Control Facilities
Concentration Used 48.5%50% NaOH -
diluted with H2O and heated
50% 50% by Weight 100%0.25% to 0.35% (introduced as
solution)38 to 44% Dry Weight
Feed Rate
Used when efffluent
phosphate concentration >0 5 mg/L P
Applied Sparingly as required Intermittent Intermittent Continuous Feed Continuous Feed Continuous Feed Intermittent Intermittent Intermittent
Minimum 8 mg/L 500 kg/day N/A Function of Sulphide Loading
Function of Product Water
flow
Function of Sulphide Loading
Maximum 100 mg/L 2000 kg/day As controlled by feed equipment
Controlled by PID loop and PLC
controlled
Controlled by PID loop and PLC
controlled
Controlled by P D loop and PLC
controlledTotal Used Total Used Total Used Total Used Total Used Total Used Total Used Total Used Total Used Total Used Total Used Total Used
Scrubbers Membrane Scrubbers Membranelitres kg litres litres litres kg sm3 kg litres litres litres kg
January 82,665 814 8 52 123 2,172 0 8,830 5,399 1,080
February 126,057 1,628 13 218 1,724 5,000 1,841 1 4,511 5,743 700
March 240,039 1,091 153 439 1,682 2,199 0 5,525 8,823 1,540
April 239,396 45.0 1,850 25 64 3,093 2,281 2 9,180 3,999 1,180
May 240,648 972 404 86 100 2,071 310 11,931 8,738 1,040
June 354,695 1,184 45 46 2,565 374 12,369 12,254 440
July 332,415 2,294 148 88 2,361 2,052 34 13,122 17,098 400
August 175,800 2,442 221 185 2,596 2,004 188 9,899 9,948 1,040
September 194,208 74 213 707 4,117 2,044 191 14,350 12,078 300
October 60,248 360.0 962 383 644 18,969 680 1,883 0 13,215 7,995 620
November 269,071 592 496 1,690 7,154 3,217 320 2,431 15,169 240
December 160,765 216 267 142 2,343 6 7,592 11,532 80
2008 - Annual Total 2,476,007 405 13,903 2,325 4,486 42,061 5,680 26,672 1,426 112,955 118,776 8,660
Months
16%
Sodium Hypochlorite
NaOCl
50%
Caustic Soda (Liquid)
NaOH
ClearTech Industries Inc.
TABLE 6. 2008 EFFLUENT TOXICITY (Samples collected on May 5th, September 3rd and November 26th, 2008)
Type of Analysis Acute Chronic
Microtox All LC50 @ 48 hours > 100% (Non-toxic)
Daphnia magna All LC50 @ 48 hours > 100% (Non-toxic)
Rainbow Trout All LC50 @ 48 hours > 100% (Non-toxic)
Ceriodaphnia dubia Survival: All LC50 @ 7 days >100% Growth: All IC50 @ 7 days >100%
Fathead minnows Survival: All LC50 @ 7 days >100% Growth: All IC50 @ 7 days >100%
Number of Sample 3 3

FLOW Total Alkalinity Ammonia
Biochemical Oxygen Demand
Chemical Oxygen Demand
Chloride Conductivity Fecal Coliforms E Coli pH Total
Coliforms
Total Suspended
Solids
Dissolved Organic Carbon
Total Phosphorus
Total Dissolved
SolidsTurbidity
(ML) (mg CaCO3/L) (mg N/L) (mg/L) (mg/L) (mg Cl-/L) (μS/cm) (CFU/100mL) (MPN/100mL) (pH) (CFU/100mL) (mg/L) (mg/L) (mg P/L) (mg/L) (NTU)Avg 3 19 134 1 14 0 6 18 95 870 2 --- 7 91 27 < 0 2 6 74 0 250 517 0 27Max 3 40 152 4 59 1 8 26 109 937 17 --- 8 10 196 0 6 7 24 0 571 566 0 52Min 2 70 125 0 021 0 2 6 77 803 < 1 --- 7 58 < 1 < 0 2 6 13 0 065 387 < 0 14Avg 2 81 127 0 178 1 6 23 123 960 1 --- 7 86 16 < 0 2 6 78 0 542 593 0 23Max 3 83 131 0 909 2 3 25 384 1790 5 --- 8 04 220 0 6 7 22 1 61 1030 0 39Min 0 90 121 0 025 1 1 19 67 781 < 1 --- 7 45 < 1 < 0 2 6 56 0 146 477 0 15Avg 3 80 111 0 224 1 6 23 121 932 2 --- 7 76 25 < 0 3 7 08 0 445 569 0 31Max 6 50 145 0 842 2 3 25 221 1260 21 --- 7 97 198 0 6 7 66 1 09 710 0 69Min 2 00 88 <0 005 0 8 22 71 793 < 1 --- 7 42 < 1 < 0 3 6 09 0 164 494 0 15Avg 2 96 98 0 161 1 6 23 101 896 3 --- 7 73 9 < 0 3 7 79 0 377 562 0 29Max 3 30 108 0 618 2 4 27 235 1300 60 --- 8 14 92 0 6 8 03 1 02 788 0 74Min 2 50 91 <0 005 1 1 19 70 798 < 1 --- 6 95 < 1 < 0 3 7 59 0 148 484 0 17Avg 2 76 140 1 03 1 2 23 76 976 --- 3 7 80 --- < 0 3 8 15 0 508 641 0 28Max 3 50 172 11 1 1 6 28 88 1100 --- 52 7 98 --- 0 6 10 1 1 28 739 0 53Min 1 70 111 0 033 0 9 16 65 746 --- < 1 7 32 --- < 0 3 7 01 0 088 464 0 18Avg 2 61 119 0 646 0 9 27 69 959 --- 8 7 82 --- 0 3 8 86 0 528 641 0 36Max 3 20 134 4 90 1 5 29 75 1060 --- >200 7 99 --- 1 5 9 35 2 17 720 0 90Min 2 10 99 0 009 0 2 24 59 844 --- < 1 7 58 --- < 0 3 8 35 0 092 566 < 0 14Avg 3 32 117 0 172 0 8 27 72 916 --- < 1 7 80 --- 0 3 8 10 0 219 611 0 79Max 4 50 139 1 93 1 7 29 92 999 --- 1 8 02 --- 1 1 8 81 0 637 707 1 17Min 2 50 102 <0 005 0 0 21 57 779 --- < 1 7 39 --- < 0 3 7 74 0 029 522 0 41Avg 1 74 127 0 035 0 5 48 67 828 --- 13 7 79 --- < 0 3 7 55 0 217 523 0 91Max 4 30 149 0 086 1 2 66 97 954 --- 200 8 06 --- 0 6 7 70 0 713 607 1 86Min 0 00 104 0 009 0 2 21 44 638 --- < 1 7 34 --- < 0 3 7 40 0 025 395 0 29Avg 2 33 140 0 701 0 0 19 72 795 --- 7 7 88 --- < 0 3 6 77 0 072 507 0 30Max 3 00 155 2 80 0 1 21 84 848 --- 165 8 27 --- 0 6 8 61 0 242 565 1 12Min 1 50 113 0 025 0 0 16 45 660 --- < 1 7 54 --- < 0 3 5 02 0 017 405 0 15Avg 3 86 155 0 103 0 8 41 71 800 --- < 1 7 87 --- 0 3 7 03 0 057 507 0 72Max 6 40 169 0 609 2 9 59 82 841 --- 1 8 30 --- 4 6 7 27 0 126 539 3 89Min 2 50 145 <0 005 0 0 5 61 762 --- < 1 7 50 --- < 0 3 6 89 0 015 474 0 16Avg 6 43 137 0 276 1 0 48 71 798 --- 3 7 86 --- < 0 3 7 30 0 063 500 0 22Max 7 60 165 1 24 2 5 60 89 853 --- 66 8 00 --- 0 4 8 39 0 204 536 0 48Min 3 74 112 0 028 0 0 19 61 764 --- < 1 7 70 --- < 0 3 6 23 0 011 463 0 00Avg 8 34 141 1 80 1 9 29 104 939 --- 40 7 87 --- < 0 3 7 15 0 087 575 0 23Max 10 60 178 10 3 2 3 61 328 1650 --- 590 8 02 --- 0 4 7 93 0 493 973 0 40Min 4 00 109 0 032 1 5 15 61 775 --- < 1 7 65 --- < 0 3 6 21 0 040 465 0 15Avg 3 68 128 0 570 1 0 29 87 892 2 9 7 83 20 < 0 3 7 42 0 285 564 0 39Max 10 60 178 11 1 2 9 66 384 1790 60 590 8 30 220 4 6 10 1 2 17 1030 3 89Min 0 00 88 <0 005 0 0 5 44 638 < 1 < 1 6 95 < 1 < 0 3 5 02 0 011 387 < 0 14
GOLD BAR WASTEWATER TREATEMENT PLANT
August
January
February
March
April
Month
Annual Summary
Table 7. 2008 EFFLUENT REUSE QUALITY
September
October
November
December
May
June
July
Notes: 1) Average calculated as a weighted average with the results at detection as included in the average as one-half the detection limits 2) NTU – Nephelometric turbidity units 3) CFU/100mL – Colony forming units per 100 mL of sample 4) ML – Megaliters (1,000,000 liters)

TABLE 8: 2008 SUMMARY OF GOLD BAR WASTEWATER LABORATORY PROFICIENCY TESTING
Study Date BOD C-BOD TSS NH3-N TP E. Coli
mm/yy
PT
Sco
re
Avg
. Z-S
core
PT
Sco
re
Avg
. Z-S
core
PT
Sco
re
Avg
. Z-S
core
PT
Sco
re
Avg
. Z-S
core
PT
Sco
re
Avg
. Z-S
core
PT
Sco
re
Avg
. Z-S
core
CALA 03/08 71 1.944VH Pilot 1.545 85 0.988 95 0.483 93 0.482 82 1.186L
CMPT 04/08 A 0.243
ARC #13 09/08 A 1.317
CALA 10/08 79 1.390H Pilot 1.612 92 0.536 88 0.816 93 0.476 82 1.217H
ARC #15 10/08 A 1.380 A 0.912
CMPT 10/08 A 0.227
ARC #16 11/08 A -0.311 A 0.772
PT Score > 70 acceptable. VH – Very high bias, H – High bias, L – Low bias, A – Acceptable, Q – Questionable, U – Unsatisfactory CALA – Canadian Association for Laboratory Accreditation ARC – Alberta Research Council CMPT – Clinical Microbiology Proficiency Testing BOD – 5-day Biological Oxygen Demand, C-BOD - 5-day Carbonaceous Biological Oxygen Demand, TSS – Total Suspended Solids, NH3-N – Ammonia as Nitrogen, TP – Total Phosphorous.
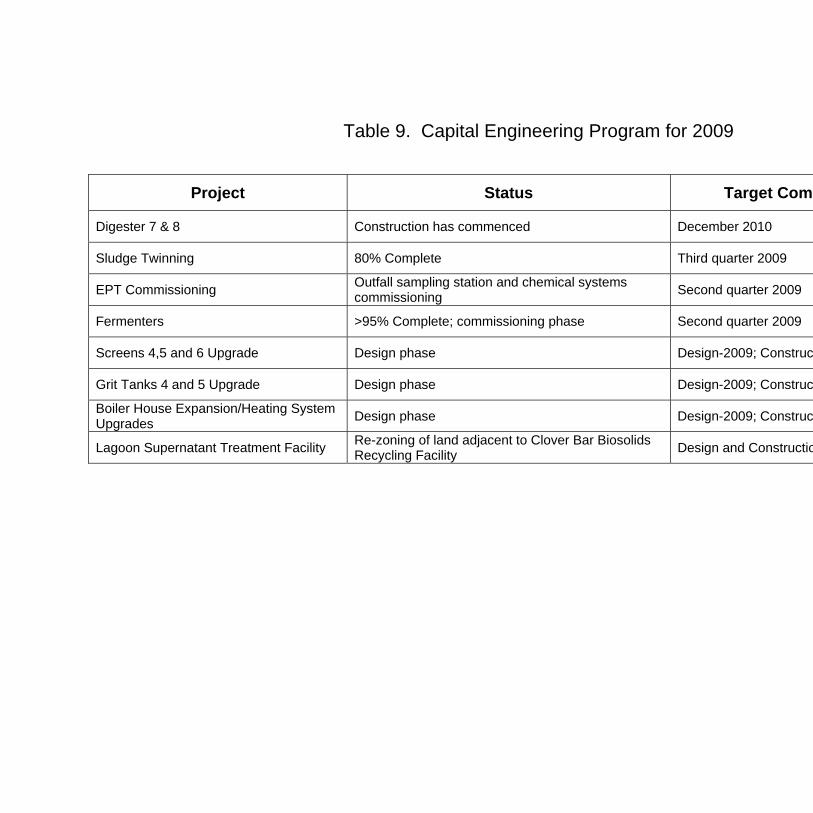
Table 9. Capital Engineering Program for 2009
Project Status Target Completion Date
Digester 7 & 8 Construction has commenced December 2010
Sludge Twinning 80% Complete Third quarter 2009
EPT Commissioning Outfall sampling station and chemical systems commissioning Second quarter 2009
Fermenters >95% Complete; commissioning phase Second quarter 2009
Screens 4,5 and 6 Upgrade Design phase Design-2009; Construction-2010 to 2011
Grit Tanks 4 and 5 Upgrade Design phase Design-2009; Construction-2010 to 2011
Boiler House Expansion/Heating System Upgrades Design phase Design-2009; Construction-2010 to 2011
Lagoon Supernatant Treatment Facility Re-zoning of land adjacent to Clover Bar Biosolids Recycling Facility Design and Construction-2010 to 2011