Embed Size (px)
Citation preview

PhysicsAndMathsTutor.com

EDEXCEL STATISTICS S3 (6685) – JUNE 2002 PROVISIONAL MARK SCHEME Question Number Scheme Marks
1. (a) Stratified B1 (1)
(b) Label De-luxe rooms 1 – 20 B1
Using random numbers in range 1 – 20 select 2 rooms B1 B1
Repeat for Premier using 1 – 40 and select 4 rooms Repeat for Standard using 1 – 100 and select 10 rooms
B1 (4)
(5 marks)
2. (a) H0 : µA = µB H1: µA ≠ µB B1 B1
standard error = =+120
4.8100
1.9 22
1.19 (awrt) M1 A1
α = 0.01 ⇒ CR: z < − 2.5758 or z > 2.5758 B1 need both
z = 19.1
2.676.70 − = 2.86 (awrt)
M1 A1
Since 2.86 is in the critical range, H0 is rejected. There is evidence of a difference in mean playing time. A1ft (8)
(b) Central Limit Theorem applies to enable normal distribution to be used. B1 (1)
(9 marks)
3. (a) M ~ N (80, 106.2 2
) or N (80, 0.676) B1 B1 (2)
(b) P ( M < 78.5) = P (z < 10/6.2805.78 − ) M1
= P (z < −1.82) A1
= 0.0344 A1 (3)
(c) Let W = weight of all 10 people
W = M1 + … + M6 + F1 + … +F4
E(W) = (6 × 80) + (4 × 59) = 716 B1
Var(W) = (6 × 2.62 ) + (4 × 1.92 ) = 55 B1
P(W > 730) = P (z > 55
716730 − ) M1 A1
= P (z > 1.89)
= 0.0294 A1 (5)
(10 marks)
awrt = “anything which rounds to…”
1
EDEXCEL STATISTICS S3 (6685) – JUNE 2002 PROVISIONAL MARK SCHEME Question Number Scheme Marks
4. (a)
M1
Σd2 = 70 M1 A1
rs = 1 − 9910706×× = 0.576 M1 A1 (5)
(b) H0: ρ = 0; H1: ρ ≠ 0 B1 B1
n = 10 ⇒ critical value = 0.5636 B1
0.576 is in the critical region M1
Evidence of correlation between performance and dedication. A1ft (5)
(c) Likely to be an element of judgement in grading. Dedication unlikely to be normally distributed. B1 (1)
(11 marks)
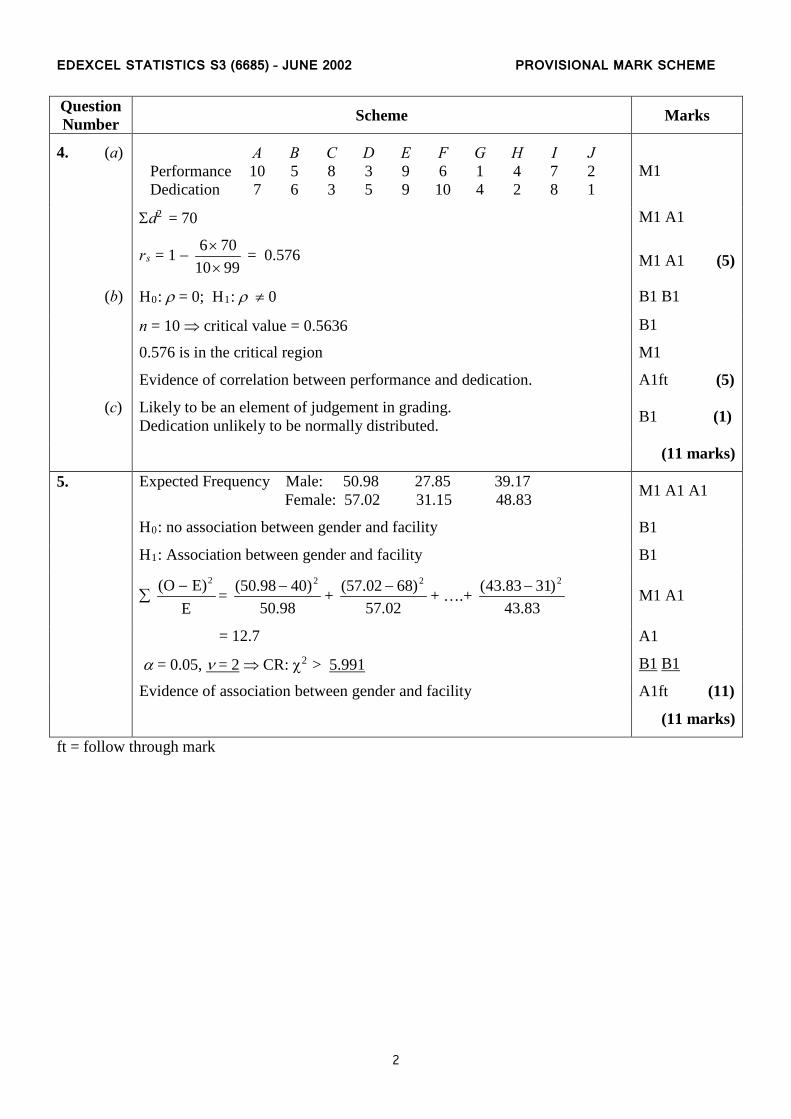
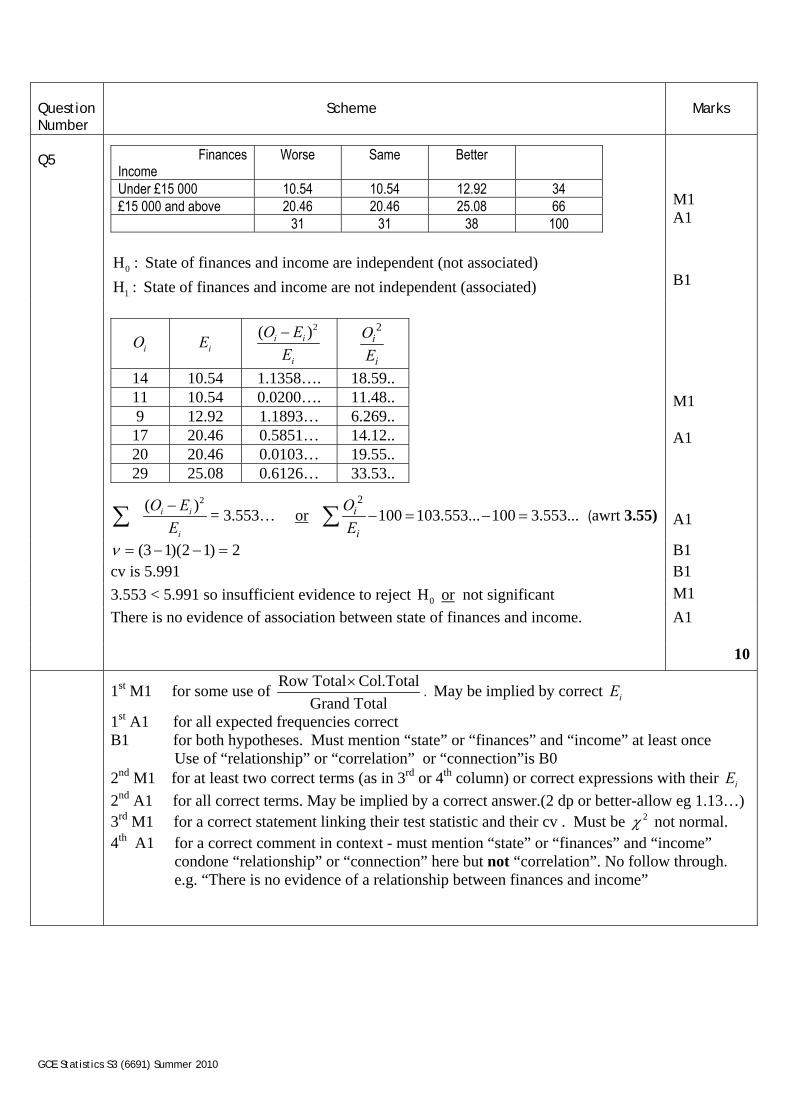
5. Expected Frequency Male: 50.98 27.85 39.17 Female: 57.02 31.15 48.83 M1 A1 A1
H0: no association between gender and facility B1
H1: Association between gender and facility B1
∑
EE)(O 2− =
98.50)4098.50( 2− +
02.57)6802.57( 2− + ….+
83.43)3183.43( 2− M1 A1
= 12.7 A1
α = 0.05, ν = 2 ⇒ CR: χ2 > 5.991 B1 B1
Evidence of association between gender and facility A1ft (11)
(11 marks)
ft = follow through mark
A B C D E F G H I J Performance 10 5 8 3 9 6 1 4 7 2 Dedication 7 6 3 5 9 10 4 2 8 1
2
EDEXCEL STATISTICS S3 (6685) – JUNE 2002 PROVISIONAL MARK SCHEME Question Number Scheme Marks
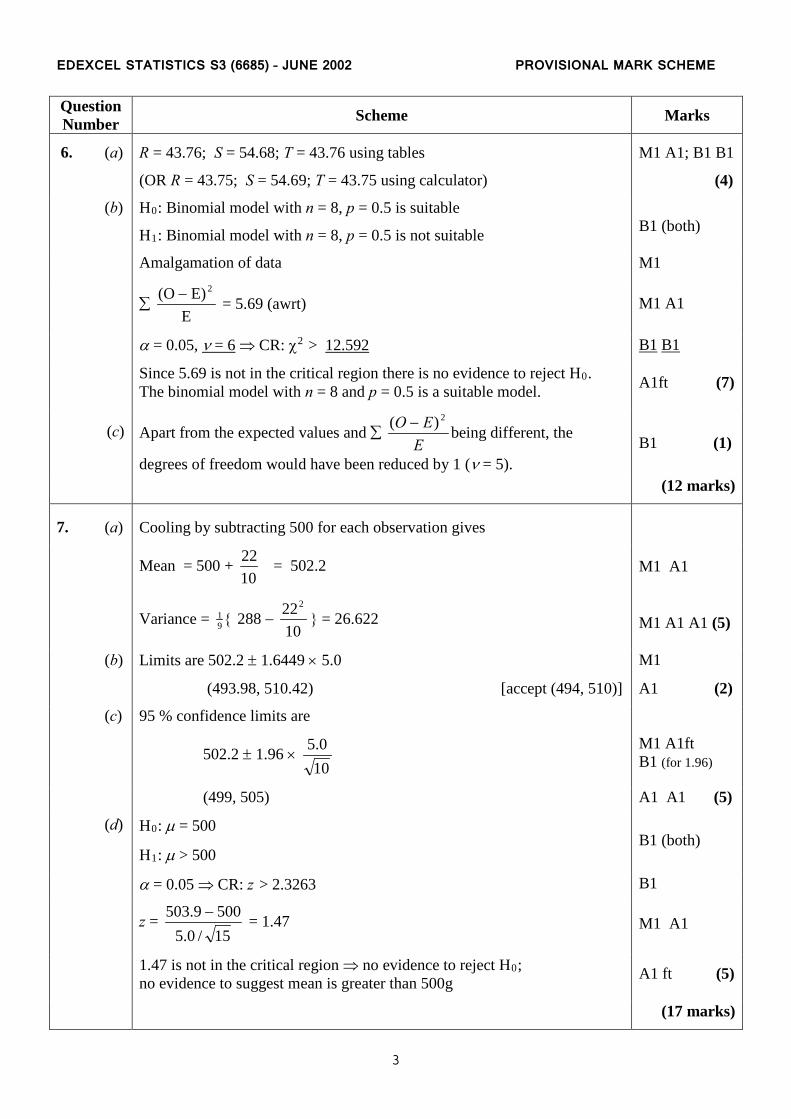
6. (a) R = 43.76; S = 54.68; T = 43.76 using tables
(OR R = 43.75; S = 54.69; T = 43.75 using calculator)
M1 A1; B1 B1
(4)
(b) H0: Binomial model with n = 8, p = 0.5 is suitable
H1: Binomial model with n = 8, p = 0.5 is not suitable B1 (both)
Amalgamation of data M1
∑
EE)(O 2− = 5.69 (awrt) M1 A1
α = 0.05, ν = 6 ⇒ CR: χ2 > 12.592 B1 B1
Since 5.69 is not in the critical region there is no evidence to reject H0. The binomial model with n = 8 and p = 0.5 is a suitable model. A1ft (7)
(c) Apart from the expected values and ∑
EEO 2)( − being different, the
degrees of freedom would have been reduced by 1 (ν = 5). B1 (1)
(12 marks)
7. (a) Cooling by subtracting 500 for each observation gives
Mean = 500 +
1022 = 502.2 M1 A1
Variance = 9
1 { 288 − 10222
} = 26.622 M1 A1 A1 (5)
(b) Limits are 502.2 ± 1.6449 × 5.0 M1
(493.98, 510.42) [accept (494, 510)] A1 (2)
(c) 95 % confidence limits are
502.2 ± 1.96 × 100.5
M1 A1ft B1 (for 1.96)
(499, 505) A1 A1 (5)
(d) H0: µ = 500
H1: µ > 500 B1 (both)
α = 0.05 ⇒ CR: z > 2.3263 B1
z =
15/0.55009.503 − = 1.47 M1 A1
1.47 is not in the critical region ⇒ no evidence to reject H0; no evidence to suggest mean is greater than 500g A1 ft (5)
(17 marks)
3

EDEXCEL STATISTICS S3 (6685) – JUNE 2003 PROVISIONAL MARK SCHEME
Question number
Scheme Marks
1. (a) (b) 2. (a) (b)
Take a (simple) random sample from (mutually exclusive) groups of the population 1g/1h B1 Sample sizes within strata in strict proportion to numbers in each strata in the population B1 Advantage: More accurate estimate of variance of population mean Individual estimates for strata available Any one B1 Disadvantage: Difficult if strata are large Definition of strata problematic (may overlap) Any one B1
(4) Non-random sampling B1 from groups of the population B1dep Advantage: Representative sample can be achieved with small sample size Cheap (costs kept to a minimum) Administration relatively easy Any one (not quick) B1 Disadvantage Not possible to estimate sampling errors due to lack of randomness Judgment of interviewer can affect choice of sample – bias OK Non-response not recorded Difficulties of defining controls e.g. social class Any one B1
(4)
X ~ N (124, 202) or X ~ (124, 30202
or assume σ 2 estimated by s2 or CLT, vals. B1,B1
202.5758 124 2.575830
xnσ
± = ± 2.5758, formula + attempt, all correct&2.58,2.576 B1M1A1
124 9.405= ± (115,133)= 3 sf A1
(6) 140 is not in confidence interval M1 Underweight apples chosen or Sample may not be representative/may be biased Any one A1∫
(2)
8
8

EDEXCEL STATISTICS S3 (6685) – JUNE 2003 PROVISIONAL MARK SCHEME
Question number
Scheme Marks
3. (a) (b) (c) 4.
E(X-Y)=20-10=10 Require minus, 10 M1A1
(2) Var(X-Y)=5+4=9 Require plus, 9 M1A1
(2) X-Y N(10,9) Implied B1∫ P(13<X-Y<16)=P(X-Y<16)-P(X-Y<13) Subtract M1
16-10 13-10P(Z< ) P(Z< )
3 3= − Standardise M1
P(Z<2) P(Z<1)= − 2&1 A1 0.9772 0.8413 0.1359= − = 0.1359 A1
(5)
0H :Taking drug and catching a cold are independent (not associated) B1
1H :Taking drug and catching a cold are not independent ( associated) (not ditto) both B1
All totals B1
RT CT
EGT
×= M1A1A1
2( )O EE−∑ =2.53 (NB with Yates 2.09) attempt & add, awrt 0.766 & 0.5 twice, awrt 2.53 M1A1A1
211, (5%) 3.841 2.53ν χ= = > 1, 3.841 B1,B1
No reason to believe that the chance of catching a cold is affected by taking the new drug A1∫
9
11
Cold Not Cold Drug 34 (39.5) 66 (60.5) 100
Dummy 45 (39.5) 55 (60.5) 100 79 121 200
O E E
EO 2)( −
34 39.5 0.766 66 60.5 0.5 45 39.5 0.765 55 60.5 0.5

EDEXCEL STATISTICS S3 (6685) – JUNE 2003 PROVISIONAL MARK SCHEME
Question number
Scheme Marks
5 6 (a) (b)
and a bµ µ are mean weight of population after and before closure respectively. B1
0
1
H : H :
b a
b a
µ µµ µ
=>
B1B1
2 2
10 82.64 1.94100 120
z −=
+ Fraction, denom Ok alone M1A1M1A1
2 6.290.1011
z = = awrt 6.29 A1
Critical region is 1.6449, 6.29>1.6449z ≥ or in critical region or Reject 0H 1.6449 B1, M1
(or P(Z 6.29) 0,0 0.05≥ = < or z in critical region or Reject 0H B1M1)
There is evidence that closing the factory has reduced mean river pollution A1∫ (11)
d M1 2d∑ M1A1
6 4618 63sr×
= −×
M1A1∫
0.452sr = 0.452 A1 (6)
0 1H : 0, H : 0( 0)ρ ρ ρ= ≠ > B1B1 critical values are 0.7381 (0.6429)± 0.7381(0.6429) B1 0.452<0.7381 (0.452<0.6429) or not sig or Insufficient evidence to reject 0H M1
No agreement between the two judges. Context A1∫ (5)
11
11
A 2 5 3 7 8 1 4 6 B 3 2 6 5 7 4 1 8 |d| 1 3 3 2 1 3 3 2 d2 1 9 9 4 1 9 9 4 46

EDEXCEL STATISTICS S3 (6685) – JUNE 2003 PROVISIONAL MARK SCHEME
Question number
Scheme Marks
7 (a) (b) (c) (d) (e)
0.3 50 0.2 10 0.5 2 18µ = × + × + × = M1A1 2 2 2 2 2(0.3 50 0.2 10 0.5 2 ) 18 448σ = × + × + × − = M1A1
(4) (50,50) or (50,50) without ordered pairs (10,2) (10,2)
(2,10) (10,10) (10,10) (50,10) (50,10) (2,2) (10,50) (50,2) (2,2) (50,2)
(2,50) either, -1 each missing pair B2 (2)
All means, probabs muiltiplied, -1 each error B1 M1 A2 (4)
P(2 7) 025 0.2 0.45X≤ < = + = Probabilities of 2 and 6 added, 0.45 M1 A1∫ (2)
E( ) 2 0.25 6 0.2..... 18X = × + × = P( )x X x∑ = from table, 18 M1 A1 2 2 2Var( ) 2 0.25 6 0.2 ..... 18 224X = × + × + − = 2P( )x X x∑ = - 2(theirs) , 224 M1A1
So 21E( ) 18 and Var( ) 2242
X Xµ σ= = = = as required. A1
(5)
17
x 2 6 10 26 30 50
P( xX = ) 0.25 0.2 0.04 0.3 0.12 0.09
EDEXCEL STATISTICS S3 (6685) – JUNE 2004 PROVISIONAL MARK SCHEME Question Number
Scheme
Marks
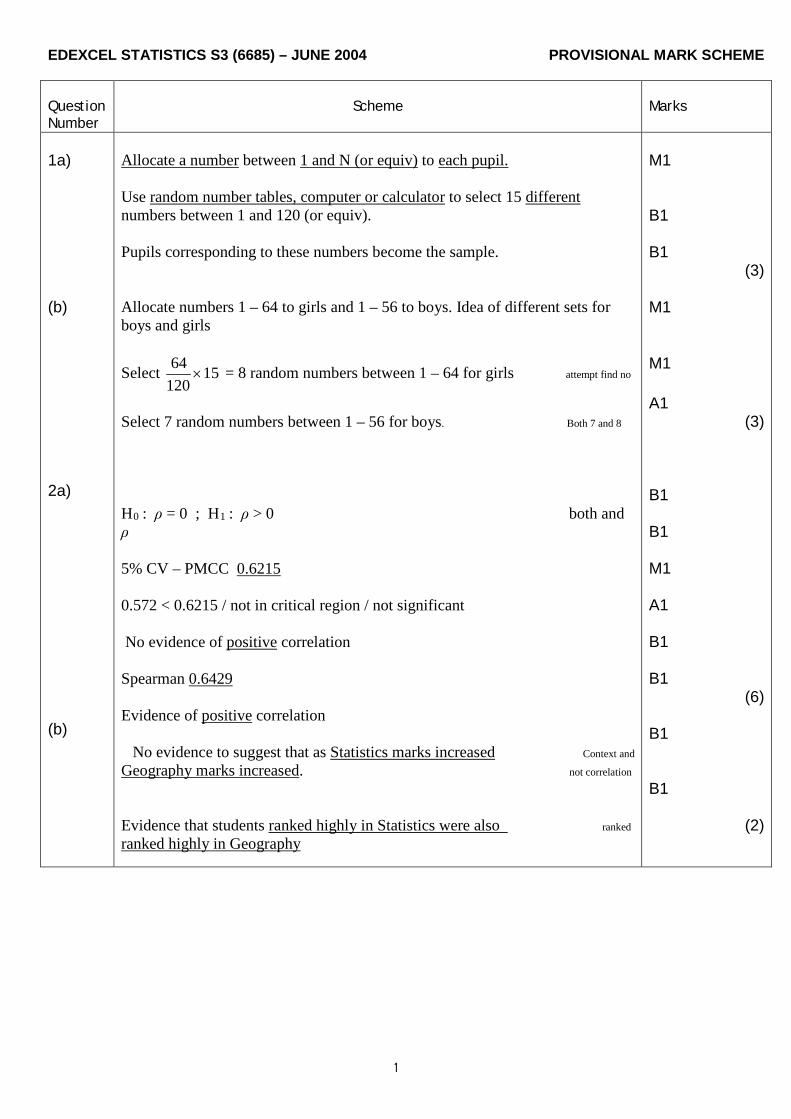
1a) (b) 2a) (b)
Allocate a number between 1 and N (or equiv) to each pupil. Use random number tables, computer or calculator to select 15 different numbers between 1 and 120 (or equiv). Pupils corresponding to these numbers become the sample. Allocate numbers 1 – 64 to girls and 1 – 56 to boys. Idea of different sets for boys and girls
Select 1512064
× = 8 random numbers between 1 – 64 for girls attempt find no
Select 7 random numbers between 1 – 56 for boys. Both 7 and 8
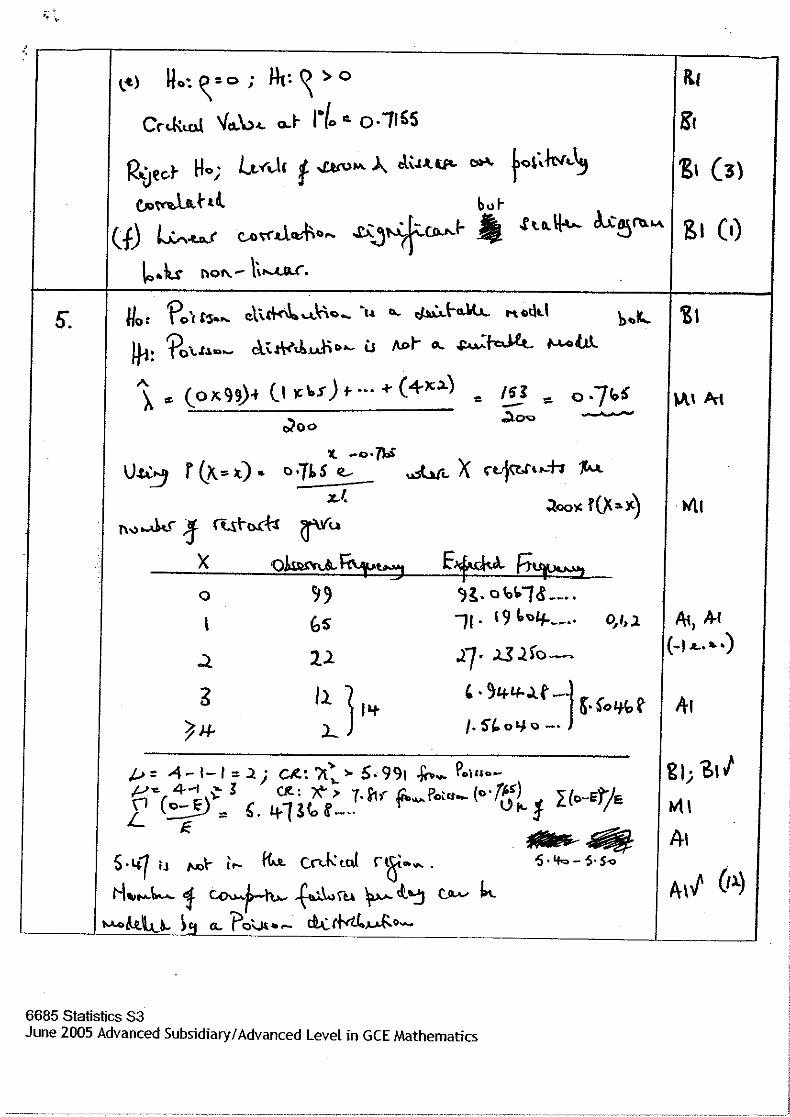
H0 : ρ = 0 ; H1 : ρ > 0 both and ρ 5% CV – PMCC 0.6215 0.572 < 0.6215 / not in critical region / not significant No evidence of positive correlation Spearman 0.6429 Evidence of positive correlation
No evidence to suggest that as Statistics marks increased Context and
Geography marks increased. not correlation Evidence that students ranked highly in Statistics were also ranked ranked highly in Geography
M1 B1 B1
(3)
M1 M1 A1
(3) B1 B1 M1 A1 B1 B1
(6) B1 B1
(2)
1

EDEXCEL STATISTICS S3 (6685) – JUNE 2004 PROVISIONAL MARK SCHEME Question Number
Scheme
Marks
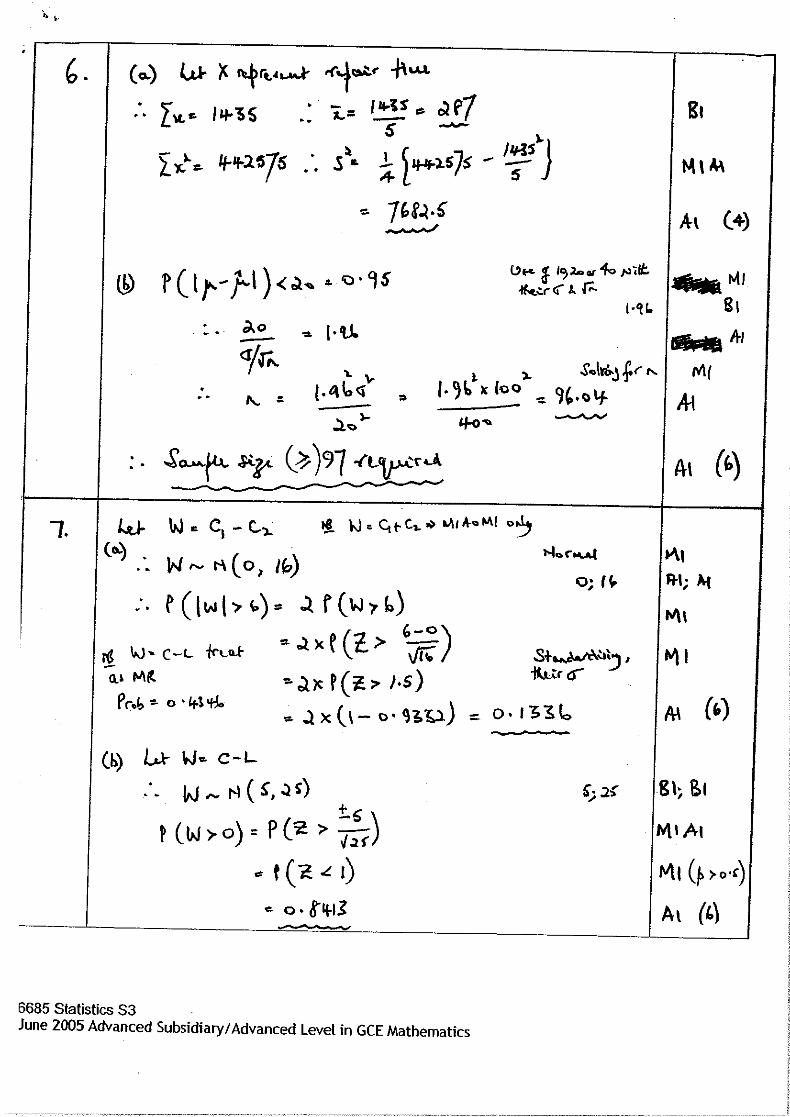
3a) b)
H0 : μA = μB ; H1 : μB > μA both and μ
z =
153.2
105.2
25124922
+
−±
Mfor 15
3.2102.5
accept 249,251
+
= ± 2.0227… awrt ± 2.02 CV = ± 1.6449 or P(Z ≥ 2.02) = 0.0212 – 0.0217, or P(Z ≤ 2.02) = 0.9788 – 0.9783
- 2.0227 < - 1.6449 or 2.0227 > 1.6449 , or 0.0212 – 0.0217 < 0.05 comparison and consistency needed or 0.9788 – 0.9783 > 0.95 There is evidence that the mean amount of coffee dispensed by B is greater than A. context Machine B amounts are normally distributed.
B1 M1 A1 A1 B1 M1 A1√
(7)
B1 (1)
2
EDEXCEL STATISTICS S3 (6685) – JUNE 2004 PROVISIONAL MARK SCHEME Question Number
Scheme
Marks
4a) b) c)
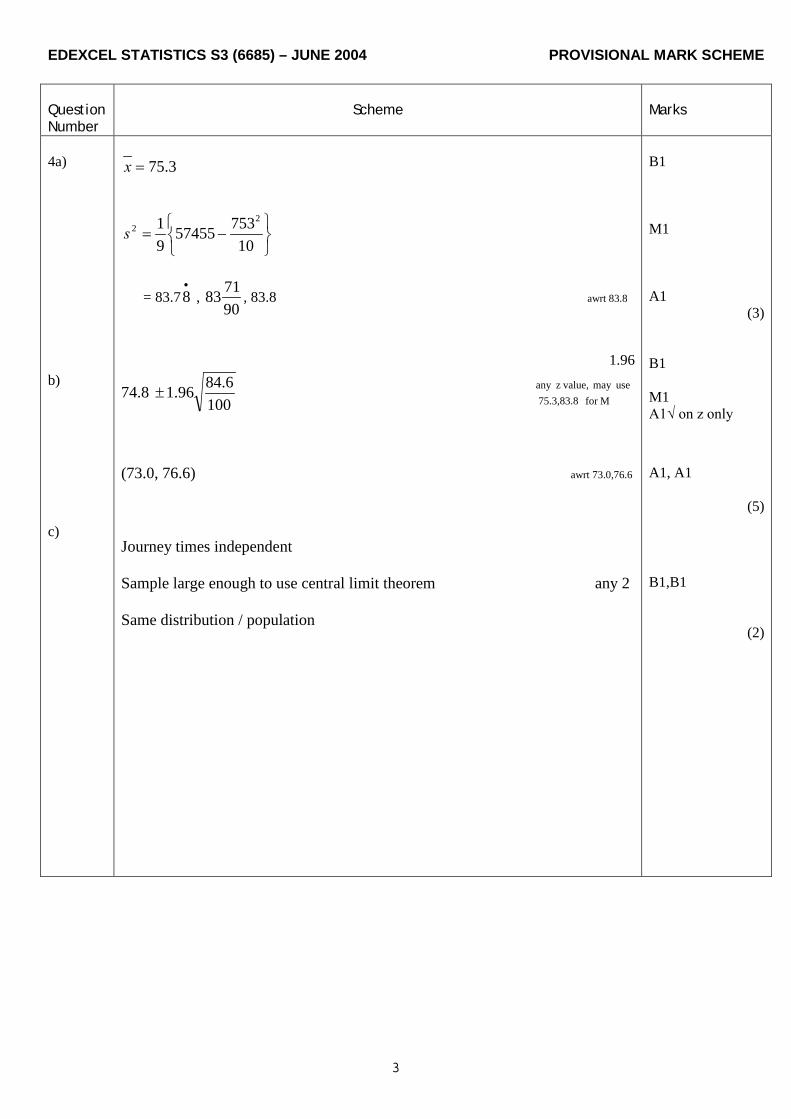
3.75=x
−=10
7535745591 2
2s
= 83.7•
8 , 907183 , 83.8 awrt 83.8
1.96
74.8 100
6.8496.1± Mfor 75.3,83.8 usemay value,zany
(73.0, 76.6) awrt 73.0,76.6
Journey times independent Sample large enough to use central limit theorem any 2 Same distribution / population
B1 M1 A1
(3)
B1 M1 A1√ on z only
A1, A1
(5)
B1,B1
(2)
3

EDEXCEL STATISTICS S3 (6685) – JUNE 2004 PROVISIONAL MARK SCHEME Question Number
Scheme
Marks
5.
Never Sometimes Regularly
Totals
Males 30 132 78 240
Females
26 143 91 260
56 275 169 500
H0 : No association (independent) between gender and exercise H1 : association (not independent) between gender and exercise Expected Values
Never
Sometimes Regularly
Totals
Males 26.88 132
81.12 240
Females
29.12 143
M1 convert % to freq A1 (26, 91, 30, 132)
A1 (143, 78) B1 B1 M1 A1 at least 3sf B1; B1√ M1 A1 A1√
(12)
4

EDEXCEL STATISTICS S3 (6685) – JUNE 2004 PROVISIONAL MARK SCHEME 87.88 260
56 275 169 500
α = 0.05 ν = 2 ; CV χ2 > 5.991 ( )
∑− ORE
EO 2
∑ =− 9271.02
NE
O answers in range 0.90 – 0.95
Not in critical region – no evidence of association between gender and exercise
5

EDEXCEL STATISTICS S3 (6685) – JUNE 2004 PROVISIONAL MARK SCHEME Question Number
Scheme
Marks
6a) b)
X~ B(3,1/6) bino
3, 1/6 X Prob Expected freq prob – must show working and use B(3,p) or may be
implied by correct answer
0 3
65
144.68 expected
1
×
61
653
2
86.81
2 2
61
653
× 17.36 awrt 145,86.8,17.4,1.15/1.16
3 3
61
1.15 (1.16)
H0 : Binomial model is a good fit both, no ditto H1 : Binomial model is not a good fit Amalgamate 3 with another group α = 0.01 ν = 2 ; CR χ2 > 9.210 ( )
∑− ORE
EO 2
∑ =− ...6894.82
NE
O
answers in range 8.67 – 8.70 or
Evidence that Binomial is a good model.
B1 B1
(2)
M1 M1 B2 (-1 ee) B1 M1 B1 ; B1√ M1 A1 A1√
(11)
6

EDEXCEL STATISTICS S3 (6685) – JUNE 2004 PROVISIONAL MARK SCHEME Question Number
Scheme
Marks
6.c)
Estimate p Degrees of freedom reduced by 1 Special case Use of B(3,0.192) in part (b) Expected frequencies 131.8785 94.01242 22.339 1.769 H0 : Binomial model is a good fit both, no ditto H1 : Binomial model is not a good fit Amalgamate 3 with another group α = 0.01 ν = 1 ; CR χ2 > 6.635 ( )
∑− ORE
EO 2
∑ − NE
O 2
in range 5.45 -5.50
Evidence that Binomial is a good model.
B1 B1
(2)
M1 M1 B0 B1 M1 B1 ; B1√ M1 A1 A1√
(11)
7

EDEXCEL STATISTICS S3 (6685) – JUNE 2004 PROVISIONAL MARK SCHEME Question Number
Scheme
Marks
7a) b)
E(D) = E(A) – 3E(B) + 4E(C) = 20 Var(D) = Var(A) + 9Var(B) + 16Var(C) Use of a2Var X
Adding 3 Var ie 4 +…
=341
P (D < 44) = P
−<
3412044z standardising their mean and sd
= P (z < 1.30) awrt 1.30 = 0.9032 E(X) = 20
Var (X) = Var (A) + 3Var(B) + 16 Var (C) + and 16
3 Var (B) = 287
P (X >0) = P
−>
28720z standardising their mean and sd
= P (z > - 1.18) awrt -1.18 = 0.8810
M1 A1 M1 M1 A1 M1, A1√ A1 A1
(9) B1 M1 M1 A1 M1 A1 A1
(7)
8


January 2006 6685 Statistics S3 Mark Scheme Question Number
Scheme
Marks
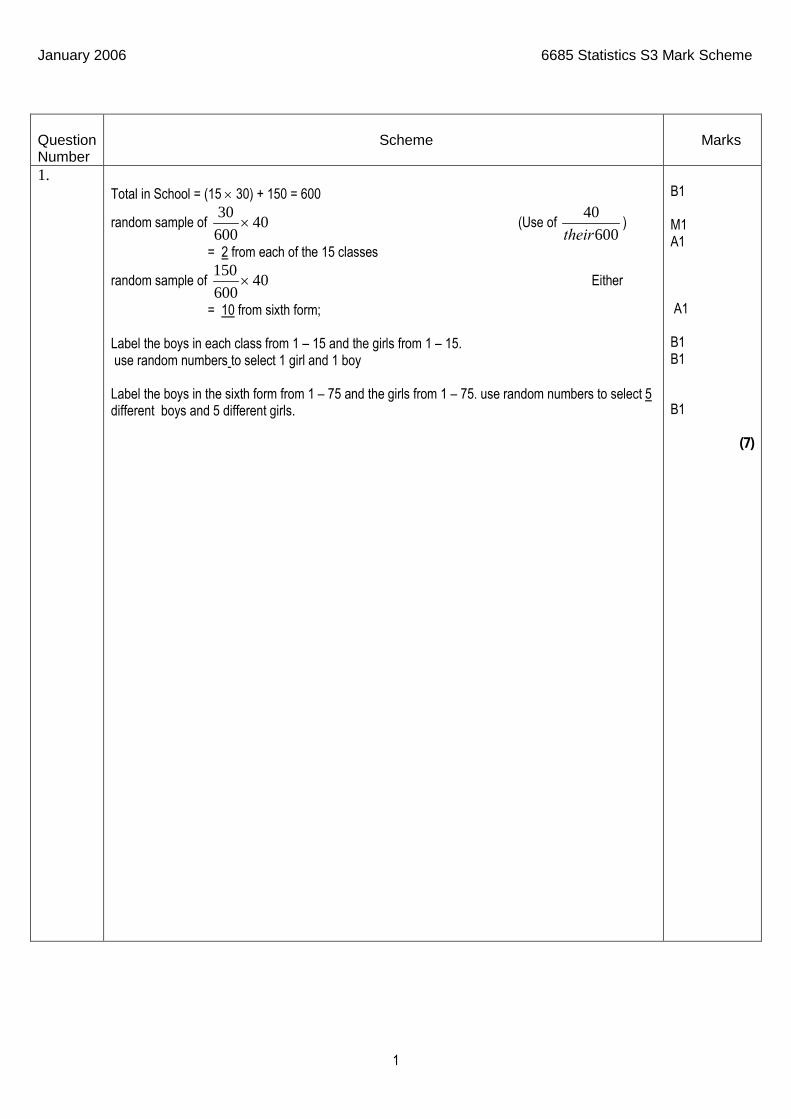
1.
Total in School = (15 × 30) + 150 = 600
random sample of 4060030
× (Use of 40600their
)
= 2 from each of the 15 classes
random sample of 40600150
× Either
= 10 from sixth form; Label the boys in each class from 1 – 15 and the girls from 1 – 15. use random numbers to select 1 girl and 1 boy Label the boys in the sixth form from 1 – 75 and the girls from 1 – 75. use random numbers to select 5 different boys and 5 different girls.
B1 M1 A1 A1 B1 B1 B1
(7)
1

Question Number
Scheme
Marks
2. (a) (b) (c)
E(R) = 20 + 10 = 30 Var(R) = 4 + 0.84, = 4.84 R ~ N(30, 4.84) (Use of normal with their (a),(b)) P(28.9 < R < 32.64) = P(R < 32.64) - P(R < 28.9)
= P
−
<22
306432.
.Z - P 28.9 302.2
Z − <
Stand their σ and μ
= P( Z < 1.2) - P(Z < - 0.5) = 0.8849 - ( 1 - 0.6915) Correct area = 0.8849 - 0. 3085 = 0.5764 ( accept AWRT 0.576)
B1 (1)
M1, A1
(2) B1ft M1 A1, A1 M1 A1
(6) 9
2

3. (a) (b) (c)
µ = 10
11070130150125901101409882 +++++++++
= 110.5
2σ = ( )251101012815391 .×− 128153
= 672.28 (AWRT 672) 95% confidence limits are (condone use of 5 instead of 25) (for 1.96)
110.51025961 ×± .
95% conf. lim. = AWRT(95, 126)
Number of intervals = 1510095
×
= 14.25 (Allow 14 or 14.3 if method is clear)
M1 A1 B1 M1 A1
(5) M1 B1 A1√ A1 A1
(5) M1 A1
(2) 12
3

4.
H0 : No association between gender and acceptance H1 : gender and acceptance are associated
Accept Not accept Total Males 170 (180) 110 (100) 280
Females 280 (270) 140 (150) 420 Totals 450 250 700
O
E
( )E
EO 2−
170 180 0.5556 110 100 1.0000 280 270 0.3704 140 150 0.6667
( )∑ −E
EO 2
= 2.59 (Yates’ 2.34) (Condone use of Yates’)
ν = 1; (5%) = 3.841 3.841 > 2.59. There is insufficient evidence to reject Ho There is no association between a persons gender and their acceptance (of the offer of a flu jab.)
B1 M1 A1
M1 A1 B1; B1 M1 A1√
(9)
9
Expected Values
4

5. (a) (b) (c)
µb = mean mark of boys, µg = mean mark of girls. H0 : µb = µg both H1 : µb ≠ µg
z =
80144
80144
5053
+
−
= 1.58 Critical region z ≥ 1.96 1.58 < 1.96 insufficient evidence to reject Ho. No diff. between mean scores of boys and girls. H0 : µb = µg H1 : µb < µg
z =
8036
8036
5962
+
−
= 3.16 Critical region z ≥ 1.6449 (accept 1.645) 3.16 > 1.6449 sufficient evidence to reject H0. the mean mark for boys is less than the mean mark of the girls. Girls have improved more than boys or girls performed better than boys after 1 year
B1 M1 A1 A1 B1 M1 A1
(7)
B1 M1 A1 B1 A1
(5) B1
(1)
13
5

6. (a)
(b) (c)
r = 27.07, s = 18.04, t = 0.11 using tables or 0.12 using totals Ho : A Poisson model Po(2) is a suitable model. both H1 : A Poisson model Po(2) is not a suitable model. Amalgamate data
( )∑ −E
EO 2
= 3.28 (awrt)
ν = 6 –1 =5
( )%525χ = 11.070 (follow through their degrees of freedom)
3.25 < 11.070 There is insufficient evidence to reject Ho, Po(2) is a suitable model.
The expected values, and hence ( )∑ −E
EO 2
would be different,
and the degrees of freedom would be 1 less.
M1 A1 B1 B1 ft
(4) B1 M1 M1 A1 B1 B1ft A1ft
(7) B1 B1 (2) 13
6

7. (a)
(b)
(c)
The variables cannot be assumed to be normally distributed
20-29 30-39 40-49 50-59 60-69 70+ Rank x 5 6 4 3 1 2 Rank y 6 5 4 1 3 2
d 1 1 0 2 2 0 2d 1 1 0 4 4 0
∑ = 102d (follow through their rankings)
( )16
1 2
2
−−= ∑
nnd
rs = 1 -21060 = 0.714 ( )5
7 or awrt 0.714
Ho : ρ = 0 H1 : ρ ≠ 0 (or ρ > 0) n = 6 ⇒ 5% critical value = 0.8857 (or 0.8286) 0.714 < 0.8857 No evidence to reject Ho; No evidence of correlation between deaths from pneumoconiosis and lung cancer.
B1 (1) M1 A1 dM1 (depends on ranking attempt) A1 ft M1 A1 (6) B1 B1 B1 M1 A1 (5) 12
7

June 2006 6691 Statistics S3
Mark Scheme


Mark Scheme (Results) Summer 2007
GCE
GCE Mathematics Statistics S3 (6691)
Edexcel Limited. Registered in England and Wales No. 4496750 Registered Office: One90 High Holborn, London WC1V 7BH

2
June 2007 6691 Statistics S3
Mark Scheme Question Scheme Marks number
1. (a) M1A1
A B C D E F G H P Rank 2 6 4 3 1 7 8 5 Q Rank 2 8 1 6 3 5 7 4
2d 0 4 9 9 4 4 1 1
2 32d =∑ M1A1
26 321
8 (8 1)Sr×
= −× −
M1
13 or AWRT 0.61921
= A1 (6)
(b) 0 1H : 0 H : 0ρ ρ= > ( sρ is OK) both B1 1 tail 5% critical value is 0.6429 (Independent of their ) B1 (Sr 1H + is OK) 0.619 < 0.6429 or not significant M1 So insufficient evidence of a positive correlation between judges Or competitor is justified A1f.t. (4) 10 (a) 1st M1 for attempting to rank both P and Q. 1st A1 for both correct (could be reversed) 2nd M1 for attempting 2d 2nd A1 for . 2 32d =∑ 3rd M1 for correct use of formula for Sr
(b) M1 for a correct comparison or statement about significance (o.e.)
Follow through their sr provided 0< sr <1
A1f.t. for a conclusion in context. Must mention judges or marks or competitor.
If they use correlation they must say it is positive.
Follow through their positive sr with their positive c.v. and ignore hypotheses.
So sr =0.667 they could say competitor’s claim is not justified etc.
S.C. No ranking Typical answer (-3.82) can get mark for use of sr formula and hypotheses in (b) only
(a) M0A0M0A0M1A0 (b) B1B1M0A0

3
Question Scheme Marks number
2. (a) Maths grades are independent of English grades 0H : or No association … Maths and English grades are dependent 1H : or There is an association … B1
Expected Frequencies e.g. 60 40 20120×
= M1 A1
2 2 2( ) 5 2.5 2.52
20 27.5 12.5O E
E⎛ ⎞−
= × + +⎜ ⎟⎜ ⎟⎝ ⎠
∑2
, = 3.9545… AWRT 3.95 or 3.955 M1, A1
22(3 1)(2 1) 2; (10%) c.v. =ν χ= − − = 4.605 B1; B1
3.95< 4.605 or not significant or do not reject (allow reject H ) M1 0H 1
Insufficient evidence of an association between English and maths grades or there is support for the Director’s belief A1 (9) or Student’s grades in maths and English are independent (b) May have some expected frequencies <5 (and hence need to pool rows/cols) B1 (1) 10 (a) 1st B1 for both hypotheses in terms of independence or association and in context.
Must mention Maths and English in at least one of the hypotheses.
“relationship” or “correlation” or “connection” or “link” is B0
1st M1 for some correct calculation seen
1st A1 for all expected frequencies correct. Accept answers without formula seen.
2nd M1 for some evidence seen of attempt to calculate test statistic.
At least one correct term seen. Follow through their expected frequencies.
2nd A1 for AWRT 3.95. Answers only please escalate!
3rd M1 for correct comparison or statement – may be implied by correct conclusion.
3rd A1 for conclusion in context using “association” or “independence” in connection with grades.
Don’t insist on seeing English or maths mentioned here.
Use ISW for comments if a false statement and correct statement are seen.
(b) B1 If they just say expected frequencies are “small” they must go onto mention need to pool.
20 27.5 12.520 27.5 12.5

4
Question Scheme Marks number
3. 0 1H : 18, H : 18µ µ= < B1, B1
16.5 18 , 1.9364...315
z −= = − AWRT – 1.94 M1, A1
5% one tail c.v. is z = (-) 1.6449 or probability (AWRT 0.026) (+) 1.6449 B1
- 1.94 < -1.6449 or significant or reject 0H or in critical region M1
There is evidence that the (mean) time to complete the puzzles has reduced
Or Robert is getting faster (at doing the puzzles) A1f.t.
7
1st & 2nd B1 must see ˜ and 18
1st M1 for attempting test statistic, allow + . Or attempt at critical value for X : 315
zµ − ×
1st A1 for AWRT – 1.94. Allow use of |z| = +1.94 to score M1A1. Or critical value = AWRT 16.7. 3rd B1 for AWRT 0.026 (i.e. correct probability only) or + 1.6449. (May be seen in cv formula) 2nd M1 for correct comparison or statement relating their test statistic and 1.6449 or their probability and 0.05. Ignore their hypotheses if any or assume they were correct.
2nd A1f.t. for conclusion in context which refers to “speed” or “time”. Depends only on previous M

5
Question Scheme Marks number
4. (a) 0 17 1 31 ... 200 217 31 ... 100× + × + ⎛ ⎞= =⎜ ⎟+ + ⎝ ⎠
, 2ˆ 0.120
p = = (Accept 202 or 2 per 20) M1, A1 (2)
(b) e.g. M1 ( ) ( )2 120100 0.1 0.9
2r ⎛ ⎞= ×⎜ ⎟
⎝ ⎠
8
r = 28.5, s = AWRT 9 A1, A1 (3)
(c)
Pooling M1
( )2O EE−
=∑ AWRT 9.4 M1A1c.a.o.
B1ft, B1ft 235 2 3, (5%) 7.815v χ= − = =
Binomial distribution is a good/suitable model/fit [Condone: B(20, 0.1) is…] 0H :
Binomial distribution is not a suitable model both B1 1H :
(Significant result) Binomial distribution is not a suitable model A1cao (7)
(d) defective items do not occur independently or not with constant probability B1ft (1)
13
(a) M1 for attempt to find mean or (as printed or better). The 0.1 must be seen in part (a). p
(b) M1 for correct expression for r or s using the binomial distribution. Follow through their . p
(c) 1st M1 for some pooling (accept x > 5, obs.freq. …14, 9, 10 and exp.freq. 19.0, s, 4.3)
2nd M1 for calculation of test statistic (N.B. x > 5 gives 14.5). One correct term seen.
1st B1ft for number of classes – 2 (N.B. x > 5 will have 6 – 2 = 4)
2nd B1ft for the appropriate tables value, ft their degrees of freedom. (NB ) 24 (5%) 9.488χ =
3rd B1 (for hypotheses) allow just “X ~ B(20, 0.1)” for null etc.
2nd A1 for correctly rejecting Binomial model. No ft and depends on 2nd M1.
(d) B1ft for independence or constant probability – must mention defective items or defectives
Follow through their conclusion in (c). So if they do not reject they may say “defectives
occur with probability 0.1”. Stating the value implies constant probability.
x 0 1 2 3 > 4
iO 17 31 19 14 19
iE 12.2 27.0 28.5 19.0 13.3
2(O E)E− 1.89 0.59 3.17 1.32 2.44

6
Question Scheme Marks number
5. (a) 361.6ˆ , 4.5280
xµ = = = M1, A1
(2
2 2 1753.95 80ˆ 1.51288...79
xsσ − ×= = = ) M1A1ft
AWRT 1.51 A1 (5)
(b) 0 1H : H :A B A Bµ µ µ= µ> B1 B1
Denominator M1
4.52 4.06 0.461.51... 2.50 0.0605...
80 60
z − ⎛= = ⎜⎝ ⎠+
⎞⎟ z dM1
= (+) 1.8689… AWRT (+) 1.87 A1
One tail c.v. is z = 1.6449 (AWRT 1.645 or probability AWRT 0.0307 or 0.0308) B1
(significant) there is evidence that diet A is better than diet B or
evidence that (mean) weight lost in first week using diet A is more than with B A1ft (7)
(c) CLT enables you to assume that and A B are normally distributed B1 (1)
(d) Assumed σ (either) B1 (1) 2 2 2 2and A A B Bs sσ= =
14
(a) 2nd M1 for a correct attempt at s or , A1ft for correct expression for , ft their mean. 2s 2s
N.B. 2nσ = is M1A1ft 801.49... so 1.49...
79×
2 (b) 1st B1 can be given for 1µ µ= , but 2nd B1 must specify which is A or B. 1st M1 for the denominator, follow through their 1.51.
Must have square root can condone but 22.502 21.51 2.50
80 60+ is M0.
Allow 1.51 leading to AWRT 1.85 to score M1M1A0 in (b) and can score in (d). 2.50
79 59+
2nd dM1 for attempting the correct test statistic, dependent on denominator mark 1st A1 for AWRT + 1.87, may be implied by a correct probability. 2nd A1ft ft their test statistic vs their cv only if is correct and both Ms are scored 1H
(but not A or B) are normally distributed (c) B1 for stating either or A B(d) B1 for either, can be stated in words in terms of variances or standard deviations.

7
Question Scheme Marks number
6. ( )1
2 123.5 154.7 139.1x = + = B1
2.5758 B1
"their 2.5758" 154.7 139.1 15.6nσ
= − = M1
AWRT 1.96 B1
(15.6 1.96"their 1.96" 11.87...2.5758n
)σ ×= = M1
So 95% C.I. = 139.1 + 11.87…= (127.22…, 150.97…) AWRT (127, 151) A1
6
1st B1 for mean = 139.1 only
1st M1 for UL – mean or mean – LL set equal to z value times standard error or some equivalent
expression for standard error. Follow through their 2.5758 provided a z value.
May be implied by nσ
= 6.056… [N.B. 15.6 6.705...2.3263
= ]
Condone poor notation for standard error if it is being used correctly to find CI.
2nd M1 for full method for semi-width (or width) of 95% interval
Follow through their z values for both M marks
N.B. Use of 2.60 instead of 2.5758 should just lose 2nd B1 since it leads to AWRT (127, 151)
8
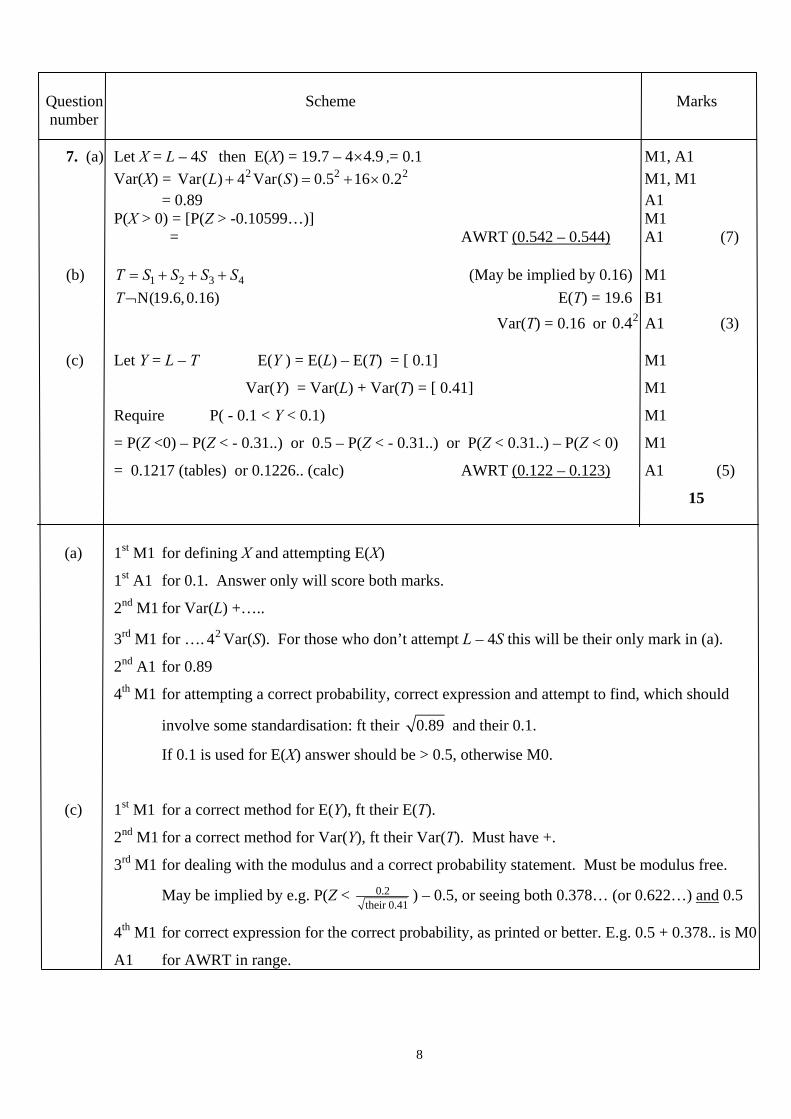
Question Scheme Marks number
7. (a) Let X = L – 4S then E(X) = 19.7 – 4 4.9× ,= 0.1 M1, A1 Var(X) = M1, M1 2 2Var( ) 4 Var( ) 0.5 16 0.2L S+ = + × 2
= 0.89 A1 P(X > 0) = [P(Z > -0.10599…)] M1 = AWRT (0.542 – 0.544) A1 (7) (b) (May be implied by 0.16) M1 1 2 3T S S S S= + + + 4
E(T) = 19.6 B1 N(19.6,0.16)T¬ Var(T) = 0.16 or A1 (3) 0.42
(c) Let Y = L – T E(Y ) = E(L) – E(T) = [ 0.1] M1
Var(Y) = Var(L) + Var(T) = [ 0.41] M1
Require P( - 0.1 < Y < 0.1) M1
= P(Z <0) – P(Z < - 0.31..) or 0.5 – P(Z < - 0.31..) or P(Z < 0.31..) – P(Z < 0) M1
= 0.1217 (tables) or 0.1226.. (calc) AWRT (0.122 – 0.123) A1 (5)
15
(a) 1st M1 for defining X and attempting E(X)
1st A1 for 0.1. Answer only will score both marks.
2nd M1 for Var(L) +…..
3rd M1 for …. Var(S). For those who don’t attempt L – 4S this will be their only mark in (a). 24
2nd A1 for 0.89
4th M1 for attempting a correct probability, correct expression and attempt to find, which should
involve some standardisation: ft their 0.89 and their 0.1.
If 0.1 is used for E(X) answer should be > 0.5, otherwise M0.
(c) 1st M1 for a correct method for E(Y), ft their E(T).
2nd M1 for a correct method for Var(Y), ft their Var(T). Must have +.
3rd M1 for dealing with the modulus and a correct probability statement. Must be modulus free.
May be implied by e.g. P(Z < 0.2their 0.41
) – 0.5, or seeing both 0.378… (or 0.622…) and 0.5
4th M1 for correct expression for the correct probability, as printed or better. E.g. 0.5 + 0.378.. is M0
A1 for AWRT in range.
1
GCE
Mark Scheme (Results) June 2008
GCE Mathematics (669101) Edexcel Limited. Registered in England and Wales No. 4496750 Registered Office: One90 High Holborn, London WC1V 7BH

2
June 2008
6691 Statistics S3 Mark Scheme
Question Scheme Marks number
1. (a) 6046 167.94...36
x ⎛ ⎞= =⎜ ⎟⎝ ⎠
awrt 168 B1
2
2 1016338 3635
xs − ×= M1
= 27.0253…. awrt 27.0 A1 (3)
(Accept 27)
(b) 99% Confidence Interval is: 5.12.575836
x ± × M1A1ft
2.5758 B1
= (165.755…, 170.133…) awrt (166,170) A1 A1 (5)
8 marks
(a) M1 for a correct expression for 2s , follow through their mean, beware it is very “sensitive”
999.63..167.94 28.56...35
1483.24..167.9 42.37...35
274168 7.8235
→ →
→ →
→ →
Use of 36 as the divisor (= 26.3… ) is M0A0
(b) M1 for substituting their values in 5.1 or 36
sx z± × where z is a recognizable value from tables
1st A1 follow through their mean and their z (to 2dp) in 5.136
x z± ×
Beware: ( )25.1167.94 2.5758 166.07..,169.8..
36± × → but scoresB1M0A0A0A0
Correct answer only in (b) scores 0/5
2nd & 3rd A marks depend upon 2.5758 and M mark.
These would all score M1A0

3
Question Scheme Marks number
2. 115 70 37.0967...217
×= or 1150
31 (etc)
311122,
311020,
311265
M1
Expected (Obs) A S H
Boy 37.1 (30) 37.1 (50) 40.8 (35)
Girl 32.9 (40) 32.9 (20) 36.2 (42)
A1A1
0H : There is no association between course and gender
1H : There is some association between course and gender (both) B1
( ) ( ) ( ) ( )2 2 2 237.1 30 32.9 40 36.2 42...
37.1 32.9 36.2O E
E− − − −
= + + +∑ M1A1ft
= 1.358 + 4.485 + 0.824 + 1.532 + 5.058 + 0.929 = 14.189… awrt 14.2 A1
( )( ) 223 1 2 1 2, (1%)ν χ= − − = critical value is 9.210 (condone 9.21) B1, B1ft
Significant result or reject null hypothesis M1
There is evidence of an association between course taken and gender A1ft (11)
[Correct answers only score full marks] 11 marks
ALT 2 2 2 230 40 42... 217
37.1 32.9 36.2O NE
− = + + + −∑ M1A1ft
1st M1 for some use of the row total col totalgrand total
× formula
1st A1 for one correct row or one correct column of expected frequencies to nearest integer
2nd A1 for all expected frequencies correct to awrt 1 dp (Allow exact fractions)
1st B1 for hypotheses. Independence is OK. Must mention courses and gender at least once.
Use of ρ or “correlation” is B0 but allow ISW.
2nd M1 for an attempt to calculate test statistic. At least one correct expression, ft expected freq.
3rd A1 follow through expected frequencies for at least 3 expressions
3rd M1 for a correct statement relating their test statistic and their cv (may be implied by comment)
5th A1 for a contextualised comment relating their test statistic and their cv. Ignore their 0 1H or H
or assume that they were correct. Must mention courses and gender

4
Question Scheme Marks number
3. (a) (i) + (ii) + (i) B1 + + + + (ii) B1B1 (3) + + + + (b)(i) M1M1
A B C D E F G Rank (Judge 1) 1 4 2 3 5 6 7 Rank (Judge 2) 1 2 4 3 5 7 6
2d 0 4 4 0 0 1 1
2 10d =∑ M1A1
( )6 10 5 231 1
7 49 1 28 28sr×
= − = − =× −
or awrt 0.821 M1A1 (6)
(ii) 0 1H : 0 H : 0ρ ρ= > (Allow Sρ ) ( 1H : 0ρ ≠ scores B0) B1,B1
sr 5% one tail critical value is 0.7143 B1
Significant result or reject null hypothesis M1
There is evidence of a (positive) correlation between the judges or the judges agree A1ft (5)
14 marks
(a) (i) 1st B1 for 5 or more points on a straight line of positive gradient
(ii) 2nd B1 for 4 or more points satisfying -1<r< 0
3rd B1 for 5 or more points of decreasing ranks not on a straight line
(b)(i) 1st M1 for attempting to rank one of the judges (at least 2 correct rankings)
2nd M1 for ranking both (may be reversed) (at least 2 correct rankings)
3rd M1 for attempting 2d .
1st A1 for 2d∑ =10
4th M1 for correct use of the sr formula
(ii) 3rd B1 for the correct critical value - depends upon their 1H : 0ρ > needs 0.7143, 0ρ ≠ , 0.7857
The 1H may be in words so B0B1 is possible. If no 1H award for 0.7143 only.
5th M1 for a correct statement relating their sr and their cv (may be implied by correct comment)
3rd A1ft follow through their sr and their cv. Comment in context. Must mention judges.
Don’t insist on “positive” and condone it if they are using 0ρ ≠ .

5
Question Scheme Marks number
4. (a) 2
1 2 3 4 ~ N(336, 22 )X M M M M= + + + µ = 336 B1
2 222σ = or 484 B1
P(X < 350) = 350 336P( )22
Z −< M1
= P( 0.64)Z < awrt 0.64 A1 = awrt 0.738 or 0.739 A1 (5) (b) M~N(84, 121) and W~N(62, 100) Let Y = M − 1.5W M1
E( ) 84 1.5 62 9Y = − × = − A1
2Var( ) Var( ) 1.5 Var( )Y M W= + M1
= 2 2 211 1.5 10 346+ × = A1
P(Y < 0 ) , = P(Z < 0.48…) = awrt 0.684 ~ 0.686 M1, A1 (6)
11 marks
(a) 2nd B1 for σ = 22 or 2 222σ = or 484 M1 for standardising with their mean and standard deviation (ignore direction of inequality) (b) 1st M1 for attempting to find Y. Need to see ( )1.5M W± − or equiv. May be implied by Var(Y). 1st A1 for a correct value for their E(Y) i.e. usually + 9. Do not give M1A1 for a “lucky” + 9.
2nd M1 for attempting Var(Y) e.g. 2 2 2 2... 1.5 10 or 11 1.5 ...+ × + ×
3rd M1 for attempt to calculate the correct probability. Must be attempting a probability > 0.5.
Must attempt to standardise with a relevant mean and standard deviation
Using 2 11Mσ = or 2 10Wσ = is not a misread.

6
Question Scheme Marks number
5. (a) Only cleaners - no managers i.e. not all types. OR Not a random sample B1g 1st 50 may be in same shift/group/share same views. OR Not a random sample B1h (2) (Allow “not a representative sample” in place of “not a random sample”) (b)(i) Label employees (1-550) or obtain an ordered list B1 Select first using random numbers (from 1 - 11) B1 Then select every 11th person from the list B1 (ii) Label managers (1-55) and cleaners (1-495) M1 Use random numbers to select… M1 …5 managers and 45 cleaners A1 (6) (c) 390, 372 (They must be in this order) B1, B1 (2) 10 marks
After 1st B1, comments should be in context, i.e. mention cleaners, managers, types of worker etc
(a) 1st B1g for one row
2nd B1h for both rows. “Not a random sample” only counts once.
Score B1B0 or B1B1 or B0B0 on EPEN
(b)(i) 1st B1 for idea of labelling or getting an ordered list. No need to see 1-550.
2nd B1 selecting first member of sample using random numbers (1-11 need not be mentioned)
3rd B1 selecting every nth where n = 11.
(ii) 1st M1 for idea of two groups and labelling both groups. (Actual numbers used not required)
2nd M1 for use of random numbers within each strata. Don’t give for SRS from all 550.
“Assign random numbers to managers and cleaners” scores M0M1
A1 for 5 managers and 45 cleaners. (This mark is dependent upon scoring at least one M)

7
Question Scheme Marks number
6. (a) ( )
0 11 1 21 ... 223, 0.22310 11 21 ... or 10 100 1000
p × + × += = =
× + + × (*) (Accept
1000223 ) M1, A1cso (2)
(b) ( )100.8 100r = × = 10.7374 awrt 10.74 M1A1
( ) ( )8 2100.8 0.2 100
2s ⎛ ⎞
= × ×⎜ ⎟⎝ ⎠
= 30.198… awrt 30.2 A1
t = 100 - [r + s + 26.84 + 20.13 + 8.81] = awrt 3.28 A1cao (4) (c) 0H : Binomial ([n =10], p = 0.2) is a suitable model for these data B1 1H : Binomial ([n =10], p = 0.2) is NOT a suitable model for these data B1 (2) (d) Since t < 5 , the last two groups are combined M1
and 4ν = = 5 - 1 A1 (2)
(e) Critical value 24 (5%)χ = 9.488 B1
Not significant or do not reject null hypothesis M1
The binomial distribution with p = 0.2 is a suitable model for the number of
cuttings that do not grow A1 (3)
13 marks
(a) M1 Must show clearly how to get either 223 or 1000. As printed or better.
A1cso for showing how to get both 223 and 1000 and reaching p = 0.223
(b) M1 for any correct method (a correct expression) seen for r or s.
1st A1 for correct value for r awrt 10.74
2nd A1 for s = awrt 30.2
3rd A1 for t = 3.28 only
(c) B1 for each. The value of p must be mentioned at least once. Accept B(10, 0.2)
If hypotheses are correct but with no value of p then score B0B1
Minimum is X~B(10, 0.2). If just B(10, 0.2) and not B(10, 0.2) award B1B0
(d) M1 for combining groups (must be stated or implied by a new table with combined cell seen)
A1 for the calculation 4 = 5 - 1
(e) M1 for a correct statement based on 4.17 and their cv(context not required) (may be implied)
Use of 4.17 as a critical value scores B0M0A0
A1 for a correct interpretation in context and p =0.2 and cuttings mentioned.

8
Question Scheme Marks number
7. (a) 0 1H : H :F M F Mµ µ µ µ= ≠ (Allow 1 2and µ µ ) B1
2 2
6.86 5.48
4.51 3.62200 100
z −=
+
M1 A1
= 2.860… awrt (+)2.86 A1
2 tail 5% critical value (+) 1.96 (or probability awrt 0.0021~0.0022) B1
Significant result or reject the null hypothesis (o.e.) M1
There is evidence of a difference in the (mean) amount spent on junk food by
male and female teenagers A1ft (7)
(b) CLT enables us to assume and F M are normally distributed B1 (1)
8 marks
(a) 1st M1 for an attempt at
100 or 200 100 or 200
a bc d
−
+ with 3 of a, b, c or d correct
1st A1 for a fully correct expression
2nd B1 for + 1.96 but only if their 1H is two-tail (it may be in words so B0B1 is OK)
If 1H is one-tail this is automatically B0 too.
2nd M1 for a correct statement based on comparison of their z with their cv. May be implied
3rd A1 for a correct conclusion in context based on their z and 1.96.
Must mention junk food or money and male vs female.
(b) B1 for or F M mentioned. Allow “mean (amount spent on junk food) is normally distributed”
Read the whole statement e.g. “ original distribution is normal so mean is…” scores B0

Mark Scheme (Results) Summer 2009
GCE
GCE Mathematics (6691/01)

6691/01 GCE Mathematics June 2009 2
June 2009 6691 Statistics S3
Mark Scheme
Question Number Scheme Marks
Q1 (a)
(bi)
(bii)
Randomly select a number between 00 and 499 (001 and 500) select every 500th person Quota Advantage: Representative sample can be achieved (with small sample size) Cheap (costs kept to a minimum) not “quick“ Administration relatively easy Disadvantage Not possible to estimate sampling errors (due to lack of randomness) Not a random process Judgment of interviewer can affect choice of sample – bias Non-response not recorded Difficulties of defining controls e.g. social class Systematic Advantage: Simple or easy to use not “quick” or “cheap” or “efficient” It is suitable for large samples (not populations) Disadvantage Only random if the ordered list is (truly) random Requires a list of the population or must assign a number to each member of the pop.
B1 B1
(2)
B1 B1
(2) B1 B1 (2)
[6]
(a)
(b)
(i)
(ii)
1st B1 for idea of using random numbers to select the first from1 - 500 (o.e.) 2nd B1 for selecting every 500th (name on the list) If they are clearly trying to carry out stratified sample then score B0B0 Score B1 for any one line 1st B1 for Quota advantage 2nd B1 for Quota disadvantage 3rd B1 for Systematic Advantage 4th B1 for Systematic Disadvantage

6691/01 GCE Mathematics June 2009 3
Question Number Scheme Marks
Q2 (a)
(b)
(c)
Limits are 20.1 ± 1.96 × 0.5 (19.1, 21.1)
98 % confidence limits are
20.1 ± 2.3263 × 105.0
(19.7, 20.5)
The growers claim is not correct Since 19.5 does not lie in the interval (19.7, 20.5)
M1 B1 A1cso
(3)
M1 B1
A1A1 (4)
B1 dB1
(2) [9]
(a)
(b)
(c)
M1 for 20.1 0.5z± × . Need 20.1 and 0.5 in correct places with no 10 B1 for z = 1.96 (or better) A1 for awrt 19.1 and awrt 21.1 but must have scored both M1 and B1 [ Correct answer only scores 3/3]
M1 for 0.520.110
z± × , need to see 20.1, 0.5 and 10 in correct places
B1 for z = 2.3263 (or better) 1st A1 for awrt 19.7 2nd A1 for awrt 20.5 [Correct answer only scores M1B0A1A1] 1st B1 for rejection of the claim. Accept “unlikely” or “not correct” 2nd dB1 Dependent on scoring 1st B1 in this part for rejecting grower’s claim for an argument that supports this. Allow comment on their 98% CI from (b)

6691/01 GCE Mathematics June 2009 4
Question Number Scheme Marks
Q3 (a)
(b)
(c)
A B C D E F G H I J BMI 1 6 3 8 4 5 7 2 9 10 or 10 5 8 3 7 6 4 9 2 1 Finishing position 3 5 1 9 6 4 10 2 7 8
2d 4 1 4 1 4 1 9 0 4 4
2d∑ = 32 (298)
rs = 1 - 6 3210 99××
= 0.80606… (-0.80606) accept 133165
± awrt ± 0.806
H0 : ρ = 0, H1 : ρ > 0, Critical value is (± )0.5636 (0.806 > 0.5636 therefore) in critical region/ reject H0 The lower the BMI the higher the position in the race./ support for doctors belief The position is already ranked OR Position is not Normally distributed
M1 M1 M1 A1ft A1
(5) B1 B1 B1 M1 A1ft
(5) B1
(1) [11]
(a)
(b)
(c)
1st M1 for attempt to rank BMI scores 2nd M1 for attempt at 2d∑ (must be using ranks)
3rd M1 for use of the correct formula with their 2d∑ . If answer is not correct an expression is required. 1st A1ft for a correct expression. ft their 2d∑ but only if all 3 Ms are scored
2nd A1 awrt + 0.806 (but sign must be compatible with their 2d∑ ) 2nd B1 for 0ρ > (or <0 but must be one tail and consistent with their ranking) 3rd B1 for critical value that is compatible with their 1H . If one-tail must be + 0.5636 if two-tail must be + 0.6485 [Condone wrong sign] M1 for a correct statement relating their sr with their cv. e.g. “reject 0H ”, “in critical region”, “significant result” May be implied by a correct comment A1ft for correct comment in context. Must mention low/high BMI and race/fitness or doctor’s belief. Comment should be one-tailed. Allow positive correlation between… but NOT …positive relationship… B1 for a correct and relevant comment either based on the fact that the data was originally partially ordered or on the underlying normal assumption “Quicker” or “easier” score B0
No ranking can score 3rd M1 only No 1H assume one-tail for 3rd B1

6691/01 GCE Mathematics June 2009 5
Question Number Scheme Marks
Q4
X ∼ N (55,32) therefore X ∼ N (55,89 )
P ( X > 57) = P ( Z >
895557 − ) = P(Z > 1.8856…)
= 1 – 0.9706 = 0.0294 0.0294~0.0297
B1 B1
M1
M1 A1
[5]
ALT
1st B1 for ~ normal and 55X µ = , may be implied but must be X
2nd B1 for Var( ) or st. dev of X X e.g. ( )29 38 8
~ N(55, ) or ~ N 55,X X ⎛ ⎞⎜ ⎟⎝ ⎠
for B1B1
Condone use of X if they clearly mean X so ( )98~ N 55,X is OK for B1B1
1st M1 for an attempt to standardize with 57 and mean of 55 and their st. dev. 3≠
2nd M1 for 1 - tables value. Must be trying to find a probability < 0.5
A1 for answers in the range 0.0294~0.0297
( )8
2
1~ N 8 55,8 3iX × ×∑
1st B1 for ~ normal and mean = 8 55X ×∑
2nd B1 for variance = 28 3× 1st M1 for attempt to standardise with 57 8× , mean of 55 8× and their st dev 3≠
6691/01 GCE Mathematics June 2009 6
Question Number Scheme Marks
Q5 (a)
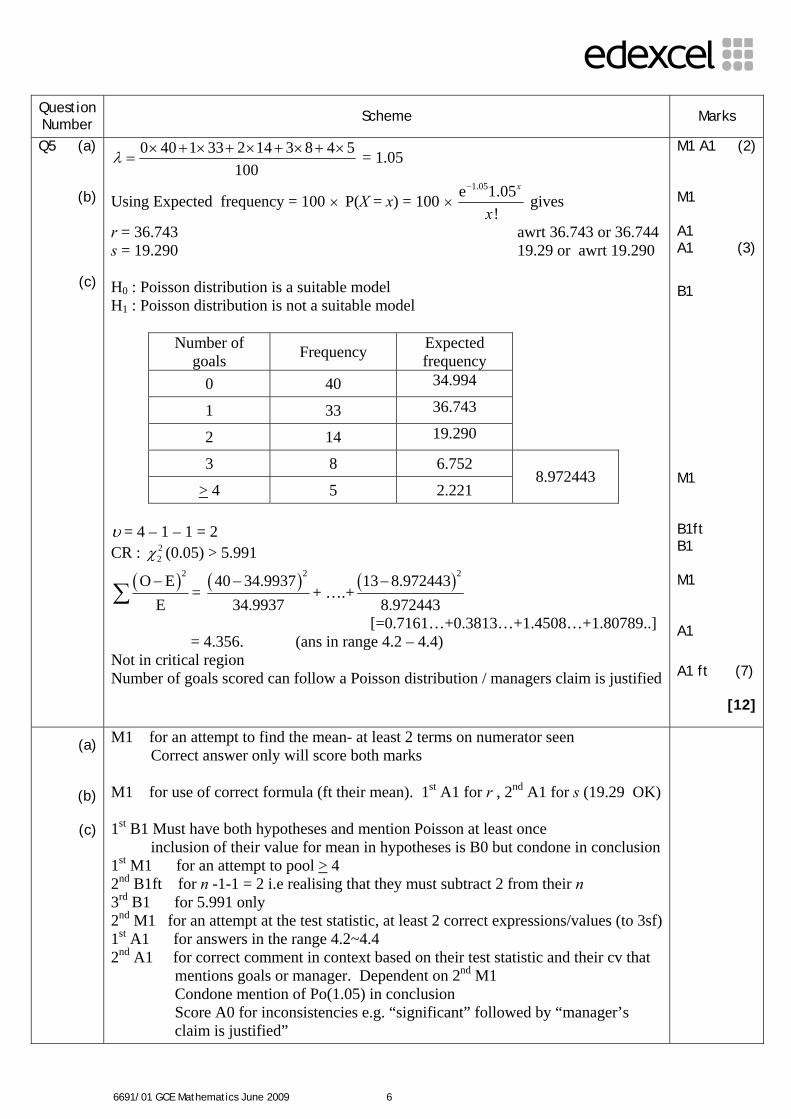
(b)
(c)
0 40 1 33 2 14 3 8 4 5100
λ × + × + × + × + ×= = 1.05
Using Expected frequency = 100 × P(X = x) = 100 ×1.05e 1.05
!
x
x
−
gives
r = 36.743 awrt 36.743 or 36.744 s = 19.290 19.29 or awrt 19.290 H0 : Poisson distribution is a suitable model H1 : Poisson distribution is not a suitable model
Number of goals Frequency Expected
frequency
0 40 34.994
1 33 36.743
2 14 19.290
3 8 6.752
> 4 5 2.221 8.972443
υ = 4 – 1 – 1 = 2 CR : 2
2χ (0.05) > 5.991
( )2O EE−
∑ = ( )240 34.993734.9937−
+ ….+ ( )213 8.9724438.972443−
[=0.7161…+0.3813…+1.4508…+1.80789..] = 4.356. (ans in range 4.2 – 4.4) Not in critical region Number of goals scored can follow a Poisson distribution / managers claim is justified
M1 A1 (2) M1 A1 A1 (3)
B1 M1 B1ft B1 M1 A1 A1 ft (7)
[12]
(a)
(b)
(c)
M1 for an attempt to find the mean- at least 2 terms on numerator seen Correct answer only will score both marks M1 for use of correct formula (ft their mean). 1st A1 for r , 2nd A1 for s (19.29 OK) 1st B1 Must have both hypotheses and mention Poisson at least once inclusion of their value for mean in hypotheses is B0 but condone in conclusion 1st M1 for an attempt to pool > 4 2nd B1ft for n -1-1 = 2 i.e realising that they must subtract 2 from their n 3rd B1 for 5.991 only 2nd M1 for an attempt at the test statistic, at least 2 correct expressions/values (to 3sf) 1st A1 for answers in the range 4.2~4.4 2nd A1 for correct comment in context based on their test statistic and their cv that mentions goals or manager. Dependent on 2nd M1 Condone mention of Po(1.05) in conclusion Score A0 for inconsistencies e.g. “significant” followed by “manager’s claim is justified”

6691/01 GCE Mathematics June 2009 7
Question Number Scheme Marks
Q6 (a)
(b)
µU~ mean length of upper shore limpets, Lµ ~ mean length of lower shore limpets H0 : µu = µL H1 : µu < µL both
s.e. = 2 20.42 0.67
120 150+
= 0.0668 5.05 4.97 ( )1.1975
0.0668z −= = ± awrt + 1.20
Critical region is 1.6449, z ≥ or probability = awrt (0.115 or 0.116) z = + 1.6449 (1.1975 < 1.6449 ) therefore not in critical region / accept H0/not significant (or P(Z 1.1975) 0.1151, 0.1151 0.05≥ = > or z not in critical region ) There is no evidence that the limpets on the upper shore are shorter than the limpets on the lower shore. Assume the populations or variables are independent Standard deviation of sample = standard deviation of population [Mention of Central Limit Theorem does NOT score the mark]
B1 M1 A1
dM1 A1
B1
M1
A1 (8)
B1 B1
(2) [10]
(a)
(b)
1st B1 If 1 2,µ µ used then it must be clear which refers to upper shore. Accept sensible choice of letters such as u and l.
1st M1 Condone minor slips e.g. 20.67
120 or
20.67 0.42150 120
+ etc i.e. swapped n or one
sd and one variance but M0 for 0.67 0.42150 120
+
1st A1 can be scored for a fully correct expression. May be implied by awrt 1.20
2nd dM1 is dependent upon the 1st M1 but can ft their se value if this mark is scored.
2nd A1 for awrt (+) 1.20
3rd M1 for a correct statement based on their z value and their cv. No cv is M0A0 If using probability they must compare their p (<0.5) with 0.05 (o.e) so can allow 0.884< 0.95 to score this 3rd M1 mark. May be implied by their contextual statement and M1A0 is possible. 3rd A1 for a correct comment to accept null hypothesis that mentions length of limpets on the two shores.
1st B1 for one correct statement. Accept ”samples are independent”
2nd B1 for both statements

6691/01 GCE Mathematics June 2009 8
Question Number Scheme Marks
Q7 (a)
(b)
Estimate of Mean = 600.95
= 120.18
Estimate of Variance = 14 { 72216.31 −
2600.95
} or 0.1484
= 0.037
P(-0.05 < ˆµ µ− < 0.05) = 0.90 or P( 0.05 0.05) 0.90X µ− < − < = [ < is OK]
0.05 1.64490.2n
=
n =2 2
21.6449 0.2
0.05×
n = 43.29… n = 44
M1A1 M1 A1ft A1
(5) B1
M1 A1
dM1 A1 A1
(6) [11]
(a)
(b)
1st M1 for an attempt at x∑ (accept 600 to 1sf)
1st A1 for 600.9 awrt 1205
= or awrt 120.2. No working give M1A1 for awrt 120.2
2nd M1 for the use of a correct formula including a reasonable attempt at
2x∑ (Accept 70 000 to 1sf) or ( )2 0.15x x− =∑ (to 2 dp)
2nd A1ft for a correct expression with correct 2x∑ but can ft their mean (for expression - no need to check values if it is incorrect) 3rd A1 for 0.037 Correct answer with no working scores 3/3 for variance B1 for a correct probability statement or “width of 90% CI = 0.05 2 0.1× = ”
1st M1 for 0.20.05
n
= z value or 0.22 0.1zn
× × =
Condone 0.5 instead of 0.05 or missing 2 or 0.05 for 0.1 for M1 1st A1 for a correct equation including 1.6449
2nd dM1 Dependent upon 1st M1 for rearranging to get n = …Must see “squaring”
2nd A1 for n = awrt 43.3
3rd A1 for rounding up to get n = 44
Using e.g.1.645 instead of 1.6449 can score all the marks except the 1st A1
1st B1 may be implied by 1st A1 scored or correct equation.
6691/01 GCE Mathematics June 2009 9
Question Number Scheme Marks
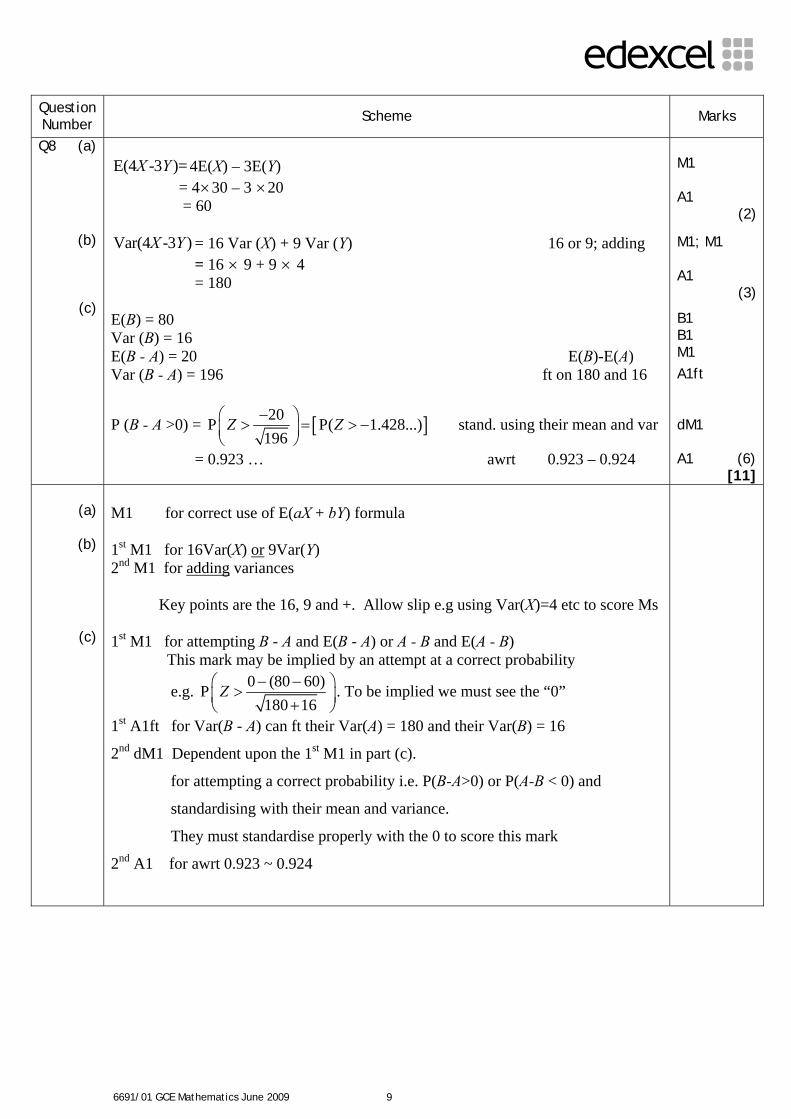
Q8 (a)
(b)
(c)
E(4 -3 )=X Y 4E(X) – 3E(Y) = 4×30 – 3 ×20 = 60 Var(4 -3 )X Y = 16 Var (X) + 9 Var (Y) 16 or 9; adding = 16 × 9 + 9 × 4 = 180 E(B) = 80 Var (B) = 16 E(B - A) = 20 E(B)-E(A) Var (B - A) = 196 ft on 180 and 16
P (B - A >0) = [ ]20P P( 1.428...)196
Z Z−⎛ ⎞> = > −⎜ ⎟⎝ ⎠
stand. using their mean and var
= 0.923 … awrt 0.923 – 0.924
M1 A1
(2)
M1; M1 A1
(3)
B1 B1 M1
A1ft dM1 A1 (6)
[11]
(a)
(b)
(c)
M1 for correct use of E(aX + bY) formula 1st M1 for 16Var(X) or 9Var(Y) 2nd M1 for adding variances Key points are the 16, 9 and +. Allow slip e.g using Var(X)=4 etc to score Ms 1st M1 for attempting B - A and E(B - A) or A - B and E(A - B) This mark may be implied by an attempt at a correct probability
e.g. 0 (80 60)P180 16
Z − −⎛ ⎞>⎜ ⎟+⎝ ⎠. To be implied we must see the “0”
1st A1ft for Var(B - A) can ft their Var(A) = 180 and their Var(B) = 16
2nd dM1 Dependent upon the 1st M1 in part (c).
for attempting a correct probability i.e. P(B-A>0) or P(A-B < 0) and
standardising with their mean and variance.
They must standardise properly with the 0 to score this mark
2nd A1 for awrt 0.923 ~ 0.924
Mark Scheme (Results) Summer 2010
GCE
GCE Statistics S3 (6691/01)
Edexcel Limited. Registered in England and Wales No. 4496750 Registered Office: One90 High Holborn, London WC1V 7BH

Edexcel is one of the leading examining and awarding bodies in the UK and throughout the world. We provide a wide range of qualifications including academic, vocational, occupational and specific programmes for employers. Through a network of UK and overseas offices, Edexcel’s centres receive the support they need to help them deliver their education and training programmes to learners. For further information, please call our GCE line on 0844 576 0025, our GCSE team on 0844 576 0027, or visit our website at www.edexcel.com.
If you have any subject specific questions about the content of this Mark Scheme that require the help of a subject specialist, you may find our Ask The Expert email service helpful. Ask The Expert can be accessed online at the following link: http://www.edexcel.com/Aboutus/contact-us/ Summer 2010 Publications Code UA024774 All the material in this publication is copyright © Edexcel Ltd 2010
GCE Statistics S3 (6691) Summer 2010
Hypothesis Tests (Final M1A1) For an incorrect comparison (e.g. probability with z value) even with a correct statement
and/or comment award M0A0 For a correct or no comparison with more than one statement one of which is false Award M0A0 (This is compatible with the principle above of contradictory statements being penalised) Apply these rules to all questions

GCE Statistics S3 (6691) Summer 2010
GCE Statistics S3 (6691) Summer 2010
June 2010 Statistics S3 6691
Mark Scheme Question Number
Scheme
Marks
Q1
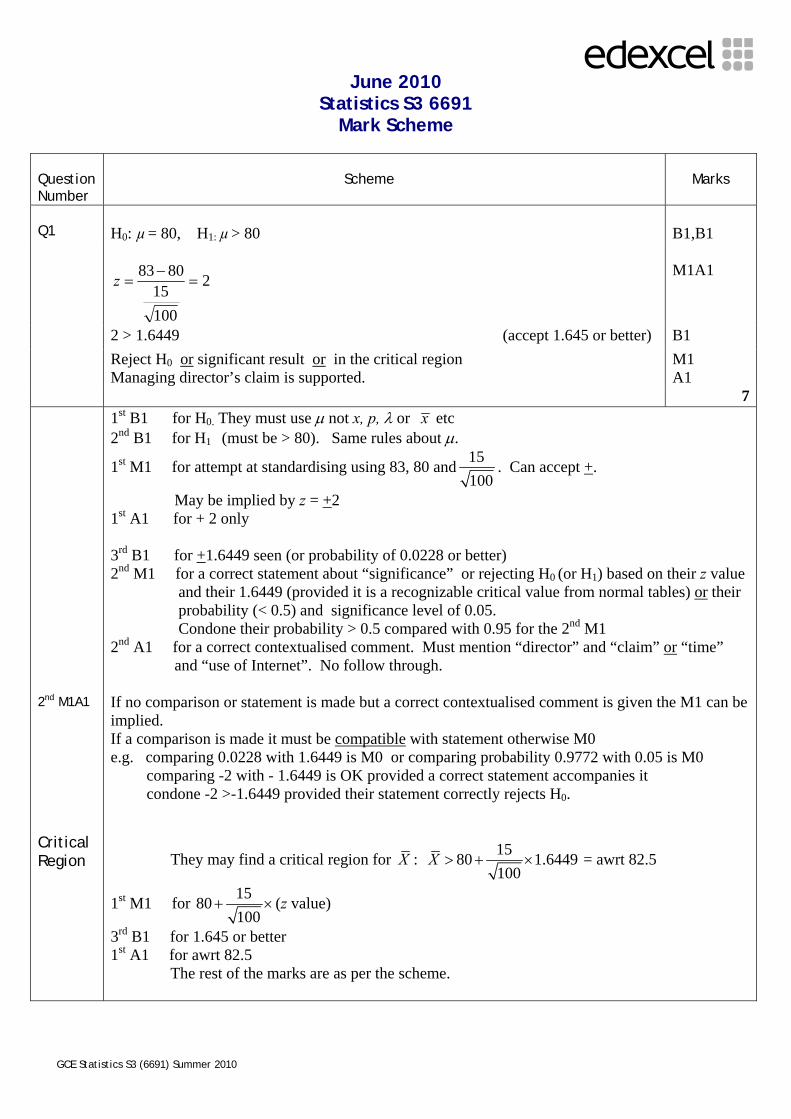
H0: µ = 80, H1: µ > 80
B1,B1
2
10015
8083=
−=z
M1A1
2 > 1.6449 (accept 1.645 or better) B1
Reject H0 or significant result or in the critical region Managing director’s claim is supported.
M1 A1
7 2nd M1A1 Critical Region
1st B1 for H0. They must use µ not x, p, λ or x etc 2nd B1 for H1 (must be > 80). Same rules about µ.
1st M1 for attempt at standardising using 83, 80 and 15100
. Can accept +.
May be implied by z = +2 1st A1 for + 2 only 3rd B1 for +1.6449 seen (or probability of 0.0228 or better) 2nd M1 for a correct statement about “significance” or rejecting H0 (or H1) based on their z value and their 1.6449 (provided it is a recognizable critical value from normal tables) or their probability (< 0.5) and significance level of 0.05. Condone their probability > 0.5 compared with 0.95 for the 2nd M1 2nd A1 for a correct contextualised comment. Must mention “director” and “claim” or “time” and “use of Internet”. No follow through. If no comparison or statement is made but a correct contextualised comment is given the M1 can be implied. If a comparison is made it must be compatible with statement otherwise M0 e.g. comparing 0.0228 with 1.6449 is M0 or comparing probability 0.9772 with 0.05 is M0 comparing -2 with - 1.6449 is OK provided a correct statement accompanies it condone -2 >-1.6449 provided their statement correctly rejects H0.
They may find a critical region for 15: 80 1.6449100
X X > + × = awrt 82.5
1st M1 for 1580100
+ × (z value)
3rd B1 for 1.645 or better 1st A1 for awrt 82.5 The rest of the marks are as per the scheme.

GCE Statistics S3 (6691) Summer 2010
Question Number
Scheme
Marks
Q2 [ P ~ N(90,9) and J ~ N(91,12)] (a) ( ) N(1,21)J P− ∼ M1, A1
P( ) P( 0)J P J P< = − < 0 1P
21Z −⎛ ⎞= <⎜ ⎟⎝ ⎠
dM1
P( 0.2182...)Z= < − 1 0.5871 0.4129= − = awrt (0.413 ~ 0.414)
calculator (0.4136….)
A1 (4)
(b) 1 2 60 1 2 60( .... ) ( .... )X J J J P P P= + + + − + + + M1
E( ) 60 91 60 90 60X = × − × = [stated as E(X) = 60 or X~N(60, …)] B1 Var( ) 60 9 60 12 1260X = × + × = A1 120 60P( 120) P
1260X Z −⎛ ⎞> = >⎜ ⎟
⎝ ⎠
M1
P( 1.69030...)Z= > 1 0.9545 0.0455= − = awrt (0.0455) A1
(5) 9
(a)
(b)
Use of means
1st M1 for attempting J - P and E(J - P) or P - J and E(P - J) 1st A1 for variance of 21 (Accept 9 + 12). Ignore any slip in µ here. 2nd dM1 for attempting the correct probability and standardising with their mean and sd. This mark is dependent on previous M so if J - P ( or P - J) is not being used score M0 If their method is not crystal clear then they must be attempting P(Z< -ve value) or P(Z > +ve value) i.e. their probability after standardisation should lead to a prob. < 0.5 so e.g. P(J - P < 0) leading to 0.5871 is M0A0 unless the M1 is clearly earned. 2nd A1 for awrt 0.413 or 0.414
The first 3 marks may be implied by a correct answer 1st M1 for a clear attempt to identify a correct form for X. This may be implied by correct variance of 1260 B1 for E(X) = 60. Can be awarded even if they are using X = 60J - 60P. Allow P - J and -60 1st A1 for a correct variance. If 1260 is given the M1 is scored by implication. 2nd M1 for attempting a correct probability and standardising with 120 and their 60 and 1260 If the answer is incorrect a full expression must be seen following through their values
for M1 e.g. 120 their 60Ptheir variance
Z −⎛ ⎞>⎜ ⎟⎝ ⎠
. If using -60, should get 120 60Ptheir variance
Z − − −⎛ ⎞<⎜ ⎟⎝ ⎠
Attempt to use J P− for 1st M1, E( J P− ) = 1 for B1 and Var( J P− ) = 0.35 for A1 Then 2nd M1 for standardisation with 2, and their 1 and 0.35
GCE Statistics S3 (6691) Summer 2010
Question Number
Scheme
Marks
Q3 (a) 2N(0,0.5 )E ∼ or ( )2~ N ,0.5X w
0.6P( 0.6) P0.5
E Z⎛ ⎞< = <⎜ ⎟⎝ ⎠
or ( ) 0.6P 0.6 P0.5
X w Z⎛ ⎞− < = <⎜ ⎟⎝ ⎠
M1
P( 1.2)Z= < 2 0.8849 1 0.7698= × − = awrt 0.770 A1
(2)(b) 1N 0,
64E ⎛ ⎞∼ ⎜ ⎟
⎝ ⎠ or
20.5~ N ,16
X w⎛ ⎞⎜ ⎟⎜ ⎟⎝ ⎠
M1
( ) 1
8
0.3P 0.3 PE Z⎛ ⎞
< = <⎜ ⎟⎝ ⎠
or ( ) 18
0.3P 0.3 PX w Z⎛ ⎞
− < = <⎜ ⎟⎜ ⎟⎝ ⎠
M1, A1
P( 2.4)Z= < 2 0.9918 1 0.9836= × − = awrt 0.984 A1
(4)(c) 135.6 2.3263
8± ×
M1 B1
(35.3, 35.9) A1,A1 (4)
10(a)
(b)
Sum of 16, not means
(c)
1st M1 for identifying a correct probability (they must have the 0.6) and attempting to standardise. Need | |. This mark can be given for 0.8849 - 0.1151 seen as final answer. 1st A1 for awrt 0.770. NB an answer of 0.3849 or 0.8849 scores M0A0 (since it implies no | |)
M1 may be implied by a correct answer
1st M1 for a correct attempt to define or E X but must attempt 2
nσ . Condone labelling as E or X
This mark may be implied by standardisation in the next line. 2nd M1 for identifying a correct probability statement using or E X . Must have 0.3 and | | 1st A1 for correct standardisation as printed or better 2nd A1 for awrt 0.984
The M marks may be implied by a correct answer. 1st M1 for correct attempt at suitable sum distribution with correct variance ( = 1
416× ) 2nd M1 for identifying a correct probability. Must have 4.8 and | |
1st A1 for correct standardisation i.e. need to see 4.84
or better
M1 for 35.6 + z 0.516
×
B1 for 2.3263 or better. Use of 2.33 will lose this mark but can still score ¾ 1st A1 for awrt 35.3 2nd A1 for awrt 35.9

GCE Statistics S3 (6691) Summer 2010
Question Number
Scheme
Marks
Q4
(a)
Distance rank 1 2 3 4 5 6 7
Depth rank 1 2 4 3 6 7 5
d 0 0 1 1 1 1 2 2d 0 0 1 1 1 1 4
M1 M1
2 8d =∑
M1A1
6 817 48sr×
= −×
M1
6 0.8571427
= = awrt 0.857 A1
(6)(b)
0 1H : 0,H : 0ρ ρ= > B1 Critical value at 1% level is 0.8929 B1
sr < 0.8929 so not significant evidence to reject 0H , M1 The researcher's claim is not correct (at 1% level).
or insufficient evidence for researcher’s claim or there is insufficient evidence that water gets deeper further from inner bank. or no (positive) correlation between depth of water and distance from inner bank
A1ft (4)
10
(a)
(b)
1st M1 for an attempt to rank the depths against the distances 2nd M1 for attempting d for their ranks. Must be using ranks. 3rd M1 for attempting 2d∑ (must be using ranks) 1st A1 for sum of 8 (or 104 for reverse ranking) 4th M1 for use of the correct formula with their 2d∑ . If answer is not correct an expression is required. 2nd A1 for awrt (+) 0.857. Sign should correspond to ranking (so use of 104 should get -0.857) 1st B1 for both hypotheses in terms of ρ, 1H must be one tail and compatible with their ranking 2nd B1 for cv of 0.8929 (accept +) M1 for a correct statement relating their sr with their cv but cv must be such that |cv|<1 A1ft for a correct contextualised comment. Must mention “researcher” and “claim” or “distance (from bank)” and “depth (of water)” Follow through their sr and their cv (provided it is |cv| <1) Use of “association” is A0
GCE Statistics S3 (6691) Summer 2010
Question Number
Scheme
Marks
Q5
Finances Income
Worse Same Better
Under £15 000 10.54 10.54 12.92 34 £15 000 and above 20.46 20.46 25.08 66 31 31 38 100
M1 A1
0
1
H : State of finances and income are independent (not associated)H : State of finances and income are not independent (associated)
B1
iO iE 2( )i i
i
O EE−
2i
i
OE
14 10.54 1.1358…. 18.59.. 11 10.54 0.0200…. 11.48.. 9 12.92 1.1893… 6.269.. 17 20.46 0.5851… 14.12.. 20 20.46 0.0103… 19.55.. 29 25.08 0.6126… 33.53..
M1 A1
∑
2( )i i
i
O EE− = 3.553… or
2100 103.553... 100 3.553...i
i
OE
− = − =∑ (awrt 3.55) A1
2)12)(13( =−−=ν B1 cv is 5.991 B1 3.553 < 5.991 so insufficient evidence to reject 0H or not significant M1 There is no evidence of association between state of finances and income. A1
10
1st M1 for some use of Row Total Col.TotalGrand Total
× . May be implied by correct iE
1st A1 for all expected frequencies correct B1 for both hypotheses. Must mention “state” or “finances” and “income” at least once Use of “relationship” or “correlation” or “connection”is B0 2nd M1 for at least two correct terms (as in 3rd or 4th column) or correct expressions with their iE 2nd A1 for all correct terms. May be implied by a correct answer.(2 dp or better-allow eg 1.13…) 3rd M1 for a correct statement linking their test statistic and their cv . Must be 2χ not normal. 4th A1 for a correct comment in context - must mention “state” or “finances” and “income” condone “relationship” or “connection” here but not “correlation”. No follow through. e.g. “There is no evidence of a relationship between finances and income”

GCE Statistics S3 (6691) Summer 2010
Question Number
Scheme
Marks
Q6
Distance from centre
of site (m) 0-1 1-2 2-4 4-6 6-9 9-12
b a− 1 1 2 2 3 3 No of artefacts 22 15 44 37 52 58
P( )a X b≤ < 121
121 1
6 1
6
41
41
228 P( )a X b× ≤ < 19 19 38 38 57 57
M1 A1 A1
Class iO iE 2( )i i
i
O EE−
2i
i
OE
0-1 22 19 919 0.4736...= 25.57…
1-2 15 19 1619 0.8421...= 11.84…
2-4 44 38 3638 0.9473...= 50.94…
4-6 37 38 138 0.0263...= 36.02…
6-9 52 57 2557 0.4385...= 47.43…
9-12 58 57 157 0.0175...= 59.01…
M1 A1
H0: continuous uniform distribution is a good fit H1: continuous uniform distribution is not a good fit
B1
∑
2( )i i
i
O EE− = 75.2
114313
= or 2
228 230.745... 228i
i
OE
− = − =∑ … (awrt 2.75) dM1A1
6 1 5ν = − = B1 2
5 (0.05) 11.070χ = (ft their ν i.e. 2 (0.05)νχ ) B1ft 2.75<11.070, insufficient evidence to reject 0H M1 Continuous uniform distribution is a suitable model A1
12 1st M1 for calculation of at least 3 widths and attempting proportions/probs. or for 1:2:3 ratio seen
1st A1 for correct probabilities 2nd A1 for all correct expected frequencies
2nd M1 for attempting ( )2 2
or O E O
E E−
, at least 3 correct expressions or values.
Follow through their iE provided they are not all = 38 3rd A1 for a correct set of calcs - 3rd or 4th column. (2 dp or better and allow e.g. 0.94…) 3rd dM1 dependent on 2nd M1 for attempting a correct sum or calculation (must see at least 3 terms and +)
The first three Ms and As can be implied by a test statistic of awrt 2.75 4th M1 for a correct statement based on their test statistic ( > 1) and their cv (> 3.8) Contradictory statements score M0 e.g. “significant” do not reject 0H . 5th A1 for a correct comment suggesting that continuous uniform model is suitable. No ft

GCE Statistics S3 (6691) Summer 2010
Question Number
Scheme
Marks
Q7 (a) Label full time staff 1-6000, part time staff 1-4000 M1 Use random numbers to select M1
Simple random sample of 120 full time staff and 80 part time staff A1 (3)
(b) Enables estimation of statistics / errors for each strata or “reduce variability” or “more representative” or “reflects population structure” NOT “more accurate”
B1 (1)
(c) H0: pf µµ = , H1: pf µµ ≠ (accept 1 2,µ µ ) B1
s.e. = 21 1980 80
+ , ( )52 50 2 221 1980 80
z −= =
+
M1,M1
= 2.828… (awrt 2.83) A1 Two tailed critical value z = 2.5758 (or prob of awrt 0.002 (<0.005) or 0.004 (<0.01)) B1 [2.828 > 2.5758 so] significant evidence to reject 0H dM1 There is evidence of a difference in policy awareness between full time and part time
staff A1ft
(7)(d) Can use mean full time and mean part time
~ Normal B1 B1 (2)
(e) Have assumed 22 σ=s or variance of sample = variance of population B1 (1)(f) 2.53 < 2.5758, not significant or do not reject H0 M1
So there is insufficient evidence of a difference in mean awareness A1ft (2)
(g) Training course has closed the gap between full time staff and part time staff’s mean awareness of company policy.
B1 (1)
17(a)
(c)
(d)
(f)
(g)
1st M1 for attempt at labelling full-time and part-time staff. One set of correct numbers. 2nd M1 for mentioning use of random numbers 1st A1 for s.r.s. of 120 full-time and 80 part-time
1st M1 for attempt at s.e. - condone one number wrong . NB correct s.e. = 12
2nd M1 for using their s.e. in correct formula for test statistic. Must be ( )52 50p rq s
± −
+
3rd dM1 dep. on 2nd M1 for a correct statement based on their normal cv and their test statistic 2nd A1 for correct comment in context. Must mention “scores” or “ policy awareness” and types of “staff”. Award A0 for a one-tailed comment. Allow ft 1st B1 for mention of mean(s) or use of X , provided X clearly refers to full-time or part-time 2nd B1 for stating that distribution can be assumed normal e.g. “mean score of the test is normally distributed” gets B1B1 M1 for correct statement (may be implied by correct contextualised comment) A1 for correct contextualised comment. Accept “no difference in mean scores”. Allow ft B1 for correct comment in context that implies training was effective. This must be supported by their (c) and (f). Condone one-tailed comment here.

GCE Statistics S3 (6691) Summer 2010

Further copies of this publication are available from Edexcel Publications, Adamsway, Mansfield, Notts, NG18 4FN Telephone 01623 467467 Fax 01623 450481
Email [email protected]
Order Code UA024774 Summer 2010 For more information on Edexcel qualifications, please visit www.edexcel.com/quals Edexcel Limited. Registered in England and Wales no.4496750 Registered Office: One90 High Holborn, London, WC1V 7BH

Mark Scheme (Results) June 2011 GCE Statistics S3 (6691) Paper 1

Edexcel is one of the leading examining and awarding bodies in the UK and throughout the world. We provide a wide range of qualifications including academic, vocational, occupational and specific programmes for employers.
Through a network of UK and overseas offices, Edexcel’s centres receive the support they need to help them deliver their education and training programmes to learners.
For further information, please call our GCE line on 0844 576 0025 or visit our website at www.edexcel.com. If you have any subject specific questions about the content of this Mark Schemethat require the help of a subject specialist, you may find our Ask The Expert email service helpful. Ask The Expert can be accessed online at the following link: http://www.edexcel.com/Aboutus/contact-us/ June 2011 Publications Code UA028846 All the material in this publication is copyright © Edexcel Ltd 2011
EDEXCEL GCE MATHEMATICS
General Instructions for Marking
1. The total number of marks for the paper is 75.
2. The Edexcel Mathematics mark schemes use the following types of marks:
• M marks: method marks are awarded for ‘knowing a method and attempting to apply it’, unless otherwise indicated.
• A marks: Accuracy marks can only be awarded if the relevant method (M) marks have been earned.
• B marks are unconditional accuracy marks (independent of M marks)
• Marks should not be subdivided.
3. Abbreviations
These are some of the traditional marking abbreviations that will appear in the mark schemes and can be used if you are using the annotation facility on ePEN.
• bod – benefit of doubt • ft – follow through • the symbol will be used for correct ft • cao – correct answer only • cso - correct solution only. There must be no errors in this part of the question to obtain this mark • isw – ignore subsequent working • awrt – answers which round to • SC: special case • oe – or equivalent (and appropriate) • dep – dependent • indep – independent • dp decimal places
• sf significant figures
• The answer is printed on the paper • The second mark is dependent on gaining the first mark
GCE Statistics S3 (6691) June 2011 1
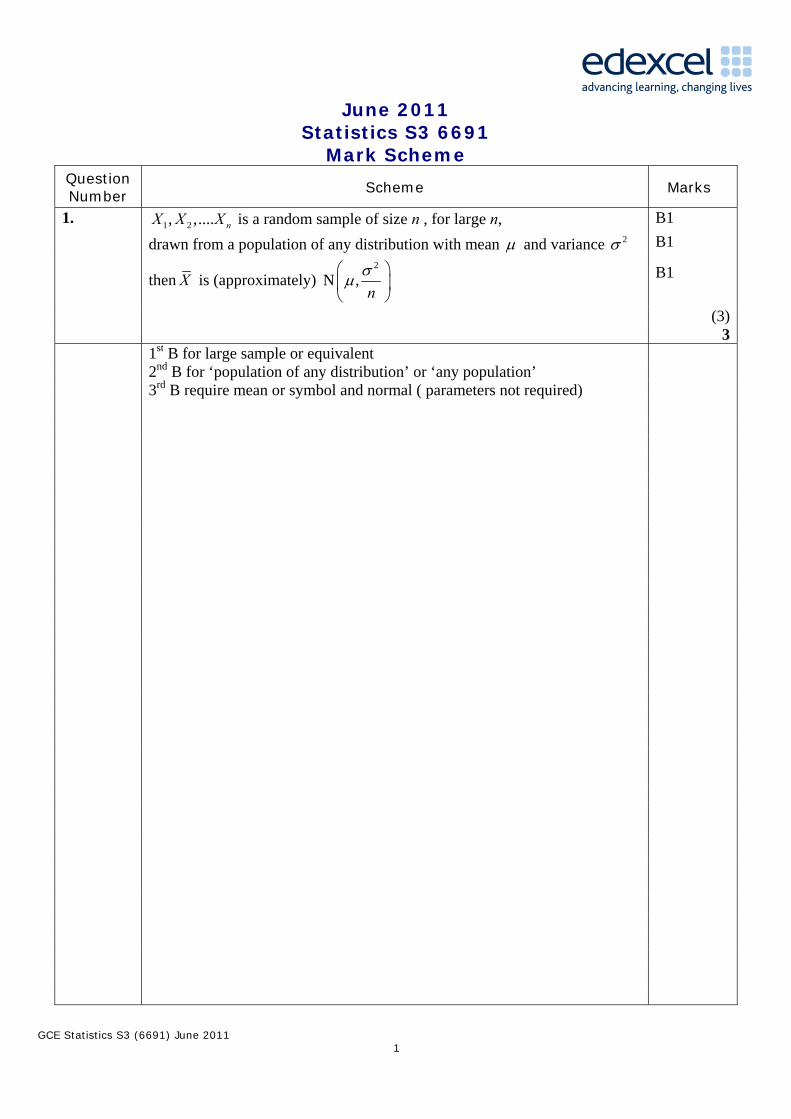
June 2011 Statistics S3 6691
Mark Scheme Question Number
Scheme Marks
1. 1 2, ,.... nX X X is a random sample of size n , for large n, B1 drawn from a population of any distribution with mean µ and variance 2σ B1
then X is (approximately) 2
N ,nσµ
⎛ ⎞⎜ ⎟⎝ ⎠
B1
(3) 3 1st B for large sample or equivalent 2nd B for ‘population of any distribution’ or ‘any population’ 3rd B require mean or symbol and normal ( parameters not required)

GCE Statistics S3 (6691) June 2011 2
Question Number Scheme Marks
2. (a) Town A B C D E F G
h rank 1 5 2 3 7 4 6 c rank 4 3 2 1 6 7 5 d 3 2 0 2 1 3 1 M1 2d 9 4 0 4 1 9 1 M1 2 28d =∑ M1A1
6 2817 48sr×
= −×
M1
0.5= A1
(6)
(b) 0 1H : 0,H : 0ρ ρ= ≠ B1 Critical values are 0.7857sr = ± B1ft 0.5<0.7857 insufficient evidence to reject 0H M1 Councillor’s claim is supported. A1ft (4) 10

GCE Statistics S3 (6691) June 2011 3
Question Number
Scheme Marks
Notes (a) 1st M1 for an attempt to rank the hardship against calls
2nd M1 for attempting d for their ranks. Must be using ranks. 3rd M1 for attempting 2d∑ (must be using ranks) 1st A1 for sum of 28 (or 84) 4th M1 for use of the correct formula with their 2d∑ . If answer is not
correct an expression is required.
2nd A1 for awrt 0.5 (or -0.5) (b) 1st B1 for both hypotheses in terms of ρ, 1H must be two tail.
2nd B1 for cv of +0.7857 (or 0.7143 to ft from 1-tailed 1H ) M1 for a correct statement relating their sr with their cv but cv must
be such that |cv|<1
A1ft for a correct contextualised comment. Must mention “Councillor” and “claim” or “hardship” and “number of calls (to the emergency services)”
Follow through their sr and their cv (provided it is |cv| <1 Condone use of “association” in conclusion for A1 Condone ‘positive’ in conclusion.

GCE Statistics S3 (6691) June 2011 4
Question Number
Scheme Marks
3. Defect Type
Shift D1 D2
First Shift 47.25 15.75 63 Second Shift 56.25 18.75 75 Third Shift 46.5 15.5 62 150 50 200 M1A1 0
1
H : Type of defect is independent of Shift (no association)H : Type of defect is not independent of Shift (association)
B1
O E 2( )O E
E−
2i
i
OE
45 47.25 0.1071… 42.857... 18 15.75 0.3214… 20.571.. 55 56.25 0.02777… 53.777... 20 18.75 0.0833… 21.333... 50 46.5 0.2634… 53.763... 12 15.5 0.7903… 9.290... M1A1 2( )O E
E− =1.5934.. or
2i
i
OE
-200=201.5934-200=1.5934.. awrt1.59 A1
(3 1)(2 1) 2ν = − − = B1 2
2 (0.10) 4.605χ = B1ft 1.59<4.605 so insufficient evidence to reject 0H M1 Insufficient evidence to support manager’s belief /claim. A1 10

GCE Statistics S3 (6691) June 2011 5
Question Number
Scheme Marks
Notes 1st M1 for some use of Row Total Col.TotalGrand Total
× May be implied by correct
iE
1st A1 for all expected frequencies correct B1 for both hypotheses. Must mention “defect” and “shift” at least
once Use of “relationship” or “correlation” or “connection” is B0
2nd M1 for at least two correct terms (as in 3rd or 4th column) or correct expressions with their iE
2nd A1 for all correct terms. May be implied by a correct answer.(2 dp or better-allow eg 0.10…)
3rd M1 for a correct statement linking their test statistic and their cv . Must be 2χ not normal.
4th A1 for a correct comment in context - must mention “manager’s belief” or “shift” and “defect type” - condone “relationship” or “connection” here but not “correlation”. No follow through e.g. “There is evidence of a relationship between shift and type of defect”

GCE Statistics S3 (6691) June 2011 6
Question Number
Scheme Marks
4. (a) 5.66
805320
==x M1,A1
79
)5.66(80392000 22 ×−=s M1A1ft
= 483.797… awrt 484 A1
(5)
(b) H0: nmm µµ = , H1: nmm µµ > (accept 1 2,µ µ with definition)
B1B1
6044.446
80797.483
5.660.69
+
−=z M1dM1
= 0.6807 awrt 0.681 A1 One tailed cv 1.6449 (Probability is awrt
0.752) B1
0.6807<1.6449 (or 0.248>0.05) insufficient evidence to reject 0H dM1 Mean money spent is not greater with music playing. A1ft
(8) 13

GCE Statistics S3 (6691) June 2011 7
Question Number
Scheme Marks
(b)
Notes No definition award B1B0.
1st M1 for attempt at s.e. - condone one number wrong or switched 60 & 80 .
2nd dM1 for using their s.e. in correct formula for test statistic. 3rd dM1 dep. on 2nd M1 for a correct statement based on their normal cv
and their test statistic
2nd A1 for correct comment in context. Must mention “money spent” and “music playing”. Allow ft.
Critical Region for (b) Standard error x z value for 2nd M1 Standard error x 1.6449= awrt 6.04 for 1st A1 2.5<6.04

GCE Statistics S3 (6691) June 2011 8
Question Number
Scheme Marks
5. (a) Hurricanes: occur singly / are independent or occur at random /are a rare
event / at a constant rate B1B1
(2)
(b) From data 1 2 2 5 3 17 .. 7 12 4.4875
80× + × + × + + ×
= M1A1
(2) No of
hurricanes, h
0 1 2 3 4 5 6 7+
(c) (80P X h=
0.9 4..038 r=9.06… 13.55 s=15.205 13.647… 10.2
06… 13.388… M1A1A1
Combine to give expected frequencies >5
13.9991 13.55 15.205… 13.647… 10.206… 13.388…
(3)
Observed 7 17 20 12 12 12 (d) 2
( )O E
E
−
3.499… 0.876… 1.511… 0.198… 0.315… 0.143…
M1
2i
i
OE
3.500...
21.322...
26.306...
10.551...
14.108...
10.755..
H0: Poisson distribution is a good fit o.e.
H1: Poisson distribution is not a good fit o.e. B1
∑
2( )i i
i
O EE− =6.545.. or
2i
i
OE
=86.545-80=6.545.. (awrt 6.55 or
6.54)
A1
426 =−=ν B1 cv is 9.488 (ft their ν i.e.
2 (0.05)νχ ) B1ft
6.545<9.488 so insufficient evidence to reject 0H (Hurricanes) can be modelled by a Poisson distribution A1 (6) 13

GCE Statistics S3 (6691) June 2011 9
Question Number
Scheme Marks
(b)
Notes M for at least 2 terms on numerator. 359/80 only award M0A0
(c) M for 80xPoisson probability with 4.4875 and either 2 or 4. 1st A1 for awrt 9.06 and 2nd A1 for awrt 15.20 or 15.21
(d) 1st M1 for some pooling and attempting ( )2 2
or O E O
E E− , at least 3 correct
expressions or values.
1st B1 no value for parameter permitted 2nd A1 for a correct comment suggesting that Poisson model is suitable.
No ft
GCE Statistics S3 (6691) June 2011 10
Question Number
Scheme Marks
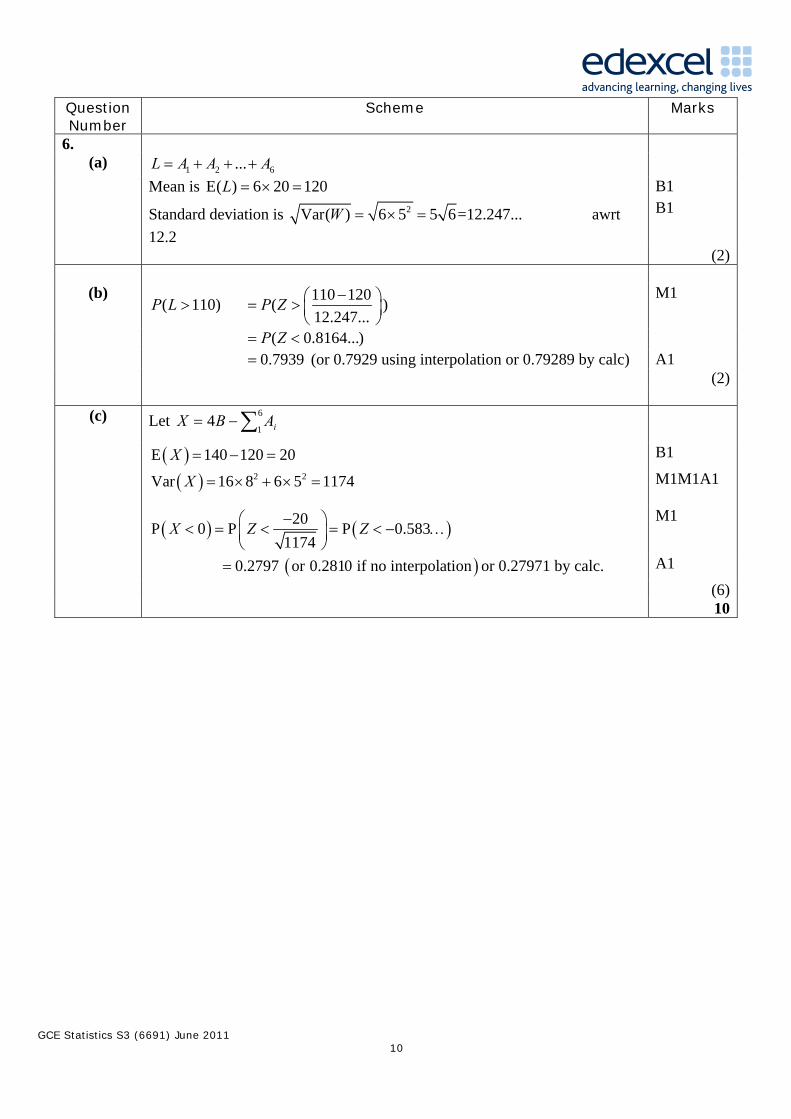
6. (a) 1 2 6...L A A A= + + +
Mean is E( ) 6 20 120L = × = B1 Standard deviation is 2Var( ) 6 5 5 6=12.247...W = × = awrt
12.2
B1
(2)
(b) 110 120( 110) (12.247...
P L P Z −⎛ ⎞> = > ⎜ ⎟⎝ ⎠
) M1
( 0.8164...)P Z= < 0.7939= (or 0.7929 using interpolation or 0.79289 by calc) A1 (2)
(c) Let ∑−=6
14 iABX
( )E 140 120 20X = − = B1
( ) 2 2Var 16 8 6 5 1174X = × + × = M1M1A1
( ) ( )20P 0 P P 0.583
1174X Z Z−⎛ ⎞< = < = < − …⎜ ⎟
⎝ ⎠
M1
( )0.2797 or 0.2810 if no interpolation= or 0.27971 by calc. A1
(6) 10

GCE Statistics S3 (6691) June 2011 11
Question Number
Scheme Marks
(b)
Notes M1 for identifying a correct probability (they must have the 110) and attempting to standardise with their mean and sd. This can be implied by the correct answer.
A1 for awrt 0.794 or 0.793 (c) Accept ±20 for B mark. Only award for probability statement if 2 terms in
var
1st M1 for 1024, 2nd M1 for 150 3rd M for standardising with their mean and 2 term sd and finding
probability <0.5
2nd A1 for awrt 0.280 or 0.281

GCE Statistics S3 (6691) June 2011 12
Question Number
Scheme Marks
7. (a) H0:µ=250, H1:µ<250, B1
248 2505.490
z −=
M1
3.513...= − awrt -3.51
A1
Critical value -1.6449 B1 -3.513..<-1.6449 so sufficient evidence to reject 0H Manager’s claim is justified. A1
(5)
(b) 98% CI for µ is 5.4248 2.3263
90± ×
M1B1
= awrt (247,249) dependent upon z value awrt 2.33
A1A1
(4)
(c) Hypothesis test is significant or CI does not contain stated weight. B1 (Manager should ask the company to investigate if their) stated weight is
too high o.e. B1
(2)
(d) ( 1) 0.98P x µ− < =
1 2.32633n
= M1 A1
2(3 2.3263) 48.7...n = × = dM1A1
Sample size 49 required. A1 (5) 16

GCE Statistics S3 (6691) June 2011 13
Question Number
Scheme Marks
(a)
Notes 1st B1 for H0 and for H1 (must be <250) They must use µ not x, p, λ or x etc
1st M1 for attempt at standardising using 248, 250 and sd. Can accept +. Critical region: 250-0.936=249.064 for M1A1 (and compare with 248.) 3rd B1 for +1.6449 seen (or probability of 0.0002 or better) 2nd A1 for a correct contextualised comment. Must mention “Manager”
and “claim” or “weight” and “stated weight”. No follow through. (b) 2.3263 or better for B mark. Any z value replacing 2.3263 award M. (d) 1st M for LHS = z value >1
1st A for RHS awrt 2.33 2nd A1 for answers in the range 48.7-48.9 3rd A1 don’t condone ≥


Further copies of this publication are available from
Edexcel Publications, Adamsway, Mansfield, Notts, NG18 4FN
Telephone 01623 467467
Fax 01623 450481 Email [email protected] Order Code UA028846 June 2011
For more information on Edexcel qualifications, please visit www.edexcel.com/quals
Pearson Education Limited. Registered company number 872828 with its registered office at Edinburgh Gate, Harlow, Essex CM20 2JE
Mark Scheme (Results)
Summer 2012
GCE Statistics S3 (6691) Paper 1

Edexcel and BTEC Qualifications
Edexcel and BTEC qualifications come from Pearson, the world’s leading learning company. We provide a wide range of qualifications including academic, vocational, occupational and specific programmes for employers. For further information, please visit our website at
www.edexcel.com.
Our website subject pages hold useful resources, support material and live feeds from our subject advisors giving you access to a portal of information. If you have any subject specific questions about this specification that require the help of a subject specialist, you may find our
Ask The Expert email service helpful.
www.edexcel.com/contactus
Pearson: helping people progress, everywhere Our aim is to help everyone progress in their lives through education. We believe in every kind
of learning, for all kinds of people, wherever they are in the world. We’ve been involved in
education for over 150 years, and by working across 70 countries, in 100 languages, we have
built an international reputation for our commitment to high standards and raising achievement
through innovation in education. Find out more about how we can help you and your students
at: www.pearson.com/uk
Summer 2012
Publications Code UA033146
All the material in this publication is copyright
© Pearson Education Ltd 2012

General Marking Guidance
• All candidates must receive the same treatment. Examiners must mark the first
candidate in exactly the same way as they mark the last.
• Mark schemes should be applied positively. Candidates must be rewarded for what they have shown they can do rather than penalised for omissions.
• Examiners should mark according to the mark scheme not according to their perception of where the grade boundaries may lie.
• There is no ceiling on achievement. All marks on the mark scheme should be used appropriately.
• All the marks on the mark scheme are designed to be awarded. Examiners should always award full marks if deserved, i.e. if the answer matches the mark scheme. Examiners should also be prepared to award zero marks if the candidate’s response is not worthy of credit according to the mark scheme.
• Where some judgement is required, mark schemes will provide the principles by which marks will be awarded and exemplification may be limited.
• When examiners are in doubt regarding the application of the mark scheme to a candidate’s response, the team leader must be consulted.
• Crossed out work should be marked UNLESS the candidate has replaced it with an alternative response.
Hypothesis Tests (Final M1A1) For an incorrect comparison (e.g. probability with z value) even with a correct statement and/or
comment award M0A0 For a correct or no comparison with more than one statement one of which is false Award M0A0 (This is compatible with the principle above of contradictory statements being penalised) Apply these rules to all questions
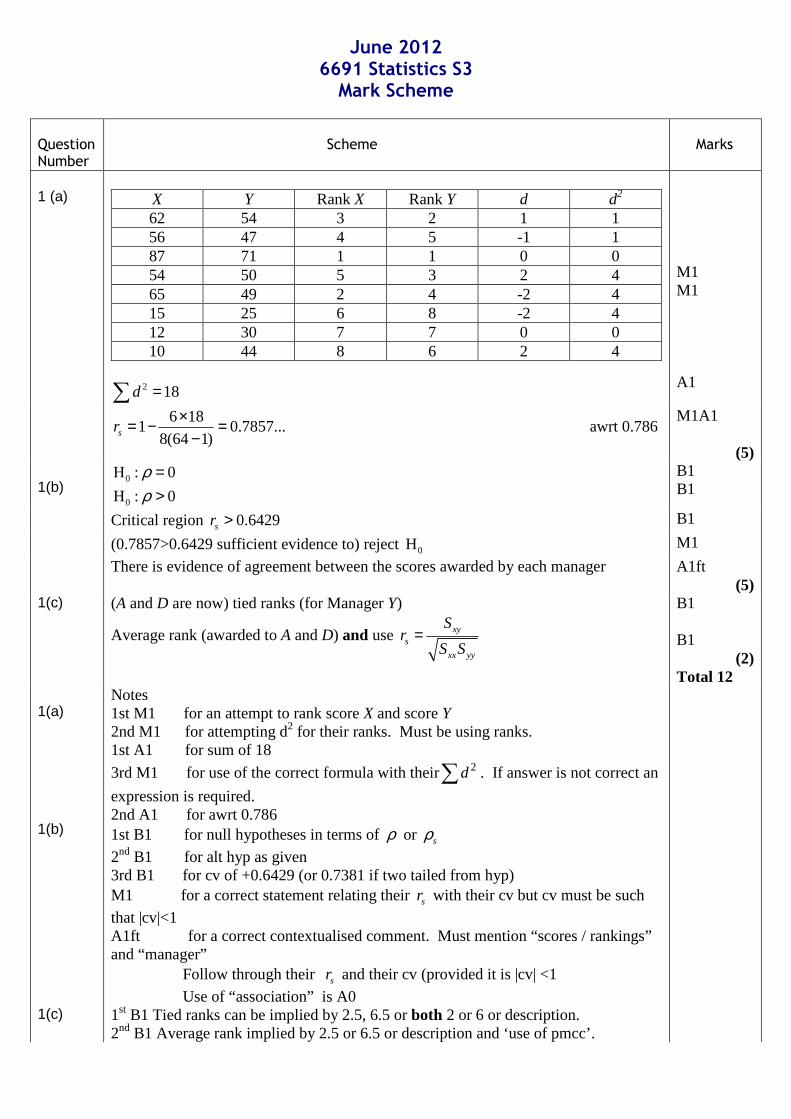
June 2012 6691 Statistics S3
Mark Scheme Question Number
Scheme
Marks
1 (a)
X Y Rank X Rank Y d d2
62 54 3 2 1 1 56 47 4 5 -1 1 87 71 1 1 0 0 54 50 5 3 2 4 65 49 2 4 -2 4 15 25 6 8 -2 4 12 30 7 7 0 0 10 44 8 6 2 4
2 18d =∑
M1 M1 A1
6 181 0.7857...
8(64 1)sr×= − =
− awrt 0.786
M1A1
(5) 1(b)
0H : 0ρ =
0H : 0ρ >
B1 B1
Critical region 0.6429sr > B1
(0.7857>0.6429 sufficient evidence to) reject 0H M1
There is evidence of agreement between the scores awarded by each manager A1ft (5)
1(c) (A and D are now) tied ranks (for Manager Y)
Average rank (awarded to A and D) and use xys
xx yy
Sr
S S=
B1 B1
(2) Total 12
1(a) 1(b) 1(c)
Notes 1st M1 for an attempt to rank score X and score Y 2nd M1 for attempting d2 for their ranks. Must be using ranks. 1st A1 for sum of 18
3rd M1 for use of the correct formula with their 2d∑ . If answer is not correct an
expression is required. 2nd A1 for awrt 0.786 1st B1 for null hypotheses in terms of ρ or sρ
2nd B1 for alt hyp as given 3rd B1 for cv of +0.6429 (or 0.7381 if two tailed from hyp) M1 for a correct statement relating their sr with their cv but cv must be such
that |cv|<1 A1ft for a correct contextualised comment. Must mention “scores / rankings” and “manager” Follow through their sr and their cv (provided it is |cv| <1
Use of “association” is A0 1st B1 Tied ranks can be implied by 2.5, 6.5 or both 2 or 6 or description. 2nd B1 Average rank implied by 2.5 or 6.5 or description and ‘use of pmcc’.

Question Number
Scheme
Marks
2(a)
Sampling frame within each species of fish in the lake impossible to obtain.
B1
(1) 2(b) Quota sampling B1
(1) 2(c) Advantages:
Sample can be obtained quickly Costs are kept to a minimum Administration of survey is easy
B1
Disadvantages: Not possible to estimate sampling errors Process not random Surveyor may not be able to identify species of fish easily
B1
(2) 2(d)
Species Quota Trout 1400
30 17.142450
× =
Bass 60030 7.35
2450× =
Pike 45030 5.51
2450× =
Fish are caught from the lake until the quota of 17 trout, 7 bass and 6 pike are reached. If a fish is caught and the species quota is full, then this is ignored.
B1B1B1 B1
(4) 2(a) 2(c) 2(d)
Notes ‘You can’t / it’s very difficult to number all the fish’ or equivalent Correct answer to (b) required. Some detail required. 1st B1 any one correct calculation seen or implied 2nd B1 all correct to at least 1 dp 3rd B1 for 17,7,6 4th B1 accept equivalent statement. Require comment on what to do with ‘extra fish’.
Total 8
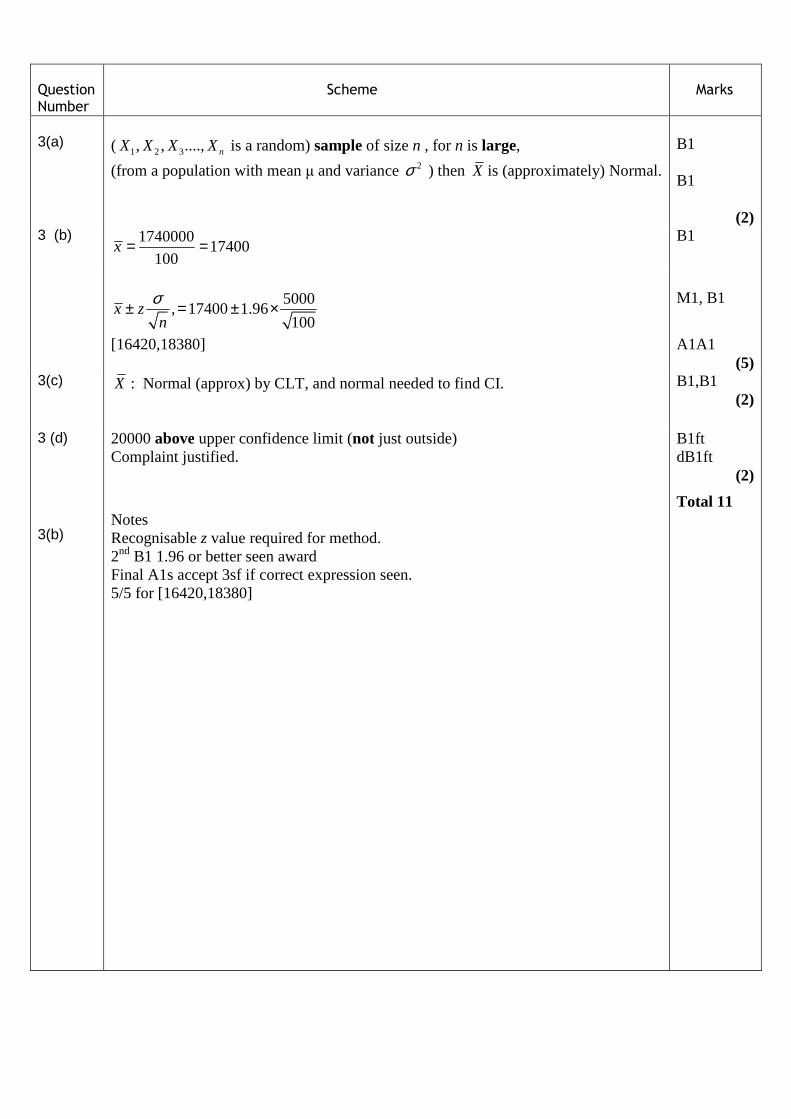
Question Number
Scheme
Marks
3(a)
( 1 2 3, , ...., nX X X X is a random) sample of size n , for n is large,
(from a population with mean µ and variance 2σ ) then X is (approximately) Normal.
B1 B1
(2) 3 (b) 1740000
17400100
x = = B1
5000
, 17400 1.96100
x zn
σ± = ± ×
M1, B1
[16420,18380]
A1A1 (5)
3(c)
X : Normal (approx) by CLT, and normal needed to find CI.
B1,B1 (2)
3 (d) 20000 above upper confidence limit (not just outside)
Complaint justified. B1ft dB1ft
(2)
3(b)
Notes Recognisable z value required for method. 2nd B1 1.96 or better seen award Final A1s accept 3sf if correct expression seen. 5/5 for [16420,18380]
Total 11

Question Number
Scheme
Marks
4
0H :Egg yield and breed of chicken are independent (not associated)
1H : Egg yield and breed of chicken are dependent (associated)
B1
Egg Yield
Breed Low Medium High Total
Leghorn 100 3624
150
× = 100 8456
150
× = 100 3020
150
× = 100
Cornish 50 3612
150× = 50 84
28150
× = 50 3010
150
× = 50
Total 36 84 30 150
M1A1
O E 2( )O E
E
−∑
2O
E∑
22 24 0.166667 20.2
52 56 0.285714 48.3
26 20 1.8 33.8
14 12 0.333333 16.3
32 28 0.571429 36.6
4 10 3.6 1.6
M1A1
2( )6.757...
O E
E
− =∑ or 2
100 6.757...O
E− =∑
A1
222, (5%) 5.991ν χ= = B1B1ft
(6.757>5.991 so sufficient evidence to) reject 0H M1
Egg yield and breed of chicken are dependent (associated)
A1 (10)
Notes B1 for both hypotheses. Must mention “yield” and “breed” in both but condone ditto marks. Use of “relationship” or “correlation” or “connection”is B0
1st M1 for some use of Row Total Col.Total
Grand Total
× . May be implied by a correct iE
1st A1 for all expected frequencies correct 2nd M1 for at least two correct terms or correct expressions with their iE
2nd A1 for all correct terms. May be implied by a correct answer (2 sf or better) 3rd M1 for a correct statement linking their test statistic and their cv . Must be 2χ not normal. 4th A1 for a correct comment in context - must mention “egg yield” and “breed of chicken” - condone “relationship” or “connection” here but not “correlation”. No follow through e.g. “There is no evidence of a relationship between egg yield and breed of chicken” is A0 whatever their test stat or cv.
Total 10

Question Number
Scheme
Marks
5(a)
0H : A Bµ µ=
1H : A Bµ µ≠ B1
(80 74)
100 22529 26
z± −=
+
M1A1
1.7247...z = ± awrt 1.72± A1 1.7247>1.6449 o.e. so reject 0H dM1
There is evidence of a difference in the (mean) scores of their students. A1 (6)
5(b)
(For z=1.6, test above not significant so no evidence of a difference.)
For Mr A’s claim, 0H : A Bµ µ= , 1H : A Bµ µ> , and critical value is z=1.2816 B1, B1
(Both z values significant,) Mr Alan’s claim supported. B1 (3)
5(a) 5(b)
Notes 1st M1 for attempt at s.e. (condone one number wrong) and for using their s.e. in correct formula for test statistic. 1st A1 for correct expression for se 2nd dM1 dep. on 1st M1 for a correct statement based on their normal cv and their test statistic 3rd A1 for correct comment in context. Must mention “scores” and “students / groups/classes” Award A0 for a one-tailed comment. 1st B1 Alternative hyp should be clearly defined
Total 9

Question Number
Scheme
Marks
6(a)
Mean=1 16 2 20 ... 6 8
2.91100
× + × + + × = **ag**
M1A1
(2)
6(b) 2.910.485
6p = =
B1
6 3 33100 C 0.485 0.515 31.17a = × × × = M1A1
6100 0.485 1.3(0)b = × = A1 (4)
6(c) 0H :Binomial is a good fit
1H :Binomial is a not a good fit
B1
Number of defective items
0 or 1 2 3 4 5 or 6
O 22 20 23 17 18 E 12.41 24.82 31.17 22.01 9.59
M1
2 2 2 2( ) (22 12.41) (20 24.82) (18 9.59)... 18.998...
12.41 24.82 9.59
O E
E
− − − −= + + + =∑ awrt 19.0 M1A1
ν =5-2=3 degrees of freedom B1 2
3 (5%) 7.815χ = B1ft
18.998...>7.815 so reject 0H M1
Binomial is a not a good fit (and is not a good model for the number of defective items in samples of size 6)
A1 (8)
6(a) 6(b) 6(c)
Notes 1st M At least 2 correct terms on numerator and 100 for denominator. 0.485 can be implied by at least 1 correct answer. Accept awrt 2dp for final answers Clear use of Binomial and x100 required for method. Parameters in hyps award B0 1st M1 for combining either 0 and 1 or 5 and 6 or both. Require at least 1 value in a combined correct.
2nd M1 for attempting ( )2 2
or O E O
E E
− , at least 2 correct expressions or values.
2nd A1 for a correct comment suggesting that Binomial model is not suitable. No ft Condone parameters here.
Total 14

Question Number
Scheme
Marks
7(a)
N(177,25)M : , N(163,16)F :
E( ) 177 163 14M F− = − = B1
Var( ) 25 16 41M F− = + = M1A1
N(14,41)M F− :
14 14P( 0) P or P
41 41M F Z Z
− − > = > <
M1
P( 2.186...)Z= <
0.9854= or 0.9856 by calculator awrt 0.985 or 0.986 A1 (5)
7(b) 1 2 6 1 2 4... ...W M M M F F F= + + + + +
E( ) 6 177 4 163W = × + × 1714= B1
Var( ) 6 25 4 16W = × + × M1
214= A1
1700 1714 1714 1700P( 1700) P or P
214 214W Z Z
− − < = < >
M1
P( 0.957..)Z= < − awrt 0.96 or 0.96ZZ − >< A1 1 0.8315= −
0.1685= awrt 0.169 (0.1693 by calculator)
A1
(6) 7(a)and (b)
Notes Condone reversed sds for method in (b) Accept metres: 2.14 award M1A0 in metres. 2nd M1s for identifying a correct probability and attempting to standardise with their mean and sd. Require explicit sd or accept 1156 for M1A0. This can be implied by the correct answer.
Total 11


Further copies of this publication are available from
Edexcel Publications, Adamsway, Mansfield, Notts, NG18 4FN
Telephone 01623 467467
Fax 01623 450481 Email [email protected]
Order Code UA033146 Summer 2012
For more information on Edexcel qualifications, please visit our website www.edexcel.com
Pearson Education Limited. Registered company number 872828 with its registered office at Edinburgh Gate, Harlow, Essex CM20 2JE

Mark Scheme (Results) Summer 2013 GCE Statistics 3 (6691/01R)

Edexcel and BTEC Qualifications Edexcel and BTEC qualifications come from Pearson, the world’s leading learning company. We provide a wide range of qualifications including academic, vocational, occupational and specific programmes for employers. For further information, please visit our website at www.edexcel.com. Our website subject pages hold useful resources, support material and live feeds from our subject advisors giving you access to a portal of information. If you have any subject specific questions about this specification that require the help of a subject specialist, you may find our Ask The Expert email service helpful. www.edexcel.com/contactus Pearson: helping people progress, everywhere Our aim is to help everyone progress in their lives through education. We believe in every kind of learning, for all kinds of people, wherever they are in the world. We’ve been involved in education for over 150 years, and by working across 70 countries, in 100 languages, we have built an international reputation for our commitment to high standards and raising achievement through innovation in education. Find out more about how we can help you and your students at: www.pearson.com/uk Summer 2013 Publications Code UA037014 All the material in this publication is copyright © Pearson Education Ltd 2013

General Marking Guidance
• All candidates must receive the same treatment. Examiners must mark the first candidate in exactly the same way as they mark the last.
• Mark schemes should be applied positively. Candidates must be rewarded for what they have shown they can do rather than penalised for omissions.
• Examiners should mark according to the mark scheme not according to their perception of where the grade boundaries may lie.
• There is no ceiling on achievement. All marks on the mark scheme should be used appropriately.
• All the marks on the mark scheme are designed to be awarded. Examiners should always award full marks if deserved, i.e. if the answer matches the mark scheme. Examiners should also be prepared to award zero marks if the candidate’s response is not worthy of credit according to the mark scheme.
• Where some judgement is required, mark schemes will provide the principles by which marks will be awarded and exemplification may be limited.
• Crossed out work should be marked UNLESS the candidate has replaced it with an alternative response.

EDEXCEL GCE MATHEMATICS
General Instructions for Marking
1. The total number of marks for the paper is 75.
2. The Edexcel Mathematics mark schemes use the following types of marks:
• M marks: method marks are awarded for ‘knowing a method and attempting to apply it’, unless otherwise indicated.
• A marks: accuracy marks can only be awarded if the relevant method (M) marks have been earned.
• B marks are unconditional accuracy marks (independent of M marks) • Marks should not be subdivided.
3. Abbreviations
These are some of the traditional marking abbreviations that will appear in the mark schemes:
• bod – benefit of doubt • ft – follow through • the symbol will be used for correct ft • cao – correct answer only • cso - correct solution only. There must be no errors in this part of the question to
obtain this mark • isw – ignore subsequent working • awrt – answers which round to • SC: special case • oe – or equivalent (and appropriate) • dep – dependent • indep – independent • dp decimal places • sf significant figures • The answer is printed on the paper • The second mark is dependent on gaining the first mark
4. All A marks are ‘correct answer only’ (cao.), unless shown, for example, as A1 ft to
indicate that previous wrong working is to be followed through. After a misread however, the subsequent A marks affected are treated as A ft, but manifestly absurd answers should never be awarded A marks.
5. For misreading which does not alter the character of a question or materially simplify it,
deduct two from any A or B marks gained, in that part of the question affected.
6. If a candidate makes more than one attempt at any question: • If all but one attempt is crossed out, mark the attempt which is NOT crossed out. • If either all attempts are crossed out or none are crossed out, mark all the
attempts and score the highest single attempt.
7. Ignore wrong working or incorrect statements following a correct answer.
8. In some instances, the mark distributions (e.g. M1, B1 and A1) printed on the candidate’s response may differ from the final mark scheme.

Question Number Scheme Marks
1. Label females 1 – 100 (or 0 – 99) and males 1 – 300 ( or 0 – 299) B1
Using random numbers for each group B1
in range 1 – 100 (0 – 99) select 15 females and using 1 – 300 (or 0 – 299) select 45
males
B1
[Total 3]
Notes
1st B1 for labelling\numbering\listing females and males
2nd B1 for use of random numbers or “randomly select” in each group (may be implied)
3rd B1 for selecting the correct number of females and males
e.g. randomly select 45 males and 15 females scores 2nd and 3rd B marks since randomly
selecting and the “each group” is implied,
If using systematic sampling within each strata allow 1st B1 and 3rd B1 (if earned) but 2nd B0
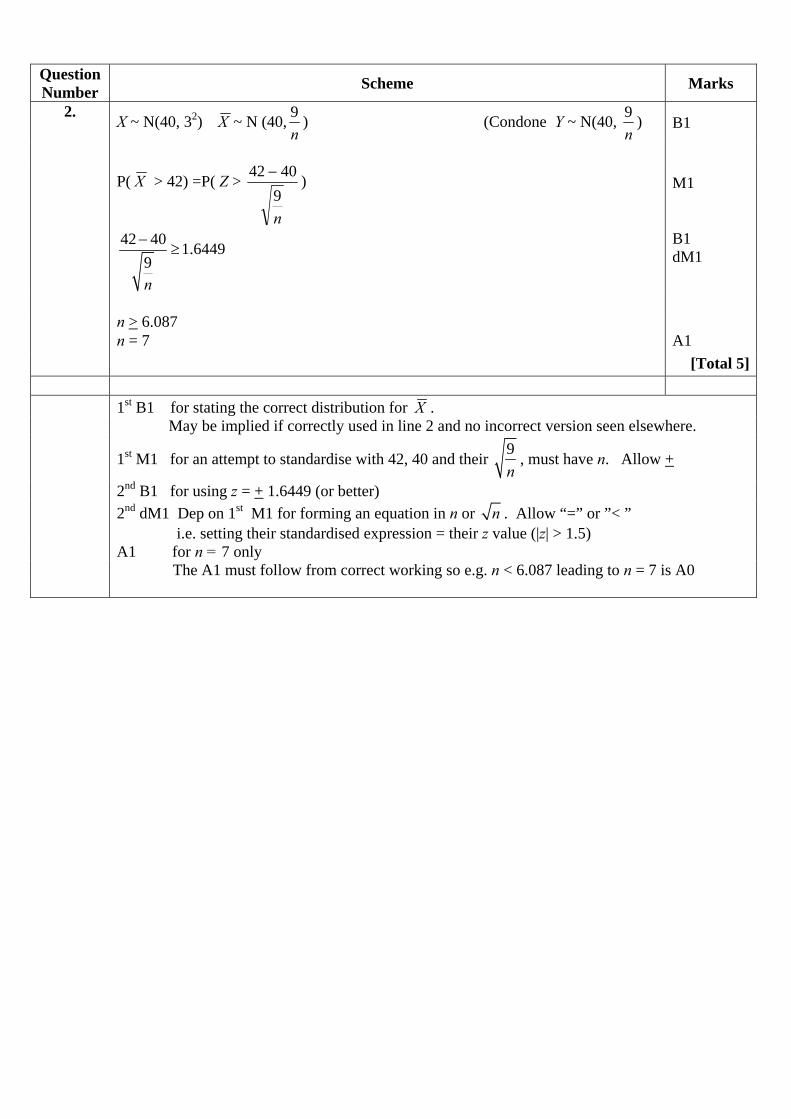
Question Number Scheme Marks
2. X ~ N(40, 32) X ~ N (40,n9 ) (Condone Y ~ N(40,
n9 ) B1
P( X > 42) =P( Z >
n94042 − )
M1
42 40 1.64499n
−≥ B1
dM1
n > 6.087 n = 7 A1 [Total 5]
1st B1 for stating the correct distribution for X . May be implied if correctly used in line 2 and no incorrect version seen elsewhere.
1st M1 for an attempt to standardise with 42, 40 and their 9n
, must have n. Allow +
2nd B1 for using z = + 1.6449 (or better) 2nd dM1 Dep on 1st M1 for forming an equation in n or n . Allow “=” or ”< ”
i.e. setting their standardised expression = their z value (|z| > 1.5) A1 for n = 7 only The A1 must follow from correct working so e.g. n < 6.087 leading to n = 7 is A0

Question Number Scheme Marks
3 (a) Town A B C D E F G H I J Pop 1 2 3 4 5 6 7 8 9 10 Empl 2 1 3 5 4 6 10 8 9 7
|d| 1 1 0 1 1 0 3 0 0 3 2d 1 1 0 1 1 0 9 0 0 9
M1
∑ = 222d M1A1
rs = 99102261××
− dM1
= 686.0165143
= awrt 0.867 A1 (5)
(b) H0 : ρ = 0 ; H1 : ρ > 0 B1
CV = 0.6485 B1 in critical region / significant/ reject H0 M1 evidence of positive correlation between population and no. of employees A1 (4)
(c) CV = 0.6319 B1 [not in critical region / not significant/ do not reject H0] No evidence of positive correlation B1 (2)
(d) No evidence to suggest that as pop’ increased the no. of employees increased linearly. Villages ranked highly for pop’ were also ranked highly for the no. of employees.
B1 B1
(2)ALT Alternate for part (d) if different conclusions in part (b) and part (c)
Data probably not (bivariate) normal therefore Spearman's coefficient is more suitable than the product moment correlation coefficient.
[Total 13]
Notes (a) 1st M1 for an attempt to rank no of employees against the populations
2nd M1 for attempting 2d∑ (must be using ranks) ft their ranks 1st A1 for 22 3rd dM1 dep on 1st M1 for use of the correct formula with their 2d∑ .
If ans. is not correct an expr’ is required.
(b) 1st B1 for both hypotheses in terms of ρ, 1H must be one tail and compatible with their ranking M1 for a correct statement relating their sr (| sr | < 1)with their cv but cv must be such that |cv|<1 A1 for a correct contextualised comment that is rejecting H0
Must mention “population” and “no. of employees” and “positive correlation”. Follow through their sr and their cv (provided it is |cv| <1 Use of “association” is A0
(c) 1st B1 for 0.6319 2nd B1 does not require context just no positive correlation mentioned
(d) 1st B1 for a comment relating to pmcc
(i) no linear relationship or (ii) pmcc requires (joint) normal distribution 2nd B1 for a second comment relating to Spearman’s
(i) there is a (non-linear) relationship between ranks.. or (ii) data not (joint) normal so Spearman’s is better

Question Number Scheme Marks
4 (a) 600
100282× (Do not accept 282 – 114.2 – 90.2 – 30.6 (o.e.))
B1 (1)
(b) 9 B1
(1)(c) 2.5 or better ( Do not accept 0.025) B1
(1)(d) H0: hair colour occurs in the ratio 2:6:1:3
H1: hair colour does not occur in the ratio 2:6:1:3 B1
black brown red blonde observed 105 282 48 165 expected 100 300 50 150
2( )i i
i
O EE−
0.25 1.08 0.08 1.5
2i
i
OE
110.25 265.08 46.08 181.5
B1expected M1 A1
∑
2( )i i
i
O EE− = 2.91 or ∑
I
I
Eo2
– 600 = 602.91 – 600 = 2.91 (awrt 2.91) A1
3=ν B1 cv is 7.815 B1 [2.91< 7.815] so insufficient evidence to reject 0H or not significant dM1 There is evidence to suggest that hair colour does occur in the given ratio. A1 (9) [Total 12] Notes
(d) 1st B1 for both hypotheses. Must mention hair colour and ratio e.g. “hair colour in the given ratio” Allow use of ditto
2nd B1 for all 4 correct expected frequencies 1st M1 for at least 2 correct calculations from 3rd or 4th row 1st A1 for all correct calculations to at least 3sf if row 4 If awrt 2.91 is seen with no incorrect working award B1M1A1A1 2nd dM1 Dep on 1st M1 for a correct statement linking their test statistic and their cv (cv > 3.5) 3rd A1 for a correct comment in context - must mention “hair colour” and “ratios” or “model”
e.g. “There is evidence of to support the given model” No follow through If hypotheses are the wrong way round score A0.

Question Number Scheme Marks
5 (a) ( )2.1218.11821
+=x = 120 B1
1.6449 (or better) B1 “ their 1.6449”
nσ = 121.2 – 120
M1
2.3263 (or better) B1
“ their 2.3263”nσ = ⎟
⎠⎞
⎜⎝⎛×
1.6449120 - 121.23263.2
dM1
So 98% C.I. = 120 + 1.424…= (118.3028…, 121.699…) awrt (118, 122) A1 (6)
(b) awrt (118π ,122π ) or (371/372, 382/383) B1ft (1)
(c) P (All) = (0.98)3 M1 = 0.941 A1 (2) [Total 9] Notes
(a) NB in part (a) only lose one of the B1 marks for not using the percentage points table 1st B1 for x = 120 2nd B1 for 1.6449 or better in an attempt (could be 1.6449σ = k or even 1.6449 2σ = k) Condone strange notation for standard error (E) here if it is used correctly 1st M1 for an attempt to find “width” or “half-width” of a 90% CI ft their z value (|z| > 1.5) e.g. for z E = 121.2 – 120 (o.e.) N.B. E = 0.7295... Condone missing 2 here. 3rd B1 for 2.3263 or better in an attempt at CI. If score 2nd B0 for using 1.64 or 1.645 allow 3rd B1 for 2.32 or 2.33 here 2nd dM1 for a correct attempt at “width” or “half-width” of a 98% CI ft their z value (|z| > 2)
Dependent on 1st M1 and ft their value or expression for s.e. A1 for lower limit in range [ 118, 118.35) and upper limit in range (121.65, 122] Answer only of awrt (118, 122) with no incorrect working seen scores 6/6/ if 1.6449 and 2.3263 are
seen and 5/6 (B1B1M1B0M1A1) otherwise.
(c) M1 for a correct expression i.e. (0.98)3 A1 for awrt 0.941
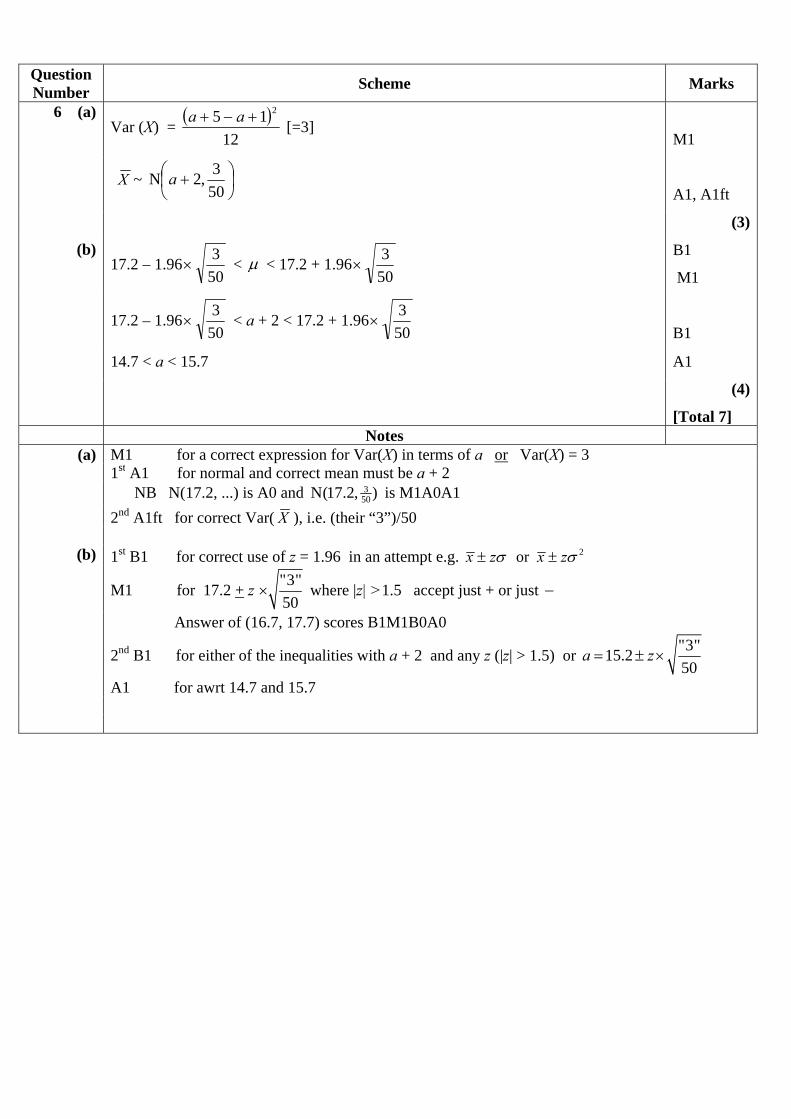
Question Number Scheme Marks
6 (a) Var (X) = ( )
1215 2+−+ aa [=3]
M1
X ~ ⎟
⎠⎞
⎜⎝⎛ +
503,2N a
A1, A1ft
(3)
(b) 17.2 – 1.96
503
× < µ < 17.2 + 1.96503
× B1
M1
17.2 – 1.96
503
× < a + 2 < 17.2 + 1.96503
×
B1
14.7 < a < 15.7 A1
(4)
[Total 7] Notes
(a) M1 for a correct expression for Var(X) in terms of a or Var(X) = 3 1st A1 for normal and correct mean must be a + 2 NB N(17.2, ...) is A0 and 3
50N(17.2, ) is M1A0A1 2nd A1ft for correct Var( X ), i.e. (their “3”)/50
(b) 1st B1 for correct use of z = 1.96 in an attempt e.g. 2 or x z x zσ σ± ±
M1 for 17.2 + z "3"50
× where |z| >1.5 accept just + or just −
Answer of (16.7, 17.7) scores B1M1B0A0
2nd B1 for either of the inequalities with a + 2 and any z (|z| > 1.5) or "3"15.250
a z= ± ×
A1 for awrt 14.7 and 15.7

Question Number Scheme Marks
7 (a) H0: ba µµ = , H1: ba µµ < B1
s.e. =15010
10025 22
+ ,
15010
10025
606722
+
−=z CR = 1.6449
15010
10025 22
+× M1,dM1
z = + 2.6616.... = + 4.326... (awrt 2.66/4.33) A1 One tailed critical value z = 1.6449 (or prob of awrt 0.004 (<0.05) ) B1 [Condone 0.996 if compared correctly with 0.95 for the B1] 2.6616 > 1.6449 so] significant evidence to reject 0H dM1 There is evidence that the amount of lead present in the soil has decreased. A1ft
(7)
(b) CLT enables you to assume that means are normally distributed B1 (1)
(c) Have assumed 22 σ=s or variance of sample = variance of population B1 (1) [Total 9] Notes
(a) 1st B1 for both hypotheses in terms of µ not words. Accept 1 2,µ µ etc if there is some indication of which is which e.g X ~ N(67, 252) implies X is “before”.
1st M1 for attempt at s.e. - condone one number wrong or mis-matched variances i.e. p r
q s+ (3 of p,q,r& s correct) or 2 210 25
100 150+ 2nd dM1 Dep on 1st M1 for using their s.e. in correct formula for test statistic. Num of + (67 – 60)
or for correct expression for CR 3rd dM1 dep. on 2nd M1 for a correct statement based on their normal cv (|cv| > 1.5) and their test statistic 2nd A1ft for correct comment in context. Must mention “lead” or “soil” and “factory”. Allow ft If hypotheses are the wrong way round score A0 If hypotheses are not for a difference between 2 means award A0
(b) B1 must mention mean and normal. In words or symbols e.g. ~ N(...X

Question Number Scheme Marks
8 (a) Let W = 1 2D D− M1 W ~ N(0, 2.88) A1, A1 P(|W |>3) = 2×P(W >3) M1
= 2 × ⎟⎟⎠
⎞⎜⎜⎝
⎛ −>
88.203P Z dM1
= 2 ×P(Z > 1.76776….) = 2 × (1 – 0.9616) = 0.0768 awrt 0.077 A1 (6)
(b) Let 4 45 55 4 or 4 5 or or T C D D C C D D C= − − − − M1
T~ N( + 4, 39.04) or N( + 0.8, 1.5616) A1 A1
P(T < 0) = ⎟⎟⎠
⎞⎜⎜⎝
⎛ −<
04.3940P Z or ⎟⎟
⎠
⎞⎜⎜⎝
⎛ −<
5616.18.00P Z M1
= P(Z < -0.64018….) = (1 – 0.7389) = 0.2611 awrt 0.261 A1 (5)
(c) Let P = D+ D + D + D + D + D +B M1 Let Q = C+ C + C + C + C + C +B P~ N(352, 13.64) and Q ~ N(292, 8.84) A1, A1 [Let R= P – Q] R ~ N(± 60, 22.48) M1
P(R > 50) = ⎟⎟⎠
⎞⎜⎜⎝
⎛ −>
48.226050P Z dM1
= P(Z > − 2.10….)
= 0.9821 awrt 0.982 ~ 0.983 A1
(6) [Total 17] Notes Award full marks in each part for a correct answer with no incorrect working seen.
(a) 1st M1 for explicitly defining a suitable W and attempt to find the distribution of W. May be implied by sight of N(0, 2.88) 1st A1 for normal and mean of 0, 2nd A1 for variance of 2.88. Award M1A1A1 for N(0, 2.88) seen. 2nd M1 for realising need 2×P(W > 3) 3rd dM1 Dep on 1st M1 for standardising with 3, 0 and their s.d. Must lead to P(Z > +ve) (o.e.)
(b) 1st M1 for explicitly defining a suitable T but may be implied by sight of one of these normals 1st A1 for normal and correct mean, 2nd A1 for correct variance. Accept awrt 3sf i.e. 39.0, 1.56 2nd M1 for standardising with 0 and their mean and their s.d. Must lead to P(Z < -ve) (o.e.)
(c) 1st M1 for explicitly defining a correct P or Q. May be implied by a correct distribution for P or Q 1st A1 for a correct distribution for P 2nd A1 for a correct distribution for Q 2nd M1 for attempting R and obtaining its distribution- ft their P and Q means and variances 3rd dM1 for attempting P(R > 50) and standardising with 50 and their E(R) and their Var( )R
Dependent on 2nd M1. Must lead to a P(Z > -ve) (o.e.)

Further copies of this publication are available from
Edexcel Publications, Adamsway, Mansfield, Notts, NG18 4FN
Telephone 01623 467467
Fax 01623 450481 Email [email protected]
Order Code UA037014 Summer 2013
For more information on Edexcel qualifications, please visit our website www.edexcel.com
Pearson Education Limited. Registered company number 872828 with its registered office at Edinburgh Gate, Harlow, Essex CM20 2JE

Mark Scheme (Results) Summer 2013 GCE Statistics 3 (6691/01)

Edexcel and BTEC Qualifications Edexcel and BTEC qualifications come from Pearson, the world’s leading learning company. We provide a wide range of qualifications including academic, vocational, occupational and specific programmes for employers. For further information, please visit our website at www.edexcel.com. Our website subject pages hold useful resources, support material and live feeds from our subject advisors giving you access to a portal of information. If you have any subject specific questions about this specification that require the help of a subject specialist, you may find our Ask The Expert email service helpful. www.edexcel.com/contactus Pearson: helping people progress, everywhere Our aim is to help everyone progress in their lives through education. We believe in every kind of learning, for all kinds of people, wherever they are in the world. We’ve been involved in education for over 150 years, and by working across 70 countries, in 100 languages, we have built an international reputation for our commitment to high standards and raising achievement through innovation in education. Find out more about how we can help you and your students at: www.pearson.com/uk Summer 2013 Publications Code UA037011 All the material in this publication is copyright © Pearson Education Ltd 2013

General Marking Guidance
• All candidates must receive the same treatment. Examiners must mark the first candidate in exactly the same way as they mark the last.
• Mark schemes should be applied positively. Candidates must be rewarded for what they have shown they can do rather than penalised for omissions.
• Examiners should mark according to the mark scheme not according to their perception of where the grade boundaries may lie.
• There is no ceiling on achievement. All marks on the mark scheme should be used appropriately.
• All the marks on the mark scheme are designed to be awarded. Examiners should always award full marks if deserved, i.e. if the answer matches the mark scheme. Examiners should also be prepared to award zero marks if the candidate’s response is not worthy of credit according to the mark scheme.
• Where some judgement is required, mark schemes will provide the principles by which marks will be awarded and exemplification may be limited.
• Crossed out work should be marked UNLESS the candidate has replaced it with an alternative response.

EDEXCEL GCE MATHEMATICS
General Instructions for Marking
1. The total number of marks for the paper is 75.
2. The Edexcel Mathematics mark schemes use the following types of marks:
• M marks: method marks are awarded for ‘knowing a method and attempting to apply it’, unless otherwise indicated.
• A marks: accuracy marks can only be awarded if the relevant method (M) marks have been earned.
• B marks are unconditional accuracy marks (independent of M marks) • Marks should not be subdivided.
3. Abbreviations
These are some of the traditional marking abbreviations that will appear in the mark schemes:
• bod – benefit of doubt • ft – follow through • the symbol will be used for correct ft • cao – correct answer only • cso - correct solution only. There must be no errors in this part of the question to
obtain this mark • isw – ignore subsequent working • awrt – answers which round to • SC: special case • oe – or equivalent (and appropriate) • dep – dependent • indep – independent • dp decimal places • sf significant figures • The answer is printed on the paper • The second mark is dependent on gaining the first mark
4. All A marks are ‘correct answer only’ (cao.), unless shown, for example, as A1 ft to
indicate that previous wrong working is to be followed through. After a misread however, the subsequent A marks affected are treated as A ft, but manifestly absurd answers should never be awarded A marks.
5. For misreading which does not alter the character of a question or materially simplify
it, deduct two from any A or B marks gained, in that part of the question affected.
6. If a candidate makes more than one attempt at any question: • If all but one attempt is crossed out, mark the attempt which is NOT crossed
out. • If either all attempts are crossed out or none are crossed out, mark all the
attempts and score the highest single attempt.
7. Ignore wrong working or incorrect statements following a correct answer.
8. In some instances, the mark distributions (e.g. M1, B1 and A1) printed on the candidate’s response may differ from the final mark scheme.

Question Number Scheme Marks
1.
Cholesterol Level High Low High 7.6 12.4 20 Low 30.4 49.6 80 38 62 100
M1A1
(2)
0
1
H : Cholesterol level is independent of intake of saturated fats(no association)H : Cholesterol level is not independent of intake of saturated fats (association)
B1 (1)
O E 2( )O E
E−
2OE
12 7.6 2.547… or 24295 18.947… or 360
19 8 12.4 1.56129… or 242
155 5.161… or 16031
26 30.4 0.6368… or 121190 22.236… or 845
38 54 49.6 0.3903… or 121
310 58.790… or 364562
dM1 A1
2( ) =5.1358234..O E
E−∑ or
2 2 2 21.2 8 26 54 100 5.147.6 12.4 30.4 49.6
+ + + − = (awrt 5.14) A1 (3)
(2 1)(2 1) 1ν = − − = B1 2
1 (0.05) 3.841χ = B1 (2) 5.14 > 3.841 so sufficient evidence to reject 0H [Condone “accept H1 ”] M1 Association between cholesterol level and saturated fat intake A1 (2)
Total 10 Notes Minimum working use part marks: iE (2), Hyp (1), 5.14 (3), 3.841 (2), Conclusion (2)
1st M1 for some use of Row Total Col.TotalGrand Total
× . May be implied by correct iE
1st A1 for all expected frequencies correct. Allow M1A0 for iE rounded to integers
1st B1 for both hypotheses. Must mention “cholesterol” and “fats” at least once Use of “relationship” or “correlation” or “connection” is B0
2nd dM1 for at least 2 correct terms (as in 3rd or 4th column) or correct expressions with their iE Dependent on 1st M1 Accept 2sf accuracy for the M mark
2nd A1 for all correct terms. May be implied by a correct ans.(2 dp or better) Allow truncation eg 2.54… 3rd A1 for awrt 5.14
2nd B1 for correct degrees of freedom (may be implied by a cv of 3.841) 3rd M1 for a correct statement linking their test statistic and their cv(cv could be 2.705 or > 3.5) Contradictory statements score M0 e.g. “significant, do not reject H0”
4th A1 for a correct comment in context - must mention “cholestorol” and “fats” condone “relationship” or “connection” here but not “correlation”. e.g. “There is evidence of a relationship between cholesterol level and fat intake” No follow through. If e.g hypotheses are the wrong way round A0 here.

Question Number Scheme Marks
2(a) Uni A B C D E F G Staff-Stu 2 4 3 5 7 1 6
Satisfaction 3 2 6 4 5 1 7 [ d ] –1 2 –3 1 2 0 –1 d2 1 4 9 1 4 0 1 20
M1A1A1
6 201 0.642857....
7(49 1)sr×
= − =−
( accept 914
) (awrt 0.643) dM1A1
(5) (b) H0: 0ρ =
H1: 0 ( 0)ρ ρ≠ > B1 Critical value is ± 0.7857(± 0.7143 for a one tailed test) B1
0.643<cv so insufficient evidence to reject H0
There is insufficient evidence to suggest a (positive) correlation between staff-student ratio and satisfaction. B1ft
(3) Total 8
Notes (a) 1st M1 for an attempt to rank the staff-students ratio or satisfaction ( at least 4 correct)
1st A1 for correct rankings for both (one or both may be reversed) 2nd A1 for 2d∑ =20 or correct 2d row (NB 2 92d =∑ for one set of reversed ranks)
2nd dM1 for use of the correct formula, follow through their 2d∑ (Dependent on 1st M1) If answer is not correct, a correct expression is required.
3rd A1 If 2d∑ = 20 for awrt 0.643 or if 2d∑ =92 for awrt – 0.643 (accept 914± )
(b) 1st B1 for both hypotheses in terms of ρ, one tail 1H must be compatible with their ranking
Hypotheses just in words e.g. “no correlation” score B0
2nd B1 for cv of 0.7857 or 0.7143 for one-tailed test (accept +) Their cv must be compatible with their 1H which may be in words
If hypotheses are the wrong way around this must be B0 but 3rd B1 is possible.
3rd B1ft for a correct contextualised comment. Must mention “ratio” or “no. of students per member of staff” and “satisfaction” Follow through their sr and their cv (provided it is |cv| <1) Don’t insist on the word “positive” for a one-tailed test Use of “association” is B0
Independent of 1st B1 so if | sr | > |cv| must say there is sufficient evidence of …….(o.e.) and if | sr | < |cv| must say insufficient evidence of … (o.e.) regardless of their hypotheses
Contradictory statements score B0 (This mark is just testing interpretation of comparison of their sr and their cv)

Question Number Scheme Marks
3(a)i Quota Sampling:
e.g Advantages: Fieldwork can be done quickly, or administering the test is easy, or costs are kept to a minimum (cheap), or gives estimates for each course. or OK for large populations or sampling frame not required (o.e.)
e.g Disadvantages: Non-random process or not possible to estimate the sampling errors, or non response not recorded, or interviewer can introduce bias in sample choice. (o.e.)
B1
3(a)ii Stratified Sampling:
e.g. Advantages: Can give accurate estimates as it is a random process, or gives estimates for each course or representative of [BUT not “proportional” to] the whole population. (o.e.)
e.g. Disadvantages: Sampling frame required, or strata may not be clear as some students overlap courses or not suitable for large populations. (o.e.) B1
(2) 3(b) Total enrolments=1000 (may be implied by calculations) B1
Leisure and Sport= 420 100 421000
× = M1
Information Technology= 337 100 33.71000
× = =34
Health and Social Care= 200 100 201000
× =
Media Studies= 43 100 4.31000
× = =4 A1
(3)3(c) The college’s information system would be used to identify each student
and which course they are enrolled on. i.e. idea of sampling frame or list for each course. Use of random numbers to select required number of students from each course
B1 B1
(2) Total 7
Notes Do not penalise for lack of context in part (a)
(a) 1st B1 for an advantage and a disadvantage for quota sampling (must be 1st or labelled (i))
2nd B1 for an advantage and a disadvantage for stratified sampling (2nd or labelled (ii)) Do not allow opposite pairs e.g. “quicker/easier” for quota sampling and “takes a long time/more difficult” for stratified or quota “easy to use” but strat. “hard for large populations”
Do not allow same reason for both e.g. “gives estimates for each course”
(b) M1 for one correct calculation, ft their “1000” A1 for 42, 34, 20 and 4 only
(c) 1st B1 for some mention of a suitable sampling frame. Need not give the specific term but a suitable source of list is required for all students in each course.
2nd B1 for mentioning use of random numbers or some random selection process for each course. If they are describing systematic sampling score B0 here
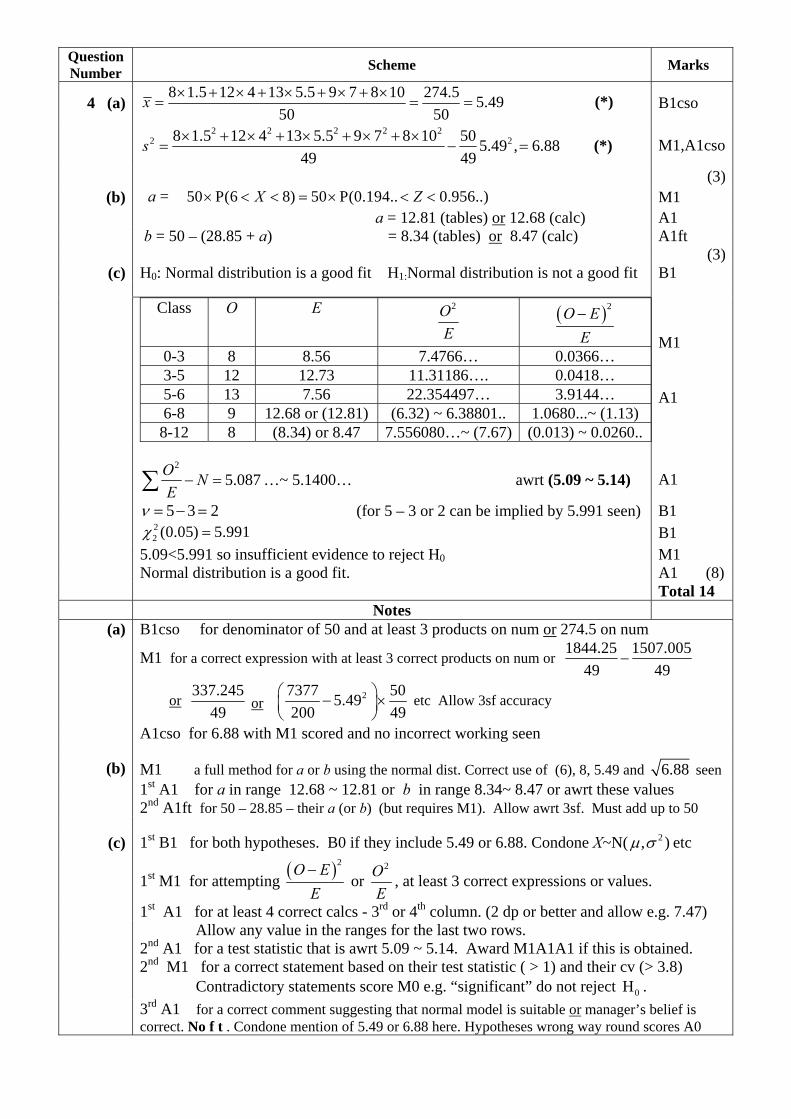
Question Number Scheme Marks
4 (a) 8 1.5 12 4 13 5.5 9 7 8 10 274.5 5.49
50 50x × + × + × + × + ×= = = (*) B1cso
2 2 2 2 2
2 28 1.5 12 4 13 5.5 9 7 8 10 50 5.49 , 6.8849 49
s × + × + × + × + ×= − = (*) M1,A1cso
(3)(b) a = 50 P(6 8) 50 P(0.194.. 0.956..)X Z× < < = × < < M1
a = 12.81 (tables) or 12.68 (calc) A1 b = 50 – (28.85 + a) = 8.34 (tables) or 8.47 (calc) A1ft (3)
(c) H0: Normal distribution is a good fit H1:Normal distribution is not a good fit B1
Class O E 2OE
( )2O EE−
0-3 8 8.56 7.4766… 0.0366… 3-5 12 12.73 11.31186…. 0.0418… 5-6 13 7.56 22.354497… 3.9144… 6-8 9 12.68 or (12.81) (6.32) ~ 6.38801.. 1.0680...~ (1.13) 8-12 8 (8.34) or 8.47 7.556080…~ (7.67) (0.013) ~ 0.0260..
M1 A1
2
5.087O NE
− =∑ …~ 5.1400… awrt (5.09 ~ 5.14) A1
5 3 2ν = − = (for 5 – 3 or 2 can be implied by 5.991 seen) B1 2
2 (0.05) 5.991χ = B1 5.09<5.991 so insufficient evidence to reject H0 M1 Normal distribution is a good fit. A1 (8) Total 14 Notes
(a) B1cso for denominator of 50 and at least 3 products on num or 274.5 on num
M1 for a correct expression with at least 3 correct products on num or 1844.25 1507.005
49 49−
or 337.245
49 or 27377 505.49200 49
⎛ ⎞− ×⎜ ⎟⎝ ⎠
etc Allow 3sf accuracy
A1cso for 6.88 with M1 scored and no incorrect working seen
(b) M1 a full method for a or b using the normal dist. Correct use of (6), 8, 5.49 and 6.88 seen 1st A1 for a in range 12.68 ~ 12.81 or b in range 8.34~ 8.47 or awrt these values 2nd A1ft for 50 – 28.85 – their a (or b) (but requires M1). Allow awrt 3sf. Must add up to 50
(c) 1st B1 for both hypotheses. B0 if they include 5.49 or 6.88. Condone X~N( 2, )µ σ etc
1st M1 for attempting ( )2 2
or O E O
E E−
, at least 3 correct expressions or values.
1st A1 for at least 4 correct calcs - 3rd or 4th column. (2 dp or better and allow e.g. 7.47) Allow any value in the ranges for the last two rows. 2nd A1 for a test statistic that is awrt 5.09 ~ 5.14. Award M1A1A1 if this is obtained.
2nd M1 for a correct statement based on their test statistic ( > 1) and their cv (> 3.8) Contradictory statements score M0 e.g. “significant” do not reject 0H .
3rd A1 for a correct comment suggesting that normal model is suitable or manager’s belief is correct. No f t . Condone mention of 5.49 or 6.88 here. Hypotheses wrong way round scores A0
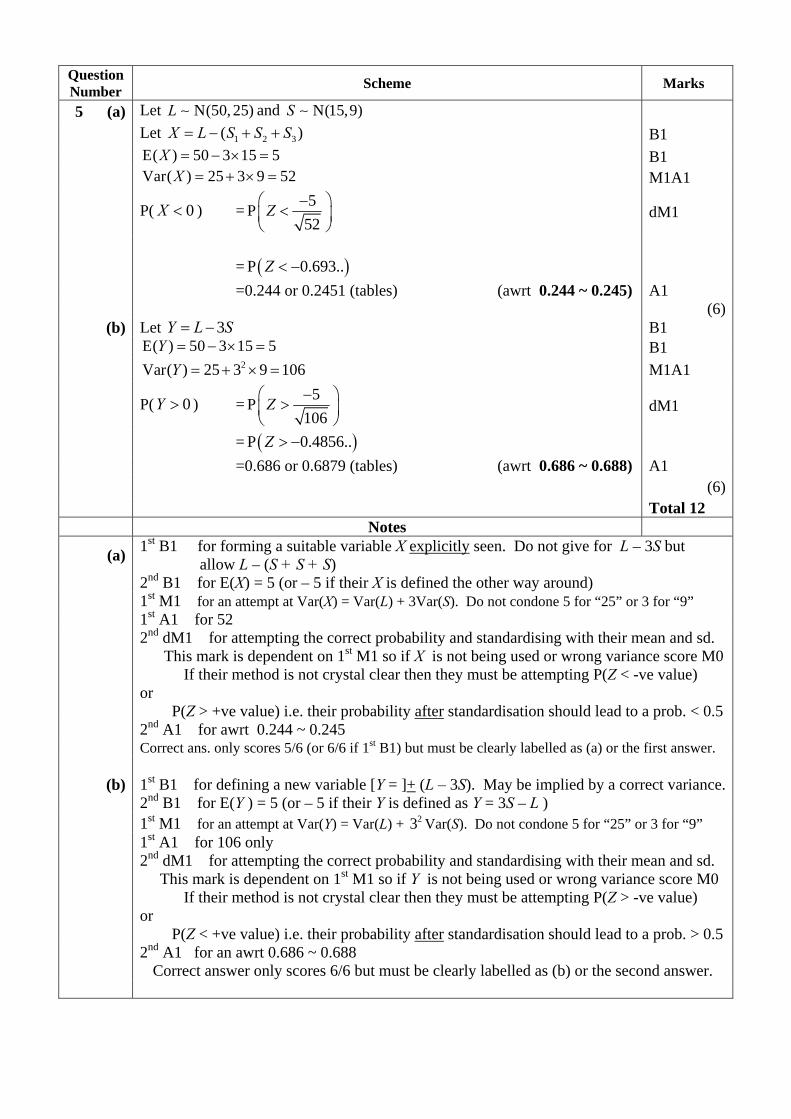
Question Number Scheme Marks
5 (a) Let N(50, 25)L ∼ and N(15,9)S ∼ Let 1 2 3( )X L S S S= − + + B1 E( ) 50 3 15 5X = − × = B1 Var( ) 25 3 9 52X = + × = M1A1
P( 0X < ) = 5P52
Z −⎛ ⎞<⎜ ⎟
⎝ ⎠ dM1
= ( )P 0.693..Z < − =0.244 or 0.2451 (tables) (awrt 0.244 ~ 0.245) A1 (6)
(b) Let 3Y L S= − B1 E( ) 50 3 15 5Y = − × = B1 2Var( ) 25 3 9 106Y = + × = M1A1
P( 0Y > ) = 5P106
Z −⎛ ⎞>⎜ ⎟
⎝ ⎠ dM1
= ( )P 0.4856..Z > − =0.686 or 0.6879 (tables) (awrt 0.686 ~ 0.688) A1 (6) Total 12 Notes
(a) 1st B1 for forming a suitable variable X explicitly seen. Do not give for L – 3S but allow L – (S + S + S)
2nd B1 for E(X) = 5 (or – 5 if their X is defined the other way around) 1st M1 for an attempt at Var(X) = Var(L) + 3Var(S). Do not condone 5 for “25” or 3 for “9” 1st A1 for 52
2nd dM1 for attempting the correct probability and standardising with their mean and sd. This mark is dependent on 1st M1 so if X is not being used or wrong variance score M0 If their method is not crystal clear then they must be attempting P(Z < -ve value) or P(Z > +ve value) i.e. their probability after standardisation should lead to a prob. < 0.5
2nd A1 for awrt 0.244 ~ 0.245 Correct ans. only scores 5/6 (or 6/6 if 1st B1) but must be clearly labelled as (a) or the first answer.
(b) 1st B1 for defining a new variable [Y = ]+ (L – 3S). May be implied by a correct variance. 2nd B1 for E(Y ) = 5 (or – 5 if their Y is defined as Y = 3S – L ) 1st M1 for an attempt at Var(Y) = Var(L) + 23 Var(S). Do not condone 5 for “25” or 3 for “9” 1st A1 for 106 only
2nd dM1 for attempting the correct probability and standardising with their mean and sd. This mark is dependent on 1st M1 so if Y is not being used or wrong variance score M0 If their method is not crystal clear then they must be attempting P(Z > -ve value) or P(Z < +ve value) i.e. their probability after standardisation should lead to a prob. > 0.5
2nd A1 for an awrt 0.686 ~ 0.688 Correct answer only scores 6/6 but must be clearly labelled as (b) or the second answer.

Question Number Scheme Marks
6 (a) 0H : 1new oldµ µ− = B1 1H : 1new oldµ µ− > B1
7 5.5 1 3.62254...0.5 0.7560 70
z − −= =
+ (awrt 3.62) M1 A1A1
A1
Critical value 1.6449z = (allow +) B1 [3.62 >1.6449] so sufficient evidence to reject 0H dM1
Evidence that the mean yield of new variety is more than 1 kg greater than the old variety. A1
(9)(b) Mean yield is normally distributed B1
Sample size is large. Must state or imply that in this case sample size is large B1 (2) Total 11 Notes
(a) 1st & 2nd B1 for hypotheses. Accept 1 2, or ,A Bµ µ µ µ etc if there is some indication of which is which e.g. ~ N( ,0.5)AA µ
1st M1 for an attempt at se. Condone switching 0.5 and 0.75 0.5 or 0.75 0.75 or 0.560 70
+
1st A1 for a correct expression for denominator of test statistic or 0.138… or 0.0190... 2nd A1 for a correct numerator of test statistic (must have the −1)
3rd A1 for awrt 3.62 [Allow – 3.62 from numerator of 5.5 – 7 − − 1 and compatible H1]
3rd B1 for + 1.6449 seen or probability of 0.0002 (tables) or 0.000145…(calc) [allow 0.0001]
2nd dM1 dep. on 1st M1 for a correct statement based on their normal cv and their test statistic
2nd A1 for correct comment in context. Must mention “yield” and “varieties” or “old” and “new” and “1”
If second B mark is B0 award A0 here
ALT Pooled estimate: If they calculate 0.41845... 0.64688...ps = = allow 1st M1, 1st A1 for expression (or awrt 0.114) and 2nd A1 if numerator correct but A0 for test statistic (4.39)
(b) 1st B1 for mention of mean (yield) and normal (distribution) 2ndB1 for mention of sample (size) being large in this case

Question Number Scheme Marks
7 (a) 33.29ˆ 4.16125
8xµ = = = ( awrt 4.16) B1
2 2 2
2 2 4.12 5.12 ... 8ˆ7
xsσ + + − ×= = M1
2 2 141.4035 138.528013ˆ 0.41078...7
sσ −= = = (awrt 0.411) A1
(3)(b) 33.29 32 4.55 178.89,x∑ = + × = (awrt 179) B1
2 2"141.4035" 31 0.25 32 4.55 ( 811.6335)x∑ = + × + × = (awrt 812) M1A1
Combined sample:
2
2
178.89811.633540 0.29724865...
39s
−= = (awrt 0.297) M1A1
0.297.... 0.086240
sn= = (awrt 0.0862) M1A1
(7)
(c) 178.89 0.671.96 1.96
40 40x
nσ
± = ± M1B1
= (4.2646…, 4.67988…) awrt (4.26[or 4.265], 4.68) A1 (3) Total 13 Notes
(a) M1 for an attempt at 2s : correct denom, clear attempt at 2x∑ and ft their x Ans only 2/2
(b) B1 for correct sum or mean or fully correct expression (accept mean = awrt 4.47) May be in (c) 1st M1 for their 141.4035 + 31 0.25× + 32 24.55× or “141.4035” + 7.75+ 662.48 (accept 3sf) Beware: 32(0.25 + 4.552) + “141.4035” = awrt 812 but scores M0A0. 1st A1 for a fully correct expression (all to 3sf or better) or answer only = awrt 812 2nd M1 for a correct expression using their values
3rd M1 dependent on using a changed 2s (not their 0.411 or 0.25) for "0.297"40
This 2s must be based on a combination of their 0.411 and 0.25 e.g. 0.661
(c) M1 for x z
nσ
± × for any z ( > 1.5) and ft their x based on combining their 4.16 and 4.55,
do not award for simply using 4.55 or their 4.16. Condone their 0.297σ = or their (b) B1 for z = 1.96 used in an attempt at a CI, may for example miss n A1 for both limits awrt 3sf. Allow lower limit of 4.265

Further copies of this publication are available from
Edexcel Publications, Adamsway, Mansfield, Notts, NG18 4FN
Telephone 01623 467467
Fax 01623 450481 Email [email protected]
Order Code UA037011 Summer 2013
For more information on Edexcel qualifications, please visit our website www.edexcel.com
Pearson Education Limited. Registered company number 872828 with its registered office at Edinburgh Gate, Harlow, Essex CM20 2JE

Mark Scheme (Results) Summer 2014 Pearson Edexcel International A Level in Statistics 3 (WST03/01)
PMT

Edexcel and BTEC Qualifications Edexcel and BTEC qualifications come from Pearson, the world’s leading learning company. We provide a wide range of qualifications including academic, vocational, occupational and specific programmes for employers. For further information, please visit our website at www.edexcel.com. Our website subject pages hold useful resources, support material and live feeds from our subject advisors giving you access to a portal of information. If you have any subject specific questions about this specification that require the help of a subject specialist, you may find our Ask The Expert email service helpful. www.edexcel.com/contactus Pearson: helping people progress, everywhere Our aim is to help everyone progress in their lives through education. We believe in every kind of learning, for all kinds of people, wherever they are in the world. We’ve been involved in education for over 150 years, and by working across 70 countries, in 100 languages, we have built an international reputation for our commitment to high standards and raising achievement through innovation in education. Find out more about how we can help you and your students at: www.pearson.com/uk Summer 2014 Publications Code IA040147 All the material in this publication is copyright © Pearson Education Ltd 2014
PMT
General Marking Guidance
All candidates must receive the same treatment. Examiners must mark the first candidate in exactly the same way as they mark the last.
Mark schemes should be applied positively. Candidates must be rewarded for what they have shown they can do rather than penalised for omissions.
Examiners should mark according to the mark scheme not according to their perception of where the grade boundaries may lie.
There is no ceiling on achievement. All marks on the mark scheme should be used appropriately.
All the marks on the mark scheme are designed to be awarded. Examiners should always award full marks if deserved, i.e. if the answer matches the mark scheme. Examiners should also be prepared to award zero marks if the candidate’s response is not worthy of credit according to the mark scheme.
Where some judgement is required, mark schemes will provide the principles by which marks will be awarded and exemplification may be limited.
Crossed out work should be marked UNLESS the candidate has replaced it with an alternative response.
PMT

EDEXCEL IAL MATHEMATICS
General Instructions for Marking
1. The total number of marks for the paper is 75.
2. The Edexcel Mathematics mark schemes use the following types of marks:
M marks: method marks are awarded for ‘knowing a method and attempting to apply it’, unless otherwise indicated.
A marks: Accuracy marks can only be awarded if the relevant method (M) marks have been earned.
B marks are unconditional accuracy marks (independent of M marks) Marks should not be subdivided.
3. Abbreviations
These are some of the traditional marking abbreviations that will appear in the mark schemes.
bod – benefit of doubt ft – follow through the symbol will be used for correct ft cao – correct answer only cso - correct solution only. There must be no errors in this part of the question to
obtain this mark isw – ignore subsequent working awrt – answers which round to SC: special case oe – or equivalent (and appropriate) dep – dependent indep – independent dp decimal places sf significant figures The answer is printed on the paper The second mark is dependent on gaining the first mark
4. All A marks are ‘correct answer only’ (cao.), unless shown, for example, as A1 ft to
indicate that previous wrong working is to be followed through. After a misread however, the subsequent A marks affected are treated as A ft, but manifestly absurd answers should never be awarded A marks.
5. For misreading which does not alter the character of a question or materially simplify it,
deduct two from any A or B marks gained, in that part of the question affected.
6. Ignore wrong working or incorrect statements following a correct answer.
PMT

Question Number Scheme Marks
1. (a) 165, 8 B1 [1]
(b) Select every 6th person B1 {having chosen the first person by} Selecting a random number between 1 and 6 or
selecting a random number and then loop back to start when you reach the end. dB1
(b)(ii) The list is alphabetical and has not been sorted by gender. B1
[3](c) Label male members 1- 180, female members 1 – 120 M1
Use random numbers to select a ... M1 Simple random sample of 30 male members and 20 female members A1 [3]
(d) Any one of It (a stratified sample) is not biased as the members are chosen randomly.
B1
You can estimate the sampling errors (for a stratified sample)
It (a stratrified sample) gives more accurate estimates as it is a random process.
A quota sample may be biased (whereas a stratrified sample is not).
It’s not possible to estimate/find the sampling errors for a quota sample (whereas you can for a stratified sample)
[1] 8 Notes
(a) B1 165 followed by 8 or 008. (b)(i) 1st B1 For selecting every 6th (name on the list)
2nd dB1 is dependent on the first B1 mark being awarded. For idea of using random numbers to select first from 1 to 6 or 0 to 5 (o.e.)
or selecting a random number between 1 and 300 and then looping back when the end of the list has been reached.
(b)(ii) B1 A comment that implies the list (or sampling frame) has not been sorted by gender. Note B0 for “the ordered list is not truly random” Note B0 for “sample does not divide the members into gender.”
(c) 1st M1 For suitable labelling of all 180 males and all 120 females. E.g. Allow labelling female members 181 – 300.
Also allow labelling male members 0 – 179 and female members either 0 to 119 or 180 to 299.
2nd M1 For use of random numbers to select males and females. A1 For 30 males and 20 females (dependent on 2nd M1 only) Note A simple random sample of 30 males and 20 females scores 2nd M1 and A1.
(d) Note B0 for “a stratified sample can reflect the population structure.” B0 for “estimates obtained from each of the strata.”
PMT
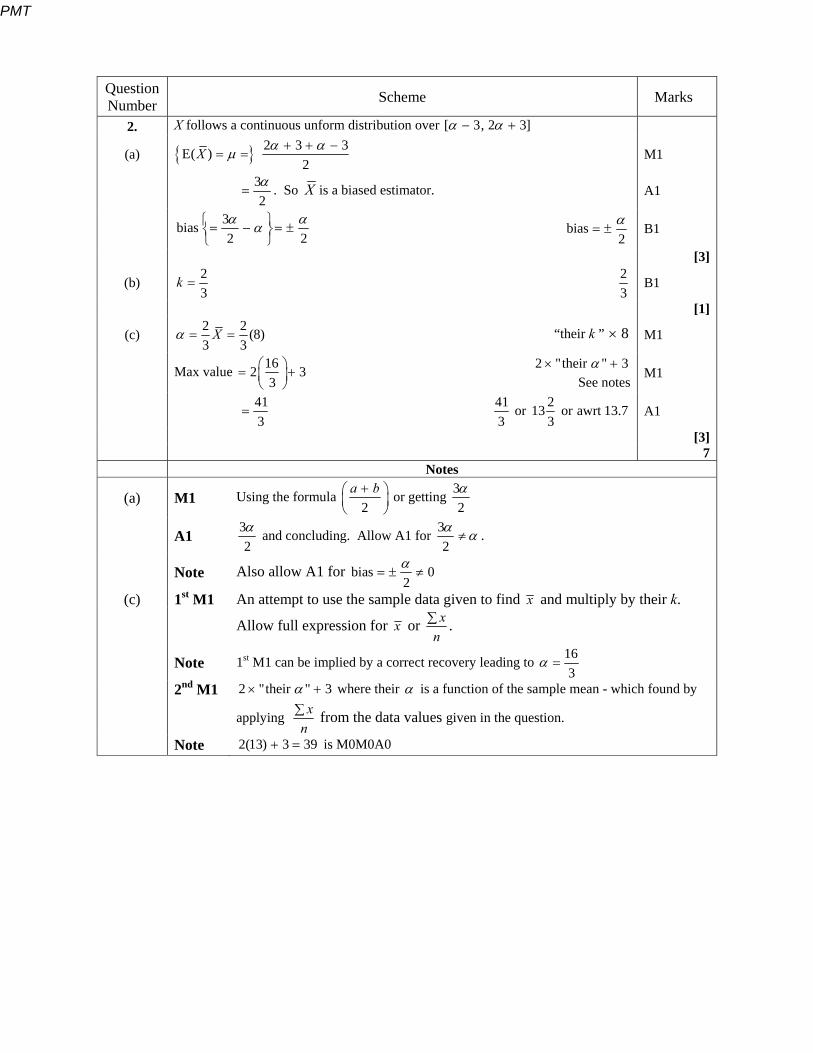
Question Number Scheme Marks
2. X follows a continuous unform distribution over [ 3, 2 3]
(a) 2 3 3E( )2
X M1
32
. So X is a biased estimator. A1
3bias2 2
bias
2
B1
[3]
(b) 23
k 23
B1
[1]
(c) 2 2 (8)3 3
X “their k ” 8 M1
Max value 162 33
2 "their " 3 See notes
M1
413
41 2or 13 or awrt 13.73 3
A1
[3] 7 Notes
(a) M1 Using the formula 2
a b
or getting 32
A1 32 and concluding. Allow A1 for 3
2 .
Note Also allow A1 for bias 02
(c) 1st M1 An attempt to use the sample data given to find x and multiply by their k.
Allow full expression for x or xn .
Note 1st M1 can be implied by a correct recovery leading to 163
2nd M1 2 "their " 3 where their is a function of the sample mean - which found by
applying xn from the data values given in the question.
Note 2(13) 3 39 is M0M0A0
PMT
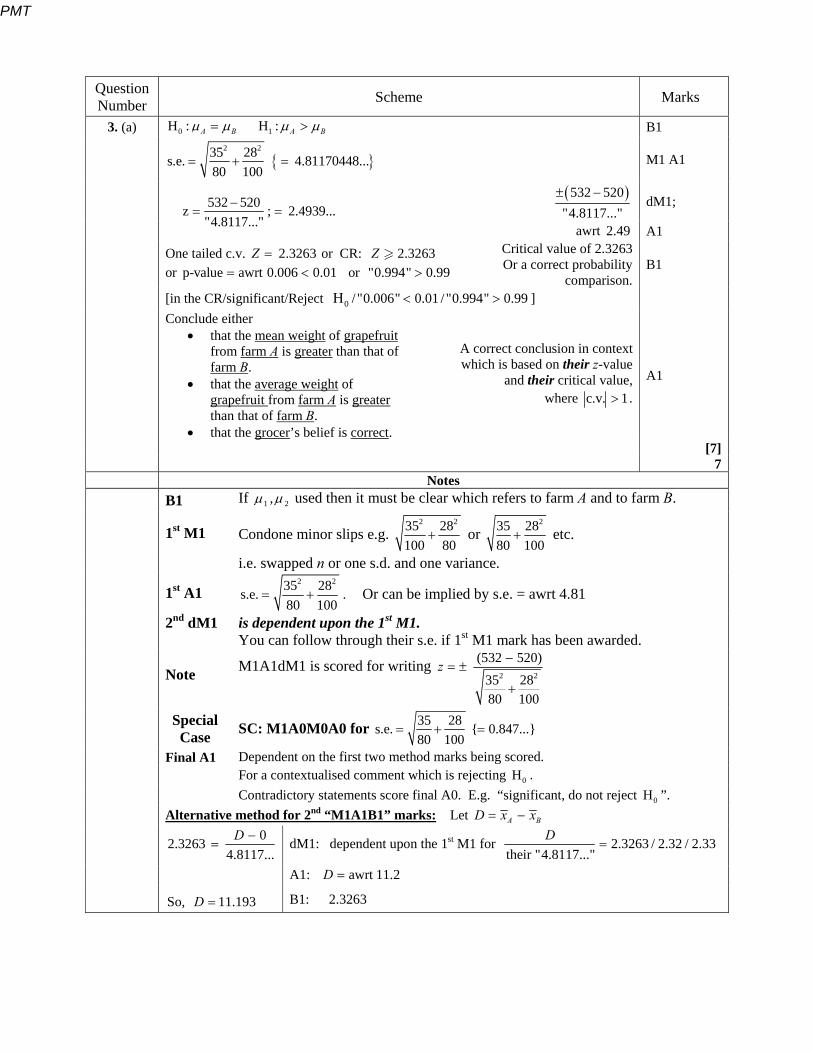
Question Number Scheme Marks
3. (a) 0 1H : H :A B A B B1
2 235 28s.e. 4.81170448...
80 100 M1 A1
532 520z ; 2.4939..."4.8117..."
532 520"4.8117..."
dM1;
awrt 2.49 A1
One tailed c.v. 2.3263Z or CR: 2.3263Z or p-value awrt 0.006 0.01 or "0.994" 0.99
Critical value of 2.3263 Or a correct probability
comparison. B1
[in the CR/significant/Reject 0H /"0.006" 0.01 / "0.994" 0.99 ]
Conclude either that the mean weight of grapefruit
from farm A is greater than that of farm B.
that the average weight of grapefruit from farm A is greater than that of farm B.
that the grocer’s belief is correct.
A correct conclusion in context which is based on their z-value
and their critical value, where c.v. 1 .
A1
[7] 7 Notes B1 If 1 2, used then it must be clear which refers to farm A and to farm B.
1st M1 Condone minor slips e.g. 2 235 28
100 80 or
235 2880 100
etc.
i.e. swapped n or one s.d. and one variance.
1st A1 2 235 28s.e. .
80 100 Or can be implied by s.e. = awrt 4.81
2nd dM1 is dependent upon the 1st M1. You can follow through their s.e. if 1st M1 mark has been awarded.
Note M1A1dM1 is scored for writing
2 2
(532 520)35 2880 100
z
Special Case SC: M1A0M0A0 for 35 28s.e. { 0.847...}
80 100
Final A1 Dependent on the first two method marks being scored. For a contextualised comment which is rejecting 0H . Contradictory statements score final A0. E.g. “significant, do not reject 0H ”. Alternative method for 2nd “M1A1B1” marks: Let A BD x x
02.32634.8117...
D
So, 11.193D
dM1: dependent upon the 1st M1 for 2.3263 / 2.32 / 2.33their "4.8117..."
D
A1: awrt 11.2D
B1: 2.3263
PMT

Question Number Scheme Marks
4. (a) Man A B C D E F G H I J Rank x 1 2 3 4 5 6 7 8 9 10 Rank w 2 7 4 3 1 9 6 5 8 10
Attempt to rank both for x
and for w. (at least four
correct).
M1 or Man A B C D E F G H I J
Rank x 10 9 8 7 6 5 4 3 2 1 Rank w 9 4 7 8 10 2 5 6 3 1
2 1 25 1 1 16 9 1 9 1 0; 64d
For finding the difference between each of the ranks
and evaluating 2.dM1
2 64d A1
6(64)1 ; 0.6121212...10(99)sr
Using 261
10(99)d
with their 2d dM1;
101 or awrt 0.612165
A1
[5](b) 0 1H : 0 , H : 0 Both hypotheses stated correctly B1
Critical Value sr = 0.5636 or CR: 0.5636sr Critical value of 0.5636 B1
Either Since 0.6121...sr lies in the CR Result is significant Reject 0H ( condone 1H )
see notes M1
conclude that there is a positive correlation between systolic blood pressure and weight. Conclusion in context A1
[4](c) Both either
Critical Value r = 0.5494 CR: 0.5494r
M1
and either
Since 0.5114r does not lie in the CR Result is not significant Do not reject 0H (or accept 0H )
Conclude that there is no positive correlation Context not required here. A1 [2]
(d) Either A comment that conveys both the ideas “as x increases, w increases”
and “the relationship is non-linear” “There is a positive correlation” and “the relationship is non-linear” Data is not (bi-variate) normal
Any one of these or
equivalent.B1
[1] 12
PMT

Notes
4. (a)
3rd dM1 is dependent on 1st M1 for use of 261
10(99)d
with their 2d
Note If a candidate finds 2 266d , leading to awrt 0.612sr then award M1M1A1M1A1.
(b) 1st B1 Both hypotheses stated in terms of .
M1 For a correct statement relating their sr 1sr with their c.v. where their c.v. 1 A1 For a contextualised comment which is rejecting 0H , which must mention “positive
correlation”, “blood pressure” and “weight”. (Use of “association” is A0.) Follow through their sr with their c.v. (provided their c.v. 1 ) Two-tailed
test Applying a two-tailed test scores a maximum of B0B1M1A0
So Award SC B0B1 for 0 1H : 0 , H : 0 followed by critical value sr = ( ) 0.6485 and allow access to the M1 mark only.
PMT

Question Number Scheme Marks
5. (a) 0H : There is no association between type of drink and gender (independent)
1H : There is an association between type of drink and gender (dependent) Correct
hypotheses B1
Expected Tea Coffee Hot Chocolate Total
Male 46.53 34.31 13.16 94 Female 52.47 38.69 14.84 106 Total 99 73 28 200
Some attempt at (Row Total)(Column Total)
(Grand Total)
Can be implied by at least one correct iE to 1d.p.
M1
All expected frequencies are correct.
Condone exact fractions.A1
Observed Expected 2( )O E
E
2OE
57 46.53 2.3559... 69.8259... 26 34.31 2.0127... 19.7027... 11 13.16 0.3545... 9.1945... 42 52.47 2.0892... 33.6192... 47 38.69 1.7849... 57.0949... 17 14.84 0.3144... 19.4744...
Totals 8.9116... 208.9116...
At least 2 correct terms for 2( )O E
E or
2OE
or correct
expressions with their iE . Accept 2 sf accuracy
for the dM1 mark.
dM1
At least 5 correct 2( )O E
E or
2OE
terms to
either 2 dp or better. Allow truncation.
A1
2 2
2 ( )X or 200 ; 8.9116...O E OE E
For applying either 2( )O E
E or
2
200OE
dM1
8.9 or awrt (8.88 8.91) A1 (2 1)(3 1) 2 2 B1
22 (0.05) 5.991 c CR: 2X 5.991 5.991 or ft 2
their (0.05)vc B1ft [in the CR/significant/Reject 0H ]
conclude that there is an association between type of drink preferred and gender. (or they are not independent.)
A correct conclusion in context which is based on their 2X -value
and their 2 -critical value.A1
[10](b) 2
2 (0.005) 10.597 c CR: 2X 10.597 Critical value of 10.597 B1 [not in the CR/not significant/do not reject 0H ] Either
Conclude there is no association between type of drink preferred and gender (or they are independent).
The conclusion would change (if a correct 0H has been rejected in part (a)).
Any one of these. B1
[2] 12
PMT

Notes
5. (a) 1st B1 For both hypotheses. Must mention “drink” and “gender” or “sex” at least once. Use of “relationship” or “correlation” or “connection” is B0. 2nd dM1 Dependent on the first method mark. At least 2 correct terms (as in 3rd or 4th column) or correct expressions with their iE 2nd A1 All correct terms to either 2 d.p. or better. Allow truncated answers. 3rd dM1 Dependent on the second method mark.
For applying either 2( )O E
E or
2
200OE
3rd A1 8.9 or awrt (8.88 8.91) 2nd B1 2v This mark can be implied by a correct critical value of 5.991 Note If 8.9 or awrt (8.88 8.91) is seen (from a calculator) without the expected frequencies
stated then award special case M0A0M1A1M1A1. Final A1 Dependent on the third method mark. A correct contextualised conclusion which is rejecting 0H .
Must mention “drink” and “gender” or “sex”. No follow through. If e.g. hypotheses are the wrong way round A0 here. Note Contradictory statements score A0. E.g. “significant, do not reject 0H ”. Note Condone “relationship” or “connection” here but not “correlation”. e.g. “There is evidence of a relationship between grades and gender” Note Full accuracy gives 2X 8.911619... and p-value 0.0116 to 0.0117
PMT

Question Number Scheme Marks
6. (a) 0(2) 1(21) 2(45) 3(42) 4(12) 5(3) 300ˆ 0.3
8(2 21 45 42 12 3) or 8(125) 1000p
(*) Answer is given.
See notes. M1 A1cso
[2](b) 8 3 5
3125 (0.3) (0.7) 31.76523...r C (formula) or 125 (0.8059 0.5518) 31.7625r (tables)
M1 125 (7.21 24.71 37.06 their 17.02 5.83) 1.40477... or 1.4075s r or 125 (1 0.9887) 1.4125s
31.76523 or 31.7625r or 31.7575 awrt 31.77 or awrt 31.76r r A1 1.40477 or 1.4075s or 1.4125 1.4 or awrt1.40s or awrt1.41s A1 [3]
(c) # failed
tasks iO iE Comb iO
Comb iE
2( )O EE
2OE
0 2 7.21 2 7.21 3.7648... 0.5548... 1 21 24.71 21 24.71 0.5570... 17.8470... 2 45 37.06 45 37.06 1.7011... 54.6411...
3 42 31.77 (31.76) 42 31.77
(31.76) 3.2941...
(3.3016...) 55.5241...
(55.5416...) 4 12 17.02 12 17.02 1.4806... 8.4606... 5 3 5.83
3 7.23
(7.24) {7.25}
2.4748… (2.4831…)
1.2448… (1.2431…)
6 0 1.40
(1.41) Totals 13.2724...
(13.2882...) 138.2724...
(138.2882...)
M1 M1
2 2
2 ( )X or 125 ; awrt 13.3O E OE E
For applying either 2( )O E
E or
2
125OE
dM1
awrt 13.3 A1 6 1 1 4v see notes B1 ft
24 (0.05) 9.488 c CR: 2X 9.488
a correct ft for their 2 (0.05)kc , where 1 1k n from their n. B1
0H : Binomial distribution is a good(or suitable) model (or fit).
1H : Binomial distribution is not a suitable model. Correct hypotheses B1
[in the CR/significant/Reject 0H ]
Binomial distribution is not a suitable model. A correct conclusion (context not required
here) which is based on their 2X -value and their 2 -critical value.
A1
[8](d) Following from a correct conclusion in part (c), a comment conveying either
p is not constant employer’s belief is not justified. B1
[1] 14
PMT

Notes
6. (a) M1 Must show clearly how to get either 300 or 1000. A1 cso Showing how to get both 300 and 1000 and reaching 0.3p
(b) M1 For any correct method (or a correct expression) for finding either r or s. A1 awrt 31.77 or awrt 31.76r r A1 1.4 or awrt1.40s or awrt1.41s
(c) 1st M1 For an attempt to pool 5 failed tasks and 6 failed tasks ONLY. Note Give 1st M0 for pooling 0 failed tasks and 1 failed task. 2nd M1 For an attempt at the test statistic, at least 2 correct expressions/values
(to awrt 2 d.p. or truncated 2 d.p.) 3rd dM1 Dependent on the second method mark.
For applying either 2( )O E
E or
2
125OE
1st A1 awrt 13.3 1st B1ft For their evaluated 1 1n . i.e. realising that they must subtract 2 from their n. 2nd B1 For a correct ft for their 2 (0.05)kc , where 1 1k n from their n. 3rd B1 Must have both hypotheses and mention Binomial at least once. Inclusion of 0.3 for p in hypotheses is B0 but condone in conclusion. Final A1 Dependent on the 2nd and 3rd Method marks only.
A correct conclusion (context not required) which is rejecting 0H . Note No follow through on their hypotheses if they are stated the wrong way round. Note Contradictory statements score A0. E.g. “significant, do not reject 0H ”. Note Condone mentioning of Bin(8, 0.3) in conclusion Note
Full accuracy gives a combined expected frequency of 7.245956..., 2( ) 2.4880O E
E
, 2
1.2421OE
, 2X 13.28333...
Note p-value for the test is 0.0099 to 0.0100 Note No combining gives 2X 13.58... Note Combining 0/1 and 4/5/ 6 gives 2X 11.02
PMT

Question Number Scheme Marks
7. (a) 4 3X Y W , 2 2N(40 , 3 ), N(50 , 2 );Y W Y, W are independent. E( ) 4E( ) 3E( ) 4(40) 3(50) E( ) 10X Y W X E( ) 10X (seen or implied) B1
Var( ) 16Var( ) 9Var( )X Y W Either 2(4 ) Var( )Y or 2(3 ) Var( )W M1 For adding the variances M1
Var( ) 16(9) 9(4) Var( ) 180X X Var( ) 180X A1 {So N(10 , 180)X }
25 10P( 25) P180
X Z
Standardising with their mean
and their standard deviation M1
= P( 1.11803...)Z awrt 1.12 A1 1 0.8686
= 0.1314 (or 0.131777...) awrt 0.131 or awrt 0.132 A1 [7]
(b) 3
1i
i
A Y
, 2N(115 , );C P( 0) 0.2 ;A C A, C are independent.
E( ) 3E( ) E( ) 3(40) (115) E( ) 5A C Y C A C E( ) 5A C B1 Var( ) 3Var( ) Var( )A C Y C 3Var( )Y and a + ... M1 2 2Var( ) 3(9) Var( ) 27A C A C 2Var( ) 27A C A1
{So 2N(5 , 27 )A C }
2
5P( 0) 0.2 P 0.227
A C Z
2
5 ( 0.8416)27
k
Standardising with their mean and their standard deviation which is in terms of 2 and setting the result equal to k,
where k is in the interval [0.84, 0.85].M1
0.8416 or awrt 0.8416 B1 Correct equation . See notes A1
2
2 25 27 ...0.8416
Squaring and rearranging
leading to a positive value for 2. dM1
2 8.2962... (= 8.4308... from using 0.84) awrt 8.3 or awrt 8.4 A1 cso ( = 8.2945... from calculator, so need awrt 8.29 for full marks if no prior working is shown.) [8] 15
(a) Note Condone applying reversed variances, e.g.16(4) 9(9) for the first 2 method marks. Note Var( ) 180X with no working gets M1M1A1 Note Var( ) 48X with no working gets M0M1A0 Note Var( ) 108X with no working gets M1M0A0 Note Var( ) 24X with no working gets M0M0A0
(b) 2nd M1 Allow their E( )their Var( )
A C kA C
, where k is in the interval (0.84, 0.85).
2nd B1 For either 0.8416 or 0.8416
2nd A1 E.g. Allow 2
5 [ 0.85, 0.84]27
or
2
5 [0.84, 0.85]27
3rd M1 Dependent on the 2nd M1 mark being awarded.
PMT

PMT
Pearson Education Limited. Registered company number 872828 with its registered office at Edinburgh Gate, Harlow, Essex CM20 2JE
PMT

Mark Scheme (Results) Summer 2014 Pearson Edexcel GCE in Statistics 3R (6691/01R)
PMT

Edexcel and BTEC Qualifications Edexcel and BTEC qualifications come from Pearson, the world’s leading learning company. We provide a wide range of qualifications including academic, vocational, occupational and specific programmes for employers. For further information, please visit our website at www.edexcel.com. Our website subject pages hold useful resources, support material and live feeds from our subject advisors giving you access to a portal of information. If you have any subject specific questions about this specification that require the help of a subject specialist, you may find our Ask The Expert email service helpful. www.edexcel.com/contactus Pearson: helping people progress, everywhere Our aim is to help everyone progress in their lives through education. We believe in every kind of learning, for all kinds of people, wherever they are in the world. We’ve been involved in education for over 150 years, and by working across 70 countries, in 100 languages, we have built an international reputation for our commitment to high standards and raising achievement through innovation in education. Find out more about how we can help you and your students at: www.pearson.com/uk Summer 2014 Publications Code UA040138
PMT

All the material in this publication is copyright © Pearson Education Ltd 2014
PMT

General Marking Guidance
All candidates must receive the same treatment. Examiners must mark the first candidate in exactly the same way as they mark the last.
Mark schemes should be applied positively. Candidates must be rewarded for what they have shown they can do rather than penalised for omissions.
Examiners should mark according to the mark scheme not according to their perception of where the grade boundaries may lie.
There is no ceiling on achievement. All marks on the mark scheme should be used appropriately.
All the marks on the mark scheme are designed to be awarded. Examiners should always award full marks if deserved, i.e. if the answer matches the mark scheme. Examiners should also be prepared to award zero marks if the candidate’s response is not worthy of credit according to the mark scheme.
Where some judgement is required, mark schemes will provide the principles by which marks will be awarded and exemplification may be limited.
Crossed out work should be marked UNLESS the candidate has replaced it with an alternative response.
PMT

PEARSON EDEXCEL GCE MATHEMATICS
General Instructions for Marking
1. The total number of marks for the paper is 75
2. The Edexcel Mathematics mark schemes use the following types of marks: M marks: Method marks are awarded for ‘knowing a method and attempting to apply it’,
unless otherwise indicated.
A marks: Accuracy marks can only be awarded if the relevant method (M) marks have
been earned.
B marks are unconditional accuracy marks (independent of M marks)
Marks should not be subdivided.
3. Abbreviations
These are some of the traditional marking abbreviations that will appear in the mark schemes.
bod – benefit of doubt
ft – follow through
the symbol will be used for correct ft
cao – correct answer only
cso - correct solution only. There must be no errors in this part of the question to obtain this mark
isw – ignore subsequent working
awrt – answers which round to
SC: special case
oe – or equivalent (and appropriate)
d… or dep – dependent
indep – independent
dp decimal places
sf significant figures
The answer is printed on the paper or ag- answer given
or d… The second mark is dependent on gaining the first mark
4. All A marks are ‘correct answer only’ (cao.), unless shown, for example, as A1 ft to indicate that previous wrong working is to be followed through. After a misread however, the subsequent A marks affected are treated as A ft, but manifestly absurd answers should never be awarded A marks.
PMT

5. For misreading which does not alter the character of a question or materially simplify it, deduct two from any A or B marks gained, in that part of the question affected.
6. If a candidate makes more than one attempt at any question:
If all but one attempt is crossed out, mark the attempt which is NOT crossed out. If either all attempts are crossed out or none are crossed out, mark all the
attempts and score the highest single attempt.
7. Ignore wrong working or incorrect statements following a correct answer.
PMT

Question Number Scheme Marks
1.
a)
Car model A B C D E F G H Sales rank 8 6 1 5 4 7 2 3
Fuel efficiency
rank 8 1 5 6 2 7 4 3
d2 0 25 16 1 4 0 4 0
M1
M1A1
∑ 50
16∑
8 64 11
6 508 63
204504
0.40476… awrt 0.405
M1
A1
(5)b) H0:s = 0 H1:s > 0 (accept sor ) B1
1 tail critical value B1
Test value is not in critical region so insufficient evidence to reject H0 No significant evidence at 5% level to support journalist’s belief
M1A1ft
(4)
c) Underlying (bivariate) Normal distribution B1 (1)
d)
Evidence does not support Normal distribution since mean< median or (negative) skew, oe
B1
(1) (11 marks)
PMT

Notes
a) M1 for attempting to rank at least one set of data A1 for at least one set of data ranked correctly(NB this mark comes after 2nd M1) M1 for attempting d2 M1 for correct use of formula for rs
b) B1 for H0 and H1 correct (condone < for H0) 2nd B1 allow 0.7381 if their H1:s ≠ 0 M1 for correct statement relating their test statistic and critical value A1ft their test statistic, H1 and critical value but must be in context.
c) B1 require Normal distribution, ignore additional assumptions
d) B1 require not Normal and valid reason
PMT
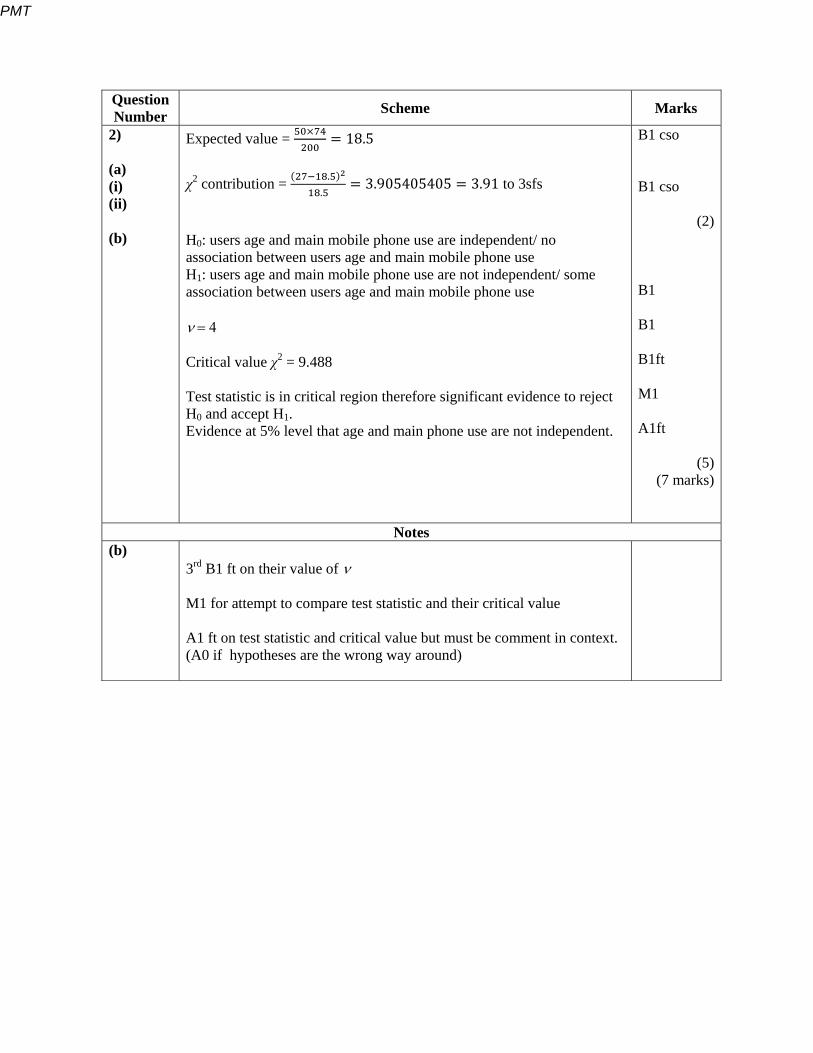
Question Number Scheme Marks
2) (a) (i) (ii) (b)
Expected value = 18.5 χ2 contribution = .
.3.905405405 3.91 to 3sfs
H0: users age and main mobile phone use are independent/ no association between users age and main mobile phone use H1: users age and main mobile phone use are not independent/ some association between users age and main mobile phone use Critical value χ2 = 9.488 Test statistic is in critical region therefore significant evidence to reject H0 and accept H1. Evidence at 5% level that age and main phone use are not independent.
B1 cso B1 cso
(2) B1 B1 B1ft M1 A1ft
(5)(7 marks)
Notes (b)
3rd B1 ft on their value of M1 for attempt to compare test statistic and their critical value A1 ft on test statistic and critical value but must be comment in context. (A0 if hypotheses are the wrong way around)
PMT

Question Number Scheme Marks
3) (a) (b)
P(S > 2C) = P(S – 2C >0) E[S – 2C] = 4.9 – 2 × 2.5 = -0.1 Var(S – 2C) = 0.64 + 4 × 0.16 = 1.28 P(S – 2C >0), = P(Z > .
√ .
= P(Z >0.08838…) =0.4641 (tables), or 0.4648… (calculator)
accept awrt 0.464 or 0.465 Let T = S1 + S2 +… + S100 E[T] = 100×4.9 = 490 Var (T) = 100×0.64 = 64 P(T < 500) = P(Z <
√ )
= P(Z < 1.25) = 0.8944
B1
M1A1
M1, M1
A1
(6)
M1A1
A1
M1
A1 (5)
(11 marks)
Notes (a) (b)
1st M1 for …±4Var(C) 2nd M1 for P (S – 2C >0) 3rd M1 ft their expectation and variance but not if Var(S – 2C) is negative. (Should lead to P(Z > +ve) 1st M1 for attempt to find mean or variance of total 1st A1 either correct 2nd A1 both correct 2nd M1 for standardising using 500, their mean and their sd leading to P(Z < +ve) o.e. Sample mean, 132
PMT

Question Number Scheme Marks
4) Test statistic, z =
√
Critical z values is 1.6449 Therefore the test statistic is significant if
132 5 160
6√5
1.6449
Therefore
1325
160 1.64496
√5
5 1.64496
√528
162.0686493… Accept awrt 162.1
M1A1ft B1 M1 A1 (6) (6 marks)
Notes
1st A1 ft on their 1st B1 given for 1.6449 seen (condone sign) 3rd M1 inequality using their test statistic, accept incorrect signs for M1
PMT

Question Number Scheme Marks
5) (a) (b) (c) (d)
SE 2 = ∑ ∑
956909 = . 98.5 H0: F = E, H1: F ≠ E,
88.75 and 93 Test statistic, .
.2.4627…
Critical values, z = (±)2.5758 Test stat is not in critical region Insufficient evidence to reject H0 at 1% level No significant evidence of a difference in mean lengths of English and French films By CLT we can assume that the mean of a large sample has a Normal distribution On a list, label English films 1 – 724 and French films 1-473 (oe) Use random number table/generator to select
190 115 English films and
190 75 French films
M1 A1 (2) B1 M1 M1A1 B1ft M1 A1ft (7) B1 (1) B1 M1A1 (3) (13 marks)
PMT

Notes (a) (b) (c) (d)
Alternative SE
2 = ∑ 88.75 98.5
1st B1 needs both H0 and H1, can be in words 2nd B1ft on their H1 1st M1 for attempt @ both means ( Ex may be in (a)) 2nd M1 for attempt at correct test statistic, ft their values 3rd M1 for attempt to compare their test stat and critical values A1 ft on their test and critical values but must include comment in context Require mention of mean of E or F and normal distribution M1 requires use of random numbers and attempt to find correct sample sizes A1 both 115 and 75 found.
PMT
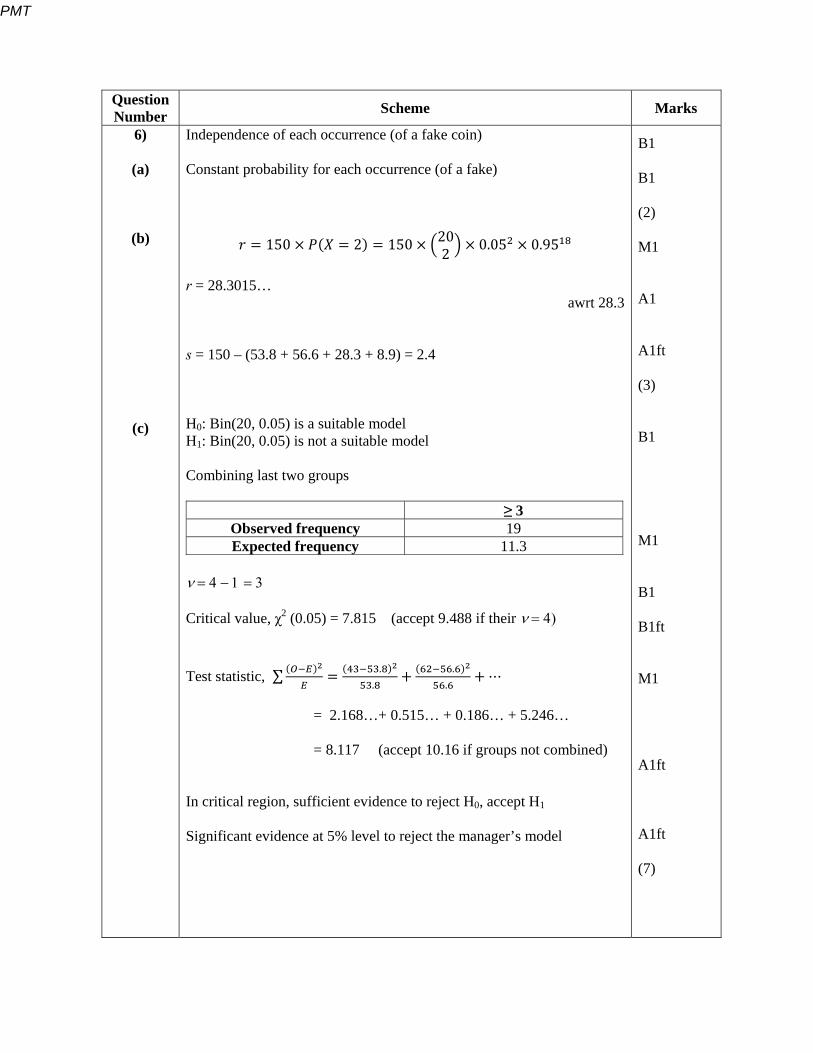
Question Number Scheme Marks
6)
(a)
(b)
(c)
Independence of each occurrence (of a fake coin) Constant probability for each occurrence (of a fake)
150 2 150 202
0.05 0.95 r = 28.3015…
awrt 28.3 s = 150 – (53.8 + 56.6 + 28.3 + 8.9) = 2.4 H0: Bin(20, 0.05) is a suitable model H1: Bin(20, 0.05) is not a suitable model Combining last two groups
≥ 3 Observed frequency 19Expected frequency 11.3
Critical value, χ2 (0.05) = 7.815 (accept 9.488 if their Test statistic, ∑ .
.
.
.⋯
= 2.168…+ 0.515… + 0.186… + 5.246… = 8.117 (accept 10.16 if groups not combined) In critical region, sufficient evidence to reject H0, accept H1 Significant evidence at 5% level to reject the manager’s model
B1 B1 (2) M1 A1 A1ft (3) B1 M1 B1 B1ft M1 A1ft A1ft (7)
PMT

Question Number Scheme Marks
(d) (e)
= 4 – 2 = 2 4 classes due to pooling 2 restrictions (equal total and mean/proportion) H0: Binomial distribution is a good model H1: Binomial distribution is not a good model Critical value, χ2 (0.05) = 5.991 Test statistic is not in critical region, insufficient evidence to reject H0 Accept the assistant manager’s model for the number of fake coins per bag.
B1 B1 (2) B1 B1 B1 (3) (17 marks)
Notes (b) (c) (d)
M1A1 for one of r or s correct A1ft for other value if using 150 - … and answer must be >0 1st B1 can be in words but must include p = 0.05 3rd B1 ft on their Test statistic alternative method Test stat = ∑ 150
. .⋯ 150 8.117…
1st A1 ft if their groups not combined 2nd A1 ft their test and critical values but must be comment in context e.g. mention of “manager’s model” or “fake coins” 1st B1 evidence that pooling is required 2nd B1 must have correct reasons for restrictions.
PMT

Question Number Scheme Marks
7) (a) (i)
(ii) (b)
. . . ⋯ = 9.9775
95% CI 1.96 .
√
95% CI for 10.00 is within confidence interval so accept that pump may be performing correctly (although sample mean is low). Upper limit of CI is
9.96 1.64490.08
√10.00
1.6449 0.08
√0.04
√1.6449 0.08
0.04
n > 10.82…. therefore minimum n = 11
M1 B1M1 A1 (4) B1 (1) B1, M1A1ft M1 A1 cao (5) (10 marks)
PMT

Notes (a) (i)
(b)
1st M1 attempt to find sample mean B1 for correct z value A1 limits correct to 2 decimal places (or more) B1 for correct z value 1st M1A1, ft their z value
PMT

Pearson Education Limited. Registered company number 872828 with its registered office at Edinburgh Gate, Harlow, Essex CM20 2JE
PMT

Mark Scheme (Results) Summer 2014 Pearson Edexcel GCE in Statistics 3 (6691/01)
PMT

Edexcel and BTEC Qualifications Edexcel and BTEC qualifications are awarded by Pearson, the UK’s largest awarding body. We provide a wide range of qualifications including academic, vocational, occupational and specific programmes for employers. For further information visit our qualifications websites at www.edexcel.com or www.btec.co.uk. Alternatively, you can get in touch with us using the details on our contact us page at www.edexcel.com/contactus. Pearson: helping people progress, everywhere Pearson aspires to be the world’s leading learning company. Our aim is to help everyone progress in their lives through education. We believe in every kind of learning, for all kinds of people, wherever they are in the world. We’ve been involved in education for over 150 years, and by working across 70 countries, in 100 languages, we have built an international reputation for our commitment to high standards and raising achievement through innovation in education. Find out more about how we can help you and your students at: www.pearson.com/uk Summer 2014 Publications Code UA040135
All the material in this publication is copyright © Pearson Education Ltd 2014
PMT

General Marking Guidance
All candidates must receive the same treatment. Examiners must mark the first candidate in exactly the same way as they mark the last.
Mark schemes should be applied positively. Candidates must be rewarded for what they have shown they can do rather than penalised for omissions.
Examiners should mark according to the mark scheme not according to their perception of where the grade boundaries may lie.
There is no ceiling on achievement. All marks on the mark scheme should be used appropriately.
All the marks on the mark scheme are designed to be awarded. Examiners should always award full marks if deserved, i.e. if the answer matches the mark scheme. Examiners should also be prepared to award zero marks if the candidate’s response is not worthy of credit according to the mark scheme.
Where some judgement is required, mark schemes will provide the principles by which marks will be awarded and exemplification may be limited.
Crossed out work should be marked UNLESS the candidate has replaced it with an alternative response.
PMT

PEARSON EDEXCEL GCE MATHEMATICS
General Instructions for Marking
1. The total number of marks for the paper is 75
2. The Edexcel Mathematics mark schemes use the following types of marks: M marks: Method marks are awarded for ‘knowing a method and attempting to apply it’,
unless otherwise indicated.
A marks: Accuracy marks can only be awarded if the relevant method (M) marks have
been earned.
B marks are unconditional accuracy marks (independent of M marks)
Marks should not be subdivided.
3. Abbreviations
These are some of the traditional marking abbreviations that will appear in the mark schemes.
bod – benefit of doubt
ft – follow through
the symbol will be used for correct ft
cao – correct answer only
cso - correct solution only. There must be no errors in this part of the question to obtain this mark
isw – ignore subsequent working
awrt – answers which round to
SC: special case
oe – or equivalent (and appropriate)
d… or dep – dependent
indep – independent
dp decimal places
sf significant figures
The answer is printed on the paper or ag- answer given
or d… The second mark is dependent on gaining the first mark
4. All A marks are ‘correct answer only’ (cao.), unless shown, for example, as A1 ft to indicate that previous wrong working is to be followed through. After a misread however, the subsequent A marks affected are treated as A ft, but manifestly absurd answers should never be awarded A marks.
PMT

5. For misreading which does not alter the character of a question or materially simplify it,
deduct two from any A or B marks gained, in that part of the question affected.
6. If a candidate makes more than one attempt at any question: If all but one attempt is crossed out, mark the attempt which is NOT crossed out. If either all attempts are crossed out or none are crossed out, mark all the
attempts and score the highest single attempt.
7. Ignore wrong working or incorrect statements following a correct answer.
PMT

Question Number
Scheme Marks
1(a) (This is a sample where) every (possible) sample (of size n) has an equal chance of being chosen.
B1
(1)
(b) ‘When it is impossible to provide a sampling frame’ or a correct example with an indication B1
of sampling frame being impossible.
(1)
(c)(i) A list/register of all the students. B1
(ii) Number the students (from 0 to 74, 1 to 75 etc.) B1
Using the random no. table read off the nos. and identify or select the students allocated B1
those nos.
(3)
Total 5
Notes
(a) Require all / each / every etc sample and same/equal etc chance / probability etc for B1
(b) Require impossible / no / doesn’t exist etc and sampling frame for B1
(c)(i) Require list/register etc and all/every/75 etc students for B1
List of 8 students is B0
(ii) First B1 accept ‘in the corresponding position’ o.e. if numbering omitted
Second B1 require both for mark.
PMT

Question Number
Scheme Marks
2a(i) Only contains known data / function of data only / no population parameters B1
therefore it is a statistic B1d
(ii)(iii) (ii) and (iii) contain unknown parameters / population parameters / µ and / or σ B1
therefore it is not a statistic. B1d
(4)
(b) (E( ) B1
Var( ) = M1
= A1
(3)
Total 7
Notes
(a)(i) First B1 for known / no unknowns o.e. in (i)
Second B1 dependent on first B1 for ‘Yes’ / is a statistic o.e. in (i)
Third B1 for unknowns o.e. in both (ii) and (iii)
Fourth B1 dependent on third B1 for ‘No’ / not a statistic o.e. in both (ii) and (ii)
(b) B1 for
M1 for some squaring on numerator or denominator and must add on numerator
A1 for o.e.
PMT

Question Number
Scheme Marks
3
Happiness Not happy Fairly happy Very happy
Gender Female 13.51 41.77 30.71 Male 8.49 26.23 19.29
M1 A1
H0 : Happiness and gender are independent/ not associated H1 : Happiness and gender are not independent/ associated B1 O E
9 13.51 1.508 5.996 43 41.77 0.0361 44.264 34 30.71 0.351 37.637 13 8.49 2.402 19.915 25 26.23 0.0575 23.829 16 19.29 0.560 13.274
dM1 A1
2O EE
= 4.91 or 2
144.91 140 4.91O NE
A1
3 2 2 1 2 B1
2O EE
< 5.991 B1ft
4.91 < 5.991 so ‘insufficient evidence to reject H0 ’ or ‘Accept H0’ M1 No association between gender and happiness. A1 (10) Total 10
Notes 1st M1 for some use of . May be implied by at least 1 correct Ei
1st A1 awrt 13.5, 41.8, 30.7, 8.5, 26.2 and 19.3 Allow M1A0 for Ei rounded to integers
1st B1 for both hypotheses. Must mention “happiness” and “gender” at least once. Use of “relationship” or “correlation” or “connection” is B0 2nd dM1 for at least 2 correct terms (in 3rdor 4thcolumns) or correct expressions with their Ei Dependent on 1st M1. Accept 2sf accuracy for the M mark. 2nd A1 for all correct terms (2sf or better). May be implied by a correct ans Allow truncation e.g. 44.2… 3rd A1 awrt 4.91 . Condone 4.915 2nd B1 for correct degrees of freedom (may be implied by a cv of 5.991) 3rd B1ft for cv that follows from their degrees of freedom 3rd M1 for a correct statement linking their test statistic and their cv Contradictory statements score M0 e.g. “significant, do not reject H0” Condone “reject H1 ” 4th A1 for a correct comment in context - must mention “gender” and “happiness” Condone “relationship” or “connection” here but not “correlation”.
e.g. “There is no evidence of a relationship between gender and happiness”
No follow through. If e.g hypotheses are the wrong way around A0 here. SC Use of calculator with no working may get M0A0B1M1A0A1B1B1M1A1
PMT
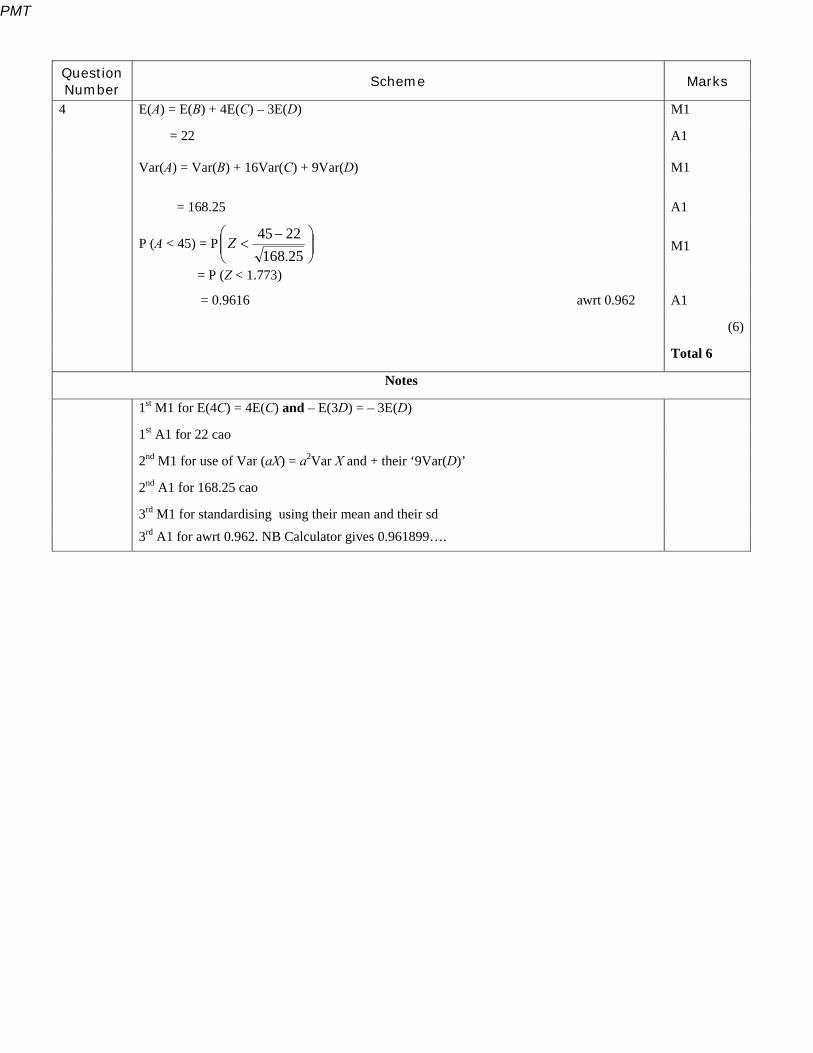
Question Number
Scheme Marks
4 E(A) = E(B) + 4E(C) – 3E(D) M1
= 22
A1
Var(A) = Var(B) + 16Var(C) + 9Var(D)
M1
= 168.25 A1
P (A < 45) = P
25.1682245Z
M1
= P (Z < 1.773)
= 0.9616 awrt 0.962 A1
(6)
Total 6
Notes
1st M1 for E(4C) = 4E(C) and – E(3D) = – 3E(D)
1st A1 for 22 cao
2nd M1 for use of Var (aX) = a2Var X and + their ‘9Var(D)’
2nd A1 for 168.25 cao
3rd M1 for standardising using their mean and their sd 3rd A1 for awrt 0.962. NB Calculator gives 0.961899….
PMT

Question Number
Scheme Marks
5(a) The seeds are independent / There are a fixed number of seeds in a row / There are only two outcomes to the seed germinating – either it germinates or it does not / The probability of a seed germinating is constant B1 B1 (2)(b) (0 2) (1 6) (2 11) (3 19) (4 25) (5 32) (6 16) (7 9)
120 7
=
504840
M1
= 0.6 ** A1cso (2)(c) p = 0.6 q = 0.4 s = 120 21q5 p2 = 12021 x 0.45 x 0.62 = 9.29 B1
t = 12035q3 p4 = 12035 x 0.43 x 0.64 = 34.84 B1 (2)(d) H0 : A binomial distribution is a suitable model. B1 H1: A binomial distribution is not a suitable model.
Observed number of rows 19 19 25 32 25 Expected number of rows 11.55 23.22 34.84 31.35 19.04
EEO 2)(
4.81 0.77 2.78 0.013 1.87
2OE
31.26 15.55 17.94 32.66 32.83
M1
B1ft 3 = 2 – 5 = ע Critical value for χ 2 = 11.345 B1ft
∑ E
EO 2)( = 10.23 or
2
130.23 120 10.23O NE
M1A1
10.23 < 11.345 therefore do not reject H0 A binomial is a suitable model. A1 (7) Total 13
Notes(a) Any two and at least one must have context. 2 correct, no context B1B0. Do not award B0B1. (b) M1 require at least two correct terms in numerator and /(120x7) or /120 then /7 A1 cso as given answer (c) Cao for each B1 (d) 1st B1 for both hypotheses. B0 if they include 0.6 Condone X~B(n,p) etc 1st M1 for using some combined columns (<8) 2nd B1ft follows from ‘their no of columns’ -2 3rd B1ft follows from the degrees of freedom
2nd M1 for attempting E
EO 2)( or
2OE
with at least 2nd (3 seeds) and 4th (5 seeds) accurate
to 2sf Contradictory statements score M0 e.g. “significant” do not reject H0 1st A1 for awrt 10.2 2nd A1 dependent on 2nd M for a correct comment suggesting that binomial model is suitable.
No follow through .
Condone mention of 0.6 here. Hypotheses wrong way round scores A0
PMT
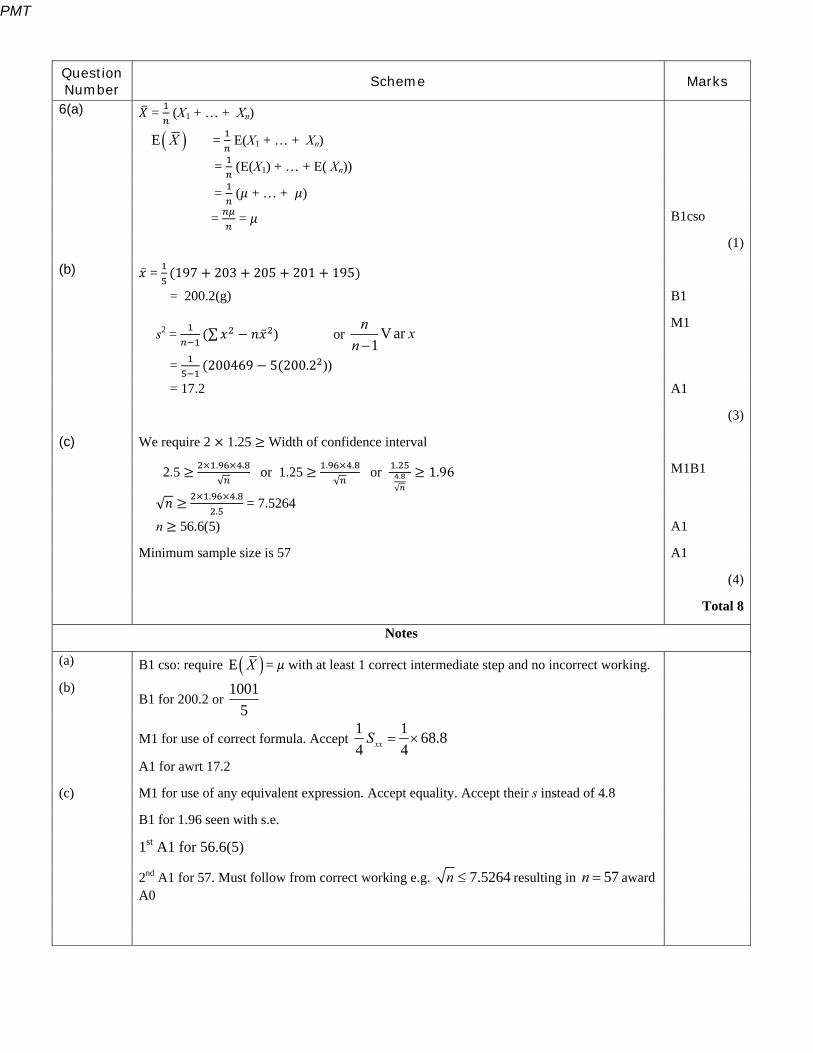
Question Number
Scheme Marks
6(a) = (X1 + … + Xn)
E X = E(X1 + … + Xn)
= (E(X1) + … + E( Xn))
= ( + … + )
= = B1cso
(1)
(b) = 197 203 205 201 195
= 200.2(g) B1
s2 = ∑ ) or V ar
1n x
n
M1
= 200469 5 200.2 ))
= 17.2 A1
(3)
(c) We require 2 1.25 Width of confidence interval
2.5 . .
√ or 1.25 . .
√ or .
.
√
1.96 M1B1
√ . .
. = 7.5264
n 56.6(5) A1
Minimum sample size is 57 A1
(4)
Total 8
Notes
(a) B1 cso: require E X = with at least 1 correct intermediate step and no incorrect working.
(b) B1 for 200.2 or
10015
M1 for use of correct formula. Accept
1 1 68.84 4xxS
A1 for awrt 17.2
(c) M1 for use of any equivalent expression. Accept equality. Accept their s instead of 4.8
B1 for 1.96 seen with s.e.
1st A1 for 56.6(5)
2nd A1 for 57. Must follow from correct working e.g. 7.5264n resulting in 57n award A0
PMT

Question Number
Scheme Marks
7(a) z = 3.2905 B1
= .
M1
= 9.117 ** A1cso
(3)
(b) H0 : 1000 H1 : 1000 B1
mean weight = 999.54 B1
z =
√
= ..
√
0.160 or 1000 2.3263 CR 993.2983.12
10
c c
M1A1
1% critical value = 2.3263 B1
2.3263 < 0.160
Accept H0 / not in critical region
dM1
There is no evidence that that the machine is delivering packets of mean weight less than 1 kg
A1ft (7)
Total 10
Notes
(a) M1 for 30/‘their z ’ >1
A1 cso as given answer
(b) 1st B1 both hypotheses correct.
Accept 1kg in hypotheses if consistent units used in working usually either kg or g.
2nd B1 999.54 (g) or 0.99954 (kg)
1st M1 for standardising using their mean allow , 1000 and .
√ o.e. in kg
1st A1 awrt -0.160 unless clearly using z (stated) then accept 0.160 or CR awrt 993
Condone -0.16 if fully correct expression seen.
3rd B1 2.3263 sign consistent with test statistic or p = 0.4364 > 0.01 NB p = 0.5636 <0.99
2nd dM1 dependent upon 1st M for a correct statement linking their test statistic and their cv
Contradictory statements score M0 e.g. “significant, do not reject H0”
2nd A1 for correct conclusion in context. Must mention ‘machine’ and ‘packets’.
PMT

Question Number
Scheme Marks
8(a) r = .
√ . . M1
= 0.840 A1 (2)(b) H0 : 0 H1 : 0 B1 Critical value = 0.5822 B1 0.840 > 0.5822 There is evidence to reject H0. M1 There is evidence of a positive correlation between a man’s height and his weight. A1ft (4)(c) Man A B C D E F G H I
Actual weight 1 2 7 3 4 5 8 6 9 Peter’s order 1 4 2 6 3 8 5 9 7 d2 0 4 25 9 1 9 9 9 4
B1 B1
70 M1A1
rs = 1 - ∑ dM1
= 1 -
= 0.417 A1 (6)(d) H0 : 0 H1 : 0 B1 Critical value 0.600 B1 (0.417 < 0.600) There is insufficient evidence to reject H0. M1 Peter does not have the ability to correctly order men, by weight, from their photograph. A1 (4) Total 16
PMT

Notes (a) M1 Clear use of
A1 0.840 cao (b) 1st B1 for both hypotheses in terms of ρ, one tail H1 must be compatible with their r Hypotheses just in words e.g. “no correlation” score B0 2nd B1 for 0.5822 cao M1 for a statement comparing ‘their r’ with ‘their cv’ A1 for a correct contextualised comment. Must mention positive correlation, be carrying out a 1-tailed test and mention height and weight. Follow through their r and their cv (provided their |cv| <1 and their |r| <1 ) (c) 1st B1 for attempt to rank actual weight / Peter’s order with at least 4 correct 2nd B1 for correct rankings for both (one or both may be reversed) 1st M1 for use of ∑ with at least 4 values correct and attempt to add 1st A1 for 70 or 170 with reversed rankings 2nd dM1 for use of the correct formula, follow through their ∑ .Dependent on 1st M1 If answer is not correct, a correct expression is required.
2nd A1 for awrt 0.417 or 512
(d) 1st B1 for both hypotheses in terms of or s One tail H1 must be compatible with their
ranking
Hypotheses just in words e.g. “no correlation” score B0
2nd B1 for cv of 0.6(00) cao
Their cv must be compatible with their H1 which may be in words M1 for statement comparing ‘their r’ with ‘their cv’ A1 for a correct contextualised comment. Must mention Peter and Men. Follow through their r and their cv (provided their |cv| <1and their 1sr )
PMT

PMT

Pearson Education Limited. Registered company number 872828 with its registered office at Edinburgh Gate, Harlow, Essex CM20 2JE
PMT

Mark Scheme (Final) Summer 2015 Pearson Edexcel International A Level in Statistics 3 (WST03/01)
PhysicsAndMathsTutor.com

Edexcel and BTEC Qualifications Edexcel and BTEC qualifications are awarded by Pearson, the UK’s largest awarding body. We provide a wide range of qualifications including academic, vocational, occupational and specific programmes for employers. For further information visit our qualifications websites at www.edexcel.com or www.btec.co.uk. Alternatively, you can get in touch with us using the details on our contact us page at www.edexcel.com/contactus. Pearson: helping people progress, everywhere Pearson aspires to be the world’s leading learning company. Our aim is to help everyone progress in their lives through education. We believe in every kind of learning, for all kinds of people, wherever they are in the world. We’ve been involved in education for over 150 years, and by working across 70 countries, in 100 languages, we have built an international reputation for our commitment to high standards and raising achievement through innovation in education. Find out more about how we can help you and your students at: www.pearson.com/uk Summer 2015 Publications Code IA042726 All the material in this publication is copyright © Pearson Education Ltd 2015
PhysicsAndMathsTutor.com
General Marking Guidance All candidates must receive the same treatment. Examiners must mark the first candidate in exactly the same way as they mark the last. Mark schemes should be applied positively. Candidates must be rewarded for what they have shown they can do rather than penalised for omissions. Examiners should mark according to the mark scheme not according to their perception of where the grade boundaries may lie. There is no ceiling on achievement. All marks on the mark scheme should be used appropriately. All the marks on the mark scheme are designed to be awarded. Examiners should always award full marks if deserved, i.e. if the answer matches the mark scheme. Examiners should also be prepared to award zero marks if the candidate’s response is not worthy of credit according to the mark scheme. Where some judgement is required, mark schemes will provide the principles by which marks will be awarded and exemplification may be limited. Crossed out work should be marked UNLESS the candidate has replaced it with an alternative response.
PhysicsAndMathsTutor.com

PEARSON EDEXCEL IAL MATHEMATICS
General Instructions for Marking
1. The total number of marks for the paper is 75
2. The Edexcel Mathematics mark schemes use the following types of marks: M marks: Method marks are awarded for ‘knowing a method and attempting to apply
it’, unless otherwise indicated.
A marks: Accuracy marks can only be awarded if the relevant method (M) marks have
been earned.
B marks are unconditional accuracy marks (independent of M marks)
Marks should not be subdivided.
3. Abbreviations
These are some of the traditional marking abbreviations that will appear in the mark schemes.
bod – benefit of doubt
ft – follow through
the symbol will be used for correct ft
cao – correct answer only
cso - correct solution only. There must be no errors in this part of the question to obtain this mark
isw – ignore subsequent working
awrt – answers which round to
SC: special case
oe – or equivalent (and appropriate)
d… or dep – dependent
indep – independent
dp decimal places
sf significant figures
The answer is printed on the paper or ag- answer given
or d… The second mark is dependent on gaining the first mark
4. All A marks are ‘correct answer only’ (cao.), unless shown, for example, as A1 ft to indicate that previous wrong working is to be followed through. After a misread however, the subsequent A marks affected are treated as A ft, but manifestly absurd answers should never be awarded A marks.
PhysicsAndMathsTutor.com

5. For misreading which does not alter the character of a question or materially simplify
it, deduct two from any A or B marks gained, in that part of the question affected.
6. If a candidate makes more than one attempt at any question: If all but one attempt is crossed out, mark the attempt which is NOT crossed
out. If either all attempts are crossed out or none are crossed out, mark all the
attempts and score the highest single attempt.
7. Ignore wrong working or incorrect statements following a correct answer.
PhysicsAndMathsTutor.com

6
June 2015 WST03 Statistics 3 Mark Scheme
Question Number Scheme Marks
1. (a) 018 or 18w 018 or 18 B1 [1]
(b) 18x 18 B1 [1]
(c) prob 0 0 B1 [1]
(d) Advantage: Any one of: Simple or easy to use also allow “quick” or “efficient” (o.e.)
It is suitable for large samples ( or populations) Gives a good spread of the data
B1
Disadvantage: Any one of:
The alphabetical list is (probably) not random Biased since the list is not (truly) random Some combinations of names are not possible
B1
[2] (Total 5) Notes
(d) If no labels are given treat the 1st reason as an advantage and the 2nd as a disadvantage 1st B1: for advantage 2nd B1: for disadvantage “it requires a sampling frame” is 2nd B0 since the alphabetical list is given. Note: Do not score both B1 marks for opposing advantages and disadvantages.
PhysicsAndMathsTutor.com

7
Question Number Scheme Marks
2. (a) A B C L N R S T Y Judge 1 6 3 4 9 2 8 1 5 7 Judge 2 8 4 5 7 3 9 1 2 6
M1 or S N B C T A Y R L
Judge 1 1 2 3 4 5 6 7 8 9 Judge 2 1 3 4 5 2 8 6 9 7
2 4 1 1 4 1 1 0 9 1or 0 1 1 1 9 4 1 1 4 22
d
M1 2 22d A1
6(22)1 ; 0.8166666...
9(80)sr M1;
4960
or awrt 0.817 A1
[5](b) 0 1H : 0 , H : 0 B1
Critical Value = 0.7833 or CR: 0.7833sr 0.7833 B1 Since 0.8166...sr it lies in the CR , or reject 0H (o.e.) M1
The two judges (or “they”) are in agreement or there is a positive correlation between the ranks of the two judges. A1ft
[4] (Total 9) Notes
(a) 1st M1 for an attempt to rank at least one row (at least 4 correct) 2nd M1 for an attempt at d2 row (may be implied by sight of 2d = 22 or 221 for reverse ranks) 1st A1 for 2 22d (or 221 if reverse ranking is used) Can be implied by correct answer. 3rd M1 for use of the correct formula with their 2d (if it is clearly stated) If the answer is not correct then a correct expression is required
False e.g Alphabetic ranking: Gives Judge 1: 7 5 2 3 8 1 9 6 4 Ranking Judge 2: 7 8 5 2 3 9 4 1 6 2 162d and sr = 0.35
Scores: M0(for ranking), M1(for attempt at d2 row), A0, M1 (for use of their 2d ), A0 i.e. 2 out of 5 Can follow through their sr in (b)
(b) 1st B1 for both hypotheses stated correctly in terms of (allow s ) H1 must be compatible with ranking 2nd B1 for cv = 0.7833 (independent of their H1 (no 2-tail value in tables) but compatible sign with their sr ) M1: for a correct statement (in words) relating their sr with their critical value.
e.g. “reject 0H ”,“in critical region”, “significant”, “positive correlation” May be implied by a correct contextual comment.
|cv|>1 If their cv is |cv| > 1 (often from using normal tables) award M0A0 If |their sr | > |their cv| then “significant” (o.e.) for M1 and “judges are in agreement” (o.e.) for A1ft If |their sr | < |their cv| then “not significant” (o.e.) for M1 and “judges don’t agree” (o.e.) for A1ft A1ft: for a correct follow through conclusion in context. “positive correlation” alone scores M1 A0 For reverse ranking should still say “ judges are in agreement”
PhysicsAndMathsTutor.com

8
Question Number Scheme Marks
3. (a) 0(47) 1(57) 2(46) 3(35) 4(9) 5(6) 320 1.6200 200
* Full exp’ or at least 2
products and 320/200 seen B1 *
[1]
(b) 1.6 2e (1.6)200 51.68550861...
2!r
Using 1.6 2e (1.6)200
2!r
M1
200 (40.38 64.61 their 27.57 11.03) 4.72449139...s r or their r + s = 56.41 M1 51.68550861... and 4.72449139...r s r = awrt 51.69 and s = awrt 4.72 A1 [3]
(c) 0H : Poisson (distribution) is a suitable/ sensible (model)
1H : Poisson (distribution )is not a suitable/ sensible (model). B1
Number of accidents Observed Expected Combined
Observed Combined Expected
2( )O EE
2OE
0 47 40.38 47 40.38 1.0853 54.7053 1 57 64.61 57 64.61 0.8963 50.2863 2 46 51.69 46 51.69 0.6264 40.9364 3 35 27.57 35 27.57 2.0024 44.4324 4 9 11.03
15 15.75 0.0357 14.2857 5 6 4.72 Totals 4.6461 204.6461
M1
2 2
2 ( )X or 200 ; 4.6461O E OE E
M1;
awrt 4.65 A1 5 1 1 3v 3 B1 ft 2
3 (0.10) 6.251 c CR: 2X 6.251 6.251 B1 ft [Since 2X 4.6461 does not lie in the CR, then there is insufficient evidence to reject 0H ]
The number of accidents per day can be modelled by a Poisson distribution or the supervisor’s belief is correct. A1 ft
[7] (Total 11) Notes
(b) Note: Allow A1 for awrt 4.74s (found as a result of using expected values to full accuracy.) (c) 1st B1: for both hypotheses and mentioning Poisson at least once.
Allow Poisson is a “good fit/model” but not “good method” Inclusion of 1.6 for mean in hypotheses is B0 but condone in conclusion. 1st M1: For an attempt to pool 4 accidents and 5 accidents or pool when Ei < 5 No pooling is M0 2nd M1: For an attempt at the test statistic, at least 2 correct expressions/values (to awrt 2 d.p.) 1st A1: For awrt 4.65 (score M1M1A1 if awrt 4.65 seen)
No pooling If no pooling can allow 2nd M1 if X2 = 5.33 is seen 2nd B1ft: For 1 1n i.e. subtracting 2 from their n. B1B1 may be implied by
6.251 (if pooling) or 7.779 for no pooling
3rd B1ft: For a correct ft for their 2 (0.10)kc , where 1 1k n from their n. 2nd A1ft: (Dep. on the 2nd M1) For correct comment in context based on their test statistic and their critical
value that mentions accidents or supervisor. Condone mention of Po(1.6) in conclusion Score A0 for inconsistencies e.g. “significant” followed by “supervisor’s belief is justified”
Note: Full accuracy gives a combined expected frequency of 15.76, 2( ) 0.0366O E
E
,2
14.2766OE
,
2X 4.64855... and p-value 0.199
PhysicsAndMathsTutor.com

9
Question Number Scheme Marks
4. (a) Let X weight of a sack of potatoes, 2N(25.6 , 0.24 )X
So 21 2 N(0 , 2(0.24) )D X X or N(0 , 0.1152)D
Attempt at D and N(0, ..)D M1 2 2(0.24) (0.24) ; 0.1152 A1; A1
P 0.5 2P( 0.5)D D 2 P( 0.5)D can be implied dM1
0.5= 2 P0.1152
Z
dM1
= 2 P 1.4731...Z or = 2(1 0.9292) = 0.1416 awrt 0.141 or awrt 0.142 A1 [6]
(b) Let Y weight of an empty pallet, 2N(20.0 , 0.32 )Y So 1 2 30...T X X X Y
2 2N(30(25.6) 20, 30(0.24) 0.32 )T 30(25.6) 20 or 788 B1
2 230(0.24) 0.32 M1 N(788, 1.8304)T N and 1.8304 or awrt 1.83 A1
785 788P( 785) P1.8304
T Z
M1
= P( 2.2174...)Z = 0.9868 awrt 0.987 A1 [5] (Total 11) Notes
(a) 1st M1: For clear definition of D and normal distribution with mean of 0 (Can be implied by 3rd M1) 1st A1: for correct use of Var( 1 2X X ) formula 2nd A1: for 0.1152 2nd dM1: For realising need 2 P( 0.5)D (Dependent on 1st M1 i.e. must be using suitable D) 3rd dM1: Dep on 1st M1 for standardising with 0.5, 0 and their s.d.( 0.24 )Must lead to P( ve)Z (o.e.) P(Z > 1.47) implies 1st M1 1st A1 2nd A1 and 3rd M1 Correct answer only will score 6 out of 6
(b) B1: For a mean of 30(25.6) 20 . Can be implied by 788. 1st M1: For 2 230(0.24) 0.32 . Can be implied by 1.8304 or awrt 1.83 Allow M1 for swapping error i.e. 2 230 0.32 0.24 if the expression is seen 1st A1: For normal and correct variance of 1.8304 or awrt 1.83. Normality may be implied by standardisation 2nd M1: For standardising with 785 with their mean and st. dev..( 0.24 ) Must lead to P( ve)Z oe. 2nd A1: awrt 0.987 Correct answer only will score 5 out of 5 Note: Calculator answers are (a) 0.14071... , (b) 0.98670...
PhysicsAndMathsTutor.com
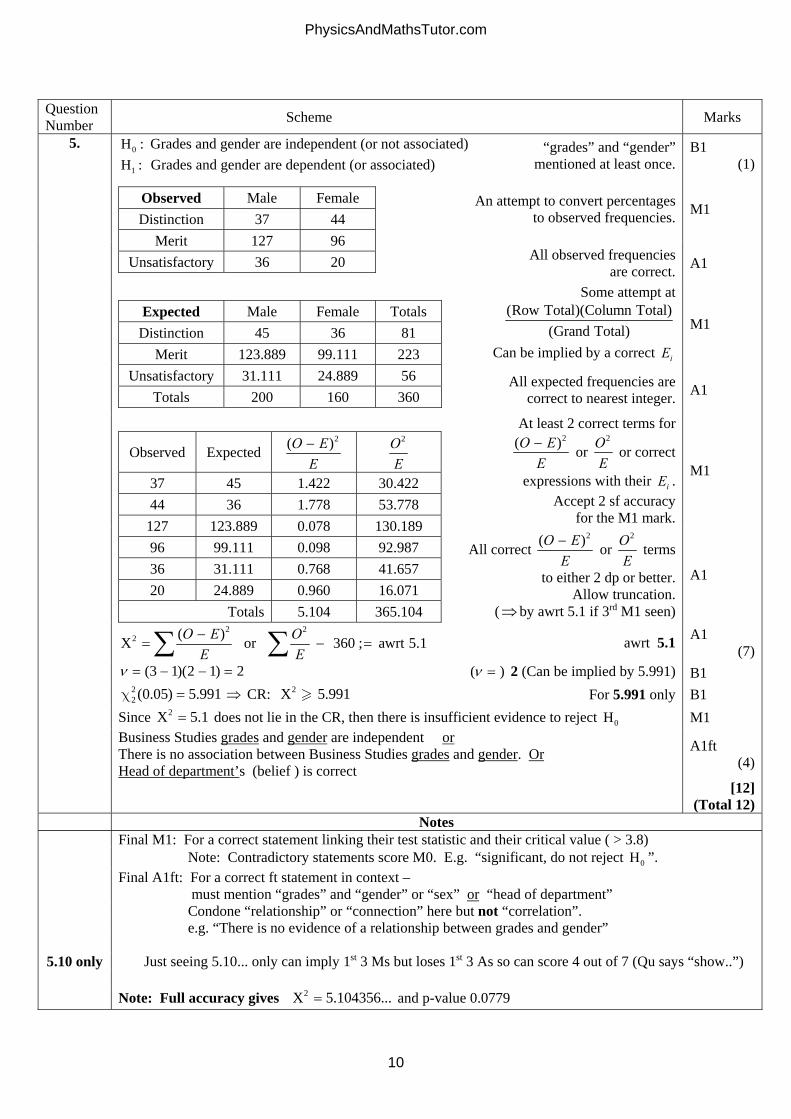
10
Question Number Scheme Marks
5. 0H : Grades and gender are independent (or not associated)
1H : Grades and gender are dependent (or associated) “grades” and “gender”
mentioned at least once.B1
(1)
Observed Male Female Distinction 37 44
Merit 127 96 Unsatisfactory 36 20
An attempt to convert percentages to observed frequencies. M1
All observed frequencies are correct. A1
Expected Male Female Totals
Distinction 45 36 81 Merit 123.889 99.111 223
Unsatisfactory 31.111 24.889 56 Totals 200 160 360
Some attempt at (Row Total)(Column Total)
(Grand Total)
Can be implied by a correct iE
M1
All expected frequencies are correct to nearest integer. A1
Observed Expected 2( )O E
E
2OE
37 45 1.422 30.422 44 36 1.778 53.778
127 123.889 0.078 130.189 96 99.111 0.098 92.987 36 31.111 0.768 41.657 20 24.889 0.960 16.071
Totals 5.104 365.104
At least 2 correct terms for 2( )O E
E or
2OE
or correct
expressions with their iE . Accept 2 sf accuracy
for the M1 mark.
M1
All correct 2( )O E
E or
2OE
terms
to either 2 dp or better. Allow truncation.
( by awrt 5.1 if 3rd M1 seen)
A1
2 22 ( )X or 360 ; awrt 5.1O E O
E E
awrt 5.1 A1 (7)
(3 1)(2 1) 2 ( ) 2 (Can be implied by 5.991) B1 2
2 (0.05) 5.991 c CR: 2X 5.991 For 5.991 only B1 Since 2X 5.1 does not lie in the CR, then there is insufficient evidence to reject 0H M1
Business Studies grades and gender are independent or There is no association between Business Studies grades and gender. Or Head of department’s (belief ) is correct
A1ft (4)
[12] (Total 12) Notes Final M1: For a correct statement linking their test statistic and their critical value ( > 3.8) Note: Contradictory statements score M0. E.g. “significant, do not reject 0H ”. Final A1ft: For a correct ft statement in context –
must mention “grades” and “gender” or “sex” or “head of department” Condone “relationship” or “connection” here but not “correlation”. e.g. “There is no evidence of a relationship between grades and gender”
5.10 only Just seeing 5.10... only can imply 1st 3 Ms but loses 1st 3 As so can score 4 out of 7 (Qu says “show..”) Note: Full accuracy gives 2X 5.104356... and p-value 0.0779
PhysicsAndMathsTutor.com

11
Question Number Scheme Marks
5. Mark Scheme for candidates who use percentages instead of observed values. 0H : Grades and gender are independent (or not associated)
1H : Grades and gender are dependent (or associated) “grades” and “gender”
mentioned at least once. B1
Observed Male Female Distinction 18.5 27.5
Merit 63.5 60.0 Unsatisfactory 18.0 12.5
These marks cannot be obtained. M0 A0
Expected Male Female Totals
Distinction 23 23 46 Merit 61.75 61.75 123.5
Unsatisfactory 15.25 15.25 30.5 Totals 100 100 200
Some attempt at (Row Total)(Column Total)
(Grand Total)
Can be implied by one of these iE ’s
M1
Expected frequencies are not correct. A0
Observed Expected 2( )O E
E
2OE
18.5 23 0.8804 14.8804 27.5 23 0.8804 32.8804 63.5 61.75 0.0496 65.2996 60.0 61.75 0.0496 58.2996 18.0 15.25 0.4959 21.2459 12.5 15.25 0.4959 10.2459
Totals 2.8518 202.8518
At least 2 “correct” terms for 2( )O E
E or
2OE
or correct
expressions with their iE . Accept 2 sf accuracy
for the M1 mark.
M1
This mark cannot be obtained. A0
2 22 ( )X or 360 ; 2.8518O E O
E E
This mark cannot be obtained. A0
(3 1)(2 1) 2 ( ) 2 (Can be implied by 5.991) B1 2
2 (0.05) 5.991 c CR: 2X 5.991 For 5.991 only B1 Since 2X 2.86 does not lie in the CR, then there is insufficient evidence to reject 0H M1
Not available since comes from incorrect working. A0
[12] (Total 12) Notes If a candidate uses percentages rather than observed values then they can obtain a maximum of 6 marks. They can get B1 M0A0 M1A0 M1A0A0 B1B1M1A0.
PhysicsAndMathsTutor.com
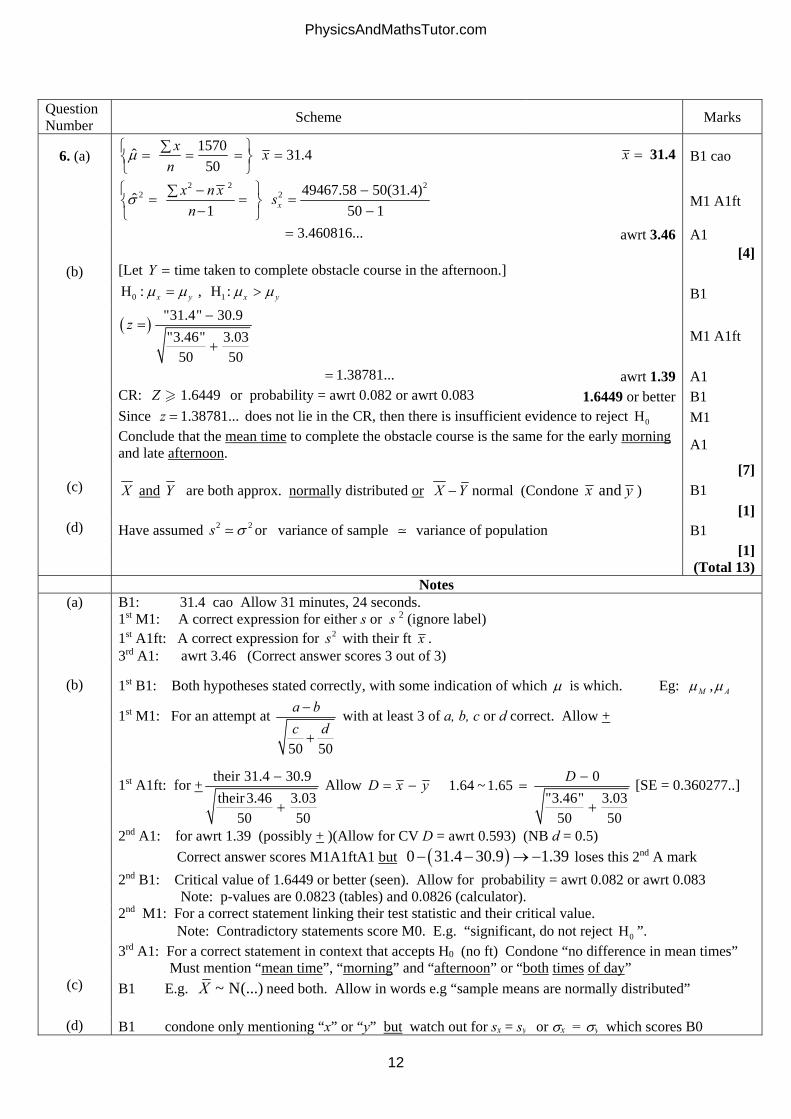
12
Question Number Scheme Marks
6. (a) 1570ˆ 31.4
50x x
n
x 31.4 B1 cao
2 2 22 2 49467.58 50(31.4)ˆ
1 50 1xx n x s
n
M1 A1ft
3.460816... awrt 3.46 A1 [4]
(b) [Let Y time taken to complete obstacle course in the afternoon.] 0 1H : , H :x y x y B1
"31.4" 30.9
"3.46" 3.0350 50
z
M1 A1ft
1.38781... awrt 1.39 A1 CR: 1.6449Z or probability = awrt 0.082 or awrt 0.083 1.6449 or better B1 Since 1.38781...z does not lie in the CR, then there is insufficient evidence to reject 0H M1
Conclude that the mean time to complete the obstacle course is the same for the early morning and late afternoon. A1
[7](c) X and Y are both approx. normally distributed or X Y normal (Condone and x y ) B1
[1](d) Have assumed 2 2s or variance of sample variance of population B1
[1] (Total 13) Notes
(a) B1: 31.4 cao Allow 31 minutes, 24 seconds. 1st M1: A correct expression for either s or s 2 (ignore label) 1st A1ft: A correct expression for 2s with their ft x . 3rd A1: awrt 3.46 (Correct answer scores 3 out of 3)
(b) 1st B1: Both hypotheses stated correctly, with some indication of which is which. Eg: ,M A
1st M1: For an attempt at
50 50
a bc d
with at least 3 of a, b, c or d correct. Allow +
1st A1ft: for + their 31.4 30.9
their 3.46 3.0350 50
Allow 01.64 ~ 1.65
"3.46" 3.0350 50
D
[SE = 0.360277..]
2nd A1: for awrt 1.39 (possibly + )(Allow for CV D = awrt 0.593) (NB d = 0.5) Correct answer scores M1A1ftA1 but 0 31.4 30.9 1.39 loses this 2nd A mark 2nd B1: Critical value of 1.6449 or better (seen). Allow for probability = awrt 0.082 or awrt 0.083 Note: p-values are 0.0823 (tables) and 0.0826 (calculator). 2nd M1: For a correct statement linking their test statistic and their critical value. Note: Contradictory statements score M0. E.g. “significant, do not reject 0H ”. 3rd A1: For a correct statement in context that accepts H0 (no ft) Condone “no difference in mean times” Must mention “mean time”, “morning” and “afternoon” or “both times of day”
(c) B1 E.g. ~ N(...)X need both. Allow in words e.g “sample means are normally distributed”
(d) B1 condone only mentioning “x” or “y” but watch out for sx = sy or x = y which scores B0
D x y
PhysicsAndMathsTutor.com
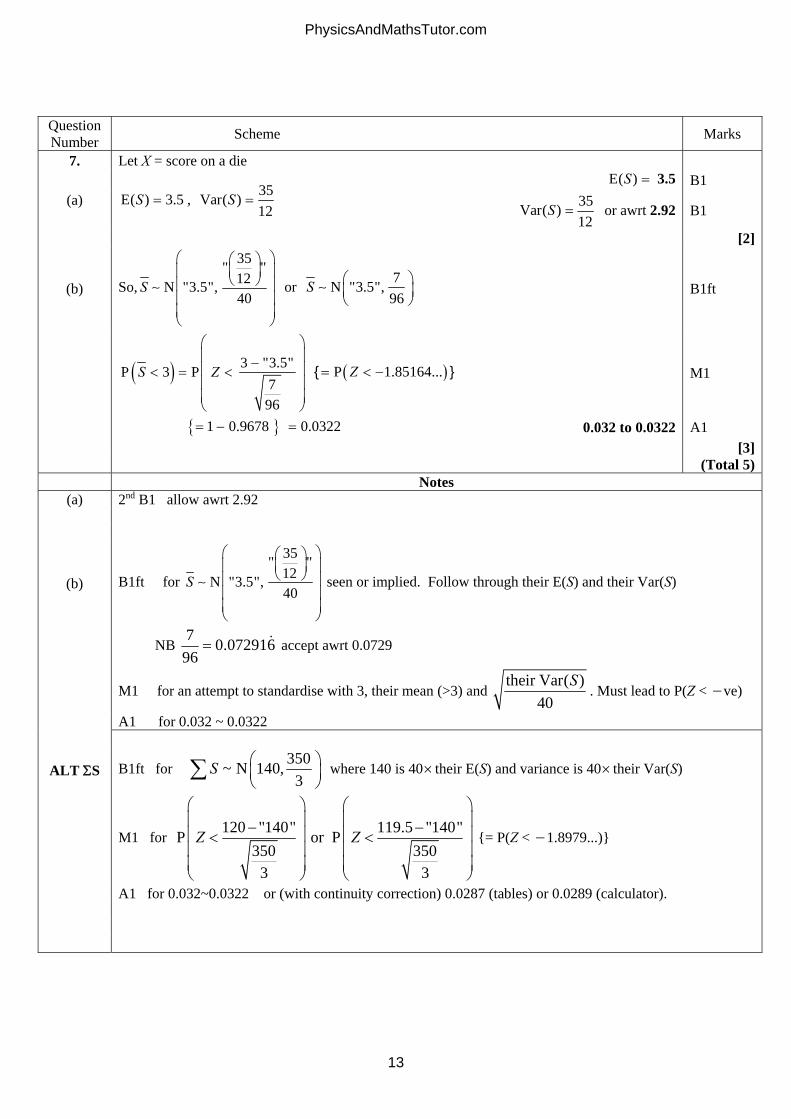
13
Question Number Scheme Marks
7. Let X = score on a die
(a) 35E( ) 3.5 , Var( )12
S S E( )S 3.5 B1
35Var( )12
S or awrt 2.92 B1
[2]
(b) So,
35" "12N "3.5",40
S
or 7N "3.5",96
S
B1ft
3 "3.5"P 3 P796
S Z
{ P 1.85164...Z } M1
1 0.9678 0.0322 0.032 to 0.0322 A1 [3] (Total 5) Notes
(a) 2nd B1 allow awrt 2.92
(b) B1ft for
35" "12N "3.5",40
S
seen or implied. Follow through their E(S) and their Var(S)
NB 7 0.072916
96 accept awrt 0.0729
M1 for an attempt to standardise with 3, their mean (>3) and their Var( )
40S
. Must lead to P(Z < ve)
A1 for 0.032 ~ 0.0322
ALT S B1ft for 350~ N 140,
3S
where 140 is 40 their E(S) and variance is 40 their Var(S)
M1 for 120 "140" 119.5 "140"P or P
350 3503 3
Z Z
{= P(Z < 1.8979...)}
A1 for 0.032~0.0322 or (with continuity correction) 0.0287 (tables) or 0.0289 (calculator).
PhysicsAndMathsTutor.com
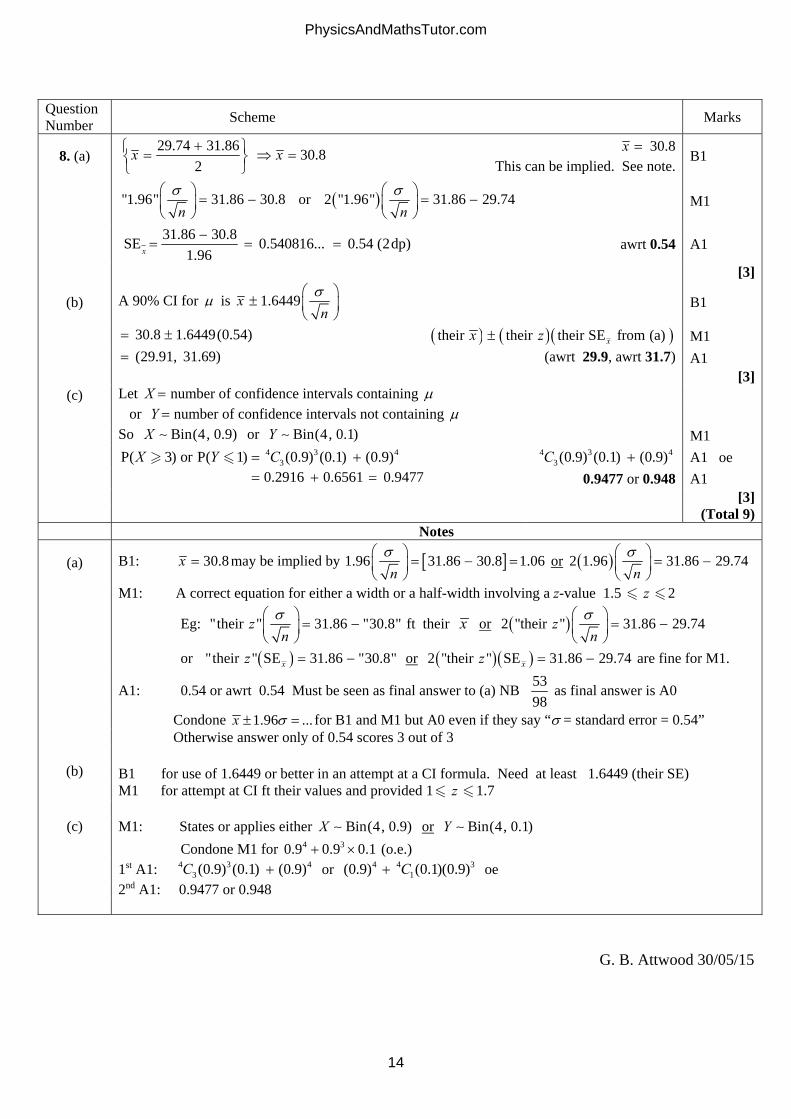
14
Question Number Scheme Marks
8. (a) 29.74 31.86 30.8
2x x
x 30.8
This can be implied. See note.B1
"1.96" 31.86 30.8
n
or 2 "1.96" 31.86 29.74n
M1
31.86 30.8SE 0.540816... 0.54 (2dp)
1.96x
awrt 0.54 A1
[3]
(b) A 90% CI for is 1.6449xn
B1
30.8 1.6449(0.54) their their their SE from (a)xx z M1 (29.91, 31.69) (awrt 29.9, awrt 31.7) A1 [3]
(c) Let X number of confidence intervals containing or Y number of confidence intervals not containing
So Bin(4, 0.9)X or Bin(4, 0.1)Y M1 4 3 4
3P( 3) or P( 1) (0.9) (0.1) (0.9)X Y C 4 3 43 (0.9) (0.1) (0.9)C A1 oe
0.2916 0.6561 0.9477 0.9477 or 0.948 A1 [3] (Total 9) Notes
(a) B1: 30.8x may be implied by 1.96 31.86 30.8 1.06n
or 2 1.96 31.86 29.74n
M1: A correct equation for either a width or a half-width involving a z-value 1.5 z 2
Eg: "their " 31.86 "30.8"zn
ft their x or 2 "their " 31.86 29.74zn
or "their " SE 31.86 "30.8"xz or 2 "their " SE 31.86 29.74xz are fine for M1.
A1: 0.54 or awrt 0.54 Must be seen as final answer to (a) NB 5398
as final answer is A0
Condone 1.96 ...x for B1 and M1 but A0 even if they say “ = standard error = 0.54” Otherwise answer only of 0.54 scores 3 out of 3
(b) B1 for use of 1.6449 or better in an attempt at a CI formula. Need at least 1.6449 (their SE) M1 for attempt at CI ft their values and provided 1 z 1.7
(c) M1: States or applies either Bin(4, 0.9)X or Bin(4, 0.1)Y Condone M1 for 4 30.9 0.9 0.1 (o.e.) 1st A1: 4 3 4
3 (0.9) (0.1) (0.9)C or 4 4 31(0.9) (0.1)(0.9)C oe
2nd A1: 0.9477 or 0.948
G. B. Attwood 30/05/15
PhysicsAndMathsTutor.com

15
Pearson Education Limited. Registered company number 872828 with its registered office at 80 Strand, London, WC2R 0RL, United Kingdom
PhysicsAndMathsTutor.com

Mark Scheme (Results) Summer 2015 Pearson Edexcel GCE in Statistics 3 (6691/01)
PhysicsAndMathsTutor.com

Edexcel and BTEC Qualifications Edexcel and BTEC qualifications are awarded by Pearson, the UK’s largest awarding body. We provide a wide range of qualifications including academic, vocational, occupational and specific programmes for employers. For further information visit our qualifications websites at www.edexcel.com or www.btec.co.uk. Alternatively, you can get in touch with us using the details on our contact us page at www.edexcel.com/contactus. Pearson: helping people progress, everywhere Pearson aspires to be the world’s leading learning company. Our aim is to help everyone progress in their lives through education. We believe in every kind of learning, for all kinds of people, wherever they are in the world. We’ve been involved in education for over 150 years, and by working across 70 countries, in 100 languages, we have built an international reputation for our commitment to high standards and raising achievement through innovation in education. Find out more about how we can help you and your students at: www.pearson.com/uk Summer 2015 Publications Code UA042717 All the material in this publication is copyright © Pearson Education Ltd 2015
PhysicsAndMathsTutor.com
3
General Marking Guidance
All candidates must receive the same treatment. Examiners must mark the first candidate in exactly the same way as they mark the last.
Mark schemes should be applied positively. Candidates must be rewarded for what they have shown they can do rather than penalised for omissions.
Examiners should mark according to the mark scheme not according to their perception of where the grade boundaries may lie.
There is no ceiling on achievement. All marks on the mark scheme should be used appropriately.
All the marks on the mark scheme are designed to be awarded. Examiners should always award full marks if deserved, i.e. if the answer matches the mark scheme. Examiners should also be prepared to award zero marks if the candidate’s response is not worthy of credit according to the mark scheme.
Where some judgement is required, mark schemes will provide the principles by which marks will be awarded and exemplification may be limited.
Crossed out work should be marked UNLESS the candidate has replaced it with an alternative response.
PhysicsAndMathsTutor.com

4
PEARSON EDEXCEL GCE MATHEMATICS
General Instructions for Marking
1. The total number of marks for the paper is 75
2. The Edexcel Mathematics mark schemes use the following types of marks: M marks: Method marks are awarded for ‘knowing a method and attempting to apply
it’, unless otherwise indicated.
A marks: Accuracy marks can only be awarded if the relevant method (M) marks have
been earned.
B marks are unconditional accuracy marks (independent of M marks)
Marks should not be subdivided.
3. Abbreviations
These are some of the traditional marking abbreviations that will appear in the mark schemes.
bod – benefit of doubt
ft – follow through
the symbol will be used for correct ft
cao – correct answer only
cso - correct solution only. There must be no errors in this part of the question to obtain this mark
isw – ignore subsequent working
awrt – answers which round to
SC: special case
oe – or equivalent (and appropriate)
d… or dep – dependent
indep – independent
dp decimal places
sf significant figures
The answer is printed on the paper or ag- answer given
or d… The second mark is dependent on gaining the first mark
4. All A marks are ‘correct answer only’ (cao.), unless shown, for example, as A1 ft to indicate that previous wrong working is to be followed through. After a misread however, the subsequent A marks affected are treated as A ft, but manifestly absurd answers should never be awarded A marks.
PhysicsAndMathsTutor.com

5
5. For misreading which does not alter the character of a question or materially simplify
it, deduct two from any A or B marks gained, in that part of the question affected.
6. If a candidate makes more than one attempt at any question: If all but one attempt is crossed out, mark the attempt which is NOT crossed
out. If either all attempts are crossed out or none are crossed out, mark all the
attempts and score the highest single attempt.
7. Ignore wrong working or incorrect statements following a correct answer.
PhysicsAndMathsTutor.com

6
June 2015 6691 S3
Mark Scheme
Question Number Scheme Marks
1. (a) Label all the books from 1 – 160 (o.e.) B1 Use random numbers to select the 10 books B1
(2)(b) Book A B C D E F G H I J
Borrow rank 1 2 3 4 5 6 7 8 9 10 Page rank 1 6 4 2 8 3 10 7 5 9
d2 0 16 1 4 9 9 9 1 16 1
M1 M1
6 661 , 1 0.410(100 1)sr
= 0.6 0.6 M1,A1
(4)(c) H0: 0 H1: 0 B1
Critical value is 0.5636 B1 0.6 > cv so significant result and sufficient evidence to reject H0 There is support for the librarian’s belief B1ft
or there is evidence of a correlation between the number of pages in a book and the number of times it is borrowed. (3)
Total 9 Notes
(a) 1st B1 for labelling\numbering\listing\using sampling frame of all 160 books 2nd B1 for use of random numbers\selection and mentioning the number 10
(b) 1st M1 for an attempt to rank the number of pages ( at least 4 correct) Allow reverse ranks 2nd M1 for attempt at 2d row (may be implied by sight of 2 66d or 264 for reverse ranks)
3rd M1 for use of the correct formula, follow through their 2d if clearly stated If answer is not correct, a correct expression is required.
A1 for 0.6 (or 0.6 for reverse ranks)
(c) 1st B1 for both hypotheses in terms of , one tail 1H (compatible with ranks) Allow use of s Hypotheses just in words e.g. “no correlation” score B0.
2nd B1 for cv of 0.5636 [ If they have a two tail 1H then allow 0.6485] Allow + for reverse ranking but must be same sign as sr
If hypotheses are the wrong way around this must be B0 but 3rd B1 is possible.
3rd B1ft for a correct contextualised comment. Must mention “librarian” (or he) or “number of pages” and “borrowing” Follow through their sr and their cv (provided it is |cv| <1) Don’t insist on the word “positive” or “negative” for a one-tailed test Use of “association” is B0
Independent of 1st B1 so if | sr | > |cv| must say there is sufficient evidence of …….(o.e.) and if | sr | < |cv| must say insufficient evidence of … (o.e.) regardless of their hypotheses
PhysicsAndMathsTutor.com

7
Question Number Scheme Marks
2. (a) 0H : 1.5g s [ g = in a group, s = on their own ] B1 1H : 1.5g s B1
s.e. = 2 22.1 1.4 0.08527...
80 65 = [0.292] M1
z =
2 2
8.7 6.6 1.52.1 1.4" "80 65
dM1
= 2.0546…. awrt 2.05(5) A1 cv 1% one tailed = 2.3263 B1 Not significant, accept H0 dM1
Insufficient evidence that using plan as part of a group leads to weight loss of more than 1.5 kg than using plan on one’s own A1ft
or researcher’s belief not supported (8)
(b) Since sample is large Central Limit Theorem (CLT) applies B1 No need to assume normal distribution dB1 (2) Total 10
Notes
(a) 1st & 2nd B1 for hypotheses. Accept 1 2, or ,A B etc if there is some indication of which is which e.g. ~ N( ,8.7)gG
1st M1 for an attempt at se with 3 out of 4 values correct. Condone switching 2.1 and 1.4
2 2 2 22.1 or 1.4 1.4 or 2.180 65
2nd dM1 dependent on 1st M1 for a correct numerator(must have 1.5) and ft their se. 1st A1 for awrt 2.05 3rd B1 for + 2.3263 or better seen or probability of awrt 0.02 3rd dM1 dep. on 1st M1 for a correct statement based on their normal cv and their test statistic
2nd A1ft for correct comment in context. Must mention “plan” and “group or individual” and “1.5” or “researcher” and “belief or claim”
NB Use of cv for difference in means D will have D = 1.5 + 2.3263 s.e. = awrt 2.18 and requires sight of d = 2.1 with a comment for the 3rd M1
(b) 1st B1 for mentioning “large samples” and “CLT”
2nd dB1 dependent on 1st B1 for stating no need to assume normality (since CLT assures it)
PhysicsAndMathsTutor.com
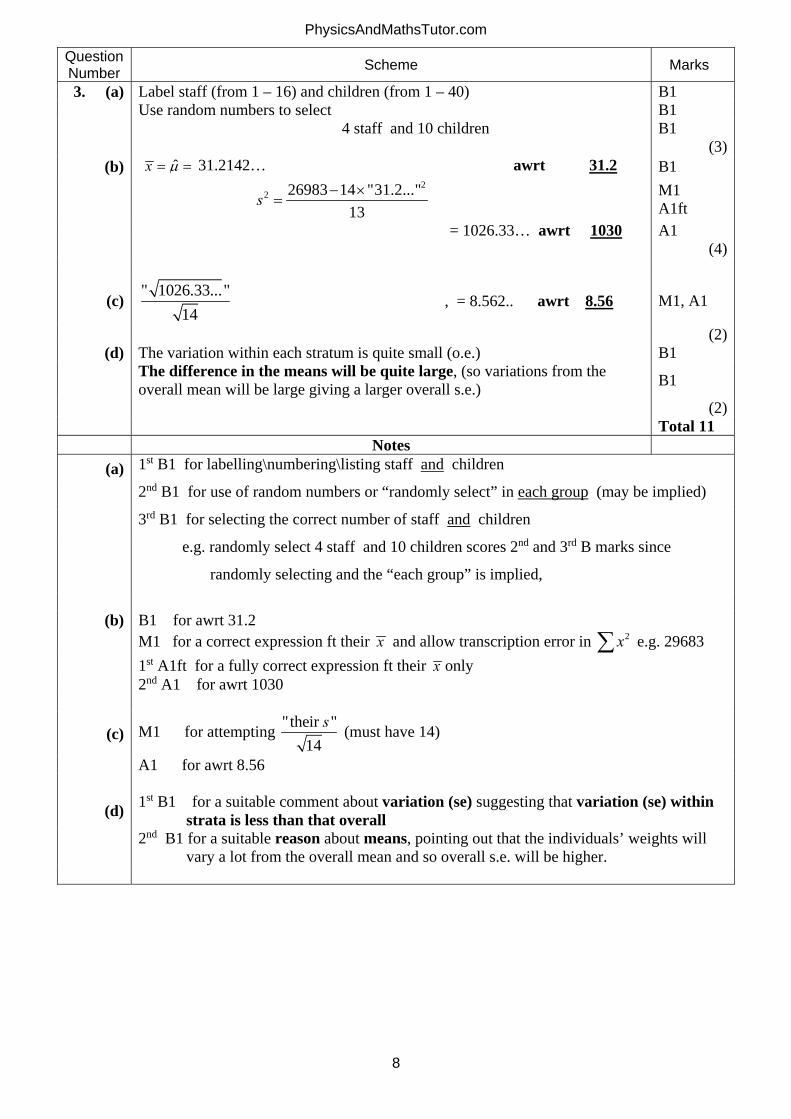
8
Question Number Scheme Marks
3. (a) Label staff (from 1 – 16) and children (from 1 – 40) B1 Use random numbers to select B1 4 staff and 10 children B1 (3)
(b) ˆx 31.2142… awrt 31.2 B1
2
2 26983 14 "31.2..."13
s M1
A1ft = 1026.33… awrt 1030 A1 (4)
(c) " 1026.33..."
14 , = 8.562.. awrt 8.56 M1, A1
(2)(d) The variation within each stratum is quite small (o.e.) B1
The difference in the means will be quite large, (so variations from the overall mean will be large giving a larger overall s.e.) B1
(2) Total 11 Notes
(a) 1st B1 for labelling\numbering\listing staff and children
2nd B1 for use of random numbers or “randomly select” in each group (may be implied)
3rd B1 for selecting the correct number of staff and children
e.g. randomly select 4 staff and 10 children scores 2nd and 3rd B marks since
randomly selecting and the “each group” is implied,
(b) B1 for awrt 31.2
M1 for a correct expression ft their x and allow transcription error in 2x e.g. 29683 1st A1ft for a fully correct expression ft their x only 2nd A1 for awrt 1030
(c) M1 for attempting "their "14
s (must have 14)
A1 for awrt 8.56
(d) 1st B1 for a suitable comment about variation (se) suggesting that variation (se) within strata is less than that overall
2nd B1 for a suitable reason about means, pointing out that the individuals’ weights will vary a lot from the overall mean and so overall s.e. will be higher.
PhysicsAndMathsTutor.com

9
Question Number Scheme Marks
4. (a) 0 1H : 0.5 H : 0.5 B1 (Significance level = )10% dB1
(0.5 is in the interval so not significant, accept H0, can accept) = 0.5 B1 (3)
(b) 1.6449100
0.0247 M1 B1
10 0.02470.15016 or 1.6449
(awrt 0.15) A1
0.479 " "1.96150
M1 B1
awrt (0.455, 0.503) A1 (6) Total 9
Notes (a) 1st B1 for both hypotheses in terms of .
2nd dB1 for 10% but accept 5% if they have a one-tail test as H1 3rd B1 for a correct comment leading to accepting H0 Ignore any ‘further calculations’.
(b) 1st M1 for 100
z k , using 100n and where |z| > 1.5 and 0.02 < k < 0.03
1st B1 for 1.6449 or better in an attempt (could be 1.6449 = k or even 1.6449 2 = k) 1st A1 for a correct expression for e.g. awrt 0.15
2nd M1 for 150
x z for any z ( > 1) and ft their and allow x 0.4633,0.5127
Allow use of letter without a value. 2nd B1 for 1.96 or better in an attempt (could be 1.96 or even 1.96 2 ) 2nd A1 for awrt 0.455 and awrt 0.503
PhysicsAndMathsTutor.com
10
Question Number Scheme Marks
5 (i) Let R = 1 2 3 4 5 5B B B B B H so E(R) = 25 (o.e.) B1
Var(R) = 2 2 25 6 5 4 R~N(25, 2
580 ) M1A1
P(R > 0) = P(Z > 0 25580 ) = P(Z > 1.04), = 0.149619…(calc) or 0.1492 (tables) dM1 A1
(5)(ii)(a) 2
5~ N ,X B1
Var(D) = 2 22 65 5" " , so D ~N
260,5
M1, A1 (3)
(b) P 1( )Y X = P(D > ) = 65
P Z
M1
= P(Z > 0.912…) = 0.181(3 dp) (*) A1cso (2)
(c) Since 1 and U U are not independent (so variance formula cannot be used) B1 Can be implied e.g. 1 U used to calculate U , 1 and U U from same sample o.e. (1)
(d) Let F = 1 2 3 4 5 1 2 3 4 51 1
4,
5 5U U U U U U U U U U
U U U
M1, A1
Var(F) =2 2 2
2
4 45
= 0.8 2 ,so F ~ N(0, 0.8 2 ) dM1, A1
P( ) P0.8
F Z
= P(Z > 1.118..) M1
= 0.1314 (tables) or 0.131776…(calc) awrt 0.131~0.132 A1cso (6) Total 17 Notes
(i) 1st B1 for E(R) = – 25 (or 25 if their R is defined the other way around) 1st M1 for an attempt at Var(R) = 5Var(B) + 25Var(H). Condone swapping of 2 26 and 4 1st A1 for normal and correct variance (ft their mean )
2nd dM1 for attempting the correct probability and standardising with their mean and sd. This mark is dependent on 1st M1 so if R is not being used or M0 for variance score M0 If their method is not crystal clear then they must be attempting P(Z > +ve value) o.e
2nd A1 for answer in the range [0.149, 0.150]
(ii)(a) B1 for correct distribution of X (may be implied for a correct answer for D) M1 for correct attempt at Var(D) (ft their Var( X )) [A1 needs must be fully correct]
(ii)(b) M1 for expressing probability in terms of D and standardising A1cso for seeing P(Z> 0.912..) or prob of 1 – 0.8186 (tables) or 0.180655…(calc)
(c) B1 correct statement that should mention 1 and U U (d) 1st M1 for forming an expression in terms of 1 5...U U only
1st A1 for collecting 1U terms and getting in a form where Var(aX + bY) can be used. 2nd dM1 for a correct expression for Var(their F). Dependent on 1st M1. 2nd A1 for a correct distribution for F 3rd M1 attempting a correct prob and standardising using their Var(F), must cancel 3rd A1cso for awrt 0.131 or 0.132
PhysicsAndMathsTutor.com

11
Question Number Scheme Marks
6. (a) 0H : U[0, 10] is a suitable model 1H : U[0, 10] is not a suitable model B1
D iO iE 2( )i i
i
O EE
2i
i
OE
0 – 4 22 40 8.1 12.1 4 – 7 39 30 2.7 50.7 7 – 9 25 20 1.25 31.25 9 – 10 14 10 1.6 19.6
B1 M1A1 M1 A1
233, (1%) 11.345 B1, B1
[Reject 0H ,] the uniform distribution over [0, 10] is not a suitable model A1 (9)
(b) Area 2R so r = 81, – 49 = 32 M1, A1 s = 100 – “32” – 49 or 100 – 81 = 19 B1ft (3)
(c) Not significant, Henry’s model is suitable M1, A1 (2)
(d) 0H : The colour\region chosen for the points is independent of gender(or no assoc’) B1
1H : The colour\region chosen for the points is dependent on gender(or assoc’) (1)
(e) 39 65
100 B1
(1)
(f) Expected frequency for Yellow and Boys is 4.9 < 5 so col. must be pooled/combined. B1
[This gives a 2 3 table so (2 1) (3 1) 2 ] (1)
(g) cv = 4.605 B1 [Not significant] so the data do not support Phoebe’s belief oe B1 (2) Total 19 Notes
(a) 2nd B1 for the correct values for D (can be implied by 40, 30, 20, and 10.) 1st M1 for at least 2 expected frequencies or clear use of a correct formula e.g. 0.4N 1st A1 for all the correct Ei 2nd M1 for at least 2 correct calculations from 4th or 5th column
2nd A1 for a test statistic of 13.65 (accept 13.7 to 3 sf) Awrt 13.7 only scores 2nd B1M1A1M1A1
3rd A1 for a correct conclusion rejecting the uniform model. Award provided their test statistic > 11.345
(b) M1 for some attempt to use 2R to find r
(c) M1 for a correct statement that it is not significant A1 for correctly stating that Henry’s model is suitable o.e.
(d) B1 Independence or association mentioned at least once if ditto marks used. Allow connection but not correlation.
(f) B1 for recognising there is an Ei < 5 and need for pooling/combining oe
(g) 2ndB1 for correctly stating that Phoebe’s belief is not supported by the data oe (depends on their cv being > 1.411)
Values of D Expected Freq 4th or 5th col
2 13.65
PhysicsAndMathsTutor.com
12
Pearson Education Limited. Registered company number 872828 with its registered office at 80 Strand, London, WC2R 0RL, United Kingdom
PhysicsAndMathsTutor.com