Embed Size (px)
Citation preview
kumarmaths.weebly.com 1
Edexcel
Statistics 3 Regression and
Correlation
Edited by: K V Kumaran
kumarmaths.weebly.com 2
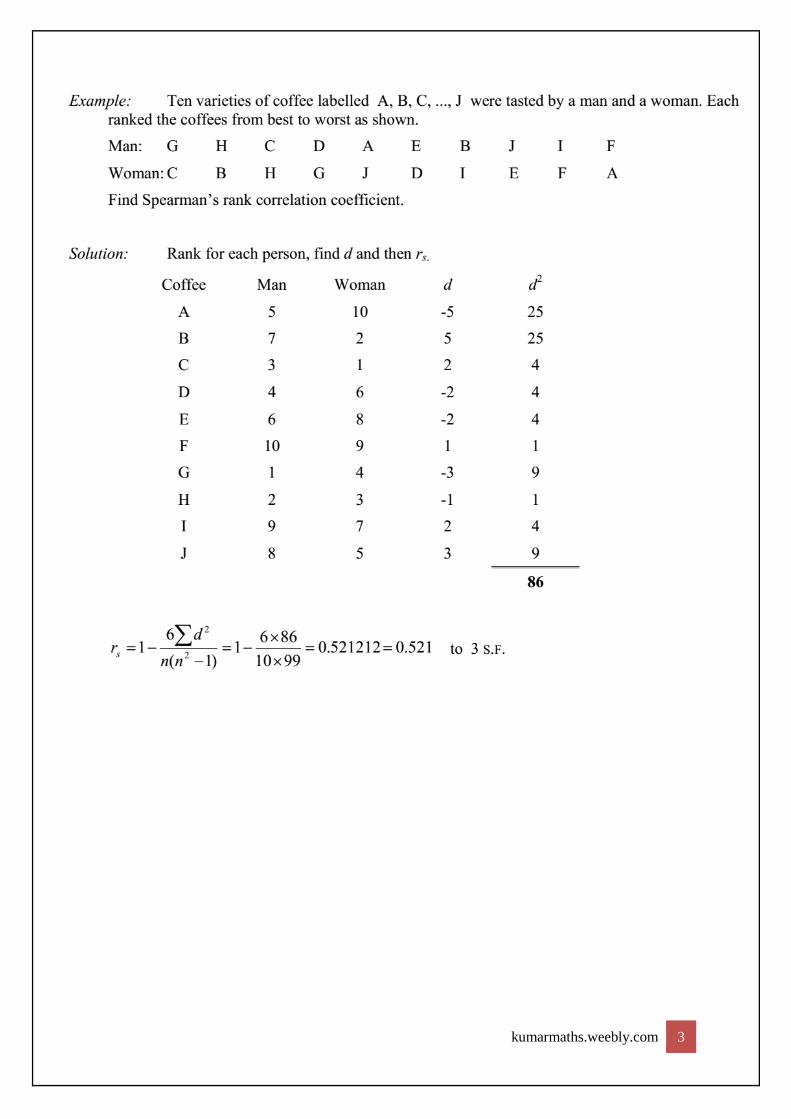
kumarmaths.weebly.com 3
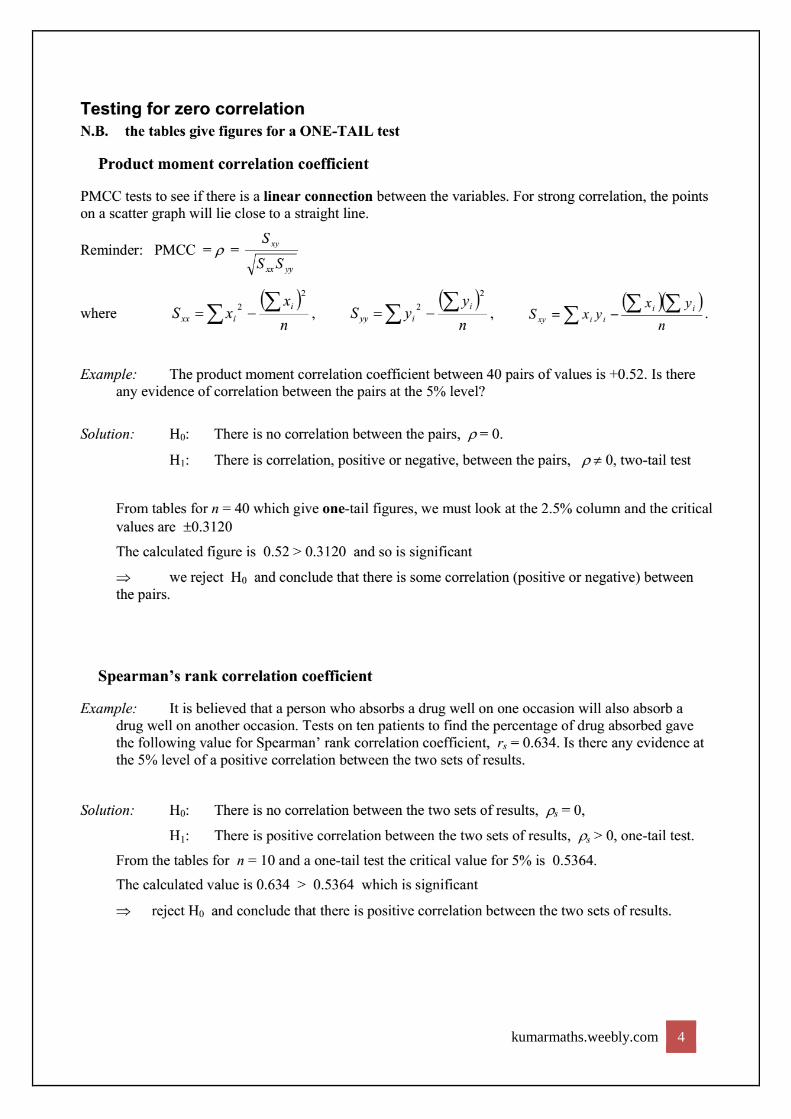
kumarmaths.weebly.com 4
kumarmaths.weebly.com 5
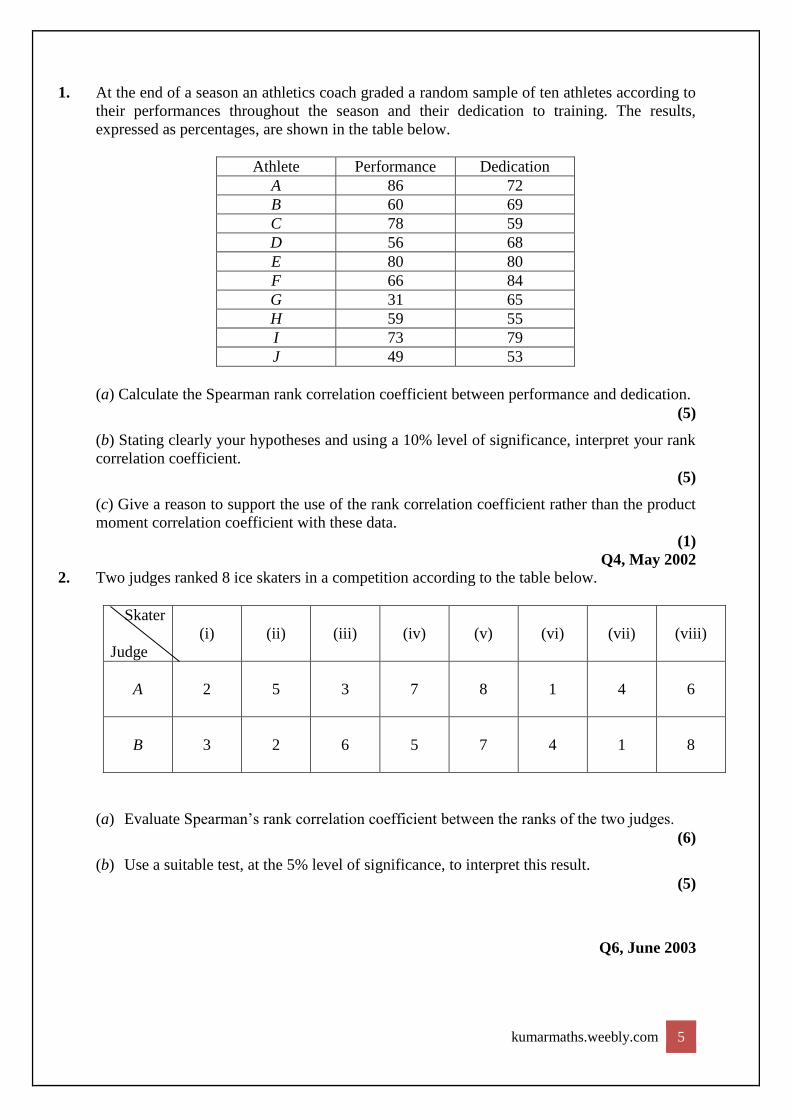
1. At the end of a season an athletics coach graded a random sample of ten athletes according to
their performances throughout the season and their dedication to training. The results,
expressed as percentages, are shown in the table below.
Athlete Performance Dedication
A 86 72
B 60 69
C 78 59
D 56 68
E 80 80
F 66 84
G 31 65
H 59 55
I 73 79
J 49 53
(a) Calculate the Spearman rank correlation coefficient between performance and dedication.
(5)
(b) Stating clearly your hypotheses and using a 10% level of significance, interpret your rank
correlation coefficient.
(5)
(c) Give a reason to support the use of the rank correlation coefficient rather than the product
moment correlation coefficient with these data.
(1)
Q4, May 2002
2. Two judges ranked 8 ice skaters in a competition according to the table below.
Skater
Judge
(i) (ii) (iii) (iv) (v) (vi) (vii) (viii)
A
2 5 3 7 8 1 4 6
B
3 2 6 5 7 4 1 8
(a) Evaluate Spearman’s rank correlation coefficient between the ranks of the two judges.
(6)
(b) Use a suitable test, at the 5% level of significance, to interpret this result.
(5)
Q6, June 2003
kumarmaths.weebly.com 6
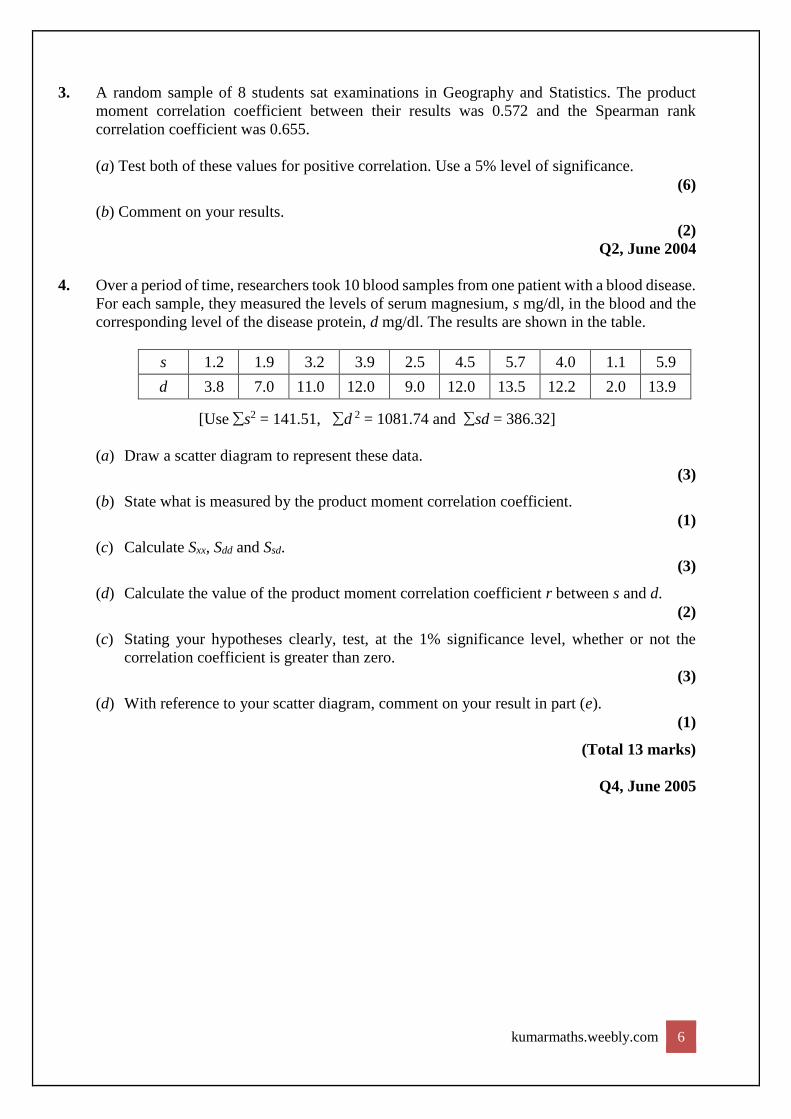
3. A random sample of 8 students sat examinations in Geography and Statistics. The product
moment correlation coefficient between their results was 0.572 and the Spearman rank
correlation coefficient was 0.655.
(a) Test both of these values for positive correlation. Use a 5% level of significance.
(6)
(b) Comment on your results.
(2)
Q2, June 2004
4. Over a period of time, researchers took 10 blood samples from one patient with a blood disease.
For each sample, they measured the levels of serum magnesium, s mg/dl, in the blood and the
corresponding level of the disease protein, d mg/dl. The results are shown in the table.
s 1.2 1.9 3.2 3.9 2.5 4.5 5.7 4.0 1.1 5.9
d 3.8 7.0 11.0 12.0 9.0 12.0 13.5 12.2 2.0 13.9
[Use s2 = 141.51, d 2 = 1081.74 and sd = 386.32]
(a) Draw a scatter diagram to represent these data.
(3)
(b) State what is measured by the product moment correlation coefficient.
(1)
(c) Calculate Sxx, Sdd and Ssd.
(3)
(d) Calculate the value of the product moment correlation coefficient r between s and d.
(2)
(c) Stating your hypotheses clearly, test, at the 1% significance level, whether or not the
correlation coefficient is greater than zero.
(3)
(d) With reference to your scatter diagram, comment on your result in part (e).
(1)
(Total 13 marks)
Q4, June 2005

kumarmaths.weebly.com 7
5. The numbers of deaths from pneumoconiosis and lung cancer in a developing country are given
in the table.
Age group (years) 20–29 30–39 40–49 50–59 60–69 70 and
over
Deaths from
pneumoconiosis
(1000s)
12.5 5.9 18.5 19.4 31.2 31.0
Deaths from lung
cancer (1000s) 3.7 9.0 10.2 19.0 13.0 18.0
The correlation between the number of deaths in the different age groups for each disease is to
be investigated.
(a) Give one reason why Spearman’s rank correlation coefficient should be used.
(1)
(b) Calculate Spearman’s rank correlation coefficient for these data.
(6)
(c) Use a suitable test, at the 5% significance level, to interpret your result. State your
hypotheses clearly.
(5)
Q7, Jan 2006
6. The table below shows the price of an ice cream and the distance of the shop where it was
purchased from a particular tourist attraction.
Shop Distance from tourist
attraction (m) Price (£)
A 50 1.75
B 175 1.20
C 270 2.00
D 375 1.05
E 425 0.95
F 580 1.25
G 710 0.80
H 790 0.75
I 890 1.00
J 980 0.85
kumarmaths.weebly.com 8
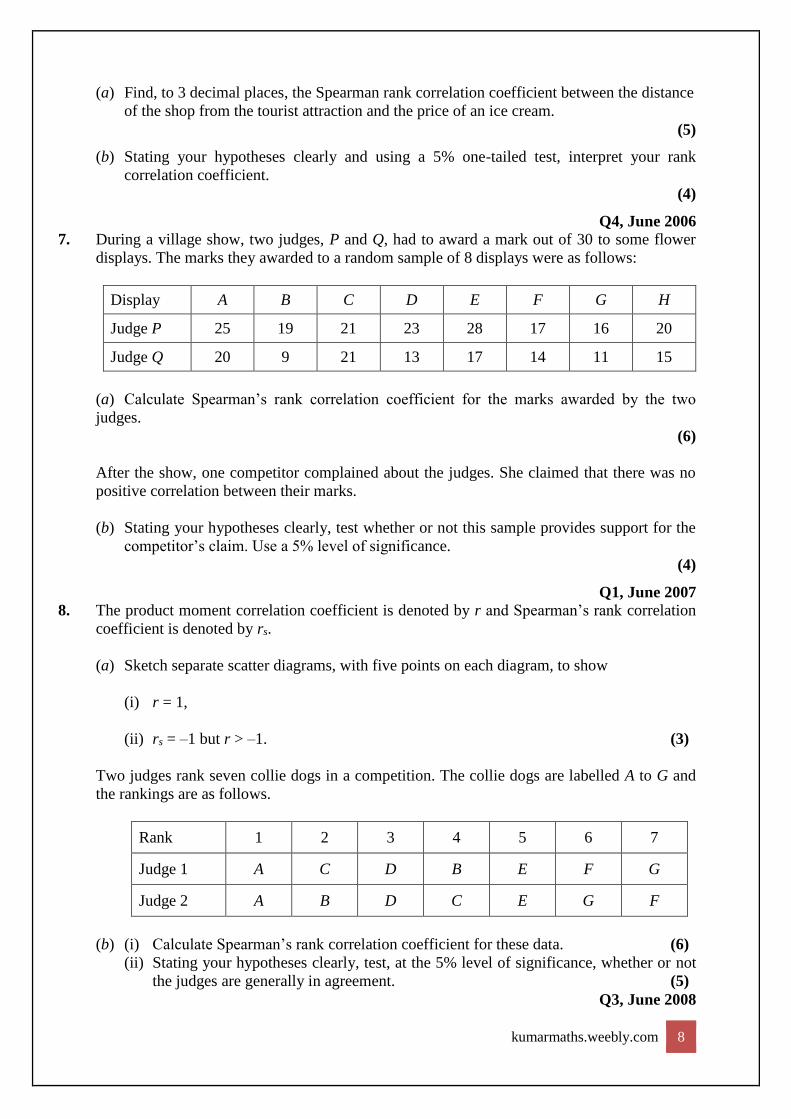
(a) Find, to 3 decimal places, the Spearman rank correlation coefficient between the distance
of the shop from the tourist attraction and the price of an ice cream.
(5)
(b) Stating your hypotheses clearly and using a 5% one-tailed test, interpret your rank
correlation coefficient.
(4)
Q4, June 2006
7. During a village show, two judges, P and Q, had to award a mark out of 30 to some flower
displays. The marks they awarded to a random sample of 8 displays were as follows:
Display A B C D E F G H
Judge P 25 19 21 23 28 17 16 20
Judge Q 20 9 21 13 17 14 11 15
(a) Calculate Spearman’s rank correlation coefficient for the marks awarded by the two
judges.
(6)
After the show, one competitor complained about the judges. She claimed that there was no
positive correlation between their marks.
(b) Stating your hypotheses clearly, test whether or not this sample provides support for the
competitor’s claim. Use a 5% level of significance.
(4)
Q1, June 2007
8. The product moment correlation coefficient is denoted by r and Spearman’s rank correlation
coefficient is denoted by rs.
(a) Sketch separate scatter diagrams, with five points on each diagram, to show
(i) r = 1,
(ii) rs = –1 but r > –1. (3)
Two judges rank seven collie dogs in a competition. The collie dogs are labelled A to G and
the rankings are as follows.
Rank 1 2 3 4 5 6 7
Judge 1 A C D B E F G
Judge 2 A B D C E G F
(b) (i) Calculate Spearman’s rank correlation coefficient for these data. (6)
(ii) Stating your hypotheses clearly, test, at the 5% level of significance, whether or not
the judges are generally in agreement. (5)
Q3, June 2008
kumarmaths.weebly.com 9
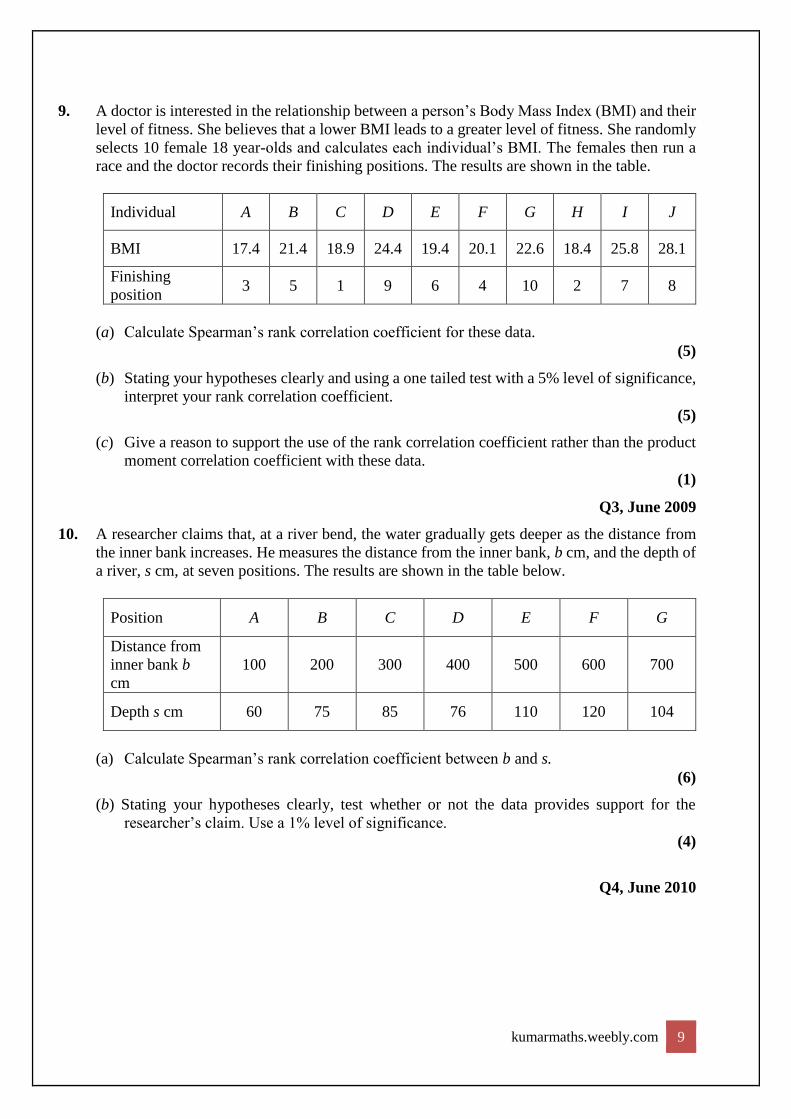
9. A doctor is interested in the relationship between a person’s Body Mass Index (BMI) and their
level of fitness. She believes that a lower BMI leads to a greater level of fitness. She randomly
selects 10 female 18 year-olds and calculates each individual’s BMI. The females then run a
race and the doctor records their finishing positions. The results are shown in the table.
Individual A B C D E F G H I J
BMI 17.4 21.4 18.9 24.4 19.4 20.1 22.6 18.4 25.8 28.1
Finishing
position 3 5 1 9 6 4 10 2 7 8
(a) Calculate Spearman’s rank correlation coefficient for these data.
(5)
(b) Stating your hypotheses clearly and using a one tailed test with a 5% level of significance,
interpret your rank correlation coefficient.
(5)
(c) Give a reason to support the use of the rank correlation coefficient rather than the product
moment correlation coefficient with these data.
(1)
Q3, June 2009
10. A researcher claims that, at a river bend, the water gradually gets deeper as the distance from
the inner bank increases. He measures the distance from the inner bank, b cm, and the depth of
a river, s cm, at seven positions. The results are shown in the table below.
Position A B C D E F G
Distance from
inner bank b
cm
100 200 300 400 500 600 700
Depth s cm 60 75 85 76 110 120 104
(a) Calculate Spearman’s rank correlation coefficient between b and s.
(6)
(b) Stating your hypotheses clearly, test whether or not the data provides support for the
researcher’s claim. Use a 1% level of significance.
(4)
Q4, June 2010
kumarmaths.weebly.com 10
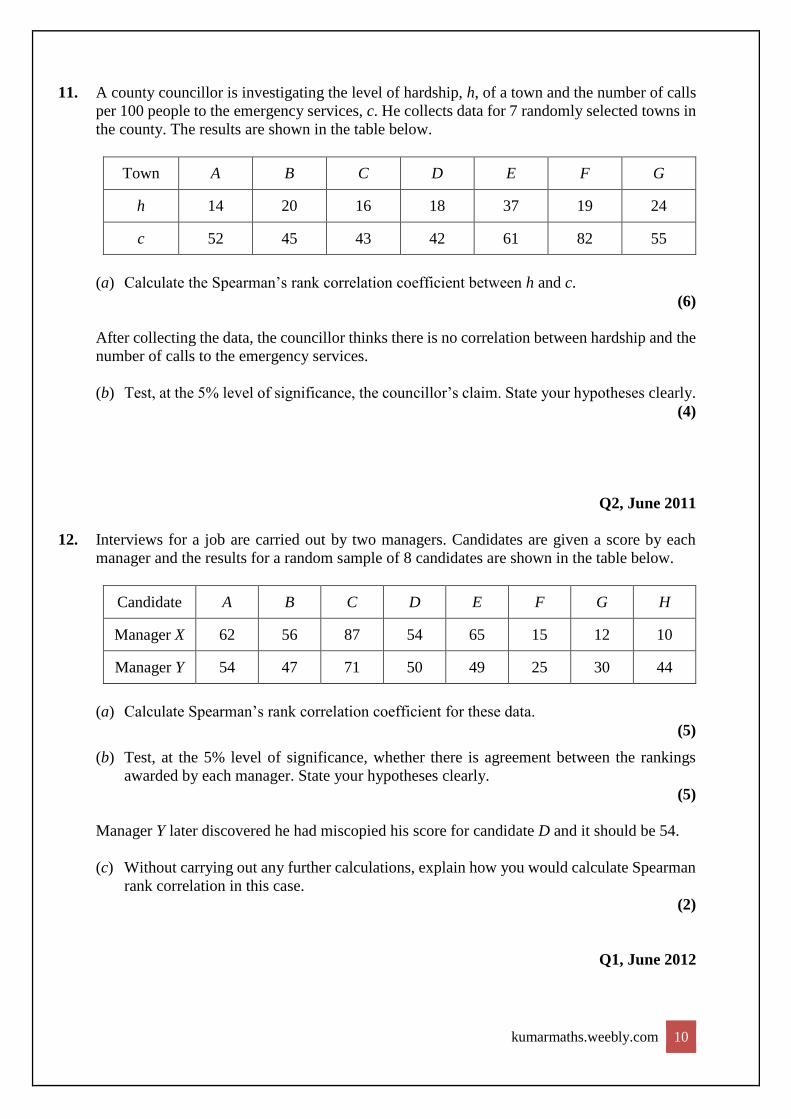
11. A county councillor is investigating the level of hardship, h, of a town and the number of calls
per 100 people to the emergency services, c. He collects data for 7 randomly selected towns in
the county. The results are shown in the table below.
Town A B C D E F G
h 14 20 16 18 37 19 24
c 52 45 43 42 61 82 55
(a) Calculate the Spearman’s rank correlation coefficient between h and c.
(6)
After collecting the data, the councillor thinks there is no correlation between hardship and the
number of calls to the emergency services.
(b) Test, at the 5% level of significance, the councillor’s claim. State your hypotheses clearly.
(4)
Q2, June 2011
12. Interviews for a job are carried out by two managers. Candidates are given a score by each
manager and the results for a random sample of 8 candidates are shown in the table below.
Candidate A B C D E F G H
Manager X 62 56 87 54 65 15 12 10
Manager Y 54 47 71 50 49 25 30 44
(a) Calculate Spearman’s rank correlation coefficient for these data.
(5)
(b) Test, at the 5% level of significance, whether there is agreement between the rankings
awarded by each manager. State your hypotheses clearly.
(5)
Manager Y later discovered he had miscopied his score for candidate D and it should be 54.
(c) Without carrying out any further calculations, explain how you would calculate Spearman
rank correlation in this case.
(2)
Q1, June 2012

kumarmaths.weebly.com 11
13. The table below shows the number of students per member of staff and the student satisfaction
scores for 7 universities.
University A B C D E F G
Number of students
per member of staff 14.2 13.1 13.3 11.7 10.5 15.9 10.8
Student satisfaction
score 4.1 4.2 3.8 4.0 3.9 4.3 3.7
(a) Calculate Spearman’s rank correlation coefficient for these data.
(5)
(b) Stating your hypotheses clearly test, at the 5% level of significance, whether or not there
is evidence of a correlation between the number of students per member of staff and the
student satisfaction score.
(3)
Q2, June 2013
14. The table below shows the population and the number of council employees for different towns
and villages.
Town or village Population Number of council employees
A 211 10
B 356 2
C 1047 12
D 2463 21
E 4892 16
F 6479 25
G 6571 67
H 6573 45
I 9845 48
J 14 784 34
(a) Find, to 3 decimal places, Spearman’s rank correlation coefficient between the population
and the number of council employees.
(5)
(b) Use your value of Spearman’s rank correlation coefficient to test for evidence of a positive
correlation between the population and the number of council employees. Use a 2.5%
significance level. State your hypotheses clearly.
(4)

kumarmaths.weebly.com 12
It is suggested that a product moment correlation coefficient would be a more suitable
calculation in this case. The product moment correlation coefficient for these data is 0.627 to
3 decimal places.
(c) Use the value of the product moment correlation coefficient to test for evidence of a
positive correlation between the population and the number of council employees. Use a
2.5% significance level.
(2)
(d) Interpret and comment on your results from part (b) and part (c).
(2)
Q3, June 2013_R
15. The heights, in metres, and weights, in kilograms, of a random sample of 9 men are shown in
the table below.
Man A B C D E F G H I
Height (x) 1.68 1.74 1.75 1.76 1.78 1.82 1.84 1.88 1.98
Weight (y) 75 76 100 77 90 95 110 96 120
(a) Given that Sxx = 0.0632, Syy = 1957.5556 and Sxy = 9.3433 calculate, to 3 decimal places,
the product moment correlation coefficient between height and weight for these men.
(2)
(b) Use your value of the product moment correlation coefficient to test whether or not there
is evidence of a positive correlation between the height and weight of men. Use a 5 %
significance level. State your hypotheses clearly.
(4)
Peter does not know the heights or weights of the 9 men. He is given photographs of them and
asked to put them in order of increasing weight. He puts them in the order
A C E B G D I F H
(c) Find, to 3 decimal places, Spearman’s rank correlation coefficient between Peter’s order
and the actual order.
(6)
(d) Use your value of Spearman’s rank correlation coefficient to test for evidence of Peter’s
ability to correctly order men, by their weight, from their photographs. Use a 5%
significance level and state your hypotheses clearly.
(4)
Q8, May 2014
kumarmaths.weebly.com 13
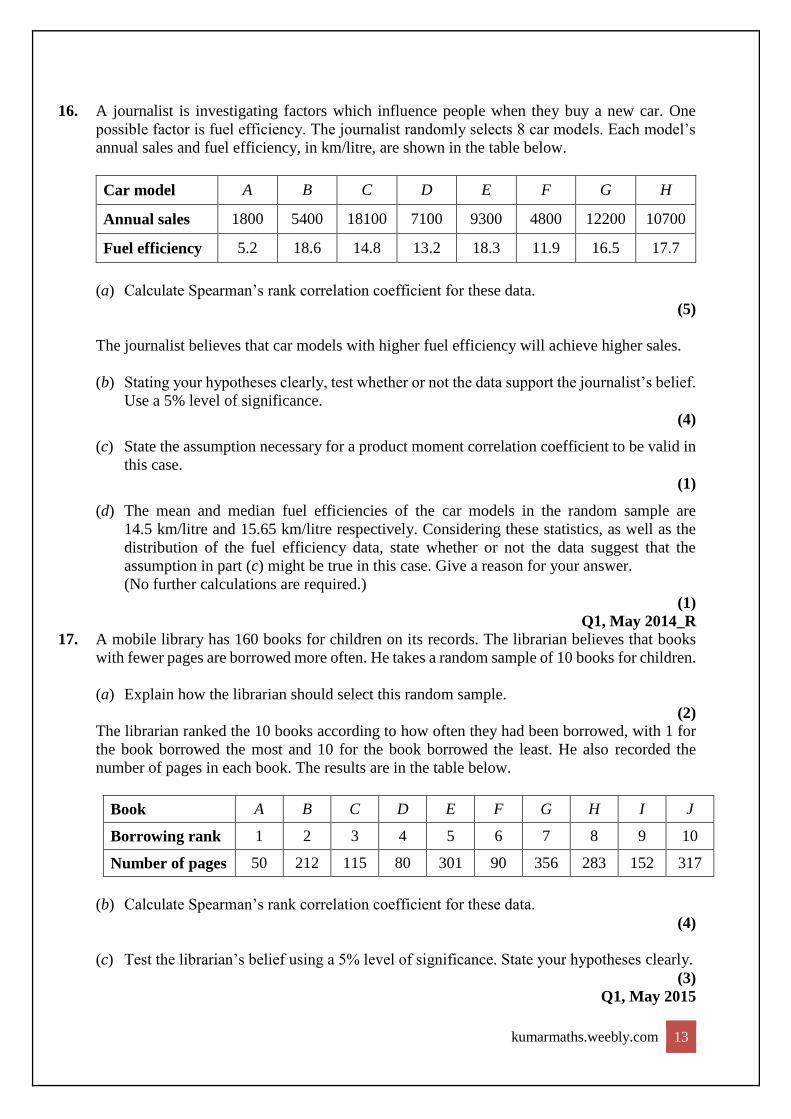
16. A journalist is investigating factors which influence people when they buy a new car. One
possible factor is fuel efficiency. The journalist randomly selects 8 car models. Each model’s
annual sales and fuel efficiency, in km/litre, are shown in the table below.
Car model A B C D E F G H
Annual sales 1800 5400 18100 7100 9300 4800 12200 10700
Fuel efficiency 5.2 18.6 14.8 13.2 18.3 11.9 16.5 17.7
(a) Calculate Spearman’s rank correlation coefficient for these data.
(5)
The journalist believes that car models with higher fuel efficiency will achieve higher sales.
(b) Stating your hypotheses clearly, test whether or not the data support the journalist’s belief.
Use a 5% level of significance.
(4)
(c) State the assumption necessary for a product moment correlation coefficient to be valid in
this case.
(1)
(d) The mean and median fuel efficiencies of the car models in the random sample are
14.5 km/litre and 15.65 km/litre respectively. Considering these statistics, as well as the
distribution of the fuel efficiency data, state whether or not the data suggest that the
assumption in part (c) might be true in this case. Give a reason for your answer.
(No further calculations are required.)
(1)
Q1, May 2014_R
17. A mobile library has 160 books for children on its records. The librarian believes that books
with fewer pages are borrowed more often. He takes a random sample of 10 books for children.
(a) Explain how the librarian should select this random sample.
(2)
The librarian ranked the 10 books according to how often they had been borrowed, with 1 for
the book borrowed the most and 10 for the book borrowed the least. He also recorded the
number of pages in each book. The results are in the table below.
Book A B C D E F G H I J
Borrowing rank 1 2 3 4 5 6 7 8 9 10
Number of pages 50 212 115 80 301 90 356 283 152 317
(b) Calculate Spearman’s rank correlation coefficient for these data.
(4)
(c) Test the librarian’s belief using a 5% level of significance. State your hypotheses clearly.
(3)
Q1, May 2015
kumarmaths.weebly.com 14
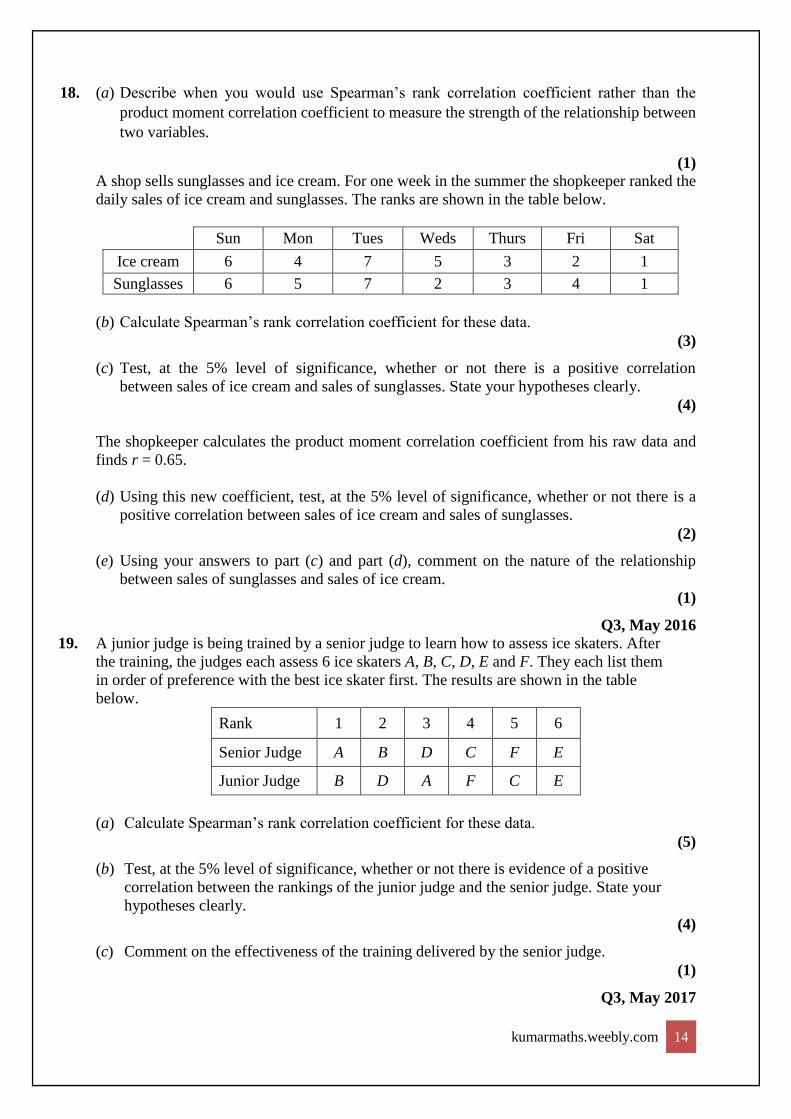
18. (a) Describe when you would use Spearman’s rank correlation coefficient rather than the
product moment correlation coefficient to measure the strength of the relationship between
two variables.
(1)
A shop sells sunglasses and ice cream. For one week in the summer the shopkeeper ranked the
daily sales of ice cream and sunglasses. The ranks are shown in the table below.
Sun Mon Tues Weds Thurs Fri Sat
Ice cream 6 4 7 5 3 2 1
Sunglasses 6 5 7 2 3 4 1
(b) Calculate Spearman’s rank correlation coefficient for these data.
(3)
(c) Test, at the 5% level of significance, whether or not there is a positive correlation
between sales of ice cream and sales of sunglasses. State your hypotheses clearly.
(4)
The shopkeeper calculates the product moment correlation coefficient from his raw data and
finds r = 0.65.
(d) Using this new coefficient, test, at the 5% level of significance, whether or not there is a
positive correlation between sales of ice cream and sales of sunglasses.
(2)
(e) Using your answers to part (c) and part (d), comment on the nature of the relationship
between sales of sunglasses and sales of ice cream.
(1)
Q3, May 2016
19. A junior judge is being trained by a senior judge to learn how to assess ice skaters. After
the training, the judges each assess 6 ice skaters A, B, C, D, E and F. They each list them
in order of preference with the best ice skater first. The results are shown in the table
below.
Rank 1 2 3 4 5 6
Senior Judge A B D C F E
Junior Judge B D A F C E
(a) Calculate Spearman’s rank correlation coefficient for these data.
(5)
(b) Test, at the 5% level of significance, whether or not there is evidence of a positive
correlation between the rankings of the junior judge and the senior judge. State your
hypotheses clearly.
(4)
(c) Comment on the effectiveness of the training delivered by the senior judge.
(1)
Q3, May 2017
kumarmaths.weebly.com 15
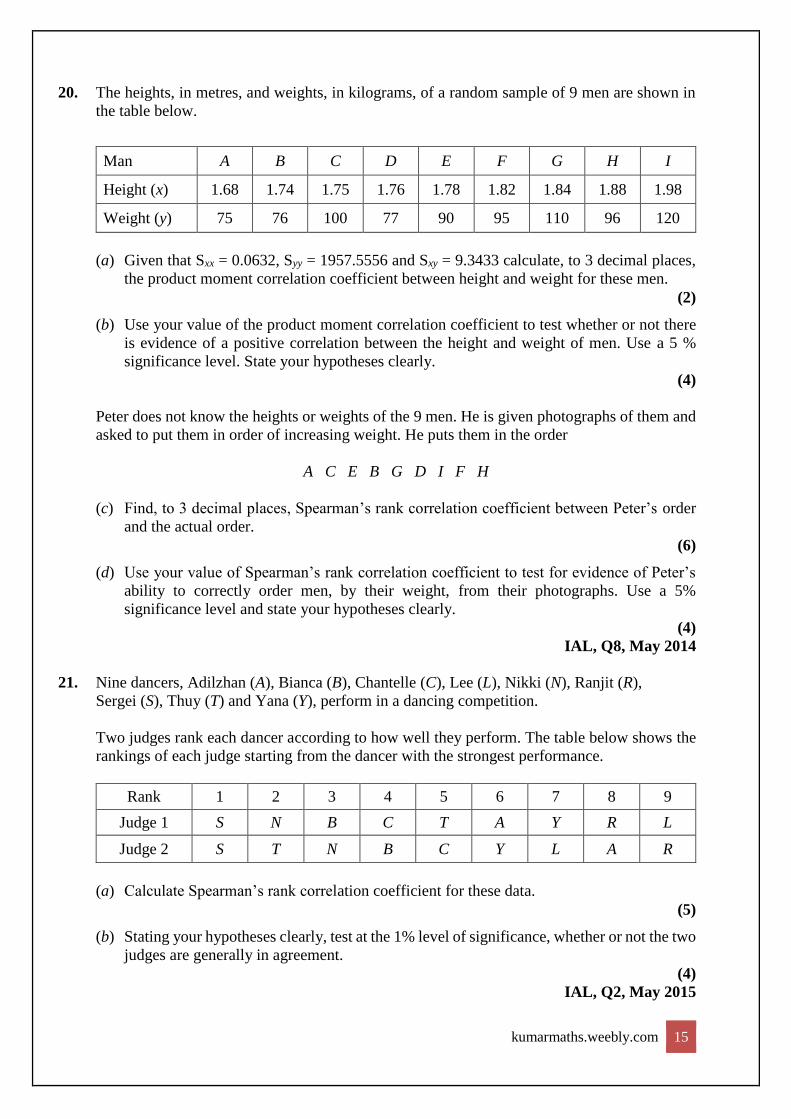
20. The heights, in metres, and weights, in kilograms, of a random sample of 9 men are shown in
the table below.
Man A B C D E F G H I
Height (x) 1.68 1.74 1.75 1.76 1.78 1.82 1.84 1.88 1.98
Weight (y) 75 76 100 77 90 95 110 96 120
(a) Given that Sxx = 0.0632, Syy = 1957.5556 and Sxy = 9.3433 calculate, to 3 decimal places,
the product moment correlation coefficient between height and weight for these men.
(2)
(b) Use your value of the product moment correlation coefficient to test whether or not there
is evidence of a positive correlation between the height and weight of men. Use a 5 %
significance level. State your hypotheses clearly.
(4)
Peter does not know the heights or weights of the 9 men. He is given photographs of them and
asked to put them in order of increasing weight. He puts them in the order
A C E B G D I F H
(c) Find, to 3 decimal places, Spearman’s rank correlation coefficient between Peter’s order
and the actual order.
(6)
(d) Use your value of Spearman’s rank correlation coefficient to test for evidence of Peter’s
ability to correctly order men, by their weight, from their photographs. Use a 5%
significance level and state your hypotheses clearly.
(4)
IAL, Q8, May 2014
21. Nine dancers, Adilzhan (A), Bianca (B), Chantelle (C), Lee (L), Nikki (N), Ranjit (R),
Sergei (S), Thuy (T) and Yana (Y), perform in a dancing competition.
Two judges rank each dancer according to how well they perform. The table below shows the
rankings of each judge starting from the dancer with the strongest performance.
Rank 1 2 3 4 5 6 7 8 9
Judge 1 S N B C T A Y R L
Judge 2 S T N B C Y L A R
(a) Calculate Spearman’s rank correlation coefficient for these data.
(5)
(b) Stating your hypotheses clearly, test at the 1% level of significance, whether or not the two
judges are generally in agreement.
(4)
IAL, Q2, May 2015

kumarmaths.weebly.com 16
22. The table below shows the distance travelled by car and the amount of commission earned
by each of 8 salespersons in 2015
Salesperson Distance travelled
(in 1000’s of km)
Commission earned
(in $1000’s)
A 20.4 17.7
B 22.2 24.1
C 29.9 20.3
D 37.8 28.3
E 25.5 34.9
F 30.2 29.3
G 35.3 23.6
H 16.5 26.8
(a) Find Spearman’s rank correlation coefficient for these data.
(5)
(b) Stating your hypotheses clearly, test, at the 5% level of significance, whether or not
there is evidence of a positive correlation between the distance travelled by car and
the amount of commission earned.
(4)
IAL, Q1, May 2016
23. The ages, in years, of a random sample of 8 parrots are shown in the table below.
Parrot A B C D E F G H
Age 10 4 13 15 2 1 8 6
A parrot breeder does not know the ages of these 8 parrots. She examines each of these 8
parrots and is asked to put them in order of decreasing age. She puts them in the order
D G H C A B F E
(a) Find, to 3 decimal places, Spearman’s rank correlation coefficient between the
breeder’s order and the actual order.
(5)
(b) Use your value of Spearman’s rank correlation coefficient to test for evidence of the
breeder’s ability to order parrots correctly, by their age, after examining them. Use a
1% significance level and state your hypotheses clearly.
(4)
IAL, Q1, May 2017


![Edexcel GCE A Level Maths Further Maths 3 · Edexcel GCE A Level Maths Further Maths 3 Vectors Edited by: K V Kumaran . kumarmaths.weebly.com 2 . ... [FP3/P6 June 2005 Qn 2] 6. The](https://img.dokumen.tips/doc/110x75/5b77df157f8b9ade6f8ddad2/edexcel-gce-a-level-maths-further-maths-3-edexcel-gce-a-level-maths-further.jpg)