Embed Size (px)
Citation preview

Lake Workshop, 18-20 September 2012, Helsinki
Eddy covariance measurements of energy and CO2 fluxes over a boreal lake in southern Finland
Ivan Mammarella1, Ü. Rannik1, S. Haapanala1, A. Nordbo1, J. Pumpanen2, A. Ojala3, T. Vesala1
1Department of Physics, University of Helsinki2Department of Forest Ecology, University of Helsinki
3Department of Environmental Sciences, University of Helsinki

Background and Motivation• Worldwide, lakes cover 3% of the Earth’s continental surface; in Finland >>> 10 %. About 95% of lakes are less than 1 Km2 .• The important role of inland fresh waters (lakes, rivers, ponds) in processing large amounts of organic carbon (Battin et al., 2009, Nature Geoscience).• Lakes have different albedo, lower surface roughness and greater effective heat capacity than surrounding land areas. These properties affect regional climate and energy budgets (Dutra et al., 2010; Jeffries et al., 1999).
• Only few studies have been published on EC flux measurements on fresh water ecosystems.• Long term and continuous flux measurements are needed in order to improve our understanding on:
- short and long term variation of thermal structure and energy balance of such ecosystems.- gas exchange processes

UHEL EC flux measurement sites
Kumpula Urban(SMEAR III)
Siikaneva I boreal fen
Peat soil
Mineral soil
Urban environment
Lakes
HyytiäläScots pine(SMEAR II)
LakeKuivajärvi
(Hotel Torni Urban
LakeValkea-Kotinen
Siikaneva II boreal bog

Materials and methods
Max depth : 13.2 m.
Length = 2.6 km.
Max width = 400 m.
Source: Maanmittauslaitos

Materials and methods
From J.Heskainen MSc thesis
Ancillary measurements:
Water T Profile: 0.2, 0.5, 1, 1.5, 2, 2.5, 3, 3.5, 4, 4.5, 5, 6, 8, 10, 12. Water CO2 Profile: 0.2, 0.5, 1, 1.5Water PAR.Radiation components.Tair, RH
Measurement Periods:
June 2009-Feb 2010June 2010 – Jan 2011May 2011 – Nov 2011

EC measurements:
1) June 2009 / Feb 2010 and Jun 2010/Dec 2010.Metek USA-1 (momentum and sensible heat fluxes)Licor 7000 (CO2 and H2O fluxes)
2) Jun 2011 / Nov 2011Metek USA-1 (momentum and sensible heat fluxes)Licor 7200 (CO2 and H2O fluxes)
EC data post-processing by EddyUHhttp://www.atm.helsinki.fi/~mammarel/Eddy_Covariance/EddyUHsoftware.php.

EC system performance

EC fluxes: systematic uncertainty
Spectral correction is up to 30% for H2O and 20% for CO2.

Environmental conditions

Environmental conditions
Wind direction at Kuivajärvi is dominantly along lake.

Environmental conditions
Themoclinedepth

Next we consider only open water periods (e.g. June – October)

Lake vs Scots Pine forestSept 2011
Red = Kuivajärvi, Green = SMEAR II

Bulk transfer relationships
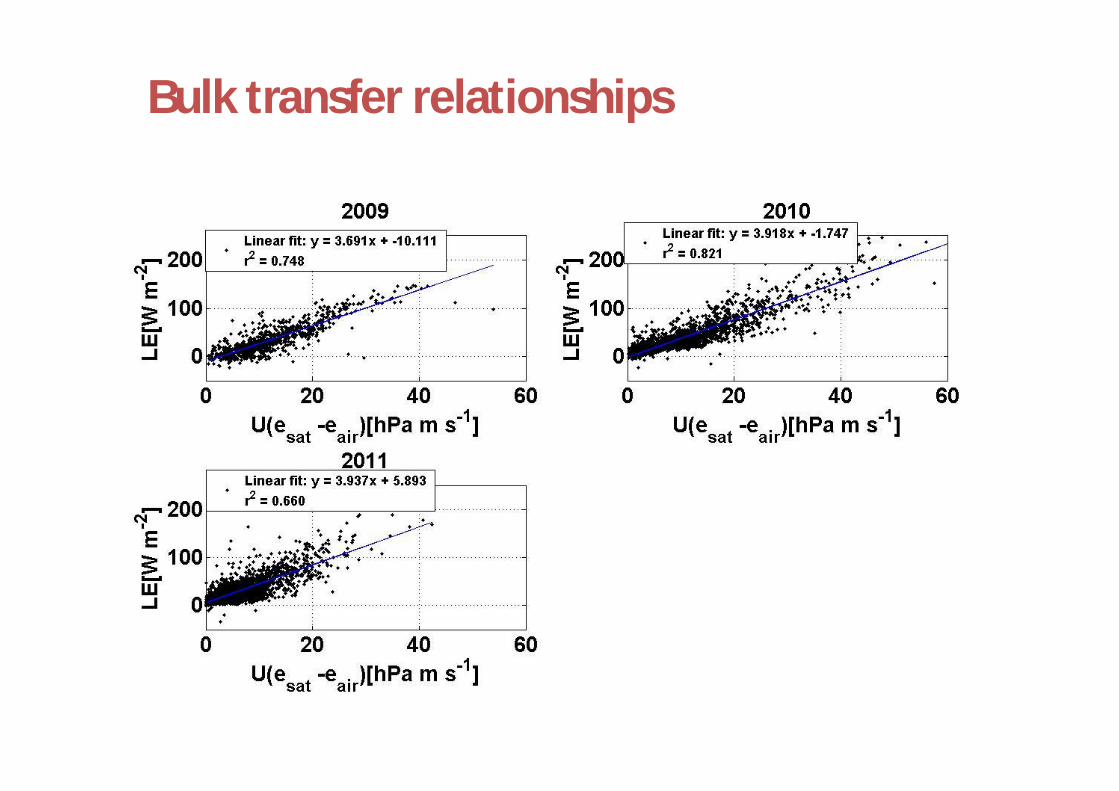
Bulk transfer relationships

Bulk transfer relationships
WHY?
-Buoyancy play relevant role.- Bias in CO2 concentration measurements.- EC flux random uncertainty

Flux random uncertainty
Flux random uncertainty according to Finkelstein & Sims (2001), JGR
RFRE = RE/Flux
SH CO2 LE
RFRE 17% 35% 20%
RE 2.5 W m-2 0.35 mumol m-2s-1 4 W m-2

Water turbulent mixing and gas exchange
( )aq airF k C Ck is the gas transfer velocity, which depends on moleculardiffusivity of the gas and the MBL variation.

Convective mixing : some equations!
We used theoretical framework similar to atmospheric mixed layer, but weapply it to water side (Imberger, 1985).
Convective velocity scale is 13
* ( )w ZZ is the mixed layer depthand beta is the buoyancyflux:
eff
p w
gHC
= 1.6e-5+9.6e-6*Tw is the thermal expansion of waterCp = 4192 J/Kg/K is the specific heat capacity
w is water density

The effective heat flux Heff is defined as
02(0) ( ) ( )eff netz
H H q q Z q z dzZ
where
net netH LW H LE is the net surface heat flux and
( ) (0) exp( )q z q z
q is the short wave radiation
Beer’s law is applied to PAR measurements to quantify the penetration of radiation in the water column. is the light attenuation coeff,
taken equal to 3.2 m-1
Sign convection for Heff: it is negative when the lake is cooling, and positive when the lake is heating. Note that during night-time Heff = Hnet.

Diurnal variation of water stratification and mixedlayer depth during summer
Thin mixed layer
Deeper mixed layer
ML depth was estimated from temperature profile as the depth where the temperature deviates more than 0.2 Celsius degree from the surfacetemperature.
16.08.2010

Example (15-25 Aug 2010)
Strong diurnal cycle
Front breaks the diurnal cycle

Example (15-25 Aug 2010)
W* > u*

Gas transfer velocity versus wind speed

Near-future plans...• EC measurements started again in June 2012 (data have
been already post-processed).• On-going EC CH4 flux measurement campaign (Aug 2012 –
Nov 2012).

• Turbulence measurement in the water by ADV/microstructure profiler (September 2012 and during next year).
• Compare EC flux with chamber flux.
• Systematic analysis of buoyancy driven mixing events.
• Analysis of energy balance and exchange processes during winter periods.
• Data are available for model validation and comparison studies.

THANKS!!!