Embed Size (px)
Citation preview
Commerce Commission Information Disclosure Template
Information Disclosures 31 March 2021 - Schedules-1-to-10.xlsx 1 CoverSheet
EDB Information Disclosure RequirementsInformation Templates
forSchedules 1–10
Company Name Scanpower Limited
Disclosure Date 31 August 2021
Disclosure Year (year ended) 31 March 2021
Templates for Schedules 1–10 excluding 5f–5gTemplate Version 4.1. Prepared 21 December 2017
Commerce Commission Information Disclosure Template
Information Disclosures 31 March 2021 - Schedules-1-to-10.xlsx2 TOC
Table of Contents
Schedule Schedule name1 ANALYTICAL RATIOS2 REPORT ON RETURN ON INVESTMENT3 REPORT ON REGULATORY PROFIT4 REPORT ON VALUE OF THE REGULATORY ASSET BASE (ROLLED FORWARD)5a REPORT ON REGULATORY TAX ALLOWANCE5b REPORT ON RELATED PARTY TRANSACTIONS5c REPORT ON TERM CREDIT SPREAD DIFFERENTIAL ALLOWANCE5d REPORT ON COST ALLOCATIONS5e REPORT ON ASSET ALLOCATIONS6a REPORT ON CAPITAL EXPENDITURE FOR THE DISCLOSURE YEAR6b REPORT ON OPERATIONAL EXPENDITURE FOR THE DISCLOSURE YEAR7 COMPARISON OF FORECASTS TO ACTUAL EXPENDITURE8 REPORT ON BILLED QUANTITIES AND LINE CHARGE REVENUES9a ASSET REGISTER9b ASSET AGE PROFILE9c REPORT ON OVERHEAD LINES AND UNDERGROUND CABLES9d REPORT ON EMBEDDED NETWORKS9e REPORT ON NETWORK DEMAND10 REPORT ON NETWORK RELIABILITY
Commerce Commission Information Disclosure Template
Information Disclosures 31 March 2021 - Schedules-1-to-10.xlsx 3 Instructions
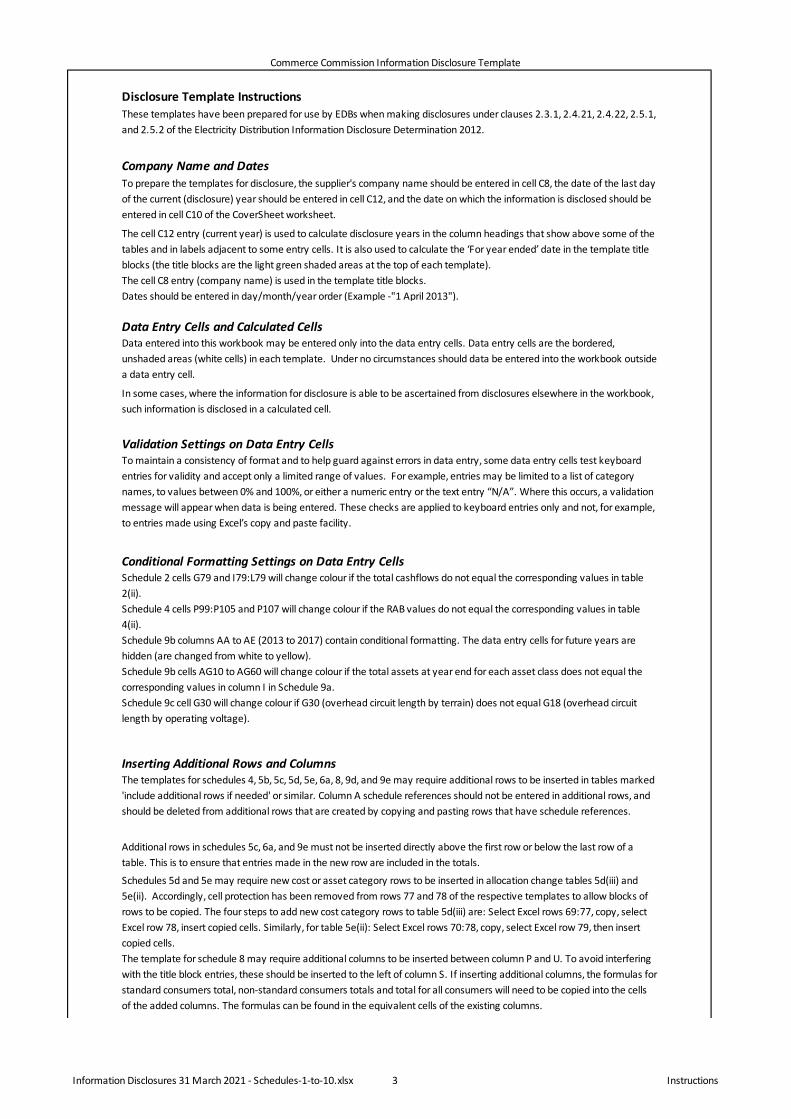
Disclosure Template InstructionsThese templates have been prepared for use by EDBs when making disclosures under clauses 2.3.1, 2.4.21, 2.4.22, 2.5.1, and 2.5.2 of the Electricity Distribution Information Disclosure Determination 2012.
Company Name and DatesTo prepare the templates for disclosure, the supplier's company name should be entered in cell C8, the date of the last day of the current (disclosure) year should be entered in cell C12, and the date on which the information is disclosed should be entered in cell C10 of the CoverSheet worksheet.
The cell C12 entry (current year) is used to calculate disclosure years in the column headings that show above some of the tables and in labels adjacent to some entry cells. It is also used to calculate the ‘For year ended’ date in the template title blocks (the title blocks are the light green shaded areas at the top of each template).The cell C8 entry (company name) is used in the template title blocks.Dates should be entered in day/month/year order (Example -"1 April 2013").
Data Entry Cells and Calculated CellsData entered into this workbook may be entered only into the data entry cells. Data entry cells are the bordered, unshaded areas (white cells) in each template. Under no circumstances should data be entered into the workbook outside a data entry cell.
In some cases, where the information for disclosure is able to be ascertained from disclosures elsewhere in the workbook, such information is disclosed in a calculated cell.
Validation Settings on Data Entry CellsTo maintain a consistency of format and to help guard against errors in data entry, some data entry cells test keyboard entries for validity and accept only a limited range of values. For example, entries may be limited to a list of category names, to values between 0% and 100%, or either a numeric entry or the text entry “N/A”. Where this occurs, a validation message will appear when data is being entered. These checks are applied to keyboard entries only and not, for example, to entries made using Excel’s copy and paste facility.
Conditional Formatting Settings on Data Entry CellsSchedule 2 cells G79 and I79:L79 will change colour if the total cashflows do not equal the corresponding values in table 2(ii).Schedule 4 cells P99:P105 and P107 will change colour if the RAB values do not equal the corresponding values in table 4(ii).Schedule 9b columns AA to AE (2013 to 2017) contain conditional formatting. The data entry cells for future years are hidden (are changed from white to yellow).Schedule 9b cells AG10 to AG60 will change colour if the total assets at year end for each asset class does not equal the corresponding values in column I in Schedule 9a.Schedule 9c cell G30 will change colour if G30 (overhead circuit length by terrain) does not equal G18 (overhead circuit length by operating voltage).
Inserting Additional Rows and ColumnsThe templates for schedules 4, 5b, 5c, 5d, 5e, 6a, 8, 9d, and 9e may require additional rows to be inserted in tables marked 'include additional rows if needed' or similar. Column A schedule references should not be entered in additional rows, and should be deleted from additional rows that are created by copying and pasting rows that have schedule references.
Additional rows in schedules 5c, 6a, and 9e must not be inserted directly above the first row or below the last row of a table. This is to ensure that entries made in the new row are included in the totals.
Schedules 5d and 5e may require new cost or asset category rows to be inserted in allocation change tables 5d(iii) and 5e(ii). Accordingly, cell protection has been removed from rows 77 and 78 of the respective templates to allow blocks of rows to be copied. The four steps to add new cost category rows to table 5d(iii) are: Select Excel rows 69:77, copy, select Excel row 78, insert copied cells. Similarly, for table 5e(ii): Select Excel rows 70:78, copy, select Excel row 79, then insert copied cells.The template for schedule 8 may require additional columns to be inserted between column P and U. To avoid interfering with the title block entries, these should be inserted to the left of column S. If inserting additional columns, the formulas for standard consumers total, non-standard consumers totals and total for all consumers will need to be copied into the cells of the added columns. The formulas can be found in the equivalent cells of the existing columns.
Commerce Commission Information Disclosure Template
Information Disclosures 31 March 2021 - Schedules-1-to-10.xlsx 4 Instructions
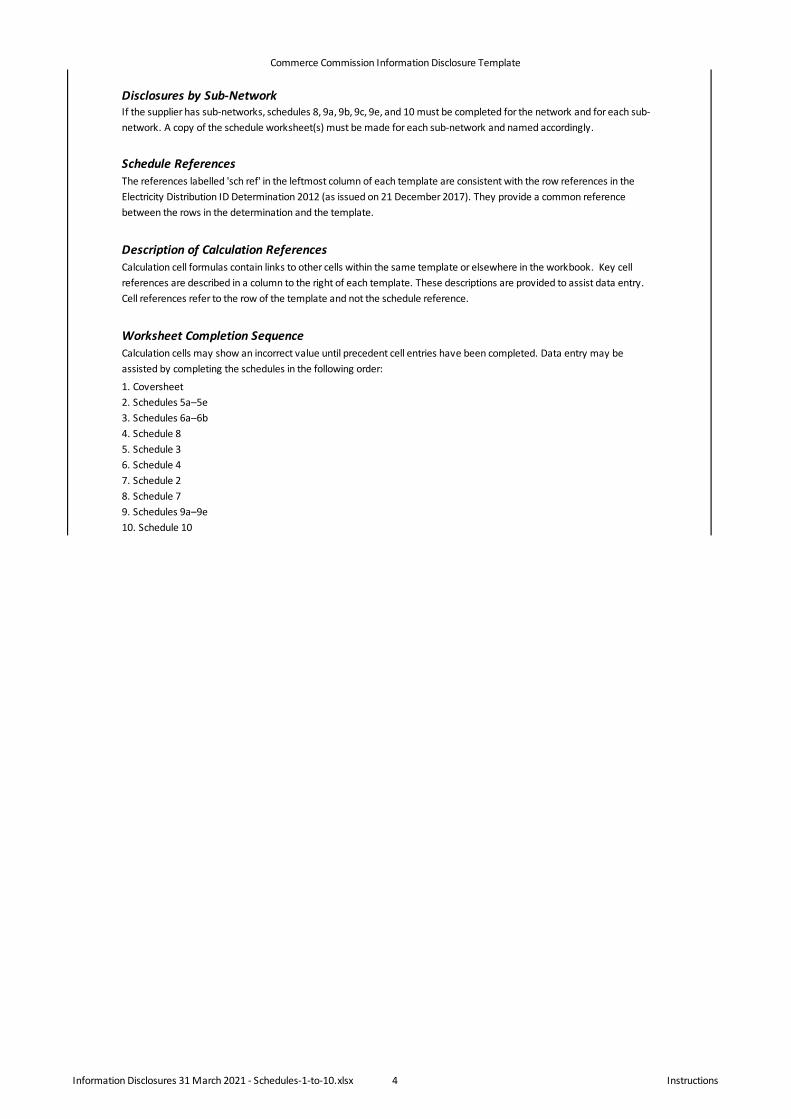
Disclosures by Sub-NetworkIf the supplier has sub-networks, schedules 8, 9a, 9b, 9c, 9e, and 10 must be completed for the network and for each sub-network. A copy of the schedule worksheet(s) must be made for each sub-network and named accordingly.
Schedule ReferencesThe references labelled 'sch ref' in the leftmost column of each template are consistent with the row references in the Electricity Distribution ID Determination 2012 (as issued on 21 December 2017). They provide a common reference between the rows in the determination and the template.
Description of Calculation ReferencesCalculation cell formulas contain links to other cells within the same template or elsewhere in the workbook. Key cell references are described in a column to the right of each template. These descriptions are provided to assist data entry. Cell references refer to the row of the template and not the schedule reference.
Worksheet Completion SequenceCalculation cells may show an incorrect value until precedent cell entries have been completed. Data entry may be assisted by completing the schedules in the following order:
1. Coversheet2. Schedules 5a–5e3. Schedules 6a–6b4. Schedule 85. Schedule 36. Schedule 47. Schedule 28. Schedule 79. Schedules 9a–9e10. Schedule 10
Commerce Commission Information Disclosure Template
Information Disclosures 31 March 2021 - Schedules-1-to-10 adjusted.xlsx 6 S1.Analytical Ratios
Company NameFor Year Ended
SCHEDULE 1: ANALYTICAL RATIOS
sch ref
7 1(i): Expenditure metrics
8
Expenditure per GWh energy
delivered to ICPs($/GWh)
Expenditure per average no. of
ICPs($/ICP)
Expenditure per MW maximum
coincident system demand($/MW)
Expenditure per km circuit length
($/km)
Expenditure per MVA of capacity from EDB-
owned distribution transformers
($/MVA)
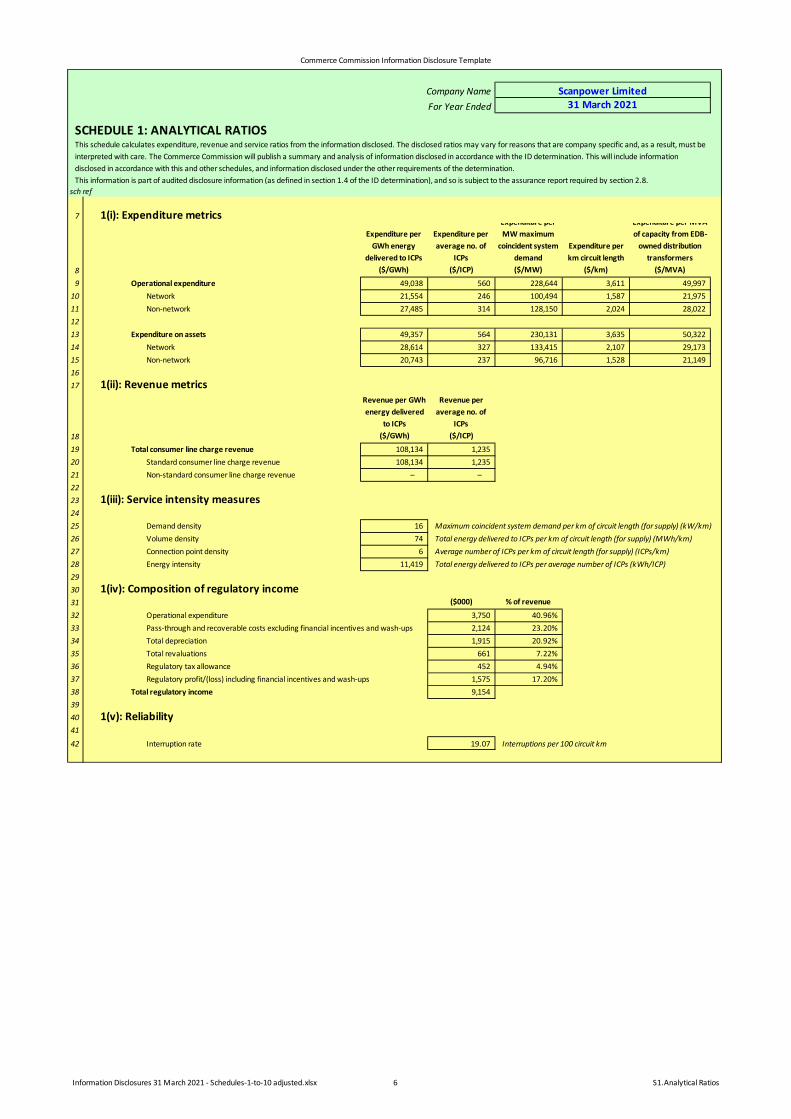
9 Operational expenditure 49,038 560 228,644 3,611 49,99710 Network 21,554 246 100,494 1,587 21,97511 Non-network 27,485 314 128,150 2,024 28,0221213 Expenditure on assets 49,357 564 230,131 3,635 50,32214 Network 28,614 327 133,415 2,107 29,17315 Non-network 20,743 237 96,716 1,528 21,1491617 1(ii): Revenue metrics
18
Revenue per GWh energy delivered
to ICPs($/GWh)
Revenue per average no. of
ICPs($/ICP)
19 Total consumer line charge revenue 108,134 1,23520 Standard consumer line charge revenue 108,134 1,23521 Non-standard consumer line charge revenue – –2223 1(iii): Service intensity measures2425 Demand density 16 Maximum coincident system demand per km of circuit length (for supply) (kW/km)26 Volume density 74 Total energy delivered to ICPs per km of circuit length (for supply) (MWh/km)27 Connection point density 6 Average number of ICPs per km of circuit length (for supply) (ICPs/km)28 Energy intensity 11,419 Total energy delivered to ICPs per average number of ICPs (kWh/ICP)2930 1(iv): Composition of regulatory income31 ($000) % of revenue
32 Operational expenditure 3,750 40.96%33 Pass-through and recoverable costs excluding financial incentives and wash-ups 2,124 23.20%34 Total depreciation 1,915 20.92%35 Total revaluations 661 7.22%36 Regulatory tax allowance 452 4.94%37 Regulatory profit/(loss) including financial incentives and wash-ups 1,575 17.20%38 Total regulatory income 9,1543940 1(v): Reliability41
42 Interruption rate 19.07 Interruptions per 100 circuit km
This schedule calculates expenditure, revenue and service ratios from the information disclosed. The disclosed ratios may vary for reasons that are company specific and, as a result, must be interpreted with care. The Commerce Commission will publish a summary and analysis of information disclosed in accordance with the ID determination. This will include information disclosed in accordance with this and other schedules, and information disclosed under the other requirements of the determination. This information is part of audited disclosure information (as defined in section 1.4 of the ID determination), and so is subject to the assurance report required by section 2.8.
Scanpower Limited31 March 2021
Commerce Commission Information Disclosure Template
Information Disclosures 31 March 2021 - Schedules-1-to-10.xlsx 6 S2.Return on Investment
Company Name
For Year Ended
SCHEDULE 2: REPORT ON RETURN ON INVESTMENT
sch ref
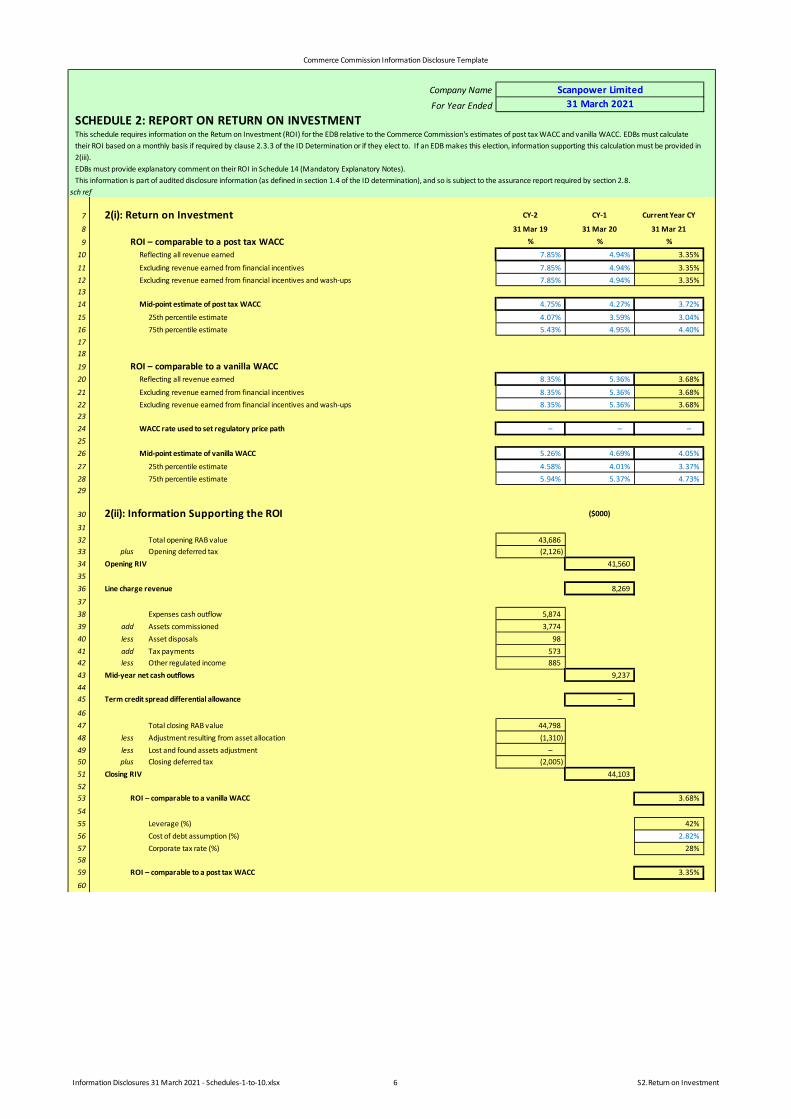
7 2(i): Return on Investment CY-2 CY-1 Current Year CY
8 31 Mar 19 31 Mar 20 31 Mar 21
9 ROI – comparable to a post tax WACC % % %
10 Reflecting all revenue earned 7.85% 4.94% 3.35%
11 Excluding revenue earned from financial incentives 7.85% 4.94% 3.35%12 Excluding revenue earned from financial incentives and wash-ups 7.85% 4.94% 3.35%1314 Mid-point estimate of post tax WACC 4.75% 4.27% 3.72%
15 25th percentile estimate 4.07% 3.59% 3.04%16 75th percentile estimate 5.43% 4.95% 4.40%1718
19 ROI – comparable to a vanilla WACC 20 Reflecting all revenue earned 8.35% 5.36% 3.68%
21 Excluding revenue earned from financial incentives 8.35% 5.36% 3.68%22 Excluding revenue earned from financial incentives and wash-ups 8.35% 5.36% 3.68%2324 WACC rate used to set regulatory price path – – –2526 Mid-point estimate of vanilla WACC 5.26% 4.69% 4.05%
27 25th percentile estimate 4.58% 4.01% 3.37%28 75th percentile estimate 5.94% 5.37% 4.73%29
30 2(ii): Information Supporting the ROI ($000)
3132 Total opening RAB value 43,68633 plus Opening deferred tax (2,126)34 Opening RIV 41,5603536 Line charge revenue 8,269
3738 Expenses cash outflow 5,87439 add Assets commissioned 3,77440 less Asset disposals 9841 add Tax payments 57342 less Other regulated income 88543 Mid-year net cash outflows 9,2374445 Term credit spread differential allowance –
4647 Total closing RAB value 44,79848 less Adjustment resulting from asset allocation (1,310)49 less Lost and found assets adjustment –50 plus Closing deferred tax (2,005)51 Closing RIV 44,1035253 ROI – comparable to a vanilla WACC 3.68%
5455 Leverage (%) 42%56 Cost of debt assumption (%) 2.82%57 Corporate tax rate (%) 28%5859 ROI – comparable to a post tax WACC 3.35%
60
This schedule requires information on the Return on Investment (ROI) for the EDB relative to the Commerce Commission's estimates of post tax WACC and vanilla WACC. EDBs must calculate their ROI based on a monthly basis if required by clause 2.3.3 of the ID Determination or if they elect to. If an EDB makes this election, information supporting this calculation must be provided in 2(iii). EDBs must provide explanatory comment on their ROI in Schedule 14 (Mandatory Explanatory Notes).This information is part of audited disclosure information (as defined in section 1.4 of the ID determination), and so is subject to the assurance report required by section 2.8.
Scanpower Limited31 March 2021
Commerce Commission Information Disclosure Template
Information Disclosures 31 March 2021 - Schedules-1-to-10.xlsx 7 S2.Return on Investment
Company Name
For Year Ended
SCHEDULE 2: REPORT ON RETURN ON INVESTMENT
sch ref
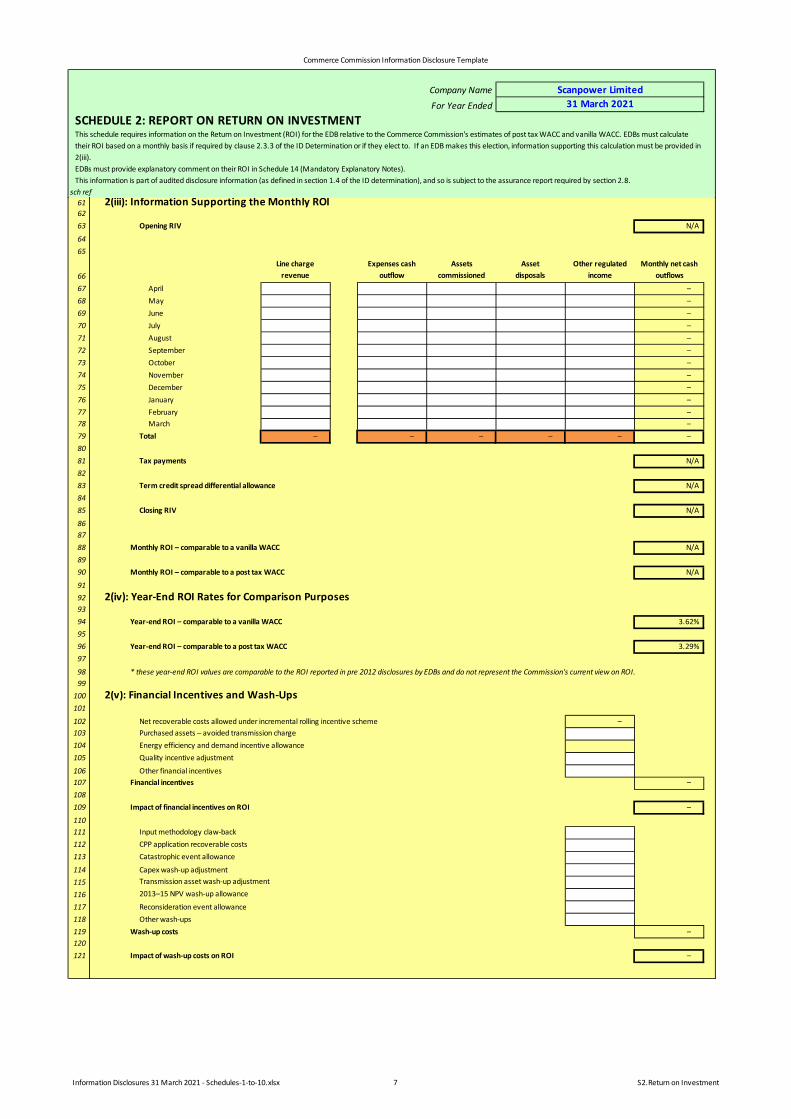
This schedule requires information on the Return on Investment (ROI) for the EDB relative to the Commerce Commission's estimates of post tax WACC and vanilla WACC. EDBs must calculate their ROI based on a monthly basis if required by clause 2.3.3 of the ID Determination or if they elect to. If an EDB makes this election, information supporting this calculation must be provided in 2(iii). EDBs must provide explanatory comment on their ROI in Schedule 14 (Mandatory Explanatory Notes).This information is part of audited disclosure information (as defined in section 1.4 of the ID determination), and so is subject to the assurance report required by section 2.8.
Scanpower Limited31 March 2021
61 2(iii): Information Supporting the Monthly ROI6263 Opening RIV N/A
6465
66Line charge
revenueExpenses cash
outflowAssets
commissionedAsset
disposalsOther regulated
incomeMonthly net cash
outflows
67 April –68 May –69 June –70 July –71 August –72 September –73 October –74 November –75 December –76 January –77 February –78 March –79 Total – – – – – –8081 Tax payments N/A8283 Term credit spread differential allowance N/A8485 Closing RIV N/A
868788 Monthly ROI – comparable to a vanilla WACC N/A8990 Monthly ROI – comparable to a post tax WACC N/A
9192 2(iv): Year-End ROI Rates for Comparison Purposes9394 Year-end ROI – comparable to a vanilla WACC 3.62%9596 Year-end ROI – comparable to a post tax WACC 3.29%97
98 * these year-end ROI values are comparable to the ROI reported in pre 2012 disclosures by EDBs and do not represent the Commission's current view on ROI.99
100 2(v): Financial Incentives and Wash-Ups101
102 Net recoverable costs allowed under incremental rolling incentive scheme –103 Purchased assets – avoided transmission charge104 Energy efficiency and demand incentive allowance105 Quality incentive adjustment
106 Other financial incentives107 Financial incentives –108109 Impact of financial incentives on ROI –
110111 Input methodology claw-back112 CPP application recoverable costs113 Catastrophic event allowance
114 Capex wash-up adjustment115 Transmission asset wash-up adjustment
116 2013–15 NPV wash-up allowance
117 Reconsideration event allowance118 Other wash-ups119 Wash-up costs –120121 Impact of wash-up costs on ROI –
Commerce Commission Information Disclosure Template
Information Disclosures 31 March 2021 - Schedules-1-to-10.xlsx 8 S3.Regulatory Profit
Company NameFor Year Ended
SCHEDULE 3: REPORT ON REGULATORY PROFIT
sch ref
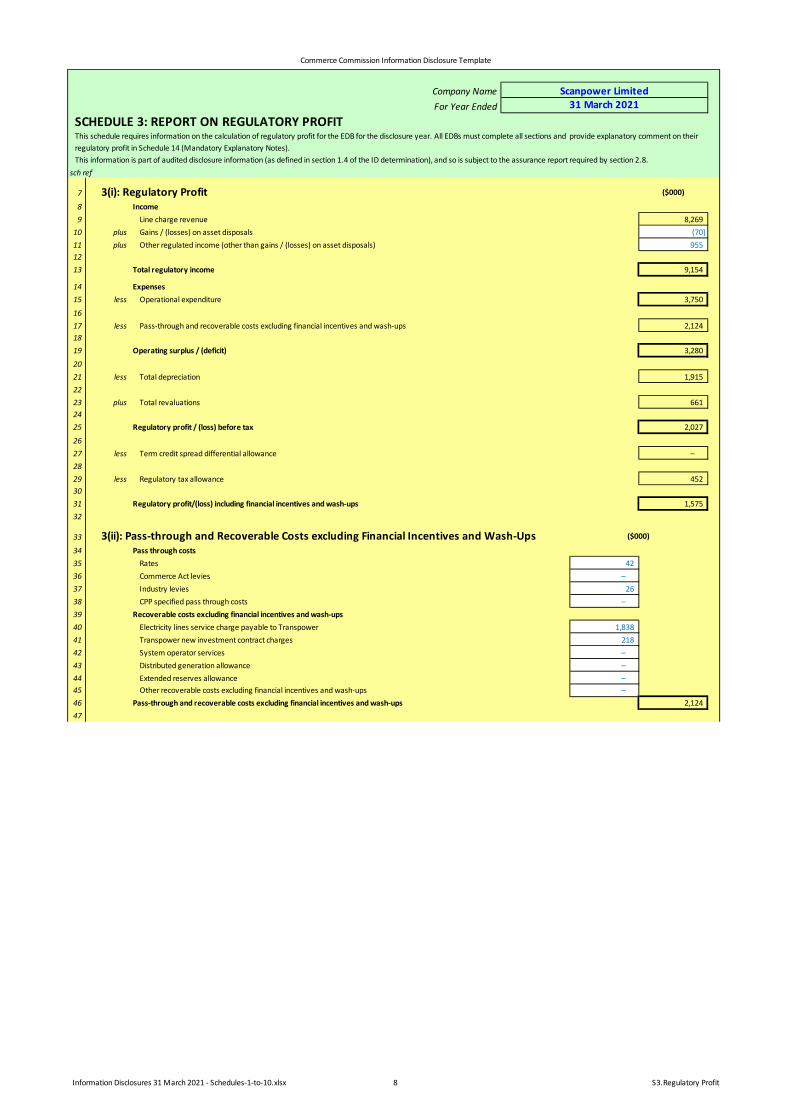
7 3(i): Regulatory Profit ($000)
8 Income9 Line charge revenue 8,269
10 plus Gains / (losses) on asset disposals (70)11 plus Other regulated income (other than gains / (losses) on asset disposals) 9551213 Total regulatory income 9,154
14 Expenses15 less Operational expenditure 3,750
1617 less Pass-through and recoverable costs excluding financial incentives and wash-ups 2,1241819 Operating surplus / (deficit) 3,280
2021 less Total depreciation 1,9152223 plus Total revaluations 6612425 Regulatory profit / (loss) before tax 2,027
2627 less Term credit spread differential allowance –2829 less Regulatory tax allowance 4523031 Regulatory profit/(loss) including financial incentives and wash-ups 1,57532
33 3(ii): Pass-through and Recoverable Costs excluding Financial Incentives and Wash-Ups ($000)
34 Pass through costs35 Rates 4236 Commerce Act levies –37 Industry levies 2638 CPP specified pass through costs –39 Recoverable costs excluding financial incentives and wash-ups40 Electricity lines service charge payable to Transpower 1,83841 Transpower new investment contract charges 21842 System operator services –43 Distributed generation allowance –44 Extended reserves allowance –45 Other recoverable costs excluding financial incentives and wash-ups –46 Pass-through and recoverable costs excluding financial incentives and wash-ups 2,12447
This schedule requires information on the calculation of regulatory profit for the EDB for the disclosure year. All EDBs must complete all sections and provide explanatory comment on their regulatory profit in Schedule 14 (Mandatory Explanatory Notes). This information is part of audited disclosure information (as defined in section 1.4 of the ID determination), and so is subject to the assurance report required by section 2.8.
Scanpower Limited31 March 2021
Commerce Commission Information Disclosure Template
Information Disclosures 31 March 2021 - Schedules-1-to-10.xlsx 9 S3.Regulatory Profit
Company NameFor Year Ended
SCHEDULE 3: REPORT ON REGULATORY PROFIT
sch ref
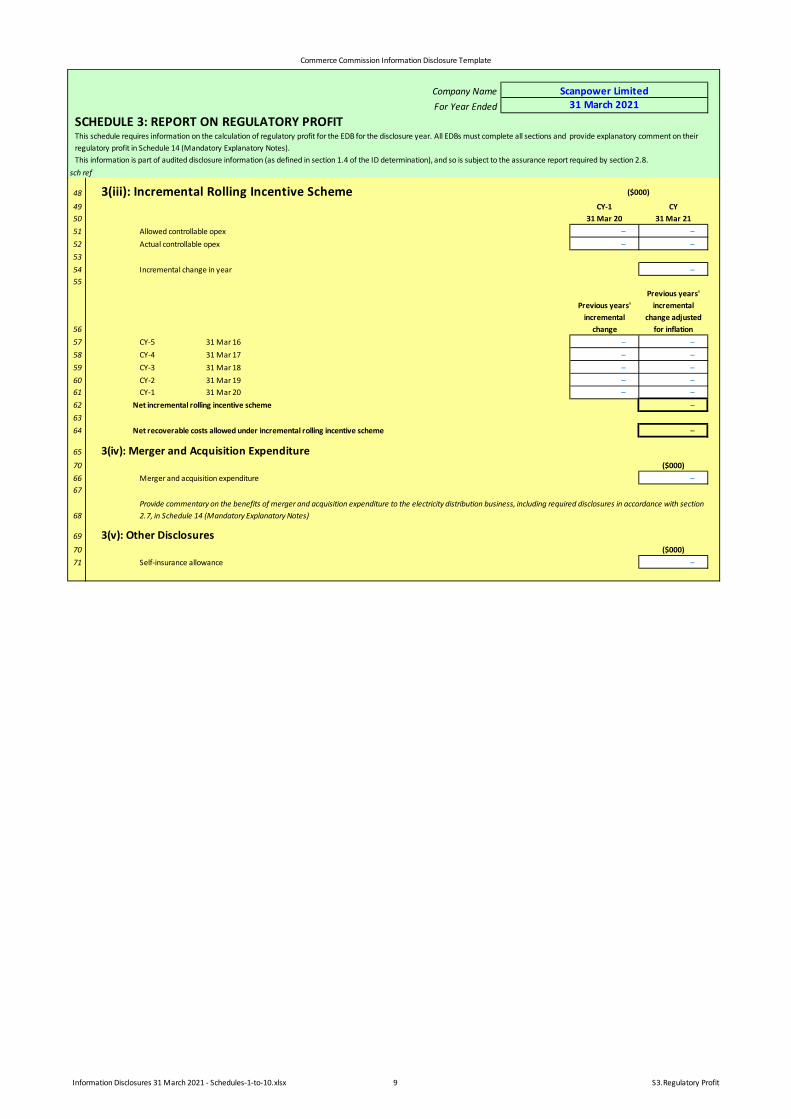
This schedule requires information on the calculation of regulatory profit for the EDB for the disclosure year. All EDBs must complete all sections and provide explanatory comment on their regulatory profit in Schedule 14 (Mandatory Explanatory Notes). This information is part of audited disclosure information (as defined in section 1.4 of the ID determination), and so is subject to the assurance report required by section 2.8.
Scanpower Limited31 March 2021
48 3(iii): Incremental Rolling Incentive Scheme ($000)
49 CY-1 CY50 31 Mar 20 31 Mar 2151 Allowed controllable opex – –52 Actual controllable opex – –5354 Incremental change in year –55
56
Previous years' incremental
change
Previous years' incremental
change adjusted for inflation
57 CY-5 31 Mar 16 – –58 CY-4 31 Mar 17 – –59 CY-3 31 Mar 18 – –60 CY-2 31 Mar 19 – –61 CY-1 31 Mar 20 – –62 Net incremental rolling incentive scheme –6364 Net recoverable costs allowed under incremental rolling incentive scheme –
65 3(iv): Merger and Acquisition Expenditure70 ($000)66 Merger and acquisition expenditure –67
68
69 3(v): Other Disclosures70 ($000)71 Self-insurance allowance –
Provide commentary on the benefits of merger and acquisition expenditure to the electricity distribution business, including required disclosures in accordance with section 2.7, in Schedule 14 (Mandatory Explanatory Notes)
Com
mer
ce C
omm
issio
n In
form
atio
n Di
sclo
sure
Tem
plat
e
Info
rmat
ion
Disc
losu
res 3
1 M
arch
202
1 - S
ched
ules
-1-to
-10.
xlsx
10S4
.RAB
Val
ue (R
olle
d Fo
rwar
d)
Com
pany
Nam
eFo
r Yea
r End
ed
SCHE
DULE
4: R
EPO
RT O
N V
ALUE
OF
THE
REGU
LATO
RY A
SSET
BAS
E (R
OLL
ED F
ORW
ARD)
sch
ref
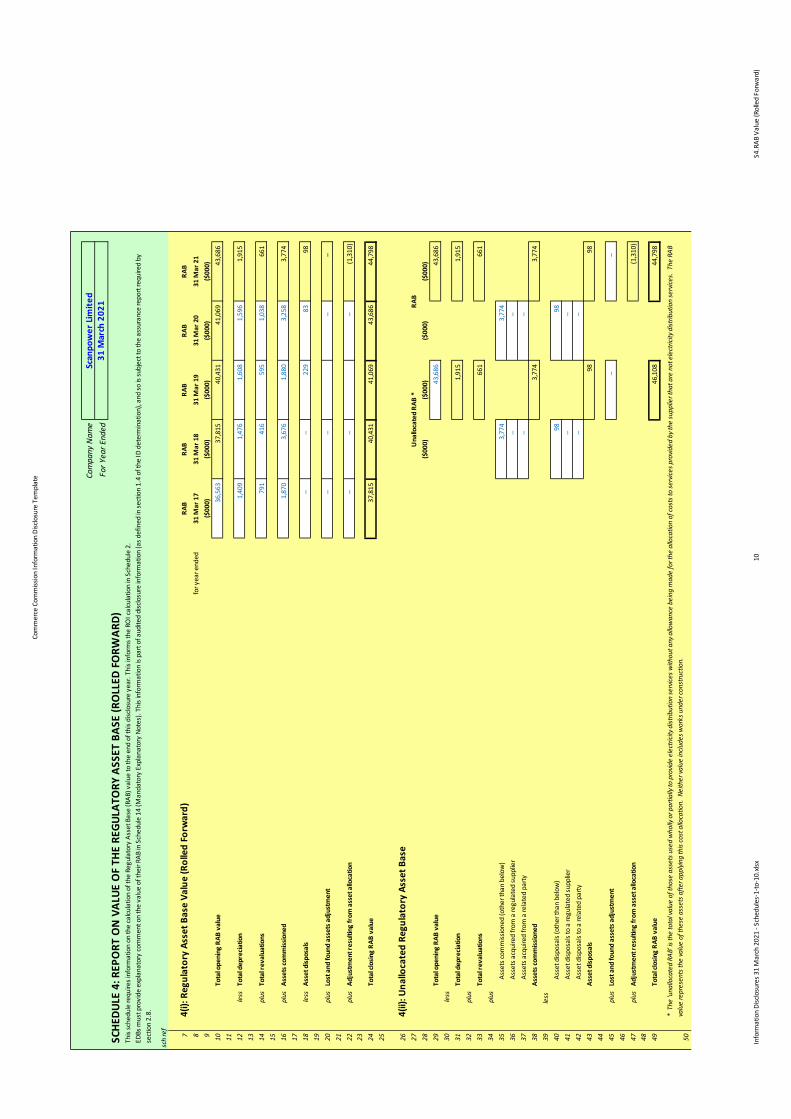
74(
i): R
egul
ator
y As
set B
ase
Valu
e (R
olle
d Fo
rwar
d)RA
BRA
BRA
BRA
BRA
B
8fo
r yea
r end
ed31
Mar
17
31 M
ar 1
831
Mar
19
31 M
ar 2
031
Mar
21
9($
000)
($00
0)($
000)
($00
0)($
000)
10To
tal o
peni
ng R
AB v
alue
36,
563
37,
815
40,
431
41,
069
43,
686
11 12le
ssTo
tal d
epre
ciatio
n 1
,409
1,4
76 1
,608
1,5
96 1
,915
13 14pl
usTo
tal r
eval
uatio
ns 7
91 4
16 5
95 1
,038
661
15 16pl
usAs
sets
com
miss
ione
d
1,8
70 3
,676
1,8
80 3
,258
3,7
7417 18
less
Asse
t disp
osal
s –
– 2
29 8
3 9
819 20
plus
Lost
and
foun
d as
sets
adj
ustm
ent
– –
– –
21 22pl
usAd
just
men
t res
ultin
g fr
om a
sset
allo
catio
n –
– –
(1,3
10)
23 24To
tal c
losin
g RA
B va
lue
37,
815
40,
431
41,
069
43,
686
44,
798
25 264(
ii): U
nallo
cate
d Re
gula
tory
Ass
et B
ase
27 28($
000)
($00
0)($
000)
($00
0)29
Tota
l ope
ning
RAB
val
ue 4
3,68
6 4
3,68
630
less
31To
tal d
epre
ciatio
n 1
,915
1,9
1532
plus
33To
tal r
eval
uatio
ns 6
61 6
6134
plus
35As
sets
com
miss
ione
d (o
ther
than
bel
ow)
3,7
74 3
,774
36As
sets
acq
uire
d fro
m a
regu
late
d su
pplie
r –
–37
Asse
ts a
cqui
red
from
a re
late
d pa
rty –
–38
Asse
ts co
mm
issio
ned
3
,774
3,7
7439
less
40
Asse
t disp
osal
s (ot
her t
han
belo
w)
98
98
41As
set d
ispos
als t
o a
regu
late
d su
pplie
r –
–42
Asse
t disp
osal
s to
a re
late
d pa
rty –
–43
Asse
t disp
osal
s 9
8 9
844 45
plus
Lost
and
foun
d as
sets
adj
ustm
ent
– –
46 47pl
usAd
just
men
t res
ultin
g fr
om a
sset
allo
catio
n(1
,310
)48 49
Tota
l clo
sing
RAB
valu
e 4
6,10
8 4
4,79
8
50
Scan
pow
er Li
mite
d31
Mar
ch 2
021
This
sche
dule
requ
ires i
nfor
mat
ion
on th
e ca
lcula
tion
of th
e Re
gula
tory
Ass
et B
ase
(RAB
) val
ue to
the
end
of th
is di
sclo
sure
yea
r. Th
is in
form
s the
RO
I cal
cula
tion
in S
ched
ule
2.
EDBs
mus
t pro
vide
exp
lana
tory
com
men
t on
the
valu
e of
thei
r RAB
in S
ched
ule
14 (M
anda
tory
Exp
lana
tory
Not
es).
This
info
rmat
ion
is pa
rt of
aud
ited
disc
losu
re in
form
atio
n (a
s def
ined
in se
ctio
n 1.
4 of
the
ID d
eter
min
atio
n), a
nd so
is su
bjec
t to
the
assu
ranc
e re
port
requ
ired
by
sect
ion
2.8. *
The
'una
lloca
ted
RAB'
is th
e to
tal v
alue
of t
hose
ass
ets u
sed
who
lly o
r par
tially
to p
rovid
e el
ectri
city d
istrib
utio
n se
rvice
s with
out a
ny a
llow
ance
bei
ng m
ade
for t
he a
lloca
tion
of co
sts t
o se
rvice
s pro
vided
by t
he su
pplie
r tha
t are
not
ele
ctric
ity d
istrib
utio
n se
rvice
s. T
he R
AB
valu
e re
pres
ents
the
valu
e of
thes
e as
sets
afte
r app
lying
this
cost
allo
catio
n. N
eith
er va
lue
inclu
des w
orks
und
er co
nstru
ctio
n.
Una
lloca
ted
RAB
*RA
B
Com
mer
ce C
omm
issio
n In
form
atio
n Di
sclo
sure
Tem
plat
e
Info
rmat
ion
Disc
losu
res 3
1 M
arch
202
1 - S
ched
ules
-1-to
-10.
xlsx
11S4
.RAB
Val
ue (R
olle
d Fo
rwar
d)
Com
pany
Nam
eFo
r Yea
r End
ed
SCHE
DULE
4: R
EPO
RT O
N V
ALUE
OF
THE
REGU
LATO
RY A
SSET
BAS
E (R
OLL
ED F
ORW
ARD)
sch
ref
Scan
pow
er Li
mite
d31
Mar
ch 2
021
This
sche
dule
requ
ires i
nfor
mat
ion
on th
e ca
lcula
tion
of th
e Re
gula
tory
Ass
et B
ase
(RAB
) val
ue to
the
end
of th
is di
sclo
sure
yea
r. Th
is in
form
s the
RO
I cal
cula
tion
in S
ched
ule
2.
EDBs
mus
t pro
vide
exp
lana
tory
com
men
t on
the
valu
e of
thei
r RAB
in S
ched
ule
14 (M
anda
tory
Exp
lana
tory
Not
es).
This
info
rmat
ion
is pa
rt of
aud
ited
disc
losu
re in
form
atio
n (a
s def
ined
in se
ctio
n 1.
4 of
the
ID d
eter
min
atio
n), a
nd so
is su
bjec
t to
the
assu
ranc
e re
port
requ
ired
by
sect
ion
2.8.
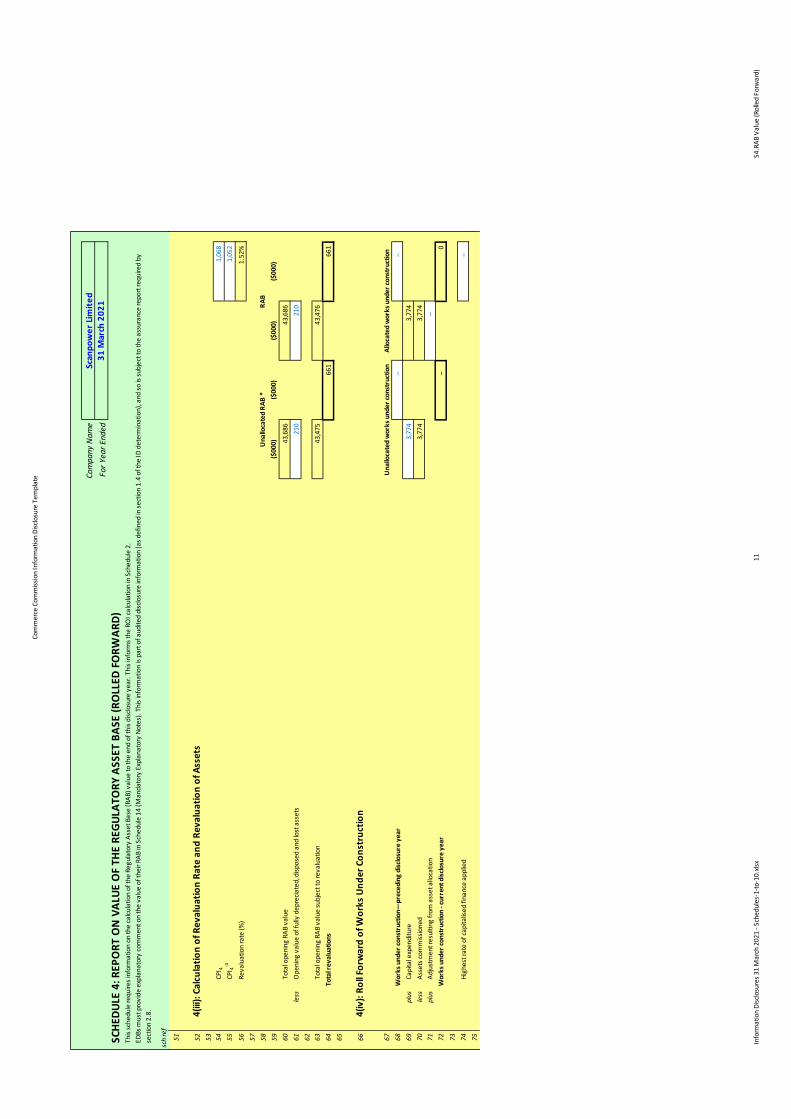
51 524(
iii):
Calc
ulat
ion
of R
eval
uatio
n Ra
te a
nd R
eval
uatio
n of
Ass
ets
53 54CP
I 4 1
,068
55CP
I 4-4
1,0
52
56Re
valu
atio
n ra
te (%
) 1
.52%
57 58 59($
000)
($00
0)($
000)
($00
0)
60To
tal o
peni
ng R
AB v
alue
43,
686
43,
686
61le
ssO
peni
ng v
alue
of f
ully
dep
recia
ted,
disp
osed
and
lost
ass
ets
210
210
62 63To
tal o
peni
ng R
AB v
alue
subj
ect t
o re
valu
atio
n 4
3,47
5 4
3,47
664
Tota
l rev
alua
tions
661
661
65 664(
iv):
Roll
Forw
ard
of W
orks
Und
er C
onst
ruct
ion
67 68W
orks
und
er co
nstr
uctio
n—pr
eced
ing
disc
losu
re y
ear
– –
69pl
usCa
pita
l exp
endi
ture
3,7
74 3
,774
70le
ssAs
sets
com
miss
ione
d 3
,774
3,7
7471
plus
Adju
stm
ent r
esul
ting
from
ass
et a
lloca
tion
–72
Wor
ks u
nder
cons
truc
tion
- cur
rent
disc
losu
re y
ear
– 0
73 74Hi
ghes
t rat
e of
capi
talis
ed fi
nanc
e ap
plie
d –
75
Allo
cate
d w
orks
und
er co
nstr
uctio
n
Una
lloca
ted
RAB
*
Una
lloca
ted
wor
ks u
nder
cons
truc
tion
RAB
Com
mer
ce C
omm
issio
n In
form
atio
n Di
sclo
sure
Tem
plat
e
Info
rmat
ion
Disc
losu
res 3
1 M
arch
202
1 - S
ched
ules
-1-to
-10.
xlsx
12S4
.RAB
Val
ue (R
olle
d Fo
rwar
d)
Com
pany
Nam
eFo
r Yea
r End
ed
SCHE
DULE
4: R
EPO
RT O
N V
ALUE
OF
THE
REGU
LATO
RY A
SSET
BAS
E (R
OLL
ED F
ORW
ARD)
sch
ref
Scan
pow
er Li
mite
d31
Mar
ch 2
021
This
sche
dule
requ
ires i
nfor
mat
ion
on th
e ca
lcula
tion
of th
e Re
gula
tory
Ass
et B
ase
(RAB
) val
ue to
the
end
of th
is di
sclo
sure
yea
r. Th
is in
form
s the
RO
I cal
cula
tion
in S
ched
ule
2.
EDBs
mus
t pro
vide
exp
lana
tory
com
men
t on
the
valu
e of
thei
r RAB
in S
ched
ule
14 (M
anda
tory
Exp
lana
tory
Not
es).
This
info
rmat
ion
is pa
rt of
aud
ited
disc
losu
re in
form
atio
n (a
s def
ined
in se
ctio
n 1.
4 of
the
ID d
eter
min
atio
n), a
nd so
is su
bjec
t to
the
assu
ranc
e re
port
requ
ired
by
sect
ion
2.8.
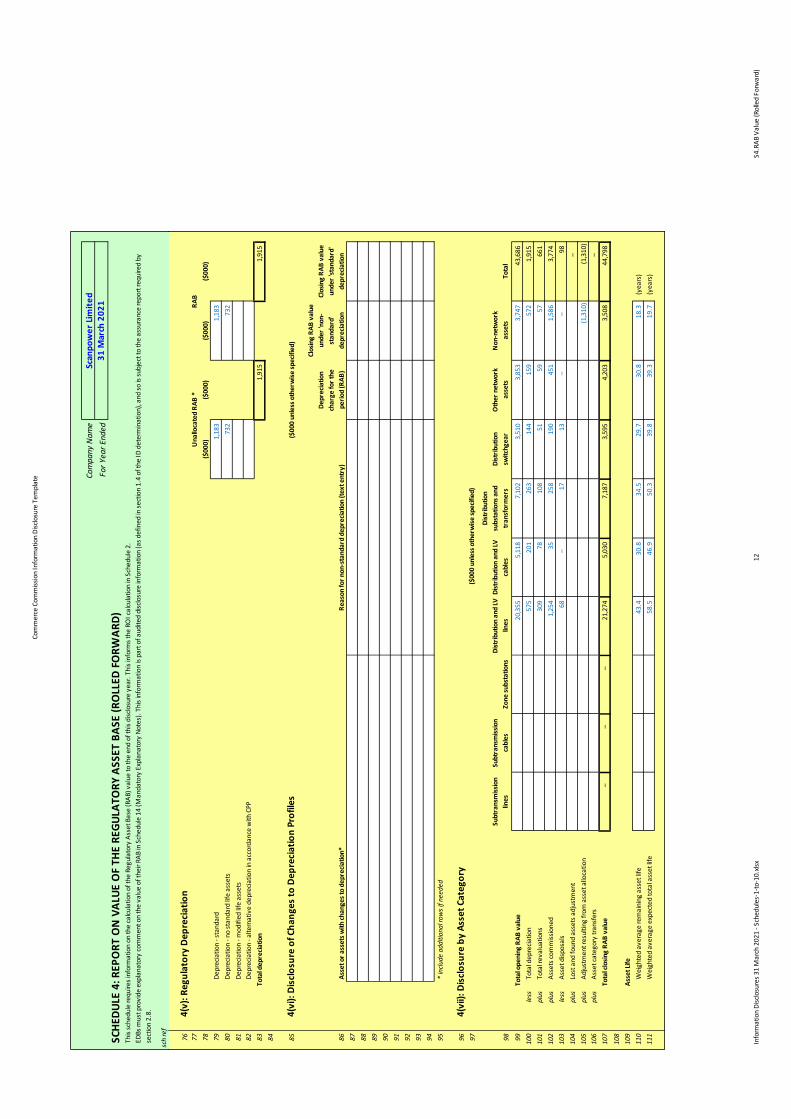
764(
v): R
egul
ator
y D
epre
ciat
ion
77 78($
000)
($00
0)($
000)
($00
0)79
Depr
ecia
tion
- sta
ndar
d 1
,183
1,1
8380
Depr
ecia
tion
- no
stan
dard
life
asse
ts 7
32 7
3281
Depr
ecia
tion
- mod
ified
life
asse
ts82
Depr
ecia
tion
- alte
rnat
ive
depr
ecia
tion
in a
ccor
danc
e w
ith C
PP83
Tota
l dep
recia
tion
1,9
15 1
,915
84 854(
vi):
Dis
clos
ure
of C
hang
es to
Dep
reci
atio
n Pr
ofile
s
86As
set o
r ass
ets w
ith ch
ange
s to
depr
ecia
tion*
Reas
on fo
r non
-sta
ndar
d de
prec
iatio
n (te
xt e
ntry
)
Depr
ecia
tion
char
ge fo
r the
pe
riod
(RAB
)
Clos
ing
RAB
valu
e un
der '
non-
stan
dard
' de
prec
iatio
n
Clos
ing
RAB
valu
e un
der '
stan
dard
' de
prec
iatio
n 87 88 89 90 91 92 93 94 95
* in
clude
add
ition
al ro
ws i
f nee
ded
964(
vii):
Dis
clos
ure
by A
sset
Cat
egor
y97
($00
0 un
less
oth
erw
ise sp
ecifi
ed)
98Su
btra
nsm
issio
n lin
esSu
btra
nsm
issio
n ca
bles
Zone
subs
tatio
nsDi
strib
utio
n an
d LV
lin
esDi
strib
utio
n an
d LV
ca
bles
Dist
ribut
ion
subs
tatio
ns a
nd
tran
sfor
mer
sDi
strib
utio
n sw
itchg
ear
Oth
er n
etw
ork
asse
tsN
on-n
etw
ork
asse
tsTo
tal
99To
tal o
peni
ng R
AB v
alue
20,
355
5,1
18 7
,102
3,5
10 3
,853
3,7
47 4
3,68
610
0le
ssTo
tal d
epre
ciatio
n 5
75 2
01 2
63 1
44 1
59 5
72 1
,915
101
plus
Tota
l rev
alua
tions
309
78
108
51
59
57
661
102
plus
Asse
ts co
mm
issio
ned
1,2
54 3
5 2
58 1
90 4
51 1
,586
3,7
7410
3le
ssAs
set d
ispos
als
68
– 1
7 1
3 –
– 9
810
4pl
usLo
st a
nd fo
und
asse
ts a
djus
tmen
t –
105
plus
Adju
stm
ent r
esul
ting
from
ass
et a
lloca
tion
(1,3
10)
(1,3
10)
106
plus
Asse
t cat
egor
y tra
nsfe
rs –
107
Tota
l clo
sing
RAB
valu
e –
– –
21,
274
5,0
30 7
,187
3,5
95 4
,203
3,5
08 4
4,79
8
108
109
Asse
t Life
110
Wei
ghte
d av
erag
e re
mai
ning
ass
et lif
e 4
3.4
30.
8 3
4.5
29.
7 3
0.8
18.
3(y
ears
)11
1W
eigh
ted
aver
age
expe
cted
tota
l ass
et lif
e 5
8.5
46.
9 5
0.3
39.
8 3
9.3
19.
7(y
ears
)
Una
lloca
ted
RAB
*RA
B
($00
0 un
less
oth
erw
ise sp
ecifi
ed)
Commerce Commission Information Disclosure Template
Information Disclosures 31 March 2021 - Schedules-1-to-10.xlsx 13 S5a.Regulatory Tax Allowance
Company NameFor Year Ended
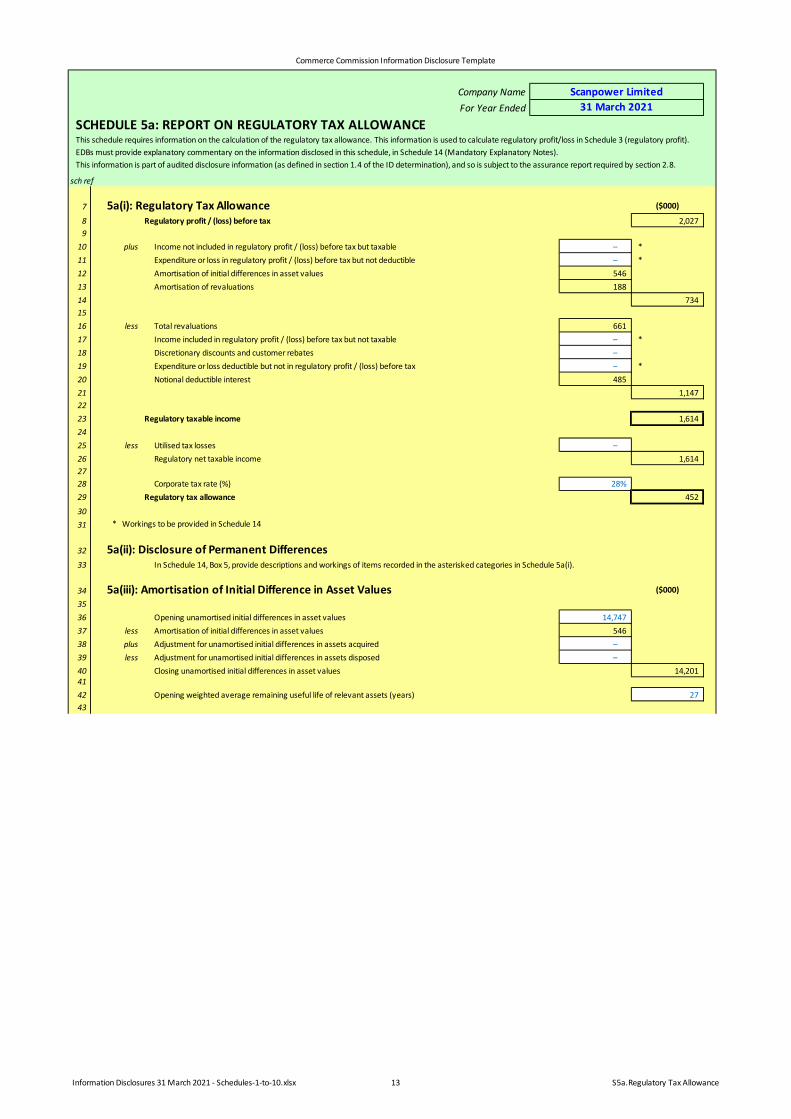
SCHEDULE 5a: REPORT ON REGULATORY TAX ALLOWANCE
sch ref
7 5a(i): Regulatory Tax Allowance ($000)
8 Regulatory profit / (loss) before tax 2,0279
10 plus Income not included in regulatory profit / (loss) before tax but taxable – *11 Expenditure or loss in regulatory profit / (loss) before tax but not deductible – *12 Amortisation of initial differences in asset values 54613 Amortisation of revaluations 18814 7341516 less Total revaluations 66117 Income included in regulatory profit / (loss) before tax but not taxable – *18 Discretionary discounts and customer rebates –19 Expenditure or loss deductible but not in regulatory profit / (loss) before tax – *20 Notional deductible interest 48521 1,1472223 Regulatory taxable income 1,6142425 less Utilised tax losses – 26 Regulatory net taxable income 1,614 2728 Corporate tax rate (%) 28%29 Regulatory tax allowance 452
3031 * Workings to be provided in Schedule 14
32 5a(ii): Disclosure of Permanent Differences33 In Schedule 14, Box 5, provide descriptions and workings of items recorded in the asterisked categories in Schedule 5a(i).
34 5a(iii): Amortisation of Initial Difference in Asset Values ($000)
3536 Opening unamortised initial differences in asset values 14,74737 less Amortisation of initial differences in asset values 54638 plus Adjustment for unamortised initial differences in assets acquired –39 less Adjustment for unamortised initial differences in assets disposed –40 Closing unamortised initial differences in asset values 14,2014142 Opening weighted average remaining useful life of relevant assets (years) 2743
This schedule requires information on the calculation of the regulatory tax allowance. This information is used to calculate regulatory profit/loss in Schedule 3 (regulatory profit). EDBs must provide explanatory commentary on the information disclosed in this schedule, in Schedule 14 (Mandatory Explanatory Notes).This information is part of audited disclosure information (as defined in section 1.4 of the ID determination), and so is subject to the assurance report required by section 2.8.
Scanpower Limited31 March 2021
Commerce Commission Information Disclosure Template
Information Disclosures 31 March 2021 - Schedules-1-to-10.xlsx 14 S5a.Regulatory Tax Allowance
Company NameFor Year Ended
SCHEDULE 5a: REPORT ON REGULATORY TAX ALLOWANCE
sch ref
This schedule requires information on the calculation of the regulatory tax allowance. This information is used to calculate regulatory profit/loss in Schedule 3 (regulatory profit). EDBs must provide explanatory commentary on the information disclosed in this schedule, in Schedule 14 (Mandatory Explanatory Notes).This information is part of audited disclosure information (as defined in section 1.4 of the ID determination), and so is subject to the assurance report required by section 2.8.
Scanpower Limited31 March 2021
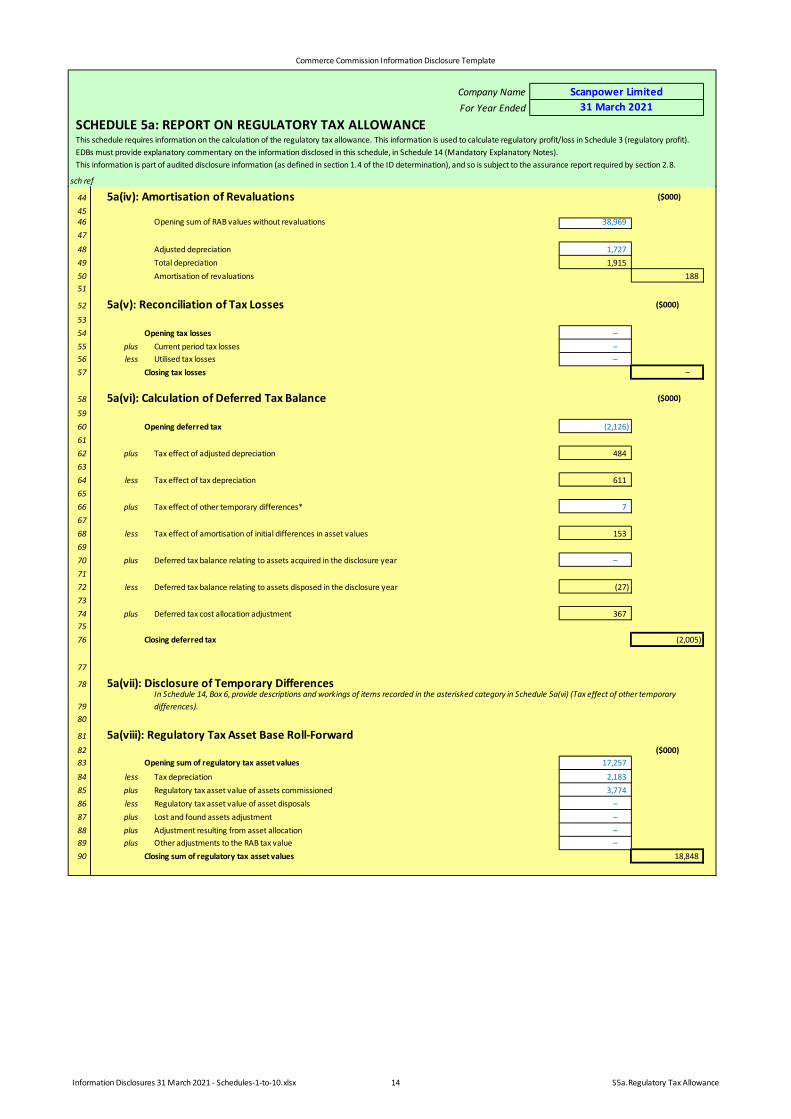
44 5a(iv): Amortisation of Revaluations ($000)
4546 Opening sum of RAB values without revaluations 38,96947
48 Adjusted depreciation 1,72749 Total depreciation 1,91550 Amortisation of revaluations 18851
52 5a(v): Reconciliation of Tax Losses ($000)
5354 Opening tax losses –55 plus Current period tax losses –56 less Utilised tax losses –57 Closing tax losses –
58 5a(vi): Calculation of Deferred Tax Balance ($000)
5960 Opening deferred tax (2,126)6162 plus Tax effect of adjusted depreciation 4846364 less Tax effect of tax depreciation 6116566 plus Tax effect of other temporary differences* 76768 less Tax effect of amortisation of initial differences in asset values 1536970 plus Deferred tax balance relating to assets acquired in the disclosure year –7172 less Deferred tax balance relating to assets disposed in the disclosure year (27)7374 plus Deferred tax cost allocation adjustment 3677576 Closing deferred tax (2,005)
77
78 5a(vii): Disclosure of Temporary Differences
7980
81 5a(viii): Regulatory Tax Asset Base Roll-Forward82 ($000)83 Opening sum of regulatory tax asset values 17,257
84 less Tax depreciation 2,18385 plus Regulatory tax asset value of assets commissioned 3,77486 less Regulatory tax asset value of asset disposals –87 plus Lost and found assets adjustment –88 plus Adjustment resulting from asset allocation –89 plus Other adjustments to the RAB tax value –90 Closing sum of regulatory tax asset values 18,848
In Schedule 14, Box 6, provide descriptions and workings of items recorded in the asterisked category in Schedule 5a(vi) (Tax effect of other temporary differences).
Commerce Commission Information Disclosure Template
Information Disclosures 31 March 2021 - Schedules-1-to-10.xlsx 15 S5b.Related Party Transactions
Company NameFor Year Ended
SCHEDULE 5b: REPORT ON RELATED PARTY TRANSACTIONS
sch ref
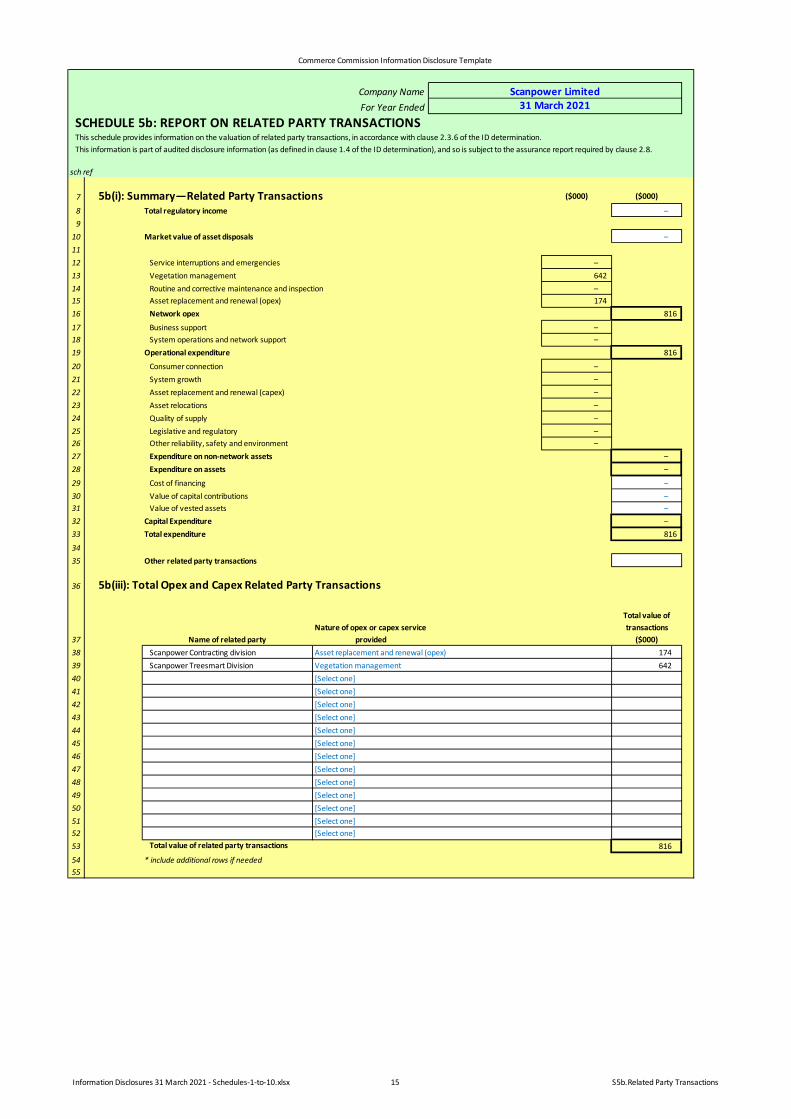
7 5b(i): Summary—Related Party Transactions ($000) ($000)
8 Total regulatory income –9
10 Market value of asset disposals –1112 Service interruptions and emergencies –13 Vegetation management 64214 Routine and corrective maintenance and inspection –15 Asset replacement and renewal (opex) 17416 Network opex 816
17 Business support –18 System operations and network support –19 Operational expenditure 816
20 Consumer connection –21 System growth –22 Asset replacement and renewal (capex) –23 Asset relocations –24 Quality of supply –25 Legislative and regulatory –26 Other reliability, safety and environment –27 Expenditure on non-network assets –28 Expenditure on assets –
29 Cost of financing –30 Value of capital contributions –31 Value of vested assets –32 Capital Expenditure –33 Total expenditure 816
3435 Other related party transactions
36 5b(iii): Total Opex and Capex Related Party Transactions
37 Name of related party Nature of opex or capex service
provided
Total value of transactions
($000)38 Scanpower Contracting division 17439 Scanpower Treesmart Division 6424041424344454647484950515253 Total value of related party transactions 816
54 * include additional rows if needed55
Scanpower Limited31 March 2021
Asset replacement and renewal (opex)Vegetation management[Select one][Select one][Select one][Select one]
This schedule provides information on the valuation of related party transactions, in accordance with clause 2.3.6 of the ID determination. This information is part of audited disclosure information (as defined in clause 1.4 of the ID determination), and so is subject to the assurance report required by clause 2.8.
[Select one][Select one][Select one]
[Select one]
[Select one][Select one][Select one][Select one][Select one]
Comm
erce Comm
ission Information Disclosure Tem
plate
Information Disclosures 31 M
arch 2021 - Schedules-1-to-10.xlsx16
S5c.TCSD Allowance
Company N
ame
For Year Ended
SCHEDULE 5c: REPORT O
N TERM
CREDIT SPREAD DIFFERENTIAL ALLO
WAN
CE
sch ref78
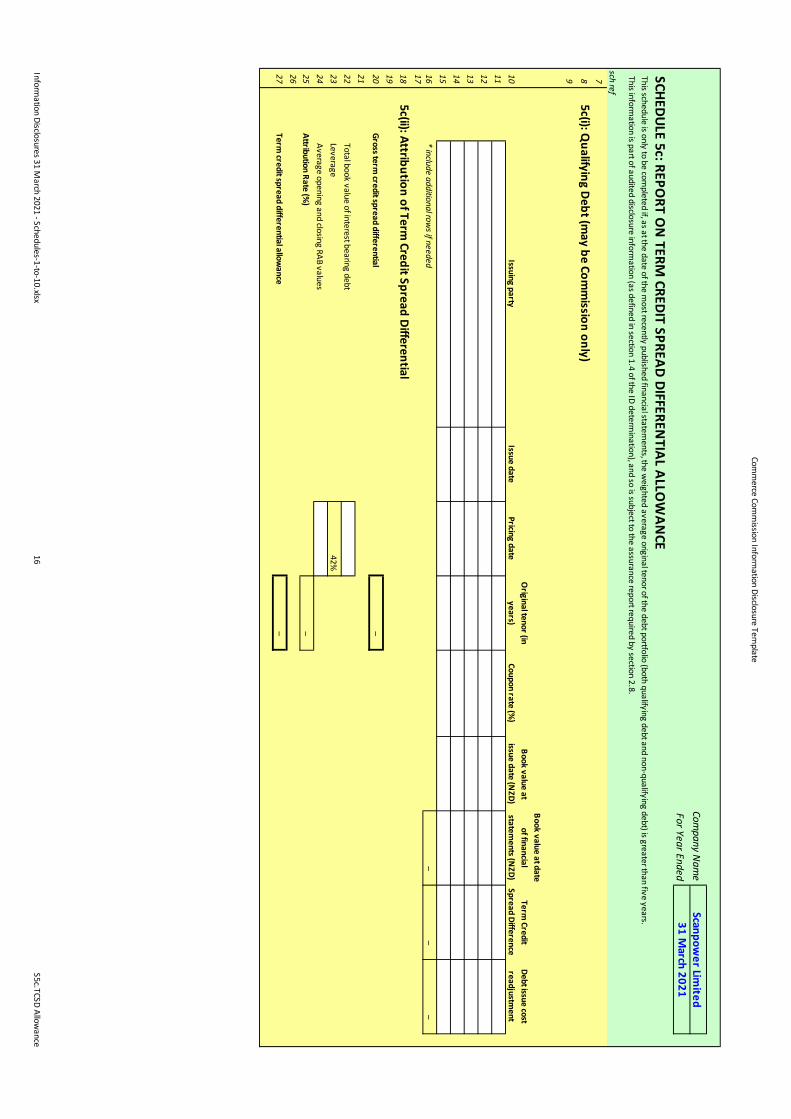
5c(i): Qualifying D
ebt (may be Com
mission only)
910Issuing party
Issue datePricing date
Original tenor (in
years)Coupon rate (%
)Book value at
issue date (NZD)
Book value at date of financial
statements (N
ZD)Term
Credit Spread Difference
Debt issue cost readjustm
ent 111213141516
* include additional rows if needed
– –
–1718
5c(ii): Attribution of Term Credit Spread D
ifferential1920
Gross term credit spread differential
–
2122Total book value of interest bearing debt
23Leverage
42%24
Average opening and closing RAB values25
Attribution Rate (%)
–2627
Term credit spread differential allow
ance –
Scanpower Lim
ited31 M
arch 2021
This schedule is only to be completed if, as at the date of the m
ost recently published financial statements, the w
eighted average original tenor of the debt portfolio (both qualifying debt and non-qualifying debt) is greater than five years.This inform
ation is part of audited disclosure information (as defined in section 1.4 of the ID determ
ination), and so is subject to the assurance report required by section 2.8.
Comm
erce Comm
ission Information Disclosure Tem
plate
Information Disclosures 31 M
arch 2021 - Schedules-1-to-10.xlsx17
S5d.Cost Allocations
Company N
ame
For Year Ended
SCHEDULE 5d: REPORT O
N CO
ST ALLOCATIO
NS
sch ref
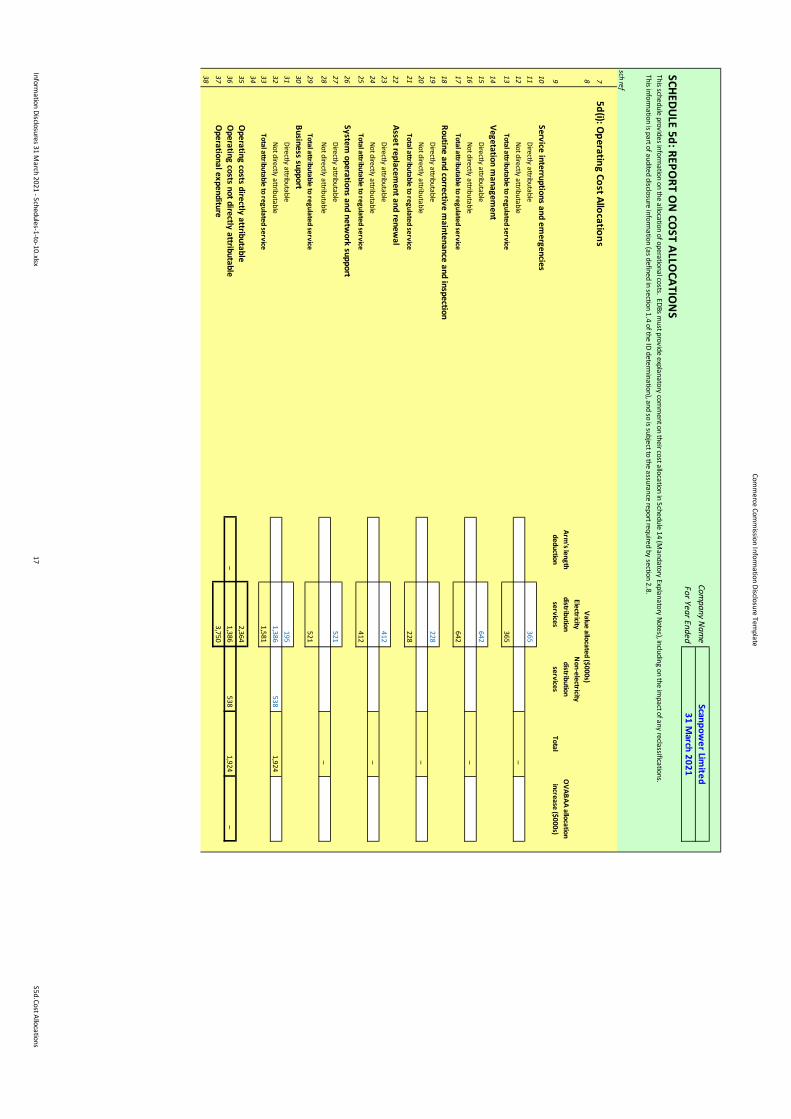
75d(i): O
perating Cost Allocations8
Value allocated ($000s)
9Arm
's length deduction
Electricity distribution
services
Non-electricity distribution
servicesTotal
OVABAA allocation increase ($000s)
10Service interruptions and em
ergencies11
Directly attributable 365
12Not directly attributable
–13
Total attributable to regulated service 365
14Vegetation m
anagement
15Directly attributable
64216
Not directly attributable –
17Total attributable to regulated service
642
18Routine and corrective m
aintenance and inspection19
Directly attributable 228
20Not directly attributable
–21
Total attributable to regulated service 228
22Asset replacem
ent and renewal
23Directly attributable
41224
Not directly attributable –
25Total attributable to regulated service
412
26System
operations and network support
27Directly attributable
52128
Not directly attributable –
29Total attributable to regulated service
52130
Business support31
Directly attributable 195
32Not directly attributable
1,386 538
1,92433
Total attributable to regulated service 1,581
3435O
perating costs directly attributable 2,364
36O
perating costs not directly attributable –
1,386 538
1,924 –
37O
perational expenditure 3,750
38
Scanpower Lim
ited31 M
arch 2021
This schedule provides information on the allocation of operational costs. EDBs m
ust provide explanatory comm
ent on their cost allocation in Schedule 14 (Mandatory Explanatory Notes), including on the im
pact of any reclassifications.This inform
ation is part of audited disclosure information (as defined in section 1.4 of the ID determ
ination), and so is subject to the assurance report required by section 2.8.
Comm
erce Comm
ission Information Disclosure Tem
plate
Information Disclosures 31 M
arch 2021 - Schedules-1-to-10.xlsx18
S5d.Cost Allocations
Company N
ame
For Year Ended
SCHEDULE 5d: REPORT O
N CO
ST ALLOCATIO
NS
sch ref
Scanpower Lim
ited31 M
arch 2021
This schedule provides information on the allocation of operational costs. EDBs m
ust provide explanatory comm
ent on their cost allocation in Schedule 14 (Mandatory Explanatory Notes), including on the im
pact of any reclassifications.This inform
ation is part of audited disclosure information (as defined in section 1.4 of the ID determ
ination), and so is subject to the assurance report required by section 2.8.
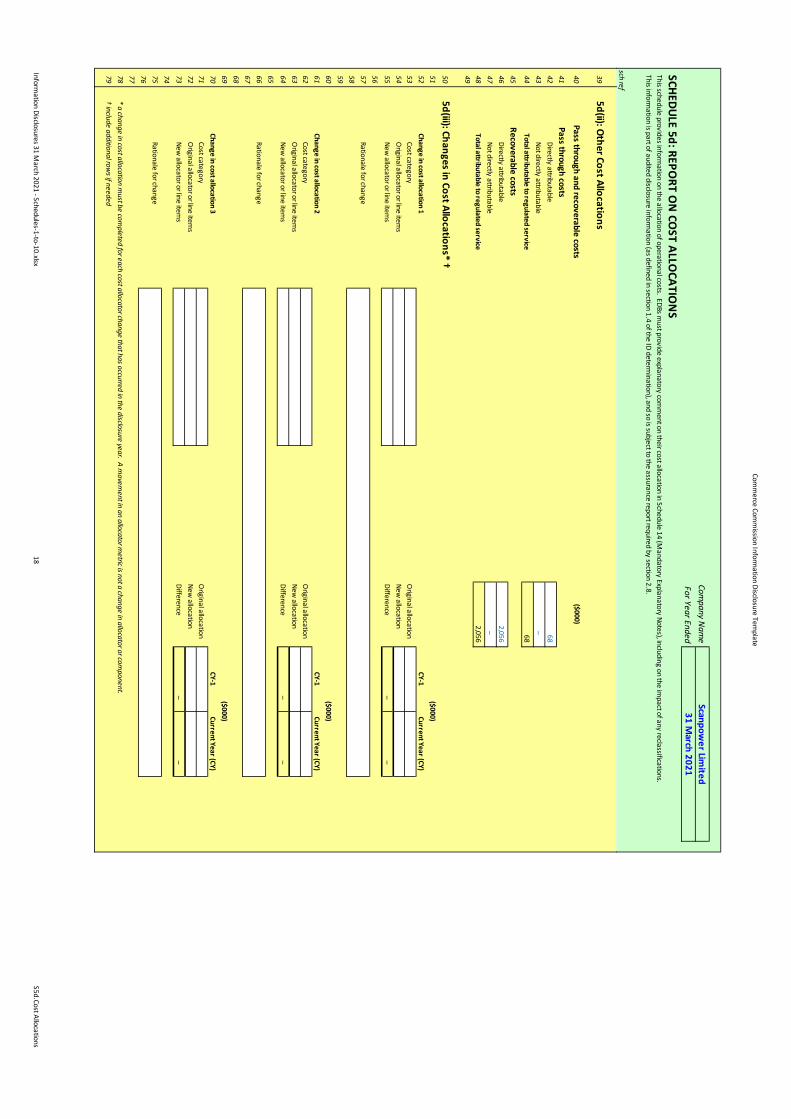
395d(ii): O
ther Cost Allocations
40Pass through and recoverable costs
($000)
41 Pass through costs
42Directly attributable
6843
Not directly attributable –
44Total attributable to regulated service
68
45 Recoverable costs
46Directly attributable
2,05647
Not directly attributable –
48Total attributable to regulated service
2,0564950
5d(iii): Changes in Cost Allocations* †5152
Change in cost allocation 1CY-1
Current Year (CY)53
Cost categoryO
riginal allocation54
Original allocator or line item
sNew
allocation55
New allocator or line item
sDifference
– –
5657Rationale for change
58596061Change in cost allocation 2
CY-1Current Year (CY)
62Cost category
Original allocation
63O
riginal allocator or line items
New allocation
64New
allocator or line items
Difference –
–
6566Rationale for change
676869($000)
70Change in cost allocation 3
CY-1Current Year (CY)
71Cost category
Original allocation
72O
riginal allocator or line items
New allocation
73New
allocator or line items
Difference –
–
7475Rationale for change
76777879† include additional row
s if needed* a change in cost allocation m
ust be completed for each cost allocator change that has occurred in the disclosure year. A m
ovement in an allocator m
etric is not a change in allocator or component.
($000)
($000)
Commerce Commission Information Disclosure Template
Information Disclosures 31 March 2021 - Schedules-1-to-10.xlsx 19 S5e.Asset Allocations
Company NameFor Year Ended
SCHEDULE 5e: REPORT ON ASSET ALLOCATIONS
sch ref
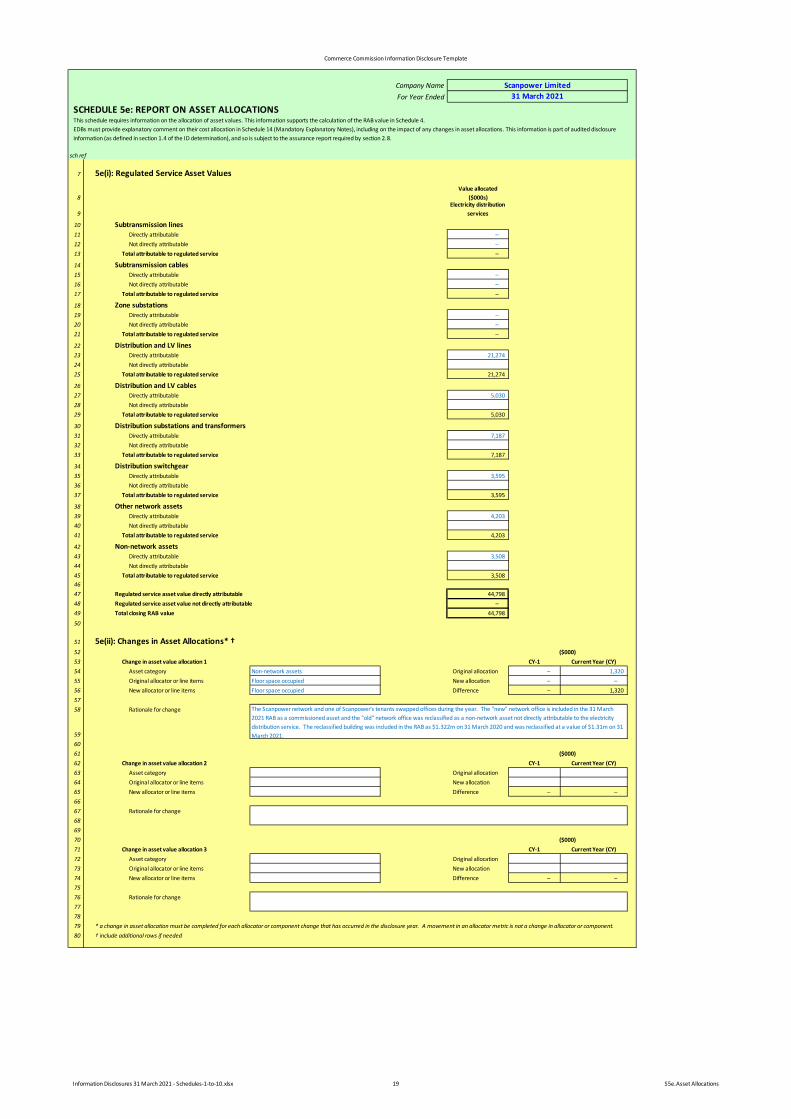
7 5e(i): Regulated Service Asset Values
8Value allocated
($000s)
9Electricity distribution
services
10 Subtransmission lines11 Directly attributable –12 Not directly attributable –13 Total attributable to regulated service –
14 Subtransmission cables15 Directly attributable –16 Not directly attributable –17 Total attributable to regulated service –
18 Zone substations19 Directly attributable –20 Not directly attributable –21 Total attributable to regulated service –
22 Distribution and LV lines23 Directly attributable 21,27424 Not directly attributable 25 Total attributable to regulated service 21,274
26 Distribution and LV cables27 Directly attributable 5,03028 Not directly attributable 29 Total attributable to regulated service 5,030
30 Distribution substations and transformers31 Directly attributable 7,18732 Not directly attributable 33 Total attributable to regulated service 7,187
34 Distribution switchgear35 Directly attributable 3,59536 Not directly attributable 37 Total attributable to regulated service 3,595
38 Other network assets39 Directly attributable 4,20340 Not directly attributable 41 Total attributable to regulated service 4,203
42 Non-network assets43 Directly attributable 3,50844 Not directly attributable 45 Total attributable to regulated service 3,5084647 Regulated service asset value directly attributable 44,79848 Regulated service asset value not directly attributable –49 Total closing RAB value 44,798
50
51 5e(ii): Changes in Asset Allocations* †52 ($000)53 Change in asset value allocation 1 CY-1 Current Year (CY)54 Asset category Non-network assets Original allocation – 1,32055 Original allocator or line items Floor space occupied New allocation – –56 New allocator or line items Floor space occupied Difference – 1,3205758 Rationale for change
596061 ($000)62 Change in asset value allocation 2 CY-1 Current Year (CY)63 Asset category Original allocation64 Original allocator or line items New allocation65 New allocator or line items Difference – –6667 Rationale for change686970 ($000)71 Change in asset value allocation 3 CY-1 Current Year (CY)72 Asset category Original allocation73 Original allocator or line items New allocation74 New allocator or line items Difference – –7576 Rationale for change77787980 † include additional rows if needed
Scanpower Limited31 March 2021
* a change in asset allocation must be completed for each allocator or component change that has occurred in the disclosure year. A movement in an allocator metric is not a change in allocator or component.
This schedule requires information on the allocation of asset values. This information supports the calculation of the RAB value in Schedule 4.EDBs must provide explanatory comment on their cost allocation in Schedule 14 (Mandatory Explanatory Notes), including on the impact of any changes in asset allocations. This information is part of audited disclosure information (as defined in section 1.4 of the ID determination), and so is subject to the assurance report required by section 2.8.
The Scanpower network and one of Scanpower's tenants swapped offices during the year. The "new" network office is included in the 31 March 2021 RAB as a commissioned asset and the "old" network office was reclassified as a non-network asset not directly attributable to the electricity distribution service. The reclassified building was included in the RAB as $1.322m on 31 March 2020 and was reclassified at a value of $1.31m on 31 March 2021.
Commerce Commission Information Disclosure Template
Information Disclosures 31 March 2021 - Schedules-1-to-10.xlsx 20 S6a.Actual Expenditure Capex
Company NameFor Year Ended
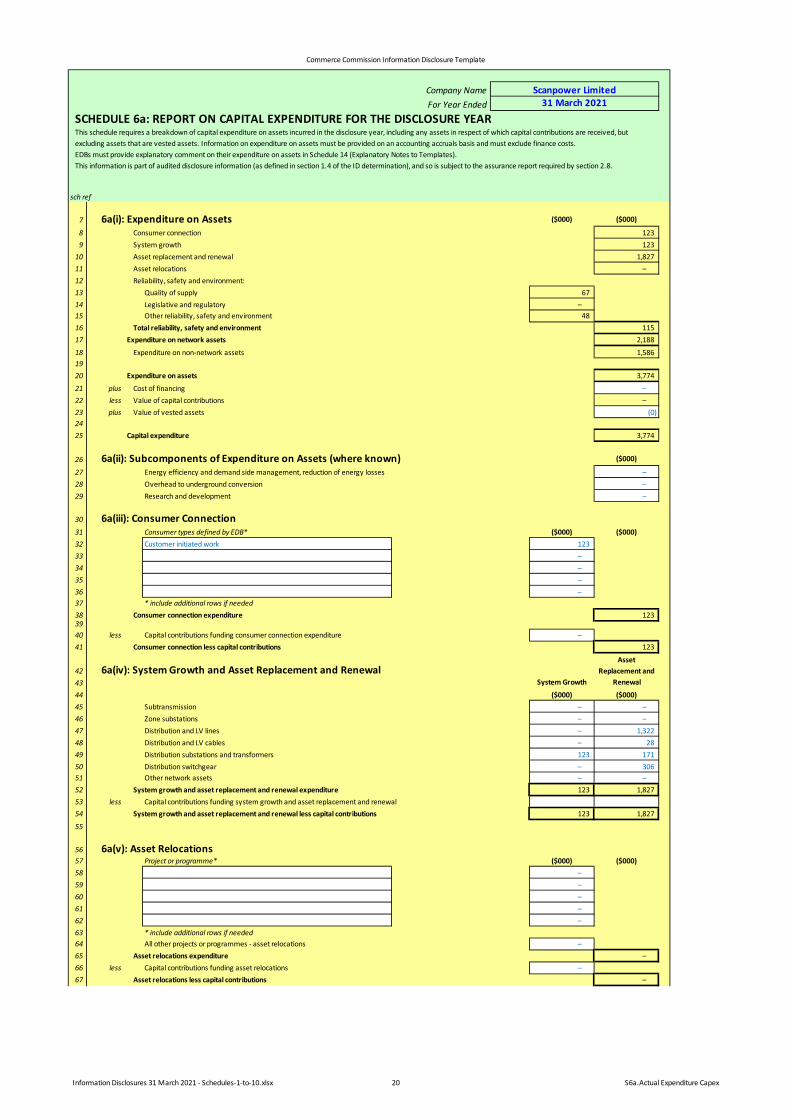
SCHEDULE 6a: REPORT ON CAPITAL EXPENDITURE FOR THE DISCLOSURE YEAR
sch ref
7 6a(i): Expenditure on Assets ($000) ($000)
8 Consumer connection 1239 System growth 123
10 Asset replacement and renewal 1,82711 Asset relocations –12 Reliability, safety and environment:13 Quality of supply 6714 Legislative and regulatory –15 Other reliability, safety and environment 4816 Total reliability, safety and environment 11517 Expenditure on network assets 2,188
18 Expenditure on non-network assets 1,5861920 Expenditure on assets 3,774
21 plus Cost of financing –22 less Value of capital contributions –23 plus Value of vested assets (0)2425 Capital expenditure 3,774
26 6a(ii): Subcomponents of Expenditure on Assets (where known) ($000)
27 Energy efficiency and demand side management, reduction of energy losses –28 Overhead to underground conversion –29 Research and development –
30 6a(iii): Consumer Connection31 Consumer types defined by EDB* ($000) ($000)32 Customer initiated work 12333 –34 –35 –36 –37 * include additional rows if needed38 Consumer connection expenditure 1233940 less Capital contributions funding consumer connection expenditure –41 Consumer connection less capital contributions 123
42 6a(iv): System Growth and Asset Replacement and Renewal4344 ($000) ($000)45 Subtransmission – –46 Zone substations – –47 Distribution and LV lines – 1,32248 Distribution and LV cables – 2849 Distribution substations and transformers 123 17150 Distribution switchgear – 30651 Other network assets – –52 System growth and asset replacement and renewal expenditure 123 1,82753 less Capital contributions funding system growth and asset replacement and renewal54 System growth and asset replacement and renewal less capital contributions 123 1,827
55
56 6a(v): Asset Relocations57 Project or programme* ($000) ($000)58 –59 –60 –61 –62 –63 * include additional rows if needed64 All other projects or programmes - asset relocations –65 Asset relocations expenditure –66 less Capital contributions funding asset relocations –67 Asset relocations less capital contributions –
System Growth
Asset Replacement and
Renewal
Scanpower Limited31 March 2021
This schedule requires a breakdown of capital expenditure on assets incurred in the disclosure year, including any assets in respect of which capital contributions are received, but excluding assets that are vested assets. Information on expenditure on assets must be provided on an accounting accruals basis and must exclude finance costs. EDBs must provide explanatory comment on their expenditure on assets in Schedule 14 (Explanatory Notes to Templates).This information is part of audited disclosure information (as defined in section 1.4 of the ID determination), and so is subject to the assurance report required by section 2.8.
Commerce Commission Information Disclosure Template
Information Disclosures 31 March 2021 - Schedules-1-to-10.xlsx 21 S6a.Actual Expenditure Capex
Company NameFor Year Ended
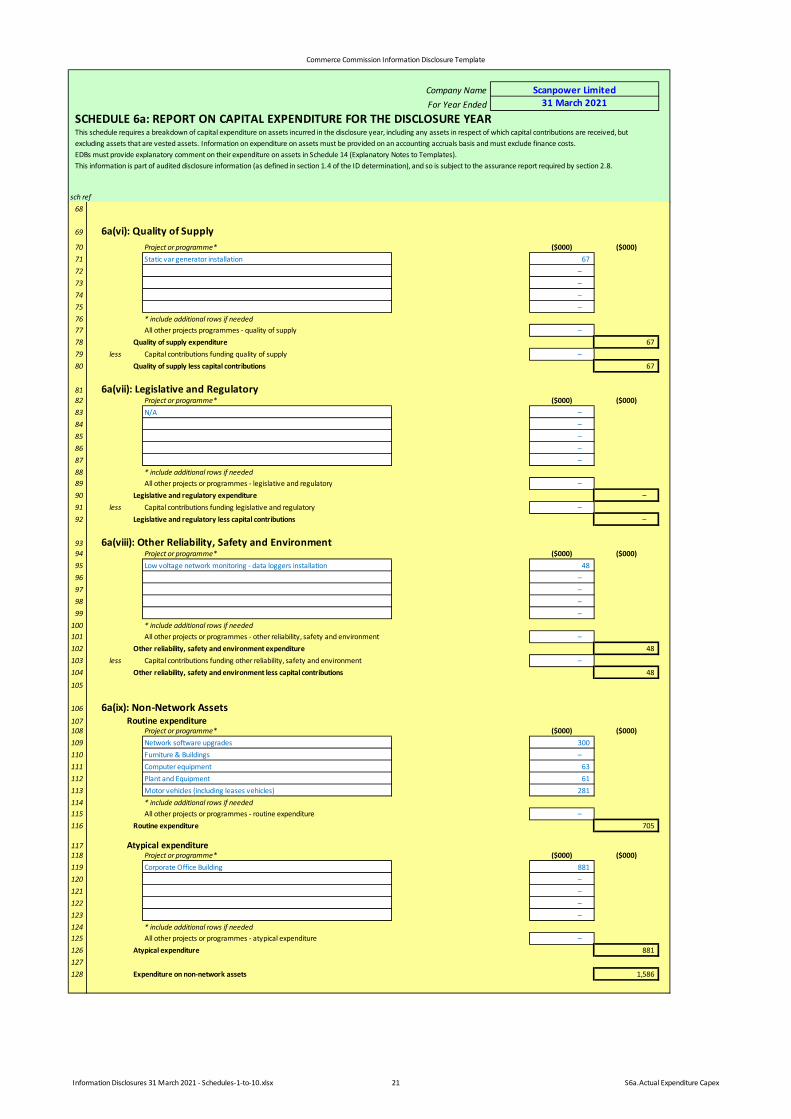
SCHEDULE 6a: REPORT ON CAPITAL EXPENDITURE FOR THE DISCLOSURE YEAR
sch ref
Scanpower Limited31 March 2021
This schedule requires a breakdown of capital expenditure on assets incurred in the disclosure year, including any assets in respect of which capital contributions are received, but excluding assets that are vested assets. Information on expenditure on assets must be provided on an accounting accruals basis and must exclude finance costs. EDBs must provide explanatory comment on their expenditure on assets in Schedule 14 (Explanatory Notes to Templates).This information is part of audited disclosure information (as defined in section 1.4 of the ID determination), and so is subject to the assurance report required by section 2.8.
68
69 6a(vi): Quality of Supply70 Project or programme* ($000) ($000)71 Static var generator installation 6772 –73 –74 –75 –76 * include additional rows if needed77 All other projects programmes - quality of supply –78 Quality of supply expenditure 6779 less Capital contributions funding quality of supply –80 Quality of supply less capital contributions 67
81 6a(vii): Legislative and Regulatory82 Project or programme* ($000) ($000)83 N/A –84 –85 –86 –87 –88 * include additional rows if needed89 All other projects or programmes - legislative and regulatory –90 Legislative and regulatory expenditure –91 less Capital contributions funding legislative and regulatory –92 Legislative and regulatory less capital contributions –
93 6a(viii): Other Reliability, Safety and Environment94 Project or programme* ($000) ($000)95 Low voltage network monitoring - data loggers installation 4896 –97 –98 –99 –
100 * include additional rows if needed101 All other projects or programmes - other reliability, safety and environment –102 Other reliability, safety and environment expenditure 48103 less Capital contributions funding other reliability, safety and environment –104 Other reliability, safety and environment less capital contributions 48
105
106 6a(ix): Non-Network Assets107 Routine expenditure108 Project or programme* ($000) ($000)109 Network software upgrades 300110 Furniture & Buildings –111 Computer equipment 63112 Plant and Equipment 61113 Motor vehicles (including leases vehicles) 281114 * include additional rows if needed115 All other projects or programmes - routine expenditure –116 Routine expenditure 705
117 Atypical expenditure118 Project or programme* ($000) ($000)119 Corporate Office Building 881120 –121 –122 –123 –124 * include additional rows if needed125 All other projects or programmes - atypical expenditure –126 Atypical expenditure 881127128 Expenditure on non-network assets 1,586
Com
mer
ce C
omm
issio
n In
form
atio
n Di
sclo
sure
Tem
plat
e
Info
rmat
ion
Disc
losu
res 3
1 M
arch
202
1 - S
ched
ules
-1-to
-10.
xlsx
22S6
b.Ac
tual
Exp
endi
ture
Ope
x
Com
pany
Nam
eFo
r Yea
r End
ed
SCHE
DULE
6b:
REP
ORT
ON
OPE
RATI
ON
AL E
XPEN
DITU
RE F
OR
THE
DISC
LOSU
RE Y
EAR
sch
ref
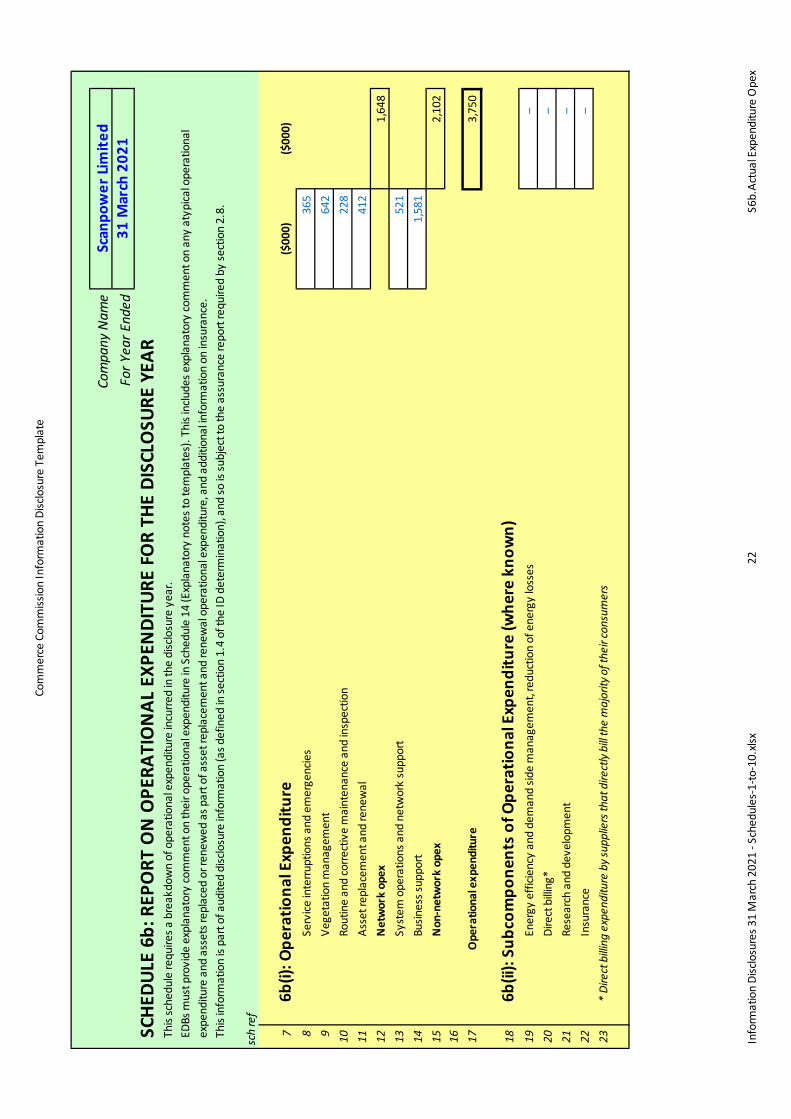
76b
(i): O
pera
tiona
l Exp
endi
ture
($00
0)($
000)
8Se
rvice
inte
rrupt
ions
and
em
erge
ncie
s 3
659
Vege
tatio
n m
anag
emen
t 6
4210
Rout
ine
and
corre
ctiv
e m
aint
enan
ce a
nd in
spec
tion
228
11As
set r
epla
cem
ent a
nd re
new
al 4
1212
Net
wor
k op
ex 1
,648
13Sy
stem
ope
ratio
ns a
nd n
etw
ork
supp
ort
521
14Bu
sines
s sup
port
1,5
8115
Non
-net
wor
k op
ex 2
,102
16 17O
pera
tiona
l exp
endi
ture
3,7
50
186b
(ii):
Subc
ompo
nent
s of
Ope
ratio
nal E
xpen
ditu
re (w
here
kno
wn)
19En
ergy
effi
cienc
y an
d de
man
d sid
e m
anag
emen
t, re
duct
ion
of e
nerg
y lo
sses
–20
Dire
ct b
illing
* –
21Re
sear
ch a
nd d
evel
opm
ent
–22
Insu
ranc
e –
23*
Dire
ct b
illing
exp
endi
ture
by s
uppl
iers
that
dire
ctly
bill t
he m
ajor
ity o
f the
ir co
nsum
ers
This
sche
dule
requ
ires a
bre
akdo
wn
of o
pera
tiona
l exp
endi
ture
incu
rred
in th
e di
sclo
sure
yea
r. ED
Bs m
ust p
rovi
de e
xpla
nato
ry co
mm
ent o
n th
eir o
pera
tiona
l exp
endi
ture
in S
ched
ule
14 (E
xpla
nato
ry n
otes
to te
mpl
ates
). Th
is in
clude
s exp
lana
tory
com
men
t on
any
atyp
ical o
pera
tiona
l ex
pend
iture
and
ass
ets r
epla
ced
or re
new
ed a
s par
t of a
sset
repl
acem
ent a
nd re
new
al o
pera
tiona
l exp
endi
ture
, and
add
ition
al in
form
atio
n on
insu
ranc
e.Th
is in
form
atio
n is
part
of a
udite
d di
sclo
sure
info
rmat
ion
(as d
efin
ed in
sect
ion
1.4
of th
e ID
det
erm
inat
ion)
, and
so is
subj
ect t
o th
e as
sura
nce
repo
rt re
quire
d by
sect
ion
2.8.
Scan
pow
er Li
mite
d31
Mar
ch 2
021
Commerce Commission Information Disclosure Template
Information Disclosures 31 March 2021 - Schedules-1-to-10.xlsx 23 S7.Actual vs Forecast
Company NameFor Year Ended
SCHEDULE 7: COMPARISON OF FORECASTS TO ACTUAL EXPENDITURE
sch ref
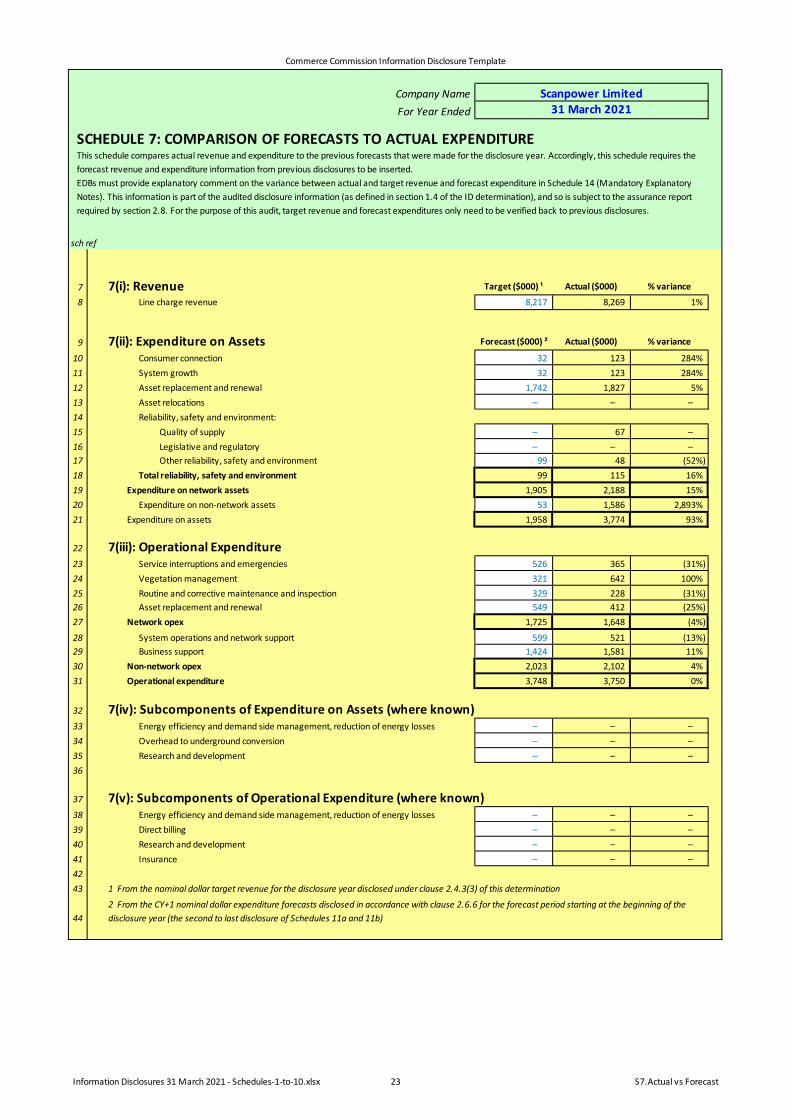
7 7(i): Revenue Target ($000) ¹ Actual ($000) % variance
8 Line charge revenue 8,217 8,269 1%
9 7(ii): Expenditure on Assets Forecast ($000) ² Actual ($000) % variance
10 Consumer connection 32 123 284%11 System growth 32 123 284%12 Asset replacement and renewal 1,742 1,827 5%13 Asset relocations – – –14 Reliability, safety and environment:15 Quality of supply – 67 –16 Legislative and regulatory – – –17 Other reliability, safety and environment 99 48 (52%)18 Total reliability, safety and environment 99 115 16%19 Expenditure on network assets 1,905 2,188 15%20 Expenditure on non-network assets 53 1,586 2,893%21 Expenditure on assets 1,958 3,774 93%
22 7(iii): Operational Expenditure 23 Service interruptions and emergencies 526 365 (31%)24 Vegetation management 321 642 100%25 Routine and corrective maintenance and inspection 329 228 (31%)26 Asset replacement and renewal 549 412 (25%)27 Network opex 1,725 1,648 (4%)
28 System operations and network support 599 521 (13%)29 Business support 1,424 1,581 11%30 Non-network opex 2,023 2,102 4%31 Operational expenditure 3,748 3,750 0%
32 7(iv): Subcomponents of Expenditure on Assets (where known)33 Energy efficiency and demand side management, reduction of energy losses – – –34 Overhead to underground conversion – – –35 Research and development – – –36
37 7(v): Subcomponents of Operational Expenditure (where known) 38 Energy efficiency and demand side management, reduction of energy losses – – –39 Direct billing – – –40 Research and development – – –41 Insurance – – –4243 1 From the nominal dollar target revenue for the disclosure year disclosed under clause 2.4.3(3) of this determination
44
This schedule compares actual revenue and expenditure to the previous forecasts that were made for the disclosure year. Accordingly, this schedule requires the forecast revenue and expenditure information from previous disclosures to be inserted. EDBs must provide explanatory comment on the variance between actual and target revenue and forecast expenditure in Schedule 14 (Mandatory Explanatory Notes). This information is part of the audited disclosure information (as defined in section 1.4 of the ID determination), and so is subject to the assurance report required by section 2.8. For the purpose of this audit, target revenue and forecast expenditures only need to be verified back to previous disclosures.
Scanpower Limited31 March 2021
2 From the CY+1 nominal dollar expenditure forecasts disclosed in accordance with clause 2.6.6 for the forecast period starting at the beginning of the disclosure year (the second to last disclosure of Schedules 11a and 11b)
Com
mer
ce C
omm
issio
n In
form
atio
n Di
sclo
sure
Tem
plat
e
Info
rmat
ion
Disc
losu
res 3
1 M
arch
202
1 - S
ched
ules
-1-to
-10
adju
sted
.xlsx
29S8
.Bille
d Q
uant
ities
+Rev
enue
s
Com
pany
Nam
eFo
r Yea
r End
edN
etw
ork
/ Su
b-N
etw
ork
Nam
e
SCHE
DULE
8: R
EPO
RT O
N B
ILLE
D Q
UAN
TITI
ES A
ND
LIN
E CH
ARGE
REV
ENUE
S
sch
ref
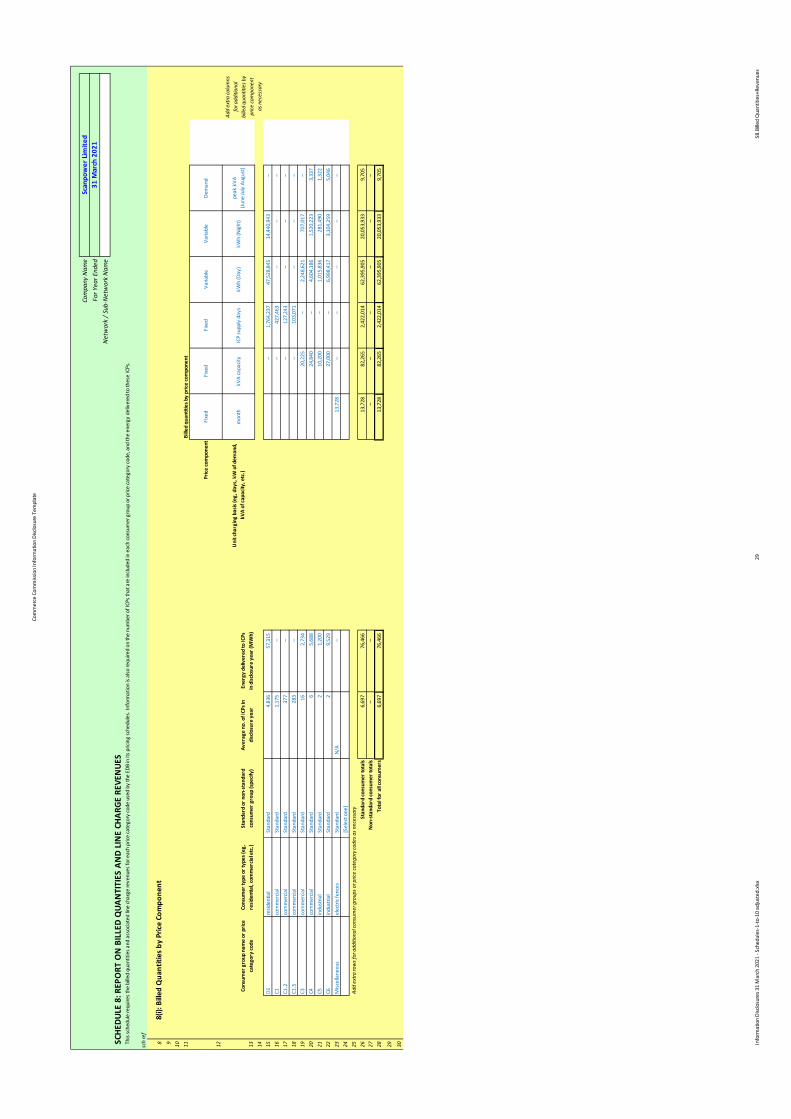
88(
i): B
illed
Qua
ntiti
es b
y Pr
ice
Com
pone
nt9 10 11
Bille
d qu
antit
ies b
y pr
ice co
mpo
nent
12
Fixe
dFi
xed
Fixe
dVa
riabl
eVa
riabl
eDe
man
d
13Co
nsum
er g
roup
nam
e or
pric
e ca
tego
ry co
deCo
nsum
er ty
pe o
r typ
es (e
g,
resid
entia
l, co
mm
ercia
l etc
.)St
anda
rd o
r non
-sta
ndar
d co
nsum
er g
roup
(spe
cify)
Aver
age
no. o
f ICP
s in
disc
losu
re y
ear
Ener
gy d
eliv
ered
to IC
Ps
in d
isclo
sure
yea
r (M
Wh)
mon
thkV
A ca
pacit
yIC
P su
pply
day
skW
h (D
ay)
kWh
(Nig
ht)
peak
kVA
(June
July
Aug
ust)
14 15D1
resid
entia
lSt
anda
rd 4
,836
57,
315
– 1
,764
,237
47,
528,
845
14,
440,
943
–16
C1co
mm
ercia
lSt
anda
rd 1
,175
– –
427
,463
– –
–17
C1.2
com
mer
cial
Stan
dard
377
– –
127
,243
– –
–18
C1.5
com
mer
cial
Stan
dard
283
– –
103
,071
– –
–19
C3co
mm
ercia
lSt
anda
rd 1
6 2
,734
20,
225
– 2
,248
,621
707
,017
–20
C4co
mm
ercia
lSt
anda
rd 6
5,6
88 2
4,84
0 –
4,6
04,1
86 1
,520
,223
3,3
3721
C5in
dust
rial
Stan
dard
2 1
,200
10,
200
– 1
,015
,836
281
,490
1,3
2222
C6in
dust
rial
Stan
dard
2 9
,529
27,
000
– 6
,998
,417
3,1
04,2
59 5
,046
23M
iscel
lane
ous
publ
ic lig
htin
g, te
leco
m b
oxes
, el
ectri
c fen
ces
Stan
dard
N/A
– 1
3,72
8 –
– –
– –
24[S
elec
t one
]25
Add
extra
row
s for
add
ition
al co
nsum
er g
roup
s or p
rice
cate
gory
code
s as n
eces
sary
26St
anda
rd co
nsum
er to
tals
6,6
97 7
6,46
6 1
3,72
8 8
2,26
5 2
,422
,014
62,
395,
905
20,
053,
933
9,7
0527
Non
-sta
ndar
d co
nsum
er to
tals
– –
– –
– –
– –
28To
tal f
or a
ll con
sum
ers
6,6
97 7
6,46
6 1
3,72
8 8
2,26
5 2
,422
,014
62,
395,
905
20,
053,
933
9,7
05
29 30
Scan
pow
er Li
mite
d31
Mar
ch 2
021
Add
extra
colu
mns
fo
r add
ition
al
bille
d qu
antit
ies b
y pr
ice co
mpo
nent
as
nec
essa
ry
This
sche
dule
requ
ires t
he b
illed
quan
titie
s and
ass
ocia
ted
line
char
ge re
venu
es fo
r eac
h pr
ice ca
tego
ry co
de u
sed
by th
e ED
B in
its p
ricin
g sc
hedu
les.
Info
rmat
ion
is al
so re
quire
d on
the
num
ber o
f ICP
s tha
t are
inclu
ded
in e
ach
cons
umer
gro
up o
r pric
e ca
tego
ry co
de, a
nd th
e en
ergy
del
iver
ed to
thes
e IC
Ps.
Uni
t cha
rgin
g ba
sis (e
g, d
ays,
kW
of d
eman
d,
kVA
of ca
pacit
y, e
tc.)
Price
com
pone
nt

Com
mer
ce C
omm
issio
n In
form
atio
n Di
sclo
sure
Tem
plat
e
Info
rmat
ion
Disc
losu
res 3
1 M
arch
202
1 - S
ched
ules
-1-to
-10
adju
sted
.xlsx
30S8
.Bille
d Q
uant
ities
+Rev
enue
s
Com
pany
Nam
eFo
r Yea
r End
edN
etw
ork
/ Su
b-N
etw
ork
Nam
e
SCHE
DULE
8: R
EPO
RT O
N B
ILLE
D Q
UAN
TITI
ES A
ND
LIN
E CH
ARGE
REV
ENUE
S
Scan
pow
er Li
mite
d31
Mar
ch 2
021
This
sche
dule
requ
ires t
he b
illed
quan
titie
s and
ass
ocia
ted
line
char
ge re
venu
es fo
r eac
h pr
ice ca
tego
ry co
de u
sed
by th
e ED
B in
its p
ricin
g sc
hedu
les.
Info
rmat
ion
is al
so re
quire
d on
the
num
ber o
f ICP
s tha
t are
inclu
ded
in e
ach
cons
umer
gro
up o
r pric
e ca
tego
ry co
de, a
nd th
e en
ergy
del
iver
ed to
thes
e IC
Ps.
318(
ii): L
ine
Char
ge R
even
ues
($00
0) b
y Pr
ice
Com
pone
nt32 33
Line
char
ge re
venu
es ($
000)
by
price
com
pone
nt
34
Price
com
pone
ntFi
xed
Fixe
dFi
xed
Varia
ble
Varia
ble
Dem
and
Post
ed d
iscou
nts
35Co
nsum
er g
roup
nam
e or
pric
e ca
tego
ry co
deCo
nsum
er ty
pe o
r typ
es (e
g,
resid
entia
l, co
mm
ercia
l etc
.)St
anda
rd o
r non
-sta
ndar
d co
nsum
er g
roup
(spe
cify)
Tota
l line
char
ge re
venu
e in
di
sclo
sure
yea
r
Not
iona
l rev
enue
fo
rego
ne fr
om p
oste
d di
scou
nts (
if ap
plica
ble)
Tota
l dist
ribut
ion
line
char
ge
reve
nue
Rate
(eg,
$ p
er d
ay, $
per
kW
h, e
tc.)
$/m
onth
$/kV
A ca
pacit
y$/
day
$/kW
h (D
ay)
$/kW
h (N
ight
)$/
peak
kVA
(June
July
Aug
ust)
36 37D1
resid
entia
lSt
anda
rd $
6,07
6 ($
1,34
1) $
6,07
6 –
– $
265
$5,
903
$1,
249
– ($
1,34
1)38
C1co
mm
ercia
lSt
anda
rd $
375
($21
9) $
375
– –
$59
4 –
– –
($21
9)39
C1.2
com
mer
cial
Stan
dard
$78
($22
) $
78 –
– $
100
– –
– ($
22)
40C1
.5co
mm
ercia
lSt
anda
rd $
89 ($
18)
$89
– –
$10
7 –
– –
($18
)41
C3co
mm
ercia
lSt
anda
rd $
315
($8)
$31
5 –
$96
– $
188
$39
– ($
8)42
C4co
mm
ercia
lSt
anda
rd $
529
($8)
$52
9 –
$11
8 –
$35
0 $
40 $
28 ($
8)43
C5in
dust
rial
Stan
dard
$14
2 ($
3) $
142
– $
49 –
$77
$7
$11
($3)
44C6
indu
stria
lSt
anda
rd $
625
($5)
$62
5 –
$20
4 –
$33
9 $
48 $
39 ($
5)45
Misc
ella
neou
spu
blic
light
ing,
tele
com
box
es,
elec
tric f
ence
sSt
anda
rd $
39 ($
2) $
39 $
41 –
– –
– –
($2)
46[S
elec
t one
] –
47Ad
d ex
tra ro
ws f
or a
dditi
onal
cons
umer
gro
ups o
r pric
e ca
tego
ry co
des a
s nec
essa
ry48
Stan
dard
cons
umer
tota
ls $
8,26
9 ($
1,62
6) $
8,26
9 –
$41
$46
7 $
1,06
6 $
6,85
7 $
1,38
4 $
79 ($
1,62
6)49
Non
-sta
ndar
d co
nsum
er to
tals
– –
– –
– –
– –
– –
–50
Tota
l for
all c
onsu
mer
s $
8,26
9 ($
1,62
6) $
8,26
9 –
$41
$46
7 $
1,06
6 $
6,85
7 $
1,38
4 $
79 ($
1,62
6)
51 528(
iii):
Num
ber o
f ICP
s di
rect
ly b
illed
Chec
kO
K
53N
umbe
r of d
irect
ly b
illed
ICPs
at y
ear e
nd
Tota
l tra
nsm
issio
n lin
e ch
arge
re
venu
e (if
av
aila
ble)
Add
extra
colu
mns
fo
r add
ition
al lin
e ch
arge
reve
nues
by
pric
e co
mpo
nent
as
nece
ssar
y
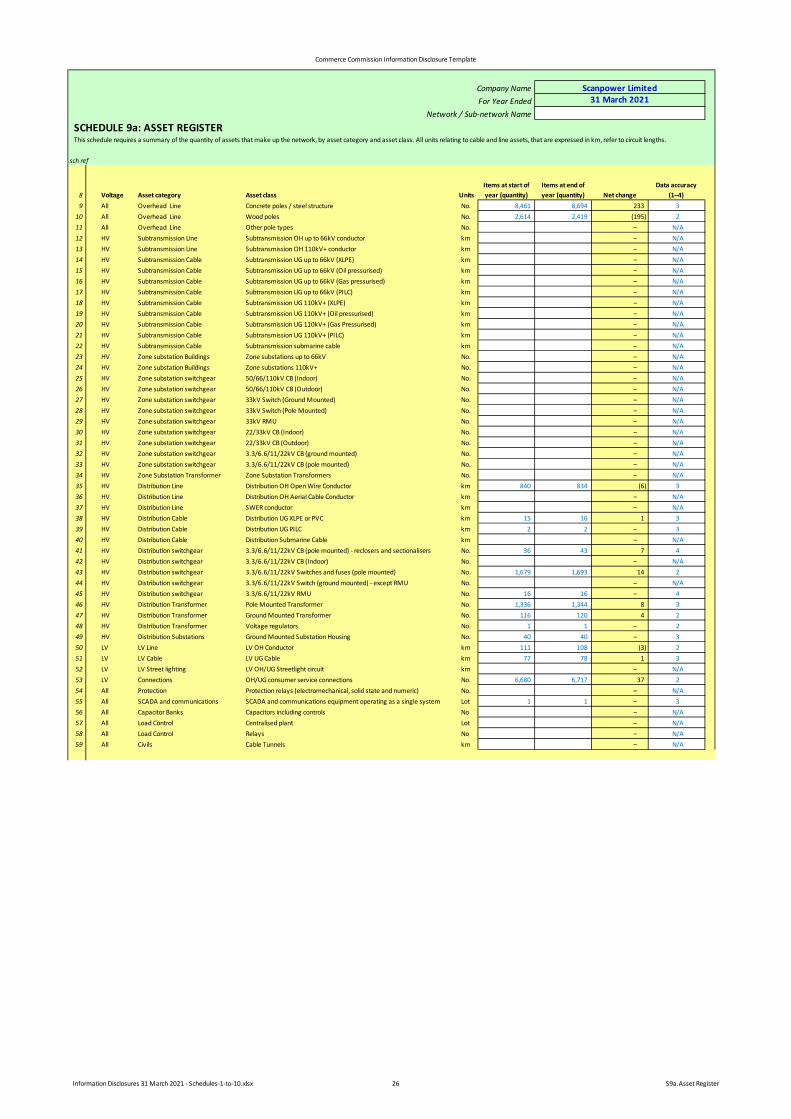
Commerce Commission Information Disclosure Template
Information Disclosures 31 March 2021 - Schedules-1-to-10.xlsx 26 S9a.Asset Register
Company NameFor Year Ended
Network / Sub-network Name
SCHEDULE 9a: ASSET REGISTER
sch ref
8 Voltage Asset category Asset class UnitsItems at start of year (quantity)
Items at end of year (quantity) Net change
Data accuracy(1–4)
9 All Overhead Line Concrete poles / steel structure No. 8,461 8,694 233 3 10 All Overhead Line Wood poles No. 2,614 2,419 (195) 2 11 All Overhead Line Other pole types No. – N/A 12 HV Subtransmission Line Subtransmission OH up to 66kV conductor km – N/A 13 HV Subtransmission Line Subtransmission OH 110kV+ conductor km – N/A 14 HV Subtransmission Cable Subtransmission UG up to 66kV (XLPE) km – N/A 15 HV Subtransmission Cable Subtransmission UG up to 66kV (Oil pressurised) km – N/A 16 HV Subtransmission Cable Subtransmission UG up to 66kV (Gas pressurised) km – N/A 17 HV Subtransmission Cable Subtransmission UG up to 66kV (PILC) km – N/A 18 HV Subtransmission Cable Subtransmission UG 110kV+ (XLPE) km – N/A 19 HV Subtransmission Cable Subtransmission UG 110kV+ (Oil pressurised) km – N/A 20 HV Subtransmission Cable Subtransmission UG 110kV+ (Gas Pressurised) km – N/A 21 HV Subtransmission Cable Subtransmission UG 110kV+ (PILC) km – N/A 22 HV Subtransmission Cable Subtransmission submarine cable km – N/A 23 HV Zone substation Buildings Zone substations up to 66kV No. – N/A 24 HV Zone substation Buildings Zone substations 110kV+ No. – N/A 25 HV Zone substation switchgear 50/66/110kV CB (Indoor) No. – N/A 26 HV Zone substation switchgear 50/66/110kV CB (Outdoor) No. – N/A 27 HV Zone substation switchgear 33kV Switch (Ground Mounted) No. – N/A 28 HV Zone substation switchgear 33kV Switch (Pole Mounted) No. – N/A 29 HV Zone substation switchgear 33kV RMU No. – N/A 30 HV Zone substation switchgear 22/33kV CB (Indoor) No. – N/A 31 HV Zone substation switchgear 22/33kV CB (Outdoor) No. – N/A 32 HV Zone substation switchgear 3.3/6.6/11/22kV CB (ground mounted) No. – N/A 33 HV Zone substation switchgear 3.3/6.6/11/22kV CB (pole mounted) No. – N/A 34 HV Zone Substation Transformer Zone Substation Transformers No. – N/A 35 HV Distribution Line Distribution OH Open Wire Conductor km 840 834 (6) 3 36 HV Distribution Line Distribution OH Aerial Cable Conductor km – N/A 37 HV Distribution Line SWER conductor km – N/A 38 HV Distribution Cable Distribution UG XLPE or PVC km 15 16 1 3 39 HV Distribution Cable Distribution UG PILC km 2 2 – 3 40 HV Distribution Cable Distribution Submarine Cable km – N/A 41 HV Distribution switchgear 3.3/6.6/11/22kV CB (pole mounted) - reclosers and sectionalisers No. 36 43 7 4 42 HV Distribution switchgear 3.3/6.6/11/22kV CB (Indoor) No. – N/A 43 HV Distribution switchgear 3.3/6.6/11/22kV Switches and fuses (pole mounted) No. 1,679 1,693 14 2 44 HV Distribution switchgear 3.3/6.6/11/22kV Switch (ground mounted) - except RMU No. – N/A 45 HV Distribution switchgear 3.3/6.6/11/22kV RMU No. 16 16 – 4 46 HV Distribution Transformer Pole Mounted Transformer No. 1,336 1,344 8 3 47 HV Distribution Transformer Ground Mounted Transformer No. 116 120 4 2 48 HV Distribution Transformer Voltage regulators No. 1 1 – 2 49 HV Distribution Substations Ground Mounted Substation Housing No. 40 40 – 3 50 LV LV Line LV OH Conductor km 111 108 (3) 2 51 LV LV Cable LV UG Cable km 77 78 1 3 52 LV LV Street lighting LV OH/UG Streetlight circuit km – N/A 53 LV Connections OH/UG consumer service connections No. 6,680 6,717 37 2 54 All Protection Protection relays (electromechanical, solid state and numeric) No. – N/A 55 All SCADA and communications SCADA and communications equipment operating as a single system Lot 1 1 – 3 56 All Capacitor Banks Capacitors including controls No – N/A 57 All Load Control Centralised plant Lot – N/A 58 All Load Control Relays No – N/A 59 All Civils Cable Tunnels km – N/A
This schedule requires a summary of the quantity of assets that make up the network, by asset category and asset class. All units relating to cable and line assets, that are expressed in km, refer to circuit lengths.
Scanpower Limited31 March 2021
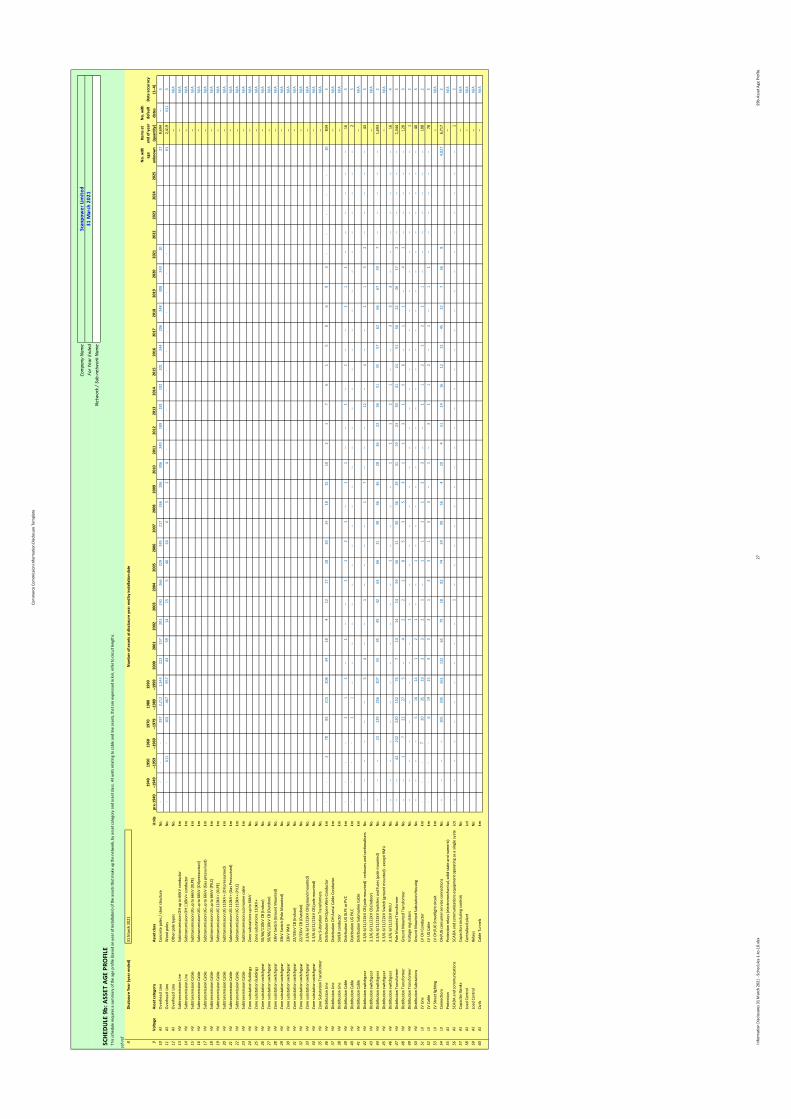
Com
mer
ce C
omm
issio
n In
form
atio
n Di
sclo
sure
Tem
plat
e
Info
rmat
ion
Disc
losu
res 3
1 M
arch
202
1 - S
ched
ules
-1-to
-10.
xlsx
27S9
b.As
set A
ge P
rofil
e
Com
pany
Nam
eFo
r Yea
r End
edN
etw
ork
/ Su
b-ne
twor
k N
ame
SCHE
DULE
9b:
ASS
ET A
GE P
ROFI
LE
sch
ref
8Di
sclo
sure
Yea
r (ye
ar e
nded
)31
Mar
ch 2
021
9Vo
ltage
Asse
t cat
egor
yAs
set c
lass
Uni
tspr
e-19
4019
40–1
949
1950
–195
919
60–1
969
1970
–197
919
80–1
989
1990
–199
920
0020
0120
0220
0320
0420
0520
0620
0720
0820
0920
1020
1120
1220
1320
1420
1520
1620
1720
1820
1920
2020
2120
2220
2320
2420
25
No.
with
ag
e un
know
n
Item
s at
end
of y
ear
(qua
ntity
)
No.
with
defa
ult
date
sDa
ta a
ccur
acy
(1–4
)10
All
Ove
rhea
d Li
neCo
ncre
te p
oles
/ st
eel s
truct
ure
No.
- -
- -
297
2,2
12 1
,344
222
157
201
241
266
229
245
217
266
196
306
249
189
181
192
201
244
206
248
308
240
10
27
8,6
94 –
311
All
Ove
rhea
d Li
neW
ood
pole
sNo
. -
- 6
11 -
102
467
957
43
59
14
15
5 4
6 2
4 6
3 2
4 -
- -
- -
- -
- -
- -
61
2,4
19 6
113
12Al
lO
verh
ead
Line
Oth
er p
ole
type
sNo
. –
N/A
13HV
Subt
rans
miss
ion
Line
Subt
rans
miss
ion
OH
up to
66k
V co
nduc
tor
km –
N/A
14HV
Subt
rans
miss
ion
Line
Subt
rans
miss
ion
OH
110k
V+ co
nduc
tor
km –
N/A
15HV
Subt
rans
miss
ion
Cabl
eSu
btra
nsm
issio
n UG
up
to 6
6kV
(XLP
E)km
–N/
A16
HVSu
btra
nsm
issio
n Ca
ble
Subt
rans
miss
ion
UG u
p to
66k
V (O
il pre
ssur
ised)
km –
N/A
17HV
Subt
rans
miss
ion
Cabl
eSu
btra
nsm
issio
n UG
up
to 6
6kV
(Gas
pre
ssur
ised)
km –
N/A
18HV
Subt
rans
miss
ion
Cabl
eSu
btra
nsm
issio
n UG
up
to 6
6kV
(PIL
C)km
–N/
A19
HVSu
btra
nsm
issio
n Ca
ble
Subt
rans
miss
ion
UG 1
10kV
+ (X
LPE)
km –
N/A
20HV
Subt
rans
miss
ion
Cabl
eSu
btra
nsm
issio
n UG
110
kV+
(Oil p
ress
urise
d)km
–N/
A21
HVSu
btra
nsm
issio
n Ca
ble
Subt
rans
miss
ion
UG 1
10kV
+ (G
as P
ress
urise
d)km
–N/
A22
HVSu
btra
nsm
issio
n Ca
ble
Subt
rans
miss
ion
UG 1
10kV
+ (P
ILC)
km –
N/A
23HV
Subt
rans
miss
ion
Cabl
eSu
btra
nsm
issio
n su
bmar
ine
cabl
ekm
–N/
A24
HVZo
ne su
bsta
tion
Build
ings
Zo
ne su
bsta
tions
up
to 6
6kV
No.
–N/
A25
HVZo
ne su
bsta
tion
Build
ings
Zo
ne su
bsta
tions
110
kV+
No.
–N/
A26
HVZo
ne su
bsta
tion
switc
hgea
r 50
/66/
110k
V CB
(Ind
oor)
No.
–N/
A27
HVZo
ne su
bsta
tion
switc
hgea
r 50
/66/
110k
V CB
(Out
door
)No
. –
N/A
28HV
Zone
subs
tatio
n sw
itchg
ear
33kV
Sw
itch
(Gro
und
Mou
nted
)No
. –
N/A
29HV
Zone
subs
tatio
n sw
itchg
ear
33kV
Sw
itch
(Pol
e M
ount
ed)
No.
–N/
A30
HVZo
ne su
bsta
tion
switc
hgea
r 33
kV R
MU
No.
–N/
A31
HVZo
ne su
bsta
tion
switc
hgea
r 22
/33k
V CB
(Ind
oor)
No.
–N/
A32
HVZo
ne su
bsta
tion
switc
hgea
r 22
/33k
V CB
(Out
door
)No
. –
N/A
33HV
Zone
subs
tatio
n sw
itchg
ear
3.3/
6.6/
11/2
2kV
CB (g
roun
d m
ount
ed)
No.
–N/
A34
HVZo
ne su
bsta
tion
switc
hgea
r 3.
3/6.
6/11
/22k
V CB
(pol
e m
ount
ed)
No.
–N/
A35
HVZo
ne S
ubst
atio
n Tr
ansf
orm
er
Zone
Sub
stat
ion
Tran
sfor
mer
sNo
. –
N/A
36HV
Dist
ribut
ion
Line
Dist
ribut
ion
OH
Ope
n W
ire C
ondu
ctor
km -
- 2
78
83
215
208
34
18
4 1
2 1
7 1
8 3
0 1
4 1
8 1
5 1
0 2
1 7
6 1
5 8
6 9
3 -
- -
- -
10
834
337
HVDi
strib
utio
n Lin
eDi
strib
utio
n O
H Ae
rial C
able
Con
duct
orkm
–N/
A38
HVDi
strib
utio
n Lin
eSW
ER co
nduc
tor
km –
N/A
39HV
Dist
ribut
ion
Cabl
eDi
strib
utio
n UG
XLP
E or
PVC
km -
- -
- 1
1 1
– 1
– –
1 1
2 1
– 1
1 –
– 1
– 1
– –
1 1
1 –
– –
– –
– 1
63
40HV
Dist
ribut
ion
Cabl
eDi
strib
utio
n UG
PIL
Ckm
- -
- -
1 1
– –
– –
– –
– –
– –
– –
– –
– –
– –
– –
– –
– –
– –
– –
23
41HV
Dist
ribut
ion
Cabl
eDi
strib
utio
n Su
bmar
ine
Cabl
ekm
–N/
A42
HVDi
strib
utio
n sw
itchg
ear
3.3/
6.6/
11/2
2kV
CB (p
ole
mou
nted
) - re
close
rs a
nd se
ctio
nalis
ers
No.
– –
– –
– –
5 4
– –
1 –
– –
– 1
7 –
– –
12
– 4
– –
1 1
5 2
– –
– –
– 4
33
43HV
Dist
ribut
ion
switc
hgea
r 3.
3/6.
6/11
/22k
V CB
(Ind
oor)
No.
–N/
A44
HVDi
strib
utio
n sw
itchg
ear
3.3/
6.6/
11/2
2kV
Switc
hes a
nd fu
ses (
pole
mou
nted
)No
. –
– –
23
129
256
307
55
45
49
42
63
66
31
38
46
36
28
26
23
36
51
35
57
62
66
67
49
7 –
– –
– –
1,6
932
45HV
Dist
ribut
ion
switc
hgea
r 3.
3/6.
6/11
/22k
V Sw
itch
(gro
und
mou
nted
) - e
xcep
t RM
UNo
. –
N/A
46HV
Dist
ribut
ion
switc
hgea
r 3.
3/6.
6/11
/22k
V RM
UNo
. –
– –
– –
– –
– –
– –
– 1
– –
– –
1 1
1 2
1 –
– 3
3 3
– –
– –
– –
– 1
64
47HV
Dist
ribut
ion
Tran
sfor
mer
Pole
Mou
nted
Tra
nsfo
rmer
No.
– –
42
242
220
152
76
7 1
4 1
4 1
4 5
9 5
6 2
1 3
0 3
6 1
9 3
1 1
9 2
3 3
0 4
1 2
4 5
1 5
6 2
2 2
6 1
7 2
– –
– –
– 1
,344
348
HVDi
strib
utio
n Tr
ansf
orm
erGr
ound
Mou
nted
Tra
nsfo
rmer
No.
– –
1 7
22
27
5 –
4 2
2 2
8 5
3 5
3 1
1 3
1 5
6 –
1 1
– 4
1 –
– –
– –
120
349
HVDi
strib
utio
n Tr
ansf
orm
er
Volta
ge re
gula
tors
No.
– –
– –
– –
– –
– 1
– –
– –
– –
– –
– –
– –
– –
– –
– –
– –
– –
– –
12
50HV
Dist
ribut
ion
Subs
tatio
nsGr
ound
Mou
nted
Sub
stat
ion
Hous
ing
No.
– –
– –
5 1
6 1
4 1
2 1
– –
1 –
– –
– –
– –
– –
– –
– –
– –
– –
– –
– –
40
351
LVLV
Line
LV O
H Co
nduc
tor
km -
- -
7 2
0 3
5 1
9 3
3 2
1 –
1 1
1 1
2 3
– –
1 1
2 1
2 1
1 –
– –
– –
– –
108
252
LVLV
Cab
leLV
UG
Cabl
ekm
- -
- -
6 1
9 1
5 4
3 3
1 4
3 1
5 3
– 1
– 3
1 1
2 –
1 –
1 1
– –
– –
– –
78
353
LVLV
Stre
et lig
htin
gLV
OH/
UG S
treet
light
circ
uit
km –
N/A
54LV
Conn
ectio
nsO
H/UG
cons
umer
serv
ice co
nnec
tions
No.
– –
– –
105
335
561
132
65
79
18
82
74
24
99
56
4 2
9 4
51
14
16
12
12
45
22
7 3
6 8
4,8
27 6
,717
255
All
Prot
ectio
nPr
otec
tion
rela
ys (e
lect
rom
echa
nica
l, sol
id st
ate
and
num
eric)
No.
–N/
A56
All
SCAD
A an
d co
mm
unica
tions
SCAD
A an
d co
mm
unica
tions
equ
ipm
ent o
pera
ting
as a
sing
le sy
stem
Lot
– –
– –
– –
– –
– –
1 –
– –
– –
– –
– –
– –
– –
– –
– –
– –
– –
– –
13
57Al
lCa
pacit
or B
anks
Capa
citor
s inc
ludi
ng co
ntro
lsNo
–N/
A58
All
Load
Con
trol
Cent
ralis
ed p
lant
Lot
–N/
A59
All
Load
Con
trol
Rela
ysNo
–N/
A60
All
Civi
lsCa
ble
Tunn
els
km –
N/A
This
sche
dule
requ
ires a
sum
mar
y of
the
age
prof
ile (b
ased
on
year
of i
nsta
llatio
n) o
f the
ass
ets t
hat m
ake
up th
e ne
twor
k, b
y as
set c
ateg
ory
and
asse
t cla
ss. A
ll uni
ts re
latin
g to
cabl
e an
d lin
e as
sets
, tha
t are
exp
ress
ed in
km
, ref
er to
circ
uit l
engt
hs.
Scan
pow
er Li
mite
d31
Mar
ch 2
021
Num
ber o
f ass
ets a
t disc
losu
re y
ear e
nd b
y in
stal
latio
n da
te
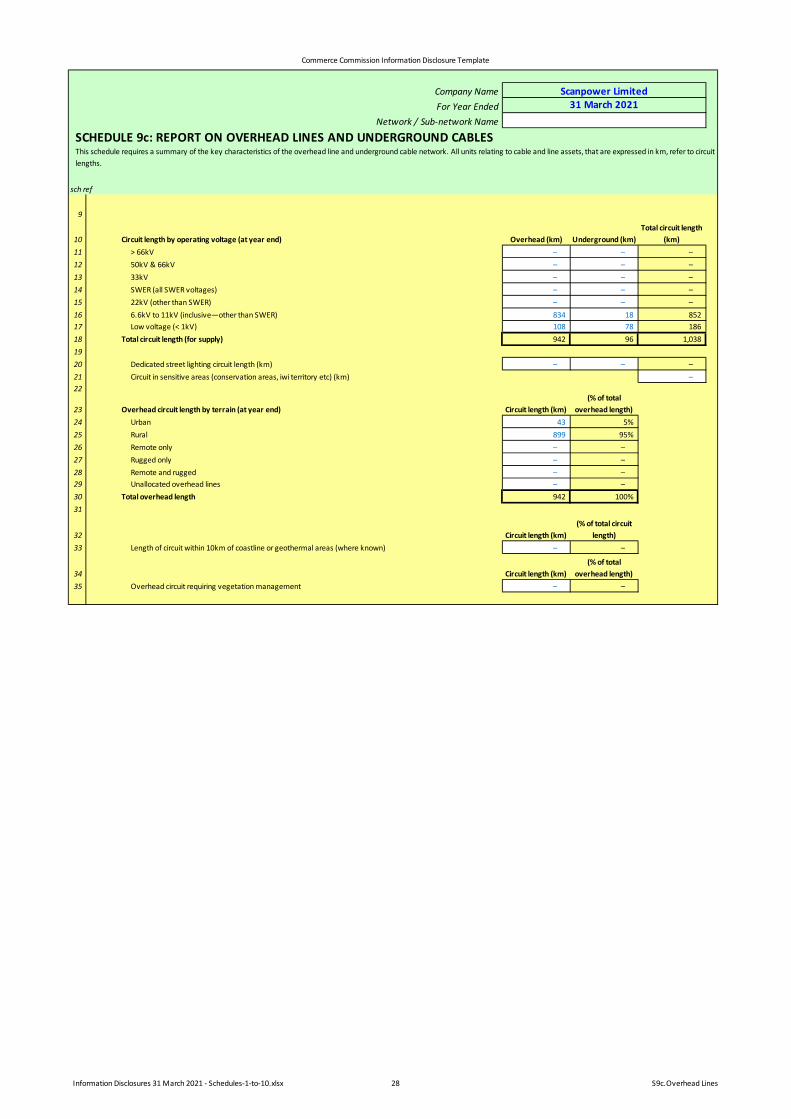
Commerce Commission Information Disclosure Template
Information Disclosures 31 March 2021 - Schedules-1-to-10.xlsx 28 S9c.Overhead Lines
Company NameFor Year Ended
Network / Sub-network Name
SCHEDULE 9c: REPORT ON OVERHEAD LINES AND UNDERGROUND CABLES
sch ref
9
10 Circuit length by operating voltage (at year end) Overhead (km) Underground (km)Total circuit length
(km)11 > 66kV – – –12 50kV & 66kV – – –13 33kV – – –14 SWER (all SWER voltages) – – –15 22kV (other than SWER) – – –16 6.6kV to 11kV (inclusive—other than SWER) 834 18 85217 Low voltage (< 1kV) 108 78 18618 Total circuit length (for supply) 942 96 1,0381920 Dedicated street lighting circuit length (km) – – –21 Circuit in sensitive areas (conservation areas, iwi territory etc) (km) –22
23 Overhead circuit length by terrain (at year end) Circuit length (km)(% of total
overhead length)24 Urban 43 5%25 Rural 899 95%26 Remote only – –27 Rugged only – –28 Remote and rugged – –29 Unallocated overhead lines – –30 Total overhead length 942 100%31
32 Circuit length (km)(% of total circuit
length)33 Length of circuit within 10km of coastline or geothermal areas (where known) – –
34 Circuit length (km)(% of total
overhead length)35 Overhead circuit requiring vegetation management – –
This schedule requires a summary of the key characteristics of the overhead line and underground cable network. All units relating to cable and line assets, that are expressed in km, refer to circuit lengths.
Scanpower Limited31 March 2021
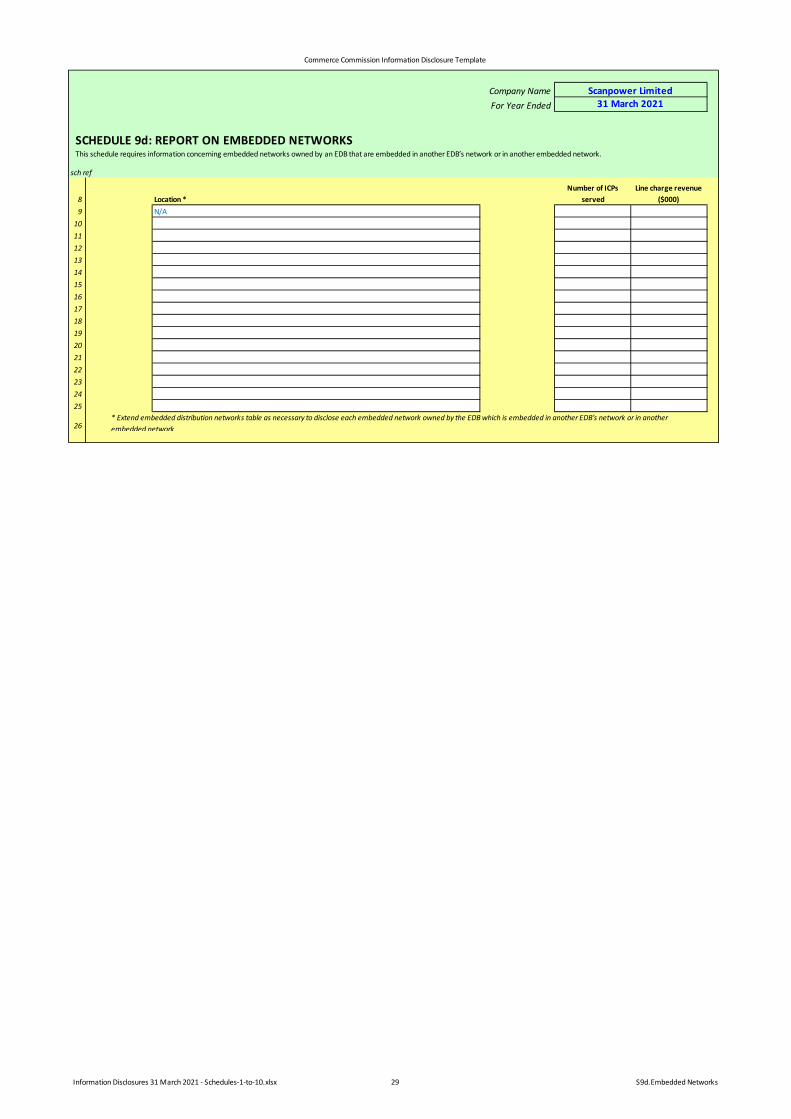
Commerce Commission Information Disclosure Template
Information Disclosures 31 March 2021 - Schedules-1-to-10.xlsx 29 S9d.Embedded Networks
Company NameFor Year Ended
sch ref
8 Location *Number of ICPs
servedLine charge revenue
($000)9
10111213141516171819202122232425
26
Scanpower Limited31 March 2021
* Extend embedded distribution networks table as necessary to disclose each embedded network owned by the EDB which is embedded in another EDB’s network or in another embedded network
SCHEDULE 9d: REPORT ON EMBEDDED NETWORKS
N/A
This schedule requires information concerning embedded networks owned by an EDB that are embedded in another EDB’s network or in another embedded network.
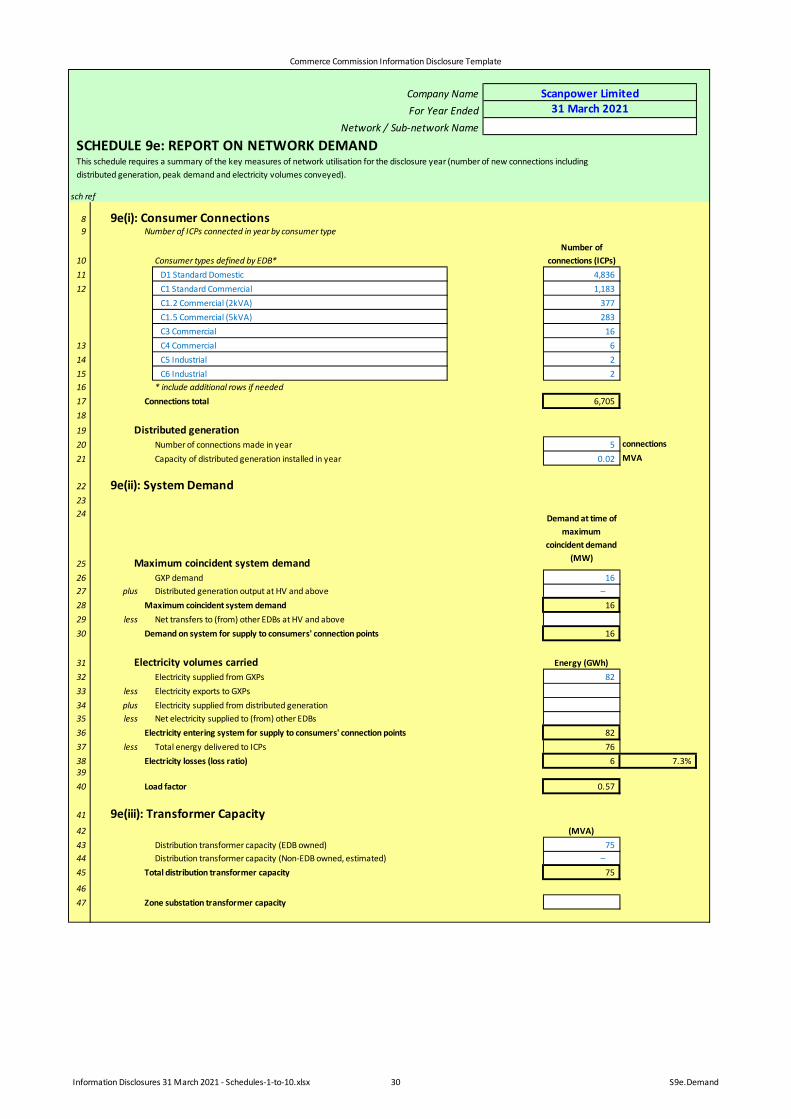
Commerce Commission Information Disclosure Template
Information Disclosures 31 March 2021 - Schedules-1-to-10.xlsx 30 S9e.Demand
Company NameFor Year Ended
Network / Sub-network Name
SCHEDULE 9e: REPORT ON NETWORK DEMAND
sch ref
8 9e(i): Consumer Connections9 Number of ICPs connected in year by consumer type
10 Consumer types defined by EDB*Number of
connections (ICPs)11 D1 Standard Domestic 4,83612 C1 Standard Commercial 1,183
C1.2 Commercial (2kVA) 377C1.5 Commercial (5kVA) 283C3 Commercial 16
13 C4 Commercial 614 C5 Industrial 215 C6 Industrial 216 * include additional rows if needed17 Connections total 6,70518
19 Distributed generation20 Number of connections made in year 5 connections
21 Capacity of distributed generation installed in year 0.02 MVA
22 9e(ii): System Demand2324
25 Maximum coincident system demand26 GXP demand 1627 plus Distributed generation output at HV and above –28 Maximum coincident system demand 1629 less Net transfers to (from) other EDBs at HV and above30 Demand on system for supply to consumers' connection points 16
31 Electricity volumes carried Energy (GWh)32 Electricity supplied from GXPs 8233 less Electricity exports to GXPs34 plus Electricity supplied from distributed generation35 less Net electricity supplied to (from) other EDBs36 Electricity entering system for supply to consumers' connection points 8237 less Total energy delivered to ICPs 7638 Electricity losses (loss ratio) 6 7.3%3940 Load factor 0.57
41 9e(iii): Transformer Capacity42 (MVA)43 Distribution transformer capacity (EDB owned) 7544 Distribution transformer capacity (Non-EDB owned, estimated) –45 Total distribution transformer capacity 75
4647 Zone substation transformer capacity
Demand at time of maximum
coincident demand (MW)
Scanpower Limited31 March 2021
This schedule requires a summary of the key measures of network utilisation for the disclosure year (number of new connections including distributed generation, peak demand and electricity volumes conveyed).
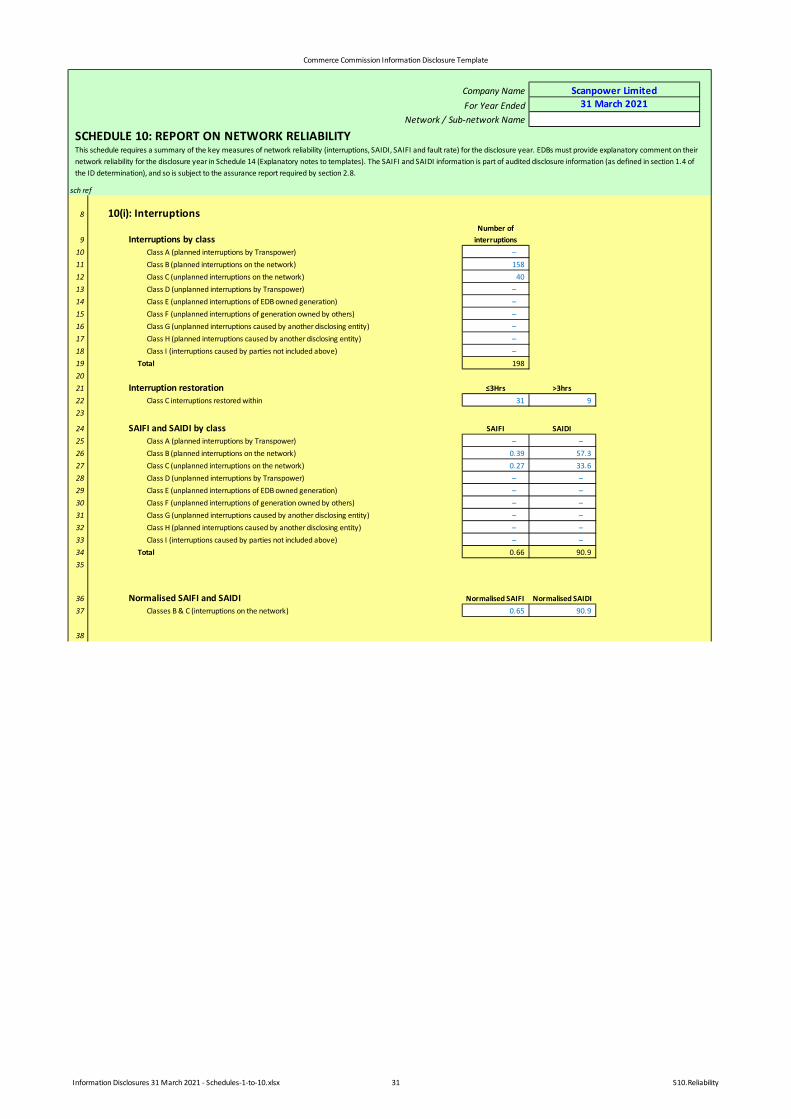
Commerce Commission Information Disclosure Template
Information Disclosures 31 March 2021 - Schedules-1-to-10.xlsx 31 S10.Reliability
Company NameFor Year Ended
Network / Sub-network Name
SCHEDULE 10: REPORT ON NETWORK RELIABILITY
sch ref
8 10(i): Interruptions
9 Interruptions by classNumber of
interruptions10 Class A (planned interruptions by Transpower) –11 Class B (planned interruptions on the network) 15812 Class C (unplanned interruptions on the network) 4013 Class D (unplanned interruptions by Transpower) –14 Class E (unplanned interruptions of EDB owned generation) –15 Class F (unplanned interruptions of generation owned by others) –16 Class G (unplanned interruptions caused by another disclosing entity) –17 Class H (planned interruptions caused by another disclosing entity) –18 Class I (interruptions caused by parties not included above) –19 Total 1982021 Interruption restoration ≤3Hrs >3hrs22 Class C interruptions restored within 31 923
24 SAIFI and SAIDI by class SAIFI SAIDI25 Class A (planned interruptions by Transpower) – –26 Class B (planned interruptions on the network) 0.39 57.327 Class C (unplanned interruptions on the network) 0.27 33.628 Class D (unplanned interruptions by Transpower) – –29 Class E (unplanned interruptions of EDB owned generation) – –30 Class F (unplanned interruptions of generation owned by others) – –31 Class G (unplanned interruptions caused by another disclosing entity) – –32 Class H (planned interruptions caused by another disclosing entity) – –33 Class I (interruptions caused by parties not included above) – –34 Total 0.66 90.935
36 Normalised SAIFI and SAIDI Normalised SAIFI Normalised SAIDI37 Classes B & C (interruptions on the network) 0.65 90.9
38
Scanpower Limited31 March 2021
This schedule requires a summary of the key measures of network reliability (interruptions, SAIDI, SAIFI and fault rate) for the disclosure year. EDBs must provide explanatory comment on their network reliability for the disclosure year in Schedule 14 (Explanatory notes to templates). The SAIFI and SAIDI information is part of audited disclosure information (as defined in section 1.4 of the ID determination), and so is subject to the assurance report required by section 2.8.
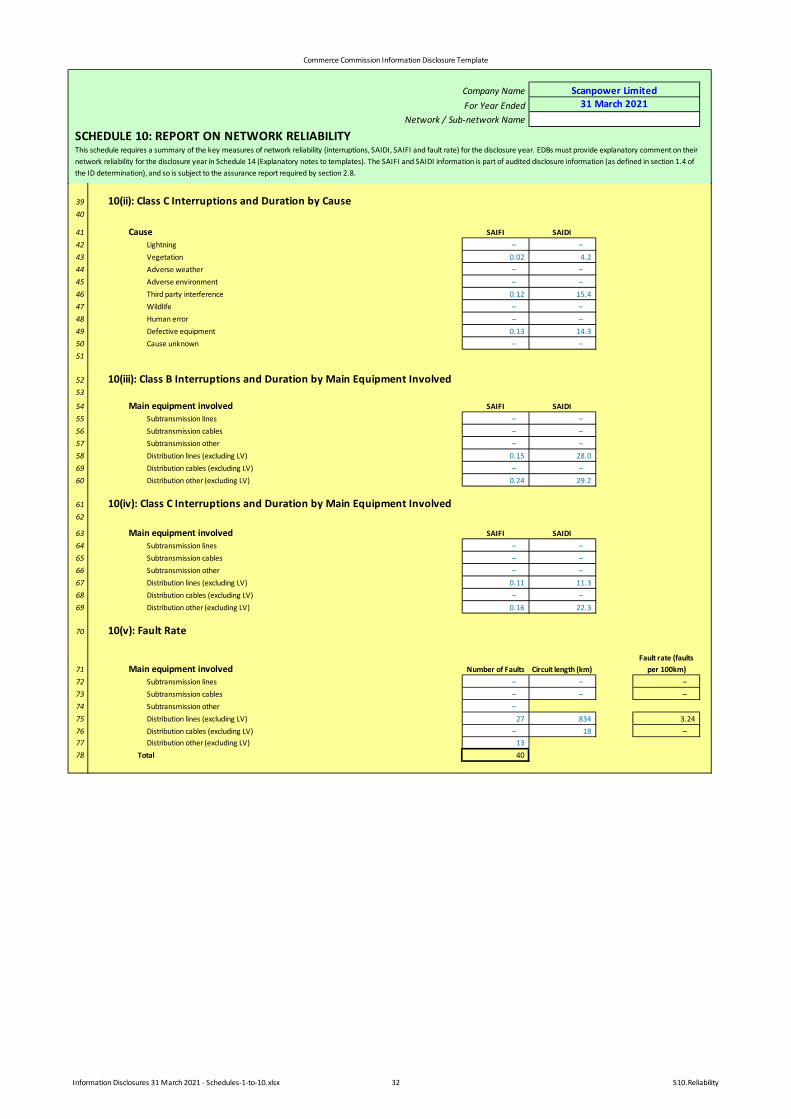
Commerce Commission Information Disclosure Template
Information Disclosures 31 March 2021 - Schedules-1-to-10.xlsx 32 S10.Reliability
Company NameFor Year Ended
Network / Sub-network Name
SCHEDULE 10: REPORT ON NETWORK RELIABILITY
Scanpower Limited31 March 2021
This schedule requires a summary of the key measures of network reliability (interruptions, SAIDI, SAIFI and fault rate) for the disclosure year. EDBs must provide explanatory comment on their network reliability for the disclosure year in Schedule 14 (Explanatory notes to templates). The SAIFI and SAIDI information is part of audited disclosure information (as defined in section 1.4 of the ID determination), and so is subject to the assurance report required by section 2.8.
39 10(ii): Class C Interruptions and Duration by Cause40
41 Cause SAIFI SAIDI42 Lightning – –43 Vegetation 0.02 4.244 Adverse weather – –45 Adverse environment – –46 Third party interference 0.12 15.447 Wildlife – –48 Human error – –49 Defective equipment 0.13 14.350 Cause unknown – –51
52 10(iii): Class B Interruptions and Duration by Main Equipment Involved53
54 Main equipment involved SAIFI SAIDI55 Subtransmission lines – –56 Subtransmission cables – –57 Subtransmission other – –58 Distribution lines (excluding LV) 0.15 28.069 Distribution cables (excluding LV) – –60 Distribution other (excluding LV) 0.24 29.2
61 10(iv): Class C Interruptions and Duration by Main Equipment Involved62
63 Main equipment involved SAIFI SAIDI64 Subtransmission lines – –65 Subtransmission cables – –66 Subtransmission other – –67 Distribution lines (excluding LV) 0.11 11.368 Distribution cables (excluding LV) – –69 Distribution other (excluding LV) 0.16 22.3
70 10(v): Fault Rate
71 Main equipment involved Number of Faults Circuit length (km)Fault rate (faults
per 100km)72 Subtransmission lines – – –73 Subtransmission cables – – –74 Subtransmission other –75 Distribution lines (excluding LV) 27 834 3.2476 Distribution cables (excluding LV) – 18 –77 Distribution other (excluding LV) 1378 Total 40
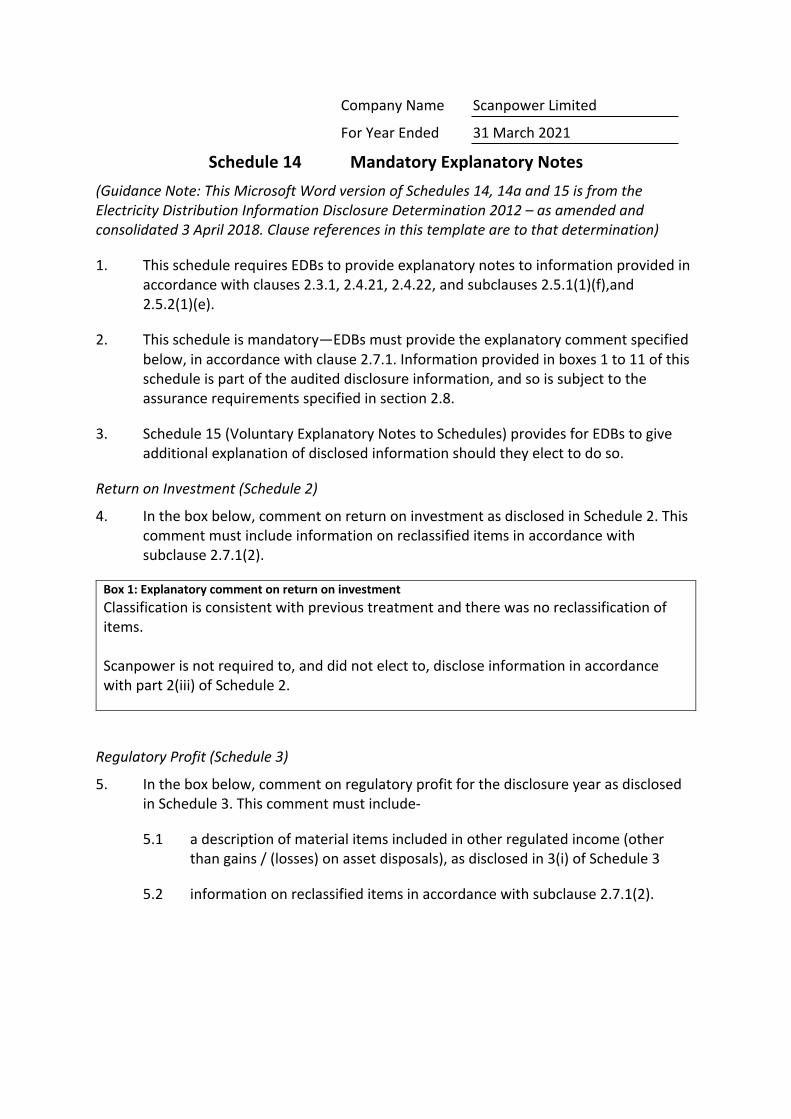
Company Name Scanpower Limited
For Year Ended 31 March 2021
Schedule 14 Mandatory Explanatory Notes (Guidance Note: This Microsoft Word version of Schedules 14, 14a and 15 is from the Electricity Distribution Information Disclosure Determination 2012 – as amended and consolidated 3 April 2018. Clause references in this template are to that determination)
1. This schedule requires EDBs to provide explanatory notes to information provided in accordance with clauses 2.3.1, 2.4.21, 2.4.22, and subclauses 2.5.1(1)(f),and 2.5.2(1)(e).
2. This schedule is mandatory—EDBs must provide the explanatory comment specified below, in accordance with clause 2.7.1. Information provided in boxes 1 to 11 of this schedule is part of the audited disclosure information, and so is subject to the assurance requirements specified in section 2.8.
3. Schedule 15 (Voluntary Explanatory Notes to Schedules) provides for EDBs to give additional explanation of disclosed information should they elect to do so.
Return on Investment (Schedule 2)
4. In the box below, comment on return on investment as disclosed in Schedule 2. This comment must include information on reclassified items in accordance with subclause 2.7.1(2).
Box 1: Explanatory comment on return on investment Classification is consistent with previous treatment and there was no reclassification of items. Scanpower is not required to, and did not elect to, disclose information in accordance with part 2(iii) of Schedule 2.
Regulatory Profit (Schedule 3)
5. In the box below, comment on regulatory profit for the disclosure year as disclosed in Schedule 3. This comment must include-
5.1 a description of material items included in other regulated income (other than gains / (losses) on asset disposals), as disclosed in 3(i) of Schedule 3
5.2 information on reclassified items in accordance with subclause 2.7.1(2).
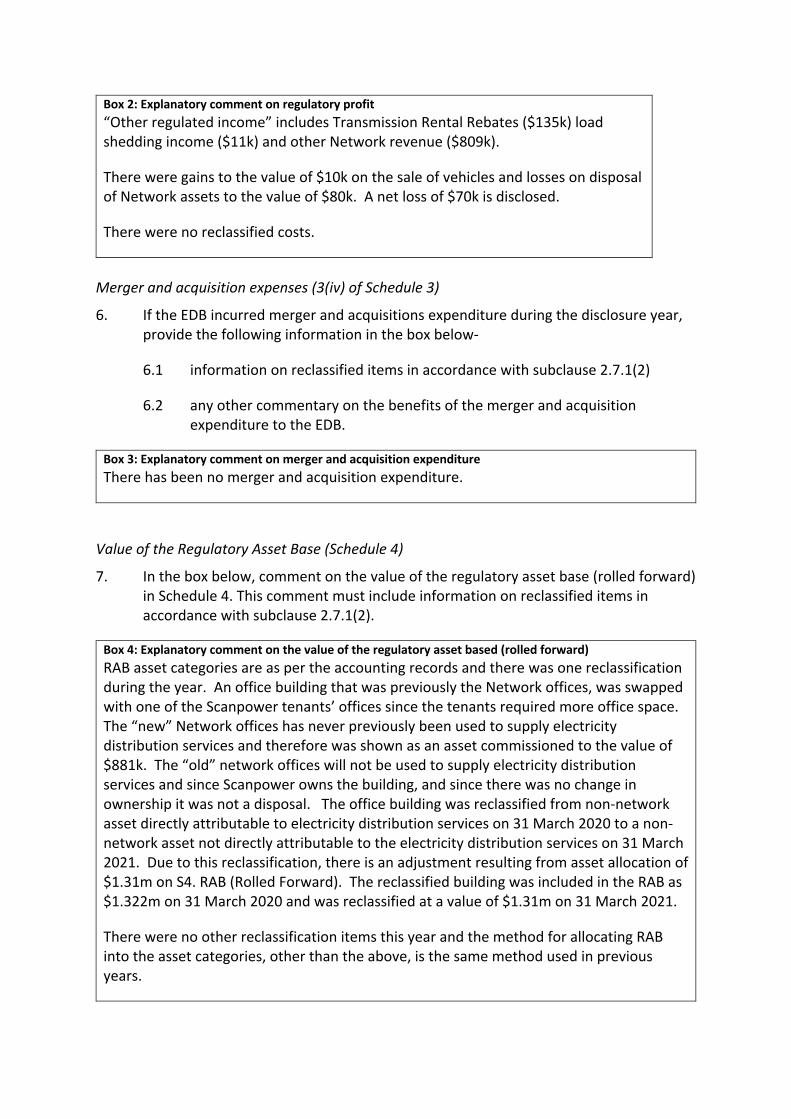
Box 2: Explanatory comment on regulatory profit “Other regulated income” includes Transmission Rental Rebates ($135k) load shedding income ($11k) and other Network revenue ($809k).
There were gains to the value of $10k on the sale of vehicles and losses on disposal of Network assets to the value of $80k. A net loss of $70k is disclosed.
There were no reclassified costs.
Merger and acquisition expenses (3(iv) of Schedule 3)
6. If the EDB incurred merger and acquisitions expenditure during the disclosure year, provide the following information in the box below-
6.1 information on reclassified items in accordance with subclause 2.7.1(2)
6.2 any other commentary on the benefits of the merger and acquisition expenditure to the EDB.
Box 3: Explanatory comment on merger and acquisition expenditure There has been no merger and acquisition expenditure.
Value of the Regulatory Asset Base (Schedule 4)
7. In the box below, comment on the value of the regulatory asset base (rolled forward) in Schedule 4. This comment must include information on reclassified items in accordance with subclause 2.7.1(2).
Box 4: Explanatory comment on the value of the regulatory asset based (rolled forward) RAB asset categories are as per the accounting records and there was one reclassification during the year. An office building that was previously the Network offices, was swapped with one of the Scanpower tenants’ offices since the tenants required more office space. The “new” Network offices has never previously been used to supply electricity distribution services and therefore was shown as an asset commissioned to the value of $881k. The “old” network offices will not be used to supply electricity distribution services and since Scanpower owns the building, and since there was no change in ownership it was not a disposal. The office building was reclassified from non-network asset directly attributable to electricity distribution services on 31 March 2020 to a non-network asset not directly attributable to the electricity distribution services on 31 March 2021. Due to this reclassification, there is an adjustment resulting from asset allocation of $1.31m on S4. RAB (Rolled Forward). The reclassified building was included in the RAB as $1.322m on 31 March 2020 and was reclassified at a value of $1.31m on 31 March 2021.
There were no other reclassification items this year and the method for allocating RAB into the asset categories, other than the above, is the same method used in previous years.
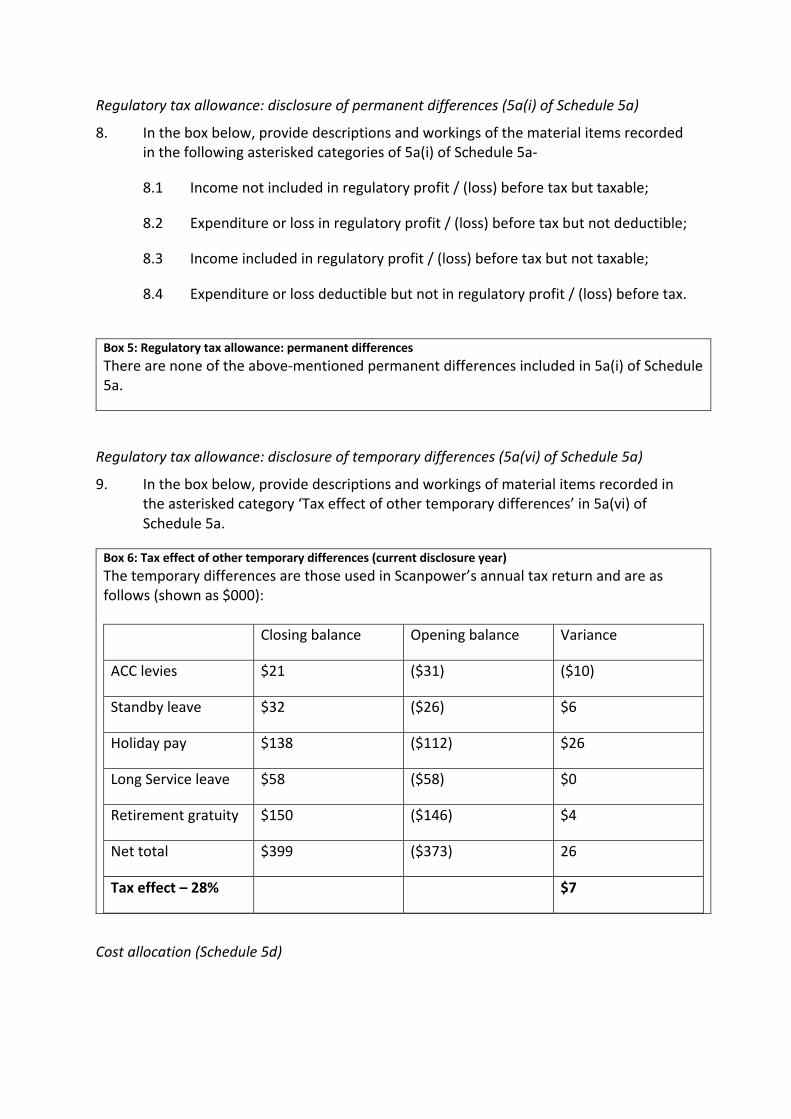
Regulatory tax allowance: disclosure of permanent differences (5a(i) of Schedule 5a)
8. In the box below, provide descriptions and workings of the material items recorded in the following asterisked categories of 5a(i) of Schedule 5a-
8.1 Income not included in regulatory profit / (loss) before tax but taxable;
8.2 Expenditure or loss in regulatory profit / (loss) before tax but not deductible;
8.3 Income included in regulatory profit / (loss) before tax but not taxable;
8.4 Expenditure or loss deductible but not in regulatory profit / (loss) before tax.
Box 5: Regulatory tax allowance: permanent differences There are none of the above-mentioned permanent differences included in 5a(i) of Schedule 5a.
Regulatory tax allowance: disclosure of temporary differences (5a(vi) of Schedule 5a)
9. In the box below, provide descriptions and workings of material items recorded in the asterisked category ‘Tax effect of other temporary differences’ in 5a(vi) of Schedule 5a.
Box 6: Tax effect of other temporary differences (current disclosure year) The temporary differences are those used in Scanpower’s annual tax return and are as follows (shown as $000):
Closing balance Opening balance Variance
ACC levies $21 ($31) ($10)
Standby leave $32 ($26) $6
Holiday pay $138 ($112) $26
Long Service leave $58 ($58) $0
Retirement gratuity $150 ($146) $4
Net total $399 ($373) 26
Tax effect – 28% $7
Cost allocation (Schedule 5d)
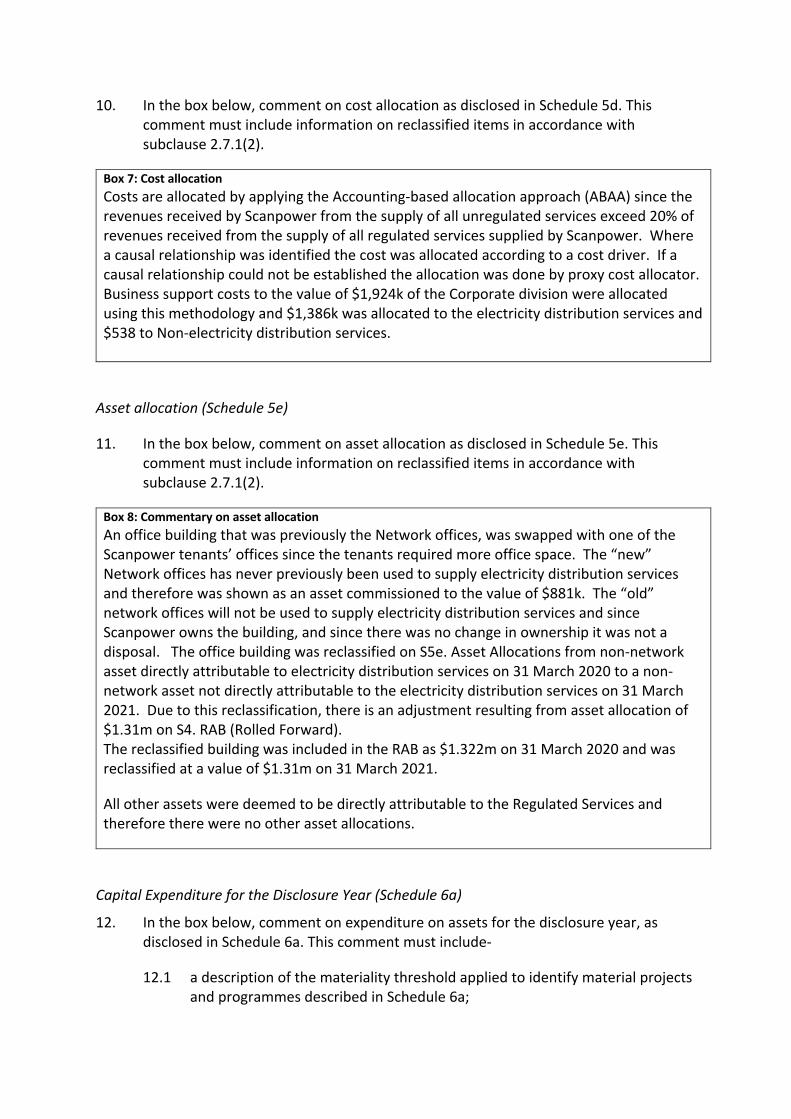
10. In the box below, comment on cost allocation as disclosed in Schedule 5d. This comment must include information on reclassified items in accordance with subclause 2.7.1(2).
Box 7: Cost allocation Costs are allocated by applying the Accounting-based allocation approach (ABAA) since the revenues received by Scanpower from the supply of all unregulated services exceed 20% of revenues received from the supply of all regulated services supplied by Scanpower. Where a causal relationship was identified the cost was allocated according to a cost driver. If a causal relationship could not be established the allocation was done by proxy cost allocator. Business support costs to the value of $1,924k of the Corporate division were allocated using this methodology and $1,386k was allocated to the electricity distribution services and $538 to Non-electricity distribution services.
Asset allocation (Schedule 5e)
11. In the box below, comment on asset allocation as disclosed in Schedule 5e. This comment must include information on reclassified items in accordance with subclause 2.7.1(2).
Box 8: Commentary on asset allocation An office building that was previously the Network offices, was swapped with one of the Scanpower tenants’ offices since the tenants required more office space. The “new” Network offices has never previously been used to supply electricity distribution services and therefore was shown as an asset commissioned to the value of $881k. The “old” network offices will not be used to supply electricity distribution services and since Scanpower owns the building, and since there was no change in ownership it was not a disposal. The office building was reclassified on S5e. Asset Allocations from non-network asset directly attributable to electricity distribution services on 31 March 2020 to a non-network asset not directly attributable to the electricity distribution services on 31 March 2021. Due to this reclassification, there is an adjustment resulting from asset allocation of $1.31m on S4. RAB (Rolled Forward). The reclassified building was included in the RAB as $1.322m on 31 March 2020 and was reclassified at a value of $1.31m on 31 March 2021.
All other assets were deemed to be directly attributable to the Regulated Services and therefore there were no other asset allocations.
Capital Expenditure for the Disclosure Year (Schedule 6a)
12. In the box below, comment on expenditure on assets for the disclosure year, as disclosed in Schedule 6a. This comment must include-
12.1 a description of the materiality threshold applied to identify material projects and programmes described in Schedule 6a;
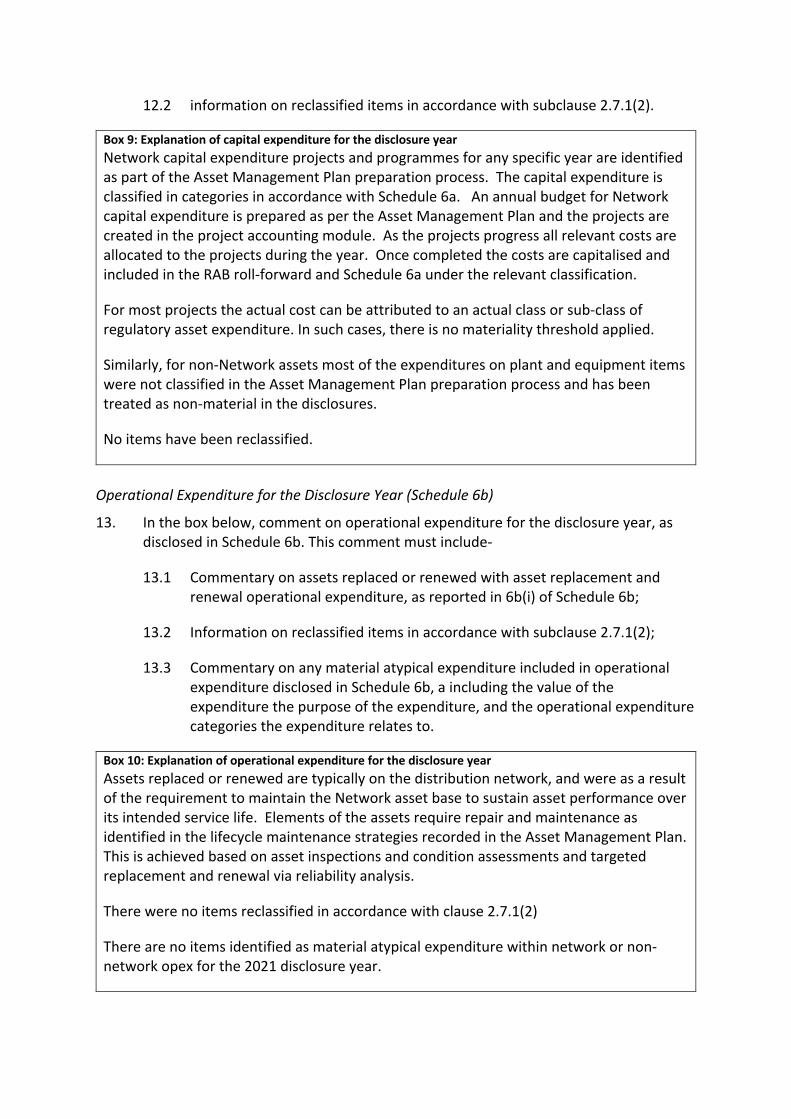
12.2 information on reclassified items in accordance with subclause 2.7.1(2).
Box 9: Explanation of capital expenditure for the disclosure year Network capital expenditure projects and programmes for any specific year are identified as part of the Asset Management Plan preparation process. The capital expenditure is classified in categories in accordance with Schedule 6a. An annual budget for Network capital expenditure is prepared as per the Asset Management Plan and the projects are created in the project accounting module. As the projects progress all relevant costs are allocated to the projects during the year. Once completed the costs are capitalised and included in the RAB roll-forward and Schedule 6a under the relevant classification.
For most projects the actual cost can be attributed to an actual class or sub-class of regulatory asset expenditure. In such cases, there is no materiality threshold applied.
Similarly, for non-Network assets most of the expenditures on plant and equipment items were not classified in the Asset Management Plan preparation process and has been treated as non-material in the disclosures.
No items have been reclassified.
Operational Expenditure for the Disclosure Year (Schedule 6b)
13. In the box below, comment on operational expenditure for the disclosure year, as disclosed in Schedule 6b. This comment must include-
13.1 Commentary on assets replaced or renewed with asset replacement and renewal operational expenditure, as reported in 6b(i) of Schedule 6b;
13.2 Information on reclassified items in accordance with subclause 2.7.1(2);
13.3 Commentary on any material atypical expenditure included in operational expenditure disclosed in Schedule 6b, a including the value of the expenditure the purpose of the expenditure, and the operational expenditure categories the expenditure relates to.
Box 10: Explanation of operational expenditure for the disclosure year Assets replaced or renewed are typically on the distribution network, and were as a result of the requirement to maintain the Network asset base to sustain asset performance over its intended service life. Elements of the assets require repair and maintenance as identified in the lifecycle maintenance strategies recorded in the Asset Management Plan. This is achieved based on asset inspections and condition assessments and targeted replacement and renewal via reliability analysis.
There were no items reclassified in accordance with clause 2.7.1(2)
There are no items identified as material atypical expenditure within network or non-network opex for the 2021 disclosure year.

Variance between forecast and actual expenditure (Schedule 7)
14. In the box below, comment on variance in actual to forecast expenditure for the disclosure year, as reported in Schedule 7. This comment must include information on reclassified items in accordance with subclause 2.7.1(2).
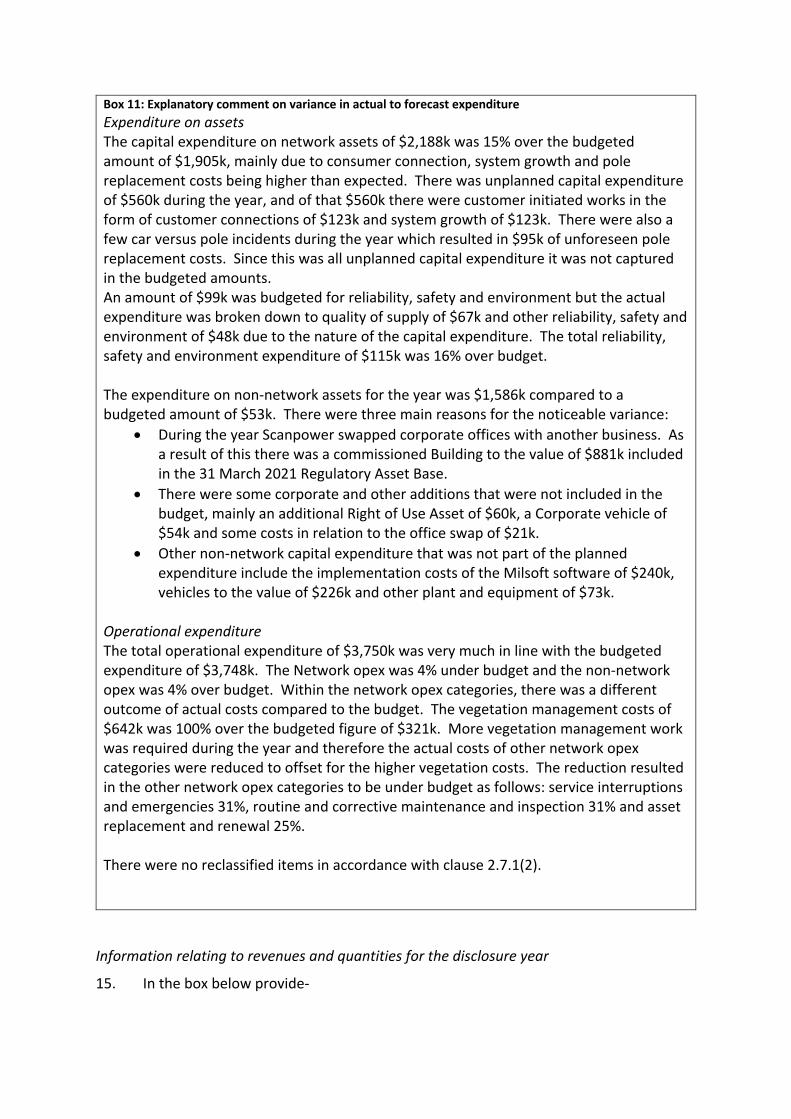
Box 11: Explanatory comment on variance in actual to forecast expenditure Expenditure on assets The capital expenditure on network assets of $2,188k was 15% over the budgeted amount of $1,905k, mainly due to consumer connection, system growth and pole replacement costs being higher than expected. There was unplanned capital expenditure of $560k during the year, and of that $560k there were customer initiated works in the form of customer connections of $123k and system growth of $123k. There were also a few car versus pole incidents during the year which resulted in $95k of unforeseen pole replacement costs. Since this was all unplanned capital expenditure it was not captured in the budgeted amounts. An amount of $99k was budgeted for reliability, safety and environment but the actual expenditure was broken down to quality of supply of $67k and other reliability, safety and environment of $48k due to the nature of the capital expenditure. The total reliability, safety and environment expenditure of $115k was 16% over budget. The expenditure on non-network assets for the year was $1,586k compared to a budgeted amount of $53k. There were three main reasons for the noticeable variance:
• During the year Scanpower swapped corporate offices with another business. As a result of this there was a commissioned Building to the value of $881k included in the 31 March 2021 Regulatory Asset Base.
• There were some corporate and other additions that were not included in the budget, mainly an additional Right of Use Asset of $60k, a Corporate vehicle of $54k and some costs in relation to the office swap of $21k.
• Other non-network capital expenditure that was not part of the planned expenditure include the implementation costs of the Milsoft software of $240k, vehicles to the value of $226k and other plant and equipment of $73k.
Operational expenditure The total operational expenditure of $3,750k was very much in line with the budgeted expenditure of $3,748k. The Network opex was 4% under budget and the non-network opex was 4% over budget. Within the network opex categories, there was a different outcome of actual costs compared to the budget. The vegetation management costs of $642k was 100% over the budgeted figure of $321k. More vegetation management work was required during the year and therefore the actual costs of other network opex categories were reduced to offset for the higher vegetation costs. The reduction resulted in the other network opex categories to be under budget as follows: service interruptions and emergencies 31%, routine and corrective maintenance and inspection 31% and asset replacement and renewal 25%. There were no reclassified items in accordance with clause 2.7.1(2).
Information relating to revenues and quantities for the disclosure year
15. In the box below provide-
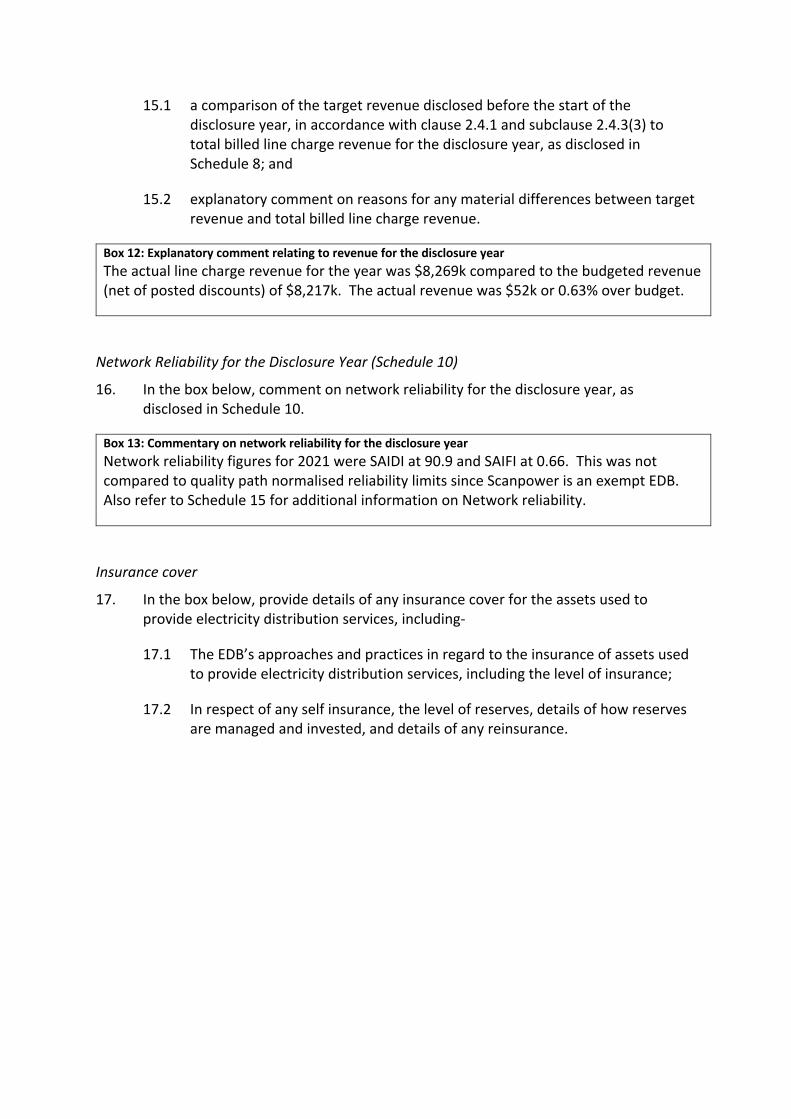
15.1 a comparison of the target revenue disclosed before the start of the disclosure year, in accordance with clause 2.4.1 and subclause 2.4.3(3) to total billed line charge revenue for the disclosure year, as disclosed in Schedule 8; and
15.2 explanatory comment on reasons for any material differences between target revenue and total billed line charge revenue.
Box 12: Explanatory comment relating to revenue for the disclosure year The actual line charge revenue for the year was $8,269k compared to the budgeted revenue (net of posted discounts) of $8,217k. The actual revenue was $52k or 0.63% over budget.
Network Reliability for the Disclosure Year (Schedule 10)
16. In the box below, comment on network reliability for the disclosure year, as disclosed in Schedule 10.
Box 13: Commentary on network reliability for the disclosure year Network reliability figures for 2021 were SAIDI at 90.9 and SAIFI at 0.66. This was not compared to quality path normalised reliability limits since Scanpower is an exempt EDB. Also refer to Schedule 15 for additional information on Network reliability.
Insurance cover
17. In the box below, provide details of any insurance cover for the assets used to provide electricity distribution services, including-
17.1 The EDB’s approaches and practices in regard to the insurance of assets used to provide electricity distribution services, including the level of insurance;
17.2 In respect of any self insurance, the level of reserves, details of how reserves are managed and invested, and details of any reinsurance.
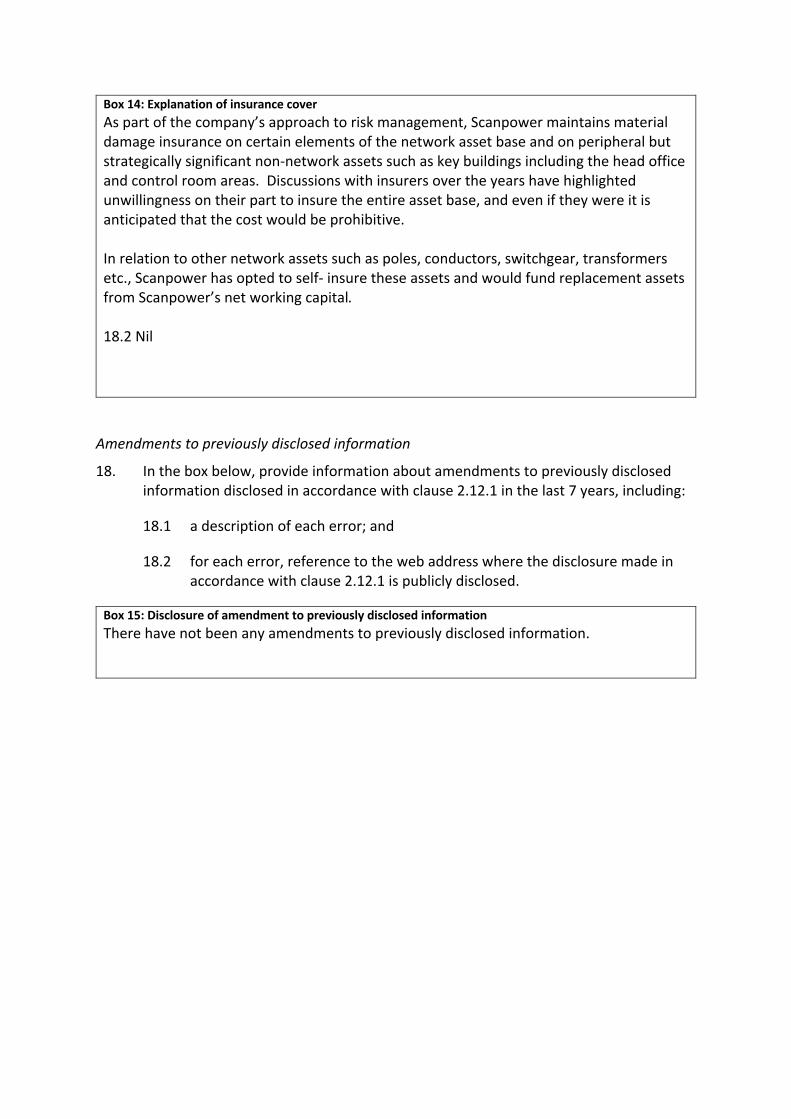
Box 14: Explanation of insurance cover As part of the company’s approach to risk management, Scanpower maintains material damage insurance on certain elements of the network asset base and on peripheral but strategically significant non-network assets such as key buildings including the head office and control room areas. Discussions with insurers over the years have highlighted unwillingness on their part to insure the entire asset base, and even if they were it is anticipated that the cost would be prohibitive. In relation to other network assets such as poles, conductors, switchgear, transformers etc., Scanpower has opted to self- insure these assets and would fund replacement assets from Scanpower’s net working capital. 18.2 Nil
Amendments to previously disclosed information
18. In the box below, provide information about amendments to previously disclosed information disclosed in accordance with clause 2.12.1 in the last 7 years, including:
18.1 a description of each error; and
18.2 for each error, reference to the web address where the disclosure made in accordance with clause 2.12.1 is publicly disclosed.
Box 15: Disclosure of amendment to previously disclosed information There have not been any amendments to previously disclosed information.
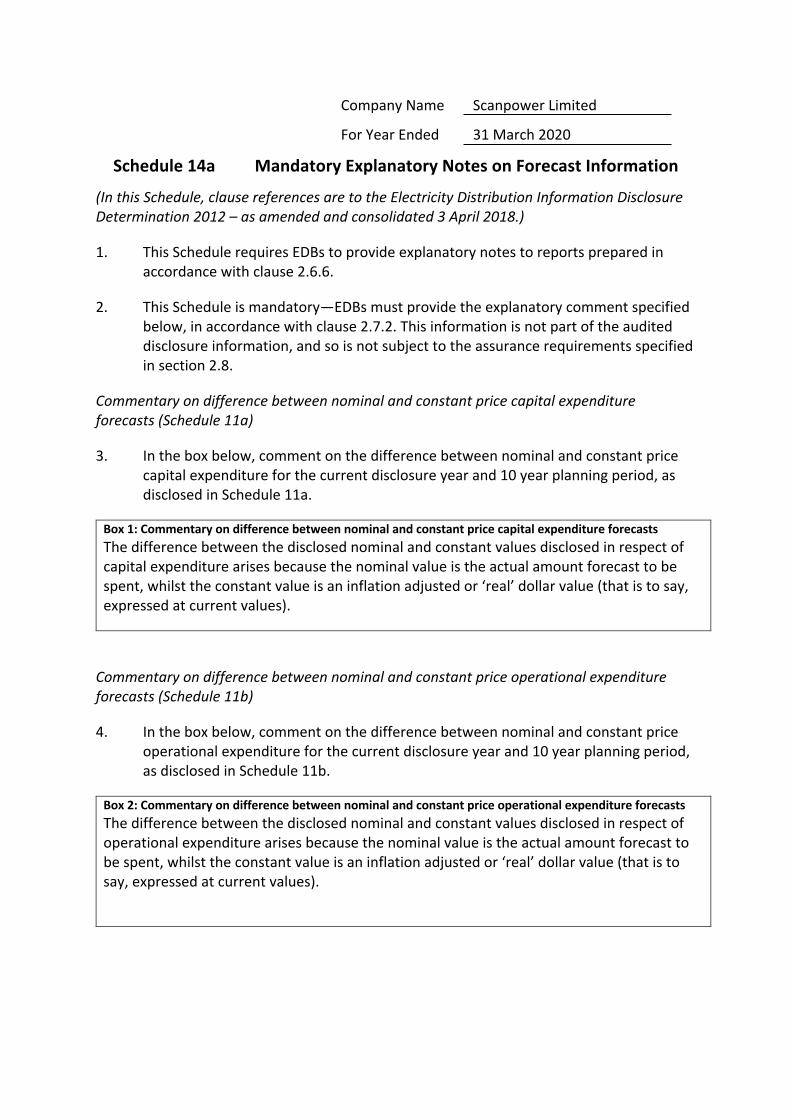
Company Name Scanpower Limited
For Year Ended 31 March 2020
Schedule 14a Mandatory Explanatory Notes on Forecast Information
(In this Schedule, clause references are to the Electricity Distribution Information Disclosure Determination 2012 – as amended and consolidated 3 April 2018.)
1. This Schedule requires EDBs to provide explanatory notes to reports prepared in accordance with clause 2.6.6.
2. This Schedule is mandatory—EDBs must provide the explanatory comment specified below, in accordance with clause 2.7.2. This information is not part of the audited disclosure information, and so is not subject to the assurance requirements specified in section 2.8.
Commentary on difference between nominal and constant price capital expenditure forecasts (Schedule 11a)
3. In the box below, comment on the difference between nominal and constant price capital expenditure for the current disclosure year and 10 year planning period, as disclosed in Schedule 11a.
Box 1: Commentary on difference between nominal and constant price capital expenditure forecasts The difference between the disclosed nominal and constant values disclosed in respect of capital expenditure arises because the nominal value is the actual amount forecast to be spent, whilst the constant value is an inflation adjusted or ‘real’ dollar value (that is to say, expressed at current values).
Commentary on difference between nominal and constant price operational expenditure forecasts (Schedule 11b)
4. In the box below, comment on the difference between nominal and constant price operational expenditure for the current disclosure year and 10 year planning period, as disclosed in Schedule 11b.
Box 2: Commentary on difference between nominal and constant price operational expenditure forecasts The difference between the disclosed nominal and constant values disclosed in respect of operational expenditure arises because the nominal value is the actual amount forecast to be spent, whilst the constant value is an inflation adjusted or ‘real’ dollar value (that is to say, expressed at current values).
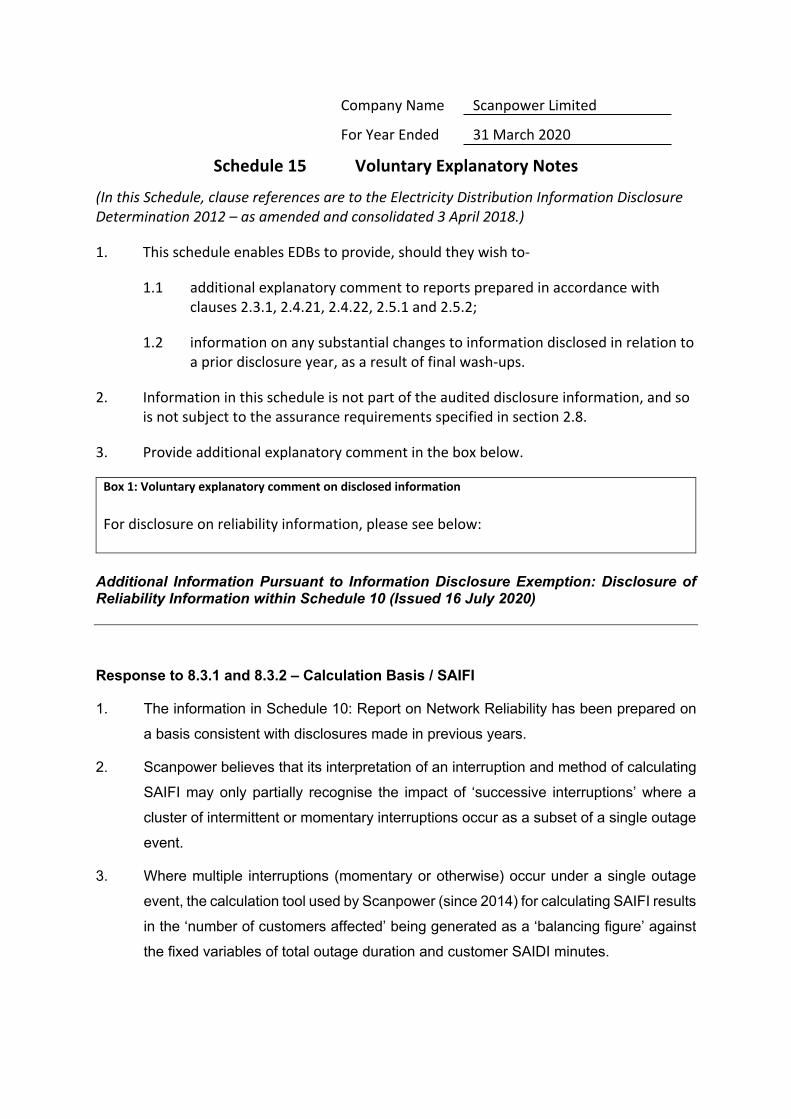
Company Name Scanpower Limited
For Year Ended 31 March 2020
Schedule 15 Voluntary Explanatory Notes
(In this Schedule, clause references are to the Electricity Distribution Information Disclosure Determination 2012 – as amended and consolidated 3 April 2018.)
1. This schedule enables EDBs to provide, should they wish to-
1.1 additional explanatory comment to reports prepared in accordance with clauses 2.3.1, 2.4.21, 2.4.22, 2.5.1 and 2.5.2;
1.2 information on any substantial changes to information disclosed in relation to a prior disclosure year, as a result of final wash-ups.
2. Information in this schedule is not part of the audited disclosure information, and so is not subject to the assurance requirements specified in section 2.8.
3. Provide additional explanatory comment in the box below.
Box 1: Voluntary explanatory comment on disclosed information For disclosure on reliability information, please see below:
Additional Information Pursuant to Information Disclosure Exemption: Disclosure of Reliability Information within Schedule 10 (Issued 16 July 2020)
Response to 8.3.1 and 8.3.2 – Calculation Basis / SAIFI
1. The information in Schedule 10: Report on Network Reliability has been prepared on
a basis consistent with disclosures made in previous years.
2. Scanpower believes that its interpretation of an interruption and method of calculating
SAIFI may only partially recognise the impact of ‘successive interruptions’ where a
cluster of intermittent or momentary interruptions occur as a subset of a single outage
event.
3. Where multiple interruptions (momentary or otherwise) occur under a single outage
event, the calculation tool used by Scanpower (since 2014) for calculating SAIFI results
in the ‘number of customers affected’ being generated as a ‘balancing figure’ against
the fixed variables of total outage duration and customer SAIDI minutes.
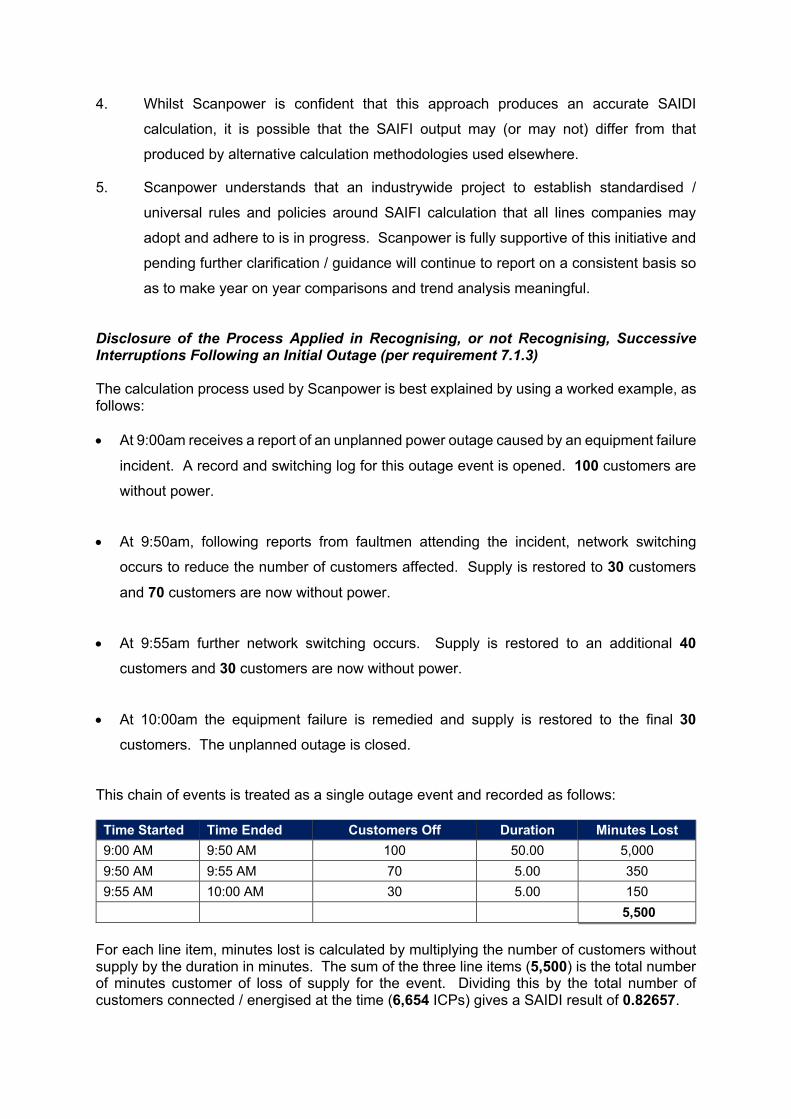
4. Whilst Scanpower is confident that this approach produces an accurate SAIDI
calculation, it is possible that the SAIFI output may (or may not) differ from that
produced by alternative calculation methodologies used elsewhere.
5. Scanpower understands that an industrywide project to establish standardised /
universal rules and policies around SAIFI calculation that all lines companies may
adopt and adhere to is in progress. Scanpower is fully supportive of this initiative and
pending further clarification / guidance will continue to report on a consistent basis so
as to make year on year comparisons and trend analysis meaningful.
Disclosure of the Process Applied in Recognising, or not Recognising, Successive Interruptions Following an Initial Outage (per requirement 7.1.3) The calculation process used by Scanpower is best explained by using a worked example, as follows: • At 9:00am receives a report of an unplanned power outage caused by an equipment failure
incident. A record and switching log for this outage event is opened. 100 customers are
without power.
• At 9:50am, following reports from faultmen attending the incident, network switching
occurs to reduce the number of customers affected. Supply is restored to 30 customers
and 70 customers are now without power.
• At 9:55am further network switching occurs. Supply is restored to an additional 40
customers and 30 customers are now without power.
• At 10:00am the equipment failure is remedied and supply is restored to the final 30
customers. The unplanned outage is closed.
This chain of events is treated as a single outage event and recorded as follows:
Time Started Time Ended Customers Off Duration Minutes Lost 9:00 AM 9:50 AM 100 50.00 5,000 9:50 AM 9:55 AM 70 5.00 350 9:55 AM 10:00 AM 30 5.00 150
5,500 For each line item, minutes lost is calculated by multiplying the number of customers without supply by the duration in minutes. The sum of the three line items (5,500) is the total number of minutes customer of loss of supply for the event. Dividing this by the total number of customers connected / energised at the time (6,654 ICPs) gives a SAIDI result of 0.82657.
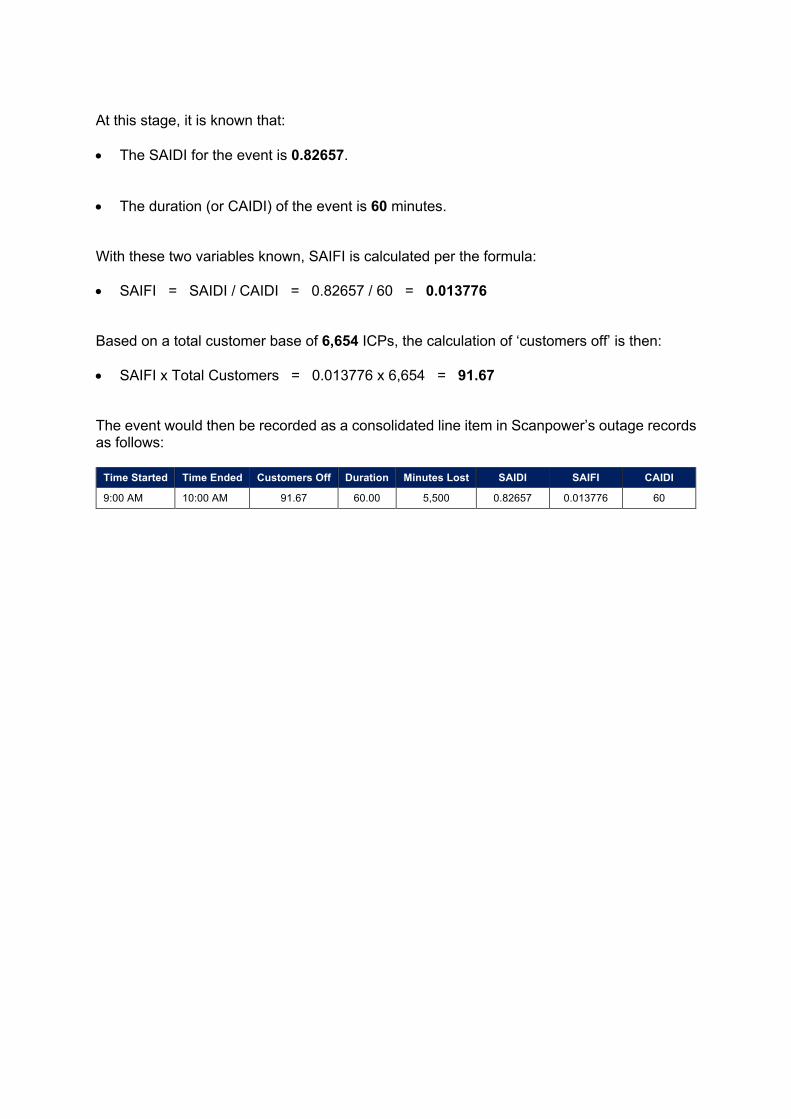
At this stage, it is known that: • The SAIDI for the event is 0.82657.
• The duration (or CAIDI) of the event is 60 minutes.
With these two variables known, SAIFI is calculated per the formula: • SAIFI = SAIDI / CAIDI = 0.82657 / 60 = 0.013776
Based on a total customer base of 6,654 ICPs, the calculation of ‘customers off’ is then: • SAIFI x Total Customers = 0.013776 x 6,654 = 91.67
The event would then be recorded as a consolidated line item in Scanpower’s outage records as follows:
Time Started Time Ended Customers Off Duration Minutes Lost SAIDI SAIFI CAIDI
9:00 AM 10:00 AM 91.67 60.00 5,500 0.82657 0.013776 60
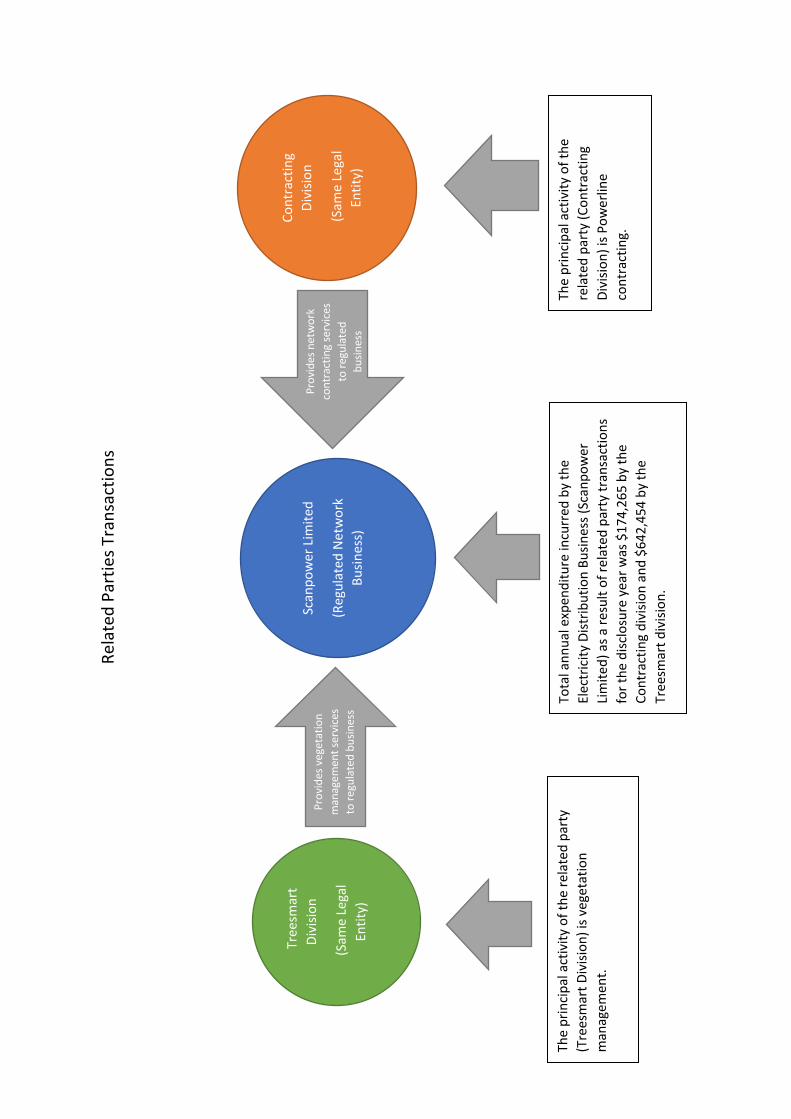
Rela
ted
Part
ies T
rans
actio
ns
Scan
pow
er L
imite
d
(Reg
ulat
ed N
etw
ork
Busin
ess)
Cont
ract
ing
Divi
sion
(Sam
e Le
gal
Entit
y)
Prov
ides
net
wor
k co
ntra
ctin
g se
rvic
es
to re
gula
ted
busin
ess
The
prin
cipa
l act
ivity
of t
he
rela
ted
part
y (C
ontr
actin
g Di
visio
n) is
Pow
erlin
e co
ntra
ctin
g.
Tota
l ann
ual e
xpen
ditu
re in
curr
ed b
y th
e El
ectr
icity
Dist
ribut
ion
Busin
ess (
Scan
pow
er
Lim
ited)
as a
resu
lt of
rela
ted
part
y tr
ansa
ctio
ns
for t
he d
isclo
sure
yea
r was
$17
4,26
5 by
the
Cont
ract
ing
divi
sion
and
$642
,454
by
the
Tree
smar
t div
ision
.
Tre
esm
art
Divi
sion
(Sam
e Le
gal
Entit
y)
Prov
ides
veg
etat
ion
man
agem
ent s
ervi
ces
to re
gula
ted
busin
ess
The
prin
cipa
l act
ivity
of t
he re
late
d pa
rty
(Tre
esm
art D
ivisi
on) i
s veg
etat
ion
man
agem
ent.
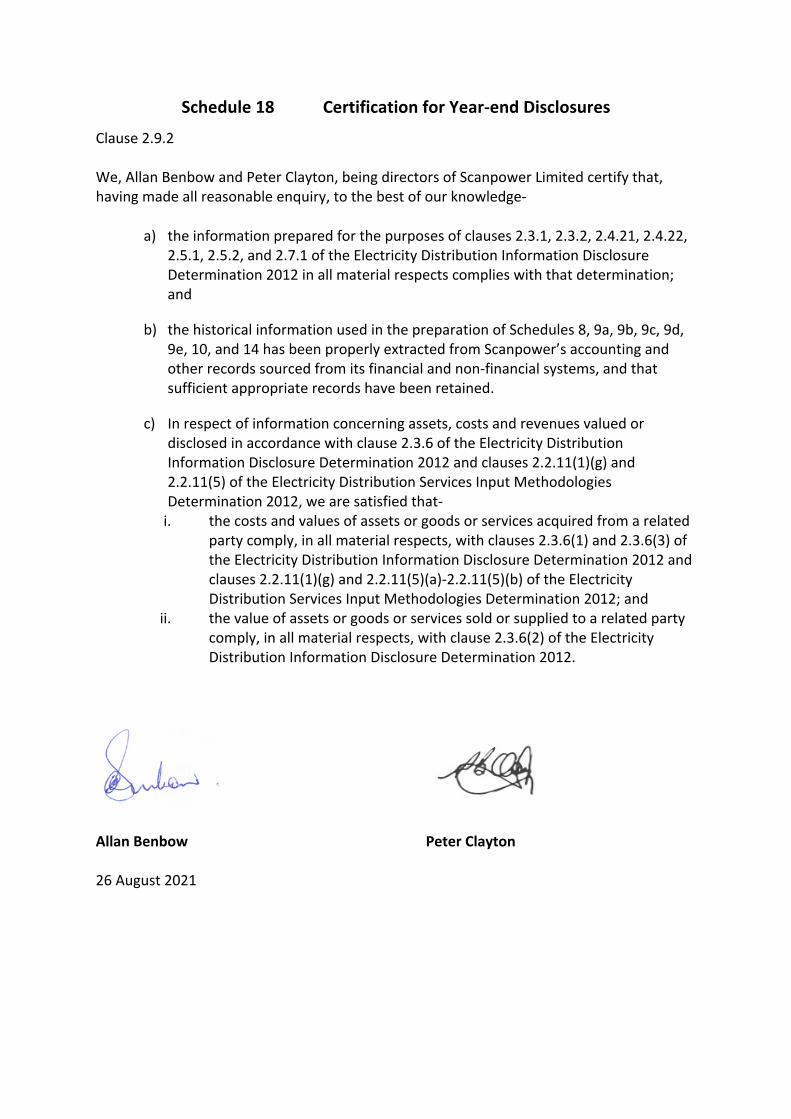
Schedule 18 Certification for Year-end Disclosures
Clause 2.9.2 We, Allan Benbow and Peter Clayton, being directors of Scanpower Limited certify that, having made all reasonable enquiry, to the best of our knowledge-
a) the information prepared for the purposes of clauses 2.3.1, 2.3.2, 2.4.21, 2.4.22, 2.5.1, 2.5.2, and 2.7.1 of the Electricity Distribution Information Disclosure Determination 2012 in all material respects complies with that determination; and
b) the historical information used in the preparation of Schedules 8, 9a, 9b, 9c, 9d, 9e, 10, and 14 has been properly extracted from Scanpower’s accounting and other records sourced from its financial and non-financial systems, and that sufficient appropriate records have been retained.
c) In respect of information concerning assets, costs and revenues valued or disclosed in accordance with clause 2.3.6 of the Electricity Distribution Information Disclosure Determination 2012 and clauses 2.2.11(1)(g) and 2.2.11(5) of the Electricity Distribution Services Input Methodologies Determination 2012, we are satisfied that-
i. the costs and values of assets or goods or services acquired from a related party comply, in all material respects, with clauses 2.3.6(1) and 2.3.6(3) of the Electricity Distribution Information Disclosure Determination 2012 and clauses 2.2.11(1)(g) and 2.2.11(5)(a)-2.2.11(5)(b) of the Electricity Distribution Services Input Methodologies Determination 2012; and
ii. the value of assets or goods or services sold or supplied to a related party comply, in all material respects, with clause 2.3.6(2) of the Electricity Distribution Information Disclosure Determination 2012.
Allan Benbow Peter Clayton 26 August 2021
Independent Assurance Report
To the directors of Scanpower Limited and to the Commerce Commission on the disclosure information
for the disclosure year ended 31 March 2021 as required by
the electricity distribution information disclosure determination 2012
The Scanpower Limited (the Company) is required to disclose certain information under the Electricity Distribution Information Disclosure Determination 2012 (the Determination) and to procure an assurance report by an independent auditor in terms of section 2.8.1 of the Determination.
The Auditor-General is the auditor of the Company.
The Auditor-General has appointed me, Chris Webby, using the staff and resources of Audit New Zealand, to undertake a reasonable assurance engagement, on his behalf, on whether the information prepared by the Company for the disclosure year ended 31 March 2021 (the Disclosure Information) complies, in all material respects, with the Determination.
The Disclosure Information that falls within the scope of the assurance engagement are:
• Schedules 1 to 4, 5a to 5g, 6a and 6b, 7, 10 and 14 (limited to the explanatory notes in boxes 1 to 11) of the Determination.
• Clause 2.3.6 of the Determination and clauses 2.2.11(1)(g) and 2.2.11(5) of the Electricity Distribution Services Input Methodologies Determination 2012 (the IM Determination), in respect of the basis for valuation of related party transactions (the Related Party Transaction Information).
This assurance report should be read in conjunction with the Commerce Commission’s Information Disclosure exemption, issued to all electricity distribution businesses on 17 May 2021 under clause 2.11 of the Determination. The Commerce Commission granted an exemption from the requirement that the assurance report, in respect of the information in Schedule 10 of the Determination, must take into account any issues arising out of the Company’s recording of SAIDI, SAIFI, and number of interruptions due to successive interruptions.
Opinion
In our opinion, in all material respects:
• as far as appears from an examination, proper records to enable the complete and accurate compilation of the Disclosure Information have been kept by the Company;
2
• as far as appears from an examination, the information used in the preparation of the Disclosure Information has been properly extracted from the Company’s accounting and other records, sourced from the Company’s financial and non-financial systems;
• the Disclosure Information complies, in all material respects, with the Determination; and
• the basis for valuation of related party transactions complies with the Determination and the IM Determination.
Basis for opinion
We conducted our engagement in accordance with the Standard on Assurance Engagements (SAE) 3100 (Revised) Assurance Engagements on Compliance, issued by the New Zealand Auditing and Assurance Standards Board. An engagement conducted in accordance with SAE (NZ) 3100 (Revised) requires that we comply with the International Standard on Assurance Engagements (New Zealand) 3000 (Revised) Assurance Engagements Other Than Audits or Reviews of Historical Financial Information.
We have obtained sufficient recorded evidence and explanations that we required to provide a basis for our opinion
Key assurance matters
Key assurance matters are those matters that, in our professional judgement, required significant attention when carrying out the assurance engagement during the current disclosure year. These matters were addressed in the context of our compliance engagement, and in forming our opinion. We do not provide a separate opinion on these matters.
3
Key assurance matter How our procedures addressed the key assurance matter
Related party transactions and valuation at arms-length
The Determination and the IM Determination place a requirement on the Company to value related-party procurement transactions at a value not greater than arms-length. In other words, the value at which a transaction, with the same terms and conditions, would be entered into between a willing seller and a willing buyer who are unrelated and who are acting independently of each other and pursuing their own best interests.
In the absence of an active market for related-party transactions, assigning an objective arms-length value to a related-party transaction is difficult.
This is a key assurance matter because it is a requirement that involves considerable judgement by Company personnel. In turn, verification of the appropriate assignment of an objective arms-length valuation to related-party transactions requires the exercise of significant professional judgement by the auditor.
We have obtained an understanding of the Company’s approach to identifying and valuing related-party transactions at arm’s-length in accordance with the Determination and the IM Determination.
The procedures we carried out to satisfy ourselves that related-party transactions are appropriately identified and valued at a value not greater than arm’s-length, included:
• testing the completeness of the related-parties identified through review of Board minutes, and related-parties identified through detailed testing of transactions and balances in our audit of the annual financial statements audit;
• comparing the prices charged to the Company by related parties with the unit prices charged to other customers; and
• confirming the material accuracy of related party values disclosed, and compliance of their calculation with the Determination and the IM Determination.
4
Key assurance matter How our procedures addressed the key assurance matter
Accuracy of the number and duration of electricity outages
The Company has a combination of manual and automated systems to identify outages and to record the duration of outages. This outage information is used to report the Company’s Report on Network Reliability in Schedule 10. If this information is inaccurate then the measures of the reliability of the network could be materially misstated.
This is a key assurance matter because information on the frequency and duration of outages is an important measure of the reliability of electricity supply. Relatively small inaccuracies can have a significant impact on the reliability thresholds against which Company performance is assessed.
Reliability measures are a key indicator of the quality of supply. Declining reliability performance could be an indicator of poor network maintenance or lack of investment in network infrastructure.
The Commerce Commission has issued an Exemption notice which, excludes the assurance report from coverage of the information, in Schedule 10 of the Determination, for any issues arising out of the Company’s recording of SAIDI, SAIFI and number of interruptions due to successive interruptions. We need to ensure that the Company meets the criteria for the Exemption to apply, including that it makes the necessary disclosures so the exclusion to the assurance opinion applies.
We have obtained an understanding of the Company’s system to record electricity outages, and their duration. This included review of the Company’s definition of interruptions and planned interruptions.
Our procedures to assess the adequacy of the Company’s methods to identify and record electricity outages and their duration included:
• performing an assessment of the reliability of the manual processes to record the details of interruptions to supply;
• obtaining internal and external information on interruptions to supply to gain assurance that interruptions to supply were recorded. Internal and external information sources included works orders for contractors, media reports, and Board minutes;
• testing a sample of interruptions to supply to source records to conclude on their accuracy of calculation, and the appropriateness of the categorisation of the cause of the interruption and whether it was planned or unplanned, and that the cause of the interruptions is correctly categorised;
• checked the SAIDI and SAIFI ratios were correctly calculated in accordance with the Determination, as amended, and the IM Determination;
• obtained explanations for all significant variances to forecast; and
• testing the accuracy of the number of connections to the Electricity Authority’s register.
With respect to the Exemption, we:
• obtained and documented our understanding of the Company’s methods by which electricity outages and their duration are recorded where an outage event results in successive interruptions of supply;
• compared this to the documented process that the Company followed in the previous year; and
5
Key assurance matter How our procedures addressed the key assurance matter
• identified potential incidences of successive interruptions of supply to ensure that the Company’s methods, by which electricity outages and their duration are recorded where an outage event results in successive interruptions of supply, was the same for both years.
Having carried out these procedures, and in assessing the likelihood of reported electricity outages and their duration being materially misstated in the Disclosure Information, we have no matters to report.
Directors’ responsibilities
The directors of the Company are responsible in accordance with the Determination for:
• the preparation of the Disclosure Information; and
• the Related Party Transaction Information.
The directors of the Company are also responsible for the identification of risks that may threaten compliance with the schedules and clauses identified above and controls which will mitigate those risks and monitor ongoing compliance.
Auditor’s responsibilities
Our responsibilities in terms of clauses 2.8.1(1)(b)(vi) and (vii), 2.8.1(1)(c) and 2.8.1(1)(d) are to express an opinion on whether:
• As far as appears from an examination, the information used in the preparation of the audited Disclosure Information has been properly extracted from the Company’s accounting and other records, sourced from its financial and non-financial systems.
• As far as appears from an examination, proper records to enable the complete and accurate compilation of the audited Disclosure Information required by the Determination have been kept by the Company and, if not, the records not so kept.
• The Company complied, in all material respects, with the Determination in preparing the audited Disclosure Information.
• The Company’s basis for valuation of related party transactions in the disclosure year has complied, in all material respects, with clause 2.3.6 of the Determination and clauses 2.2.11(1)(g) and 2.2.11(5) of the IM Determination.
6
To meet these responsibilities, we planned and performed procedures in accordance with SAE (NZ) 3100 (Revised), to obtain reasonable assurance about whether the Company has complied, in all material respects, with the Disclosure Information (which includes the Related Party Transaction Information) required to be audited by the Determination.
An assurance engagement to report on the Company’s compliance with the Determination involves performing procedures to obtain evidence about the compliance activity and controls implemented to meet the requirements. The procedures selected depend on our judgement, including the identification and assessment of the risks of material non-compliance with the requirements.
Inherent limitations
Because of the inherent limitations of an assurance engagement, together with the internal control structure, it is possible that fraud, error or non-compliance with the Determination may occur and not be detected. A reasonable assurance engagement throughout the disclosure year does not provide assurance on whether compliance with the Determination will continue in the future.
Restricted use
This report has been prepared for use by the directors of the Company and the Commerce Commission in accordance with clause 2.8.1(1)(a) of the Determination and is provided solely for the purpose of establishing whether the compliance requirements have been met. We disclaim any assumption of responsibility for any reliance on this report to any person other than the directors of the Company and the Commerce Commission, or for any other purpose than that for which it was prepared.
Independence and quality control
We complied with the Auditor-General’s:
• independence and other ethical requirements, which incorporate the independence and ethical requirements of Professional and Ethical Standard 1 issued by the New Zealand Auditing and Assurance Standards Board; and
• quality control requirements, which incorporate the quality control requirements of Professional and Ethical Standard 3 (Amended) issued by the New Zealand Auditing and Assurance Standards Board.
The Auditor-General, and his employees, and Audit New Zealand and its employees may deal with the Company on normal terms within the ordinary course of trading activities of the Company. Other than any dealings on normal terms within the ordinary course of trading activities of the Company, this engagement and the annual audit of the Company’s financial statements and performance information, we have no relationship with or interests in the Company.
7
Chris Webby Audit New Zealand On behalf of the Auditor-General Palmerston North, New Zealand 26 August 2021