Embed Size (px)
Citation preview
DOCUMENT RESUME
ED 327 550 TM 015 819
AUTHOR Facione, Peter A.TITLE The California Critical Thinking Skills Test--College
Level. Technical Report #2. Factors Predictive of CTSkills.
PUB DATE 90
NOTE 23p.; For technical reports 1 and 3, see TM 015 818and TM 015 962.
AVAILABLE FROM California Academic Press, 217 La Cruz, Millbrae, CA94030 ($10.00, $70.00 for 10).
PUB TYPE Reports - Research/Technical (143)
EDRS PRICE MF01/PC01 Plus Postage.DESCRIPTORS *Cognitive Tests; *College Students; Course
Evaluation; *Critical Thinking; English; HigherEducation; Instructional Effectiveness; NativeSpeakers; *Predictor Variables; Pretests Posttests;Reading Achievement; Regression (Statistics); *SkillDevelopment; *Student Characteristics; TeacherInfluence; Thinking Skills
IDENTIFIERS *California Critical Thinking Skills Test (College);California State University Fullert(n; NonnativeSpeakers; Scholastic Aptitude Test
ABSTRACTCorrelations between the California Ci_tical Thinking
Skills Test--College Level (CCTST) and student-related factorsregarded as indicators of academic ability and success were studiedin a series of four experiments investigating whether the CCTSTmeasures improvement in critical thinking (CT) skills. During1989-90, data were collected on 1,196 college students at CaliforniaState University (Fullerton), some of whom were enrolled in coursesspecifically designed to improve CT skills. Instructor-relatedfactors were also evaluated for their impact on CT skill development.Regression models were developed for predicting CCTST results.Relationships between reading ability and native English languageability and the CCTST were also examined. CT skills could bepredicted by a combination of verbal Scholastic Aptitude Test (SAT)score, mathematics SAT score, and grade point average. CCTST resultscorrelated positively with reading test scores for vocabulary,comprehension, and total score. Non-native English speakers showedvirtually no gains in CT skills from pretest to posttest. Onlyinstructor years of teachiag experience and recent experienceteaching CT skills were related to CCTST results. No evidence wasfound to suggest that improvement in CT skills is a natural outgrowthof baccalaureate education; skills improvement did result fromcourses targeting such skills. Twelve tables provide study lata.(SLD)
Reproductions supplied by EDRS are the best that can be madefrom the original di-Jcument.

U & DEPARTMENT OF IMCATioitOffice of Educational Research end improvement
EC UCADONAL RESOURCES INFORIAATiONCENTER (ERIC)rl document hes bees reproduced as
received from the person or oreartmetrononginating rt
0 Minor changes have tow made to improvereproductiOn PANS
Points of view or opinions stated in Ma doctrmeni do not neceseenly reOrseent OfficialOEM posaiori or policy
"PERMISSION TO REPRODUCE THISMATERIAL HAS BEEN GRANTED BY
Y9C11g Al. FR/oluir
TO THE EDUCATIONAL RESOURCESINFORMATION CENTER (ERIC)."
The California Critical Thinking Skills Test -- 0211ege Level
Technical Report #2
Factors Predictive of CT Skills
Peter A. FacioneSanta Clara Universk
c. 1990CALIFORNIA ACADEMIC PRESS217 La Cruz Ave., Millbrae , CA 94030
(ERIC Doc. No: TM 015819)
2
The California Critical Thinking Skills Test: College Level
Technical Report #2 Factors Predictive of CT Skills
by
Peter A. Facione
Santa Clara University
Abstract
Technical Report #2 builds on Technical Report #1 which discussed thecontent validity and the four experiments used to determine that theCalifornia Critical Thinking Skills Test: College Level (CCTST) measuresLmprovements in the core CT skills of interpretation, analysis, evaluation,inference and explanation. During 1989/90, data was collected on a variety ofvariables related to the 1196 subjects who participated in these experiments.Critical thinking skills, as measured on tho CCTST, can be predicted by acombination of SAT verbal, SAT math, and GPA data with R-sguare =.41 If CCTST
pretest data are included in the regression model the R-sguare =.71. Thecollege student's age, units of college work completed, and high schoolsubject matter preparation, and the instructor's teaching experiencecontribute nothing of significance to the regression models which predictsCCTST posttest results. CCTST results positively correlated with Nelson-Dennyreading scorea for vocabulary, comprehension, and total score. Non-nativeEnglish speakei; dhow virtually no gain from pretest to posttest and, hence,use of the CCTST for this group of tudnts is strongly counter-indicated. Of
six instructor-factors which are thought to b. related to effectiveness inteaching CT skills, only years of teaching xperience and recent experienceteaching CT are related, and those in non-linear ways. Applying the CCTST tothe hypothesis that CT skill development is a natural outcome of baccalaureateeducation, no evidence for that hypothesis, either in general, or by referenceto the control groups, could be discovered. This result is not viewednegatively. Not all professors should be expected to teach all skills.Technical Report #3 discusses student-related factors such as academic major,CT self-esteem, gender, and ethnicity. Technical Report #4 provides groupnorms and discusses CCTST sub-scores on analysis, evaluation, inference,deductive reasoning and inductive reasoning skills.
13
The California Critical Thinking Skills Test: College Level
Technical Report #2 Factors Predictive of CT Skills
by
Peter A. Facione
Santa Clara University
Recap of Previous Findings
Technical Report #1 discussed the content validity and the experimental validation
of the California Critical Thinking Skills Test: College Level (CCTST). Those
experiments were conducted in 1989/90 at California State University, Fullerton using
1169 undergraduate students enrolled in lower division general education requirements.
From these experiments it was inferred that the CCTST succeeds in measuring the gains in
CT skills which result from the completion of courses specifically designed and approved
for CT development. No gain in CT skills was evident in either of the two control group
experiments conducted during the same academic year at the university (Facione 1990 c).
The CCTST addresses the core CT skills of interpretation, analysis, evaluation, inference
and explanation and provides sub-scores on these three skills as well as deductive
reasoning and inductive reasoning. During the 1989/90 research, data was also collected
24
on a variety of variables relating to the 1196 students and the 20 instructors who
participated in these experiments. These data were gathered on participants in the two
posttest administrations, Nov. '89 and May '90, and in the pretest administration of Feb.
'90.
Technical Report # 2 discusses the correlations between the CCTST and several
student-related factors generally regarded as indicators of academic ability and success. It
also examines seven instructor-related factors for evidence of their impact on CT skill
development. This report develops regression models for predicting CCTST results. It
then examines the relationship batween reading ability and native English language ability
to the CCTST. This report challenges the hypothesis that college teachers generally
promote CT skill development as a natural result of the educational experience.
Concurrent Validity of the CCTST
Among the student-related data gathered in 1989/90 was information on students'
high school GPA, SAT-verbal and SAT-math scores. Statistical information available
through the campus Admissions and Records Office also included data on the number of
semesters of high school preparatory English, math, foreign language, and science taken
prior to enrolling at the university. College GPA and the number of college units earned,
as well as score on the California State University's English Placement Test and Entry
Level Math Test were also made available through the university. The students
themselves supplied only limited information, such as their age in years. They were also
asked to respond to certain attitudinal and self-perception que3tions which are discussed
in Technical Report #3.
35

So as not to contaminate these comparisons with the results of CT instruction, only
the February 1990 pretest data was used to determine if interesting correlations existed
between CT skills and other important indicators or predictors of academic achievement
and success. Table 1 reports these findings.
CCTST pretest results are significantly correlated with seven factors including
college GPA (r= .20, p < .000) and Scholastic Aptitude Test (SAT) Verbal Score (r = .55,
p<.000) and the SAT Math Score (r=.44, p<.000). Students entering the California State
University syst...m with an SAT-verbal score below 470 must take the University's English
Placement Test (EPT). Likewise, those with an SAT-math score below 530 must take the
University's Entry Level Mathematics Test (ELM). As would be expected, the means for
these measures, as reported on Table 1, fall below the means for the entire sample. The
CCTST pretest scores were correlated with the EPT (r =.48, p<.000) and the ELM (r=.13,
p=.025). Statistically significant correlations were also found between students' pretest
CCTST scores and the number of semesters of high school preparatory English (r=.16,
P=.002) and the number of semesters of high school preparatory Math (r =.10, p=.039).
High school science and foreign language preparation were not statistically significantly
correlated, however.
It is a widely accepted that mastery of CT skills increases as college students
advance through their baccalaureate education. I:, for example, the cumulative effect of a
college education were generally to enhance students' critical thinking skills, then one
might predict a positive correlation between the number of units of college work
completed and growth in CT ability. However the results of these comparisons were
surprisingly negative. Pretest CCTST scores were not significantly correlated with either
age or college units earned. This result is disconcerting for those who hold the view that
growth in CT ability is a "natural byproduce of either a college education or the
4

maturation which occurs in young adulthood. On the other hand, these findings are most
encouraging to those who hold that specific attention to the development of CT skills will
occur only if this becomes a specific course goal, a planned outcome in curricular design,
and a factor considered in the selection of instructional materials and pedagogicai strategy.
lida.Fab. 1990 Pretest Correlations -- Concurrent Validity
Measure Elm lia.L gam Nun pretestSAT-Verb +.55 *p<.000 333 419 16.40EFT +.48 *p<.000 229 147 15.27SAT-Math +.44 *p<.000 333 477 16.40SLIM +.13 *1)=.025 218 51.1 15.22CPA +.20 *p<.000 473 2.66 16.11Prep-Eng +.16 *p=.002 314 7.7 16.47Prep-Math +.10 *p=.039 315 6.3 16.44Prep-Sci +.11 p=.081 155 3.8 16.23Prep-Flng +.01 p=.491 281 2.0 15.56Units +.03 1)=.262 473 66.8 16.11AGE -.006 p=.449 479 22.03 16.10
While Table 1 shows seven s4cgtificant correlations (p < .05) vinich obtain at the start
of CT instruction, questions arise as to whether these correlations persist though to the
culmination of one semester of CT study. On the Nov. '89 posttest data, six of the same
seven factors were statistically significantly correlated with the CCTST posttest score.
These are SAT-verbal, SAT-math, EPT, ELM, GPA, and semesters of college preparatory
English. But the number of semesters of college preparatory math, which was significantly
correlated with the pretest sccre, was not ccrrelated with the posttest score at a
statistically significant level. As Table 2 indicates, on the Nov. '89 posttest, age, number of
college units completed again showed themselves not be correlated significantly with one's
CT ability as measured by the CCTST.
5 7
=IsNov.
MAMMA
1989
th2
Posttest Correlations -- Concurrent
Mils CAAAA MAAR
Validity
PosttestSAT-Verb +.62 *p<.000 275 415 16.87EPT +.57 *p<.000 206 148 15.89
SAT-Nath +.48 *p<.000 275 494 16.87
ELK +.24 *p<.000 188 52.8 15.96GPA +.22 *p<.000 404 2.75 16.81
Prep-Eng +.19 *p=.001 269 7.8 16.87
Prep-Nath +.10 p=.054 269 6,5 16.87
Prep-Sci +.08 p=.231 231 4.1 16.67
Prep-Plng -.02 p=.355 248 1.4 16.61
Units +.06 p=.124 404 76.1 16.81
AGE +.01 p=.403 461 22.9 16.85
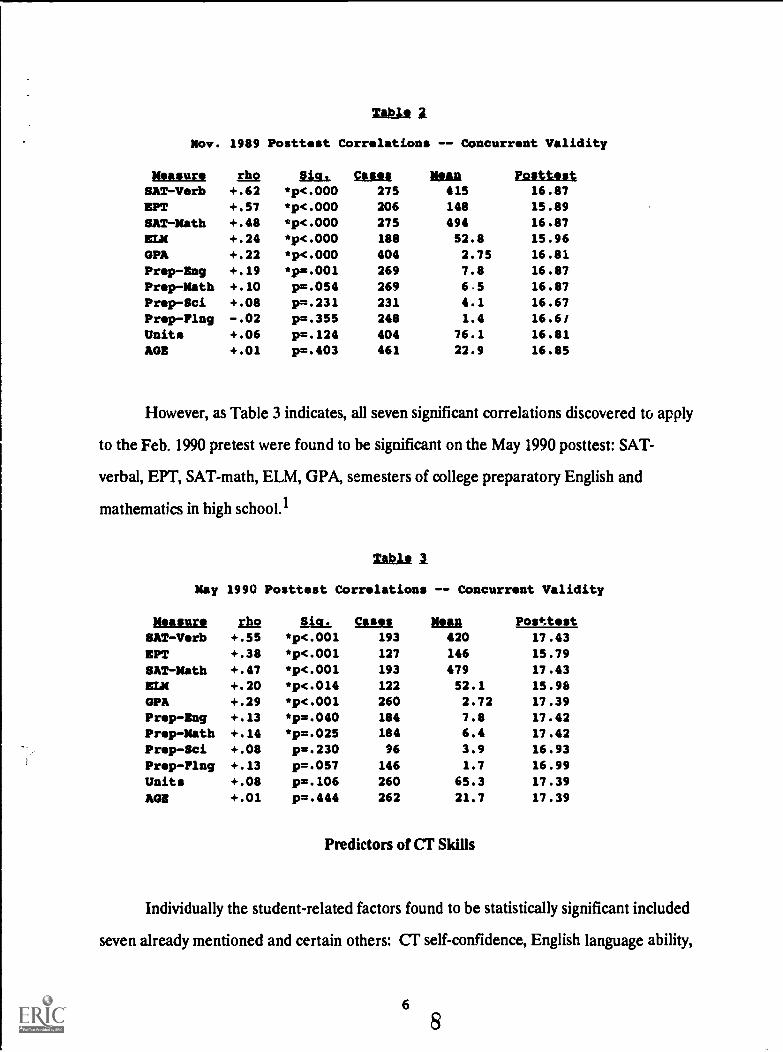
However, as Table 3 indicates, all seven significant correlations discovered to apply
to the Feb. 1990 pretest were found to be significant on the May 1990 posttest: SAT-
verbal, EPT, SAT-math, ELM, GPA, semesters of college preparatory English and
mathematics in high school.1
MktMay 1990 Posttest Correlations -- Concurrent Validity
MUMS Eba PAIL ICU/ NAAR POsttestSAT-Verb +.55 *p<.001 193 420 17.43EPT +.38 *p<.001 127 146 15.79
SAT-Nath +.47 *p<.001 193 479 17.43ICLA +.20 *p<.014 122 52.1 15.98OPA +.29 *p<.001 260 2.72 17.39
Prep-Eng +.13 *p=.040 184 7.8 17.42Prep-Nath +.14 *p=.025 184 6.4 17.42Prep-Sci +.08 p=.230 96 3.9 16.93
Prep-Plng +.13 p=.057 146 1.7 16.99
Units +.08 p=.106 260 65.3 17.39
AGE +.01 p=.444 262 21.7 17.39
Predictors of CT Skills
Individually the student-related factors found to be statistically significant included
seven already mentioned and certain others: CT self-confidence, English language ability,
6

and the academic major in which the student hopes to graduate, the perception of the
relationship of one's CT ability and GPA, ethnicity/race, and, in one analysis, gender.3
But, just as body weight can be correlated positively with reading ability in elementary
school children, one must be cautious about how any of these findings about individual
factors, considered in isolation, is interpreted. Human performance is the result of the
complex interaction of many factors, not the result of any one factor taken by itself. Any
single factor, even where a strong correlation is discovered, may turn out to be
unimportant when considered in combination with other factors. Discovering that
combination of factors which, taken together, best predicts a student's CT skill is crucial to
optimal CT instruction and to the utility of CT assessment tools, such as CCTST.
Several stepwise multiple regression analyses were conducted in order to build a
model of that combinz .ion of factors which best and most economically predict CCTST
results. The data from the May '90 posttest and the Nov. '89 posttest were combined so as
to maximize the number of cases for the regression analyses. Certain factors, because of
the nature of the way they were measured, could not be entered into the regression
equations. Using the backward method variables initially introduced into the regression
equation were taken out, one by one, as it became evident that their continued presence
contributed nothing significant to the equations ability to predict variances in the
dependent variable -- the CCTST posttest score.
One regression analysis of interest produced a Multiple-R of .84100 and an R-
square of .70729. (F = 239.83, df 4, 397, Sig. of F = .0000). This analysis indicates that
roughly 71% of the variance in the posttest scores could be predicted by the combination
of four factors which remained in the equation after the backward analysis was completed.
In this model nine independent variables were entered into the initial regression equation
in this order: Pretest score, age, preparatory Math, preparatory English, college GPA,
7
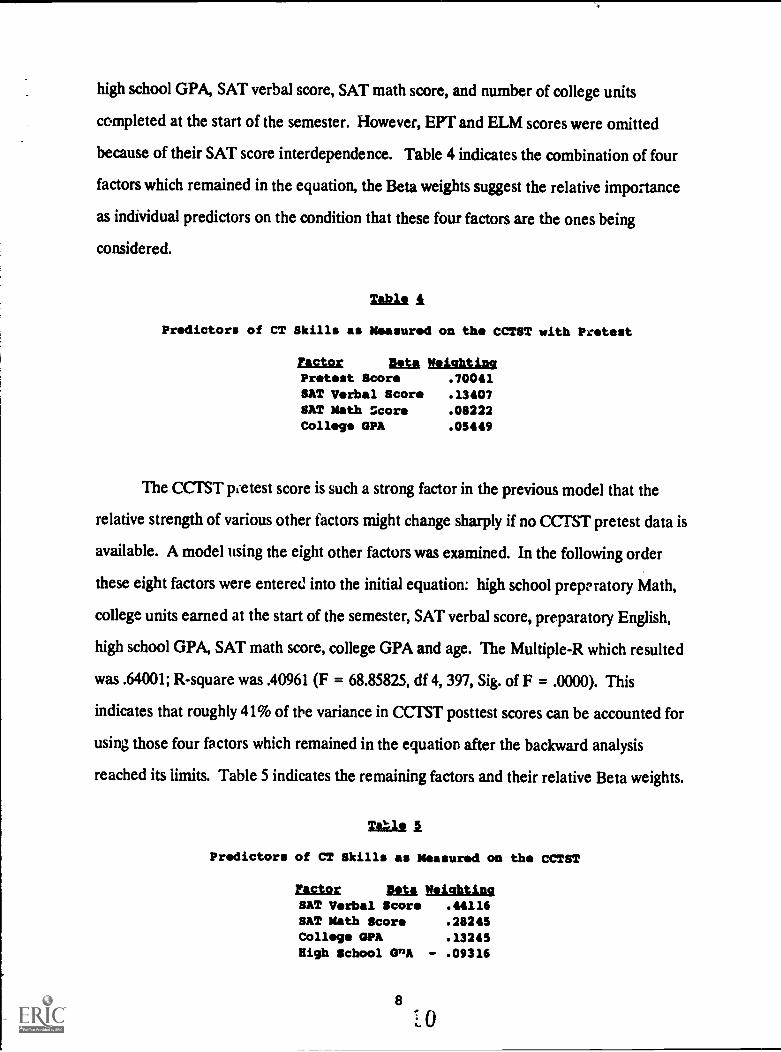
high school GPA, SAT verbal score, SAT math score, and number of college units
completed at the start of the semester. However, EPT and ELM scores were omitted
because of their SAT score interdependence. Table 4 indicates the combination of four
factors which remained in the equation, the Beta weights suggest the relative importance
as individual predictors on the condition that these four factors are the ones being
considered.
Predictors of CT Skills as Measured on the CCTST with Pretest
EASIRE B.ta WeiahtinqProtest Score .70041SAT Verbal Scor .13407SAT Math Score .08222College OPA .05449
The CCTST pfetest score is such a strong factor in the previous model that the
relative strength of various other factors might change sharply if no CC1TST pretest data is
available. A model using the eight other factors was examined. In the following order
these eight factors were entered into the initial equation: high school prepratory Math,
college units earned at the start of the semester, SAT verbal score, preparatory English,
high school GPA, SAT math score, college GPA and age. The Multiple-R which resulted
was .64001; R-square was .40961 (F = 68.85825, df 4, 397, Sig. of F = .0000). This
indicates that roughly 41% of the variance in CCTST posttest scores can be accounted for
using those four factors which remained in the equation after the backward analysis
reached its limits. Table 5 indicates the remaining factors and their relative Beta weights.
lgall
Predictors of CT Skills as Measured on tho CCTST
Factor Data NeiahtingSAT Verbal Score .44116SAT Math Score .28245College OPA .13245High School IPA - .09316
8*: 0

Effectiveness of Particular Courses
Posttest data were gathered from sections of approved CI' courses o',T...red by three
departments: Philosophy, Psychology and Reading. In all, seventeen different faculty
persons were involved as instructors in the various sections of the four courses used in this
research. The four one-semester lower division general education courses, by title, were
l'hilosophy 200 Logic, Philosophy 210 Argument and Reasoning, Psychology 110 Reasoning
and Problem Solving, and Reading 290 Critical Reading as Critical Thinldng.2 Table 6
shows the mean scores by course number for the Nov. '89 posttest and the May '90
posttest.
maiQUM Nov. Keir NIsi RIM:. at MU Man 11.4 P. n.I.
Psychology 110 16.43 3.95 86 16.00 4.73 38
Philosophy 200 16.7'i 4.57 194 17.64 5.28 31
Philosophy 210 16.95 5.46 141 17.32 4.51 116Reading 290 17.45 3.72 44 18.08 4.26 77
These differences by course were not statistically significant, but they did suggest
tendencies. Particularly, note that the Reading mean scores surpassed the others in both
posttest groups. Also in both groups the standard deviation for the scores of the reading
students' were the smallest. As a result, an analysis was done combining Nob. '89 and May
'90 data and grouped only by sponsorirg Department. Table 7 indicates that there was a
statistically significant difference among the scores obtained by the three departments,
(F= 3.4408, df 2, 723, Sig of F = .0326, Eta Sq.= .0094).
7.0.11
MIAMI Combined Posttest Pen fitst Rgn. Cases
Reading 17.8512 4.0675 121
Philosophy 17.0187 4.8753 481
Psychology 16.2984 4.1886 124
9
1 1
While such differences are remarkable in that they tend to counter some of the
presumptions sometimes found in the academy, pending a fuller study of the instructor-
related variables discussed below, these findings should be interpreted with caution.
Significant CT development can occur by virtue of instruction from any of the thme
departments. The Eta-square suggests that less than 1% of the variance is attributable to
this factor. Thus, the critical comparison for student assessment purposes must remain
that which contrasts outcomes from CT courses with outcomes from course not specifically
designed to foster the development of CT skills.
Reading Ability and CT Skills
Because the CCTST is an English language instrument, and because of the
similarities in the question frames used on the CCTST with those used in reading
assessment, a small study was conducted to determine the possible correlation between the
CCTST and the Nelson-Denay Reading Test. The Nelson-Denny Reading Test, a widely
used instrument, reports scores in four areas: Vocabulary, Comprehension, Total Score
and Reading Rate. The computation for Total Score used in this study was the sum of the
Vocabulary Score and the Comprehension Score.
Forty-two students enrolled in Reading 290 were pretested in September of 1989
using the Nelson-Denny Reading Test. These students were enrolled in one or another of
the two sections taught by the same instructor. In Nov. '89 these two sections participated
in the CCTST experiment by completing the CCTST as a posttest. They had not been
given the CCTST in any earlier form. The mean score on the CCTST for this group of 42
stidents was 17.42 with a standard deviation of 3.7815. Table 8 reports the three
10
12
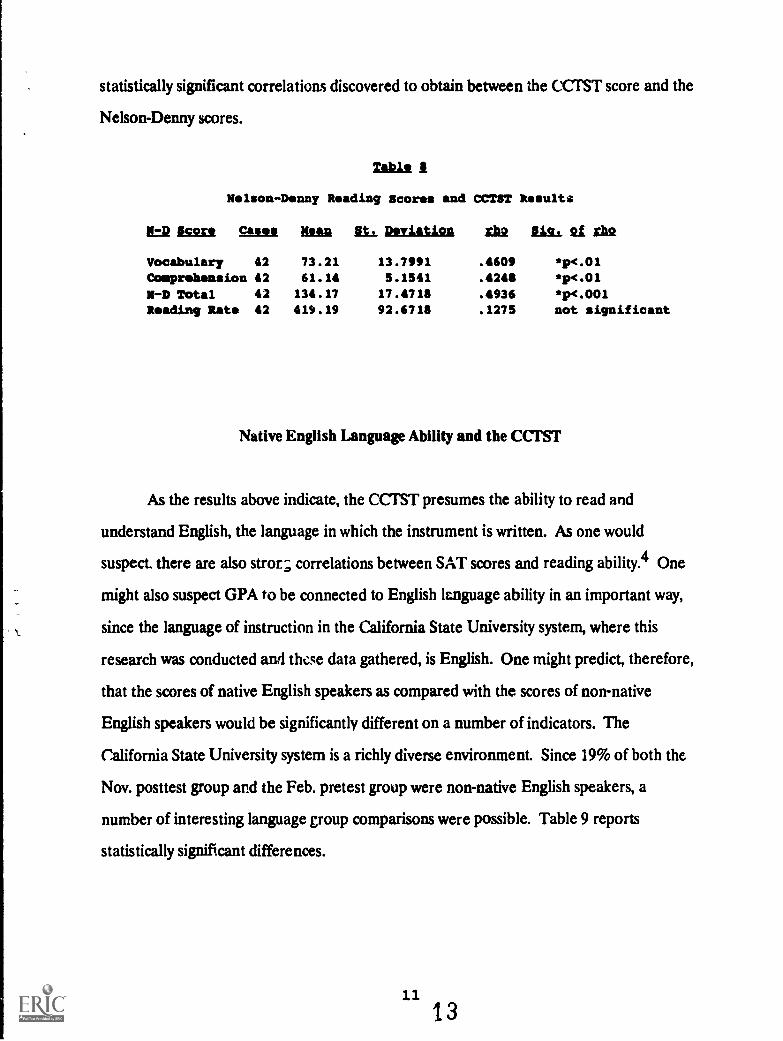
statistically significant correlations discovered to obtain between the CCTST score and the
Nelson-Denny scores.
i
Nelson-Denny Reading Scores and CCTST Results
H=2 Ism gust Htan Al: DeviatioA ib2 IASI 21 Xh2
Vocabulary 42 73.21 13.7991 .4609 *p.01Comprehension 42 61.14 5.1541 .4248 *p.01N-D Total 42 134.17 17.4718 .4936 *p.001Reading Rate 42 419.19 92.6718 .1275 not significant
Native English Language Ability and the CCM
As the results above indicate, the CCTST presumes the ability to read and
understand English, the language in which the instrument is written. As one would
suspect. there are also stror; correlations between SAT scores and reading ability.4 One
might also suspect GPA to be connected to English language ability in an important way,
since the language of instruction in the California State University system, where this
research was conducted and these data gathered, is English. One might predict, therefore,
that the scores of native English speakers as compared with the scores of non-native
English speakers would be significantly different on a number of indicators. The
California State University system is a richly diverse environment. Since 19% of both the
Nov. posttest group and the Feb. pretest group were non-native English speakers, a
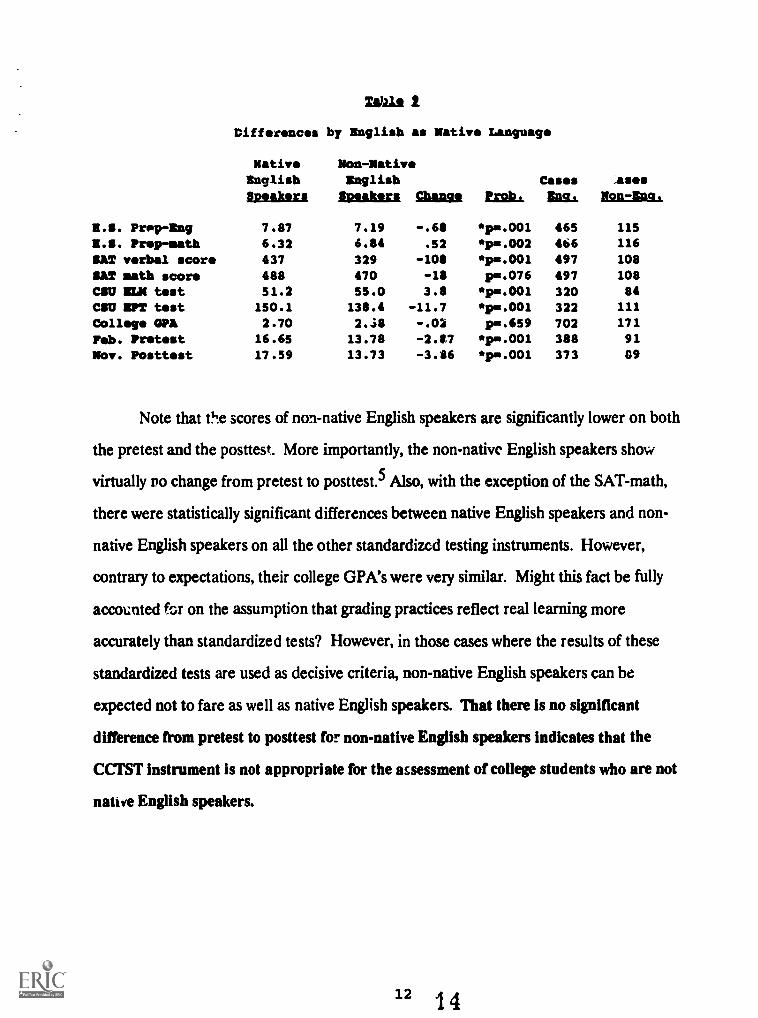
number of interesting language group comparisons were possible. Table 9 reports
statistically significant differences.
Differences by English as Native Language
NativeEnglish
MUSES
Non-NativeEnglish
MAMMA Shams Mk:Cases
5119.2.
_saesN2n=ing.
M.S. Prop-Eng 7.87 7.19 -.68 *pm.001 465 115
I.S. Prep-math 6.32 6.84 .52 *pm.002 466 116
SAT verbal score 437 329 -108 *pm.001 497 108
SAT math score 488 470 -18 pm.076 497 108
CSU ILE test 51.2 55.0 3.8 *pm.001 320 84CSU ENT tst 150.1 138.4 -11.7 *pm.001 322 111
College SPA 2.70 2.48 -.02 pm.659 702 171
Feb. Pretest 16.65 13.78 -2.87 *pm.001 388 91Nov. Posttest 17.59 13.73 -3.86 lipm.001 373 09
Note that th.e scores of non-native English speakers are significantly lower on both
the pretest and the posttest. More importantly, the non-native English speakers show
virtually no change from pretest to posttest.5 Also, with the exception of the SAT-math,
there were statistically significant differences between native English speakers and non-
native English speakers on all the other standardized testing instruments. However,
contrary to expectations, their college GPA's were very similar. Might this fact be fully
accounted for on the assumption that grading practices reflect real learning more
accurately than standardized tests? However, in those cases where the results of these
standardized tests are used as decisive criteria, non-native English speakers can be
expected not to fare as well as native English speakers. That there is no significant
difference from pretest to posttest for non-native English speakers indicates that the
CCTST instrument is not appropriate for the assessment of college students who are not
native English speakers.
12 14
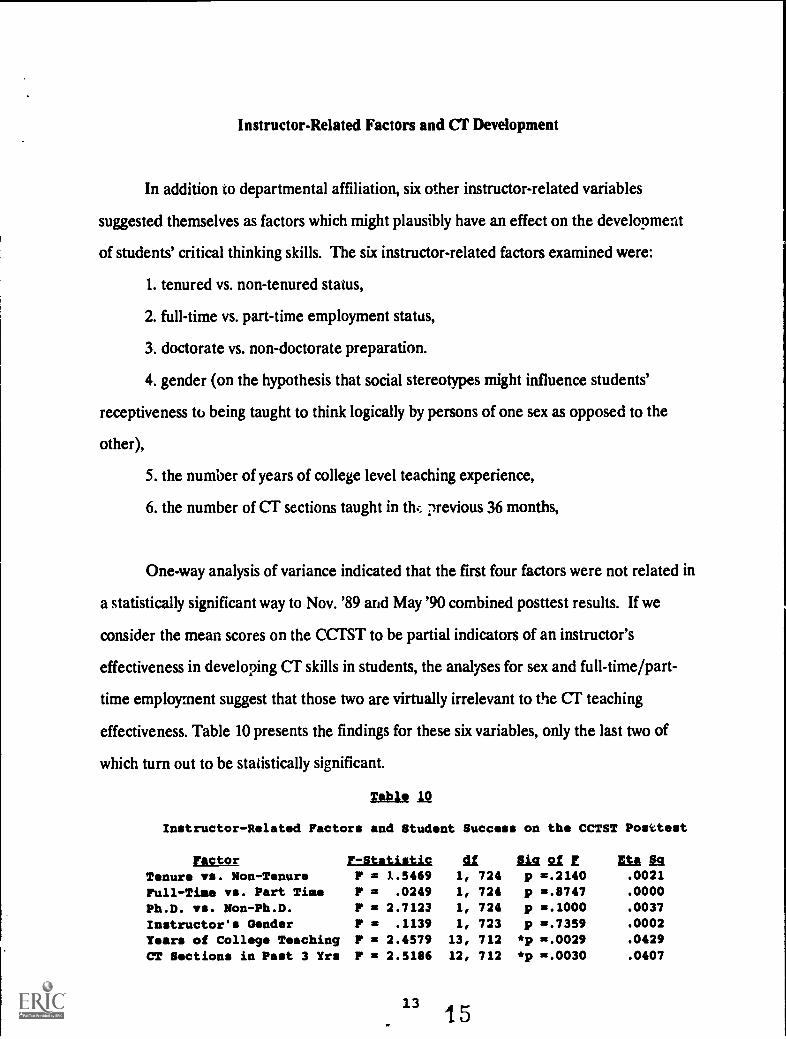
Instructor-Related Factors and CT Development
In addition to departmental affiliation, six other instructor-related variables
suggested themselves as factors which might plausibly have an effect on the development
of students' critical thinking skills. The six instructor-related factors examined were:
1. tenured vs. non-tenured status,
2. full-time vs. part-time employment status,
3. doctorate vs. non-doctorate preparation.
4. gender (on the hypothesis that social stereotypes might influence students'
receptiveness to being taught to think logically by persons of one sex as opposed to the
other),
5. the number of years of college level teaching experience,
6. the number of CI' sections taught in thc previous 36 months,
One-way analysis of variance indicated that the first four factors were not related in
a statistically significant way to Nov. '89 and May '90 combined posttest results. If we
consider the mean scores on the CCTST to be partial indicators of an instructor's
effectiveness in developing CT skills in students, the analyses for sex and full-time/part-
time employment suggest that those two are virtually irrelevant to the CT teaching
effectiveness. Table 10 presents the findings for these six variables, only the last two of
which turn out to be statistically significant.
T.1021. JLQ
Instructor-Related Factors and Student Success on the CcTsT Posttest
Factor T-Statistic it !A21f At01 ASTenure vs. Non-Tenure F = 1.5469 1, 724 p =.2140 .0021
Full-Time vs. Part Time F = .0249 1, 724 p =.8747 .0000
Ph.D. vs. Non-Ph.D. F = 2.7123 1, 724 p =.1000 .0037
Instructor's Gender F .1139 1, 723 p =.7359 .0002
Years of College Teaching F = 2.4579 13, 712 *p =.0029 .0429
CT Sections in Past 3 Yrs F = 2.5186 12, 712 *p =.0030 .0407
13

The Eta squared values indicate that, considered in isolation from everything else,
roughly 4% of the variance in CCTST posttest scores is attributable to the teaching
experience factor in general and roughly 4% relates to recent CT teaching experience.
However considered in combination with other student-related factors, such as SAT scores
and GPA, their effect is not significant. When these two factors were added to the several
others used in the two multiple regression models discussed above, both were eliminated
from the final regression equations.
Pierson correlation analysis on these two experience factors suggests they do not
have a linear relationship to success on the CCM:. The graphic representations of the
findings of this study suggests that some intereting non-linear relationships might exist
between teaching experience and teaching effectiveness. In Table 11 the years of
experience are in parentheses.
Takla U
Relationship gl years pi Teaching Experience Aild CCTST Posttest Scoree
19.0018.8018.6018.40
(11) (12)
M 18.20E 18.00A 17.80 (7)
N 17.6017.40 (15)
17.20 (0)
17.00 (5) (4) (10)
16.80 (3)
C 16.60 (18)
C 16.40
T 16.20 (30)
S 16.00 (4) (21)
T 15.8015.6015.40 (1)
15.2027 32 51 96 89 33 76 32 52 44 44 66 38 46
Nuldmer of Students Taking CCTST
1416
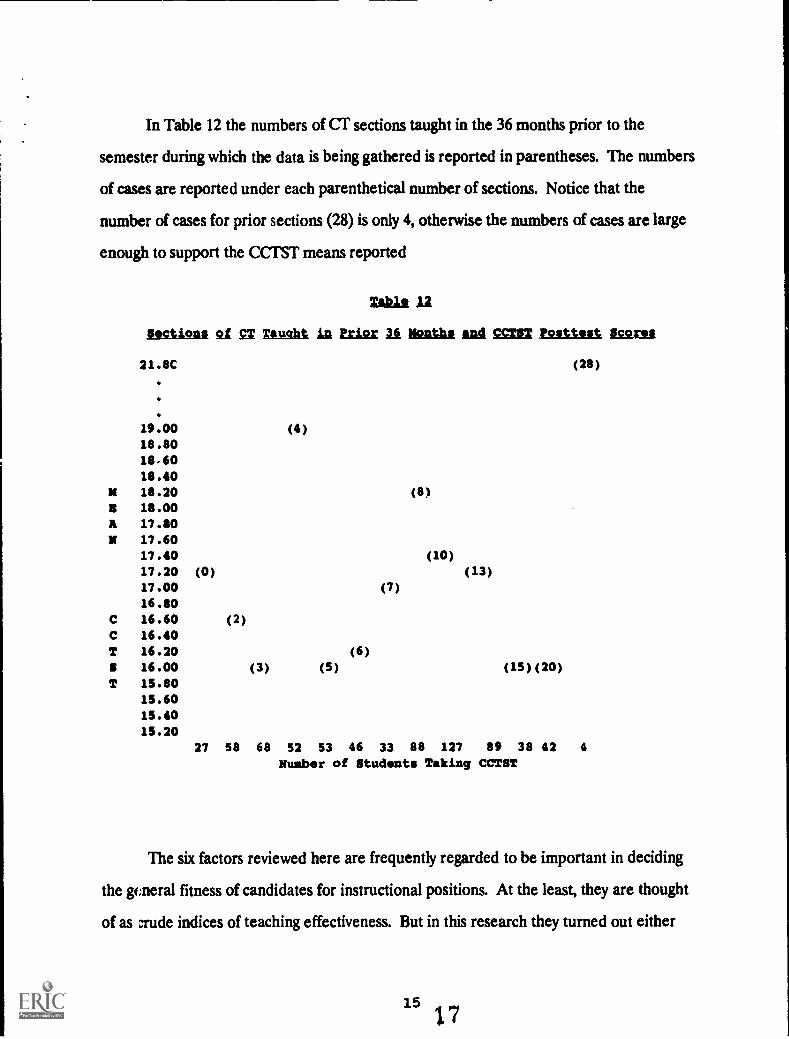
In Table 12 the numbers of CT sections taught in the 36 months prior to the
semester during which the data is being gathered is reported in parentheses. The numbers
of cases are reported under each parenthetical number of sections. Notice that the
number of cases for prior sections (28) is only 4, otherwise the numbers of cases are large
enough to support the CCTST means reported
Zak 12.
Ilections gl gz Taualit ig Prior id math' And ggzdz ?ostust Amu
21.8C (28)
19.00 (4)
18.8018,6018.40
N 18.20 (8)
N 18.00A 17.80N 17.60
17.40 (10)
17.20 (0) (13)
17.00 (7)
16.80
C 16.60 (2)
C 16.40
T 16.20 (6)
S 16.00 (3) (5) (15)(20)
T 15.8015.60
15.4015.20
27 58 68 52 53 46 33 88 127 89 38 42 4
/Author of Students Taking CCTST
The six factors reviewed here are frequently regarded to be important in deciding
the gcneral fitness of candidates for instructional positions. At the least, they are thought
of as :rude indices of teaching effectiveness. But in this research they turned out either
15
1 7
not to be significant or to have relationships to the outcome variable which were
unexpectedly complex. Such findings lead to speculations about faculty evaluation policies
which this investigator consigns to the wisdom others. However, of greater importance is
what these negative findings suggest about those factors which might, indeed, make a
difference -- specifically the utilization of particular CT classroom activities, projects,
instructional materials, and pedagogy. Future research may confirm the emerging
consensus among advocates of CT in the college curriculum that who teaches the CT
course is probably less important than how the CT course is tauf,ht.
Hypothesis: We All Teach CT
In view of the results reported here and in Technical Report #1, CT enthusiasts can
justly feel proud that their instructional efforts lead to measurable improvements in
students' CT skills. However, it is widely argued in the academy that all good instruction --
almost, but not quite by definition -- does (or should) nurture students' CT skills. Clearly
some find it to be an implied criticism to suggest that because CT courses emphasize CT
outcomes, other courses in the curriculum do not. In view of the findings presented here,
this reaction, however, is inappropriate. Pride in one's teaching does not require that one
teach all things. An honest evaluation of one's value as an instructor, or of the value of a
course or program of study, should not presume that CT skill development must be an
intended outcome. Now that this outcome can be distinguished and measured separately
from others, questions as to whether or not it should be part of a given course of study
become curricular judgments and the success of achieving such an outcome becomes an
empirical matter.
Wise and sensible educators emphasized the importance of learning how to think
1618
logically long before the CT movement blossomed in the late nineteen eighties. Indeed, it
is not unreasonable to expect that the entire baccalaureate educational process might have
been intended to result in the enhancement of those skills we now identify with the name
"critical thinking." However, whether it does or not is now a testable question.
To evaluate the hypothesis that the baccalaureate experience in general leads to a
growth in CT skills it was predicted that the CT of veteran college students would be
stronger than those of younger or less experienced students. Operationally, if this were so,
then one might predict a positive linear correlation between CT skills and age, or between
CT skills and the number of college uaits earned. However, as indicated in Table 1 above,
efforts to discover such results using the CCTST failed.
A second way of trying to test the intuition that all good instruction includes CT
instruction, was to isolate a specific course, not unlike the required CT course, and
determine if a measurable growth in CT skills occurred in that course. For this purpose
Introduction to Philosophy was selected. Intro. to Philosophy, like the four CT courses, is
a lower division general education offering with a student clientele which is comparable to
the cadre enrolled in the four approved CT courses. Instructors of Intro. Phil. indicate
that while teaching CT is not their main goal, they do spend some time, perhaps a week or
two, on common fallacies of reasoning. Also they do emphasize and attempt to model
clear and logical thinking throughout the semester.
As indicated in Technical Report #1 in Nov. '89, 126 Introduction to Philosophy
students took the CCTST under the same controlled conditions as obtained in the Nov. '89
posttest of the four CT courses. In Feb. '90, 124 students from three matched sections of
Intro. Phil. were pretested using the CCTST. The Feb. '90 pretest mean w:.1., 15.436 and
the Nov. '89 posttest mean was 15.476 revealing a gain of +.04. The t-statistic for this
1719
-xperirrent was .08 and the null hypothesis, that there was no significant difference
between the two groups, was retained with P=.938.
In May '90 these same three sections were given the CCTST as a posttest. The May
'90 mean was 16.356 as compared to the Feb. '90 pretest mean of 15.722 for the 90
students who complete both the Feb. '90 pretest and the May '90 posttest. The differeixe
( + .63) is not statistically significant (t-statistic =1.69, two-tail p=.94). To confirm that the
spring and fall groups were reasonably comparable, one could compare the overall May
'90 posttest mean of 15.722 with the Nov. '89 posttest mean of 15.476. The non-significant
difference of 0.246 warrants the assumption that the CT skills of these groups are
reasonably consistent semester to semester.
It may be the case that all good instructors teach CT, however the hypothesis that
students learn CT as a natural by-product of their college education was not confirmed by
this experiment. In courses were the development of CT was both the chief educational
goal of instruction and assessment, measurable development in CT skills was evident on
the ccrsT. But in courses, such as Introduction to Philosophy, where instructors, while
not neglecting CI', rightly emphasize other educational goals, development in CT skills, as
measured by the CCTST, was not evident. This is not a criticism of Introduction to
Philosophy or any other course. It is, rather, a candid acknowledgement, based on the
evidence at hand, that curricular and pedagogical energies must be directed primarily
toward CT skill development if such development is to be a measurable outcome of
baccalaureate level general education.
18 1") II4.. v

Conclusion
Critical thinking skills, as measured on the CCTST, can be predicted by a
combination of SAT verbal, SAT math, and GPA data. CT skills are positively correlated
with reading ability and, hence, the use of the CCTST for non-native English speakers is
strongly counter-indicated. Of those instructor-factors which are thought to be related to
effectiveness in teaching CT skills, only years of teaching experience and prior experience
teaching CT appear to be related, and their relationships are non-linear. Given the
effectiveness of the CC TST as an assessment tool, it was applied to the hypothesis that CT
skill development is a natural outcome of baccalaureate education. No evidence for that
hypothesis, either in general, or by reference to a control group experiment, could be
discove: ed. This result, however, need not be viewed negatively or with concern. Not all
professors teach all subjects, not all professors teach all skills. The CCTST, as a student
assessment tool, has strong concurrent validity with other important assessment devices
and measures of student aptitude and achievement such as SAT, EPT, ELM, GPA, and
Nelson-Denny Reading Test.
Technical Report #3 discusses analyses performed on additional student-related
factors such as academic major, CT self-esteem, gender, and ethnicity. Technical Report
#4 provides group norms for the overall CCTST score and for the CCTST sub-scores on
analysis, evaluation, inference, deductive reasoning and inductive reasoning skills.
Partial Bibliography
Baron, Joan B., and Sternberg, Robert J., Teaching Thinking Skills: Theory andPractice, W. H. Freeman Publishing, 1987.
Ennil, Robert H., "Problems in Testing Informal Logic CT Reasoning Ability,"Informal Logic v6. nl, p3-9, 1984.
, "A Bibliography of Testing CT," CT News, Center for the ReasoningArts, CSU Sacramento, v6, nl, Sept.-Oct. 1S87.
1921
Ennis, Robert H., and Norris, Stephen P., "CT Testing and Other CT Evaluation:Status, Issues, and Needs," in Issues in Evaluation, Algina, .;ames(Eds.), Ablex Press, New York, NY, 1988.
Facione, Peter A., "Assessing Inference Skills," ERIC Clearinghouse on Tests,Measurement, and Evaluation, Doc. No: TM 012917, Mar. 1989.
, (a) Critical Thinking: A Statement of Expert Consensus for Purposesof Educational Assessment and Instruction, California Academic Press,Millbrae CA, 1990; ERIC Clearinghouse on Tests, Measurement, andEvaluation; Doc. No: TM 014423, Feb. 1990.
, (b) "Strategies for Multiple Choice CT Assessment," in CT at Collegesand Universities, David Hitchcock, (Ed.), Vale Press, Newport News, VA,1990, forthcoming.
, (c) "CCTST Technical Report #1 -- Experimental Validation and ContentValidity," California Academic Press, Millbrae CA, Nov. 1990., (ERICDoc. No: TM 015818).
, (d) "California Critical Thinking Skills Test: College Level,"California Academic Press, k17 La Cruz, Millbrae, CA, 94030, Dec. 1990.
Kurfiss, Joanne G., Critical Thinking: Theory, Research, Practice, andPossibilities, ASHE-ERIC Higher Education Report Number 2, WashingtonDC, ASHE, 1988.
Modjeski, Richard B., and Michael, William B., "An Evaluation by a Panel ofPsychologists of the Reliability and Validity of Two Tests of CT,"Educational and Psychological Measurement, v43, n4, p1187-97, Winter1983. (The tests reviewed were the Watson-Glaser CT Appraisal and theCornell CT Test.)
Norris, Stephen P. "Evaluating CT Ability," History and Social ScienceTeacher, v21, n3, p135-146, Spr. 1986.
, "Verbal Reports o Thinking and Multiple-Choice CT Test Design,"Technical Report No. 447, Champaign, IL: Center for the Study ofReading, University of Illinois, (ERIC Doc. No: ED302826.)
, "Effect of Eliciting Verbal Reports of Thinking on CT TestPerformance," Journal of Educational Measurement, v27, nl, 1990.
Norris, Stephen P.; and Ennis, Robert H., Evaluating CT, Midwest Publications,Pacific Grove, CA, 1989.
Passmore, J., 'On Teaching to be Critical," The Concept of Education,Routledge and Kegan Paul, London, p192-211, 1967.
Pecorino, Philip, "CT Bibliography," Newsletter on Teaching Philosophy,American Philosophical Association, p18, Summer 1987.
Resnick, L. W., Education and Learning to Think, National Academy Press, 1987.Siegel, Harvey, Educating Reason: Rationality, CT, and Education, Routledge,
London, 1988.Sternberg, Robert J., "CT: Its Nature, Measurement, and Improvement," National
Institute of Education, Washington, DC, 1986.Thompson, B., and Melancon, J. G., "Validity of a Validity Measure of CT
Skills," Psychological Reports v60, p1223-1230, 1987.
&mimics
(1) Unlike the sampk for the Nov. posttest which was independent of other administrations of the cern, the ume students weresampled for both the Feb. pretest and the May posttest.
(2) Enrollments is these four courses amount for 85% of the CT enrollment at Califon& State Unhemity, Fullerton with the majority
of sections being found in the two Philonophy Dept. offerinp.
2 0
2 2
(3) Findings related to factors such as academic major, CT self-crnfideace, geader, and ethnicity arc treated in detail is TechnicalReport #3. Ilmiever, them valuable human differ:aces um out sot So be natinhally significaet in predicting cr sks malts oa theCCITT whom mie consols for thase more telling differences aeon people, such as sdialmtic aptitude mad reading shay.
(4) Tweatrak of the *Wean for whom Neban-Deasy wares were available also lnd SAT mores cm record. Por these 26 cams the=mons of the SAT verbal score with the Nelms-Deasy Vocababry Scom, Compreheinias Scum mad Thuil Saxe woe significanat p<1101. The correlations of the SAT math score with the Nelms-Denny Vocabulary sad Total Score were significant at pc.01.Conelstion with Neboo-Dimay scores and GM or college mils earned were sot statistienly ngsifimat for these 26 cams.
(5) That aos-astive &Oa speakers show no change after having completed an approved CT course should be a matter of majormama to the campus and the CSU system which require thst al shaken sat* a CT requiremeet. At the dam of this research thecr requireasen could sot be sstisfied by any mesm other than seccernfully completing as approved CT course. It is reammeaded thatstudent outcomes research an non-natin English speakers should be umtlettehm is the au to di:semi= if such policies as this are
equitable.
2123