Embed Size (px)
Citation preview

Ecosystem services assessment
methods of Ukraine’s habitats
for nature conservation
Yakiv P. Didukh

Ecosystem services are considered as
tools for ecosystem impact assessment
(general environmental risks and risks of
ecosystem loss based on relevant
calculations). Ecosystem services appear
as benefits that society receives from
ecosystems.(Konstanza et al., 1997; МЕА 2005; TEEV, 2010).

Economists regard them as
economic category, contributing to
creation of environmentally friendly
economies and falling under
financial terms. In this narrower
sense many of the available
ecosystem services remain out-of-
focus.
Environmental services are the means of
the National Environmental Policy in the
XXI century, which implies the close
interaction of its economic, environmental
and technological components. These are
the tools for the assessment of
ecosystem use in sustainable regional
development.

THE COMPONENTS OF ECOSYSTEM
SERVICES
R - resource component (production,
procurement) – measured in currency
F - regulatory component (support of
ecosystem functioning) – measured in
energy units)
I - socio-informational component
(satisfaction of the cultural and
axiological requirements and needs) –
measured in points. (ТЕЕВ, 2010).

The challenge: finding the appropriate
assessment methods for ecosystem services,
assessment of the three fundamental
components in one dimension for equal-sized
ecosystems (habitats).
It is important to choose a basic unit for
comparison (elementary ecosystem, biotope,
habitat).
E =R ($); E (Joule); I (points)

BIOTOPE (HABITAT) IS...
Historically established ecosystems,
characterized by a specific organization,
structure, integrity and functioning
object for classification, spatial measurements
(at topological level) and ecosystem mapping;
the object for specific- and coenotic-level
biodiversity conservation;
the base unit for “ecosystem services“
assessment.

G. Forest biotopes EUNIS: G1.A2 Non-riverine [Fraxinus] woodland
NATURA 2000: Pal. Hab. Clas.: 41.3 Non-riverine [Fraxinus] woodland
Garlic ash-oak forests
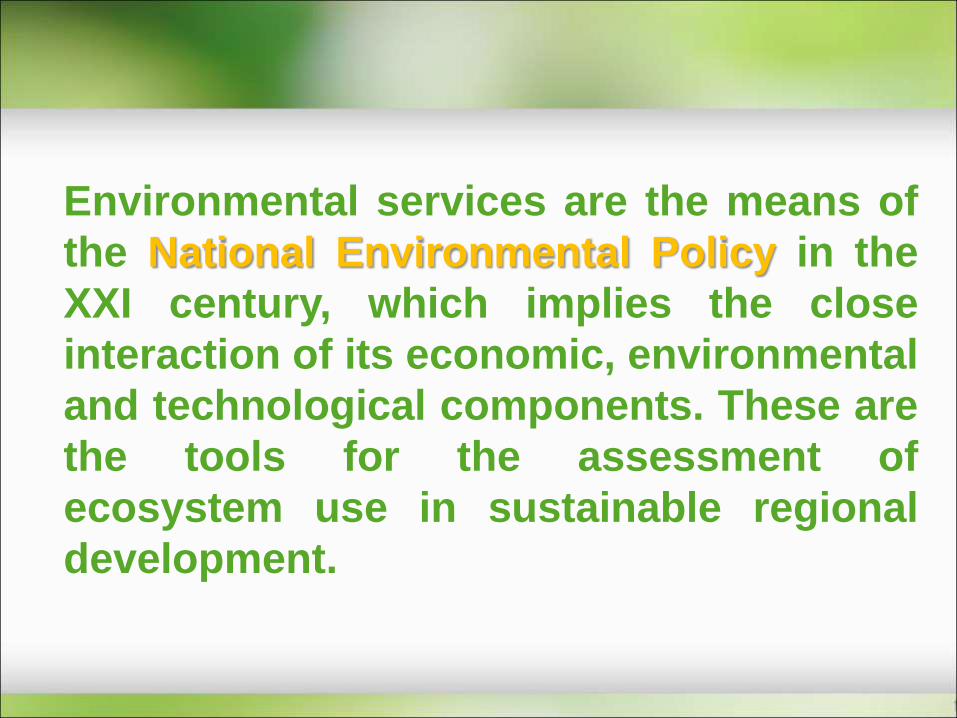
D. Water-logget biotopes (bogs, fens and water-fringe vegetationEUNIS: D1.11 Active relatively undamaged raised bogs
Natura 2000: 7110 Active raised bogs
Pal. Hab.: 51.11 Bog hummocks, ridgesand lawns

H. Biotopes formed by
geomorphological
processes
EUNIS: E1.11 Euro-
Siberian rock debris
swards
Natura 2000: 6110.
Rupicolous calcareous
or basophilic grasslands
of the Alysso-Sedion albi
Pal. Hab.:34.11 Euro-
Siberian rock debris
swards

This economical category of services is
estimated in monetary equivalent(Emerton et al., 2006).
In Ukraine this problem is complicated
by the fact that we need to develop
special tools, legislative documents for
the refund of monetary resources
covering ecosystem loss and ensuring
ecosystem restoration.
RESOURCE COMPONENT - R

REGULATORY (FUNCTIONAL) COMPONENT (F)
Evaluation of regulatory (functional)
component can be performed through the
assessment of ecosystem energy
performance, which can be calculated
through biomass contents or carbon pool
and subsequently converted to monetary
units.

Monitoring of terrestrial
ecosystems conditions
and changes


GENERAL PHYTOMASS 100 % - gain 3%
ABOVEGROUND
MASS
UNDERGROUND
MASS
CONSUMERS MASS
Energy potential of biomass 18.06 GJ/t
MASS СО2
Energy potential О2
14.7 Г GJ/t
Energy potential О2
7.14 GJ/t
OVERALL ENERGY POTENTIAL
Forest 65%
Lowland bogs 330%
Transition bogs 290%
Raised bogs 260%
Meadows, steppes 90%
MASS О2
140 % from gain
Forest, bog* age (years)
Steppe * 10
Meadows * 5
Disturbed steppe *50
Disturbed meadows
* 25
Grazing , mowing
Grasslands 47 %
Others 10 %
DECAY MASS Grass plants 70 %
Trees and shrubs 3 %
(From overall phytomass)
Forest, bog, steppe* 10 Meadows *3
years of age
The scheme of ecosystem damage assessment in different ecosystem
types and their components based on energy indices
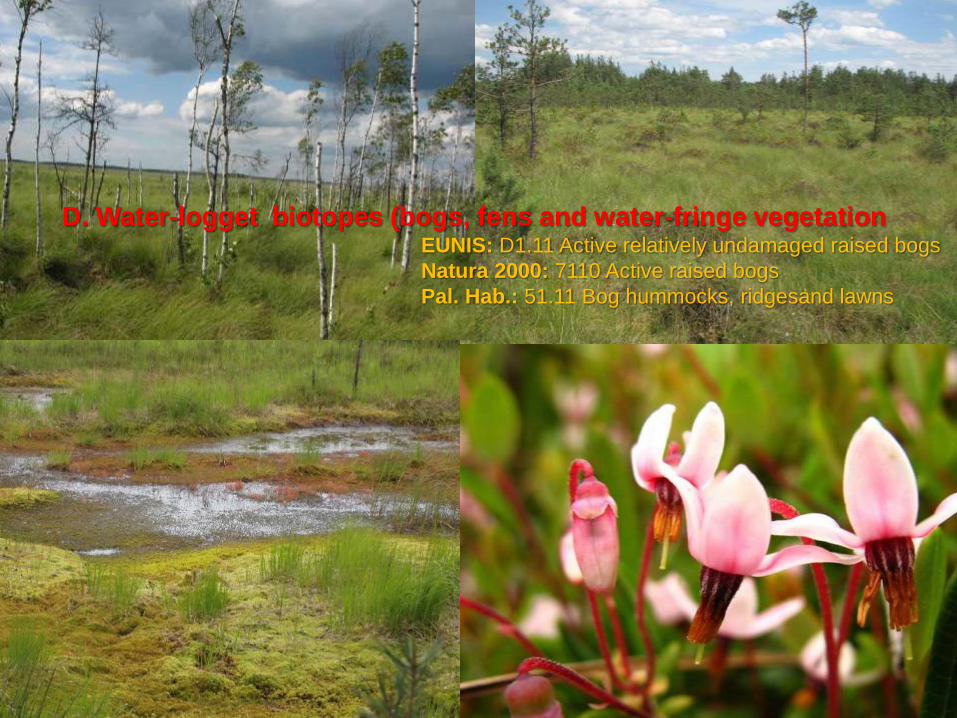
We have established the correlation
of energy performance indices for
various ecosystems (habitat) types:
C - aquatic ecosystems;
D - swamps;
E1 - meadows;
E2 - steppes;
G - forests.

G
g
G
f
D
L
M
K
R
P
S
GfGg
DM
S
KP
R
L
Y =14 : 1
Y = 1 : 4
K – energy of biomass disposed by consumments, L – gross energy of biomass, P – energy of increment,
М – energy of decay, D – energy of organic waste, R – energy of respiration, Gg – energy of humic acids in
soil, Gf – energy of fulvic acid in soil, S – energy of synthesis, Y – ecosystem stability degree
Comparative assessment of energy indices in different forest and steppe ecosystem
components

Forests
Ecosystem energy pool:

Biomass
(100 %)
СО2 (65%) О2 (140%)
Decay (
3%
)
INTERRELATION OF ENERGY POOLS BETWEEN
DIFFERENT COMPONENTS OF FOREST ECOSYSTEMS
Consumers (10%)
Gain
(3%
)

Swamps

Decay
(3 %)
Biomass
(100 %)
СО2 О2 (140%)
Peat
Oligotrophic (260%)
Mesotrophic (290%)
Eutrophic (330%)Consumers (10%)
INTERRELATION OF ENERGY POOLS BETWEEN
DIFFERENT COMPONENTS OF SWAMP ECOSYSTEMS

Steppes

INTERRELATION OF ENERGY POOLS IN
STEPPE VEGETATION
СО2 (90%)
Dec
ay (
20
%)
Bio
mass (
100%
)
О2 (140%)
Co
nsu
mers
(4
7%
)
Ga
in (
20
%)

Meadows

Biomass
(100 %)
СО2 (90 %) О2 (140 %)
Decay (20 %)
Consumer (47%)
Gain (20 %)
INTERRELATION OF ENERGY POOLS IN MEADOWS

AGRICULTURAL ECOSYSTEMS
Area
32480 000 ha = 53.8%
Energy pool
10.39∙1018 J = 26%
Energy gain
10.39∙1018 J

EVALUATION OF THE MATHEMATICAL TOOLS FOR
THE CALCULATION OF ECOSYSTEM DAMAGE

ENERGY REQUIREMENTS FOR THE RESTORATION
OF 1 HECTARE OF DIFFERENT ECOSYSTEM TYPES
Oligotrophic bogs
20 Tcal/ha
Meso- and
Eutrophic bogs
10-12 Tcal/ha
Forests (100 – 140 years)
10-11 Tcal/ha
Forests (40 – 60 years)
5 Tcal/ha
Bogs without peat
5 Tcal/ha
Steppes 0.5 Tcal/ha
Meadows 0.2 Tcal/ha

I – SOCIO- INFORMATIONAL COMPONENT
Appears in various aspects that are
difficult to consider and assess:
cultural, scientific, recreational,
conservational value etc.
It can not be converted to currency
or estimated in relative units (points).

Factors4 3 2 1
1. Influence of
anthropogenic
transformation
complete
destruction and
restoration from
pioneer stages
changes of dominant
structure
species composition
changes
minor changes or
development under
anthropogenic factors
2. Sustainability VERY LOW LOW SATISFACTORY GOOD
3. Position in succession
row in relation to
anthropogenic
successions
terminal stable
climax and
subclimax stages
endoecogenetic stages,
not affecting the
changes of soil and
microclimate
serial syngenetic
stages, not affecting
soil and microclimate
pioneer, short stages
4. Regional
representation
occurs at the
geobotanical
district level
occurs at the
geobotanical
subprovince level
occurs at the
geobotanical region or
physiographic zone
level
occurs at the level of
several geobotanical
regions or
physiographic zones
5. Distribution features several small
localities
has disjunctive range occurs sporadically at
the edge of the range
widely occurs under
favorable conditions
6. Ecological amplitude has narrow (<5%)
amplitude in
several edaphic
factors
has narrow (<5%)
amplitude in one
factor and <10% - in
majority of edaphic
factors
has <10% amplitude in
more than one edaphic
factors
has >10% amplitude
in various edaphic
factors
CONSERVATIONAL ASSESSMENT OF BIOTOPES ACCORDING TO YA. P. DIDUKH (2012)
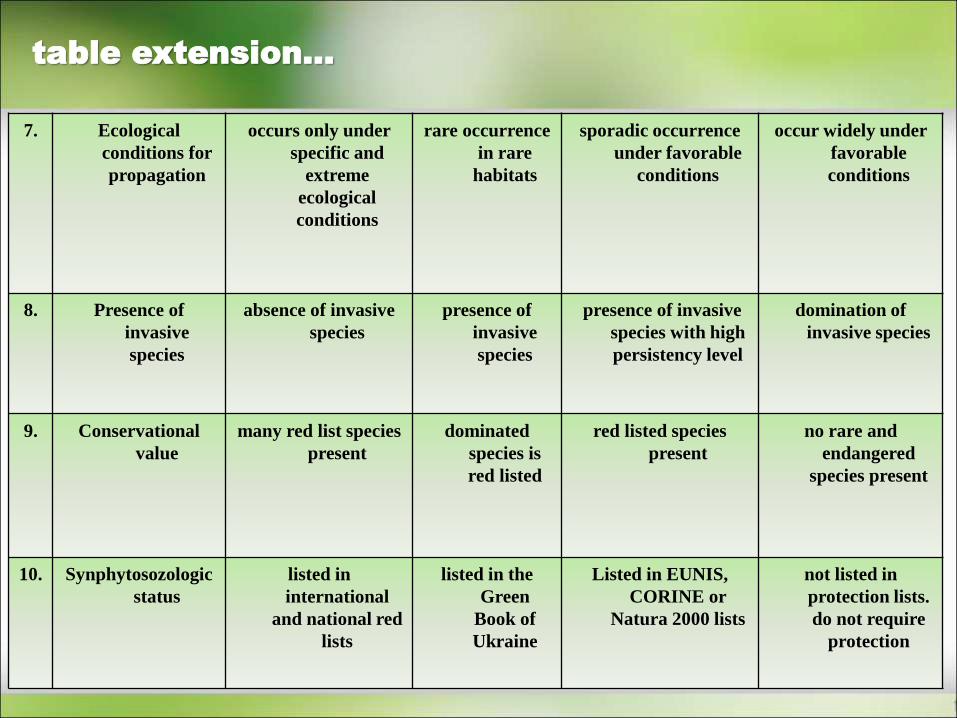
7. Ecological
conditions for
propagation
occurs only under
specific and
extreme
ecological
conditions
rare occurrence
in rare
habitats
sporadic occurrence
under favorable
conditions
occur widely under
favorable
conditions
8. Presence of
invasive
species
absence of invasive
species
presence of
invasive
species
presence of invasive
species with high
persistency level
domination of
invasive species
9. Conservational
value
many red list species
present
dominated
species is
red listed
red listed species
present
no rare and
endangered
species present
10. Synphytosozologic
status
listed in
international
and national red
lists
listed in the
Green
Book of
Ukraine
Listed in EUNIS,
CORINE or
Natura 2000 lists
not listed in
protection lists.
do not require
protection
table extension...

CONSERVATIONAL ASSESSMENT OF THE RARE
HABITATS OF THE KRASNA RIVER VALLEY
Biotopes/Habitats
Infl
uen
ce o
f an
thro
pogen
ic
tran
sform
ati
on
Su
stain
ab
ilit
y
Su
cces
sion
ser
ies
Reg
ion
al
rep
rese
nta
tion
Dis
per
sal
chara
cter
Eco
logic
al
am
pli
tud
e
Eco
logic
al
con
dit
ion
s
Invasi
ve
spec
ies
pre
sen
ce
Con
serv
ati
on
al
valu
e
Syn
ph
yto
sozo
logic
al
valu
e
Tota
l p
oin
ts
Ran
k
F 4.2111 dominated by
Artemisia hololeuca3 2 4 4 4 4 4 4 4 3 37 І
F 4.2111 b dominated by
Hyssopus cretaceus0 2 4 4 4 4 4 4 4 3 36 І
Е 2.2131 b and Е 2.2132 b: dominated by
Carex pediformis4 4 4 3 3 4 4 4 4 4 38 І
Е 2.2131 а and Е 2.2132 а: dominated by
Carex humilis4 4 4 3 4 4 3 4 4 4 38 І
Е 2.2131 dominated by
Helianthemum сretophilum4 4 4 4 4 4 4 4 4 3 39 І
Е 2.1311 dominated by Stipa capillata 3 3 3 1 1 3 1 3 3 3 24 ІІІ
E 2.1312 dominated by Stipa lessingiana 3 3 3 2 3 3 1 3 4 3 28 ІІІ
Е 2.2131 d: dominated by Stipa pennata 3 3 3 3 3 4 3 3 4 4 33 ІІ

Biotopes are evaluated by 12 indicators
using 4-point scale, based on the formula:
E = (N - 12)∙2.77Calculated significance percentage index
reflects the five degrees of ecosystem
loss risk:
І-ІІІ – habitats of regulatory type (E + I> R),
require protection;
IV-V – habitats of resource type (E + I <R),
do not require protection.

HABITAT MAPPING
Habitat maps are of great
importance as they represent
the basis for the development
of ecological networks and
“eco-corridors”

FI
R

I - informational
F - functional
R - resource

This approach is far from being
perfect for proper direct assessment
of ecosystem services,
however, it can be used indirectly to
assess and effectively allocate best
conservation cores, buffer zones,
ecological corridors and transit zones
in biosphere reserves, national parks
and other protected areas.

HABITAT MAP OF SHATSKIY NATIONAL NATURE PARK
(ACCORDING TO EUNIS CLASSIFICATION) 1:100000Умовні позначення:
– G3.42112. Субконтинентальні соснові лишайниковіліси
– G3.42111. Субконтинентальні соснові зеленомошніліси
– G3.4F. Штучні лісонасадження з Pinus sylvestris
– G4.7. Мішані ацидофільні ліси Pinus sylvestris -Quercus
– G1.A. Мезо- та евтрофні ліси з Quercus, Carpinus, Fraxinus, Acer, Tilia, Ulmus
– G1.52. Вільхові болотні ліси на кислому торфі
– G1.4. Дрібнолистяні болотні ліси не на кислому торфі
– G1.9. Позазаплавні ліси з Betula, Populustremula– G1.513 Мезо-ацидофільні болотніберезові ліси
– G1.513. Мезо-ацидофільні болотні березові ліси
– C3.2. Прибережні постійно обводнені заростіочерету та інші високі гелофітні угруповання
– D5.2. Угруповання високих осок, зазвичай, тимчасово обводнені
– D2.3. Відкриті або пригнічено рідколісніперехідні болота і трясовини
– D1.1. Верхові болота
– E3.4. Сирі або вологі евтрофні та мезотрофнілуки
– E2.1. Мезотрофні пасовища та відновленіпісля випасу луки
– C1.1. Оліготрофні ставки й озера
– C1.2. Мезотрофні ставки й озера
– C1.3. Евтрофні ставки й озера
– J1. Міста, містечка та села
– I1. Біотопи сегетального типу
– G3.A1. Ялинові ліси
– J4. Транспортні мережі та інші конструкції зтвердим покриттям

In Ukraine, there are 7 Biosphere Reserves (4 of
which are transboundary), currently considered
as models for sustainable regional development
providing monitoring of ecosystems under global
climate changes (the Madrid Action Plan, Dresden
Declaration).
BR have great political, social, economic,
educational, scientific value, but in order to fully
understand it we need to assess their ecosystem
services. For this reason we need to develop
approaches to such ecosystem assessment.

THE NETWORK OF EXISTING AND PROSPECTIVE
BIOSPHERE RESERVES IN UKRAINE

Objectives should include the
development in two directions:
1. Implementation of the preceding developments, TEEA
developments in relation to Ukraine and its various
regions, development of practical recommendations for
political and administrative units – “broadwise approach”.
2. The development and improvement of new methods
and approaches for ecosystem assessment on the basis
of “ecosystem services“ concept and their testing on
model sites in Ukraine – “depthward approach”.

THANK YOU FOR
YOUR ATTENTION !