Embed Size (px)
Citation preview

Ecosystem exploitation and trophodynamic indicators: a comparison between the Northern Adriatic Sea and
Southern New England
Fabio Pranovi* & Jason S. Link**
*Dipartimento di Scienze Ambientali, Università di Venezia -Italy
**NOAA, National Marine Fisheries Service Northeast Fisheries Science Center -USA

Semi-enclosed basin
surface area 14178 km2
average depth <35 m
strong riverine outflows
recurrent eutrophication
high fishing pressure
Peculiarity:
‘Atlantic lacuna’
Northern Adriatic Sea

Open system
surface area 64060 km2
average depth 60 m
water flows northeast to southwest
high fishing pressure
Southern New England
Very high primary production

Model descriptions
years of reference 1997-200020 nodes Phytoplankton - Piscivorous fish
years of reference 1996-200033 nodes Phytoplankton – Whales/highly migratory sp.
NAS SNEOriginal structure
Differences due to geographical and oceanographic features, data availability, and different degree of food web aggregation
Aggregation according to the main ecological compartments
NAS SNE (number of original nodes)
Plankton 4 9Benthos 8 7Nekton 5 11Mammals/birds - 4Detritus 3 2Fishery 5 1
Ecosystem structure comparison
Biomass
Production
NAS SNEB/P 4.48 1.37B/N 2.97 2.94N/P 1.51 0.47
NAS SNEB/P 0.09 0.03
B/N 5.76 14.38 N/P 0.02 0.002
0
0.2
0.4
0.6
0.8
Plankton Benthos Nekton Mam./Birds
NASSNE
0
0.2
0.4
0.6
0.8
1
Plankton Benthos Nekton Mam./Birds
NASSNE
%
%
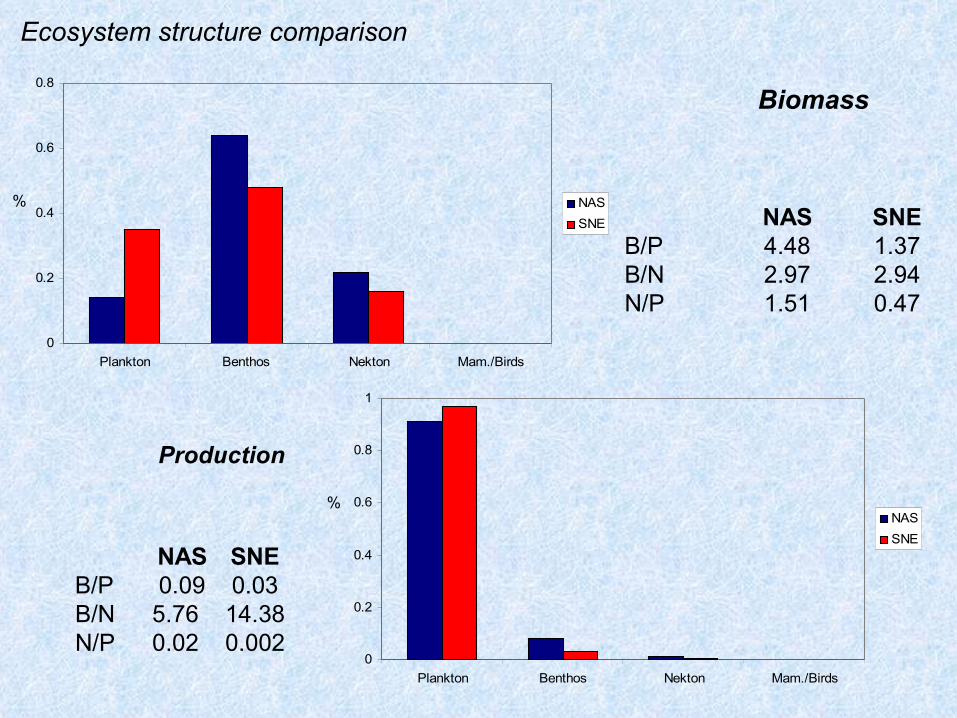
Total biomass vs Trophic Level
Ecosystem structure comparison
0
0.2
0.4
0.6
0.8
1
1.2
0 1 2 3 4 5 6
Trophic Level (TL)
Tota
l Bio
mas
s (%
)
NASSNE
{
Biomass accumulation
0
2000
4000
6000
8000
10000
12000
14000
16000
18000
20000
Sum of allconsumption
Sum of allexports
Sum of allrespiratory
flows
Sum of allflows intodetritus
Total systemthroughput
Sum of allproduction
NASSNE
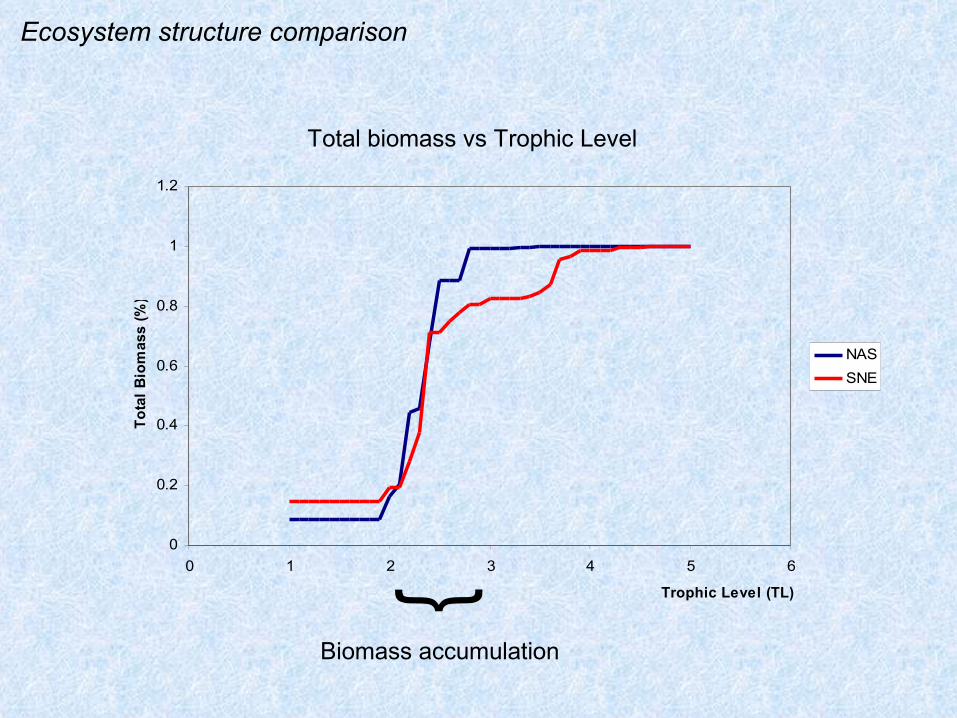
Ecosystem comparison in terms of flows
In absolute terms,SNE 3-4 times higher than NAS
tC/TST 43% NAS 47% SNE
tPP/tR 1.23 for both
TST and TE
NASTE=8.4%
SNETE=15.5%
IIIIIIIVV
57% 55%
38% 36%
7%4%
1%0.4%
0.1%0.02%
TE 10.7
TE 10.7
TE 5.1
TE 4.5
TE 20
TE 13.5TE 13.7
TE 11.5

overall effect
-4.0
-3.5
-3.0
-2.5
-2.0
-1.5
-1.0
-0.5
0.0
0.5
KS
Keystoneness index
overall effect-2.2
-2
-1.8
-1.6
-1.4
-1.2
-1
-0.8
-0.6
-0.4
-0.2
0
KS
Libralato et al., Ecol. Mod., 2006
NAS
SNE
∑≠
=n
ijiji m2ε
Overall effects (estimated by MTI matrix)
Keystoneness index (overall effect weighted for biomass)
KSi=[log(εi(1-pi)]
Large copepods
Gelatinous zooplankton
Phytoplankton
B. detritus feeders
B. omnivores
Phytoplankton
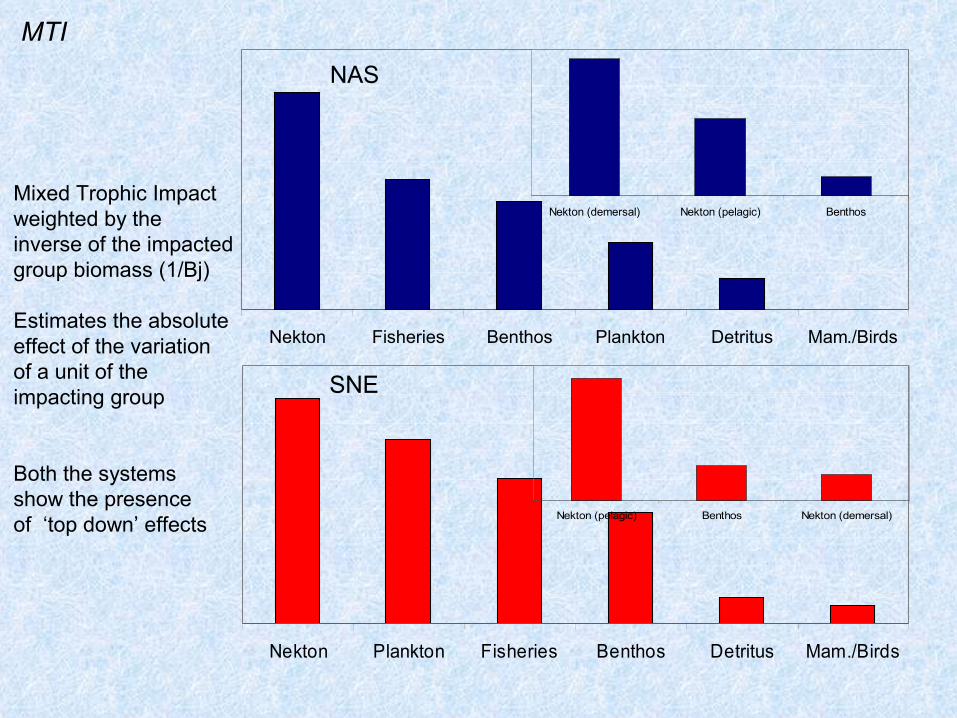
Nekton Fisheries Benthos Plankton Detritus Mam./Birds
Nekton Plankton Fisheries Benthos Detritus Mam./Birds
MTI NAS
SNE
Mixed Trophic Impactweighted by the inverse of the impacted group biomass (1/Bj)
Estimates the absoluteeffect of the variationof a unit of the impacting group
Both the systemsshow the presence of ‘top down’ effects
Nekton (demersal) Nekton (pelagic) Benthos
Nekton (pelagic) Benthos Nekton (demersal)
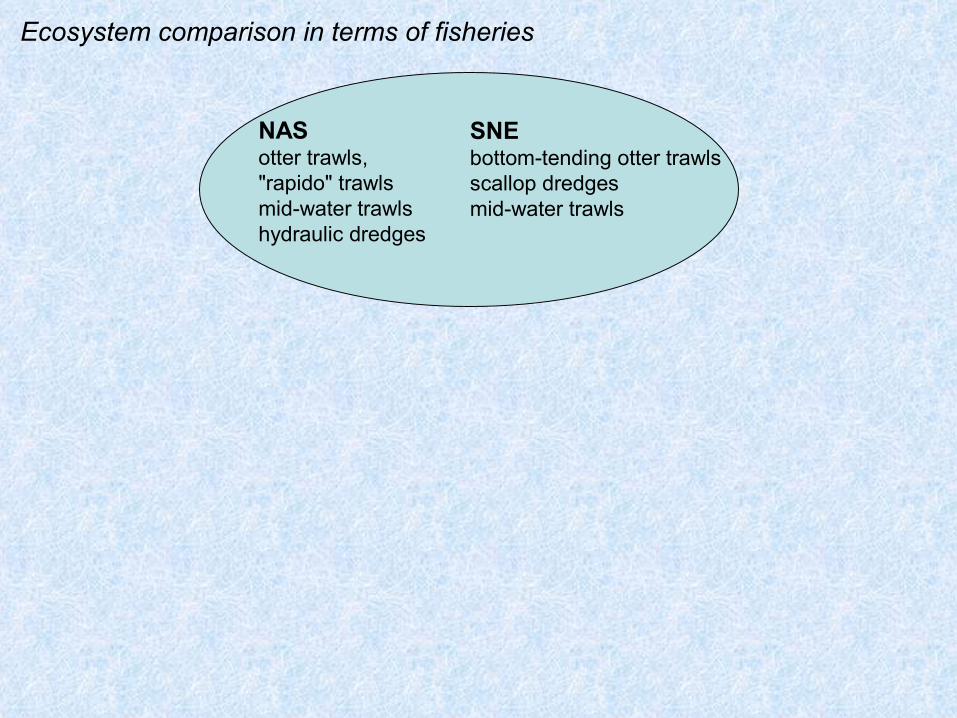
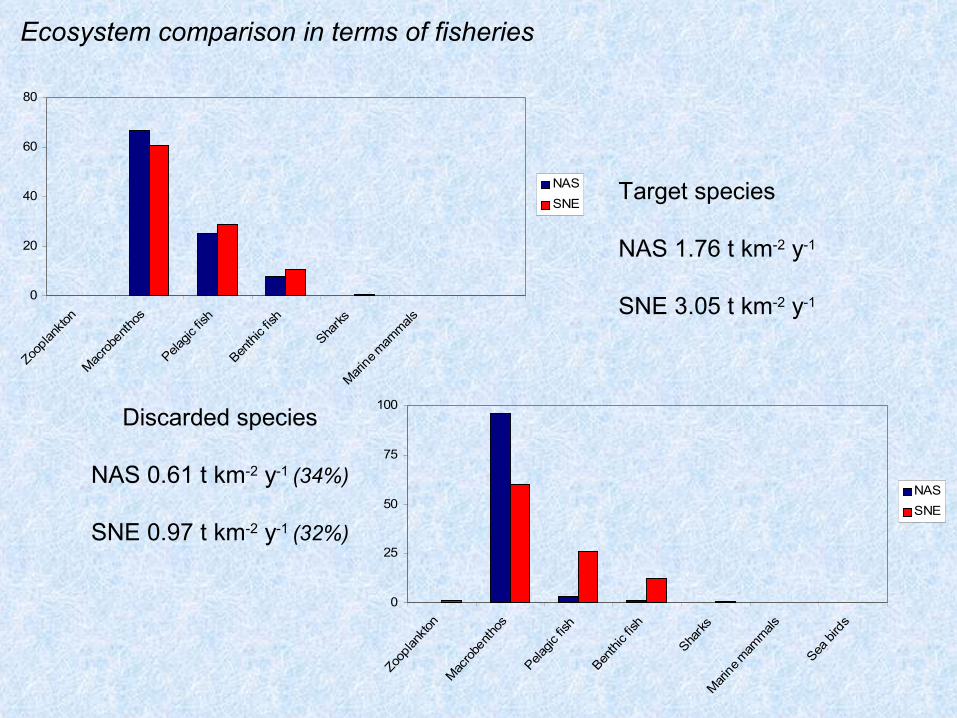
Ecosystem comparison in terms of fisheries
NASotter trawls, "rapido" trawlsmid-water trawls hydraulic dredges
SNEbottom-tending otter trawls scallop dredges mid-water trawls
0
20
40
60
80
Zooplan
kton
Macrob
enthos
Pelagic
fish
Benthi
c fish
Sharks
Marine m
ammals
NASSNE
0
25
50
75
100Zo
oplan
kton
Macrob
entho
s
Pelagic
fish
Benthi
c fish
Sharks
Marine
mam
mals
Sea bi
rds
NASSNE
Ecosystem comparison in terms of fisheries
Target species
NAS 1.76 t km-2 y-1
SNE 3.05 t km-2 y-1
Discarded species
NAS 0.61 t km-2 y-1 (34%)
SNE 0.97 t km-2 y-1 (32%)

Total catch/P Total catch/Q
NAS SNE NAS SNEBenthos 0.69 0.03 0.14 0.01Nekton (pelagic) 0.02 0.06 0.01 0.01Nekton (demersal) 0.11 0.14 0.03 0.07
TE PP TLc PPR % gCm-2y-1 %
NAS 8.4 142 2.57 13.0
SNE 15.5 539 2.90 7.6
Fisheries and ecosystem functioning
Total catchNAS 2.36 t km-2 y-1
SNE 4.03 t km-2 y-1

TEPTEPPRL
TLc
ln1
1
⋅⋅−=
−
Libralato et al., MEPS (in press)
NAS 0.1081
SNE 0.11650
500
1000
1500
2000
2500
1 2 3 4 5
TL
Prod
uctio
n
Loss of production
Y2
Y3
Y4
L index
To use the loss in production as a proxy for quantifying the
disruption of the ecosystem due to
fishing harvesting
Overfished!
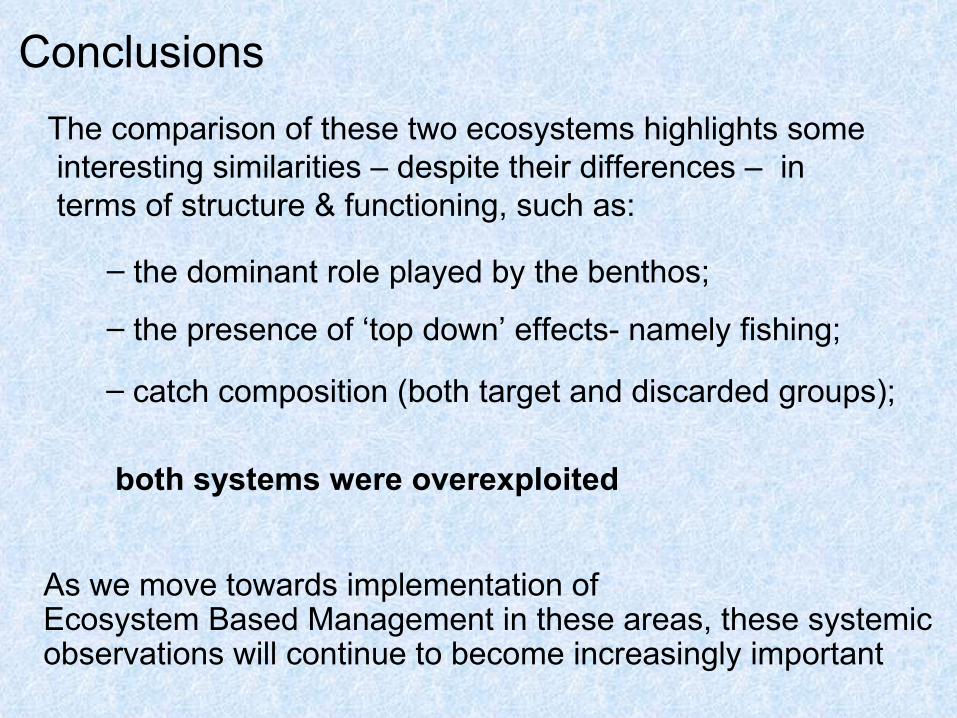
Conclusions The comparison of these two ecosystems highlights some
interesting similarities – despite their differences – in terms of structure & functioning, such as:
– the dominant role played by the benthos;
– the presence of ‘top down’ effects- namely fishing;
– catch composition (both target and discarded groups);
As we move towards implementation of Ecosystem Based Management in these areas, these systemic observations will continue to become increasingly important
both systems were overexploited