Embed Size (px)
Citation preview

118
Ecophysiological variation of transpiration of pine forests: synthesis of new and published results
Pantana tor-ngern,1,2,3,9 ram oren,1,2,4 andrew C. oishi,5 Joshua m. uebelherr,6 sari Palmroth,1,2 lasse tarvainen,2 mikaell ottosson-löfvenius,2 sune linder,7
Jean-ChristoPhe domeC,1,8 and torgny näsholm2
1Nicholas School of the Environment and Earth Sciences, Duke University, Durham, North Carolina 27708 USA2Department of Forest Ecology and Management, Swedish University of Agricultural Sciences (SLU), Umeå SE-901 83 Sweden
3Department of Environmental Science, Faculty of Science, Chulalongkorn University, Bangkok 10330 Thailand4Hydrospheric-Atmospheric Research Center, Nagoya University, Chikusa-ku, Nagoya 464-8601 Japan
5USDA Forest Service Coweeta Hydrologic Laboratory, 3160 Coweeta Lab Road, Otto, North Carolina 28763 USA6School of Public Affairs, Arizona State University, Phoenix, Arizona 85004 USA
7Southern Swedish Forest Research Centre, SLU, P.O. Box 49, Alnarp SE-230 53 Sweden8UMR 1391 ISPA INRA, Bordeaux Sciences AGRO, 1 Cours du général de Gaulle, Gradignan Cedex 33175 France
Abstract. Canopy transpiration (EC) is a large fraction of evapotranspiration, integrating physical and biological processes within the energy, water, and carbon cycles of forests. Quantifying EC is of both scientific and practical importance, providing information relevant to questions ranging from energy partitioning to ecosystem services, such as primary produc-tivity and water yield. We estimated EC of four pine stands differing in age and growing on sandy soils. The stands consisted of two wide- ranging conifer species: Pinus taeda and Pinus sylvestris, in temperate and boreal zones, respectively. Combining results from these and pub-lished studies on all soil types, we derived an approach to estimate daily EC of pine forests, representing a wide range of conditions from 35° S to 64° N latitude. During the growing sea-son and under moist soils, maximum daily EC (ECm) at day- length normalized vapor pressure deficit of 1 kPa (ECm-ref) increased by 0.55 ± 0.02 (mean ± SE) mm/d for each unit increase of leaf area index (L) up to L = ~5, showing no sign of saturation within this range of quickly rising mutual shading. The initial rise of ECm with atmospheric demand was linearly related to ECm-ref. Both relations were unaffected by soil type. Consistent with theoretical prediction, daily EC was sensitive to decreasing soil moisture at an earlier point of relative extractable water in loamy than sandy soils. Our finding facilitates the estimation of daily EC of wide- ranging pine forests using remotely sensed L and meteorological data. We advocate an assem-bly of worldwide sap flux database for further evaluation of this approach.
Key words: canopy transpiration; leaf area index; Pinus sylvestris; Pinus taeda; relative extractable water; soil texture; vapor pressure deficit.
introduCtion
In a forest ecosystem, canopy transpiration (EC), the largest component of evapotranspiration (Roberts et al. 1980, Calder 1998), exerts great influence on the earth’s surface energy balance, affecting mesoscale circulation, weather patterns, and water supply to downstream systems (Avissar et al. 1985, Andre et al. 1989, Oishi et al. 2010, Manoli et al. 2016). Most ecological models predicting biosphere–atmosphere exchanges of energy, carbon, and water are driven by variations in both atmospheric and soil conditions and the responses of vegetation to these varia-tions (e.g., De Kauwe et al. 2013, Zaehle et al. 2014). These models predict transpiration and photosynthesis by con-sidering physiological processes such as stomatal response to soil moisture and atmospheric evaporative demand,
stand properties such as canopy leaf area, and site- specific factors such as local meteorology and soil properties (e.g., Woodward et al. 1995, Kowalczyk et al. 2006, Oleson et al. 2010). Despite substantive research on these physiological processes and site- level properties, an improved under-standing of how these factors interact and identification of consistent trends that can help provide useful parameters for models are still needed.
The importance of specific physiological processes varies with different spatial and temporal scales. In forests where stomata are well coupled to the atmos-phere, the diurnal course of leaf transpiration can be described empirically as a multiplicative set of responses reducing stomatal conductance from a maximum under favorable conditions, as light and atmospheric and soil humidity decrease and temperature fluctuates relative to the optimal (Jarvis 1976). Daily variation of leaf- scale stomatal conductance, and therefore transpiration, correlates well with changes in vapor pressure deficit (D) and soil moisture during the growing season (Granier
Ecological Applications, 27(1), 2017, pp. 118–133© 2016 by the Ecological Society of America
Manuscript received 29 January 2016; revised 6 July 2016; accepted 1 August 2016. Corresponding Editor: W. J. D. van Leeuwen.
9E-mail: [email protected]
ESTIMATING DAILY FOREST TRANSPIRATIONJanuary 2017 119
et al. 2000). This is because, during the growing season, daily stomatal conductance is relatively constant over a broad range of temperatures (Landsberg 1986).
At diurnal timescale, mean canopy stomatal con-ductance decreases linearly with the natural logarithm of D, consistent with the role of stomata protecting hydraulic function of the xylem by regulating the maximum transpiration rate and thus the minimum xylem water potential (Oren et al. 1999a). Based on this hydraulic theory of stomatal regulation, the higher the transpiration per leaf area (EL) at a reference D (=1 kPa, EL-ref), the steeper the response of instantaneous EL to D should be, saturating at the maximum hydraulically tolerable rate (ELm; Duursma et al. 2008, Oishi et al. 2010). When diurnal data are integrated to daily values, the same patterns remain, but lower sensitivity of daily mean canopy stomatal conductance to increasing day length- normalized D (DZ) may prevent ELm from satu-rating within the DZ range (Pataki et al. 2000). These patterns should also translate to the same expectation for EC, the higher the maximum EC at the reference D (ECm-ref), the steeper the increase of EC with DZ should be. Decline of EC with increasing DZ is com-monly observed in high- frequency (hourly) measure-ments (Ocheltree et al. 2014), but rarely found in daily integration (Oishi et al. 2010).
Upscaling leaf transpiration to the canopy requires accounting for stand properties. From a first- order approximation, canopy transpiration should increase with leaf area index (L). However, several factors com-plicate the relationship between L and canopy transpi-ration. As the transpiring leaf surface area increases, mean light intensity on leaf surfaces decreases as does mean canopy stomatal conductance (e.g., Sellin and Kupper 2005). Conifers with needle leaves of varying longevity occupy a large portion of the global L. Moreover, a large proportion of the foliage of shade- tolerant conifers may be old and show low gas- exchange rates (Zimmermann et al. 1988), perhaps accounting for an inverse relationship between leaf- to- sapwood area ratio (AL/AS) and tree height in such species (McDowell et al. 2002). However, for more shade- intolerant species with relatively low L and less plastic shoot structure, the within- canopy mutual shading increases rapidly with L at the low L range and more slowly at higher L (Kim et al. 2011). Both situations may result in increasing pro-portion of less active foliage (decreased average stomatal conductance and EL-ref) with L and a saturation of the relationship between EC and total L. However, across species or genotypes with more diverse shoot structures (Thérézien et al. 2007), L may be a poor predictor of mutual shading, frustrating the prediction of the shape of the response of EL to L (Igarashi et al. 2015, information in Poyatos et al. 2007). Nevertheless, if the reduction of mean canopy stomatal conductance is proportionally less than the increase in functional L, one may expect that total canopy stomatal conductance would increase with L (Kelliher et al. 1995, Granier et al. 2000). Thus, in
forests where the canopy is well coupled to the atmos-phere (e.g., Ewers and Oren 2000, Kim et al. 2014), EC should potentially increase with L.
At a given canopy L, canopy transpiration depends on additional site- specific factors, such as available energy which changes depending on location (e.g., latitude and altitude; Alo and Wang 2008, Matyssek et al. 2009), soil moisture availability depending on precipitation and soil texture (Hacke et al. 2000, Xu et al. 2012), and vegetative response to environmental drivers, which varies among species (Ford et al. 2011). Stomatal conductance decreases with soil moisture, and the function depends on soil and plant hydraulic properties (Hacke et al. 2000). When soil moisture is not limiting and the xylem is fully conductive, maximum stomatal conductance may increase with the area of sapwood supporting a unit of leaf area (AS/AL; Whitehead et al. 1984). Poyatos et al. (2007) and Martínez- Vilalta et al. (2007) explored in detail the mechanism of stomatal response to hydraulic variation within one species, Pinus sylvestris, showing that adjustment to local climate is principally through AS/AL and stomatal sensi-tivity to atmospheric conditions. This quantity (AS/AL) varies with several hydraulic and stand characteristics: AS/AL may increase in partial compensation for increased path- length resistance with tree height (or age; Schäfer et al. 2000, McDowell et al. 2002, but see Poyatos et al. 2007, Novick et al. 2009) for low tissue- specific hydraulic conductivity in slow- growing individuals (Pothier et al. 1989) and for higher D in sites of dry growing- season atmosphere (Poyatos et al. 2007). Such hydraulic com-pensations attenuate the decrease of leaf gas–exchange rates relative to expected based on tree and site character-istics and may translate to stand- scale variation in L.
However, L is also greatly affected by the large spatial variation in tree density and sapwood area per unit of ground area (Oren et al. 1998a), reflecting local variation of resource availability, such as water and nutrients as affected by rooting volume (e.g., in relation to rock content and soil depth; McCarthy et al. 2006), weather- related disturbances (McCarthy et al. 2006, Xiong et al. 2015), or management (Zhang et al. 2012). Modification of site resources, such as water and nutrients, may differ-entially affect AS and AL, decoupling stand transpiration from L (Ewers et al. 2001). Similar- age stands of a species growing under the same atmospheric conditions had lower L on sandy than on loamy soil, commensurate with lower soil water and nutrient availability, but similar AS/AL (Pinus palustris in Addington et al. 2006, and Pinus taeda, in Hacke et al. 2000), and irrigation and fertili-zation experiments affected EC and L more than AS/AL (Ewers et al. 2000, 2001, Lai et al. 2002). Thus, where L in developing canopies is far below steady state, transpi-ration would be limited by the available leaf surface area. However, small variation in L, both spatially and tempo-rally, could be compensated for by hydraulic- and/or light- related adjustments (Sellin and Kupper 2005), infusing variation in the relationship between stand tran-spiration and L.

120 Ecological Applications Vol. 27, No. 1PANTANA TOR- NGERN ET AL.
Although predictions based on hydraulic theory can be made regarding the response of stand- scale transpiration to D and soil moisture depletion, predicting the form of the relationship between maximum transpiration and L is difficult. In effect, predicting maximum transpiration rate is theoretically more difficult and requires more information than predicting temporal responses to changing atmospheric and soil conditions. Thus, if L is shown to account for a large proportion of the variation of canopy transpiration in forests, such empirical rela-tionship would provide a useful tool for assessing results of modeled ecological processes and long- term responses to environmental changes (Betts et al. 1997, Tor- ngern et al. 2015).
Forests dominated by the genus Pinus are found over a wide range of environments, from the Arctic Circle with short growing seasons to the tropics with a year- round growing season, and on soils ranging from nutrient- rich to sandy, poor soils (Knight 1991, Knight et al. 1994). Species of this genus are commonly used in plantations worldwide because of long tracheids and adequate wood properties for structural timber. Pine plantations cover a vast area with consequences to ecosystem services, such as carbon sequestration and water yield. These forests contain wide ranges of many characteristics involving leaf phenology, leaf morphology, and canopy structure, which affect canopy conductance and transpiration (Roberts 2000). Because of their extent and commercial importance, many studies have quantified sap flux in pine forests, making them ideal for evaluating how well the variation of L among these very different forests reflects their capacity to transpire. We estimated canopy transpi-ration using sap flux data of two of the most dominant pine species worldwide with large geographical ranges: a mid- latitude P. taeda (North Carolina, USA) and a high- latitude P. sylvestris (Northern Sweden), both growing on sandy soil. The latter species included two levels of nutrient availability and two levels of developmental stage- related L. We used these data to determine (1) whether the spatial variation of maximum daily growing season EC is related primarily to L and whether the temporal variations from that maximum are related to soil and atmospheric humidity as expected based on hydraulic theory. We then explored (2) whether the pat-terns identified in these contrasting stands are consistent with those obtained from published studies on pine forests of various soil textures and locations.
materials and methods
Definitions of all abbreviations and variables in the following sections are presented in Table 1.
Settings
The study was conducted in pine forests of contrasting size, nutrient availability, and climatic zones (for detailed stand characteristics see Appendix S1: Table S1). The
mature Pinus taeda plantation (PT) in North Carolina, USA, (36°20′ N 79°28′ W) was established in 1965, thinned in 1983, and harvested in 2006. The broadleaf understory was sparse, comprising 2% of stand basal area (Uebelherr 2008). The soil was well- drained sand with average bulk density and porosity (in the top 60 cm) of 1500 kg/m3 and 0.43, respectively. Long- term (30- year) average annual temperature and total precipitation were 15.4°C and 1189 mm (year 1983–2012; data available online).10
The mature Pinus sylvestris (PS) forests in Rosinedal, Sweden, (64°10′ N, 19°45′ E) were regenerated with seed trees in 1920–1925, pre- commercially thinned in 1955, and thinned in 1976 and 1993, respectively. These forests have been used for long- term fertilization experiment with control (PSMC) and fertilized (PSMF) stands located ~2 km apart. The area of each stand is ~15 ha, and there is a flux tower in the center of each stand. Fertilizer of 100 kg N·ha−1·yr−1 was applied to PSMF from 2006 to 2011 and a reduced rate of 50 kg N·ha−1·yr−1 has been used afterwards (Lim et al. 2015). The young, regener-ating P. sylvestris forest (PSY) was in Åheden (~7 km from Rosinedal). The understory of both stands is char-acterized by a field layer of dwarf shrubs, (Vaccinium myrtil lus and V. vitis-idaea) and a ground layer of mosses (Pleurozium schreberi and Hylocomium splendens) and lichens (Cladonia spp.; Hasselquist et al. 2012, Palmroth et al. 2014). These forests share similar soil texture of well- drained, deep sandy sediment with 2–5 cm soil organic layer (Mellander et al. 2005) and bulk density and porosity (in the top 10 cm) of 1230 kg/m3 (Giesler et al. 1996) and 0.49 (Lundmark and Jansson 2009). The 30- year mean annual temperature and precipitation (1981–2010), measured at the Svartberget field station (8 km from PSMC and 1 km from PSY) were 1.8°C and 614 mm, respectively (Laudon et al. 2013). On average, the area is covered by snow from early November to late April (Laudon and Ottosson Löfvenius 2016).
Environmental measurements
A summary of instrumentation for environmental measurements in the four sites is presented in Appendix S1: Table S2. Other assumptions associated with the pre-sented measurements in Appendix S1: Table S2 and addi-tional measurements are briefly discussed as follows.
In Sweden, air temperature (TA, °C) and relative hum-idity (RH, %) were measured below the forest canopies (Appendix S1: Table S2). Nevertheless, these data were used to represent above- canopy measurements because there is generally an adequate coupling between the canopy and the atmosphere and small gradient of D throughout the canopy depth in forests with low L (Ewers and Oren 2000). In PSY, the global radiation was measured and converted to photosynthetic photon flux density (PPFD) using a factor of 0.47 (Papaioannou et al. 1993).
10 www.ncdc.noaa.gov

ESTIMATING DAILY FOREST TRANSPIRATIONJanuary 2017 121
In PSMC and PSMF, two sets of soil moisture probes were used for measurements at different periods. To obtain the soil moisture at 15 cm depth (θ15, m3/m3) at the plot level, we employed the relationship between the long- (near tower) and short- (around sap- flux trees) term data (see Appendix S1: Table S2) during June–September 2013 (r2 ≥ 0.85) to adjust values from the continuous, long- term measurement. In PSY, we used soil moisture data from PSMC to estimate values during the unmeasured period in PSY (r2 = 0.72, P < 0.001 for relationship between daily mean θ15 of both sites). In PT, soil moisture was measured with probes integrating from the surface to 30 cm depth.
At all sites, the growing season was delineated beginning the day after daily mean temperature exceeded +5°C for five consecutive days and lasted until it dropped below +5°C for five consecutive days (Mäkelä et al. 2006). The average growing season period during three
study years was approximately March–November in PT and May–September in the PS sites. To facilitate the cross- site comparison, soil moisture was represented by relative extractable water (REW) calculated according to Granier et al. (2000):
where θm is minimum volumetric soil moisture and θFC is soil moisture at field capacity. The values of θm were 0.054, 0.045, 0.052, and 0.044 m3/m3 for PT, PSMC, PSMF, and PSY, respectively. The average of these values was not different (t test, P = 0.93) from the wilting point of sand according to the survey of Kätterer et al. (2006). The values of θFC were 0.158, 0.146, 0.164, and 0.148 for PT, PSMC, PSMF, and PSY, respectively. Vapor pressure deficit (D) was calculated from TA and RH (Abtew and Melesse 2013). Daylength- normalized D (DZ) was
(1)REW=θ−θ
m
θFC−θm
table 1. A summary of abbreviations and variables used in the study with their full definitions.
Variable Definition Unit
a asymptotic value of the maximum daily canopy transpiration mm/dAG ground area m2
AL leaf area m2
AS sapwood area m2
AS/AG total sapwood area per unit ground area m2/m2 or m2/haAS/AL sapwood to leaf area ratio m2/m2
b soil texture parameter in the soil water retention curve equation …c critical relative xylem depth at which sap flux density starts decreasing …D vapor pressure deficit kPaDD daytime average vapor pressure deficit kPaDZ day- length normalized vapor pressure deficit kPaDZ,crit critical day- length normalized vapor pressure deficit kPaEC growing season or annual canopy transpiration mmECD daily canopy transpiration mm/dECm maximum daily canopy transpiration under nonlimiting soil water condition mm/dECm-ref reference maximum daily canopy transpiration at day- length normalized vapor pressure deficit
of 1 kPamm/d
JS sap flux density g·m−2·s−1
JSD daily sum sap flux density g·cm−2·d−1
JSD,i daily sum sap flux density at inner sapwood depths g·cm−2·d−1
JSD,Out daily sum sap flux density in the outer 20- mm xylem g·cm−2·d−1
JSD mean daily sap flux density over the entire xylem area g·cm−2·d−1
L leaf area index m2/m2
nd number of daylight hours …PPFD photosynthetic photon flux density μmol·m−2·s−1
or mol·m−2·d−1
PS all Pinus sylvestris sites in this study …PSMC mature Pinus sylvestris site in northern Sweden under nonfertilized condition …PSMF mature Pinus sylvestris site in northern Sweden under fertilized condition …PSY young Pinus sylvestris site in northern Sweden …PT Pinus taeda site in North Carolina, USA …REW relative extractable water …REWc relative extractable water at which canopy transpiration is reduced to 90% of the maximum …RH relative humidity %s
DZinitial increasing rate of the maximum daily canopy transpiration with day- length normalized
vapor pressure deficitkPa−1
sREW parameter for the sensitivity of canopy transpiration relative to the maximum to changes in relative extractable water in the soil drying curve
…
TA air temperature °CXR the ratio between sensor depth relative to sapwood radius …β fitting parameter of the Gaussian function for scaling …θFC soil moisture at field capacity m3/m3
θm minimum volumetric soil moisture m3/m3
θ15 volumetric soil moisture at 15 cm depth m3/m3
θ30 volumetric soil moisture at 30 cm depth m3/m3
122 Ecological Applications Vol. 27, No. 1PANTANA TOR- NGERN ET AL.
calculated as DD × (nd/24) where DD was daytime mean D and nd was number of daylight hours (Phillips and Oren 2001).
Estimation of sapwood area and leaf area index
In PT, sapwood area (AS, m2) was estimated from allo-metric equations derived from 25 stem discs taken at breast height from the trees harvested in 2006. The disc sizes covered the full range of stem diameter distribution in the forest, allowing the estimation of sapwood area of all trees. Stand sapwood area was then calculated by summing values of all individuals and expressed per unit of ground area. Leaf area index (L; projected- area based) and its dynamics were derived from monthly optical measurement (Appendix S1: Table S2). A correction factor of 0.59 was applied to L to account for foliage clumping (Stenberg 1996, Thérézien et al. 2007).
For PSMC and PSMF, sapwood area (AS) was estimated using allometric equations while L was determined from both allometric equations and optical measurements (Lim et al. 2015). All allometric equations were derived from trees harvested in October 2011, six in each stand. Maximum L was estimated based on annual foliage pro-duction derived from the harvested trees and litterfall (Lim et al. 2015). The optical information was obtained from hemispherical photographs taken over the litter trap position (Appendix S1: Table S2). Details of deri-vation of L are presented in Lim et al. (2015). For PSY, AS and maximum L were estimated based on allometric equations derived from eight trees harvested in September 2013 (P. Tor- ngern and L. Tarvainen, unpublished data). The L dynamics was obtained from a study of P. syl-vestris stands of similar site characteristics (Rautiainen et al. 2011).
Sap flux measurements and scaling to the canopies
In the P. taeda stand (PT), sap flux density (JS, g m−2
sapwood s−1) was measured at breast height in 24
trees with thermal dissipation probes, after Granier (1987). Trees were located within a 22 m radius from a datalogger and selected to represent the range of diameter at breast height (1.3 m aboveground) for the entire stand. Radial (Phillips et al. 1996, Ford et al. 2004, Oishi et al. 2008) and azimuthal (Oren et al. 1999b, Lu et al. 2000, James et al. 2002, Tateishi et al. 2008) variations of JS may, however, produce considerable errors when scaling up from tree to stand measurement. To capture such var-iations, seventy- two sensors were distributed in the north, southeast, and southwest sides of stems and at five 20- mm interval depths from the inner bark (i.e., 0–20 mm, 20–40 mm, 40–60 mm, 60–80 mm, and 80–100 mm), operating from May 2003 to August 2005.
In Sweden, the similar Granier- type sensors were installed at breast height on six mature P. sylvestris trees each in PSMC and PSMF. In each site, we distributed 14 sensors at four depths and four azimuthal directions
(north, south, east, and west), measuring JS from July 2011. Additionally, we incorporated JS measurements from other experiments in PSMC and PSMF. In one exper-iment, from August to September 2011, eight sensors were installed at the outer 20- mm sapwood layer of eight trees in each site. In another short- term experiment, from August to September 2012, fifteen sensors were dis-tributed among five trees in PSMF to measure JS at three sapwood depths. Excluding the treatment days in these other experiments, we combined JS data of the outermost layers from the additional experiments by performing a weighted average. Therefore, we used a total of 22 and 37 sensors to estimate canopy- average sap flux density for PSMC and PSMF, respectively. Similarly, twenty sensors were distributed among 12 trees at PSY. The sensors were installed at either one or two sapwood depths at breast height and data were collected from June 2012 to June 2014. In all sites, half- hourly average data were recorded on the same type of data logger (CR1000; Campbell Scientific, Logan, Utah, USA).
To calculate daily canopy transpiration (ECD, mm/d), we employed the following approach to scale the point- measurement of JS to the entire forest. Daily sum JS (JSD, g·cm−2
sapwood·d−1) was considered in the analysis to avoid
issues related to tree water storage and measurement errors (Phillips and Oren 1998). The daily sum sap flux density (JSD) in the outer 20- mm xylem (JSD,Out) was scaled to a mean daily sap flux density over the entire xylem area (JSD). For all sites, there was no significant variation of JSD,Out with tree size (P ≥ 0.10, r2 ≤ 0.16, n ≥ 12) nor circumferentially (P ≥ 0.46). However, the radial variation of JSD was significant (P ≤ 0.0001) and independent of azimuth (P ≥ 0.31). We developed a scaling function to account for the radial variation of JSD to allow simple gap- filling of missing values, after finding that using the average ratios of measured inner- to- outer JSD generated only <2% difference of JSD compared to using a continuous function. For the missing meas-urement periods, we gap- filled values of JSD,Out (ranging 19–36% of total growing season days) with a function dependent on daily average PPFD and DZ (see Appendix S1: Table S3). Within the studied species, we observed maximum JSD within 10–30- mm xylem depth, decreasing nonlinearly towards the stem center (cf. Cermák et al. 1992, Ford et al. 2004, Oishi et al. 2008). Therefore, for each canopy, we generated a scaling function, describing the decline of JSD beyond a critical xylem depth (c) by a Gaussian function, as
where JSD,i is JSD at inner xylem depths (e.g., i = 1 at 20–40 mm layer), XR is the ratio between sensor depth relative to xylem radius, c is the XR at which JSD starts
(2)
JSD,i
JSD,Out
=1; XR ≤ c
JSD,i
JSD,Out
=1×e
−0.5
(
XR−1
β
)2
; XR > c

ESTIMATING DAILY FOREST TRANSPIRATIONJanuary 2017 123
decreasing with sapwood depth, and β is the fitting parameter. We employed an average function to derive JSD of each forest for the entire study period as no daily variation of the function was observed (P ≥ 0.3; see Appendix S1: Table S3). Sapwood thickness exceeded probe length, such that 1–6% of sapwood area was not captured by the sensors in the sample trees, and thus no correction method (e.g., Clearwater et al. 1999) to account for nonconductive sapwood in JSD estimation was needed.
Although we carefully considered spatial and temporal variability in scaling procedures, we did not calibrate the JS sensors specifically for the two pine species studied here, which may cause potential errors in the estimates of canopy transpiration (Steppe et al. 2010, Sun et al. 2012, Vergeynst et al. 2014). Sap flux density measured with this method has, however, been examined in both species in previous studies (e.g., Lundblad et al. 2001, Oliveras and Llorens 2001, Ford et al. 2004) with results in agreement with local water balance and eddy covariance estimates (Granier et al. 1996, Schäfer et al. 2002, Domec et al. 2012). We further note that Poyatos et al. (2007) performed a synthesis across Eurasia of sap- flux based stomatal conductance of P. sylvestris, concluding that the responses to atmospheric and hydraulic architecture were robust to potential errors generated by different sensors used.
For scaling up to the canopy, we estimated dynamic profile of the total sapwood area of all trees (AS) per unit ground area (AG) or AS/AG (m2
sapwoodm−2
ground). The tem-
poral pattern of AS/AG was calculated using the AS values of two consecutive years, linearly interpolating between the time of leaf flush and the time L reached maximum based on the temporal pattern of L, keeping AS/AG con-stant thereafter until leaf flush in the following year (Fig. 2, dashed line). Finally, ECD, given the units of variables as defined in Table 1, was calculated as
where JSD was calculated from the above scaling approach.
We performed a boundary line analysis (Schäfer et al. 2000, Ewers et al. 2001) to obtain the response of non- gap- filled ECD under the optimal conditions (Martin et al. 1997). The canopy transpiration varies with DZ, PPFD, and soil water availability (Jarvis 1976, Phillips and Oren 2001). Because DZ and PPFD were correlated in our study sites (r2 ≥ 0.69, P < 0.001), we focused on DZ and REW as the physiological driving variables. First, we determined REW ranges in which ECD was best explained by DZ, i.e., well- watered conditions and obtained the maximum daily canopy transpiration (ECm). Then, for each study site, we pooled data over the REW range in which soil moisture does not affect transpiration and per-formed the boundary line analysis by binning ECm based on DZ data (see Schäfer et al. 2000, Ewers et al. 2001 for details). Finally, ECm was described by the function
where a is asymptotic ECm value at high DZ and sDZ
is the initial increasing rate of ECm with DZ (Ewers et al. 2001). Taking into account the soil drying effect on ECm, we performed another boundary line analysis on ECD values obtained from ECD vs. DZ curves under a range of soil moisture conditions (i.e., REW), relative to the ECD in wet soil (i.e., ECm obtained from the response in Eq. 4).
Statistical analyses
All regression analyses were performed in SigmaPlot version 12.0, from Systat Software, San Jose, California, USA. We used an F test to compare fitting results on dif-ferent datasets with the same function (e.g., the analysis of transpiration response to vapor pressure deficit and soil drying effect of the four stands and comparisons of scaling functions between control and fertilized PS sites). Two- factor ANOVA with interaction term was applied to analyze the effect of radial and azimuthal variation on JSD. The calculations of variables and the boundary line analysis were conducted in MATLAB 7.6.0 R2008a (MathWorks, Natick, Massachusetts, USA). We note that boundary line analysis produces similar results to quantile regression when the data are normally distributed and in the absence of outliers, which affect the regression analysis.
results
Environmental conditions
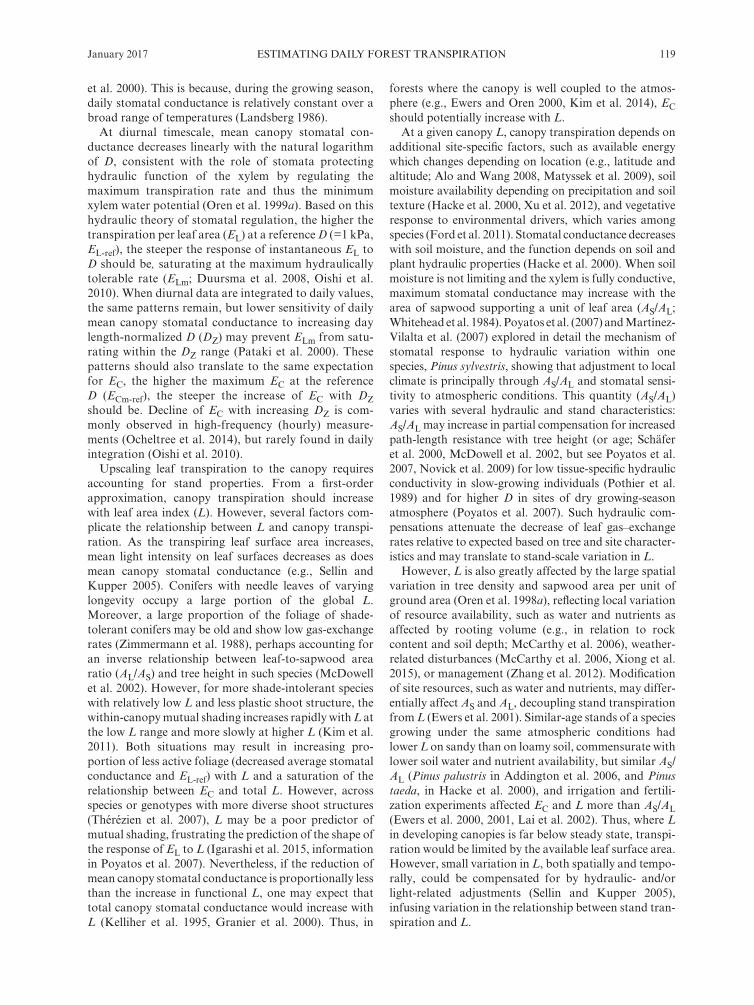
The Pinus taeda site (PT) experienced a variable inter-annual weather pattern with wet growing season (P = 850 mm) in 2003 and relatively dry growing season (449 mm) in 2005 (Fig. 1d, bars). The PPFD and DZ were low in 2003 compared to other years (Fig. 1a). Growing season REW was high in 2003 (averaged REW = 0.56 ± 0.08 SD or ~0.45 ± 0.05 m3/m3 of θ30), moderate in 2004 (averaged REW = 0.47 ± 0.06 or ~0.32 ± 0.04 m3/m3 of θ30) and decreased to an average of 0.32 ± 0.14 (~0.22 ± 0.04 m3/m3 of θ30) during the 2005 growing season (Fig. 1d, line). In contrast, growing season weather was similar among the study years in Sweden with average P and PPFD of 400 ± 30 mm and 29 ± 2 mol·m−2·d−1 (Fig. 1e–f, bars for P; Fig. 1b–c, black lines for PPFD). However, DZ was slightly lower in 2012 relative to other years (Fig. 1b–c, gray lines). Generally, REW values were higher in PSMF (gray dashed line in Fig. 1e) with the seasonality similar to the other PS sites (i.e., gray solid lines in Fig. 1e–f). As expected given the greater depth- integration in PT, the coefficient of vari-ation (CV) of soil moisture was lower (23%) than at the Swedish sites (34–55%). However, the rate of decline in soil moisture between rain events, the information used in this study, is relatively conservative among horizontal positions. Within each of the forests in Sweden, REW was of similar range in 2011 and 2012 but reached the minimum
(3)ECD =10× JSD
AS
AG
(4)ECm =a(1−e−s
DZDZ )

124 Ecological Applications Vol. 27, No. 1PANTANA TOR- NGERN ET AL.
REW of 0.03–0.26 (~0.01–0.08 m3/m3 θ15) in 2013. Therefore, these study periods cover a wide range of envi-ronmental conditions for pine forests on sandy soil.
Daily sap flux density and the calculation of transpiration
In general, growing season JSD,Out in mature trees was lower than in young trees (Fig. 2, compare solid lines). Among the mature stands, PT had the lowest total sapwood area per unit ground area (AS/AG, m2/ha), averaging 17 ± 0.23 (SD) m2/ha across three growing seasons, and the highest JSD,Out (averaging 72 ± 33 g⋅cm−2
sapwood⋅d−1). Comparing the two mature PS stands,
JSD,Out was similar (P = 0.39) with mean growing season values of 44 ± 25 and 48 ± 26 g⋅cm−2
sapwood⋅d−1 for PSMC
and PSMF, respectively. The slightly higher mean JSD,Out value in PSMF corresponded with lower AS/ AG (22 ± 0.38 vs. 25 ± 0.09 m2/ha in PSMC) because lower stem density in PSMF produced more open canopy compared to PSMC (see Appendix S1: Table S1). Trees in PSY had the lowest AS/AG (5 ± 0.42 m2/ha) and the highest JSD,Out (98 ± 28 gH2O⋅cm−2
sapwood⋅d−1) of all stands. As a result, JSD,Out
decreased linearly with AS/AG among the four sites (r2 = 0.96; P < 0.001).
The negative relationship between AS/AG and JSD,Out resulted in scaled ECD being a similar magnitude at the mature stands, averaging 0.94 ± 0.71, 0.94 ± 0.52, and 0.89 ± 0.49 mm/d for PT, PSMC, and PSMF, over three growing seasons (data not shown). Comparatively high ECD in PT was compensated by low AS/AG, whereas lower ECD in PSMF was compensated by higher AS/AG. For the young stand PSY, ECD was 0.56 ± 0.33 mm/d. Longevity of PT needles is ~18 months while that of PS needles is over 4 yr, leading to more pronounced dynamics of L in PT. Growing season L was higher at the mature stands than at PSY (Fig. 2, compare dotted lines). Over the three growing seasons, the mature, unfertilized PSMC stand had higher L (2.5 ± 0.36 m2/m2) than the PT stand (1.6 ± 0.32 m2/m2; Fig. 2a–b, dotted lines). The fertilized stand PSMF had the highest L (3.1 ± 0.32 m2/m2; Fig. 2c), while the young stand PSY had the lowest (1.5 ± 0.17 m2/m2; Fig. 2d).
Canopy transpiration in relation to atmospheric, soil, and stand conditions
The response of maximum daily canopy transpiration (ECm; using only non- gap-filled data) to DZ was similar among the mature canopies of PT, PSMC, and PSMF (P = 0.90), initially increasing faster with DZ and reaching
fig. 1. Environmental conditions shown as (a–c) the daily sum of photosynthetic photon flux density (PPFD, mol·m−2·d−1, black lines) and daylength- normalized daytime average vapor pressure deficit (DZ, kPa, gray lines) and (d–f) the soil moisture expressed as relative extractable water (REW, gray lines) and precipitation (bars). Data are presented as 30- d running mean. See Table 1 and text for explanations of each environmental variable. Gray ranges indicate growing season days for each year and location.

ESTIMATING DAILY FOREST TRANSPIRATIONJanuary 2017 125
higher saturating ECm value than the young forest (Fig. 3a). Our ECm vs. DZ responses shared similar pattern to the results from our analysis of 17 other studies on pine forests (Fig. 3b). We then examined the parameters describing ECm vs. DZ responses in Fig. 3b. In the fol-lowing analyses, all linear regressions were forced through the origin because the intercept was not significant (P ≥ 0.42), consistent with having no transpiration when leaf area is zero. First, we defined a reference ECm value at 1 kPa DZ, analogous to parameter a in the ECm vs. DZ response function (Eq. 4), as ECm-ref. ECm-ref was linearly related to L, showing 0.55 ± 0.02 (SE) mm/d increase of ECm-ref with a unit increase of L (Fig. 4a; including five
additional P. sylvestris studies with data available for this relationship only; see Appendix S1: Table S1 labeled with an asterisk). In this relationship, the previously mentioned compensation between AS/AG and JS adds to the varia-bility in the relationship among these sites with medium to high L. Because the soil texture of these forests varies, and soil texture can greatly affect transpiration (Hacke et al. 2000, Duursma et al. 2008), we assessed whether the general trend among the global sites depended on soil texture. The rate of increase in ECm-ref with L was not significantly different between sandy and nonsandy (here-after, loamy) soils (orange and dark red symbols, respec-tively, in Fig. 4a; P = 0.33; Appendix S1: Table S4). The
fig. 2. Variables for scaling to the canopy shown, and for each panel, daily sum of sap flux density in the outermost xylem layer (i.e., at 0–20 mm depth from inner bark; JSD,Out in g·cm−2
sapwood·d−1) is presented as solid lines with both measured (black lines) and
estimated (gray lines) values (see text for gap- filling approach and Appendix S1: Derivation of gapfilling functions and Table S3). Estimates of leaf area index (L) are shown in dotted lines, together with measured values (circles). Estimated daily total sapwood area per unit ground area (AS/AG; m2/ha) is shown in dashed line.

126 Ecological Applications Vol. 27, No. 1PANTANA TOR- NGERN ET AL.
residuals from the ECm-ref vs. L relationship (Fig. 4a) were not related to AS/AL (P = 0.13, r2 = 0.05) and were only weakly related to another hydraulic supply index, AS/AL × 1/h (where h is mean canopy height; P = 0.007, r2 = 0.23); normalizing the residuals by L (making the quantity proportional to mean canopy stomatal con-ductance) resulted in no relationship with either of these hydraulic quantities (minimum P > 0.13). The coefficient of variation values were ECm-ref 58%, L 56%, AL/AS 114% (which was similar for trees growing in both soil types, P = 0.63), JS 115%, and AS/AG 78%.
The sensitivity of ECm to DZ (i.e., the sDZ
parameter; Eq. 4) was linearly and similarly related to ECm-ref across soil types (P = 0.43; Fig. 4b; Appendix S1: Table S4). Thus, among these sites, in stands with higher ECm-ref, ECm increased toward saturation more rapidly with increasing DZ. Using the relationships in Fig. 4a–b, we can derive the ECm vs. DZ response under nonlimiting soil moisture condition similar to those in Fig. 3b; the derived values had only 3% bias (r2 = 0.63) compared to the data from which the original curves in Fig. 3b were formed. We also assessed whether L can be used to identify the condi-tions at which the decrease in daily mean stomatal con-ductance compensates for increasing DZ. Based on Eq. 4, we considered DZ at which ECm reaches 95% of the ECm-ref (DZ,crit) at each stand. So defined, DZ,crit decreased with increasing stand L (Fig. 4c; Appendix S1: Table S4) simi-larly in both soil types (P = 0.83).
To assess the effect of soil drying, we derived the theo-retical responses of transpiration to REW based on the relationships with soil water potential presented in Hacke et al. (2000), which differ among soils depending on texture. In that study, the transpiration was simulated
using hydraulic properties of trees and soils in P. taeda stands on sandy and loamy soils. The soil water potential was converted to REW using soil properties presented in the study and additional parameters from other pub-lished work (e.g., soil moisture at saturation, θs, from Oren et al. 1998b for loam; Clapp and Hornberger 1978 for sand; θFC from Kätterer et al. 2006). Transpiration declined more rapidly under dry conditions (low REW) in sandy soils than loamy soils (Fig. 5b, compare dashed lines). Our data from the four sandy sites revealed a sim-ilarly small (10%) reduction of ECm as REW declined to 0.11 (P = 0.8; Fig. 5a; Appendix S1: Table S4). We found six additional pine species with data needed to evaluate these theoretical relationships (Fig. 5b; Appendix S1: Table S5, see method in Appendix S1). Overall, pines on sandy sites were less sensitive to changes in REW until a critical threshold (REWc averaged 0.21 ± 0.12 SD for four species from eight studies; Fig. 5b, orange solid lines) was reached and ECm declined more rapidly than those on loamy soils in a broad agreement with theory (REWc averaged 0.36 ± 0.18 SD for six species from nine studies; Fig. 5b, dark red solid lines). The mean REWc values of pines on both soil types were similar to their corresponding theoretical values (P = 0.81 for sandy and P = 0.94 for loamy sites). Because of the limited datasets on pine species, we further evaluated the relationships by including stands with three other conifers, ten broad-leaved, one stand of mixed species and three crops, two shrubs, and one forest fern. We expanded on Duursma et al. (2008) survey and analysis of the effect of soil texture on the relationship between soil drying and transpiration, adding our new data and additional published res-ponses. Based on data from all species (REWc averaged
fig. 3. Responses of canopy transpiration to environmental conditions, with (a) daily canopy transpiration under nonlimiting soil moisture (ECm; mm/d) in response to daylength- normalized vapor pressure deficit (DZ, kPa) for the forests in this study and (b) from other Pinus forests as listed in Appendix S1: Table S1. Regression statistics for (a) is presented in Appendix S1: Table S4.

ESTIMATING DAILY FOREST TRANSPIRATIONJanuary 2017 127
0.22 ± 0.13 for sandy sites with nine species from 12 studies and 0.43 ± 0.25 for loamy sites with 18 species from 22 studies), the relationships were similar to the the-oretical responses (P = 0.34 and 0.61 for sandy and loamy sites, respectively). The effect of soil drying on ECm dif-fered greatly between the soil types (P < 0.001; Fig. 5c).
Combining fitted curves from Figs. 4a, b and 5c, ECD of pine forests can be estimated from L, TA, and RH (to calculate D), radiation (to determine day- length), soil moisture, and soil properties such as field capacity and nonextractable soil moisture (for estimating REW). Under nonlimiting soil water condition, regardless of soil type,
and
where ± is followed by SE of the estimate. Correcting for soil drying effect (Fig. 5c), the proportion of daily to maximum transpiration can be expressed as ECD/ECm = 1 − e−(16.08 ± 3.6) × REW for sandy soils and ECD/ECm = 1 − e−(7.55 ± 1.01) × REW for loamy soils. While these equations can be combined to calculate ECD, we note, that this approach is not applicable to any particular stand but may be used for estimating the average ECD of multiple pine stands over a large area. This was demon-strated by less bias between the results estimated from the above approach and the data from our combined four stands (8%) than when testing the approach separately with data from an individual stand (ranging 19–32%). Additionally, we extended our synthesis of the soil drying effects on transpiration in pine forests for applications when finer specifications of soil classes are available. We based the extension on the soil water retention curve (Campbell 1974), ψs = ψe(θ/θsat)−b, where ψs is soil water potential, ψe and θsat are soil water potential and content at saturation, and b is the sensitivity of soil water potential to relative soil moisture. Generic values of b for soil classes ranging from sandy to clayey, available in Cosby et al. (1984), corresponding to soil texture of the data survey in Appendix S1: Table S5, were compared to the sensitivity to REW of canopy transpiration relative to ECm (sREW). Because soil texture is commonly typed broadly in publi-cations, we performed a regression analysis on the mean values of sREW and b of the soil type provided. The result showed signifi cant exponential decay of sREW with increasing b (sREW = 3.29 + 99e−0.7b, r2 = 0.87, P = 0.008; Fig. 5c, inset).
disCussion
The data from our four pine stands on sandy soils showed that, during periods in which soil moisture was not limiting, transpiration (ECm) in the young (PSY) sat-urated with increasing DZ at two- thirds that of the mature stands, consistent with their one- third lower L (Fig. 3a; ECm-ref vs. L relationship P = 0.005). However, the
(5; Fig. 4a)ECm- ref= (0.55±0.02)×L
(6; Fig. 4b)sDZ
= (1.33±0.06)×ECm-ref
fig. 4. Functions to estimate daily canopy transpiration of forests, with (a) synthesis response of reference canopy transpiration under well- watered condition (ECm-ref) to leaf area index (L) in pine forests, and (b) the sensitivity of canopy transpiration of pine forests to changes in vapor pressure deficit as a function of ECm-ref from (a). (c) The relationship between critical DZ at which ECm reaches 95% of the ECm-ref (DZ,crit) and L. Orange (dark red) color represents sites on sandy (loamy) soil. Enlarged symbols refer to our four study stands. See Appendix S1: Table S1 for site information and Appendix S1: Table S4 for regression results and statistical tests. Shaded regions show 95% significant interval of the regression lines.

128 Ecological Applications Vol. 27, No. 1PANTANA TOR- NGERN ET AL.
mature PT and PS stands transpired similarly in response to atmospheric demand, even when nutrient availability was enhanced in PSMF. This suggests that the ~23% higher L induced by fertilization decreased the mean light intensity on leaf surfaces and reduced mean stomatal conductance proportionally (Zimmermann et al. 1988, Ewers et al. 2001). Among the four stands, sap flux density (JS) decreased with increasing intraspecific competition as reflected by the areal density of sapwood (AS/AG), as has been shown previously (Oren et al. 1998a, Zhang et al. 2012). The lower maximum JS at low
competition in our studies on sandy soil, compared to that found in the clayey soil (Oren et al. 1998a), coupled with a faster decrease of JS with increasing competition, reflect differences in both soil and plant hydraulic prop-erties (Ewers et al. 2000, Hacke et al. 2000).
Importantly, an inverse relationship between JS and AS/AG may reduce the variation of ECm-ref (their product), making stand transpiration relatively conservative in comparison to either of the contributing quantities (Roberts 1983). Because L is related to AS/AG, the com-pensatory pattern may weaken a relationship between ECm-ref and L over a narrower L range, as observed in our three mature sites (ECm-ref vs. L relationship, P = 0.03). Nevertheless, L explained much of the variation of ECm-
ref (Fig. 4a, and effect on Fig. 4b) and the ECm − DZ response in 12 pine species (Fig. 3b), regardless of various treatments, including fertilization, irrigation, and ele-vated atmospheric CO2 concentration. Increases of ECm with L were observed in crops and an oak stand (Ritchie and Burnett 1971, Bréda and Granier 1996) but had not been previously shown among forest stands under the diverse climates and stand conditions presented here. This finding indicates that hydraulic adjustments at the tree scale (e.g., reduced maximum height, reduced height for a given diameter and sapwood area, increased root area for a leaf area) and adjustments of competition at the stand scale (e.g., reduced tree density, L) homogenize the maximum mean canopy stomatal conductance among canopies. This holds across stands on soil texture ranging from sandy to clayey, as long as other conditions are similar (e.g., high soil moisture and incoming light, standard vapor pressure; Hacke et al. 2000, Addington et al. 2006). Thus, despite increased shading with L, L held a strong and linear effect on ECm.
Based on a number of studies with available data, we accounted for soil drying effects on daily canopy
fig. 5. Soil drying effect on transpiration, with the pro-portion of observed daily canopy transpiration (ECD) compared to transpiration under favorable conditions (ECm) as a function of relative extractable water content (REW), and (a) soil drying effect on canopy transpiration under favorable conditions (ECm) as observed in the four pine forests and (b) other pine studies as presented in Appendix S1: Table S5 (solid lines, orange color for sandy and dark red color for loamy soils). Dashed lines represent theoretical responses of maximum transpiration rate as allowed by the soil–leaf continuum for Pinus taeda stands on sandy and loamy soils, directly obtained from Fig. 6 of Hacke et al. (2000). (c) Functions accounting for soil drying effect for sandy (ECD/ECm = 1 − e−16.08 × REW) and loamy ((ECD/ECm = 1 − e−7.55 × REW) soils based on all species presented in Appendix S1: Table S5 with one SE shown as shaded regions (see Appendix S1 for method). Inset shows a logarithmically decreasing relationship between the sensitivity to REW of canopy transpiration relative to ECm (sREW) and b, the sensitivity of soil water potential to relative soil moisture of finer soil classes (inset, panel c). The regression was based on all data, while only the average with one standard deviation for each b parameter is displayed. Where soil texture is known, sREW can be obtained from this relationship and used in the soil drying function as in (c). These functions combined with those in Fig. 4 are used to estimate daily canopy transpiration. All regression statistics are presented in Appendix S1: Table S4.

ESTIMATING DAILY FOREST TRANSPIRATIONJanuary 2017 129
transpiration (Fig. 5a). Of the eight pine species used in the analysis, pines growing on loamy soils were sensitive to soil drying at a higher soil water status than those on sandy soils (Fig. 5b). Such behavior agreed with the the-oretical results based on pre- defined hydraulic properties, demonstrating the hydraulic constraints on water uptake in P. taeda on sandy and loamy soils (Fig. 5b, dashed lines; derived from Hacke et al. 2000). Combining data from pines and other species, the results show a clearer difference in the soil drying effects on transpiration between sandy and loamy soils (Fig. 5c, solid lines), similar to a previous finding with fewer data (Duursma et al. 2008). High sensitivity of transpiration to decreasing soil moisture, seen here restricted to only low soil moisture conditions in sandy soils, has also been attributed to a rapid water depletion in stands with shallower roots (Bréda et al. 1993, Granier et al. 2007). Shallow rooting and sandy texture (even with deep roots), both restricting water availability in the rooting zone, apparently elicit a similar threshold response to soil drying. Further support for the theoretical underpinning of transpiration response to soil moisture is provided by the relationship between the sensitivity to REW of canopy transpiration relative to ECm (sREW) and b, the sensitivity of soil water potential to relative soil moisture of finer soil classes (inset, Fig. 5c). As the clay content increases in the soil, sREW decreases exponentially to a minimum. This relationship can be used to obtain sREW for a more constrained prediction of the response of transpiration to soil drying when more exact information on soil texture is available.
Methodological considerations
Scaling JS of the four stands to ECD estimates (0.56– 0.94 mm/d with L ~1.5–3.1) produced values within the range found in other studies of pine forests on sandy soil (0.45–1.6 mm/d with L ~0.8–3; Cermák et al. 1995, Loustau et al. 1996, Saugier et al. 1997, Ewers et al. 1999, Zimmermann et al. 2000, Irvine et al. 2004, Mellander et al. 2006). Nevertheless, many of these studies, including ours, did not calibrate sap flux sensors specifically for the stand and site conditions in which they were employed, potentially contributing to the unexplained variation pre-sented in Fig. 4 (cf. Steppe et al. 2010, Sun et al. 2012, Vergeynst et al. 2014). The most common criticism of the heat dissipation method, the most commonly used method, is that it underestimates the flux (Steppe et al. 2010, Sun et al. 2012). However, of the 54 values in Fig. 4a, the eight estimated from methods other than heat dissipation averaged (SD) 94 ± 15% of the flux expected based on a fit with L for the 46 values obtained with constant heat dissi-pation approach (P = 0.34), indicating no particular bias.
In addition to methodological differences and the com-pensating behavior of JS and AS/AG, differential sensitiv-ities to shading among species and variation in plant–soil hydraulic properties (either among species, Wullschleger et al. 1998, or via growing conditions, Margolis et al. 1995, Ryan et al. 2000, Novick et al. 2009) likely added
to variation in transpiration per unit L and contributed to the ~30% unexplained variation of ECm-ref with respect to L among pine stands (Fig. 4a).
Finally, we note that the distribution of stand charac-teristics between the two soil types presented in this study was far from optimal, with potential effects on the extracted parameters. Therefore, while employing these parameters may be useful in broad application, the uncertainty may be high if the parameters are employed for estimating transpiration in a particular stand. A new effort to systematically assemble a worldwide sap flux data base would allow further evaluation of the gen-erality of the results and a better estimate of the uncer-tainty involved.
ConCluding remarks
Climate change will involve alterations in the spatial and temporal frequency distributions of atmospheric and soil conditions. In the future, likely increases in air tem-perature and its variation may be accompanied by similar changes in D, while changes in precipitation are uncertain. Our results show the rather remarkable usefulness of L for explaining the variation in daily maximum canopy transpiration. To the degree that climate change will affect L, especially in the range of L less than five over which it can be estimated reasonably well with remotely sensed data (Zheng and Moskal 2009), the effect on maximum stand transpiration can be estimated from L and used directly or for constraining model predictions. Furthermore, the responses generated show that, as DZ increases, transpiration ultimately reaches a maximum. Above that critical DZ, further increase is accompanied by a proportional stomatal closure and reduced carbon uptake. This critical DZ decreases with increasing L (Fig. 4c), meaning that a given absolute increase of atmospheric humidity deficit is likely to cause a greater effect on the carbon balance of high productivity, high L, forests. In contrast, the difference in the responses of EC to soil moisture between the texture types means that low productivity forests on sandy soils are more sensitive to changes in precipitation, especially when soil water decreases below the critical threshold (Fig. 5c). Thus, pre-dictions of future biosphere–atmosphere exchanges of water and forest productivity should account for the effect of spatial variation of L and soil texture on the temporal variation of stomatal conductance and transpi-ration, and thus productivity and water yield.
aCknowledgments
We appreciate the field assistantship from Nils Henriksson and Ulla Nylander in the Scots pine forest in Rosinedal, Sweden. The Rosinedalsheden research site was established with support from the Kempe Foundation and the Swedish Research Council for Environment, Agricultural Sciences and Spatial Planning (FORMAS) and is since 2014 part of the “Swedish Infrastructure for Ecosystem Science” (SITES) sponsored by the Swedish Science Foundation (VR). This study received support from the

130 Ecological Applications Vol. 27, No. 1PANTANA TOR- NGERN ET AL.
research programmes “Future Forests” (Swedish Foundation for Strategic Environmental—MISTRA), “Trees and Crops for the Future” (Swedish Governmental Agency for Innovation Systems—VINNOVA), Knut and Alice Wallenberg Foundation and “Nitrogen and Carbon in Forests” (FORMAS) and by the United States Department of Agriculture through the Agriculture and Food Research Initiative (2011- 67003- 30222), and Department of Energy through the Office of Biological and Environmental Research, Terrestrial Ecosystem Science Pro gram (DE- SC0006967, DE- 0006700). P.T. thanks the Royal Thai Government and Swedish University of Agricultural Sciences for financial support.
literature Cited
Abtew, W., and A. Melesse. 2013. Evaporation and evapo-transpiration measurement and estimations. Pages 53–62. Springer, Science+Business Media Dordrecht. DOI 10.1007/ 978-94-007-4737-1
Addington, R. N., L. A. Donovan, R. J. Mitchell, J. M. Vose, S. D. Pecot, S. B. Jack, U. G. Hacke, J. S. Sperry, and R. Oren. 2006. Adjustments in hydraulic architecture of Pinus palustris maintain similar stomatal conductance in xeric and mesic habitats. Plant Cell and Environment 29:535–545.
Alo, C. A., and G. Wang. 2008. Potential future changes of the terrestrial ecosystem based on climate projections by eight general circulation models. Journal of Geophysical Research 113:G01004.
Andre, J.-C., P. Bougeault, J.-F. Mahfouf, P. Mascart, J. Noilham, and J.-C. Pinty. 1989. Impacts of forests on mesoscale meteorology. Philosophical Transactions of the Royal Society B 324:407–422.
Avissar, R., P. Avissar, Y. Mahrer, and B. A. Bravdo. 1985. A model to simulate response of plant stomata to environ-mental conditions. Agricultural and Forest Meteorology 34: 21–29.
Betts, R., P. M. Cox, S. E. Lee, and F. I. Woodward. 1997. Contrasting physiological and structural vegetation feed-backs in climate change simulations. Nature 387:796–799.
Bréda, N., H. Cochard, E. Dreyer, and A. Granier. 1993. Water transfer in a mature oak stand (Quercus petraea): seasonal evolution and effects of a severe drought. Canadian Journal of Forest Research 3:1136–1143.
Bréda, N., and A. Granier. 1996. Intra- and interannual varia-tions of transpiration, leaf area index and radial growth of a sessile oak stand (Quercus petraea). Annals of Forest Science 53:521–536.
Calder, I. R. 1998. Water use by forests, limits and controls. Tree Physiology 18:625–631.
Campbell, G. S. 1974. A simple method for determining unsatu-rated conductivity from moisture retention data. Soil Science 117:311–314.
Cermák, J., E. Cienciala, J. Kucera, and J. E. Hällgren. 1992. Radial velocity profiles of water flow in trunks of Norway spruce and oak and the response of spruce to severing. Tree Physiology 10:367–380.
Cermák, J., E. Ciencial, J. Kucera, A. Lindroth, and E. Bednárová. 1995. Individual variation of sap- flow rate in large pine and spruce trees and stand transpiration: a pilot study at the central NOPEX site. Journal of Hydrology 168:17–27.
Clapp, R. B., and G. M. Hornberger. 1978. Empirical equations for some hydraulic properties. Water Resources Research 14:601–604.
Clearwater, M. J., F. C. Meinzer, J. L. Andrade, G. Goldstein, and M. Holbrook. 1999. Potential errors in measurement of nonuniform sap flow using heat dissipation probes. Tree Physiology 19:681–687.
Cosby, B. J., G. M. Hornberger, R. B. Clapp, and T. R. Ginn. 1984. A statistical exploration of the relationships of soil- moisture characteristics to the physical properties of soils. Water Resources Research 20:682–690.
De Kauwe, M. G., et al. 2013. Forest water use and water use efficiency at elevated CO2: a model- data intercomparison at two contrasting temperate forest FACE sites. Global Change Biology 19:1759–1779.
Domec, J.-C., G. Sun, A. Noormets, M. J. Gavazzi, E. A. Treasure, E. Cohen, J. J. Swenson, S. G. McNulty, and J. S. King. 2012. A comparison of three methods to estimate evap-otranspiration in two contrasting loblolly pine plantations: age- related changes in water use and drought sensitivity of evapotranspiration components. Forest Science 58:497–512.
Duursma, R. A., P. Kolari, M. Perämäki, E. Nikinmaa, P. Hari, S. Delzon, D. Loustau, H. Ilvesniemi, J. Pumpanen, and A. Mäkelä. 2008. Predicting the decline in daily maximum transpiration rate of two pine stands during drought based on constant minimum leaf water potential and plant hydraulic conductance. Tree Physiology 28:265–276.
Ewers, B. E., and R. Oren. 2000. Analyses of assumptions and errors in the calculation of stomatal conductance from sap flux measurements. Tree Physiology 20:579–589.
Ewers, B. E., R. Oren, T. J. Albaugh, and P. M. Dougherty. 1999. Carry- over effects of water and nutrient supply on water use of Pinus taeda. Ecological Applications 9:513–525.
Ewers, B. E., R. Oren, N. Phillips, M. Strömgren, and S. Linder. 2001. Mean canopy stomatal conductance responses to water and nutrient availabilities in Picea abies and Pinus taeda. Tree Physiology 21:841–850.
Ewers, B. E., R. Oren, and J. S. Sperry. 2000. Influence of nutri-ent versus water supply on hydraulic architecture and water balance in Pinus taeda. Plant Cell and Environment 23: 1055–1066.
Ford, C. R., R. M. Hubbard, and J. M. Vose. 2011. Quantifying structural and physiological controls on variation in canopy transpiration among planted pine and hardwood species in the southern Appalachians. Ecohydrology 4:183–195.
Ford, C. R., M. A. McGuire, R. J. Mitchell, and R. O. Teskey. 2004. Assessing variation in the radial profile of sap flux den-sity in Pinus species and its effect on daily water use. Tree Physiology 24:241–249.
Giesler, R., U. S. Lundström, and H. Grip. 1996. Comparison of soil solution chemistry assessment using zero- tension ly-simeters or centrifugation. European Journal of Soil Science 47:395–405.
Granier, A. 1987. Evaluation of transpiration in a Douglas- fir stand by means of sap flow measurements. Tree Physiology 3:309–320.
Granier, A., P. Biron, B. Köstner, L. W. Gay, and G. Najjar. 1996. Comparisons of xylem sap flow and water vapour flux at the stand level and derivation of canopy conductance for Scots pine. Theoretical and Applied Climatology 53: 115–122.
Granier, A., D. Loustau, and N. Bréda. 2000. A generic model of forest canopy conductance dependent on climate, soil water availability and leaf area index. Annals of Forest Science 57:755–765.
Granier, A., et al. 2007. Evidence for soil water control on carbon and water dynamics in European forests during the extremely dry year: 2003. Agricultural and Forest Meteor-ology 143:123–145.
Hacke, U. G., J. S. Sperry, B. E. Ewers, D. S. Ellsworth, K. V. R. Schäfer, and R. Oren. 2000. Influence of soil poro-sity on water use in Pinus taeda. Oecologia 124:495–505.
Hasselquist, N. J., P. Högberg, and D. B. Metcalfe. 2012. Contrasting effects of low and high nitrogen additions on soil

ESTIMATING DAILY FOREST TRANSPIRATIONJanuary 2017 131
CO2 flux components and ectomycorrhizal fungal sporocarp production in a boreal forest. Global Change Biology 18: 3596–3605.
Igarashi, Y., T. Kumagai, N. Yoshifuji, T. Sato, N. Tanaka, K. Tanaka, M. Suzuki, and C. Tantasirin. 2015. Envir-onmental control of canopy stomatal conductance in a tropi-cal deciduous forest in northern Thailand. Agricultural and Forest Meteorology 202:1–10.
Irvine, J., B. E. Law, M. R. Kurpius, P. M. Anthoni, D. Moore, and P. A. Schwarz. 2004. Age- related changes in ecosystem structure and function and effects on water and carbon exchange in ponderosa pine. Tree Physiology 24:753–763.
James, S. A., M. J. Clearwater, F. C. Meinzer, and G. Goldstein. 2002. Heat dissipation sensors of variable length for the measurement of sap flow in trees with deep sapwood. Tree Physiology 22:277–283.
Jarvis, P. G. 1976. The interpretation of the variations in leaf water potential and stomatal conductance found in canopies in the field. Philosophical Transactions of the Royal Society B 273:593–610.
Kätterer, T., O. Andrén, and P.-E. Jansson. 2006. Pedotransfer functions for estimating plant available water and bulk den-sity in Swedish agricultural soils. Acta Agriculturae Scan-dinavica Section B 56:263–267.
Kelliher, F. M., R. Leuning, M. R. Raupach, and E.-D. Schulze. 1995. Maximum conductances for evaporation from global vegetation types. Agricultural and Forest Meteorology 73: 1–16.
Knight, D. H. 1991. Pine forests: a comparative overview of ecosystem structure and function. Pages 121–135 in N. Nakagoshi and F. B. Golley, editors. Coniferous forest ecology from an international perspective. SPB Academic Publisher, The Hague, the Netherlands.
Kim, D., R. Oren, A. C. Oishi, C.-I. Hsieh, N. Phillips, K. A. Novick, and P. C. Stoy. 2014. Sensitivity of stand transpira-tion to wind velocity in a mixed broadleaved deciduous for-est. Agricultural and Forest Meteorology 187:62–71.
Kim, H.-S., S. Palmroth, M. Thérézien, P. Stenberg, and R. Oren. 2011. Analysis of the sensitivity of absorbed light and incident light profile to various canopy architecture and stand conditions. Tree Physiology 30:31–47.
Knight, D. H., J. M. Vose, V. C. Baldwin, K. C. Ewel, and K. Grodzinska. 1994. Contrasting patterns in pine forest eco-systems. Ecological Bulletins (Copenhagen) 43:9–19.
Kowalczyk, E. A., Y. P. Wang, R. M. Law, H. L. Davies, J. L. McGregor, and G. Abramowitz. 2006. The CSIRO Atmosphere Biosphere Land Exchange (CABLE) model for use in climate models and as an offline model, Marine Atmospheric Research Paper 013. CSIRO (Commonwealth Scientific and Industrial Research Organisation), Aspendale, Victoria, Australia.
Lai, C.-T., G. Katul, J. Butnor, M. Siqueira, D. Ellsworth, C. Maier, K. Johnsen, S. Mckeand, and R. Oren. 2002. Modelling the limits on the response of net carbon exchange to fertilization in a south- eastern pine forest. Plant Cell and Environment 25:1095–1119.
Landsberg, J. J. 1986. Physiology ecology of forest production. Pages 198. Academic Press, Sydney, New South Wales, Australia.
Laudon, H., and M. Ottosson Löfvenius. 2016. Adding snow to the picture: providing complementary winter precipitation data to the Krycklan Catchment Study database. Hydro-logical Processes 30:2413–2416. http://dx.doi.org/10.1002/hyp.10753
Laudon, H., I. Taberman, A. Ågren, M. Futter, M. Ottosson-Löfvenius, and K. Bishop. 2013. The Krycklan catchment study: a flagship infrastructure for hydrological,
biogeochemistry, and climate research in the boreal land-scape. Water Resources Research 49:7154–7158.
Lim, H., R. Oren, S. Palmroth, P. Tor-ngern, T. Mörling, T. Näsholm, T. Lundmark, H.-S. Helmisaari, J. Leppälammi-Kujansuu, and S. Linder. 2015. Inter- annual variability of precipitation constrains the production response of boreal Pinus sylvestris to nitrogen fertilization. Forest Ecology and Management 348:31–45.
Loustau, D., P. Berbigier, P. Roumagnac, C. Arruda-Pacheco, J. S. David, M. I. Ferreira, J. S. Pereira, and R. Tavares. 1996. Transpiration of a 64- year- old maritime pine stand in Portugal. Oecologia 107:33–42.
Lu, P., W. J. Müller, and E. K. Chacko. 2000. Spatial variations in xylem sap flux density in the trunk of orchard- grown, mature mango trees under changing soil water conditions. Tree Physiology 20:683–692.
Lundblad, M., F. Lagergren, and A. Lindroth. 2001. Evaluation of heat balance and heat dissipation methods for sapflow measurements in pine and spruce. Annals of Forest Science 58:625–638.
Lundmark, A., and P.-E. Jansson. 2009. Generic soil descriptions for modelling water and chloride dynamics in the unsaturated zone based on Swedish soils. Geoderma 150:85–95.
Mäkelä, A., P. Kolari, J. Karimäki, E. Nikinmaa, M. Perämäki, and P. Hari. 2006. Modelling five years of weather- driven variation of GPP in a boreal forest. Agricultural and Forest Meteorology 139:382–398.
Manoli, G., J.-C. Domec, K. Novick, A. C. Oishi, A. Noormets, M. Marani, and G. Katul. 2016. Soil–plant–atmosphere conditions regulating convective cloud formation above southeastern US pine plantations. Global Change Biology 22:2238–2254. http://dx.doi.org/10.1111/gcb.13221
Margolis, H., R. Oren, D. Whitehead, and M. R. Kaufmann. 1995. Leaf area dynamics of conifer forests. Pages 181–223 in W. K. Smith and T. M. Hinckley, editors. Ecophysiology of coniferous forests. Academic Press, San Diego, California, USA.
Martin, T. A., K. J. Brown, J. Cermák, R. Ceulemans, J. Kucera, F. C. Meinzer, J. S. Rombold, D. G. Sprugel, and T. M. Hinckley. 1997. Crown conductance and tree and stand transpiration in a second growth Abies amabilis forest. Canadian Journal of Forest Research 27:797–808.
Martínez-Vilalta, J., D. Vanderklein, and M. Mencuccini. 2007. Tree height and age- related decline in growth in Scots pine (Pinus sylvestris L.). Oecologia 150:529–544.
Matyssek, R., G. Wieser, K. Patzner, H. Blaschke, and K.-H. Häberle. 2009. Transpiration of forest trees and stands at dif-ferent altitude: Consistencies rather than contrasts? European Journal of Forest Research 128:579–596.
McCarthy, H. R., R. Oren, K. H. Johnsen, S. G. Pritchard, M. A. Davis, C. Maier, and H.-S. Kim. 2006. Ice storms and management practices interact to affect current carbon sequestration in forests with potential mitigation under future CO2 atmosphere. Journal of Geophysical Research, Atmo-spheres 111:D15103.
McDowell, N., et al. 2002. The relationship between tree height and leaf area: sapwood area ratio. Oecologia 132:12–20.
Mellander, P.-E., H. Laudon, and K. Bishop. 2005. Modelling variability of snow depths and soil temperatures in Scots pine stands. Agricultural and Forest Meteorology 133:109–118.
Mellander, P.-E., M. Stähli, D. Gustafsson, and K. Bishop. 2006. Modelling the effect of low soil temperatures on transpiration by Scots pine. Hydrological Processes 20:1929–1944.
Novick, K., R. Oren, P. Stoy, J.-Y. Juang, M. Siqueira, and G. Katul. 2009. The relationship between reference canopy conductance and simplified hydraulic architecture. Advances in Water Resources 32:809–819.

132 Ecological Applications Vol. 27, No. 1PANTANA TOR- NGERN ET AL.
Ocheltree, T. W., J. B. Nippert, and P. V. V. Prasad. 2014. Stomatal responses to changes in vapor pressure deficit reflect tissue- specific differences in hydraulic conductance. Plant, Cell and Environment 37:132–139.
Oishi, A. C., R. Oren, K. A. Novick, S. Palmroth, and G. G. Katul. 2010. Interannual invariability of forest evapotranspi-ration and its consequence to water flow downstream. Ecosystems 13:421–436.
Oishi, A. C., R. Oren, and P. C. Stoy. 2008. Estimating compo-nents of forest evapotranspiration: a footprint approach for scaling sap flux measurements. Agricultural and Forest Meteorology 148:1719–1732.
Oleson, K. W., et al. 2010. Technical description of version 4.0 of the Community Land Model (CLM) NCAR. Technical Note NCAR/TN-461+ STR. National Centre for Atmospheric Research, Boulder, Colorado, USA.
Oliveras, I., and P. Llorens. 2001. Medium- term sap flux moni-toring in a Scots pine stand: analysis of the operability of the heat dissipation method for hydrological purposes. Tree Physiology 21:473–480.
Oren, R., N. Phillips, G. Katul, B. E. Ewers, and D. E. Pataki. 1998a. Scaling xylem sap flux and soil water balance and calculating variance: a method for partitioning water flux in forests. Annals of Forest Science 55:191–216.
Oren, R., B. E. Ewers, P. Todd, N. Phillips, and G. G. Katul. 1998b. Water balance delineates the soil layer in which mois-ture affects canopy conductance. Ecological Applications 8:990–1002.
Oren, R., N. Phillips, B. E. Ewers, D. E. Pataki, and P. J. Megonigal. 1999b. Sap flux- scaled transpiration in response to light, vapor pressure deficit, and leaf area reduction in a flooded Taxodium distichum L. forest. Tree Physiology 19: 337–347.
Oren, R., J. S. Sperry, G. G. Katul, D. E. Pataki, B. E. Ewers, N. Phillips, and K. V. R. Schäfer. 1999a. Survey and synthesis of intra- and interspecific variation in stomatal sensitivity to vapour pressure deficit. Plant, Cell and Environment 22: 1515–1526.
Palmroth, S., L. H. Bach, A. Nordin, and K. Palmqvist. 2014. Nitrogen- addition effects on leaf traits and photosynthetic carbon gain of boreal forest understory shrubs. Oecologia 175:457–470.
Papaioannou, G., N. Papanikolaou, and D. Retails. 1993. Relationships of photosynthetically active radiation and shortwave irradiance. Theoretical and Applied Climatology 48:23–27.
Pataki, D. E., R. Oren, and W. K. Smith. 2000. Sap flux of co- occurring species in a western subalpine forest during sea-sonal soil drought. Ecology 81:2557–2566.
Phillips, N., and R. Oren. 1998. A comparison of daily representa-tions of canopy conductance based on two conditional time- averaging methods and the dependence of daily conductance on environmental factors. Annals of Forest Science 55:217–235.
Phillips, N., and R. Oren. 2001. Intra- and inter- annual varia-tion in transpiration of a pine forest. Ecological Applications 11:385–396.
Phillips, N., R. Oren, and R. Zimmerman. 1996. Radial patterns of xylem sap flow in non- , diffuse- and ring- porous tree spe-cies. Plant, Cell and Environment 19:983–990.
Pothier, D., H. A. Margolis, and R. H. Waring. 1989. Patterns of change of saturated sapwood permeability and sapwood conductance with stand development. Canadian Journal of Forest Research 19:432–439.
Poyatos, R., et al. 2007. Plasticity in hydraulic architecture of Scots pine across Eurasia. Oecologia 153:245–259.
Rautiainen, M., J. Heiskanen, and L. Korhonen. 2011. Seasonal changes in canopy leaf area index and MODIS vegetation
products for a boreal forest site in central Finland. Boreal Environment Research 17:72–84.
Ritchie, J. T., and E. Burnett. 1971. Dryland evaporative flux in subhumid climate, II. Plant influences. Agronomy Journal 63:56–62.
Roberts, J. 1983. Forest transpiration: a conservative hydrolog-ical process. Journal of Hydrology 66:133–141.
Roberts, J. 2000. The influence of physical and physiological characteristics of vegetation on their hydrological response. Hydrological Processes 14:2885–2901.
Roberts, J., C. F. Pymar, J. S. Wallace, and R. M. Pitman. 1980. Seasonal changes in leaf area, stomatal and canopy conduct-ances and transpiration from bracken below a forest canopy. Journal of Applied Ecology 17:409–422.
Ryan, M., B. J. Bond, B. E. Law, R. M. Hubbard, D. Woodruff, E. Cienciala, and J. Kucera. 2000. Transpiration and whole- tree conductance in ponderosa pine trees of different heights. Oecologia 124:553–560.
Saugier, B., A. Granier, J. Y. Pontailler, E. Dufrêne, and D. D. Baldocchi. 1997. Transpiration of a boreal pine forest meas-ured by branch bag, sap flow and micrometeorological meth-ods. Tree Physiology 17:511–519.
Schäfer, K. V. R., R. Oren, C.-T. Lai, and G. G. Katul. 2002. Hydrologic balance in an intact temperate forest ecosystem under ambient and elevated atmospheric CO2 concentration. Global Change Biology 8:895–911.
Schäfer, K. V. R., R. Oren, and J. D. Tenhunen. 2000. The effect of tree height on crown level stomatal conductance. Plant Cell and Environment 23:365–375.
Sellin, A., and P. Kupper. 2005. Effects of light availability versus hydraulic constraints on stomatal responses within a crown of silver birch. Oecologia 142:388–397.
Stenberg, P. 1996. Correcting LAI- 2000 estimates for the clumping of needles in shoots of conifers. Agricultural and Forest Meteorology 79:1–8.
Steppe, K., D. J. W. De Pauw, T. M. Doody, and R. O. Teskey. 2010. A comparison of sap flux density using thermal dissipation, heat pulse velocity and heat field deformation methods. Agricultural and Forest Meteorology 150: 1046–1056.
Sun, H., D. P. Aubrey, and R. O. Teskey. 2012. A simple cali-bration improved the accuracy of the thermal dissipation technique for sap flow measurements in juvenile trees of six species. Trees 26:631–640.
Tateishi, M., T. Kumagai, Y. Utsumi, T. Umebayashi, Y. Shiiba, K. Inoue, K. Kaji, K. Cho, and K. Otsuki. 2008. Spatial variations in xylem sap flux density in evergreen oak trees with radial- porous wood: comparisons with anatomical observations. Trees 23:23–30.
Thérézien, M., S. Palmroth, R. Brady, and R. Oren. 2007. Estimation of light interception properties of conifer shoots by an improved photographic method and a 3D model of shoot structure. Tree Physiology 27:1375–1387.
Tor-ngern, P., R. Oren, E. J. Ward, S. Palmroth, H. R. McCarthy, and J.-C. Domec. 2015. Increases in atmospheric CO2 have little influence on transpiration of a temperate for-est canopy. New Phytologist 205:518–525.
Uebelherr, J. M. 2008. The effects of plant-area index on precip-itation throughfall and its spatiotemporal variation among deciduous and evergreen forests. Thesis. Duke University, Durham, North Carolina, USA.
Vergeynst, L. L., M. W. Vandegehuchte, M. A. McGuire, R. O. Teskey, and K. Steppe. 2014. Changes in stem water content influence sap flux density measurements with thermal dissipa-tion probes. Trees 28:949–955.
Whitehead, D., W. R. N. Edwards, and P. G. Jarvis. 1984. Conducting sapwood area, foliage area, and permeability in

ESTIMATING DAILY FOREST TRANSPIRATIONJanuary 2017 133
mature trees of Picea sitchensis and Pinus contorta. Canadian Journal of Forest Research 14:940–947.
Woodward, F. I., T. M. Smith, and W. R. Emanuel. 1995. A global land primary productivity and phytogeography model. Global Biogeochemical Cycles 9:471–490.
Wullschleger, S. D., F. C. Meinzer, and R. A. Vertessy. 1998. A review of whole- plant water use studies in trees. Tree Physiology 18:499–512.
Xiong, W., R. Oren, Y. Wang, P. Yu, H. Liu, G. Cao, L. Xu, Y. Wang, and H. Zuo. 2015. Heterogeneity of competition at decameter scale: patches of high canopy leaf area in a shade- intolerant larch stand transpire less yet are more sensitive to drought. Tree Physiology 35:470–484.
Xu, Q., S. Liu, X. Wan, C. Jiang, X. Song, and J. Wang. 2012. Effects of rainfall on soil moisture and water movement in a subalpine dark coniferous forest in southwestern China. Hydrological Processes 26:3800–3809.
Zaehle, S., et al. 2014. Evaluation of 11 terrestrial carbon- nitrogen cycle models against observations from two
temperate free- air CO2 Enrichment studies. New Phytologist 202:803–822.
Zhang, Y., R. Oren, and S. Kang. 2012. Spatiotemporal variation of crown- scale stomatal conductance in an arid Vitis vinifera L. cv. Merlot vineyard: direct effects of hydrau-lic properties and indirect effects of canopy leaf area. Tree Physiology 32:262–279.
Zheng, G., and L. M. Moskal. 2009. Retrieving leaf area index (LAI) using remote sensing: theories, methods and sensors. Sensors 9:2719–2745.
Zimmermann, R., R. Oren, E.-D. Schulze, and K. S. Werk. 1988. Performance of two Picea abies (L.) Karst. stands at different stages of decline. II. Photosynthesis and leaf conductance. Oecologia 76:513–518.
Zimmermann, R., E.-D. Schulze, C. Wirth, E.-E. Schulze, K. C. Mcdonald, N. N. Vygodskaya, and W. Ziegler. 2000. Canopy transpiration in a chronosequence of Central Siberian pine forests. Global Change Biology 6: 25–37.
suPPorting information
Additional Supporting Information may be found online at: http://onlinelibrary.wiley.com/doi/10.1002/eap.1423/full