Embed Size (px)
Citation preview

Unaudited semi-annual report as at 30th June 2019
ECONOPOLIS FUNDS Société d'investissement à capital variable Luxembourg
R.C.S. Luxembourg B174910

No subscription can be received on the basis of this financial report. Subscriptions are only valid if made on the basis of the current prospectus, the Key Investor Information Document "KIID", supplemented by the latest annual report and the most recent semi-annual report, if published thereafter.

ECONOPOLIS FUNDS
Contents
1
Organisation ........................................................................................................................................... 3
Combined statement of net assets ....................................................................................................... 5
ECONOPOLIS FUNDS - ECONOPOLIS PATRIMONIAL SUSTAINABLE ............................................ 6 Statement of net assets ........................................................................................................................ 6 Statistical information ............................................................................................................................ 7 Statement of investments and other net assets ................................................................................... 8 Industrial and geographical classification of investments ...................................................................13 Statement of changes in investments .................................................................................................15
ECONOPOLIS FUNDS - ECONOPOLIS PATRIMONIAL EMERGING ................................................19 Statement of net assets ......................................................................................................................19 Statistical information ..........................................................................................................................20 Statement of investments and other net assets .................................................................................21 Industrial and geographical classification of investments ...................................................................24 Statement of changes in investments .................................................................................................26
ECONOPOLIS FUNDS - ECONOPOLIS GLOBAL EQUITY ................................................................28 Statement of net assets ......................................................................................................................28 Statistical information ..........................................................................................................................29 Statement of investments and other net assets .................................................................................30 Industrial and geographical classification of investments ...................................................................31 Statement of changes in investments .................................................................................................32
ECONOPOLIS FUNDS - ECONOPOLIS EM GOVERNMENT BONDS ...............................................33 Statement of net assets ......................................................................................................................33 Statistical information ..........................................................................................................................34 Statement of investments and other net assets .................................................................................35 Industrial and geographical classification of investments ...................................................................37 Statement of changes in investments .................................................................................................38
ECONOPOLIS FUNDS - ECONOPOLIS SMART CONVICTIONS FUND ............................................40 Statement of net assets ......................................................................................................................40 Statistical information ..........................................................................................................................41 Statement of investments and other net assets .................................................................................42 Industrial and geographical classification of investments ...................................................................44 Statement of changes in investments .................................................................................................46
ECONOPOLIS FUNDS - ECONOPOLIS EMERGING MARKET EQUITIES ........................................48 Statement of net assets ......................................................................................................................48 Statistical information ..........................................................................................................................49 Statement of investments and other net assets .................................................................................50 Industrial and geographical classification of investments ...................................................................52 Statement of changes in investments .................................................................................................53
ECONOPOLIS FUNDS - ECONOPOLIS GLOBAL BONDS ................................................................54 Statement of net assets ......................................................................................................................54 Statistical information ..........................................................................................................................55 Statement of investments and other net assets .................................................................................56 Industrial and geographical classification of investments ...................................................................58 Statement of changes in investments .................................................................................................59
ECONOPOLIS FUNDS - ECONOPOLIS BELGIAN CHAMPIONS ......................................................60 Statement of net assets ......................................................................................................................60 Statistical information ..........................................................................................................................61 Statement of investments and other net assets .................................................................................62 Industrial and geographical classification of investments ...................................................................63 Statement of changes in investments .................................................................................................64

ECONOPOLIS FUNDS
Contents (continued)
2
ECONOPOLIS FUNDS - ECONOPOLIS TOTAL RETURN ..................................................................65 Statistical information ..........................................................................................................................65 Statement of changes in investments .................................................................................................66
Notes to the financial statements .......................................................................................................69
Additional information .........................................................................................................................76

ECONOPOLIS FUNDS
3
Organisation
Registered Office: 9, Boulevard Prince Henri L-1724 LUXEMBOURG Board of Directors: Chairman Geert NOELS
ECONOPOLIS WEALTH MANAGEMENT N.V. Sneeuwbeslaan 20 B-2610 WILRIJK
Directors Fred JANSSENS
ECONOPOLIS WEALTH MANAGEMENT N.V. Sneeuwbeslaan 20 B-2610 WILRIJK
(since 22nd February 2019) Maarten GEERDINK
ECONOPOLIS WEALTH MANAGEMENT N.V. Sneeuwbeslaan 20 B-2610 WILRIJK (until 26th February 2019)
Gregory CHRISTIANS ECONOPOLIS WEALTH MANAGEMENT N.V. Sneeuwbeslaan 20 B-2610 WILRIJK (since 26th February 2019)
Geert WELLENS
ECONOPOLIS WEALTH MANAGEMENT N.V. Sneeuwbeslaan 20 B-2610 WILRIJK (until 22nd February 2019)
Management Company and CONVENTUM ASSET MANAGEMENT Domiciliary Agent Société Anonyme 9, Boulevard Prince Henri L-1724 LUXEMBOURG Board of Directors of the Management Company Chairman Ruth BÜLTMANN Independent Director 40, Rue d’Ernster L-6977 OBERANVEN Directors Michèle BIEL General Manager CONVENTUM ASSET MANAGEMENT Société Anonyme 9, Boulevard Prince Henri L-1724 LUXEMBOURG

ECONOPOLIS FUNDS
Organisation (continued)
4
Fernand GRULMS Independent Director 2, Rue Nic. Flener L-8228 MAMER General Managers of the Michèle BIEL Management Company General Manager CONVENTUM ASSET MANAGEMENT Société Anonyme 9, Boulevard Prince Henri L-1724 LUXEMBOURG Georges ENGEL General Manager CONVENTUM ASSET MANAGEMENT Société Anonyme 9, Boulevard Prince Henri L-1724 LUXEMBOURG Rita HERRMANN General Manager CONVENTUM ASSET MANAGEMENT Société Anonyme 9, Boulevard Prince Henri L-1724 LUXEMBOURG (until 28th February 2019) Depositary, Central Administration BANQUE DE LUXEMBOURG and Primary Paying Agent 14, Boulevard Royal
L-2449 LUXEMBOURG Central Administration’s Subcontractor EUROPEAN FUND ADMINISTRATION 2, Rue d’Alsace L-1017 LUXEMBOURG Cabinet de révision agréé DELOITTE Audit Société à responsabilité limitée 20, Boulevard de Kockelscheuer L-1821 LUXEMBOURG Investment Manager ECONOPOLIS WEALTH MANAGEMENT N.V. Sneeuwbeslaan 20 B-2610 WILRIJK

ECONOPOLIS FUNDS
Combined statement of net assets (in EUR) as at 30th June 2019
The accompanying notes are an integral part of these financial statements.
5
Assets Securities portfolio at market value 276,991,028.14 Cash at banks 18,490,036.20 Formation expenses, net 47,417.46 Receivable on issues of shares 244,079.15 Income receivable on portfolio 2,121,147.09
Total assets 297,893,708.04
Liabilities Bank overdrafts 2,261,997.62 Payable on purchases of securities 271,327.66 Payable on redemptions of shares 5,763,993.10 Interest payable on bank overdrafts 6,024.49 Expenses payable 665,121.62
Total liabilities 8,968,464.49
Net assets at the end of the period 288,925,243.55

ECONOPOLIS FUNDS - ECONOPOLIS PATRIMONIAL SUSTAINABLE
Statement of net assets (in EUR) as at 30th June 2019
The accompanying notes are an integral part of these financial statements.
6
Assets Securities portfolio at market value 127,422,274.48 Cash at banks 8,993,630.57 Formation expenses, net 2,768.84 Income receivable on portfolio 934,111.98
Total assets 137,352,785.87
Liabilities Bank overdrafts 2,261,853.63 Payable on redemptions of shares 3,042,093.10 Interest payable on bank overdrafts 6,024.49 Expenses payable 232,175.72
Total liabilities 5,542,146.94
Net assets at the end of the period 131,810,638.93
Breakdown of net assets per share class
Share class Number of
shares
Currency of
share class
NAV per share in currency of
share class
Net assets per share class
(in EUR)
A Cap EUR 1.0000 EUR 100.21 100.21 A Dis EUR 1.0000 EUR 98.93 98.93 I Cap EUR 591,959.4794 EUR 111.85 66,211,840.91 I Dis EUR 417,625.8706 EUR 103.25 43,120,431.99 O Cap EUR 179,904.9527 EUR 102.44 18,429,915.50 O Dis EUR 40,027.9314 EUR 101.14 4,048,251.39
131,810,638.93

ECONOPOLIS FUNDS - ECONOPOLIS PATRIMONIAL SUSTAINABLE
Statistical information (in EUR) as at 30th June 2019
(*) Net asset value used for final redemption.
The accompanying notes are an integral part of these financial statements.
7
Total net assets Currency 31.12.2017 31.12.2018 30.06.2019
EUR 78,648,924.45 77,255,274.17 131,810,638.93
Net asset value per share
Currency 31.12.2017 31.12.2018 30.06.2019
A Cap EUR EUR - 97.65 100.21 A Dis EUR EUR - 97.65 98.93 I Cap EUR EUR 109.46 107.50 111.85 I Dis EUR EUR 103.97 100.49 103.25 O Cap EUR EUR 99.34 98.15 102.44 O Dis EUR EUR 99.34 98.15 101.14
Number of shares outstanding at the
beginning of the period
issued redeemed outstanding at the end of the period
A Cap EUR - 1.0000 - 1.0000 A Dis EUR - 1.0000 - 1.0000 I Cap EUR 403,731.0653 287,360.1036 -99,131.6895 591,959.4794 I Dis EUR 124,599.0000 365,598.1188 -72,571.2482 417,625.8706 O Cap EUR 177,921.7161 1,983.2366 - 179,904.9527 O Dis EUR 39,428.0644 599.8670 - 40,027.9314
Dividends paid Currency Dividend per share Ex-dividend date
A Dis EUR EUR 1.29 30.04.2019 I Dis EUR EUR 1.29 30.04.2019 O Dis EUR EUR 1.29 30.04.2019
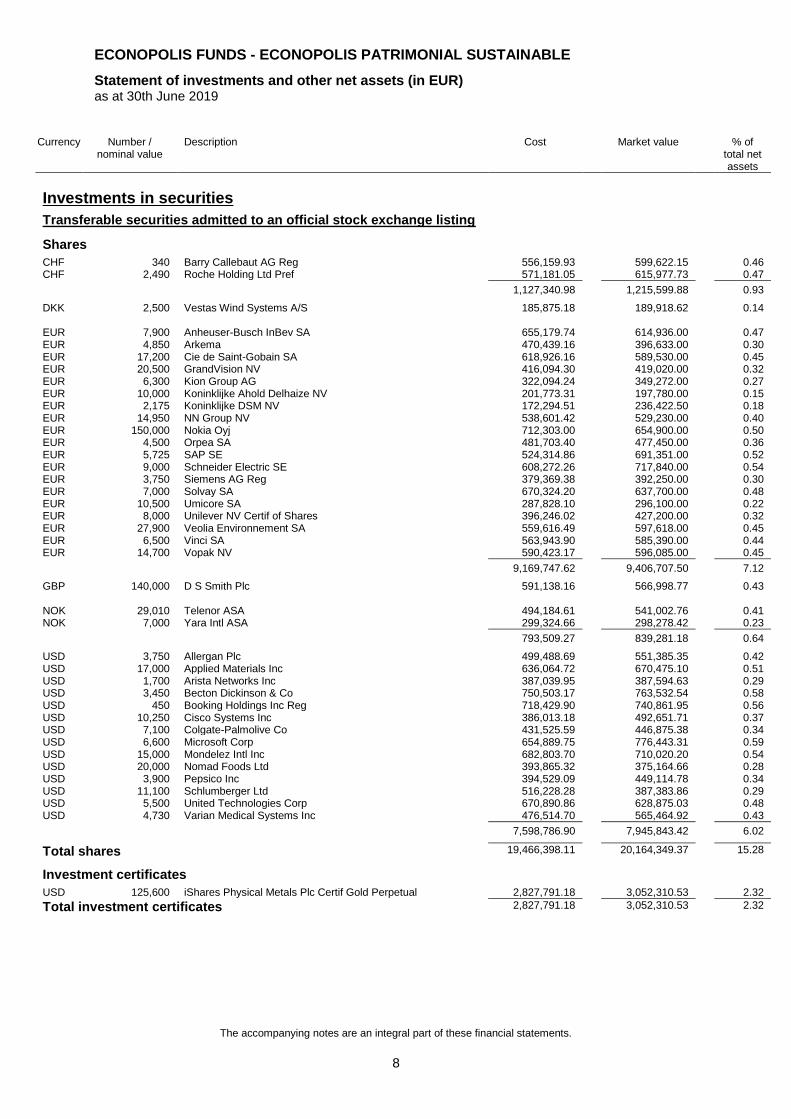
ECONOPOLIS FUNDS - ECONOPOLIS PATRIMONIAL SUSTAINABLE
Statement of investments and other net assets (in EUR) as at 30th June 2019
The accompanying notes are an integral part of these financial statements.
8
Currency Number / nominal value
Description Cost Market value % of total net assets
Investments in securities
Transferable securities admitted to an official stock exchange listing
Shares
CHF 340 Barry Callebaut AG Reg 556,159.93 599,622.15 0.46 CHF 2,490 Roche Holding Ltd Pref 571,181.05 615,977.73 0.47
1,127,340.98 1,215,599.88 0.93
DKK 2,500 Vestas Wind Systems A/S 185,875.18 189,918.62 0.14 EUR 7,900 Anheuser-Busch InBev SA 655,179.74 614,936.00 0.47 EUR 4,850 Arkema 470,439.16 396,633.00 0.30 EUR 17,200 Cie de Saint-Gobain SA 618,926.16 589,530.00 0.45 EUR 20,500 GrandVision NV 416,094.30 419,020.00 0.32 EUR 6,300 Kion Group AG 322,094.24 349,272.00 0.27 EUR 10,000 Koninklijke Ahold Delhaize NV 201,773.31 197,780.00 0.15 EUR 2,175 Koninklijke DSM NV 172,294.51 236,422.50 0.18 EUR 14,950 NN Group NV 538,601.42 529,230.00 0.40 EUR 150,000 Nokia Oyj 712,303.00 654,900.00 0.50 EUR 4,500 Orpea SA 481,703.40 477,450.00 0.36 EUR 5,725 SAP SE 524,314.86 691,351.00 0.52 EUR 9,000 Schneider Electric SE 608,272.26 717,840.00 0.54 EUR 3,750 Siemens AG Reg 379,369.38 392,250.00 0.30 EUR 7,000 Solvay SA 670,324.20 637,700.00 0.48 EUR 10,500 Umicore SA 287,828.10 296,100.00 0.22 EUR 8,000 Unilever NV Certif of Shares 396,246.02 427,200.00 0.32 EUR 27,900 Veolia Environnement SA 559,616.49 597,618.00 0.45 EUR 6,500 Vinci SA 563,943.90 585,390.00 0.44 EUR 14,700 Vopak NV 590,423.17 596,085.00 0.45
9,169,747.62 9,406,707.50 7.12
GBP 140,000 D S Smith Plc 591,138.16 566,998.77 0.43 NOK 29,010 Telenor ASA 494,184.61 541,002.76 0.41 NOK 7,000 Yara Intl ASA 299,324.66 298,278.42 0.23
793,509.27 839,281.18 0.64
USD 3,750 Allergan Plc 499,488.69 551,385.35 0.42 USD 17,000 Applied Materials Inc 636,064.72 670,475.10 0.51 USD 1,700 Arista Networks Inc 387,039.95 387,594.63 0.29 USD 3,450 Becton Dickinson & Co 750,503.17 763,532.54 0.58 USD 450 Booking Holdings Inc Reg 718,429.90 740,861.95 0.56 USD 10,250 Cisco Systems Inc 386,013.18 492,651.71 0.37 USD 7,100 Colgate-Palmolive Co 431,525.59 446,875.38 0.34 USD 6,600 Microsoft Corp 654,889.75 776,443.31 0.59 USD 15,000 Mondelez Intl Inc 682,803.70 710,020.20 0.54 USD 20,000 Nomad Foods Ltd 393,865.32 375,164.66 0.28 USD 3,900 Pepsico Inc 394,529.09 449,114.78 0.34 USD 11,100 Schlumberger Ltd 516,228.28 387,383.86 0.29 USD 5,500 United Technologies Corp 670,890.86 628,875.03 0.48 USD 4,730 Varian Medical Systems Inc 476,514.70 565,464.92 0.43
7,598,786.90 7,945,843.42 6.02
Total shares 19,466,398.11 20,164,349.37 15.28
Investment certificates
USD 125,600 iShares Physical Metals Plc Certif Gold Perpetual 2,827,791.18 3,052,310.53 2.32
Total investment certificates 2,827,791.18 3,052,310.53 2.32

ECONOPOLIS FUNDS - ECONOPOLIS PATRIMONIAL SUSTAINABLE
Statement of investments and other net assets (in EUR) (continued) as at 30th June 2019
The accompanying notes are an integral part of these financial statements.
9
Currency Number / nominal value
Description Cost Market value % of total net assets
Bonds
AUD 500,000 Australia ILB Ser CAIN407 09/20.09.25 456,537.15 454,385.58 0.34 BRL 1,330,000 IBRD 11.75% Reg S Ser 11312 15/04.11.20 359,719.61 328,369.95 0.25 BRL 4,000,000 Intl Finance Corp 7.5% EMTN Ser 1718 Sen 17/09.05.22 961,407.46 961,751.78 0.73
1,321,127.07 1,290,121.73 0.98
CAD 600,000 Canada 1% Sen 17/01.09.22 388,538.03 397,737.55 0.30 CAD 1,850,000 Canada 1.75% Sen 19/01.05.21 1,231,988.78 1,248,842.59 0.95
1,620,526.81 1,646,580.14 1.25
CZK 19,000,000 Czech Republic 0% Ser 101 Sen 17/10.02.20 718,689.01 740,264.75 0.56 CZK 5,000,000 Czech Republic 0.45% Ser 97 15/25.10.23 188,567.36 189,025.66 0.14 CZK 67,000,000 Czech Republic 0.75% Ser 104 18/23.02.21 2,552,623.14 2,603,545.94 1.98 CZK 6,500,000 Czech Republic 1.5% Ser 6Y 13/29.10.19 252,380.95 255,253.09 0.19 CZK 5,000,000 Czech Republic 3.85% Ser 61 10/29.09.21 211,985.80 207,116.14 0.16
3,924,246.26 3,995,205.58 3.03
EUR 1,100,000 Air Liquide Finance 1.25% EMTN Reg S Sen 15/03.06.25 1,162,749.50 1,181,719.00 0.90 EUR 200,000 Air Liquide Finance 1.25% EMTN Reg S Sen 16/13.06.28 210,937.00 217,653.00 0.17 EUR 100,000 Akzo Nobel NV 1.125% EMTN Reg S Sen 16/08.04.26 100,127.40 106,029.00 0.08 EUR 150,000 Akzo Nobel NV 1.75% EMTN Reg S Sen 14/07.11.24 160,650.00 163,086.00 0.12 EUR 1,450,000 Akzo Nobel NV 2.625% EMTN Sen 12/27.07.22 1,580,059.03 1,572,590.25 1.19 EUR 500,000 Alfa Laval Treasury Intl AB FRN EMTN Reg S Ser 1
14/12.09.19 501,763.37 500,440.00 0.38
EUR 300,000 Amadeus Capital Market 0.125% EMTN Reg S Sen 16/06.10.20 299,490.00 300,942.00 0.23 EUR 100,000 Amadeus Capital Market 1.625% EMTN Reg S Sen 15/17.11.21 105,596.00 103,730.50 0.08 EUR 700,000 Anglo American Capital Plc 2.875% EMTN Sen 13/20.11.20 731,290.00 728,276.50 0.55 EUR 900,000 Anglo American Capital Plc 3.5% EMTN 12/28.03.22 980,052.00 984,303.00 0.75 EUR 1,200,000 Arcelik AS 3.875% Reg S Sen 14/16.09.21 1,245,210.00 1,229,886.00 0.93 EUR 400,000 Befimmo SA 2.175% EMTN Ser 1059 Sen 17/12.04.27 400,200.00 401,956.00 0.31 EUR 1,400,000 Befimmo SA FRN Sen 15/21.04.22 1,406,500.00 1,403,500.00 1.06 EUR 200,000 Bekaert SA 5% EMTN 11/06.12.19 206,647.00 204,116.00 0.15 EUR 300,000 Belgium 0.5% Sen 17/22.10.24 308,376.00 314,571.00 0.24 EUR 500,000 Belgium 1.7% OLO 88 Sen 144A Reg S 19/22.06.50 558,947.50 588,705.00 0.45 EUR 100,000 BNG Bank NV FRN EMTN Sen 11/09.02.21 101,298.00 100,913.00 0.08 EUR 200,000 Booking Holdings Inc 0.8% Sen 17/10.03.22 204,112.00 204,498.00 0.16 EUR 600,000 Booking Holdings Inc 1.8% Sen 15/03.03.27 629,862.00 650,091.00 0.49 EUR 100,000 Chile 1.625% 14/30.01.25 102,420.69 108,238.50 0.08 EUR 1,000,000 Cofinimmo SICAFI SA 1.929% Sen 15/25.03.22 1,017,504.00 1,020,160.00 0.77 EUR 1,400,000 Czech Republic 3.875% EMTN 12/24.05.22 1,617,575.00 1,572,165.00 1.19 EUR 900,000 D S Smith Plc 2.25% EMTN Reg S Sen 15/16.09.22 953,324.00 950,679.00 0.72 EUR 300,000 Deutschland 0.5% Sen 15/15.02.25 315,307.50 319,486.50 0.24 EUR 150,000 Deutschland 1.5% 13/15.02.23 164,356.50 162,400.50 0.12 EUR 150,000 Deutschland ILB Sen 15/15.04.26 159,855.85 173,867.46 0.13 EUR 2,700,000 Deutschland ILB Ser I/L 09/15.04.20 3,232,466.76 3,125,327.07 2.37 EUR 2,000,000 Deutschland ILB Ser I/L 12/15.04.23 2,245,825.79 2,283,715.56 1.73 EUR 1,400,000 Electricité de France VAR EMTN Sub 13/29.01.Perpetual 1,454,118.00 1,435,336.00 1.09 EUR 800,000 Engie SA 2.625% EMTN Sen 12/20.07.22 871,108.00 870,652.00 0.66 EUR 450,000 Espana ILB Sen 14/30.11.19 474,954.73 474,009.69 0.36 EUR 1,800,000 Espana ILB Sen 14/30.11.24 2,143,233.95 2,172,923.74 1.65 EUR 700,000 Espana ILB Sen 15/30.11.30 804,009.09 855,450.88 0.65 EUR 750,000 Espana ILB Sen 16/30.11.21 807,156.48 811,396.21 0.62 EUR 100,000 Espana ILB Sen 17/30.11.27 101,189.90 116,111.78 0.09 EUR 200,000 Flemish Community 0.375% EMTN Reg S Sen 16/13.10.26 200,272.00 205,797.00 0.16 EUR 1,350,000 Flowserve Corp 1.25% Reg S Sen 15/17.03.22 1,351,133.55 1,363,999.50 1.03 EUR 1,500,000 France 0% 18/25.03.24 1,515,480.00 1,537,365.00 1.17 EUR 100,000 France 0% OAT 16/25.05.22 99,380.00 102,011.00 0.08 EUR 300,000 France ILB OAT 13/25.07.24 340,962.24 344,355.18 0.26 EUR 700,000 France ILB Ser OAT 11/25.07.27 964,083.65 979,744.86 0.74 EUR 200,000 France ILB T-Bonds Reg S Ser OATe 16/01.03.21 213,474.07 213,794.37 0.16 EUR 400,000 Fresenius Finance Ireland PLC 0.875% Reg S Sen 17/31.01.22 405,490.00 408,230.00 0.31 EUR 200,000 Fresenius Finance Ireland PLC 1.5% Reg S Sen 17/30.01.24 206,516.00 210,048.00 0.16 EUR 500,000 Fresenius Finance Ireland PLC 3% Reg S Sen 17/30.01.32 537,365.00 573,167.50 0.43 EUR 400,000 General Electric Co FRN Sen 15/28.05.20 399,818.10 400,274.00 0.30

ECONOPOLIS FUNDS - ECONOPOLIS PATRIMONIAL SUSTAINABLE
Statement of investments and other net assets (in EUR) (continued) as at 30th June 2019
The accompanying notes are an integral part of these financial statements.
10
Currency Number / nominal value
Description Cost Market value % of total net assets
EUR 810,000 GIMV NV 3.5% EMTN Sen 19/05.07.31 814,050.00 826,742.70 0.63 EUR 435,000 Greenyard NV 5% Sen 13/05.07.19 468,258.59 432,851.10 0.33 EUR 1,000,000 Hochtief AG 3.875% Sen 13/20.03.20 1,064,592.00 1,028,570.00 0.78 EUR 200,000 Hungary 3.875% EMTN Reg S Sen 05/24.02.20 222,480.00 205,610.00 0.16 EUR 500,000 Ireland 1.5% T-Bonds Sen 19/15.05.50 523,450.00 550,672.50 0.42 EUR 200,000 K+S Aktiengesellschaft 4.125% Reg S Sen Tr 2 13/06.12.21 216,657.00 218,951.00 0.17 EUR 100,000 Kinepolis Group NV 2.4% Sen 17/15.12.25 101,260.00 103,053.00 0.08 EUR 1,100,000 Kinepolis Group NV 2.9 % Sen Reg S 17/15.12.27 1,100,000.00 1,121,846.00 0.85 EUR 350,000 KPN NV 5.625% 09/30.09.24 464,929.50 431,072.25 0.33 EUR 300,000 Kraft Heinz Foods Co 1.5% Reg S Sen 16/24.05.24 305,790.00 311,044.50 0.24 EUR 200,000 Kraft Heinz Foods Co 2% Sen 15/30.06.23 208,722.00 211,695.00 0.16 EUR 150,000 La Lorraine Bakery Group NV 4% Sen 13/23.12.20 155,233.50 154,930.50 0.12 EUR 200,000 Mexico 1.375% Sen 16/15.01.25 201,686.00 205,646.00 0.16 EUR 800,000 Mexico 1.625% EMTN Sen 15/06.03.24 823,600.00 837,404.00 0.64 EUR 300,000 Molnlycke Holding AB 1.75% Reg S Sen 15/28.02.24 312,919.00 316,482.00 0.24 EUR 500,000 Naturgy Finance BV VAR Reg S Sub 14/18.11.Perpetual 510,500.00 544,035.00 0.41 EUR 100,000 Naturgy Finance BV VAR Reg S Sub 15/24.04.Perpetual 96,250.00 105,561.50 0.08 EUR 500,000 Nederlandse Waterschapsbank NV FRN EMTN Reg S
11/27.04.21 505,450.00 504,700.00 0.38
EUR 600,000 Neste Corporation 4% Sen 12/18.09.19 613,687.75 605,070.00 0.46 EUR 350,000 Netherlands 1.75% Reg S 13/15.07.23 389,159.00 384,471.50 0.29 EUR 350,000 NN Group NV VAR EMTN Sub 14/13.06.Perpetual 368,298.00 384,884.50 0.29 EUR 75,000 OEBB Infrastruktur AG 3% EMTN Ser 35 13/24.10.33 75,407.25 100,878.38 0.08 EUR 250,000 Oesterreich 0% Reg S Sen 16/15.07.23 253,565.00 255,895.00 0.19 EUR 500,000 OMV AG VAR Reg S Sub 15/09.12.Perpetual 562,550.00 555,555.00 0.42 EUR 200,000 OMV AG VAR Reg S Sub 15/09.12.Perpetual 232,640.00 251,836.00 0.19 EUR 300,000 Orpea SA 2.2% Sen 17/15.12.24 301,041.00 298,987.50 0.23 EUR 1,400,000 Poland 0.875% EMTN Reg S Ser 40 15/14.10.21 1,439,122.00 1,437,590.00 1.09 EUR 150,000 Poland 3.375% EMTN Reg S Ser 33 12/09.07.24 167,640.14 176,281.50 0.13 EUR 200,000 Romania 2.75% EMTN Reg S Sen 15/29.10.25 213,750.00 224,030.00 0.17 EUR 100,000 Romania 2.875% EMTN 14/28.10.24 110,900.00 112,357.00 0.09 EUR 400,000 Romania 3.875% EMTN Reg S Ser 2015-2 15/29.10.35 412,398.00 459,250.00 0.35 EUR 600,000 Sappi Papier Holdings GmbH 4% Reg S Sen 16/01.04.23 626,221.87 618,459.00 0.47 EUR 1,400,000 Schneider Electric SE 0.25% EMTN Sen 16/09.09.24 1,384,591.00 1,418,858.00 1.08 EUR 600,000 Siemens Financieringsmaatsc NV 2.875% EMTN Sen
13/10.03.28 709,398.00 730,623.00 0.55
EUR 700,000 Sky Ltd 1.5% EMTN Sen 14/15.09.21 729,969.00 725,039.00 0.55 EUR 500,000 Sky Ltd FRN EMTN Reg S Sen 15/01.04.20 506,390.00 502,122.50 0.38 EUR 1,000,000 Slovakia 0% Ser 230 16/13.11.23 985,698.00 1,017,415.00 0.77 EUR 400,000 Solvay Finance SA VAR Reg S Sub 15/02.06.Perpetual 405,709.73 434,906.00 0.33 EUR 800,000 Solvay SA 1.625% Reg S Sen 15/02.12.22 841,170.00 842,088.00 0.64 EUR 100,000 Telecom Italia SpA 3.25% EMTN Sen 15/16.01.23 98,609.30 105,790.50 0.08 EUR 1,300,000 Telenor ASA 2.75% EMTN Sen 12/27.06.22 1,428,061.00 1,417,039.00 1.08 EUR 400,000 Tesco Corp Treasury Serv plc 2.125% EMTN Sen 13/12.11.20 418,642.00 409,996.00 0.31 EUR 1,100,000 Tesco Plc 1.375% EMTN Sen 14/01.07.19 1,109,239.50 1,100,308.00 0.83 EUR 1,100,000 Teva Pharmaceutical Fin II BV 0.375% Reg S Sen 16/25.07.20 1,085,611.00 1,082,928.00 0.82 EUR 600,000 Teva Pharmaceutical Fin II BV 1.125% Reg S Sen 16/15.10.24 557,319.27 498,873.00 0.38 EUR 600,000 UCB 4.125% EMTN Sen 13/04.01.21 649,604.00 636,153.00 0.48 EUR 600,000 UCB 5.125% EMTN 13/02.10.23 712,788.00 708,288.00 0.54 EUR 700,000 Valeo SA 3.25% EMTN Sen 14/22.01.24 766,923.50 788,238.50 0.60 EUR 800,000 Vestas Wind Systems A/S 2.75% Reg S Sen 15/11.03.22 838,848.54 849,280.00 0.64 EUR 550,000 VGP SA 3.5% Sen Reg S 18/19.03.26 556,583.75 570,482.00 0.43 EUR 479,000 VGP SA 3.9% Reg S Sen 16/21.09.23 474,210.00 504,300.78 0.38 EUR 400,000 Voestalpine VAR EMTN Sub Ser 2 13/31.10.Perpetual 411,620.00 406,990.00 0.31 EUR 844,000 Vranken-Pommery Monopole 3.45% Sen 19/19.06.24 848,220.00 869,455.04 0.66
62,973,660.84 63,343,297.30 48.06
GBP 400,000 3i Group Plc 6.875% EMTN Ser 77312 98/09.03.23 592,764.21 525,790.53 0.40 GBP 350,000 United Kingdom 1.5% T-Stock Sen 15/22.01.21 407,917.22 396,420.12 0.30 GBP 800,000 United Kingdom 1.75% T Stock 12/07.09.22 971,001.75 927,142.98 0.70 GBP 1,050,000 United Kingdom 1.75% T-Stock 13/22.07.19 1,208,924.78 1,173,763.71 0.89
3,180,607.96 3,023,117.34 2.29
HUF 50,000,000 Hungary 7.5% Ser 20/A 04/12.11.20 190,582.92 170,558.76 0.13 INR 15,000,000 IBRD 5.75% EMTN Ser 100031 Sen 17/08.05.20 191,936.37 188,464.56 0.14

ECONOPOLIS FUNDS - ECONOPOLIS PATRIMONIAL SUSTAINABLE
Statement of investments and other net assets (in EUR) (continued) as at 30th June 2019
The accompanying notes are an integral part of these financial statements.
11
Currency Number / nominal value
Description Cost Market value % of total net assets
MXN 15,000,000 EIB 7.5% EMTN Reg S Sen 17/09.06.22 706,983.36 682,568.22 0.52 MXN 10,600,000 IADB 7.5% Ser 155 07/05.12.24 655,385.03 482,624.35 0.37 MXN 15,000,000 IBRD 0% Ser GDIF 07/19.09.22 541,708.35 546,746.30 0.41 MXN 7,700,000 IBRD 5.25% EMTN Ser 11223 15/18.05.25 383,656.04 314,309.95 0.24
2,287,732.78 2,026,248.82 1.54
NOK 2,000,000 EIB 1.5% EMTN Sen 15/12.05.22 213,694.59 206,080.46 0.16 NOK 4,000,000 Norway 2% 12/24.05.23 457,627.37 423,856.87 0.32 NOK 5,000,000 Norway 3% Ser 476 14/14.03.24 560,408.84 555,652.45 0.42 NOK 24,300,000 Norway 3.75% 10/25.05.21 2,683,044.63 2,619,684.10 1.99
3,914,775.43 3,805,273.88 2.89
PLN 1,000,000 Poland 1.5% Ser PS0420 15/25.04.20 233,035.15 235,701.28 0.18 USD 200,000 Anglo American Capital Plc 4.125% Reg S Sen 12/27.09.22 178,114.11 182,785.63 0.14 USD 200,000 AT&T Inc 4.3% Sen 13/15.12.42 178,927.51 171,984.72 0.13 USD 400,000 AT&T Inc 4.5% Sen 15/15.05.35 348,883.20 368,342.84 0.28 USD 200,000 AT&T Inc 5.45% Sen 17/01.03.47 188,294.46 202,231.49 0.15 USD 500,000 Booking Holdings Inc 3.6% Sen 16/01.06.26 448,107.19 463,399.05 0.35 USD 500,000 Canada 2.625% Sen 19/25.01.22 441,589.92 448,502.68 0.34 USD 300,000 Chile 2.25% Sen 12/30.10.22 248,751.05 264,708.44 0.20 USD 700,000 Diageo Capital Plc 2.625% Sen 13/29.04.23 621,469.92 623,256.35 0.47 USD 150,000 Embraer SA 5.15% Sen 12/15.06.22 135,663.03 139,415.56 0.11 USD 200,000 HCA Inc 5.875% Sen 12/15.03.22 190,269.96 191,965.93 0.15 USD 200,000 Hungary 5.375% Sen 13/21.02.23 198,615.66 193,668.21 0.15 USD 1,350,000 Hungary 6.375% Sen 11/29.03.21 1,297,747.91 1,267,692.32 0.96 USD 100,000 IBRD 4.75% Ser 1312 05/15.02.35 80,495.34 112,837.01 0.09 USD 200,000 Microsoft Corp 1.55% Sen 16/08.08.21 171,972.83 174,164.40 0.13 USD 1,350,000 Microsoft Corp 3.75% Sen 15/12.02.45 1,189,558.96 1,291,771.10 0.98 USD 150,000 Microsoft Corp 4.45% Sen 15/03.11.45 151,146.07 158,470.84 0.12 USD 100,000 Poland 3% Sen 12/17.03.23 84,502.37 90,269.61 0.07 USD 375,000 Poland 5.125% Sen 11/21.04.21 340,233.81 346,653.53 0.26 USD 900,000 Siemens Financieringsmaatsc NV 2.15% Reg S Sen
15/27.05.20 798,074.99 790,043.03 0.60
USD 1,000,000 US 1.5% T-Notes Ser AQ-2020 Sen 17/15.08.20 871,512.56 874,180.78 0.66 USD 2,150,000 US 1.5% T-Notes Ser H-2023 16/28.02.23 1,849,919.42 1,872,555.78 1.42 USD 2,550,000 US 2.25% T-Bonds Sen 16/15.08.46 1,971,740.80 2,114,654.52 1.60
11,985,591.07 12,343,553.82 9.36
Total bonds 92,280,359.81 92,522,508.79 70.19
Transferable securities dealt in on another regulated market
Bonds
CLP 275,000,000 Chile 5.5% Sen 10/05.08.20 390,265.70 365,148.95 0.28 EUR 2,000,000 Argan 3.25% Sen 17/04.07.23 2,027,176.00 2,052,900.00 1.56 EUR 700,000 AT&T Inc FRN 18/05.09.23 713,300.00 709,159.50 0.54 EUR 700,000 Cofinimmo SA 2% Ser Program 1041 16/09.12.24 699,587.00 711,067.00 0.54 EUR 500,000 ImmoBel 3% Sen 17/01.06.22 506,622.50 514,397.50 0.39 EUR 900,000 Molnlycke Holding AB 1.5% Reg S Sen 14/28.02.22 923,682.22 934,330.50 0.71 EUR 100,000 Molnlycke Holding AB 1.875% Reg S Sen 17/28.02.25 99,950.00 105,749.00 0.08 EUR 700,000 UCB 3.75% EMTN Sen 13/27.03.20 769,314.62 718,963.00 0.55
5,739,632.34 5,746,566.50 4.37
USD 100,000 Royal Caribbean Cruises Ltd 5.25% Sen 12/15.11.22 97,612.42 95,301.65 0.07 USD 1,000,000 US 2% T-Notes 15/15.08.25 870,806.86 886,187.36 0.67 USD 800,000 US ILB Sen T-Bonds 15/15.01.25 707,357.73 759,118.15 0.58 USD 500,000 US ILB T-Notes Lk Inflation Index 14/15.01.24 476,626.64 489,408.09 0.37

ECONOPOLIS FUNDS - ECONOPOLIS PATRIMONIAL SUSTAINABLE
Statement of investments and other net assets (in EUR) (continued) as at 30th June 2019
The accompanying notes are an integral part of these financial statements.
12
Currency Number / nominal value
Description Cost Market value % of total net assets
USD 500,000 US ILB T-Notes Sen 13/15.07.23 449,167.66 486,232.17 0.37 USD 550,000 US ILB T-Notes Ser D-2026 16/15.07.26 497,928.56 511,769.75 0.39 USD 1,600,000 US ILB T-Notes Ser X-2020 15/15.04.20 1,473,176.70 1,517,236.92 1.15
4,572,676.57 4,745,254.09 3.60
Total bonds 10,702,574.61 10,856,969.54 8.25
Other transferable securities
Bonds
EUR 600,000 Matexi NV 3.75% Sub Ser 995 16/22.06.23 599,904.00 601,290.00 0.46 EUR 250,000 Vrije Univeristeit Brussel 1.653% Sk MTN Sen 15/30.10.35 212,533.78 224,846.25 0.17
Total bonds 812,437.78 826,136.25 0.63
Total investments in securities 126,089,561.49 127,422,274.48 96.67
Cash at banks 8,993,630.57 6.82
Bank overdrafts -2,261,853.63 -1.72
Other net assets/(liabilities) -2,343,412.49 -1.77
Total 131,810,638.93 100.00

ECONOPOLIS FUNDS - ECONOPOLIS PATRIMONIAL SUSTAINABLE
Industrial and geographical classification of investments as at 30th June 2019
13
Industrial classification
(in percentage of net assets)
Countries and governments 35.81 %
Financials 11.36 %
Raw materials 8.71 %
Industrials 6.69 %
Non-cyclical consumer goods 5.60 %
Healthcare 5.41 %
Cyclical consumer goods 5.34 %
Technologies 4.01 %
Telecommunications services 3.00 %
International institutions 2.91 %
Real estate 2.88 %
Energy 2.59 %
Utilities 2.20 %
Local public administrations 0.16 %
Total 96.67 %

ECONOPOLIS FUNDS - ECONOPOLIS PATRIMONIAL SUSTAINABLE
Industrial and geographical classification of investments (continued) as at 30th June 2019
14
Geographical classification
(by domicile of the issuer) (in percentage of net assets)
United States of America 19.75 %
France 12.23 %
Belgium 10.90 %
The Netherlands 7.42 %
United Kingdom 7.42 %
Germany 6.63 %
Norway 4.45 %
Czech Republic 4.22 %
Ireland 4.06 %
Spain 3.68 %
Poland 1.73 %
Austria 1.66 %
Canada 1.59 %
Sweden 1.41 %
Hungary 1.40 %
Finland 0.96 %
Turkey 0.93 %
Switzerland 0.93 %
Mexico 0.80 %
Denmark 0.78 %
Slovakia 0.77 %
Luxembourg 0.68 %
Romania 0.61 %
Chile 0.56 %
Australia 0.34 %
Curaçao 0.29 %
British Virgin Islands 0.28 %
Brazil 0.11 %
Italy 0.08 %
Total 96.67 %

ECONOPOLIS FUNDS - ECONOPOLIS PATRIMONIAL SUSTAINABLE
Statement of changes in investments from 1st January 2019 to 30th June 2019
15
Currency Description Purchases Sales
Shares
CHF Barry Callebaut AG Reg 400 60 CHF Givaudan SA Reg 55 286 CHF Roche Holding Ltd Pref 1,150 1,188
DKK Novo Nordisk AS B 5,270 16,413 DKK Vestas Wind Systems A/S 2,500 0
EUR Anheuser-Busch InBev SA 5,660 3,888 EUR Arkema 2,385 2,185 EUR Cie de Saint-Gobain SA 11,050 5,457 EUR GrandVision NV 17,300 25,587 EUR Henkel AG & Co KGaA Pref 2,465 7,659 EUR Kion Group AG 6,300 0 EUR Koninklijke Ahold Delhaize NV 9,000 28,000 EUR Koninklijke DSM NV 975 4,800 EUR LVMH Moët Hennessy L Vuit SE 0 800 EUR NN Group NV 7,280 6,794 EUR Nokia Oyj 165,000 15,000 EUR Orpea SA 5,500 1,000 EUR SAP SE 2,650 2,725 EUR Schneider Electric SE 6,115 5,350 EUR Siemens AG Reg 1,700 1,800 EUR Solvay SA 7,000 0 EUR Umicore SA 10,500 0 EUR Unilever NV Certif of Shares 4,500 6,500 EUR Veolia Environnement SA 14,050 17,150 EUR Vinci SA 6,500 0 EUR Vopak NV 8,350 5,650
GBP D S Smith Plc 85,000 45,461
JPY Toyota Motor Corp 3,300 10,300
NOK Telenor ASA 13,810 13,587 NOK Yara Intl ASA 7,000 0
USD Allergan Plc 2,150 1,200 USD Applied Materials Inc 17,000 0 USD Arista Networks Inc 1,700 0 USD Becton Dickinson & Co 3,450 0 USD Booking Holdings Inc Reg 450 0 USD Cisco Systems Inc 4,700 6,450 USD Colgate-Palmolive Co 3,400 3,300 USD Microsoft Corp 3,650 2,050 USD Mondelez Intl Inc 24,655 15,655 USD Nomad Foods Ltd 20,000 0 USD Pepsico Inc 2,300 3,227 USD Schlumberger Ltd 6,300 4,138 USD United Technologies Corp 5,500 0 USD Varian Medical Systems Inc 2,270 2,182

ECONOPOLIS FUNDS - ECONOPOLIS PATRIMONIAL SUSTAINABLE
Statement of changes in investments (continued) from 1st January 2019 to 30th June 2019
16
Currency Description Purchases Sales
Investment certificates
USD iShares Physical Metals Plc Certif Gold Perpetual 125,600 0
Bonds
AUD Australia ILB Ser CAIN407 09/20.09.25 500,000 0
BRL Intl Finance Corp 7.5% EMTN Ser 1718 Sen 17/09.05.22 2,000,000 0
CAD Canada 0.75% Ser G658 Sen 17/01.05.19 1,550,000 1,850,000 CAD Canada 1% Sen 17/01.09.22 600,000 0 CAD Canada 1.75% Sen 19/01.05.21 1,850,000 0
CZK Czech Republic 0% Ser 101 Sen 17/10.02.20 3,000,000 0 CZK Czech Republic 0.75% Ser 104 18/23.02.21 67,000,000 0
EUR Air Liquide Finance 1.25% EMTN Reg S Sen 15/03.06.25 1,100,000 0 EUR Air Liquide Finance 1.25% EMTN Reg S Sen 16/13.06.28 200,000 0 EUR Akzo Nobel NV 2.625% EMTN Sen 12/27.07.22 1,250,000 250,000 EUR Amadeus Capital Market 0% Ser 4 Sen Reg S 17/19.05.19 0 200,000 EUR Anglo American Capital Plc 1.5% EMTN Reg S Sen 15/01.04.20 0 100,000 EUR Anglo American Capital Plc 2.875% EMTN Sen 13/20.11.20 600,000 0 EUR Anglo American Capital Plc 3.5% EMTN 12/28.03.22 300,000 0 EUR Arcelik AS 3.875% Reg S Sen 14/16.09.21 400,000 0 EUR Argan 3.25% Sen 17/04.07.23 900,000 0 EUR Befimmo SA 2.175% EMTN Ser 1059 Sen 17/12.04.27 400,000 0 EUR Befimmo SA FRN Sen 15/21.04.22 900,000 0 EUR Bekaert SA 5% EMTN 11/06.12.19 200,000 0 EUR Belgium 0.5% Sen 17/22.10.24 300,000 0 EUR Belgium 1.7% OLO 88 Sen 144A Reg S 19/22.06.50 500,000 0 EUR BNG Bank NV FRN EMTN Sen 11/09.02.21 300,000 200,000 EUR Booking Holdings Inc 0.8% Sen 17/10.03.22 200,000 0 EUR Booking Holdings Inc 1.8% Sen 15/03.03.27 600,000 0 EUR Cofinimmo SICAFI SA 1.929% Sen 15/25.03.22 600,000 0 EUR Czech Republic 3.875% EMTN 12/24.05.22 1,000,000 0 EUR Deutschland 0.5% Sen 15/15.02.25 300,000 0 EUR Deutschland ILB Ser I/L 09/15.04.20 900,000 0 EUR Deutschland ILB Ser I/L 12/15.04.23 1,600,000 0 EUR Electricité de France VAR EMTN Sub 13/29.01.Perpetual 800,000 0 EUR Engie SA 2.625% EMTN Sen 12/20.07.22 800,000 0 EUR Espana ILB Sen 14/30.11.24 1,300,000 0 EUR Espana ILB Sen 15/30.11.30 700,000 0 EUR Espana ILB Sen 16/30.11.21 550,000 0 EUR Flemish Community 0.375% EMTN Reg S Sen 16/13.10.26 100,000 0 EUR Flowserve Corp 1.25% Reg S Sen 15/17.03.22 700,000 150,000 EUR Fluvius Syst Operator 2% Sen Pr 1069 17/23.06.25 0 400,000 EUR France 0% 18/25.03.24 1,500,000 0 EUR France ILB OAT 13/25.07.24 300,000 0 EUR France ILB Ser OAT 11/25.07.27 700,000 0 EUR France ILB T-Bonds Reg S Ser OATe 16/01.03.21 200,000 0 EUR Fresenius Finance Ireland PLC 0.875% Reg S Sen 17/31.01.22 400,000 0 EUR Fresenius Finance Ireland PLC 1.5% Reg S Sen 17/30.01.24 200,000 0 EUR Fresenius Finance Ireland PLC 3% Reg S Sen 17/30.01.32 500,000 0 EUR GIMV NV 3.5% EMTN Sen 19/05.07.31 810,000 0 EUR Hochtief AG 3.875% Sen 13/20.03.20 400,000 0 EUR ImmoBel 3% Sen 17/01.06.22 300,000 0 EUR Ireland 1.5% T-Bonds Sen 19/15.05.50 500,000 0 EUR K+S Aktiengesellschaft 4.125% Reg S Sen Tr 2 13/06.12.21 200,000 0 EUR Kinepolis Group NV 2.4% Sen 17/15.12.25 100,000 0 EUR KPN NV 7.5% EMTN 09/04.02.19 0 150,000 EUR Kraft Heinz Foods Co 1.5% Reg S Sen 16/24.05.24 300,000 0

ECONOPOLIS FUNDS - ECONOPOLIS PATRIMONIAL SUSTAINABLE
Statement of changes in investments (continued) from 1st January 2019 to 30th June 2019
17
Currency Description Purchases Sales
EUR Kraft Heinz Foods Co 2% Sen 15/30.06.23 200,000 0 EUR La Lorraine Bakery Group NV 4% Sen 13/23.12.20 300,000 150,000 EUR Matexi NV 3.75% Sub Ser 995 16/22.06.23 300,000 200,000 EUR Mexico 1.375% Sen 16/15.01.25 200,000 0 EUR Mexico 1.625% EMTN Sen 15/06.03.24 800,000 0 EUR Mexico 4% Sen 15/15.03.15 100,000 100,000 EUR Molnlycke Holding AB 1.5% Reg S Sen 14/28.02.22 800,000 0 EUR Naturgy Capital Mks SA 5.375% EMTN 11/24.05.19 500,000 600,000 EUR Nederlandse Waterschapsbank NV FRN EMTN Reg S 11/27.04.21 500,000 0 EUR Neste Corporation 4% Sen 12/18.09.19 500,000 0 EUR NN Group NV VAR EMTN Sub 14/13.06.Perpetual 350,000 0 EUR Oesterreich 0% Reg S Sen 16/15.07.23 250,000 0 EUR Orpea SA 2.2% Sen 17/15.12.24 300,000 0 EUR Poland 0.875% EMTN Reg S Ser 40 15/14.10.21 1,000,000 0 EUR Romania 3.875% EMTN Reg S Ser 2015-2 15/29.10.35 200,000 0 EUR Sappi Papier Holdings GmbH 4% Reg S Sen 16/01.04.23 700,000 1,000,000 EUR Schneider Electric SE 0.25% EMTN Sen 16/09.09.24 1,000,000 0 EUR Siemens Financieringsmaatsc NV 2.875% EMTN Sen 13/10.03.28 600,000 0 EUR Slovakia 0% Ser 230 16/13.11.23 400,000 0 EUR Solvay Finance France SA VAR Reg S Sub 13/12.05.Perpetual 0 700,000 EUR Solvay SA 1.625% Reg S Sen 15/02.12.22 400,000 0 EUR South Africa 3.75% 14/24.07.26 300,000 300,000 EUR Telenor ASA 2.75% EMTN Sen 12/27.06.22 1,000,000 0 EUR Tesco Plc 1.375% EMTN Sen 14/01.07.19 700,000 0 EUR Teva Pharmaceutical Fin II BV 0.375% Reg S Sen 16/25.07.20 600,000 0 EUR Teva Pharmaceutical Fin II BV 1.125% Reg S Sen 16/15.10.24 400,000 500,000 EUR UCB 4.125% EMTN Sen 13/04.01.21 400,000 0 EUR UCB 5.125% EMTN 13/02.10.23 400,000 0 EUR Uruguay 7% Sen 03/28.06.19 100,000 400,000 EUR Valeo SA 3.25% EMTN Sen 14/22.01.24 700,000 0 EUR VGP SA 3.5% Sen Reg S 18/19.03.26 250,000 0 EUR Voestalpine VAR EMTN Sub Ser 2 13/31.10.Perpetual 400,000 0 EUR Vranken-Pommery Monopole 3.45% Sen 19/19.06.24 844,000 0
GBP United Kingdom 1.5% T-Stock Sen 15/22.01.21 350,000 0 GBP United Kingdom 1.75% T Stock 12/07.09.22 800,000 0 GBP United Kingdom 1.75% T-Stock 13/22.07.19 400,000 0
INR IBRD 5.75% EMTN Ser 100031 Sen 17/08.05.20 15,000,000 0 INR Intl Finance Corp 7.8% EMTN Ser GDIF Tr 68 14/03.06.19 0 50,000,000
MXN EIB 7.5% EMTN Reg S Sen 17/09.06.22 7,000,000 0 MXN IBRD 0% Ser GDIF 07/19.09.22 15,000,000 0
NOK Norway 3% Ser 476 14/14.03.24 5,000,000 0 NOK Norway 3.75% 10/25.05.21 17,800,000 0 NOK Norway 4.5% 08/22.05.19 0 7,800,000
PLN Poland 1.5% Ser PS0420 15/25.04.20 1,000,000 0
USD Booking Holdings Inc 3.6% Sen 16/01.06.26 500,000 0 USD Canada 1.625% Sen 14/27.02.19 0 525,000 USD Canada 2.625% Sen 19/25.01.22 500,000 0 USD Diageo Capital Plc 2.625% Sen 13/29.04.23 700,000 0 USD HCA Inc 5.875% Sen 12/15.03.22 200,000 0 USD Hungary 6.375% Sen 11/29.03.21 400,000 0 USD Lenovo Group Ltd 4.7% Reg S Sen 14/08.05.19 200,000 1,300,000 USD Microsoft Corp 1.55% Sen 16/08.08.21 200,000 0 USD Microsoft Corp 3.75% Sen 15/12.02.45 1,200,000 0 USD US 1.125% Ser AX-2019 Sen 17/28.02.19 0 2,150,000 USD US 1.5% T-Notes Ser AQ-2020 Sen 17/15.08.20 1,000,000 0 USD US 1.5% T-Notes Ser H-2023 16/28.02.23 2,150,000 0

ECONOPOLIS FUNDS - ECONOPOLIS PATRIMONIAL SUSTAINABLE
Statement of changes in investments (continued) from 1st January 2019 to 30th June 2019
18
Currency Description Purchases Sales
USD US 2% T-Notes 15/15.08.25 1,000,000 0 USD US 2.25% T-Bonds Sen 16/15.08.46 2,250,000 0 USD US ILB T-Notes Lk Inflation Index 14/15.01.24 500,000 0 USD US ILB T-Notes Ser X-2020 15/15.04.20 1,100,000 0
Investment funds (UCITS)
EUR NN (L) Liquid SICAV EUR A Cap 4,800 4,800

ECONOPOLIS FUNDS - ECONOPOLIS PATRIMONIAL EMERGING
Statement of net assets (in EUR) as at 30th June 2019
The accompanying notes are an integral part of these financial statements.
19
Assets Securities portfolio at market value 34,397,276.42 Cash at banks 2,112,729.45 Income receivable on portfolio 496,108.62
Total assets 37,006,114.49
Liabilities Payable on redemptions of shares 2,721,900.00 Expenses payable 99,306.53
Total liabilities 2,821,206.53
Net assets at the end of the period 34,184,907.96
Breakdown of net assets per share class
Share class Number of
shares
Currency of
share class
NAV per share in currency of
share class
Net assets per share class
(in EUR)
A Cap EUR 1.0000 EUR 99.76 99.76 A Dis EUR 1.0000 EUR 97.62 97.62 I Cap EUR 248,333.5716 EUR 105.92 26,302,789.40 I Dis EUR 86,854.0000 EUR 90.75 7,881,921.18
34,184,907.96

ECONOPOLIS FUNDS - ECONOPOLIS PATRIMONIAL EMERGING
Statistical information (in EUR) as at 30th June 2019
(*) Net asset value used for final redemption.
The accompanying notes are an integral part of these financial statements.
20
Total net assets Currency 31.12.2017 31.12.2018 30.06.2019
EUR 55,552,965.27 38,375,954.57 34,184,907.96
Net asset value per share
Currency 31.12.2017 31.12.2018 30.06.2019
A Cap EUR EUR - 97.40 99.76 A Dis EUR EUR - 97.40 97.62 I Cap EUR EUR 109.14 99.56 105.92 I Dis EUR EUR 99.30 87.30 90.75
Number of shares outstanding at the
beginning of the period
issued redeemed outstanding at the end of the period
A Cap EUR - 1.0000 - 1.0000 A Dis EUR - 1.0000 - 1.0000 I Cap EUR 244,642.9886 12,053.0000 -8,362.4170 248,333.5716 I Dis EUR 160,591.0000 - -73,737.0000 86,854.0000
Dividends paid Currency Dividend per share Ex-dividend date
A Dis EUR EUR 2.13 30.04.2019 I Dis EUR EUR 2.13 30.04.2019

ECONOPOLIS FUNDS - ECONOPOLIS PATRIMONIAL EMERGING
Statement of investments and other net assets (in EUR) as at 30th June 2019
The accompanying notes are an integral part of these financial statements.
21
Currency Number / nominal value
Description Cost Market value % of total net assets
Investments in securities
Transferable securities admitted to an official stock exchange listing
Shares
BRL 40,000 CCR SA 184,369.15 125,238.60 0.37 BRL 18,000 Localiza Rent A Car SA 69,538.19 169,072.11 0.49 BRL 18,000 Ultrapar Participacoes SA 106,082.46 82,927.02 0.24
359,989.80 377,237.73 1.10
EUR 3,500 Unilever NV Certif of Shares 166,573.88 186,900.00 0.55 HKD 34,000 AIA Group Ltd 240,574.65 321,976.71 0.94 HKD 35,000 Anta Sports Products Ltd 105,981.11 211,063.63 0.62 HKD 17,000 China Mobile Ltd 151,080.03 135,956.34 0.40 HKD 16,000 CK Hutchison Holdings Ltd 190,193.14 138,479.77 0.41 HKD 112,000 CNOOC Ltd 169,619.64 168,189.98 0.49 HKD 80,000 CSPC Pharmaceutical Gr Ltd 120,059.27 113,301.63 0.33 HKD 40,000 Hengan Intl Group Co Ltd 289,898.92 258,300.75 0.76 HKD 34,000 Ping An Ins Gr Co of China Ltd H 292,171.53 358,473.78 1.05 HKD 40,000 Sinopharm Group Co Ltd H 161,442.02 123,642.65 0.36 HKD 3,500 Tencent Holdings Ltd 146,107.20 138,715.82 0.41
1,867,127.51 1,968,101.06 5.77
IDR 1,100,000 Telekom Indonesia (PT) Tbk Ser B 247,149.37 283,086.27 0.83 INR 2,200 Maruti Suzuki India Ltd 188,219.38 183,112.15 0.54 INR 80,000 Power Grid Corp of India Ltd 201,703.75 210,825.25 0.62
389,923.13 393,937.40 1.16
KRW 1,300 Amorepacific Corp Pref 161,924.85 85,034.52 0.25 KRW 900 LG Chem Ltd Pref Reg 145,228.90 133,516.18 0.39 KRW 200 LG Household & Health Care Ltd Pref 102,130.94 122,323.44 0.36 KRW 1,500 NAVER Corp 169,414.88 129,759.97 0.38 KRW 300 NCsoft Corp 85,859.71 108,588.61 0.32
664,559.28 579,222.72 1.70
TWD 24,000 MediaTek Inc 199,863.54 213,527.56 0.62 USD 2,000 Alibaba Group Holding Ltd ADR repr 1 Share 272,542.15 297,620.09 0.87 USD 2,000 Autohome Inc A spons AD repr 1 Share A 156,534.28 150,382.01 0.44 USD 1,800 Baidu Inc ADR repr 0.1 Share A 254,805.40 185,516.82 0.54 USD 5,000 Cognizant Tec Solutions Corp 296,777.60 278,343.73 0.81 USD 8,500 Ctrip.Com Intl Ltd ADR Repr 1/8 Shares 308,599.20 275,520.33 0.81 USD 2,000 Fomento Econom Mexic SAB de CV ADR repr 10 Uts (10 B &
20 D) 141,376.96 169,930.62 0.50
USD 17,000 Infosys Ltd spons ADR repr 1 Share 130,280.31 159,743.57 0.47 USD 5,000 Jardine Strategic Hgs Ltd 136,570.63 167,427.77 0.49 USD 500 Netease Inc ADR Repr 1 Share 72,027.95 112,307.89 0.33 USD 2,600 Oil Co Lukoil PJSC spons ADR repr 1 Share 178,219.57 192,756.65 0.56 USD 350 Samsung Electronics Co Ltd spons GDR repr 25 Shares 283,233.73 312,593.31 0.91 USD 8,000 Taiwan Semiconduct Mfg Co Ltd ADR repr 5 Shares 122,738.71 275,191.01 0.80 USD 5,500 Yandex NV A Reg 124,999.41 183,542.64 0.54
2,478,705.90 2,760,876.44 8.07
ZAR 1,600 Naspers Ltd N 295,222.10 340,536.91 1.00
Total shares 6,669,114.51 7,103,426.09 20.80

ECONOPOLIS FUNDS - ECONOPOLIS PATRIMONIAL EMERGING
Statement of investments and other net assets (in EUR) (continued) as at 30th June 2019
The accompanying notes are an integral part of these financial statements.
22
Currency Number / nominal value
Description Cost Market value % of total net assets
Bonds
BRL 845 Brazil 10% Notas do T Nacional Ser F 10/01.01.21 223,919.91 194,803.05 0.57 BRL 1,000 Brazil 10% Ser F 12/01.01.23 245,734.37 240,726.23 0.70 BRL 520 Brazil ILB Lk IPCA Ser B 11/15.08.22 406,665.32 421,875.60 1.23 BRL 1,500,000 Intl Finance Corp 7.5% EMTN Ser 1718 Sen 17/09.05.22 384,676.02 360,656.92 1.05
1,260,995.62 1,218,061.80 3.55
COP 3,000,000,000 Colombia 7.75% Sen 10/14.04.21 888,064.38 859,752.48 2.51 CZK 3,000,000 Czech Republic 0% Ser 101 Sen 17/10.02.20 115,153.97 116,883.91 0.34 CZK 8,000,000 Czech Republic 0.45% Ser 97 15/25.10.23 295,930.01 302,441.05 0.88 CZK 29,800,000 Czech Republic 3.85% Ser 61 10/29.09.21 1,293,039.02 1,234,412.17 3.61
1,704,123.00 1,653,737.13 4.83
EUR 200,000 America Movil SAB de CV 1.5% Sen 16/10.03.24 201,200.00 211,106.00 0.62 EUR 500,000 Arcelik AS 3.875% Reg S Sen 14/16.09.21 514,273.00 512,452.50 1.50 EUR 500,000 Bharti Airtel Intl Netherld BV 3.375% 14/20.05.21 526,297.69 525,482.50 1.54 EUR 100,000 Bollore 2.875% Reg S 15/29.07.21 103,880.20 103,658.00 0.30 EUR 100,000 Colombia 3.875% EMTN Sen 16/22.03.26 113,200.00 118,419.50 0.35 EUR 100,000 EP Energy AS 5.875% Sen Reg S 12/01.11.19 108,440.00 102,001.00 0.30 EUR 400,000 Indonesia 2.625% EMTN Reg S Sen 16/14.06.23 415,659.34 433,686.00 1.27 EUR 400,000 Macedonia 3.975% Reg S 14/24.07.21 421,060.00 423,024.00 1.24 EUR 150,000 Macedonia 5.625% Reg S Sen 16/26.07.23 173,175.00 174,113.25 0.51 EUR 200,000 Mexico 1.625% EMTN Sen 15/06.03.24 197,780.00 209,351.00 0.61 EUR 300,000 Mexico 2.75% Sen 13/22.04.23 321,735.00 327,000.00 0.96 EUR 400,000 Morocco 4.5% Reg-S 10/05.10.20 437,200.00 422,376.00 1.24 EUR 300,000 OMV AG VAR Reg S Sub 15/09.12.Perpetual 341,100.00 333,333.00 0.98 EUR 200,000 Poland 0.875% EMTN Reg S Ser 40 15/14.10.21 205,362.00 205,370.00 0.60 EUR 250,000 Prague (City of) 3.125% 13/03.07.23 248,669.02 280,368.75 0.82 EUR 50,000 Romania 2.375% EMTN Ser 2017-1 Sen Reg S 17/19.04.27 50,412.50 54,282.50 0.16 EUR 100,000 Romania 2.875% EMTN 14/28.10.24 108,350.00 112,357.00 0.33 EUR 200,000 Romania 3.875% EMTN Reg S Ser 2015-2 15/29.10.35 199,250.00 229,625.00 0.67 EUR 150,000 Sappi Papier Holdings GmbH 4% Reg S Sen 16/01.04.23 153,600.00 154,614.75 0.45 EUR 200,000 Turkey 4.125% Sen Reg S Ser Intl 14/11.04.23 211,663.33 202,373.00 0.59 EUR 250,000 Turkey 4.35% Reg S Sen 13/12.11.21 260,580.00 259,625.00 0.76 EUR 650,000 Turkey 5.125% Sen 10/18.05.20 719,250.00 670,198.75 1.96
6,032,137.08 6,064,817.50 17.76
HUF 100,000,000 Hungary 2.5% Ser B 16/27.10.21 339,228.64 323,524.81 0.95 HUF 190,000,000 Hungary 6% Ser 23/A 07/24.11.23 698,151.08 707,799.98 2.07
1,037,379.72 1,031,324.79 3.02
IDR 7,230,000,000 EIB 7.2% EMTN Reg S Sen 14/09.07.19 500,567.74 449,465.80 1.31 IDR 11,000,000,000 IADB 6.25% EMTN Ser 608 Sen 17/15.06.21 677,122.30 677,673.66 1.98
1,177,690.04 1,127,139.46 3.29
INR 19,500,000 IBRD 5.75% EMTN Ser 100031 Sen 17/08.05.20 249,517.29 245,003.93 0.72 INR 20,000,000 IBRD 5.75% Ser GDIF 16/28.10.19 277,828.62 253,139.33 0.74
527,345.91 498,143.26 1.46
MXN 40,000 Mexico 5% Bonos Sen 14/11.12.19 187,049.82 180,350.93 0.53 MXN 50,000 Mexico 5.75% Bonos Ser M 15/05.03.26 199,302.70 208,167.28 0.61 MXN 30,000 Mexico 6.5% Bonos Ser M 11/09.06.22 180,578.99 133,808.45 0.39 MXN 91,700 Mexico 8.5% Bonos Ser M 20 09/31.05.29 567,097.05 446,186.36 1.31 MXN 9,000 Mexico ILB Sen 12/09.06.22 240,632.79 247,411.44 0.72
1,374,661.35 1,215,924.46 3.56
PHP 50,000,000 Philippines 6.25% Reg S Sen 11/14.01.36 873,693.08 985,937.41 2.88 PLN 1,500,000 Poland 1.75% Ser PS0721 Sen 16/25.07.21 344,501.70 354,164.60 1.04 PLN 1,750,000 Poland 2.25% Ser PS0422 16/25.04.22 388,842.77 418,148.18 1.22 PLN 2,700,000 Poland 5.75% Ser WS0922 02/23.09.22 740,148.60 714,550.60 2.09
1,473,493.07 1,486,863.38 4.35

ECONOPOLIS FUNDS - ECONOPOLIS PATRIMONIAL EMERGING
Statement of investments and other net assets (in EUR) (continued) as at 30th June 2019
The accompanying notes are an integral part of these financial statements.
23
Currency Number / nominal value
Description Cost Market value % of total net assets
RUB 45,000,000 IBRD 7.25% EMTN Ser 11545 16/23.11.20 592,362.33 630,674.47 1.84 RUB 12,000,000 Intl Finance Corp 6.75% EMTN Ser 1679 Sen Reg S
17/03.02.20 194,553.52 167,016.40 0.49
RUB 30,000,000 X5 Finance BV 9.25% Sen Reg S 17/18.04.20 425,242.48 421,330.80 1.23
1,212,158.33 1,219,021.67 3.56
SGD 500,000 Singapore 1.25% T-Notes Sen 16/01.10.21 307,109.92 321,803.95 0.94 SGD 500,000 Singapore 2.125% T-Bonds 16/01.06.26 309,807.73 329,539.55 0.96
616,917.65 651,343.50 1.90
THB 3,754,000 Ministry of Finance 1.875% Ser LB226A Sen 16/17.06.22 87,112.74 107,795.25 0.32 THB 6,546,000 Ministry of Finance 2.4% Sen 18/17.12.23 186,019.97 192,073.07 0.56
273,132.71 299,868.32 0.88
USD 200,000 Alibaba Group Holding Ltd 3.125% Ser B 15/28.11.21 180,588.52 178,263.81 0.52 USD 400,000 Baidu Inc 3% Sen 15/30.06.20 359,892.27 353,013.09 1.03 USD 400,000 Baidu Inc 4.125% Sen 15/30.06.25 356,513.12 369,438.83 1.08 USD 500,000 Banque Centrale de Tunisie 5.75% Reg S Sen 15/30.01.25 440,493.87 409,657.94 1.20 USD 500,000 Chile 2.25% Sen 12/30.10.22 417,640.96 441,180.74 1.29 USD 800,000 Dominican Republic 7.5% Sk Sen Reg S 10/06.05.21 482,009.92 494,313.40 1.45 USD 250,000 Embraer SA 5.15% Sen 12/15.06.22 211,134.61 232,359.27 0.68 USD 500,000 Entel SA 4.875% Reg S Sen Sk 13/30.10.24 429,533.80 463,065.34 1.35 USD 400,000 Korea Development Bank 3% Sen 12/14.09.22 354,145.82 358,573.81 1.05 USD 450,000 Poland 3% Sen 12/17.03.23 406,634.55 406,213.22 1.19 USD 300,000 Serbia 4.875% Sen Reg S 13/25.02.20 265,934.55 266,953.10 0.78 USD 600,000 Tencent Holdings Ltd 2.875% EMTN Reg S Sen 15/11.02.20 526,102.70 528,384.13 1.55
4,430,624.69 4,501,416.68 13.17
ZAR 6,000,000 EIB 8.5% EMTN Reg S Sen 14/17.09.24 416,543.26 391,698.56 1.15 ZAR 12,200,000 EIB 9% EMTN Sen 11/31.03.21 874,720.53 786,741.72 2.30
1,291,263.79 1,178,440.28 3.45
Total bonds 24,173,680.42 23,991,792.12 70.17
Sukuk
USD 800,000 Second Pakistan Intl Sukuk 6.75% Reg S 14/03.12.19 747,344.45 709,113.90 2.07
Total sukuk 747,344.45 709,113.90 2.07
Transferable securities dealt in on another regulated market
Bonds
CLP 750,000,000 Chile 5.5% Sen 10/05.08.20 1,060,011.82 995,860.79 2.91 USD 200,000 Cencosud SA 4.875% Reg-S Sen 12/20.01.23 141,186.53 184,252.21 0.54
Total bonds 1,201,198.35 1,180,113.00 3.45
Open-ended investment funds
Investment funds (UCITS)
USD 40,000 Aberdeen Standard China A Share Equity Fd I Cap 463,051.82 552,826.91 1.62 USD 70,068.684 Aberdeen Standard Indian Bond Fd I Cap 729,662.72 766,005.10 2.24 USD 900 Pictet Short Term Emerging Corp Bonds I USD Cap 89,371.41 93,999.30 0.27
Total investment funds (UCITS) 1,282,085.95 1,412,831.31 4.13
Total investments in securities 34,073,423.68 34,397,276.42 100.62
Cash at banks 2,112,729.45 6.18
Other net assets/(liabilities) -2,325,097.91 -6.80
Total 34,184,907.96 100.00

ECONOPOLIS FUNDS - ECONOPOLIS PATRIMONIAL EMERGING
Industrial and geographical classification of investments as at 30th June 2019
24
Industrial classification
(in percentage of net assets)
Countries and governments 47.37 %
International institutions 11.58 %
Technologies 11.27 %
Financials 5.88 %
Cyclical consumer goods 5.12 %
Telecommunications services 4.74 %
Investment funds 4.13 %
Non-cyclical consumer goods 3.32 %
Energy 2.57 %
Industrials 2.03 %
Raw materials 0.84 %
Local public administrations 0.82 %
Utilities 0.62 %
Healthcare 0.33 %
Total 100.62 %

ECONOPOLIS FUNDS - ECONOPOLIS PATRIMONIAL EMERGING
Industrial and geographical classification of investments (continued) as at 30th June 2019
25
Geographical classification
(by domicile of the issuer) (in percentage of net assets)
Luxembourg 8.89 %
Cayman Islands 7.87 %
United States of America 7.63 %
Mexico 6.25 %
Poland 6.14 %
Chile 6.09 %
Czech Republic 5.95 %
Turkey 4.81 %
Brazil 4.28 %
The Netherlands 3.86 %
South Korea 3.66 %
Hong Kong 3.33 %
Hungary 3.02 %
Philippines 2.88 %
Colombia 2.86 %
Indonesia 2.10 %
Pakistan 2.07 %
Singapore 1.90 %
Mazedonia 1.75 %
China 1.74 %
India 1.63 %
Dominican Republic 1.45 %
Austria 1.43 %
Taiwan 1.42 %
Morocco 1.24 %
Tunisia 1.20 %
Romania 1.16 %
South Africa 1.00 %
Thailand 0.88 %
Serbia Republic 0.78 %
Russia 0.56 %
Bermuda 0.49 %
France 0.30 %
Total 100.62 %

ECONOPOLIS FUNDS - ECONOPOLIS PATRIMONIAL EMERGING
Statement of changes in investments from 1st January 2019 to 30th June 2019
26
Currency Description Purchases Sales Other
Shares
BRL CCR SA 0 80,000 0 BRL Localiza Rent A Car SA 0 15,000 0 BRL Ultrapar Participacoes SA 0 11,000 9,000 BRL Vale SA 0 18,000 0
EUR Unilever NV Certif of Shares 0 3,000 0
HKD AIA Group Ltd 0 36,000 0 HKD Anta Sports Products Ltd 0 40,000 0 HKD China Mobile Ltd 0 13,000 0 HKD CK Hutchison Holdings Ltd 0 11,000 0 HKD CNOOC Ltd 0 38,000 0 HKD CSPC Pharmaceutical Gr Ltd 0 100,000 0 HKD Hengan Intl Group Co Ltd 22,000 12,000 0 HKD Ping An Ins Gr Co of China Ltd H 0 16,000 0 HKD Sinopharm Group Co Ltd H 0 45,000 0 HKD Sunny Optical Tec Gr Co Ltd 14,000 32,000 0 HKD Tencent Holdings Ltd 0 10,400 0
IDR Telekom Indonesia (PT) Tbk Ser B 0 500,000 0
INR Maruti Suzuki India Ltd 2,200 0 0 INR Power Grid Corp of India Ltd 0 60,000 0
KRW Amorepacific Corp Pref 0 1,700 0 KRW LG Chem Ltd Pref Reg 0 1,800 0 KRW LG Household & Health Care Ltd Pref 0 250 0 KRW NAVER Corp 0 1,500 0 KRW NCsoft Corp 0 500 0 KRW Samsung Life Insurance Co Ltd 0 3,100 0
TWD MediaTek Inc 24,000 0 0
USD Alibaba Group Holding Ltd ADR repr 1 Share 1,300 500 0 USD Baidu Inc ADR repr 0.1 Share A 900 1,000 0 USD Cognizant Tec Solutions Corp 2,000 2,000 0 USD Ctrip.Com Intl Ltd ADR Repr 1/8 Shares 4,000 7,000 0 USD Fomento Econom Mexic SAB de CV ADR repr 10
Uts (10 B & 20 D) 0 1,700 0
USD Infosys Ltd spons ADR repr 1 Share 0 19,000 0 USD Jardine Strategic Hgs Ltd 0 9,500 0 USD Netease Inc ADR Repr 1 Share 0 500 0 USD Oil Co Lukoil PJSC spons ADR repr 1 Share 1,100 0 0 USD Samsung Electronics Co Ltd spons GDR repr 25
Shares 0 250 0
USD Taiwan Semiconduct Mfg Co Ltd ADR repr 5 Shares 0 10,000 0 USD Yandex NV A Reg 0 6,000 0
ZAR Multichoice Group LTD Reg 0 1,600 1,600 ZAR Naspers Ltd N 0 2,500 0

ECONOPOLIS FUNDS - ECONOPOLIS PATRIMONIAL EMERGING
Statement of changes in investments (continued) from 1st January 2019 to 30th June 2019
27
Currency Description Purchases Sales Other
Bonds
BRL Brazil 10% Notas do T Nacional Ser F 10/01.01.21 550 205 0 BRL Brazil ILB Lk IPCA Ser B 11/15.08.22 200 0 0
COP Colombia 7.75% Sen 10/14.04.21 2,000,000,000 0 0
CZK Czech Republic 0% Ser 101 Sen 17/10.02.20 3,000,000 0 0 CZK Czech Republic 0.45% Ser 97 15/25.10.23 8,000,000 0 0 CZK Czech Republic 3.85% Ser 61 10/29.09.21 0 1,200,000 0
EUR Indonesia 2.625% EMTN Reg S Sen 16/14.06.23 0 100,000 0 EUR Macedonia 5.625% Reg S Sen 16/26.07.23 150,000 0 0 EUR Mexico 2.75% Sen 13/22.04.23 0 100,000 0 EUR Morocco 4.5% Reg-S 10/05.10.20 200,000 0 0 EUR Poland 0.875% EMTN Reg S Ser 40 15/14.10.21 200,000 0 0 EUR Romania 2.375% EMTN Ser 2017-1 Sen Reg S
17/19.04.27 0 50,000 0
EUR Romania 3.875% EMTN Reg S Ser 2015-2 15/29.10.35
200,000 0 0
EUR Sappi Papier Holdings GmbH 4% Reg S Sen 16/01.04.23
250,000 100,000 0
EUR Turkey 4.35% Reg S Sen 13/12.11.21 250,000 0 0
IDR EBRD 7.375% EMTN Sen 14/15.04.19 0 10,800,000,000 0 IDR IADB 6.25% EMTN Ser 608 Sen 17/15.06.21 11,000,000,000 0 0
INR IBRD 5.75% EMTN Ser 100031 Sen 17/08.05.20 19,500,000 0 0 INR Intl Finance Corp 7.8% EMTN Ser GDIF Tr 68
14/03.06.19 0 52,000,000 0
MXN Mexico 8.5% Bonos Ser M 20 09/31.05.29 0 8,300 0 MXN Mexico ILB Sen 12/09.06.22 9,000 0 0
PLN Poland 5.75% Ser WS0922 02/23.09.22 0 185,000 0
THB Ministry of Finance 1.875% Ser LB226A Sen 16/17.06.22
0 1,700,000 -6,546,000
THB Ministry of Finance 2.4% Sen 18/17.12.23 0 0 6,546,000
USD Alibaba Group Holding Ltd 3.125% Ser B 15/28.11.21
200,000 0 0
USD Baidu Inc 3% Sen 15/30.06.20 200,000 0 0 USD Cencosud SA 4.875% Reg-S Sen 12/20.01.23 0 200,000 0 USD Dominican Republic 7.5% Sk Sen Reg S
10/06.05.21 200,000 0 0
USD Lenovo Group Ltd 4.7% Reg S Sen 14/08.05.19 0 800,000 0
ZAR EIB 9% EMTN Sen 11/31.03.21 0 800,000 0
Investment funds (UCITS)
USD Aberdeen Standard China A Share Equity Fd I Cap 11,000 0 0 USD Aberdeen Standard Indian Bond Fd I Cap 0 5,500 0

ECONOPOLIS FUNDS - ECONOPOLIS GLOBAL EQUITY
Statement of net assets (in EUR) as at 30th June 2019
The accompanying notes are an integral part of these financial statements.
28
Assets Securities portfolio at market value 14,356,047.17 Cash at banks 361,569.66 Formation expenses, net 1,373.15 Income receivable on portfolio 7,386.49
Total assets 14,726,376.47
Liabilities Expenses payable 44,365.55
Total liabilities 44,365.55
Net assets at the end of the period 14,682,010.92
Breakdown of net assets per share class
Share class Number of
shares
Currency of
share class
NAV per share in currency of
share class
Net assets per share class
(in EUR)
A Cap EUR 1.0000 EUR 93.64 93.64 A Dis EUR 1.0000 EUR 93.17 93.17 I Cap EUR 111,675.3490 EUR 112.83 12,600,028.91 I Dis EUR 19,240.0000 EUR 108.20 2,081,795.20
14,682,010.92

ECONOPOLIS FUNDS - ECONOPOLIS GLOBAL EQUITY
Statistical information (in EUR) as at 30th June 2019
(*) Net asset value used for final redemption.
The accompanying notes are an integral part of these financial statements.
29
Total net assets Currency 31.12.2017 31.12.2018 30.06.2019
EUR 17,785,059.74 13,414,650.53 14,682,010.92
Net asset value per share
Currency 31.12.2017 31.12.2018 30.06.2019
A Cap EUR EUR - 84.86 93.64 A Dis EUR EUR - 84.86 93.17 I Cap EUR EUR 108.42 97.14 112.83 I Dis EUR EUR 106.33 93.58 108.20
Number of shares outstanding at the
beginning of the period
issued redeemed outstanding at the end of the period
A Cap EUR - 1.0000 - 1.0000 A Dis EUR - 1.0000 - 1.0000 I Cap EUR 118,257.6760 3,200.0000 -9,782.3270 111,675.3490 I Dis EUR 20,590.0000 150.0000 -1,500.0000 19,240.0000
Dividends paid Currency Dividend per share Ex-dividend date
A Dis EUR EUR 0.46 30.04.2019 I Dis EUR EUR 0.46 30.04.2019
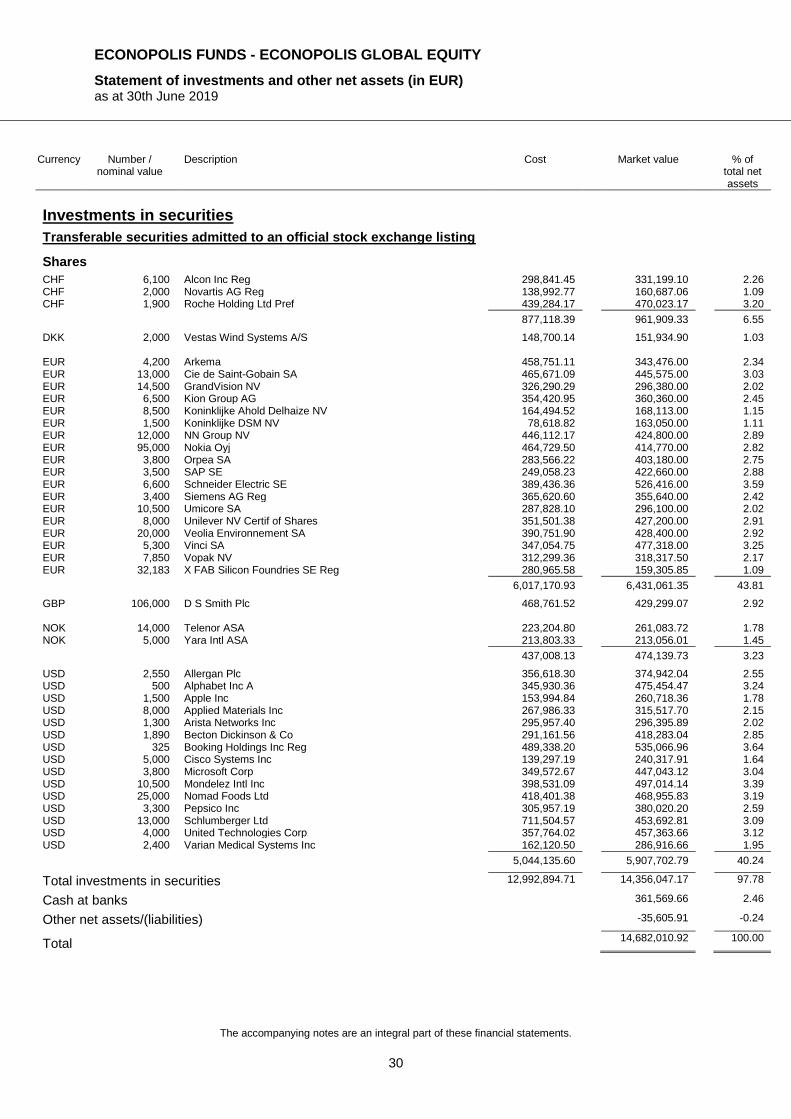
ECONOPOLIS FUNDS - ECONOPOLIS GLOBAL EQUITY
Statement of investments and other net assets (in EUR) as at 30th June 2019
The accompanying notes are an integral part of these financial statements.
30
Currency Number / nominal value
Description Cost Market value % of total net assets
Investments in securities
Transferable securities admitted to an official stock exchange listing
Shares
CHF 6,100 Alcon Inc Reg 298,841.45 331,199.10 2.26 CHF 2,000 Novartis AG Reg 138,992.77 160,687.06 1.09 CHF 1,900 Roche Holding Ltd Pref 439,284.17 470,023.17 3.20
877,118.39 961,909.33 6.55
DKK 2,000 Vestas Wind Systems A/S 148,700.14 151,934.90 1.03 EUR 4,200 Arkema 458,751.11 343,476.00 2.34 EUR 13,000 Cie de Saint-Gobain SA 465,671.09 445,575.00 3.03 EUR 14,500 GrandVision NV 326,290.29 296,380.00 2.02 EUR 6,500 Kion Group AG 354,420.95 360,360.00 2.45 EUR 8,500 Koninklijke Ahold Delhaize NV 164,494.52 168,113.00 1.15 EUR 1,500 Koninklijke DSM NV 78,618.82 163,050.00 1.11 EUR 12,000 NN Group NV 446,112.17 424,800.00 2.89 EUR 95,000 Nokia Oyj 464,729.50 414,770.00 2.82 EUR 3,800 Orpea SA 283,566.22 403,180.00 2.75 EUR 3,500 SAP SE 249,058.23 422,660.00 2.88 EUR 6,600 Schneider Electric SE 389,436.36 526,416.00 3.59 EUR 3,400 Siemens AG Reg 365,620.60 355,640.00 2.42 EUR 10,500 Umicore SA 287,828.10 296,100.00 2.02 EUR 8,000 Unilever NV Certif of Shares 351,501.38 427,200.00 2.91 EUR 20,000 Veolia Environnement SA 390,751.90 428,400.00 2.92 EUR 5,300 Vinci SA 347,054.75 477,318.00 3.25 EUR 7,850 Vopak NV 312,299.36 318,317.50 2.17 EUR 32,183 X FAB Silicon Foundries SE Reg 280,965.58 159,305.85 1.09
6,017,170.93 6,431,061.35 43.81
GBP 106,000 D S Smith Plc 468,761.52 429,299.07 2.92 NOK 14,000 Telenor ASA 223,204.80 261,083.72 1.78 NOK 5,000 Yara Intl ASA 213,803.33 213,056.01 1.45
437,008.13 474,139.73 3.23
USD 2,550 Allergan Plc 356,618.30 374,942.04 2.55 USD 500 Alphabet Inc A 345,930.36 475,454.47 3.24 USD 1,500 Apple Inc 153,994.84 260,718.36 1.78 USD 8,000 Applied Materials Inc 267,986.33 315,517.70 2.15 USD 1,300 Arista Networks Inc 295,957.40 296,395.89 2.02 USD 1,890 Becton Dickinson & Co 291,161.56 418,283.04 2.85 USD 325 Booking Holdings Inc Reg 489,338.20 535,066.96 3.64 USD 5,000 Cisco Systems Inc 139,297.19 240,317.91 1.64 USD 3,800 Microsoft Corp 349,572.67 447,043.12 3.04 USD 10,500 Mondelez Intl Inc 398,531.09 497,014.14 3.39 USD 25,000 Nomad Foods Ltd 418,401.38 468,955.83 3.19 USD 3,300 Pepsico Inc 305,957.19 380,020.20 2.59 USD 13,000 Schlumberger Ltd 711,504.57 453,692.81 3.09 USD 4,000 United Technologies Corp 357,764.02 457,363.66 3.12 USD 2,400 Varian Medical Systems Inc 162,120.50 286,916.66 1.95
5,044,135.60 5,907,702.79 40.24
Total investments in securities 12,992,894.71 14,356,047.17 97.78
Cash at banks 361,569.66 2.46
Other net assets/(liabilities) -35,605.91 -0.24
Total 14,682,010.92 100.00

ECONOPOLIS FUNDS - ECONOPOLIS GLOBAL EQUITY
Industrial and geographical classification of investments as at 30th June 2019
31
Industrial classification
(in percentage of net assets)
Industrials 19.88 %
Technologies 18.88 %
Healthcare 16.65 %
Non-cyclical consumer goods 13.23 %
Raw materials 7.82 %
Cyclical consumer goods 7.44 %
Energy 6.29 %
Utilities 2.92 %
Financials 2.89 %
Telecommunications services 1.78 %
Total 97.78 %
Geographical classification
(by domicile of the issuer) (in percentage of net assets)
United States of America 31.41 %
France 17.88 %
The Netherlands 12.25 %
Germany 7.75 %
Switzerland 6.55 %
Norway 3.23 %
British Virgin Islands 3.19 %
Belgium 3.11 %
Curaçao 3.09 %
United Kingdom 2.92 %
Finland 2.82 %
Ireland 2.55 %
Denmark 1.03 %
Total 97.78 %

ECONOPOLIS FUNDS - ECONOPOLIS GLOBAL EQUITY
Statement of changes in investments from 1st January 2019 to 30th June 2019
32
Currency Description Purchases Sales Other
Shares
CHF Alcon Inc Reg 4,910 0 1,190 CHF Givaudan SA Reg 0 100 0 CHF Novartis AG Reg 0 4,350 0
DKK Novo Nordisk AS B 0 5,350 0 DKK Vestas Wind Systems A/S 2,000 0 0
EUR Bayerische Motorenwerke AG 0 3,800 0 EUR Cie de Saint-Gobain SA 9,000 5,000 0 EUR Fresenius SE & Co KGaA 0 5,500 0 EUR GrandVision NV 0 5,000 0 EUR Henkel AG & Co KGaA Pref 0 4,400 0 EUR Kion Group AG 6,500 0 0 EUR Koninklijke Ahold Delhaize NV 0 11,000 0 EUR Koninklijke DSM NV 0 2,500 0 EUR LVMH Moët Hennessy L Vuit SE 0 800 0 EUR NN Group NV 5,000 3,000 0 EUR Nokia Oyj 95,000 0 0 EUR SAP SE 0 500 0 EUR Schneider Electric SE 0 400 0 EUR Siemens AG Reg 500 0 0 EUR Umicore SA 10,500 0 0 EUR Unilever NV Certif of Shares 0 2,500 0 EUR Veolia Environnement SA 0 4,000 0 EUR Vinci SA 0 500 0 EUR Vopak NV 0 650 0 EUR X FAB Silicon Foundries SE Reg 0 26,817 0
GBP D S Smith Plc 19,000 0 0
NOK Telenor ASA 0 12,000 0 NOK Yara Intl ASA 5,000 0 0
USD Alphabet Inc A 30 0 0 USD Applied Materials Inc 8,000 0 0 USD Arista Networks Inc 1,300 0 0 USD Booking Holdings Inc Reg 140 40 0 USD Cisco Systems Inc 0 4,000 0 USD Mondelez Intl Inc 5,000 0 0 USD Pepsico Inc 0 1,700 0 USD Schlumberger Ltd 3,000 0 0 USD United Technologies Corp 200 0 0
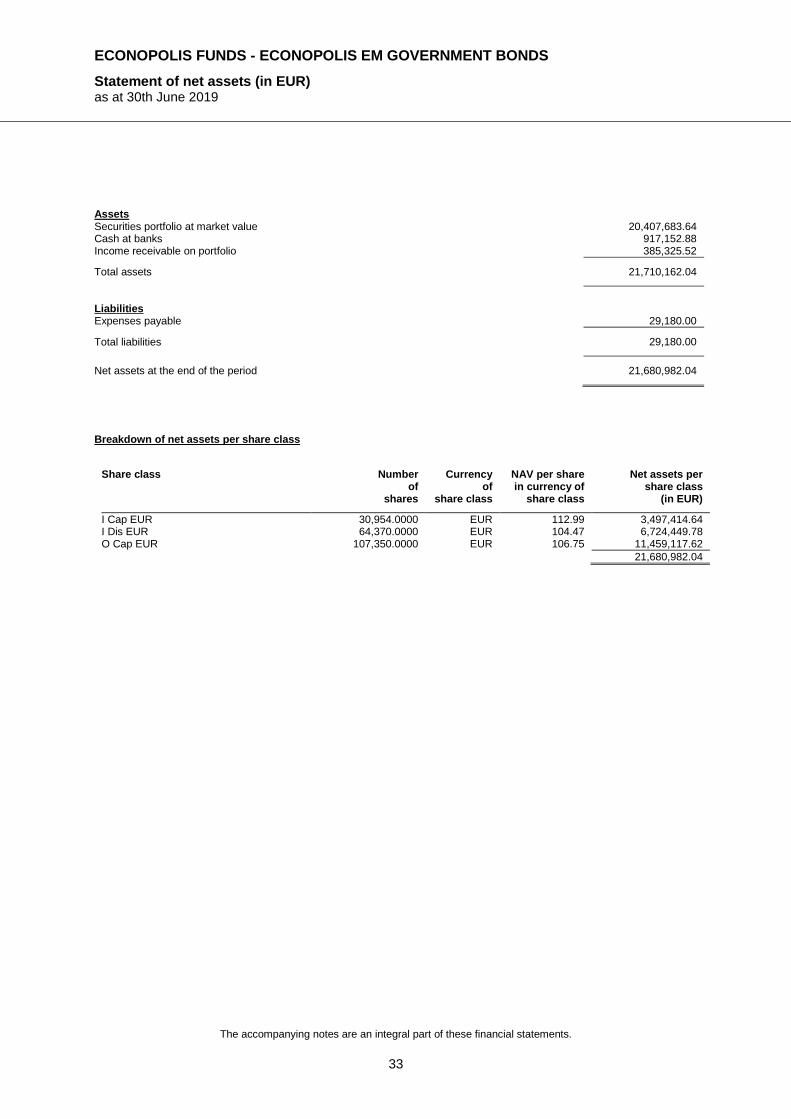
ECONOPOLIS FUNDS - ECONOPOLIS EM GOVERNMENT BONDS
Statement of net assets (in EUR) as at 30th June 2019
The accompanying notes are an integral part of these financial statements.
33
Assets Securities portfolio at market value 20,407,683.64 Cash at banks 917,152.88 Income receivable on portfolio 385,325.52
Total assets 21,710,162.04
Liabilities Expenses payable 29,180.00
Total liabilities 29,180.00
Net assets at the end of the period 21,680,982.04
Breakdown of net assets per share class
Share class Number of
shares
Currency of
share class
NAV per share in currency of
share class
Net assets per share class
(in EUR)
I Cap EUR 30,954.0000 EUR 112.99 3,497,414.64 I Dis EUR 64,370.0000 EUR 104.47 6,724,449.78 O Cap EUR 107,350.0000 EUR 106.75 11,459,117.62
21,680,982.04

ECONOPOLIS FUNDS - ECONOPOLIS EM GOVERNMENT BONDS
Statistical information (in EUR) as at 30th June 2019
(*) Net asset value used for final redemption.
The accompanying notes are an integral part of these financial statements.
34
Total net assets Currency 31.12.2017 31.12.2018 30.06.2019
EUR 12,023,310.49 10,111,275.05 21,680,982.04
Net asset value per share
Currency 31.12.2017 31.12.2018 30.06.2019
A Cap EUR EUR - 102.71 A Dis EUR EUR - 102.71 I Cap EUR EUR 107.18 106.49 112.99 I Dis EUR EUR 107.09 102.17 104.47 O Cap EUR EUR - 100.32 106.75
Number of shares outstanding at the
beginning of the period
issued redeemed outstanding at the end of the period
I Cap EUR 25,736.0000 9,773.0000 -4,555.0000 30,954.0000 I Dis EUR 68,949.0000 1,350.0000 -5,929.0000 64,370.0000 O Cap EUR 3,250.0000 104,100.0000 - 107,350.0000
Dividends paid Currency Dividend per share Ex-dividend date
I Dis EUR EUR 3.87 30.04.2019
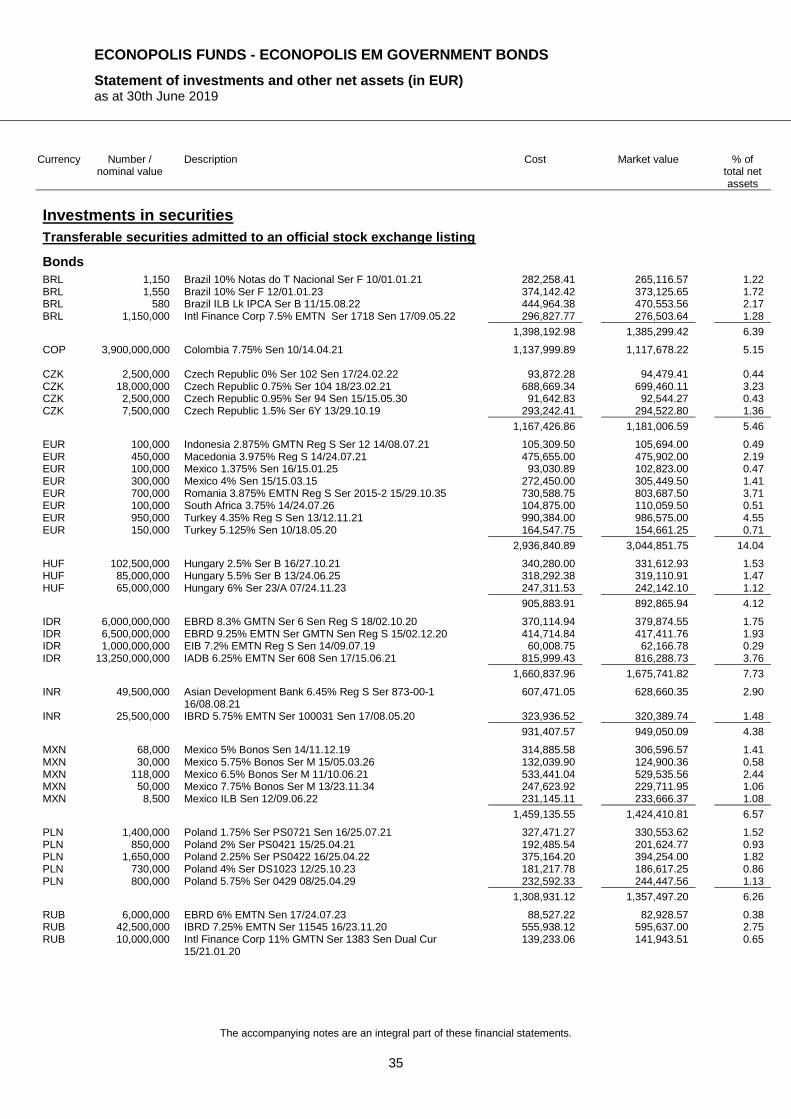
ECONOPOLIS FUNDS - ECONOPOLIS EM GOVERNMENT BONDS
Statement of investments and other net assets (in EUR) as at 30th June 2019
The accompanying notes are an integral part of these financial statements.
35
Currency Number / nominal value
Description Cost Market value % of total net assets
Investments in securities
Transferable securities admitted to an official stock exchange listing
Bonds
BRL 1,150 Brazil 10% Notas do T Nacional Ser F 10/01.01.21 282,258.41 265,116.57 1.22 BRL 1,550 Brazil 10% Ser F 12/01.01.23 374,142.42 373,125.65 1.72 BRL 580 Brazil ILB Lk IPCA Ser B 11/15.08.22 444,964.38 470,553.56 2.17 BRL 1,150,000 Intl Finance Corp 7.5% EMTN Ser 1718 Sen 17/09.05.22 296,827.77 276,503.64 1.28
1,398,192.98 1,385,299.42 6.39
COP 3,900,000,000 Colombia 7.75% Sen 10/14.04.21 1,137,999.89 1,117,678.22 5.15 CZK 2,500,000 Czech Republic 0% Ser 102 Sen 17/24.02.22 93,872.28 94,479.41 0.44 CZK 18,000,000 Czech Republic 0.75% Ser 104 18/23.02.21 688,669.34 699,460.11 3.23 CZK 2,500,000 Czech Republic 0.95% Ser 94 Sen 15/15.05.30 91,642.83 92,544.27 0.43 CZK 7,500,000 Czech Republic 1.5% Ser 6Y 13/29.10.19 293,242.41 294,522.80 1.36
1,167,426.86 1,181,006.59 5.46
EUR 100,000 Indonesia 2.875% GMTN Reg S Ser 12 14/08.07.21 105,309.50 105,694.00 0.49 EUR 450,000 Macedonia 3.975% Reg S 14/24.07.21 475,655.00 475,902.00 2.19 EUR 100,000 Mexico 1.375% Sen 16/15.01.25 93,030.89 102,823.00 0.47 EUR 300,000 Mexico 4% Sen 15/15.03.15 272,450.00 305,449.50 1.41 EUR 700,000 Romania 3.875% EMTN Reg S Ser 2015-2 15/29.10.35 730,588.75 803,687.50 3.71 EUR 100,000 South Africa 3.75% 14/24.07.26 104,875.00 110,059.50 0.51 EUR 950,000 Turkey 4.35% Reg S Sen 13/12.11.21 990,384.00 986,575.00 4.55 EUR 150,000 Turkey 5.125% Sen 10/18.05.20 164,547.75 154,661.25 0.71
2,936,840.89 3,044,851.75 14.04
HUF 102,500,000 Hungary 2.5% Ser B 16/27.10.21 340,280.00 331,612.93 1.53 HUF 85,000,000 Hungary 5.5% Ser B 13/24.06.25 318,292.38 319,110.91 1.47 HUF 65,000,000 Hungary 6% Ser 23/A 07/24.11.23 247,311.53 242,142.10 1.12
905,883.91 892,865.94 4.12
IDR 6,000,000,000 EBRD 8.3% GMTN Ser 6 Sen Reg S 18/02.10.20 370,114.94 379,874.55 1.75 IDR 6,500,000,000 EBRD 9.25% EMTN Ser GMTN Sen Reg S 15/02.12.20 414,714.84 417,411.76 1.93 IDR 1,000,000,000 EIB 7.2% EMTN Reg S Sen 14/09.07.19 60,008.75 62,166.78 0.29 IDR 13,250,000,000 IADB 6.25% EMTN Ser 608 Sen 17/15.06.21 815,999.43 816,288.73 3.76
1,660,837.96 1,675,741.82 7.73
INR 49,500,000 Asian Development Bank 6.45% Reg S Ser 873-00-1 16/08.08.21
607,471.05 628,660.35 2.90
INR 25,500,000 IBRD 5.75% EMTN Ser 100031 Sen 17/08.05.20 323,936.52 320,389.74 1.48
931,407.57 949,050.09 4.38
MXN 68,000 Mexico 5% Bonos Sen 14/11.12.19 314,885.58 306,596.57 1.41 MXN 30,000 Mexico 5.75% Bonos Ser M 15/05.03.26 132,039.90 124,900.36 0.58 MXN 118,000 Mexico 6.5% Bonos Ser M 11/10.06.21 533,441.04 529,535.56 2.44 MXN 50,000 Mexico 7.75% Bonos Ser M 13/23.11.34 247,623.92 229,711.95 1.06 MXN 8,500 Mexico ILB Sen 12/09.06.22 231,145.11 233,666.37 1.08
1,459,135.55 1,424,410.81 6.57
PLN 1,400,000 Poland 1.75% Ser PS0721 Sen 16/25.07.21 327,471.27 330,553.62 1.52 PLN 850,000 Poland 2% Ser PS0421 15/25.04.21 192,485.54 201,624.77 0.93 PLN 1,650,000 Poland 2.25% Ser PS0422 16/25.04.22 375,164.20 394,254.00 1.82 PLN 730,000 Poland 4% Ser DS1023 12/25.10.23 181,217.78 186,617.25 0.86 PLN 800,000 Poland 5.75% Ser 0429 08/25.04.29 232,592.33 244,447.56 1.13
1,308,931.12 1,357,497.20 6.26
RUB 6,000,000 EBRD 6% EMTN Sen 17/24.07.23 88,527.22 82,928.57 0.38 RUB 42,500,000 IBRD 7.25% EMTN Ser 11545 16/23.11.20 555,938.12 595,637.00 2.75 RUB 10,000,000 Intl Finance Corp 11% GMTN Ser 1383 Sen Dual Cur
15/21.01.20 139,233.06 141,943.51 0.65

ECONOPOLIS FUNDS - ECONOPOLIS EM GOVERNMENT BONDS
Statement of investments and other net assets (in EUR) (continued) as at 30th June 2019
The accompanying notes are an integral part of these financial statements.
36
Currency Number / nominal value
Description Cost Market value % of total net assets
RUB 39,000,000 Intl Finance Corp 6.375% Ser 1711 GMTN Reg S 17/11.04.22 529,466.19 543,696.37 2.51 RUB 4,000,000 Intl Finance Corp 6.75% EMTN Ser 1679 Sen Reg S
17/03.02.20 63,624.34 55,672.13 0.26
1,376,788.93 1,419,877.58 6.55
SGD 340,000 Singapore 1.25% T-Notes Sen 16/01.10.21 213,835.25 218,826.68 1.01 THB 2,046,000 Ministry of Finance 1.875% Ser LB226A Sen 16/17.06.22 54,292.43 58,750.42 0.27 THB 2,454,000 Ministry of Finance 2.4% Sen 18/17.12.23 66,295.53 72,005.39 0.33
120,587.96 130,755.81 0.60
USD 50,000 Brazil 7.125% 06/20.01.37 51,880.10 54,495.48 0.25 USD 1,050,000 Dominican Republic 7.5% Sk Sen Reg S 10/06.05.21 644,821.24 648,786.34 2.99 USD 100,000 Hungary 6.375% Sen 11/29.03.21 100,955.09 93,903.13 0.43 USD 40,000 Mexico 3.5% Sen Tr 28 14/21.01.21 36,656.35 35,691.06 0.16 USD 25,000 Poland 6.37% 09/15.07.19 23,053.28 21,996.03 0.10 USD 200,000 Romania 4.375% EMTN Reg S Ser 2013-1 13/22.08.23 183,899.14 186,576.80 0.86 USD 400,000 Serbia 4.875% Sen Reg S 13/25.02.20 355,459.99 355,937.47 1.64 USD 100,000 Turkey 5.625% 10/30.03.21 89,462.57 89,303.15 0.41 USD 100,000 Turkey 7.5% Sen 09/07.11.19 89,040.19 88,943.53 0.41
1,575,227.95 1,575,632.99 7.25
UYU 1,500,000 Intl Finance Corp 12.25% GMTN Ser 1628 Sen 16/05.10.21 49,748.69 38,276.73 0.18 ZAR 1,750,000 EIB 6% EMTN Sen Reg S 12/21.10.19 106,701.98 108,465.99 0.50 ZAR 2,300,000 EIB 8.5% EMTN Reg S Sen 14/17.09.24 137,308.90 150,151.12 0.69 ZAR 8,800,000 EIB 9% EMTN Sen 11/31.03.21 551,047.49 567,485.82 2.62 ZAR 3,050,000 South Africa 10.5% Ser R186 Sen 98/21.12.26 219,921.70 215,157.44 0.99 ZAR 700,000 South Africa 6.75% Sen Ser R208 06/31.03.21 42,732.79 43,882.43 0.20 ZAR 3,200,000 South Africa 8.875% Ser R2035 Sen 15/28.02.35 201,801.07 190,016.40 0.88
1,259,513.93 1,275,159.20 5.88
Total bonds 17,502,359.44 17,686,930.83 81.57
Transferable securities dealt in on another regulated market
Bonds
BRL 375 Brazil ILB NTNB Ser B Lk IPCA 09/15.08.20 280,473.01 288,083.60 1.33 CLP 390,000,000 Chile 5.5% Sen 10/05.08.20 539,246.80 517,847.61 2.39 CZK 5,750,000 Czech Republic 2.4% Ser 89 14/17.09.25 243,121.00 239,050.44 1.10 PHP 42,000,000 Philippines 4.95% 10/15.01.21 762,732.88 725,364.61 3.35 USD 100,000 Indonesia 6.625% 07/17.02.37 104,010.30 114,437.52 0.53
Total bonds 1,929,583.99 1,884,783.78 8.70
Open-ended investment funds
Investment funds (UCITS)
USD 76,468.485 Aberdeen Standard Indian Bond Fd I Cap 806,899.95 835,969.03 3.86
Total investment funds (UCITS) 806,899.95 835,969.03 3.86
Total investments in securities 20,238,843.38 20,407,683.64 94.13
Cash at banks 917,152.88 4.23
Other net assets/(liabilities) 356,145.52 1.64
Total 21,680,982.04 100.00

ECONOPOLIS FUNDS - ECONOPOLIS EM GOVERNMENT BONDS
Industrial and geographical classification of investments as at 30th June 2019
37
Industrial classification
(in percentage of net assets)
Countries and governments 66.34 %
International institutions 23.93 %
Investment funds 3.86 %
Total 94.13 %
Geographical classification
(by domicile of the issuer) (in percentage of net assets)
United States of America 12.87 %
Mexico 8.61 %
Luxembourg 7.96 %
Brazil 6.69 %
Czech Republic 6.56 %
Poland 6.36 %
Philippines 6.25 %
Turkey 6.08 %
Colombia 5.15 %
Romania 4.57 %
Hungary 4.55 %
United Kingdom 4.06 %
Dominican Republic 2.99 %
South Africa 2.58 %
Chile 2.39 %
Mazedonia 2.19 %
Serbia Republic 1.64 %
Indonesia 1.02 %
Singapore 1.01 %
Thailand 0.60 %
Total 94.13 %

ECONOPOLIS FUNDS - ECONOPOLIS EM GOVERNMENT BONDS
Statement of changes in investments from 1st January 2019 to 30th June 2019
38
Currency Description Purchases Sales Other
Bonds
BRL Brazil 10% Notas do T Nacional Ser F 10/01.01.21 900 0 0 BRL Brazil 10% Ser F 12/01.01.23 1,300 0 0 BRL Brazil ILB Lk IPCA Ser B 11/15.08.22 350 0 0 BRL Brazil ILB NTNB Ser B Lk IPCA 09/15.08.20 150 0 0
CLP Chile 5.5% Sen 10/05.08.20 270,000,000 0 0
COP Colombia 7.75% Sen 10/14.04.21 2,625,000,000 0 0
CZK Czech Republic 0% Ser 102 Sen 17/24.02.22 2,500,000 0 0 CZK Czech Republic 0.75% Ser 104 18/23.02.21 18,000,000 0 0 CZK Czech Republic 0.95% Ser 94 Sen 15/15.05.30 2,500,000 0 0 CZK Czech Republic 2.4% Ser 89 14/17.09.25 2,500,000 0 0
EUR Macedonia 3.975% Reg S 14/24.07.21 250,000 0 0 EUR Mexico 4% Sen 15/15.03.15 200,000 0 0 EUR Romania 3.875% EMTN Reg S Ser 2015-2
15/29.10.35 500,000 0 0
EUR Turkey 4.35% Reg S Sen 13/12.11.21 650,000 0 0
HUF Hungary 2.5% Ser B 16/27.10.21 30,000,000 0 0 HUF Hungary 5.5% Ser B 13/24.06.25 60,000,000 0 0 HUF Hungary 6% Ser 23/A 07/24.11.23 30,000,000 0 0
IDR EBRD 7.375% EMTN Sen 14/15.04.19 0 12,750,000,000 0 IDR EBRD 8.3% GMTN Ser 6 Sen Reg S 18/02.10.20 6,000,000,000 0 0 IDR EBRD 9.25% EMTN Ser GMTN Sen Reg S
15/02.12.20 6,500,000,000 0 0
IDR IADB 6.25% EMTN Ser 608 Sen 17/15.06.21 13,250,000,000 0 0
INR Asian Development Bank 6.45% Reg S Ser 873-00-1 16/08.08.21
32,000,000 0 0
INR IBRD 5.75% EMTN Ser 100031 Sen 17/08.05.20 25,500,000 0 0 INR Intl Finance Corp 7.8% EMTN Ser GDIF Tr 68
14/03.06.19 0 23,400,000 0
MXN Mexico 6.5% Bonos Ser M 11/10.06.21 60,000 0 0 MXN Mexico 7.75% Bonos Ser M 13/23.11.34 20,000 0 0 MXN Mexico ILB Sen 12/09.06.22 8,500 0 0
PHP Philippines 4.95% 10/15.01.21 20,000,000 0 0
PLN Poland 1.75% Ser PS0721 Sen 16/25.07.21 800,000 0 0 PLN Poland 2.25% Ser PS0422 16/25.04.22 500,000 0 0 PLN Poland 4% Ser DS1023 12/25.10.23 600,000 0 0 PLN Poland 5.75% Ser 0429 08/25.04.29 400,000 0 0
RUB Intl Finance Corp 11% GMTN Ser 1383 Sen Dual Cur 15/21.01.20
10,000,000 0 0
RUB Intl Finance Corp 6.375% Ser 1711 GMTN Reg S 17/11.04.22
39,000,000 0 0

ECONOPOLIS FUNDS - ECONOPOLIS EM GOVERNMENT BONDS
Statement of changes in investments (continued) from 1st January 2019 to 30th June 2019
39
Currency Description Purchases Sales Other
SGD Singapore 1.25% T-Notes Sen 16/01.10.21 190,000 0 0
THB Ministry of Finance 1.875% Ser LB226A Sen 16/17.06.22
1,500,000 0 -2,454,000
THB Ministry of Finance 2.4% Sen 18/17.12.23 0 0 2,454,000
USD Brazil 7.125% 06/20.01.37 50,000 0 0 USD Dominican Republic 7.5% Sk Sen Reg S
10/06.05.21 750,000 0 0
USD Serbia 4.875% Sen Reg S 13/25.02.20 200,000 0 0 USD Turkey 5.625% 10/30.03.21 100,000 0 0
ZAR EIB 9% EMTN Sen 11/31.03.21 6,200,000 0 0 ZAR South Africa 10.5% Ser R186 Sen 98/21.12.26 2,200,000 0 0 ZAR South Africa 8.875% Ser R2035 Sen 15/28.02.35 1,000,000 0 0
Investment funds (UCITS)
USD Aberdeen Standard Indian Bond Fd I Cap 41,300 0 0

ECONOPOLIS FUNDS - ECONOPOLIS SMART CONVICTIONS FUND
Statement of net assets (in EUR) as at 30th June 2019
The accompanying notes are an integral part of these financial statements.
40
Assets Securities portfolio at market value 28,946,514.75 Cash at banks 2,727,685.43 Formation expenses, net 14,852.59 Receivable on issues of shares 73,934.14 Income receivable on portfolio 94,680.83
Total assets 31,857,667.74
Liabilities Bank overdrafts 0.02 Expenses payable 106,955.78
Total liabilities 106,955.80
Net assets at the end of the period 31,750,711.94
Breakdown of net assets per share class
Share class Number of
shares
Currency of
share class
NAV per share in currency of
share class
Net assets per share class
(in EUR)
A Cap EUR 313,830.6885 EUR 99.47 31,215,376.80 A Dis EUR 1.0000 EUR 101.18 101.18 I Cap EUR 5,310.0000 EUR 100.80 535,233.96
31,750,711.94

ECONOPOLIS FUNDS - ECONOPOLIS SMART CONVICTIONS FUND
Statistical information (in EUR) as at 30th June 2019
The accompanying notes are an integral part of these financial statements.
41
Total net assets Currency 31.12.2018 30.06.2019
EUR 15,204,403.45 31,750,711.94
Net asset value per share
Currency 31.12.2018 30.06.2019
A Cap EUR EUR 98.38 99.47 A Dis EUR EUR - 101.18 I Cap EUR EUR - 100.80
Number of shares outstanding at the
beginning of the period
issued redeemed outstanding at the end of the period
A Cap EUR 154,544.9486 159,638.7399 -353.0000 313,830.6885 A Dis EUR - 1 - 1 I Cap EUR - 5,310 - 5,310

ECONOPOLIS FUNDS - ECONOPOLIS SMART CONVICTIONS FUND
Statement of investments and other net assets (in EUR) as at 30th June 2019
The accompanying notes are an integral part of these financial statements.
42
Currency Number / nominal value
Description Cost Market value % of total net assets
Investments in securities
Transferable securities admitted to an official stock exchange listing
Shares
CHF 5,300 Alcon Inc Reg 278,272.49 287,763.15 0.91 CHF 175 Barry Callebaut AG Reg 286,258.79 308,629.05 0.97
564,531.28 596,392.20 1.88
EUR 3,700 Anheuser-Busch InBev SA 281,171.51 288,008.00 0.91 EUR 63,000 Nokia Oyj 282,189.60 275,058.00 0.87 EUR 3,850 Schneider Electric SE 279,581.23 307,076.00 0.97 EUR 2,900 Solvay SA 277,705.74 264,190.00 0.83
1,120,648.08 1,134,332.00 3.58
USD 1,350 Becton Dickinson & Co 281,756.84 298,773.60 0.94 USD 2,500 Microsoft Corp 280,671.31 294,107.32 0.93
562,428.15 592,880.92 1.87
Total shares 2,247,607.51 2,323,605.12 7.33
Investment certificates
USD 23,900 iShares Physical Metals Plc Certif Gold Perpetual 532,613.31 580,813.87 1.83
Total investment certificates 532,613.31 580,813.87 1.83
Bonds
AUD 250,000 Australia 1.75% Reg S Ser TB146 15/21.11.20 157,142.50 155,596.60 0.49 CAD 450,000 Canada 1.75% Sen 19/01.05.21 300,868.02 303,772.52 0.96 CZK 2,500,000 Czech Republic 0.75% Ser 104 18/23.02.21 94,719.44 97,147.24 0.31 CZK 4,500,000 Czech Republic 1.5% Ser 6Y 13/29.10.19 174,120.25 176,713.68 0.56 CZK 5,000,000 Czech Republic 4.2% Ser 49 Sen 06/04.12.36 248,721.14 263,868.16 0.83
517,560.83 537,729.08 1.70
EUR 150,000 Akzo Nobel NV 2.625% EMTN Sen 12/27.07.22 161,073.00 162,681.75 0.51 EUR 200,000 Amadeus Capital Market 0.125% EMTN Reg S Sen 16/06.10.20 200,306.00 200,628.00 0.63 EUR 150,000 Anglo American Capital Plc 3.5% EMTN 12/28.03.22 160,078.50 164,050.50 0.52 EUR 200,000 Befimmo SA FRN Sen 15/21.04.22 201,300.00 200,500.00 0.63 EUR 300,000 Bekaert SA 5% EMTN 11/06.12.19 307,043.10 306,174.00 0.96 EUR 200,000 Belgium 0.5% Sen 17/22.10.24 205,584.00 209,714.00 0.66 EUR 150,000 Belgium 1.7% OLO 88 Sen 144A Reg S 19/22.06.50 167,684.25 176,611.50 0.56 EUR 200,000 BNG Bank NV FRN EMTN Sen 11/09.02.21 202,596.00 201,826.00 0.64 EUR 200,000 Cofinimmo SICAFI SA 1.929% Sen 15/25.03.22 203,850.00 204,032.00 0.64 EUR 100,000 D S Smith Plc 1.375% EMTN Ser 2 Sen Reg S 17/26.07.24 96,779.00 102,347.00 0.32 EUR 450,000 Deutschland ILB Ser I/L 09/15.04.20 525,515.17 520,887.84 1.64 EUR 600,000 Deutschland ILB Ser I/L 12/15.04.23 683,695.81 685,114.67 2.16 EUR 300,000 Espana ILB Sen 16/30.11.21 323,793.83 324,558.49 1.02 EUR 300,000 Flowserve Corp 1.25% Reg S Sen 15/17.03.22 299,442.00 303,111.00 0.95 EUR 200,000 Fluvius Syst Operator 2% Sen Pr 1069 17/23.06.25 211,460.00 214,629.00 0.68 EUR 150,000 Fresenius Finance Ireland PLC 0.875% Reg S Sen 17/31.01.22 149,685.00 153,086.25 0.48 EUR 200,000 Fresenius Finance Ireland PLC 3% Reg S Sen 17/30.01.32 198,970.00 229,267.00 0.72 EUR 305,000 GIMV NV 3.5% EMTN Sen 19/05.07.31 308,802.00 311,304.35 0.98 EUR 150,000 Ireland 1.5% T-Bonds Sen 19/15.05.50 157,035.00 165,201.75 0.52 EUR 200,000 Macedonia 3.975% Reg S 14/24.07.21 211,380.00 211,512.00 0.67 EUR 150,000 Macedonia 5.625% Reg S Sen 16/26.07.23 173,175.00 174,113.25 0.55 EUR 300,000 Nederlandse Waterschapsbank NV FRN EMTN Reg S
11/27.04.21 304,110.00 302,820.00 0.95
EUR 150,000 NN Group NV VAR EMTN Sub 14/13.06.Perpetual 157,725.00 164,950.50 0.52 EUR 400,000 NV Bekaert SA 0% Conv Reg S Ser BEKB 16/09.06.21 360,530.00 377,628.00 1.19 EUR 150,000 Oesterreich 1.65% Ser 1 14/21.10.24 164,427.00 167,269.50 0.53 EUR 200,000 Orpea SA 2.625% EMTN Sen 18/10.03.25 198,600.00 208,286.00 0.66 EUR 350,000 Poland 0.875% EMTN Reg S Ser 40 15/14.10.21 359,382.00 359,397.50 1.13 EUR 200,000 Romania 3.875% EMTN Reg S Ser 2015-2 15/29.10.35 199,610.00 229,625.00 0.72

ECONOPOLIS FUNDS - ECONOPOLIS SMART CONVICTIONS FUND
Statement of investments and other net assets (in EUR) (continued) as at 30th June 2019
The accompanying notes are an integral part of these financial statements.
43
Currency Number / nominal value
Description Cost Market value % of total net assets
EUR 100,000 Sky Ltd 1.5% EMTN Sen 14/15.09.21 102,505.00 103,577.00 0.33 EUR 200,000 Solvay Finance SA VAR Reg S Sub 15/02.06.Perpetual 214,705.00 217,453.00 0.68 EUR 200,000 Teva Pharmaceutical Fin II BV 0.375% Reg S Sen 16/25.07.20 195,750.00 196,896.00 0.62 EUR 250,000 Turkey 4.35% Reg S Sen 13/12.11.21 260,580.00 259,625.00 0.82 EUR 150,000 Turkey 5.125% Sen 10/18.05.20 155,952.00 154,661.25 0.49 EUR 200,000 UCB 4.125% EMTN Sen 13/04.01.21 213,860.00 212,051.00 0.67 EUR 200,000 Vonovia Finance BV 1.125% EMTN Ser 14 Tr 1 Sen
17/08.09.25 201,310.00 207,395.00 0.65
EUR 220,000 Vranken-Pommery Monopole 3.45% Sen 19/19.06.24 221,100.00 226,635.20 0.71
8,459,393.66 8,609,620.30 27.11
GBP 150,000 3i Group Plc 6.875% EMTN Ser 77312 98/09.03.23 201,826.20 197,171.45 0.62 GBP 100,000 United Kingdom 1.5% T-Stock Sen 15/22.01.21 115,956.38 113,262.89 0.36 GBP 100,000 United Kingdom 1.75% T-Gilt Sen Reg S 16/07.09.37 116,851.72 118,980.92 0.37
434,634.30 429,415.26 1.35
NOK 2,000,000 EIB 1% EMTN Ser 2225/0100 Sen 16/25.05.21 204,201.61 204,323.71 0.64 NOK 3,000,000 EIB 1.125% EMTN Reg S Sen 15/15.05.20 310,565.52 307,935.96 0.97
514,767.13 512,259.67 1.61
PLN 500,000 Poland 1.75% Ser PS0721 Sen 16/25.07.21 115,796.81 118,054.87 0.37 USD 250,000 Dominican Republic 7.5% Sk Sen Reg S 10/06.05.21 153,285.86 154,472.94 0.49 USD 200,000 Microsoft Corp 3.75% Sen 15/12.02.45 176,003.88 191,373.50 0.60 USD 400,000 US 2.25% T-Bonds Sen 16/15.08.46 305,151.27 331,710.51 1.04
634,441.01 677,556.95 2.13
Total bonds 11,134,604.26 11,344,005.25 35.72
Transferable securities dealt in on another regulated market
Bonds
EUR 100,000 Argan 3.25% Sen 17/04.07.23 101,900.00 102,645.00 0.32 EUR 200,000 AT&T Inc FRN 18/05.09.23 202,236.00 202,617.00 0.64 EUR 200,000 ImmoBel 3% Sen 17/01.06.22 204,506.00 205,759.00 0.65 EUR 150,000 Molnlycke Holding AB 1.5% Reg S Sen 14/28.02.22 152,658.00 155,721.75 0.49
661,300.00 666,742.75 2.10
USD 300,000 US ILB T-Notes Ser D-2026 16/15.07.26 260,370.53 279,147.14 0.88
Total bonds 921,670.53 945,889.89 2.98
Open-ended investment funds
Investment funds (UCITS)
EUR 19,384.9066 BNP Paribas InstiCash EUR 1D ST VNAV I Cap 2,699,999.96 2,694,897.47 8.49 EUR 11,350 Econopolis Fds Em Government Bonds EUR O Cap 1,160,781.00 1,210,818.00 3.81 EUR 28,500 Econopolis Fds Global Bonds O EUR Cap 2,841,205.00 2,895,600.00 9.12 EUR 2,670 NN (L) Liquid SICAV EUR A Cap 3,284,878.45 3,277,558.50 10.32 EUR 26,500 Pictet SICAV Short Term Money Market I EUR Cap 3,680,983.45 3,673,326.65 11.57
Total investment funds (UCITS) 13,667,847.86 13,752,200.62 43.31
Total investments in securities 28,504,343.47 28,946,514.75 91.17
Cash at banks 2,727,685.43 8.59
Bank overdrafts -0.02 0.00
Other net assets/(liabilities) 76,511.78 0.24
Total 31,750,711.94 100.00

ECONOPOLIS FUNDS - ECONOPOLIS SMART CONVICTIONS FUND
Industrial and geographical classification of investments as at 30th June 2019
44
Industrial classification
(in percentage of net assets)
Investment funds 43.31 %
Countries and governments 18.13 %
Financials 9.83 %
Industrials 4.07 %
Healthcare 3.80 %
Raw materials 3.49 %
Non-cyclical consumer goods 2.59 %
Technologies 2.40 %
International institutions 1.61 %
Real estate 0.97 %
Telecommunications services 0.64 %
Cyclical consumer goods 0.33 %
Total 91.17 %

ECONOPOLIS FUNDS - ECONOPOLIS SMART CONVICTIONS FUND
Industrial and geographical classification of investments (continued) as at 30th June 2019
45
Geographical classification
(by domicile of the issuer) (in percentage of net assets)
Luxembourg 44.92 %
Belgium 9.36 %
United States of America 5.98 %
The Netherlands 3.89 %
Germany 3.80 %
Ireland 3.55 %
France 3.34 %
United Kingdom 2.52 %
Switzerland 1.88 %
Czech Republic 1.70 %
Spain 1.65 %
Poland 1.50 %
Turkey 1.31 %
Mazedonia 1.22 %
Canada 0.96 %
Finland 0.87 %
Romania 0.72 %
Austria 0.53 %
Sweden 0.49 %
Australia 0.49 %
Dominican Republic 0.49 %
Total 91.17 %

ECONOPOLIS FUNDS - ECONOPOLIS SMART CONVICTIONS FUND
Statement of changes in investments from 1st January 2019 to 30th June 2019
46
Currency Description Purchases Sales
Shares
CHF Alcon Inc Reg 5,300 0 CHF Barry Callebaut AG Reg 175 0
EUR Anheuser-Busch InBev SA 3,700 0 EUR Nokia Oyj 63,000 0 EUR Schneider Electric SE 3,850 0 EUR Solvay SA 2,900 0
USD Becton Dickinson & Co 1,350 0 USD Microsoft Corp 2,500 0
Investment certificates
USD iShares Physical Metals Plc Certif Gold Perpetual 23,900 0
Bonds
AUD Australia 1.75% Reg S Ser TB146 15/21.11.20 250,000 0
CAD Canada 1.75% Sen 19/01.05.21 450,000 0
CZK Czech Republic 0.75% Ser 104 18/23.02.21 2,500,000 0 CZK Czech Republic 4.2% Ser 49 Sen 06/04.12.36 5,000,000 0
EUR Befimmo SA FRN Sen 15/21.04.22 200,000 0 EUR Bekaert SA 5% EMTN 11/06.12.19 300,000 0 EUR Belgium 0.5% Sen 17/22.10.24 200,000 0 EUR Belgium 1.7% OLO 88 Sen 144A Reg S 19/22.06.50 150,000 0 EUR BNG Bank NV FRN EMTN Sen 11/09.02.21 200,000 0 EUR Cofinimmo SICAFI SA 1.929% Sen 15/25.03.22 100,000 0 EUR Deutschland ILB Ser I/L 09/15.04.20 450,000 0 EUR Deutschland ILB Ser I/L 12/15.04.23 200,000 0 EUR Espana ILB Sen 16/30.11.21 150,000 0 EUR Flowserve Corp 1.25% Reg S Sen 15/17.03.22 300,000 0 EUR Fluvius Syst Operator 2% Sen Pr 1069 17/23.06.25 200,000 0 EUR Fresenius Finance Ireland PLC 3% Reg S Sen 17/30.01.32 200,000 0 EUR GIMV NV 3.5% EMTN Sen 19/05.07.31 305,000 0 EUR ImmoBel 3% Sen 17/01.06.22 200,000 0 EUR Ireland 1.5% T-Bonds Sen 19/15.05.50 150,000 0 EUR Macedonia 3.975% Reg S 14/24.07.21 200,000 0 EUR Macedonia 5.625% Reg S Sen 16/26.07.23 150,000 0 EUR Nederlandse Waterschapsbank NV FRN EMTN Reg S 11/27.04.21 300,000 0 EUR NN Group NV VAR EMTN Sub 14/13.06.Perpetual 150,000 0 EUR NV Bekaert SA 0% Conv Reg S Ser BEKB 16/09.06.21 300,000 0 EUR Orpea SA 2.625% EMTN Sen 18/10.03.25 200,000 0 EUR Poland 0.875% EMTN Reg S Ser 40 15/14.10.21 350,000 0 EUR Romania 3.875% EMTN Reg S Ser 2015-2 15/29.10.35 200,000 0 EUR Sappi Papier Holdings GmbH 4% Reg S Sen 16/01.04.23 200,000 200,000 EUR Teva Pharmaceutical Fin II BV 0.375% Reg S Sen 16/25.07.20 200,000 0 EUR Turkey 4.35% Reg S Sen 13/12.11.21 250,000 0 EUR Turkey 5.125% Sen 10/18.05.20 150,000 0 EUR UCB 4.125% EMTN Sen 13/04.01.21 200,000 0 EUR Vonovia Finance BV 1.125% EMTN Ser 14 Tr 1 Sen 17/08.09.25 200,000 0 EUR Vranken-Pommery Monopole 3.45% Sen 19/19.06.24 220,000 0

ECONOPOLIS FUNDS - ECONOPOLIS SMART CONVICTIONS FUND
Statement of changes in investments (continued) from 1st January 2019 to 30th June 2019
47
Currency Description Purchases Sales
GBP 3i Group Plc 6.875% EMTN Ser 77312 98/09.03.23 150,000 0 GBP United Kingdom 1.5% T-Stock Sen 15/22.01.21 100,000 0 GBP United Kingdom 1.75% T-Gilt Sen Reg S 16/07.09.37 100,000 0
NOK EIB 1% EMTN Ser 2225/0100 Sen 16/25.05.21 2,000,000 0
PLN Poland 1.75% Ser PS0721 Sen 16/25.07.21 500,000 0
USD Dominican Republic 7.5% Sk Sen Reg S 10/06.05.21 250,000 0 USD Microsoft Corp 3.75% Sen 15/12.02.45 200,000 0 USD US 2.25% T-Bonds Sen 16/15.08.46 400,000 0
Investment funds (UCITS)
EUR BNP Paribas InstiCash EUR 1D ST VNAV I Cap 8,616.5974 0 EUR Econopolis Fds Em Government Bonds EUR O Cap 8,100 0 EUR Econopolis Fds Global Bonds O EUR Cap 2,000 0 EUR NN (L) Liquid SICAV EUR A Cap 490 0 EUR Pictet SICAV Short Term Money Market I EUR Cap 7,200 0

ECONOPOLIS FUNDS - ECONOPOLIS EMERGING MARKET EQUITIES
Statement of net assets (in EUR) as at 30th June 2019
The accompanying notes are an integral part of these financial statements.
48
Assets Securities portfolio at market value 9,945,985.13 Cash at banks 677,751.15 Formation expenses, net 6,224.45 Income receivable on portfolio 17,198.23
Total assets 10,647,158.96
Liabilities Bank overdrafts 64.01 Expenses payable 38,298.06
Total liabilities 38,362.07
Net assets at the end of the period 10,608,796.89
Breakdown of net assets per share class
Share class Number of
shares
Currency of
share class
NAV per share in currency of
share class
Net assets per share class
(in EUR)
A Cap EUR 1,251.0000 EUR 86.28 107,941.61 A Dis EUR 1.0000 EUR 94.79 94.79 I Cap EUR 27,385.0000 EUR 87.10 2,385,250.26 I Dis EUR 92,783.0000 EUR 87.47 8,115,510.23
10,608,796.89

ECONOPOLIS FUNDS - ECONOPOLIS EMERGING MARKET EQUITIES
Statistical information (in EUR) as at 30th June 2019
(*) Net asset value used for final redemption.
The accompanying notes are an integral part of these financial statements.
49
Total net assets Currency 31.12.2017 31.12.2018 30.06.2019
EUR 8,217,778.98 11,528,232.38 10,608,796.89
Net asset value per share
Currency 31.12.2017 31.12.2018 30.06.2019
A Cap EUR EUR 100.16 77.18 86.28 A Dis EUR EUR - 90.47 94.79 I Cap EUR EUR 100.17 77.66 87.10 I Dis EUR EUR 100.59 77.99 87.47
Number of shares outstanding at the
beginning of the period
issued redeemed outstanding at the end of the period
A Cap EUR 1,250.0000 1.0000 - 1,251.0000 A Dis EUR - 1.0000 - 1.0000 I Cap EUR 50,425.0000 1,210.0000 -24,250.0000 27,385.0000 I Dis EUR 96,368.0000 - -3,585.0000 92,783.0000

ECONOPOLIS FUNDS - ECONOPOLIS EMERGING MARKET EQUITIES
Statement of investments and other net assets (in EUR) as at 30th June 2019
The accompanying notes are an integral part of these financial statements.
50
Currency Number / nominal value
Description Cost Market value % of total net assets
Investments in securities
Transferable securities admitted to an official stock exchange listing
Shares
BRL 40,000 CCR SA 141,233.89 125,238.60 1.18 BRL 14,000 Localiza Rent A Car SA 80,220.21 131,500.53 1.24 BRL 30,000 Ultrapar Participacoes SA 244,016.75 138,211.71 1.30
465,470.85 394,950.84 3.72
EUR 4,500 Unilever NV Certif of Shares 217,468.93 240,300.00 2.27 HKD 43,000 AIA Group Ltd 315,296.76 407,205.84 3.84 HKD 50,000 Anta Sports Products Ltd 188,297.36 301,519.47 2.84 HKD 14,500 CK Hutchison Holdings Ltd 151,589.00 125,497.29 1.18 HKD 164,000 CNOOC Ltd 249,494.06 246,278.18 2.32 HKD 150,000 CSPC Pharmaceutical Gr Ltd 260,616.70 212,440.56 2.00 HKD 40,600 Hengan Intl Group Co Ltd 301,327.38 262,175.26 2.47 HKD 53,000 Ping An Ins Gr Co of China Ltd H 457,950.24 558,797.36 5.27 HKD 55,000 Sinopharm Group Co Ltd H 191,310.03 170,008.65 1.60 HKD 12,600 Sunny Optical Tec Gr Co Ltd 101,453.70 114,293.02 1.08 HKD 10,800 Tencent Holdings Ltd 459,541.87 428,037.38 4.03
2,676,877.10 2,826,253.01 26.63
IDR 1,000,000 Telekom Indonesia (PT) Tbk Ser B 240,641.70 257,351.15 2.43 KRW 1,600 Amorepacific Corp Pref 156,660.79 104,657.87 0.99 KRW 1,800 LG Chem Ltd Pref Reg 291,696.82 267,032.36 2.52 KRW 220 LG Household & Health Care Ltd Pref 114,553.99 134,555.78 1.27 KRW 1,750 NAVER Corp 227,503.86 151,386.63 1.43 KRW 450 NCsoft Corp 142,425.32 162,882.91 1.54
932,840.78 820,515.55 7.75
MXN 30,000 Fomento Econom Mexic SAB de CV Units 1B & 4D Shares 229,405.07 254,971.17 2.40 TWD 13,000 MediaTek Inc 113,038.35 115,660.76 1.09 USD 2,500 Alibaba Group Holding Ltd ADR repr 1 Share 348,719.57 372,025.12 3.51 USD 2,950 Autohome Inc A spons AD repr 1 Share A 198,962.68 221,813.47 2.09 USD 2,000 Baidu Inc ADR repr 0.1 Share A 393,661.51 206,129.80 1.94 USD 6,600 Cognizant Tec Solutions Corp 397,283.44 367,413.72 3.46 USD 8,500 Ctrip.Com Intl Ltd ADR Repr 1/8 Shares 311,814.76 275,520.33 2.60 USD 26,000 Infosys Ltd spons ADR repr 1 Share 192,112.12 244,313.69 2.30 USD 7,500 Jardine Strategic Hgs Ltd 248,672.24 251,141.65 2.37 USD 900 Netease Inc ADR Repr 1 Share 239,175.69 202,154.21 1.91 USD 4,756 Newmont Goldcorp Corp Reg 154,369.08 160,677.37 1.51 USD 4,000 Oil Co Lukoil PJSC spons ADR repr 1 Share 266,537.58 296,548.70 2.80 USD 600 Samsung Electronics Co Ltd spons GDR repr 25 Shares 559,717.63 535,874.24 5.05 USD 10,500 Taiwan Semiconduct Mfg Co Ltd ADR repr 5 Shares 355,528.77 361,188.20 3.40 USD 7,200 Yandex NV A Reg 207,291.93 240,274.00 2.26 USD 6,400 Yum China Holdings Inc 214,856.98 259,664.53 2.45
4,088,703.98 3,994,739.03 37.65
ZAR 2,100 Naspers Ltd N 433,909.23 446,954.69 4.21
Total shares 9,398,355.99 9,351,696.20 88.15
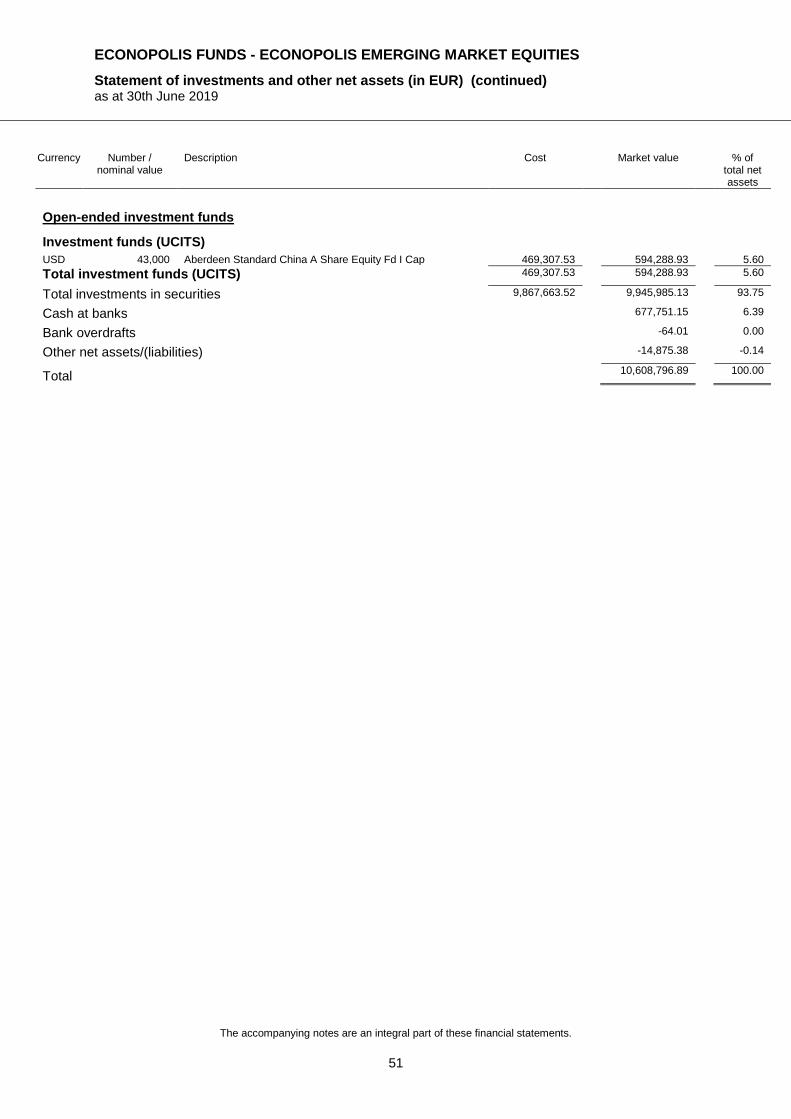
ECONOPOLIS FUNDS - ECONOPOLIS EMERGING MARKET EQUITIES
Statement of investments and other net assets (in EUR) (continued) as at 30th June 2019
The accompanying notes are an integral part of these financial statements.
51
Currency Number / nominal value
Description Cost Market value % of total net assets
Open-ended investment funds
Investment funds (UCITS)
USD 43,000 Aberdeen Standard China A Share Equity Fd I Cap 469,307.53 594,288.93 5.60
Total investment funds (UCITS) 469,307.53 594,288.93 5.60
Total investments in securities 9,867,663.52 9,945,985.13 93.75
Cash at banks 677,751.15 6.39
Bank overdrafts -64.01 0.00
Other net assets/(liabilities) -14,875.38 -0.14
Total 10,608,796.89 100.00

ECONOPOLIS FUNDS - ECONOPOLIS EMERGING MARKET EQUITIES
Industrial and geographical classification of investments as at 30th June 2019
52
Industrial classification
(in percentage of net assets)
Technologies 31.08 %
Cyclical consumer goods 15.03 %
Non-cyclical consumer goods 11.00 %
Financials 10.29 %
Energy 6.42 %
Industrials 5.87 %
Investment funds 5.60 %
Raw materials 4.03 %
Telecommunications services 2.43 %
Healthcare 2.00 %
Total 93.75 %
Geographical classification
(by domicile of the issuer) (in percentage of net assets)
Cayman Islands 18.09 %
South Korea 12.80 %
Hong Kong 11.81 %
China 8.78 %
United States of America 7.42 %
Luxembourg 5.60 %
The Netherlands 4.53 %
Taiwan 4.49 %
South Africa 4.21 %
Brazil 3.72 %
Russia 2.80 %
Indonesia 2.43 %
Mexico 2.40 %
Bermuda 2.37 %
India 2.30 %
Total 93.75 %

ECONOPOLIS FUNDS - ECONOPOLIS EMERGING MARKET EQUITIES
Statement of changes in investments from 1st January 2019 to 30th June 2019
53
Currency Description Purchases Sales Other
Shares
BRL CCR SA 0 75,000 0 BRL Localiza Rent A Car SA 0 16,000 0 BRL Odontoprev SA 0 22,000 0 BRL Ultrapar Participacoes SA 0 14,000 22,000 BRL Vale SA 0 17,000 0
EUR Unilever NV Certif of Shares 0 3,500 0
HKD AIA Group Ltd 6,000 16,000 0 HKD Anta Sports Products Ltd 0 23,000 0 HKD China Mobile Ltd 0 22,000 0 HKD CK Hutchison Holdings Ltd 0 14,000 0 HKD CNOOC Ltd 24,000 0 0 HKD Hengan Intl Group Co Ltd 17,600 0 0 HKD Ping An Ins Gr Co of China Ltd H 0 7,000 0 HKD Sunny Optical Tec Gr Co Ltd 8,000 13,000 0
IDR Telekom Indonesia (PT) Tbk Ser B 0 780,000 0
KRW LG Household & Health Care Ltd Pref 0 260 0 KRW NCsoft Corp 0 150 0 KRW Samsung Life Insurance Co Ltd 0 4,500 0
MXN Fomento Econom Mexic SAB de CV Units 1B & 4D Shares
0 25,000 0
TWD MediaTek Inc 13,000 0 0
USD Alibaba Group Holding Ltd ADR repr 1 Share 1,100 600 0 USD Autohome Inc A spons AD repr 1 Share A 1,150 0 0 USD Cognizant Tec Solutions Corp 2,200 0 0 USD Goldcorp Inc 0 0 -14,500 USD Infosys Ltd spons ADR repr 1 Share 0 10,000 0 USD Jardine Strategic Hgs Ltd 0 5,500 0 USD Newmont Goldcorp Corp Reg 0 0 4,756 USD Oil Co Lukoil PJSC spons ADR repr 1 Share 1,000 0 0 USD Taiwan Semiconduct Mfg Co Ltd ADR repr 5 Shares 0 9,900 0 USD Yandex NV A Reg 0 4,000 0
ZAR Multichoice Group LTD Reg 0 2,700 2,700 ZAR Naspers Ltd N 0 600 0

ECONOPOLIS FUNDS - ECONOPOLIS GLOBAL BONDS
Statement of net assets (in EUR) as at 30th June 2019
The accompanying notes are an integral part of these financial statements.
54
Assets Securities portfolio at market value 22,469,400.65 Cash at banks 1,806,178.54 Formation expenses, net 6,835.92 Income receivable on portfolio 180,185.50
Total assets 24,462,600.61
Liabilities Bank overdrafts 79.96 Expenses payable 33,779.01
Total liabilities 33,858.97
Net assets at the end of the period 24,428,741.64
Breakdown of net assets per share class
Share class Number of
shares
Currency of
share class
NAV per share in currency of
share class
Net assets per share class
(in EUR)
I Cap EUR 171,076.2138 EUR 100.93 17,266,000.72 I Dis EUR 42,334.0000 EUR 100.78 4,266,413.10 O Cap EUR 28,500.0000 EUR 101.63 2,896,327.82
24,428,741.64

ECONOPOLIS FUNDS - ECONOPOLIS GLOBAL BONDS
Statistical information (in EUR) as at 30th June 2019
(*) Net asset value used for final redemption.
The accompanying notes are an integral part of these financial statements.
55
Total net assets Currency 31.12.2018 30.06.2019
EUR 19,450,214.07 24,428,741.64
Net asset value per share
Currency 31.12.2018 30.06.2019
I Cap EUR EUR 98.85 100.93 I Dis EUR EUR - 100.78 O Cap EUR EUR 99.37 101.63
Number of shares outstanding at the
beginning of the period
issued redeemed outstanding at the end of the period
I Cap EUR 170,126.2138 950.0000 - 171,076.2138 I Dis EUR - 45,094 -2,760 42,334 O Cap EUR 26,500.0000 2,000.0000 - 28,500.0000

ECONOPOLIS FUNDS - ECONOPOLIS GLOBAL BONDS
Statement of investments and other net assets (in EUR) as at 30th June 2019
The accompanying notes are an integral part of these financial statements.
56
Currency Number / nominal value
Description Cost Market value % of total net assets
Investments in securities
Transferable securities admitted to an official stock exchange listing
Bonds
CZK 3,500,000 Czech Republic 0% Ser 102 Sen 17/24.02.22 129,820.84 132,271.18 0.54 CZK 4,000,000 Czech Republic 1.5% Ser 6Y 13/29.10.19 157,936.44 157,078.83 0.64 CZK 2,000,000 Czech Republic 3.85% Ser 61 10/29.09.21 85,275.64 82,846.45 0.34
373,032.92 372,196.46 1.52
EUR 250,000 Akzo Nobel NV 2.625% EMTN Sen 12/27.07.22 270,325.00 271,136.25 1.11 EUR 500,000 Alfa Laval Treasury Intl AB FRN EMTN Reg S Ser 1
14/12.09.19 502,585.00 500,440.00 2.05
EUR 200,000 Amadeus Capital Market 0.125% EMTN Reg S Sen 16/06.10.20 200,590.00 200,628.00 0.82 EUR 300,000 Amadeus Capital Market 1.625% EMTN Reg S Sen 15/17.11.21 312,514.00 311,191.50 1.27 EUR 100,000 Anglo American Capital Plc 1.5% EMTN Reg S Sen 15/01.04.20 100,080.00 101,077.00 0.41 EUR 350,000 Anglo American Capital Plc 3.5% EMTN 12/28.03.22 380,766.50 382,784.50 1.57 EUR 500,000 Arcelik AS 3.875% Reg S Sen 14/16.09.21 530,210.00 512,452.50 2.10 EUR 200,000 AT&T Inc 2.65% Sen 13/17.12.21 215,602.00 212,105.00 0.87 EUR 400,000 Befimmo SA 2.175% EMTN Ser 1059 Sen 17/12.04.27 400,200.00 401,956.00 1.65 EUR 200,000 Befimmo SA FRN Sen 15/21.04.22 201,300.00 200,500.00 0.82 EUR 200,000 Bekaert SA 5% EMTN 11/06.12.19 204,695.40 204,116.00 0.84 EUR 650,000 Bharti Airtel Intl Netherld BV 3.375% 14/20.05.21 692,205.50 683,127.25 2.80 EUR 650,000 BNG Bank NV FRN EMTN Sen 11/09.02.21 657,796.00 655,934.50 2.69 EUR 100,000 Booking Holdings Inc 1.8% Sen 15/03.03.27 101,720.00 108,348.50 0.44 EUR 150,000 British Telecommunications Plc 2.125% EMTN 20188
18/26.09.28 158,850.00 162,219.00 0.66
EUR 200,000 Cofinimmo SICAFI SA 1.929% Sen 15/25.03.22 203,850.00 204,032.00 0.84 EUR 200,000 D S Smith Plc 1.375% EMTN Ser 2 Sen Reg S 17/26.07.24 196,194.00 204,694.00 0.84 EUR 400,000 D S Smith Plc 2.25% EMTN Reg S Sen 15/16.09.22 424,884.00 422,524.00 1.73 EUR 200,000 Daimler Intl Fin BV 0.625% EMTN 19/27.02.23 200,172.00 203,565.00 0.83 EUR 400,000 EP Energy AS 5.875% Sen Reg S 12/01.11.19 430,415.00 408,004.00 1.67 EUR 300,000 Espana ILB Sen 16/30.11.21 326,083.70 324,558.49 1.33 EUR 700,000 Flowserve Corp 1.25% Reg S Sen 15/17.03.22 701,901.60 707,259.00 2.90 EUR 200,000 Fluvius Syst Operator 2% Sen Pr 1069 17/23.06.25 211,460.00 214,629.00 0.88 EUR 200,000 Fluvius Syst Operator 2.75% EMTN Sen 12/30.11.22 219,832.00 219,367.00 0.90 EUR 450,000 Fluvius Syst Operator 4.25% Sen Reg S 10/30.12.20 485,798.68 477,596.25 1.96 EUR 350,000 Fresenius Finance Ireland PLC 0.875% Reg S Sen 17/31.01.22 353,512.50 357,201.25 1.46 EUR 200,000 Fresenius Finance Ireland PLC 3% Reg S Sen 17/30.01.32 198,970.00 229,267.00 0.94 EUR 200,000 Fresenius SE & Co KGaA 2.875% EMTN 10Y Sen Reg S
19/15.02.29 198,328.00 228,435.00 0.94
EUR 430,000 GIMV NV 3.5% EMTN Sen 19/05.07.31 437,150.00 438,888.10 1.80 EUR 200,000 Hochtief AG 3.875% Sen 13/20.03.20 214,054.00 205,714.00 0.84 EUR 300,000 Hungary 3.875% EMTN Reg S Sen 05/24.02.20 321,000.00 308,415.00 1.26 EUR 400,000 Indonesia 2.875% GMTN Reg S Ser 12 14/08.07.21 424,598.00 422,776.00 1.73 EUR 500,000 K+S Aktiengesellschaft 3% EMTN 12/20.06.22 533,435.00 537,292.50 2.20 EUR 600,000 Kinepolis Group NV 2.9 % Sen Reg S 17/15.12.27 598,404.00 611,916.00 2.50 EUR 254,000 La Lorraine Bakery Group NV 4% Sen 13/23.12.20 262,964.68 262,348.98 1.07 EUR 100,000 Mexico 1.375% Sen 16/15.01.25 99,381.00 102,823.00 0.42 EUR 150,000 Mexico 1.875% 16/23.02.22 155,400.00 157,059.75 0.64 EUR 700,000 Nederlandse Waterschapsbank NV FRN EMTN Reg S
11/27.04.21 710,168.00 706,580.00 2.89
EUR 500,000 NV Bekaert SA 0% Conv Reg S Ser BEKB 16/09.06.21 440,290.00 472,035.00 1.93 EUR 200,000 Orpea SA 2.2% Sen 17/15.12.24 199,505.20 199,325.00 0.82 EUR 100,000 Orpea SA 2.625% EMTN Sen 18/10.03.25 99,300.00 104,143.00 0.43 EUR 150,000 Romania 2.375% EMTN Ser 2017-1 Sen Reg S 17/19.04.27 151,725.00 162,847.50 0.67 EUR 150,000 Romania 3.875% EMTN Reg S Ser 2015-2 15/29.10.35 147,300.00 172,218.75 0.71 EUR 200,000 Schneider Electric SE 0.25% EMTN Sen 16/09.09.24 193,522.00 202,694.00 0.83 EUR 200,000 Sky Ltd 1.5% EMTN Sen 14/15.09.21 207,858.00 207,154.00 0.85 EUR 200,000 Sky Ltd FRN EMTN Reg S Sen 15/01.04.20 202,020.00 200,849.00 0.82 EUR 100,000 Solvay SA 1.625% Reg S Sen 15/02.12.22 103,962.00 105,261.00 0.43 EUR 400,000 Teva Pharmaceutical Fin II BV 0.375% Reg S Sen 16/25.07.20 391,942.00 393,792.00 1.61

ECONOPOLIS FUNDS - ECONOPOLIS GLOBAL BONDS
Statement of investments and other net assets (in EUR) (continued) as at 30th June 2019
The accompanying notes are an integral part of these financial statements.
57
Currency Number / nominal value
Description Cost Market value % of total net assets
EUR 500,000 Toyota Motor Cred Corp 1% EMTN Reg S Sen 15/09.03.21 513,520.00 510,140.00 2.09 EUR 300,000 VGP SA 3.5% Sen Reg S 18/19.03.26 300,375.00 311,172.00 1.27 EUR 171,000 Vranken-Pommery Monopole 3.45% Sen 19/19.06.24 171,855.00 176,157.36 0.72
15,960,569.76 16,080,749.93 65.85
NOK 2,000,000 BMW Finance NV 1.5% EMTN Sen Reg S 17/18.01.21 208,710.69 205,481.14 0.84 NOK 2,000,000 Daimler Intl Fin BV 1.75% EMTN Ser 49 Sen Reg S 17/24.05.22 207,499.67 206,030.01 0.84 NOK 4,000,000 EIB 1% EMTN Ser 2225/0100 Sen 16/25.05.21 413,742.39 408,647.40 1.67 NOK 3,000,000 EIB 1.125% EMTN Reg S Sen 15/15.05.20 315,071.43 307,935.96 1.26 NOK 2,500,000 EIB 1.5% EMTN Sen 15/12.05.22 259,691.50 257,600.57 1.05
1,404,715.68 1,385,695.08 5.66
Total bonds 17,738,318.36 17,838,641.47 73.03
Transferable securities dealt in on another regulated market
Bonds
EUR 500,000 Argan 3.25% Sen 17/04.07.23 510,425.00 513,225.00 2.10 EUR 200,000 AT&T Inc FRN 18/05.09.23 202,234.00 202,617.00 0.83 EUR 600,000 Cofinimmo SA 2% Ser Program 1041 16/09.12.24 591,432.00 609,486.00 2.49 EUR 300,000 ImmoBel 3% Sen 17/01.06.22 308,166.00 308,638.50 1.26 EUR 100,000 Matexi NV 4.625% Sen 13/08.07.19 100,900.00 100,292.00 0.41 EUR 400,000 Molnlycke Holding AB 1.5% Reg S Sen 14/28.02.22 414,604.00 415,258.00 1.70 EUR 150,000 Romania 1.25% 16/26.02.21 152,977.23 152,730.75 0.63
Total bonds 2,280,738.23 2,302,247.25 9.42
Other transferable securities
Bonds
EUR 200,000 Duvel Moortgat SA 2.15% Tr 2026 Sen 18/05.06.26 200,000.00 215,240.00 0.88 EUR 200,000 Matexi NV 3.75% Sub Ser 995 16/22.06.23 200,200.00 200,430.00 0.82 EUR 200,000 Orchestra Premaman SA Step-down Sen 14/06.11.20 195,250.00 168,000.00 0.69
Total bonds 595,450.00 583,670.00 2.39
Open-ended investment funds
Investment funds (UCITS)
EUR 710 NN (L) Liquid SICAV EUR A Cap 872,793.85 871,560.50 3.57 EUR 6,300 Pictet SICAV Short Term Money Market I EUR Cap 874,555.11 873,281.43 3.57
Total investment funds (UCITS) 1,747,348.96 1,744,841.93 7.14
Total investments in securities 22,361,855.55 22,469,400.65 91.98
Cash at banks 1,806,178.54 7.39
Bank overdrafts -79.96 0.00
Other net assets/(liabilities) 153,242.41 0.63
Total 24,428,741.64 100.00

ECONOPOLIS FUNDS - ECONOPOLIS GLOBAL BONDS
Industrial and geographical classification of investments as at 30th June 2019
58
Industrial classification
(in percentage of net assets)
Financials 31.74 %
Countries and governments 8.91 %
Industrials 8.57 %
Cyclical consumer goods 7.40 %
Investment funds 7.14 %
Raw materials 6.31 %
Real estate 5.70 %
Telecommunications services 5.16 %
International institutions 3.98 %
Healthcare 3.80 %
Energy 1.67 %
Non-cyclical consumer goods 1.60 %
Total 91.98 %
Geographical classification
(by domicile of the issuer) (in percentage of net assets)
Belgium 22.75 %
The Netherlands 13.61 %
Luxembourg 11.12 %
United States of America 7.13 %
United Kingdom 6.88 %
France 5.59 %
Germany 3.98 %
Sweden 3.75 %
Spain 3.42 %
Czech Republic 3.19 %
Ireland 2.40 %
Turkey 2.10 %
Romania 2.01 %
Indonesia 1.73 %
Hungary 1.26 %
Mexico 1.06 %
Total 91.98 %

ECONOPOLIS FUNDS - ECONOPOLIS GLOBAL BONDS
Statement of changes in investments from 1st January 2019 to 30th June 2019
59
Currency Description Purchases Sales
Bonds
CZK Czech Republic 0% Ser 102 Sen 17/24.02.22 3,500,000 0
EUR Akzo Nobel NV 2.625% EMTN Sen 12/27.07.22 250,000 0 EUR Amadeus Capital Market 1.625% EMTN Reg S Sen 15/17.11.21 200,000 0 EUR Anglo American Capital Plc 1.5% EMTN Reg S Sen 15/01.04.20 100,000 0 EUR Befimmo SA 2.175% EMTN Ser 1059 Sen 17/12.04.27 400,000 0 EUR Befimmo SA FRN Sen 15/21.04.22 200,000 0 EUR Bekaert SA 5% EMTN 11/06.12.19 200,000 0 EUR Bharti Airtel Intl Netherld BV 3.375% 14/20.05.21 150,000 0 EUR BNG Bank NV FRN EMTN Sen 11/09.02.21 650,000 0 EUR Booking Holdings Inc 1.8% Sen 15/03.03.27 0 200,000 EUR British Telecommunications Plc 1.125% EMTN Reg S 14/10.06.19 0 500,000 EUR British Telecommunications Plc 2.125% EMTN 20188 18/26.09.28 150,000 0 EUR Cofinimmo SICAFI SA 1.929% Sen 15/25.03.22 100,000 0 EUR D S Smith Plc 1.375% EMTN Ser 2 Sen Reg S 17/26.07.24 100,000 0 EUR Daimler Intl Fin BV 0.625% EMTN 19/27.02.23 200,000 0 EUR Dredging Env & Marine Engineer 4.145% Sen 13/14.02.19 0 600,000 EUR Flowserve Corp 1.25% Reg S Sen 15/17.03.22 300,000 0 EUR Fluvius Syst Operator 2% Sen Pr 1069 17/23.06.25 200,000 0 EUR Fluvius Syst Operator 4.25% Sen Reg S 10/30.12.20 250,000 0 EUR Fresenius Finance Ireland PLC 3% Reg S Sen 17/30.01.32 200,000 0 EUR Fresenius SE & Co KGaA 2.875% EMTN 10Y Sen Reg S 19/15.02.29 300,000 100,000 EUR GIMV NV 3.5% EMTN Sen 19/05.07.31 430,000 0 EUR Hochtief AG 2.625% Sen 14/28.05.09 0 300,000 EUR ImmoBel 3% Sen 17/01.06.22 100,000 0 EUR La Lorraine Bakery Group NV 4% Sen 13/23.12.20 254,000 0 EUR Matexi NV 3.75% Sub Ser 995 16/22.06.23 200,000 0 EUR Matexi NV 4.625% Sen 13/08.07.19 100,000 0 EUR Nederlandse Waterschapsbank NV FRN EMTN Reg S 11/27.04.21 550,000 0 EUR NV Bekaert SA 0% Conv Reg S Ser BEKB 16/09.06.21 200,000 0 EUR Orpea SA 2.625% EMTN Sen 18/10.03.25 100,000 0 EUR Romania 1.25% 16/26.02.21 150,000 0 EUR Romania 2.375% EMTN Ser 2017-1 Sen Reg S 17/19.04.27 150,000 0 EUR Romania 3.875% EMTN Reg S Ser 2015-2 15/29.10.35 150,000 0 EUR Solvay Finance France SA VAR Reg S Sub 13/12.05.Perpetual 0 300,000 EUR Solvay SA 1.625% Reg S Sen 15/02.12.22 100,000 0 EUR Teva Pharmaceutical Fin II BV 0.375% Reg S Sen 16/25.07.20 200,000 0 EUR Uruguay 7% Sen 03/28.06.19 0 100,000 EUR Vranken-Pommery Monopole 3.45% Sen 19/19.06.24 171,000 0
NOK EIB 1.5% EMTN Sen 15/12.05.22 2,500,000 0
SEK EIB 2.25% EMTN Sen Reg S 14/12.03.19 0 170,000
Investment funds (UCITS)
EUR NN (L) Liquid SICAV EUR A Cap 405 0 EUR Pictet SICAV Short Term Money Market I EUR Cap 3,600 0

ECONOPOLIS FUNDS - ECONOPOLIS BELGIAN CHAMPIONS
Statement of net assets (in EUR) as at 30th June 2019
The accompanying notes are an integral part of these financial statements.
60
Assets Securities portfolio at market value 19,045,845.90 Cash at banks 893,338.52 Formation expenses, net 15,362.51 Receivable on issues of shares 170,145.01 Income receivable on portfolio 6,149.92
Total assets 20,130,841.86
Liabilities Payable on purchases of securities 271,327.66 Expenses payable 81,060.97
Total liabilities 352,388.63
Net assets at the end of the period 19,778,453.23
Breakdown of net assets per share class
Share class Number of
shares
Currency of
share class
NAV per share in currency of
share class
Net assets per share class
(in EUR)
A Cap EUR 152,524.9460 EUR 106.74 16,280,644.95 A Dis EUR 32,770.5836 EUR 106.74 3,497,808.28
19,778,453.23

ECONOPOLIS FUNDS - ECONOPOLIS BELGIAN CHAMPIONS
Statistical information (in EUR) as at 30th June 2019
The accompanying notes are an integral part of these financial statements.
61
Total net assets Currency 31.12.2018 30.06.2019
EUR 7,258,739.71 19,778,453.23
Net asset value per share
Currency 31.12.2018 30.06.2019
A Cap EUR EUR 96.08 106.74 A Dis EUR EUR 96.07 106.74
Number of shares outstanding at the
beginning of the period
issued redeemed outstanding at the end of the period
A Cap EUR 64,361.6794 95,811.0296 -7,647.7630 152,524.9460 A Dis EUR 11,190.8685 23,932.5357 -2,352.8206 32,770.5836

ECONOPOLIS FUNDS - ECONOPOLIS BELGIAN CHAMPIONS
Statement of investments and other net assets (in EUR) as at 30th June 2019
The accompanying notes are an integral part of these financial statements.
62
Currency Number / nominal value
Description Cost Market value % of total net assets
Investments in securities
Transferable securities admitted to an official stock exchange listing
Shares
EUR 4,700 Ackermans & Van Haaren SA 654,209.44 619,930.00 3.13 EUR 14,600 Ageas NV 596,294.84 667,366.00 3.37 EUR 16,500 Anheuser-Busch InBev SA 1,135,674.84 1,284,360.00 6.49 EUR 7,000 Argenx SE 791,815.66 862,400.00 4.36 EUR 47,500 Bekaert SA 1,113,482.00 1,120,050.00 5.66 EUR 88,000 Bpost SA 927,162.00 733,568.00 3.71 EUR 7,260 Cie Francois d'Entreprises 651,739.69 605,484.00 3.06 EUR 550 Cie Mob et Fon du Bois Sauvage 210,779.00 200,750.00 1.02 EUR 4,725 Elia Syst Operator SA NV 281,691.44 306,180.00 1.55 EUR 12,000 EVS Broadcast Equipment SA 282,775.20 245,400.00 1.24 EUR 45,000 Fagron SA 719,622.09 802,800.00 4.06 EUR 9,700 Galapagos Genomics NV 868,886.62 1,100,465.00 5.56 EUR 6,510 Groupe Bruxelles Lambert SA 512,314.23 561,682.80 2.84 EUR 2,230 Jensen-Group NV 76,562.39 72,252.00 0.37 EUR 10,000 KBC Ancora CVA 417,170.00 393,000.00 1.99 EUR 9,490 KBC Group SA 573,393.51 547,003.60 2.77 EUR 16,000 Kinepolis Group NV 821,815.66 768,000.00 3.88 EUR 10,000 Koninklijke Ahold Delhaize NV 226,067.69 197,780.00 1.00 EUR 80 Lotus Bakeries NV 180,610.00 188,000.00 0.95 EUR 380 Miko NV 41,800.00 43,320.00 0.22 EUR 24,700 Mithra Pharmaceuticals SA Reg 669,705.92 637,754.00 3.22 EUR 15,500 Orange Belgium SA 272,320.58 270,320.00 1.37 EUR 46,000 Recticel SA 342,933.10 364,780.00 1.84 EUR 800 Resilux 112,867.02 108,000.00 0.55 EUR 18,200 Sioen Industries 452,926.37 436,800.00 2.21 EUR 3,200 Sipef SA 162,737.49 134,720.00 0.68 EUR 945 Sofina SA 162,423.39 158,382.00 0.80 EUR 17,475 Solvay SA 1,564,483.38 1,591,972.50 8.05 EUR 8,000 Tessenderlo Group NV Parts Soc 243,566.71 234,800.00 1.19 EUR 10,000 UCB 731,375.15 729,200.00 3.69 EUR 32,300 Umicore SA 1,010,435.76 910,860.00 4.61 EUR 11,500 VGP SA 841,863.67 837,200.00 4.23 EUR 23,460 X FAB Silicon Foundries SE Reg 112,108.54 116,127.00 0.59
Total shares 17,763,613.38 17,850,706.90 90.26
Closed-ended investment funds
EUR 10,910 Aedifica SICAFI Dist 878,338.15 915,349.00 4.63 EUR 2,450 Cofinimmo Dist 274,146.06 279,790.00 1.41
Total closed-ended investment funds 1,152,484.21 1,195,139.00 6.04
Total investments in securities 18,916,097.59 19,045,845.90 96.30
Cash at banks 893,338.52 4.52
Other net assets/(liabilities) -160,731.19 -0.82
Total 19,778,453.23 100.00

ECONOPOLIS FUNDS - ECONOPOLIS BELGIAN CHAMPIONS
Industrial and geographical classification of investments as at 30th June 2019
63
Industrial classification
(in percentage of net assets)
Healthcare 20.89 %
Industrials 20.17 %
Raw materials 16.68 %
Financials 15.99 %
Non-cyclical consumer goods 9.71 %
Real estate 4.23 %
Cyclical consumer goods 3.88 %
Technologies 1.83 %
Utilities 1.55 %
Telecommunications services 1.37 %
Total 96.30 %
Geographical classification
(by domicile of the issuer) (in percentage of net assets)
Belgium 90.94 %
The Netherlands 5.36 %
Total 96.30 %

ECONOPOLIS FUNDS - ECONOPOLIS BELGIAN CHAMPIONS
Statement of changes in investments from 1st January 2019 to 30th June 2019
64
Currency Description Purchases Sales Other
Shares
EUR Ackermans & Van Haaren SA 3,290 0 0 EUR Ageas NV 13,070 5,500 0 EUR Anheuser-Busch InBev SA 15,500 4,000 0 EUR Argenx SE 13,325 8,080 0 EUR Barco NV 2,500 4,420 0 EUR Bekaert SA 41,500 0 0 EUR Bpost SA 88,000 0 0 EUR Cie Francois d'Entreprises 4,400 0 0 EUR Cie Mob et Fon du Bois Sauvage 410 0 0 EUR Elia Syst Operator SA NV 1,100 0 525 EUR EVS Broadcast Equipment SA 12,000 0 0 EUR Fagron SA 50,660 18,500 0 EUR Galapagos Genomics NV 7,240 1,200 0 EUR Groupe Bruxelles Lambert SA 3,200 0 0 EUR Jensen-Group NV 1,100 0 0 EUR KBC Ancora CVA 10,000 0 0 EUR KBC Group SA 8,200 6,000 0 EUR Kinepolis Group NV 10,290 0 0 EUR Koninklijke Ahold Delhaize NV 1,240 3,900 0 EUR Lotus Bakeries NV 40 0 0 EUR Melexis NV 1,400 5,000 0 EUR Mithra Pharmaceuticals SA Reg 22,425 0 0 EUR Orange Belgium SA 8,270 0 0 EUR Proximus SA 5,800 13,840 0 EUR Recticel SA 80,839 44,839 0 EUR Resilux 500 0 0 EUR Sioen Industries 12,710 0 0 EUR Sipef SA 2,861 0 0 EUR Sofina SA 200 0 0 EUR Solvay SA 17,975 5,750 0 EUR Tessenderlo Group NV Parts Soc 3,800 0 0 EUR UCB 8,900 3,000 0 EUR Umicore SA 23,300 0 0 EUR VGP SA 14,500 4,255 0 EUR X FAB Silicon Foundries SE Reg 6,000 10,000 0
Closed-ended investment funds
EUR Aedifica SICAFI Dist 8,856 0 1,014 EUR Cofinimmo Dist 1,500 0 0
Warrants and rights
EUR Aedifica SICAFI Droits de sousc 02.05.19 2 0 -2

ECONOPOLIS FUNDS - ECONOPOLIS TOTAL RETURN
Statistical information (in EUR) as at 26th March 2019
The accompanying notes are an integral part of these financial statements.
65
Total net assets Currency 31.12.2017 31.12.2018 26.03.2019
EUR 75,966,539.27 65,654,607.30 0.00
Net asset value per share
Currency 31.12.2017 31.12.2018 26.03.2019
I Cap EUR EUR 103.69 99.84 102.37 (*) I Dis EUR EUR 102.84 97.14 99.60 (*)
Number of shares outstanding at the
beginning of the period
issued redeemed outstanding at the end of the period
I Cap EUR 262,121.0005 - -262,121.0005 - I Dis EUR 406,489.0000 - -406,489.0000 -
(*) Valeur Nette d’Inventaire pour le rachat final

ECONOPOLIS FUNDS - ECONOPOLIS TOTAL RETURN
Statement of changes in investments from 1st January 2019 to 26th March 2019
66
Currency Description Purchases Sales
Shares
CHF Givaudan SA Reg 0 206 CHF Roche Holding Ltd Pref 0 2,171
DKK Novo Nordisk AS B 0 9,942
EUR Arkema 0 3,853 EUR Cie de Saint-Gobain SA 2,500 12,500 EUR GrandVision NV 0 24,300 EUR Henkel AG & Co KGaA Pref 0 4,651 EUR Kion Group AG 2,850 2,850 EUR Koninklijke Ahold Delhaize NV 0 25,200 EUR Koninklijke DSM NV 0 5,375 EUR LVMH Moët Hennessy L Vuit SE 0 693 EUR NN Group NV 0 13,114 EUR Nokia Oyj 33,000 33,000 EUR SAP SE 0 5,007 EUR Schneider Electric SE 0 7,127 EUR Siemens AG Reg 0 2,700 EUR Unilever NV Certif of Shares 0 8,500 EUR Veolia Environnement SA 0 26,500 EUR Vopak NV 0 10,000
GBP D S Smith Plc 15,000 100,000
JPY Toyota Motor Corp 0 5,900
NOK Telenor ASA 0 26,057
USD Allergan Plc 0 3,000 USD Cisco Systems Inc 0 10,500 USD Colgate-Palmolive Co 0 5,900 USD Microsoft Corp 300 4,500 USD Mondelez Intl Inc 4,250 9,250 USD Pepsico Inc 0 5,100 USD Schlumberger Ltd 0 8,110 USD Varian Medical Systems Inc 0 4,289
Investment certificates
USD iShares Physical Metals Plc Certif Gold Perpetual 57,100 57,100
Bonds
AUD Australia ILB Ser CAIN407 09/20.09.25 0 500,000
BRL Intl Finance Corp 7.5% EMTN Ser 1718 Sen 17/09.05.22 0 2,000,000
CAD Canada 0.75% Ser G658 Sen 17/01.05.19 0 1,550,000
CZK Czech Republic 0% Ser 101 Sen 17/10.02.20 0 3,000,000 CZK Czech Republic 0.75% Ser 104 18/23.02.21 7,500,000 7,500,000

ECONOPOLIS FUNDS - ECONOPOLIS TOTAL RETURN
Statement of changes in investments (continued) from 1st January 2019 to 26th March 2019
67
Currency Description Purchases Sales
EUR Air Liquide Finance 1.25% EMTN Reg S Sen 15/03.06.25 0 1,100,000 EUR Air Liquide Finance 1.25% EMTN Reg S Sen 16/13.06.28 0 200,000 EUR Akzo Nobel NV 2.625% EMTN Sen 12/27.07.22 0 1,250,000 EUR Anglo American Capital Plc 2.875% EMTN Sen 13/20.11.20 0 600,000 EUR Anglo American Capital Plc 3.5% EMTN 12/28.03.22 300,000 300,000 EUR Arcelik AS 3.875% Reg S Sen 14/16.09.21 0 400,000 EUR Argan 3.25% Sen 17/04.07.23 0 900,000 EUR Befimmo SA FRN Sen 15/21.04.22 200,000 700,000 EUR Bekaert SA 5% EMTN 11/06.12.19 0 200,000 EUR Booking Holdings Inc 0.8% Sen 17/10.03.22 0 200,000 EUR Booking Holdings Inc 1.8% Sen 15/03.03.27 0 600,000 EUR Cofinimmo SICAFI SA 1.929% Sen 15/25.03.22 0 600,000 EUR Czech Republic 3.875% EMTN 12/24.05.22 0 1,000,000 EUR Deutschland 0.5% Sen 15/15.02.25 0 300,000 EUR Deutschland ILB Ser I/L 09/15.04.20 0 900,000 EUR Deutschland ILB Ser I/L 12/15.04.23 400,000 1,100,000 EUR Electricité de France VAR EMTN Sub 13/29.01.Perpetual 0 800,000 EUR Engie SA 2.625% EMTN Sen 12/20.07.22 0 800,000 EUR Espana ILB Sen 14/30.11.24 0 1,300,000 EUR Espana ILB Sen 15/30.11.30 0 700,000 EUR Espana ILB Sen 16/30.11.21 0 200,000 EUR Flemish Community 0.375% EMTN Reg S Sen 16/13.10.26 0 100,000 EUR Flowserve Corp 1.25% Reg S Sen 15/17.03.22 0 700,000 EUR France 0% 18/25.03.24 0 1,500,000 EUR France ILB OAT 13/25.07.24 0 300,000 EUR France ILB Ser OAT 11/25.07.27 0 700,000 EUR France ILB T-Bonds Reg S Ser OATe 16/01.03.21 0 200,000 EUR Fresenius Finance Ireland PLC 0.875% Reg S Sen 17/31.01.22 0 400,000 EUR Fresenius Finance Ireland PLC 1.5% Reg S Sen 17/30.01.24 0 200,000 EUR Fresenius Finance Ireland PLC 3% Reg S Sen 17/30.01.32 0 500,000 EUR Hochtief AG 3.875% Sen 13/20.03.20 0 400,000 EUR ImmoBel 3% Sen 17/01.06.22 200,000 300,000 EUR K+S Aktiengesellschaft 4.125% Reg S Sen Tr 2 13/06.12.21 0 200,000 EUR Kinepolis Group NV 2.4% Sen 17/15.12.25 0 100,000 EUR Kraft Heinz Foods Co 1.5% Reg S Sen 16/24.05.24 0 300,000 EUR Kraft Heinz Foods Co 2% Sen 15/30.06.23 0 200,000 EUR La Lorraine Bakery Group NV 4% Sen 13/23.12.20 0 300,000 EUR Matexi NV 3.75% Sub Ser 995 16/22.06.23 0 300,000 EUR Mexico 1.375% Sen 16/15.01.25 0 200,000 EUR Mexico 1.625% EMTN Sen 15/06.03.24 0 800,000 EUR Mexico 4% Sen 15/15.03.15 0 100,000 EUR Molnlycke Holding AB 1.5% Reg S Sen 14/28.02.22 0 800,000 EUR Naturgy Capital Mks SA 5.375% EMTN 11/24.05.19 0 500,000 EUR Neste Corporation 4% Sen 12/18.09.19 0 500,000 EUR NN Group NV VAR EMTN Sub 14/13.06.Perpetual 150,000 150,000 EUR Oesterreich 0% Reg S Sen 16/15.07.23 0 250,000 EUR Orpea SA 2.2% Sen 17/15.12.24 0 300,000 EUR Poland 0.875% EMTN Reg S Ser 40 15/14.10.21 0 1,000,000 EUR Sappi Papier Holdings GmbH 4% Reg S Sen 16/01.04.23 0 700,000 EUR Schneider Electric SE 0.25% EMTN Sen 16/09.09.24 0 1,000,000 EUR Siemens Financieringsmaatsc NV 2.875% EMTN Sen 13/10.03.28 0 600,000 EUR Slovakia 0% Ser 230 16/13.11.23 0 400,000 EUR Solvay SA 1.625% Reg S Sen 15/02.12.22 200,000 400,000 EUR South Africa 3.75% 14/24.07.26 0 300,000 EUR Ste Autoroute Paris-Rhin-Rhone 4.875% EMTN 11/21.01.19 0 200,000 EUR Telenor ASA 2.75% EMTN Sen 12/27.06.22 0 1,000,000 EUR Tesco Plc 1.375% EMTN Sen 14/01.07.19 0 700,000 EUR Teva Pharmaceutical Fin II BV 1.125% Reg S Sen 16/15.10.24 0 400,000 EUR UCB 4.125% EMTN Sen 13/04.01.21 0 400,000 EUR UCB 5.125% EMTN 13/02.10.23 0 400,000 EUR Uruguay 7% Sen 03/28.06.19 0 100,000 EUR Valeo SA 3.25% EMTN Sen 14/22.01.24 0 700,000 EUR VGP SA 3.5% Sen Reg S 18/19.03.26 0 250,000 EUR Voestalpine VAR EMTN Sub Ser 2 13/31.10.Perpetual 0 400,000
GBP United Kingdom 1.5% T-Stock Sen 15/22.01.21 200,000 200,000 GBP United Kingdom 1.75% T Stock 12/07.09.22 0 800,000

ECONOPOLIS FUNDS - ECONOPOLIS TOTAL RETURN
Statement of changes in investments (continued) from 1st January 2019 to 26th March 2019
68
Currency Description Purchases Sales
GBP United Kingdom 1.75% T-Stock 13/22.07.19 0 400,000
MXN EIB 7.5% EMTN Reg S Sen 17/09.06.22 0 7,000,000 MXN IBRD 0% Ser GDIF 07/19.09.22 0 15,000,000
NOK Norway 3% Ser 476 14/14.03.24 0 5,000,000 NOK Norway 3.75% 10/25.05.21 0 7,800,000
PLN Poland 1.5% Ser PS0420 15/25.04.20 0 1,000,000
USD Booking Holdings Inc 3.6% Sen 16/01.06.26 0 500,000 USD Diageo Capital Plc 2.625% Sen 13/29.04.23 0 700,000 USD HCA Inc 5.875% Sen 12/15.03.22 200,000 200,000 USD Hungary 6.375% Sen 11/29.03.21 0 400,000 USD Lenovo Group Ltd 4.7% Reg S Sen 14/08.05.19 0 200,000 USD Microsoft Corp 3.75% Sen 15/12.02.45 500,000 500,000 USD US 1.125% Ser AX-2019 Sen 17/28.02.19 0 1,700,000 USD US 1.5% T-Notes Ser H-2023 16/28.02.23 750,000 1,750,000 USD US 2% T-Notes 15/15.08.25 0 1,000,000 USD US 2.25% T-Bonds Sen 16/15.08.46 1,000,000 1,000,000 USD US ILB T-Notes Lk Inflation Index 14/15.01.24 250,000 250,000 USD US ILB T-Notes Ser X-2020 15/15.04.20 0 1,100,000
Investment funds (UCITS)
EUR NN (L) Liquid SICAV EUR A Cap 2,200 2,200

ECONOPOLIS FUNDS
Notes to the financial statements as at 30th June 2019
69
Note 1 - General information ECONOPOLIS FUNDS (the "SICAV") is an Investment Company with Variable Capital (Société d'Investissement à Capital Variable) with multiple Sub-Funds incorporated on 30th January 2013 under the laws of Luxembourg for an unlimited duration. The SICAV is governed under the Council Directive 2009/65/EC as amended and the provisions of Part I of the law of 17th December 2010 as amended. At the end of each financial year ended on 31st December, the SICAV publishes an annual report audited by the Independent Auditor, as well as, at the end of each semester, an unaudited semi-annual report. These financial reports include, amongst other items, separate financial statements drawn up for each Sub-Fund. The Net Asset Value, issue, redemption and conversion price of each class of shares are available every full bank working day in Luxembourg at the SICAV’s registered office. The following documents are made available to the public at the registered office of the SICAV and at the registered office of the Management Company:
- The Prospectus of the SICAV, including the Articles of Incorporation and the fact sheets, - The key investor information documents (“KIID”) of the SICAV, (also published on
www.conventum.lu), - The financial reports of the SICAV.
The complaints handling procedure setup in accordance with the CSSF Regulation relating to the out-of-court resolution of complaints is available at the SICAV’s registered office free of charge upon request. Note 2 - Significant accounting policies a) Presentation of the financial statements The financial statements of the SICAV are prepared in accordance with Luxembourg legal and regulatory requirements concerning undertakings for collective investment in transferable securities and with generally accepted accounting principles in Luxembourg. b) Valuation of assets The value of any cash on hand or on deposit, notes and bills payable on demand and accounts receivable, prepaid expenses and cash dividends and interest declared or accrued but not yet collected, shall be deemed the full amount thereof, unless it is improbable that it can be collected; in which case, the value thereof will be arrived at after deducting such amounts as the Board of Directors may consider appropriate to reflect the true value of these assets. All transferable securities and money market instruments quoted or dealt in on an official stock exchange or on any other Regulated Market will be valued at the last price known in Luxembourg on the applicable Valuation Day and, if the relevant transferable security and money market instrument is traded on several markets, on the basis of the last known price on the main market of this security. If the last known price is not representative, valuation will be based on the fair value at which it is expected it can be resold, as determined with prudence and in good faith by the Board of Directors. Futures contracts are valued based on their closing price the previous day on the market concerned. Prices used are settlement prices on forward markets.

ECONOPOLIS FUNDS
Notes to the financial statements (continued) as at 30th June 2019
70
Unlisted securities or securities not traded on a stock exchange or any other Regulated Market, will be valued based on the fair value at which it is expected they can be resold, as determined with prudence and in good faith by the Board of Directors. Securities denominated in a currency other than the Sub-Fund's reference currency will be translated at the average exchange rate of the currency concerned. Shares or units of UCITS and other UCIs will be valued on the basis of their last available net asset value as reported by such undertakings. c) Acquisition cost of securities in the portfolio The acquisition cost of the securities held by each Sub-Fund that are denominated in currencies other than the reference currency of the Sub-Fund is converted into this currency at the exchange rate prevailing on the date of purchase. d) Net realised gain/(loss) on securities portfolio The realised gains and losses on sales of securities portfolio are calculated on the basis of the average acquisition cost. e) Investment portfolio income Dividend income is recorded at the ex-date, net of any withholding tax. Interest income accrued is recorded, net of any withholding tax. f) Return on Sukuk Sukuk are certificates of investments or securities representing the rights and obligations of its holders on an underlying asset. Their remuneration (which is capped) is based on performance of the assets. The remuneration of sukuk is variable depending on the profits earned on the assets or on the income of the issuer. g) Valuation of forward foreign exchange contracts Open forward foreign exchange contracts are valued at forward market rates for the remaining period from valuation date to the maturity of the contracts. Net unrealised gain or loss of open contracts is disclosed in the statement of net assets. h) Valuation of futures contracts Open futures contracts are valued at the last settlement or close price on the stock exchanges or regulated markets. Unrealised gains or losses of open contracts are disclosed in the statement of net assets. i) Formation expenses Formation expenses are amortised on a straight line basis over a period of five years. If the launch of a Sub-Fund occurs after the launch date of the Fund, the formation expenses related to the launch of the new Sub-Fund is charged to such Sub-Fund alone and may be amortised over a maximum of five years with effect as from the Sub-Fund’s launch date.

ECONOPOLIS FUNDS
Notes to the financial statements (continued) as at 30th June 2019
71
j) Conversion of foreign currencies Cash at banks, other net assets, liabilities and the market value of the securities in portfolio expressed in currencies other than the reference currency of the Sub-Fund are converted into this currency at the exchange rate prevailing on the date of the report. Income and expenses expressed in currencies other than the reference currency of the Sub-Fund are converted into this currency at the exchange rate prevailing on the date of the transaction. k) Combined financial statements The combined financial statements of the Company are expressed in EUR and are equal to the sum of the corresponding items in the financial statements of each Sub-Funds converted into this currency at the exchange rates prevailing at the of the financial statements. Note 3 - Global fee Since 27th March 2019, for all the share classes of the Sub-Funds of the SICAV, except for O share classes, following Investment Management Fee is applicable:
Name of the sub-fund Share Class
Global fees Management company fees
ECONOPOLIS FUNDS - ECONOPOLIS PATRIMONIAL SUSTAINABLE
A 1.20 % p.a. -0.04% p.a. on the net assets of the SICAV payable quarterly during the month following the end of the relevant quarter -A flat fee of EUR 96.000 p.a. for the SICAV(with eight Sub-Funds) payable quarterly during the month following the end of the relevant quarter
B 1.20% p.a.
I 0.70% p.a.
ECONOPOLIS FUNDS - ECONOPOLIS PATRIMONIAL EMERGING
A 1.50 % p.a.
B 1.50% p.a.
I 0.90% p.a.
ECONOPOLIS FUNDS - ECONOPOLIS TOTAL RETURN (until 26th March)
A 1.00% p.a.
B 1.00% p.a.
I 0.60% p.a.
ECONOPOLIS FUNDS - GLOBAL EQUITIY
A 1.45% p.a.
B 1.45% p.a.
I 0.85% p.a.
ECONOPOLIS FUNDS - ECONOPOLIS EM GOVERNMENT BONDS
A 1.20% p.a.
B 1.20% p.a.
I 0.65% p.a.
ECONOPOLIS FUNDS - ECONOPOLIS EMERGING MARKET EQUITIES
A 1.40% p.a.
B 1.40% p.a.
I 0.80% p.a.
ECONOPOLIS FUNDS - ECONOPOLIS GLOBAL BONDS
A 0.60% p.a.
B 0.60% p.a.
I 0.40% p.a.
ECONOPOLIS FUNDS - ECONOPOLIS SMART CONVICTIONS FUND
A 1.20% p.a.
B 1.20% p.a.
I 0.75% p.a.
ECONOPOLIS FUNDS - ECONOPOLIS BELGIAN CHAMPIONS
A 1.50% p.a.
B 1.50% p.a.
I 0.75% p.a.

ECONOPOLIS FUNDS
Notes to the financial statements (continued) as at 30th June 2019
72
The Global Fee, which includes the Management Company Fee and the Investment Management Fee, is payable quarterly and calculated on the average net assets of the Sub-Fund for the quarter in question. The Investment Management Fee is calculated by deducting the Management Company Fee from the Global Fee. No investment Management Fee is applicable to the O shares classes of each Sub-Fund. Until 26th March 2019: The Investment Management fee is calculated by deducting the Management Company fee from the global fee. No investment fee is applicable to the O share classes of each Sub-fund. The Management company Fee applicable to the O shares classes is indicated in the table below.
Name of the sub-fund Share Class
Global fees Management company fees
ECONOPOLIS FUNDS - ECONOPOLIS PATRIMONIAL SUSTAINABLE
A 1.20 % p.a. -0.04% p.a. on the net assets of the SICAV payable quarterly during the month following the end of the relevant quarter -A flat fee of EUR 108.000 p.a. for the SICAV(with nine sub funds) payable quarterly during the month following the end of the relevant quarter
B 1.20% p.a.
I 0.70% p.a. ECONOPOLIS FUNDS - ECONOPOLIS PATRIMONIAL EMERGING
A 1.50 % p.a.
B 1.50% p.a.
I 0.90% p.a. ECONOPOLIS FUNDS - ECONOPOLIS TOTAL RETURN
A 1.00% p.a.
B 1.00% p.a.
I 0.60% p.a. ECONOPOLIS FUNDS - GLOBAL EQUITIY
A 1.85% p.a.
B 1.85% p.a.
I 0.85% p.a. ECONOPOLIS FUNDS - ECONOPOLIS EM GOVERNMENT BONDS
A 1.20% p.a.
B 1.20% p.a.
I 0.65% p.a. ECONOPOLIS FUNDS - ECONOPOLIS EMERGING MARKET EQUITIES
A 1.40% p.a.
B 1.40% p.a.
I 0.80% p.a. ECONOPOLIS FUNDS - ECONOPOLIS GLOBAL BONDS
A 0.60% p.a.
B 0.60% p.a.
I 0.40% p.a. ECONOPOLIS FUNDS - ECONOPOLIS SMART CONVICTIONS FUND
A 1.20% p.a.
B 1.20% p.a.
I 0.75% p.a. ECONOPOLIS FUNDS - ECONOPOLIS BELGIAN CHAMPIONS
A 1.50% p.a.
B 1.50% p.a.
I 0.75% p.a.
The Global fee is payable quarterly and calculated on the average net assets of the Sub-Fund for the quarter in question. Note 4 - Management fees of the target funds The management fee of the target funds in which the Sub-Fund invests rises to maximum 2.50% p.a., calculated on the net assets invested in the target fund.

ECONOPOLIS FUNDS
Notes to the financial statements (continued) as at 30th June 2019
73
Note 5 - Performance fee For the Sub-Fund ECONOPOLIS FUNDS - ECONOPOLIS SMART CONVICTIONS FUND, a performance fee will be due annually and payable to the Investment Manager during the month following the end of the year. The performance fee hurdle rate is tied to Eonia + 3%. The performance fee of 15% is calculated based on the excess return (prior to the deduction of the performance fee) above the hurdle rate. The frequency of the calculation is commonly referred to as the crystallization frequency of the incentive (performance) fee payment. The Sub-Fund sets an annual crystallization as benchmark and the performance fee is paid at the end of the calendar year. The High Watermark principle is not applicable. In case of an excess return (above the hurdle rate) a performance fee accrual will be accounted in the net asset value. Such accrual will evolve over the year depending on the realised out or under-performance meaning that in case of underperformance, the accrual will be reduced accordingly. If at the end of the calendar year a performance fee is accrued, it will be payable to the investment manager. At the beginning of the following calendar year, the performance fee calculation will restart based on the last net asset value of the previous calendar year. The report of potential under-performance during the previous year is not applicable. The starting date of the frequency of the sub-fund is the first of January of each calendar year. If the crystallization frequency differs from the accrual schedule, which is the schedule used to calculate and charge the fee to the Sub-Fund's statement of operations and changes in net assets, the performance fee will be calculated on a pro-rata basis. The calculation of the fee is as follows:
1. For each net asset value for which the Sub- Fund's performance exceeds the benchmark index
(EONIA +3%) (i.e. the Hurdle Rate), a maximum fee of 15% of the realised outperformance shall be payable under the conditions stipulated in paragraph 3 below.
2. The Sub-Fund's performance is equal to the positive difference between the return of the last
calculated net asset value and the Hurdle Rate. 3. The outperformance fee is only payable in the case when the increase in the net asset value
exceeds that of the Hurdle Rate; in which case the outperformance fee is applied to the difference between the return of the last calculated net asset value per share and the Hurdle Rate, multiplied by the number of shares outstanding on the day of the last net asset value.
4. Investors are advised that the performance fee is subject to the crystallisation principle. When
shares are redeemed on a date other than the date when the performance fee is paid out, and when provision has been set aside for the performance fee, the provisioned performance fee amount payable on redeemed shares will be considered as accruing to the Investment Manager and paid out at the end of the year concerned. In the case of subscriptions, the calculation of the performance fee is adjusted to prevent the subscription having an impact on the amount of provisions for performance fees. For such adjustments, the outperformance of the net asset value per share compared with the minimum rate of return up to the subscription date is not taken into account when calculating the performance fee. The provision set aside for the performance fee will be reduced by 15% of the Outperformance determined on the Valuation Day on which the subscriptions were deducted, multiplied by the number of shares subscribed.

ECONOPOLIS FUNDS
Notes to the financial statements (continued) as at 30th June 2019
74
At the date of the financial statements, a performance fee was recorded for the following Sub-Fund and amounted to :
ECONOPOLIS FUNDS - ECONOPOLIS SMART CONVICTIONS FUND: EUR 158.71 Other sub-funds are not subject to Performance fee. Note 6 - Subscription duty (“taxe d’abonnement”) The SICAV is governed by Luxembourg law. Pursuant to the legislation and regulations in force, the SICAV is subject to an annual subscription duty "taxe d’abonnement" of 0.05% which is payable quarterly and calculated on the basis of the net assets of each sub-fund on the last day of each quarter. Nevertheless, the annual rate of the subscription duty is set at 0.01% of the net assets of I and O Category shares as these shares are reserved to Institutional Investors.
Pursuant to Article 175 (a) of the amended law of 17th December 2010, the net assets invested in undertakings for collective investment already subject to the "taxe d’abonnement" are exempt from this tax. Note 7 - Cross investments Pursuant to Article 181(8) of the amended Law of 17th December 2010 relating to Undertakings for Collective Investment, the following Sub-Fund invested in the Sub-Funds as described below as at 30th June 2019:
Sub-Fund Description Currency Quantity Market value % of total net assets
ECONOPOLIS FUNDS - ECONOPOLIS SMART CONVICTION FD
Econopolis Fds Em Government Bonds EUR O Cap EUR 11,350 1,210,818.00 3.81%
Econopolis Fds Global Bonds O EUR Cap EUR 28,500 2,895,600.00 9.12%
The combined statement of net assets has not been adjusted to remove the impact of the above. There is no duplication of management, subscription or repurchase fees between those at the level of the Sub-Fund of the Fund having invested in the target Sub-Fund, and this target Sub-Fund. Note 8- Futures contracts As at 30th June 2019, the Sub-Funds are not committed in any futures contract. Note 9 - Valuation of investment The Sub-Fund ECONOPOLIS FUNDS - ECONOPOLIS GLOBAL BONDS (the "Sub-Fund") holds a position of 200.000 bonds of Orchestra Premaman SA 2014 6.25% 06/11/2020 (ISIN BE6272390798) (the "Bond"), which represents 1.05% of the net asset of the Sub-Fund as of the net asset value dated 21th December 2018.

ECONOPOLIS FUNDS
Notes to the financial statements (continued) as at 30th June 2019
75
No reliable quotes by market are currently available for the Bond and only one trade was priced around 97% over the last 6 months. ECONOPOLIS WEALTH MANAGEMENT NV, acting as Investment Manager of the Sub-Fund, has informed the Board that the Company having issued the Bond has clear financial difficulties. The Bond has been restructured as follows: Maturity: 06/11/2021 (one year extended) Coupon: 5.25% (an increase of 0.50%) Coupon 2018: 85% of this coupon is deferred to the beginning of 2021 Based on the elements described in the last paragraph, the Investment Manager has suggested quoting the Bond with the CCC rated euro yield curve, which would result in a yield of 9%. Consequently, the theoretical price of the Bond would be around 94%. In order to take into account the uncertainty related to financial difficulties of the company having issued the Bond, Conventum Asset Management as management company of the Company, suggests to apply the principle of prudence and apply a supplemental haircut of 10% to the theoretical price of 94%, which would result in a final valuation price of 84%. Given the financial difficulties of the Company having issued the Bond and the difficulties of pricing the Bond, the Investment Manager joins the suggestion of Conventum Asset Management to apply a final valuation price of 84%. By Circulation Resolution with effect on 27th December 2018 and on the basis of the above considerations, the Board of Directors resolved as follows: In absence of a regular and reliable pricing of the Bond and due to the financial difficulties of the Company having issued the Bond, the Board of Directors decided to apply the principle of prudence and to evaluate the Bond at 84% until fair value quotations reappear in the market. Note 10 - Event By Circular Resolution, the Board of Directors decided to merge on 26th March 2019 the Sub-Fund ECONOPOLIS FUNDS - TOTAL RETURN by absorption into the Sub-Fund ECONOPOLIS FUNDS - PATRIMONIAL SUSTAINABLE. The exchange ratio for each share class is calculated on 27th March 2019 as follows:
Absorbed Sub-Fund Exchange Ratio
ECONOPOLIS FUNDS - TOTAL RETURN - I Cap EUR 0.93017
ECONOPOLIS FUNDS - TOTAL RETURN - I Dis EUR 0.96818

ECONOPOLIS FUNDS
Additional information as at 30th June 2019
76
Information concerning the transparency of securities financing transactions and of reuse of cash collateral (regulation EU 2015/2365, hereafter "SFTR") During the reporting period, the Company did not engage in transactions which are subject to the publication requirements of SFTR. Accordingly, no information concerning the transparency of securities financing transactions and of reuse of cash collateral should be reported.