Embed Size (px)
Citation preview

UNIVERSITY OF VICTORIA ECONOMICS
Economics of the Poor Comparing Developing and Developed
Agriculture by Comparing Factor Growth and TFP
Jacob Genert
4/22/2015
Supervised By Prof. Ken Stewart
Special thank-you to my Mother
2
Economics of the Poor: Comparing Developed and Developing Agriculture by
Comparing Factor Growth and TFP
Jacob Genert
Table of Contents:
1.1 Introduction .............................................................................................................................. 3
1.2 Review.......................................................................................................................................5
2.1 Study..........................................................................................................................................6
2.2 Modelling...................................................................................................................................7
3.1 Labour........................................................................................................................................8
3.2 Land...........................................................................................................................................9
3.3 Livestock..................................................................................................................................10
3.4 Machinery................................................................................................................................11
3.5 Fertilizer...................................................................................................................................12
4.1 Results......................................................................................................................................14
4.2 Conclusion...............................................................................................................................15
Reference List................................................................................................................................16
Figures and Graphs........................................................................................................................19
3
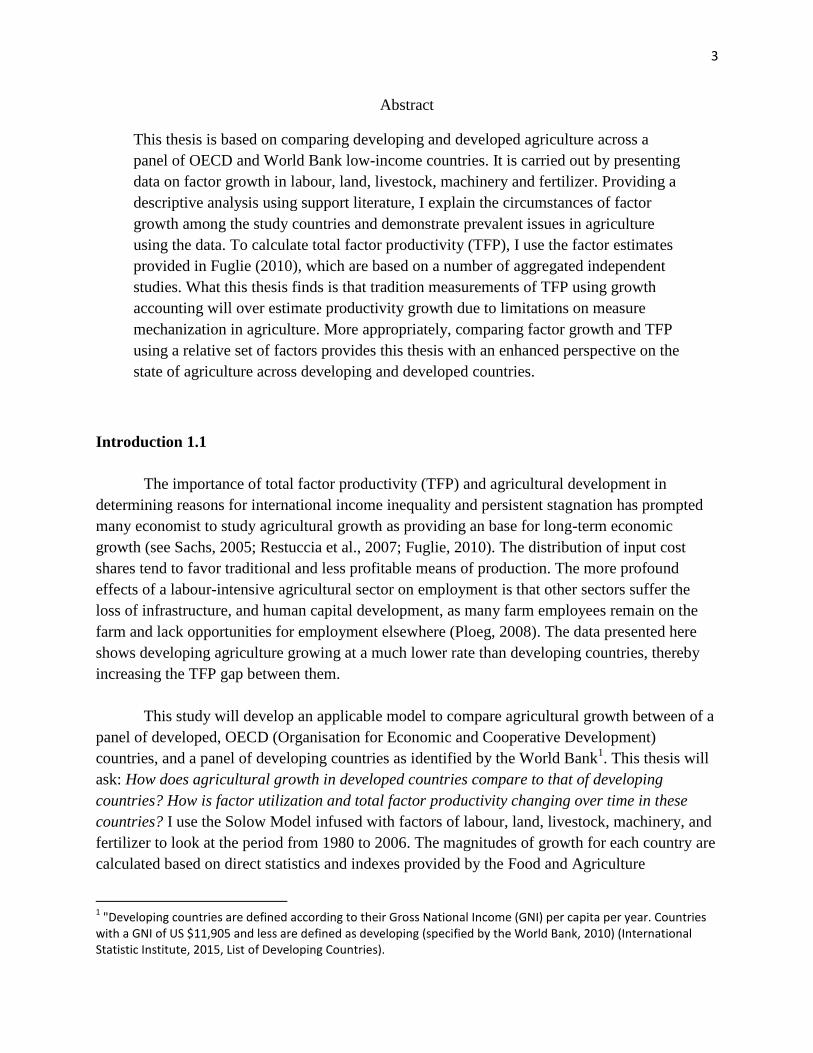
Abstract
This thesis is based on comparing developing and developed agriculture across a
panel of OECD and World Bank low-income countries. It is carried out by presenting
data on factor growth in labour, land, livestock, machinery and fertilizer. Providing a
descriptive analysis using support literature, I explain the circumstances of factor
growth among the study countries and demonstrate prevalent issues in agriculture
using the data. To calculate total factor productivity (TFP), I use the factor estimates
provided in Fuglie (2010), which are based on a number of aggregated independent
studies. What this thesis finds is that tradition measurements of TFP using growth
accounting will over estimate productivity growth due to limitations on measure
mechanization in agriculture. More appropriately, comparing factor growth and TFP
using a relative set of factors provides this thesis with an enhanced perspective on the
state of agriculture across developing and developed countries.
Introduction 1.1
The importance of total factor productivity (TFP) and agricultural development in
determining reasons for international income inequality and persistent stagnation has prompted
many economist to study agricultural growth as providing an base for long-term economic
growth (see Sachs, 2005; Restuccia et al., 2007; Fuglie, 2010). The distribution of input cost
shares tend to favor traditional and less profitable means of production. The more profound
effects of a labour-intensive agricultural sector on employment is that other sectors suffer the
loss of infrastructure, and human capital development, as many farm employees remain on the
farm and lack opportunities for employment elsewhere (Ploeg, 2008). The data presented here
shows developing agriculture growing at a much lower rate than developing countries, thereby
increasing the TFP gap between them.
This study will develop an applicable model to compare agricultural growth between of a
panel of developed, OECD (Organisation for Economic and Cooperative Development)
countries, and a panel of developing countries as identified by the World Bank1. This thesis will
ask: How does agricultural growth in developed countries compare to that of developing
countries? How is factor utilization and total factor productivity changing over time in these
countries? I use the Solow Model infused with factors of labour, land, livestock, machinery, and
fertilizer to look at the period from 1980 to 2006. The magnitudes of growth for each country are
calculated based on direct statistics and indexes provided by the Food and Agriculture
1 "Developing countries are defined according to their Gross National Income (GNI) per capita per year. Countries
with a GNI of US $11,905 and less are defined as developing (specified by the World Bank, 2010) (International Statistic Institute, 2015, List of Developing Countries).
4
Organization, the World Bank, and EconStats™ 2(EconStats™, 2015, WB, WDI). Input cost
shares are provided by Fuglie's (2010) study on global agriculture productivity, which
categorizes the cost-share distribution by region according to a number of independent region
and country based agricultural studies. My growth data on the included factors can be weighted
and categorized according the Fuglie's findings and provides a basis for comparison by
determining the trending growth rates of TFP. By modelling the change in factor utilization,
change in output, and change in the TFP, I can explain that constant or inconsistent streams of
growth in developing countries leads to lower levels of TFP for agricultural sectors in low
income, developing countries. This cycle leads to increasing relative gaps in production.
Studies have shown the TFP accounting for up to 64% of annual GDP growth per capita
in some countries, where as physical capital accounts for 25% at most (Easterly & Levine, 2001,
p. 9; see also Dougherty, 1991; Young, 1994; Lagos, 2006 ). Easterly (2001) tells us the driver of
economic growth is not factor accumulation, but rather total factor productivity (TFP). Total
factor productivity can be explained as the statistic gap between similar levels of inputs and
investment which lead to in higher levels of production. As Comin (2006) states, "[TFP] is the
portion of output not explained by the amount of inputs used in production. As such, its level is
determined by how efficiently and intensely the inputs are utilized in production" (p.1). The
increase in production is attributed to the diffusion of technological innovation, education, and
improved practices reaching the producer. In agriculture, as in other sectors, there are various
forms of capital inputs included in production (such as mechanized capital, fertilizer, land
expansion, and protections for livestock and crops), which make it difficult to accurately
measure many capital factors. In some circumstances innovations occur under certain types of
conditions (climate, soil type, etc.) and are not applicable elsewhere. This often stifles
measurement models and has led researchers to seek alternatives to the use of a mechanized
capital factor (Restuccia et al., 2007). Determining the growth of TFP also relies on large and
consistent bodies of statistics in order develop reasonable estimates of the input costs and are
especially difficult to find in the case of developing countries.
To provide consistency to my own study, I was able to use a single body of statistics
which provides similar data across all the countries included in the panel. In cases where data
was not available, the country was either exempt from the study or, where piece data was
available, represented for a subset of the study period beginning in 1980. Furthermore, the data
set provides information in some direct relation to each of the factors accounted for by Fuglie
(2010), allowing for both consistent and relatively accurate measuring of agricultural growth
with respect to the included countries. The applying this data to the Solow growth accounting
model provides a basis for comparing the growth of developed and developing agriculture.
Furthermore, because of the continuity of the data collected spans over 25 years, I was able to
2 The statistics used to calculate the growth of each factor were retrieved from EconStats™ which are gathered
from the World Bank, World Development indicators, and internally (EconStats™, 2015, WB, WDI).

5
use an index to reflect the relative cumulative changes in factor utilization and TFP over the
study period. As a result, the descriptive analysis is enhanced by allowing us to see the year to
year changes in factor and TFP growth over the study period. What the index shows in many
circumstances is that factor utilization remains relatively constant with significant differences
among developing and developed agriculture in the use of labour, land, and fertilizer.
1.2 Review
Agriculture acts as a basis for comparing development because, as Theodore Schultz
states, "Most of the world's poor people earn a living from agriculture, so if we knew the
economics of agriculture we would know much more about the economics of being poor”. And
"Because no currently advanced country of some size became advanced without the agriculture
sector first achieving substantial productivity gains in the early stages of development“(Bezemer
& Headey, 2007, p. 1342). Developing agriculture is contested on the grounds that production
decisions are made on the availability of labour, the level of necessity, and the possibility of
entitlement (see Ploeg, 2008; Angelsen, 1999). Some researchers argue that developing countries
should "stress [] demographic growth as the driving force of agricultural growth” (as cited in
Ploeg, 2008, p.46, see Boserup, 1970). In contrast, Reardon et al (2003), shows that
supermarkets in the developing world are "increasingly and overwhelmingly [foreign owned]"
and "demonstrate a preference for working with relatively fewer, modern suppliers" (as cited in
Barkley and Barkley, 2015, p.87). The expansion of Western producers reflects the classic
restrictions on developing agriculture listed by Ploeg (2008): reaching "technical ceilings",
suffering diminishing returns on labour inputs, and continued factor stagnation (p.46). The
descriptive analysis used in this study offers support to the latter body of research by showing
relatively constant factor utilization among some countries. Furthermore, stagnation or decline in
the use efficient and productive factors like fertilizer and machinery may explain negative rates
of TFP growth among some developing countries.
The following section (2) provides a model of measurement and the factors needed to
derive a reliable result. More directly, I provide the Solow model being used for measurement,
the included factors, a derivation of the growth accounting model, and the index used to
demonstrate change in factors over time. In Section (3), I discuss the input factors and the
associated data. In particular, I point out features displayed in the trends of each factor which
suggest intuitive features of the economies being researched. For example, in the case of small
developing countries, a lack of trade specialization is believed to result from unusually high
levels of activity in agriculture. In section (4) I display my findings on TFP for the included
countries and discuss the implications with regard to agricultural development. I found that, over
the course of the study period, a majority of countries yielded sufficient data to determine
relative productivity growth in agriculture. Information from the study suggests increasing
productivity gaps between developing and developed agricultural economies.

6
Study 2.1
This study is driven by a descriptive analysis of the factors listed above and is supported
by a number of literary sources with regard to the factors involved. As cited in Ludena et. al
(2007) "a review of multi-country agriculture productivity studies, report[ed] a total of 17 studies
in the decade between 1993 and 2003" (p. 1). In the case of Ludena et. al. (2007), a Malmquist
Index3 and data on livestock quantities provided estimated input costs which are applied to a
sample of 116 countries. However, Coelli and Rao (2005) have reported that cost shares often
vary widely over regions and over time. Fuglie's (2010) research on global agricultural
productivity "bring[s] together several country-level case studies that have acquired
representative input cost data to construct... and apply their average cost-share estimates to other
countries with similar agriculture" (p.65). The approach used by Fuglie provides accurate
estimates of the TFP growth by categorizing the differences in multi-factor cost according to
region, but unfortunately does not account for their change over time. Similarly, my research
adopts the input cost-share estimates on labour and land; livestock, machinery, and fertilizer
provided by Fuglie (2010) (see Figure 2). The panel of countries selected for this study are
categorized according to their region and development status (i.e., developed and developing) in
Figure 1.
Modeling 2.2
The Solow Model used for the study can be shown in the Cobb-Douglas form under
constant returns to scale as:
According to Fuglie (2010) "TFP is usually defined as the ratio of total output to total input in
the production process" (p.66). TFP is, then, the average measure of the mean output from a
given set of input. As such TFP can be given as:
By taking the log differential equation and derivative with respect to't', we can show the growth
rate of TFP as:
3 "The Malmquist index is based on the idea of a function that measures the distance from a given input/output
vector to the technically efficient frontier along a particular direction defined by the relative levels of the alternate outputs" (Ludena et. al, 2007, p.2).

7
Where 'R' is represented as the total revenue share and 'S' as a vector with 'j' as the number of
input shares summing to one. Given constant cost-shares, the formula used for calculating TFP is
shown as:
Where the log differential with respect to’t’ of TFP is used to track the period to period change in
TFP. In other words, for small changes, the rate of growth or decline in TFP is the difference
between the growth in total output and the growth of factor inputs weighted by their cost-shares.
The cost shares used to calculate the growth rate of TFP according to region are shown in
Figure 2.
Indexing Factor Change
The Raw data used for this study is significantly varied in magnitudes and made it
difficult to display from a relative basis. For this reason I developed a squared-adjusted index
based on changes in the log differential function with respect to the time of each factor input,
total output, and TFP, in order to cumulate and show the relative year to year changes. The index
used here can be shown as:
The index offers a relative perspective with respect to change in factor utilization over time.
This allows us some sense of the relative change in the magnitudes of each factor across all the
sample countries, rather that the direct magnitudes of input. In this regard, the index should be
viewed as a level of utilization relative to the levels used during 1980, which allows us to
visualize the change in utilization over the study period.
Under a constant returns to scale, growth or decline in one input factor should exhibit the
opposite effect among the other factors or else be accounted for by a growth or decline in the
TFP. This study does not go so far as to further implement the data on period to period change of
cost-shares into the calculation of TFP, as this is limited by the amount of observations per
sample country and would require aggregating countries by region while overlooking subtle
country to country differences this study is comparing. Fuglie (2010) has collected a number of
regional studies which use aggregate data to acquire factor estimates respective of particular
countries or regions. Like Fuglie, I apply them to the calculated factor growth rates and use the
index to view relative change in total factor productivity over the study period.
8
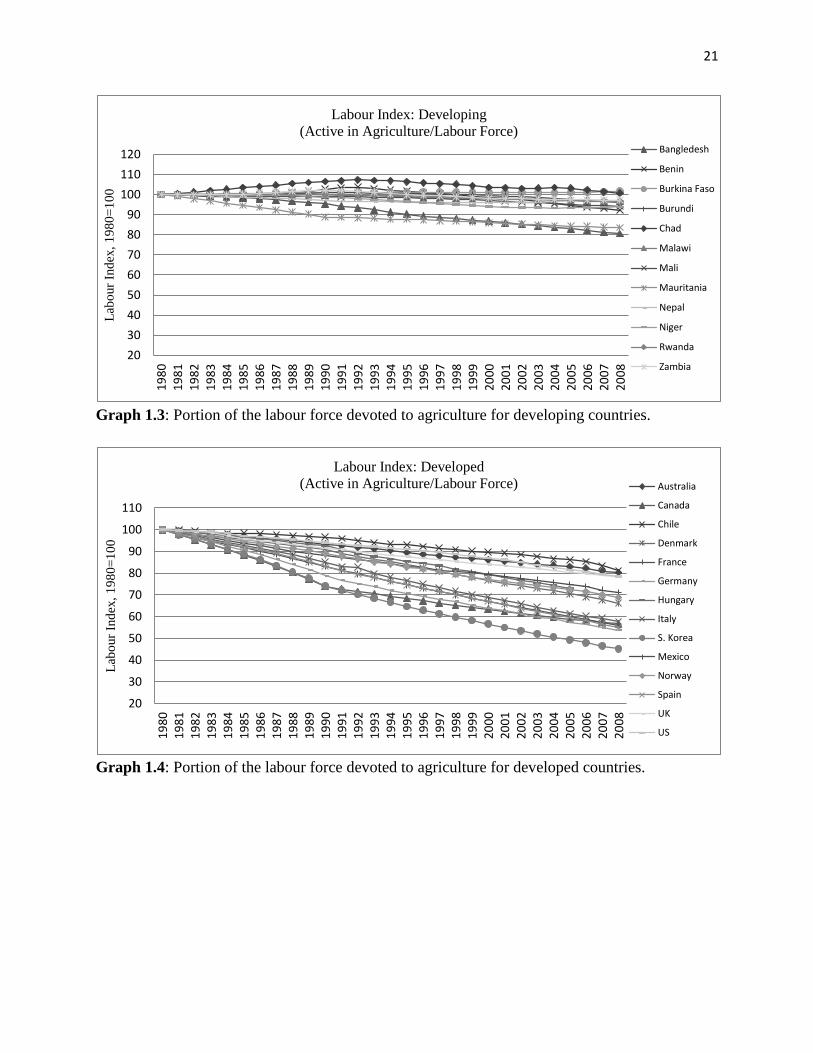
3.1 Labour
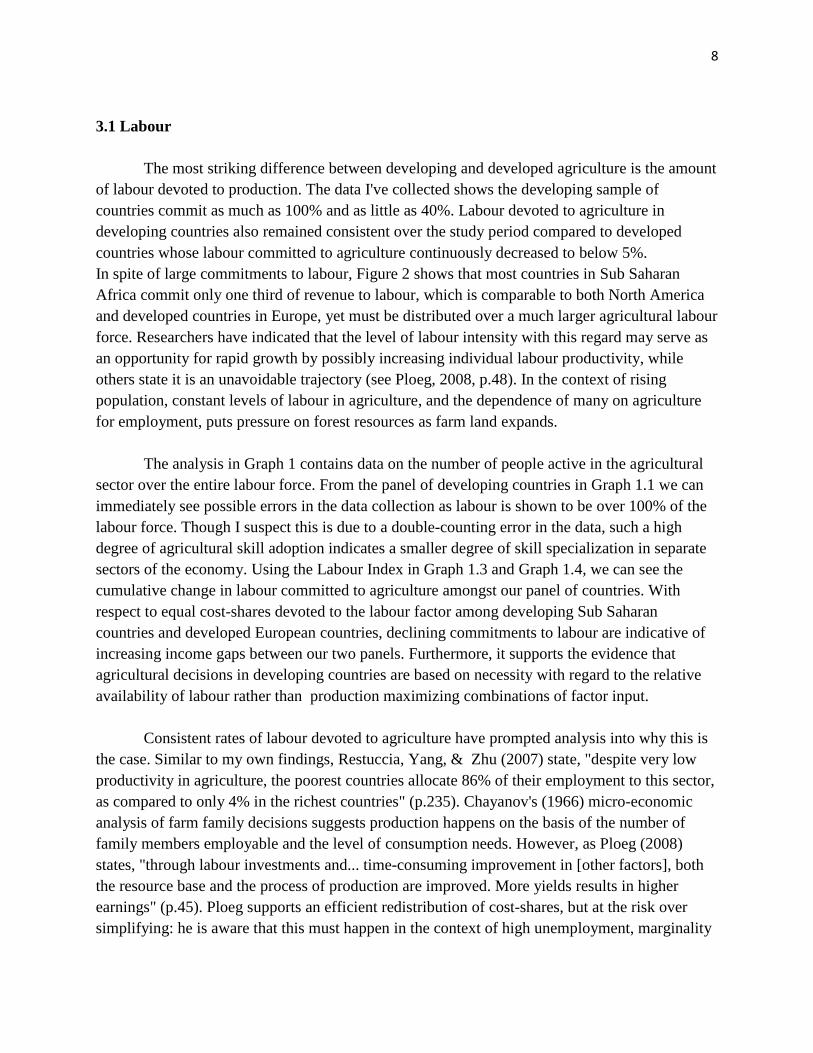
The most striking difference between developing and developed agriculture is the amount
of labour devoted to production. The data I've collected shows the developing sample of
countries commit as much as 100% and as little as 40%. Labour devoted to agriculture in
developing countries also remained consistent over the study period compared to developed
countries whose labour committed to agriculture continuously decreased to below 5%.
In spite of large commitments to labour, Figure 2 shows that most countries in Sub Saharan
Africa commit only one third of revenue to labour, which is comparable to both North America
and developed countries in Europe, yet must be distributed over a much larger agricultural labour
force. Researchers have indicated that the level of labour intensity with this regard may serve as
an opportunity for rapid growth by possibly increasing individual labour productivity, while
others state it is an unavoidable trajectory (see Ploeg, 2008, p.48). In the context of rising
population, constant levels of labour in agriculture, and the dependence of many on agriculture
for employment, puts pressure on forest resources as farm land expands.
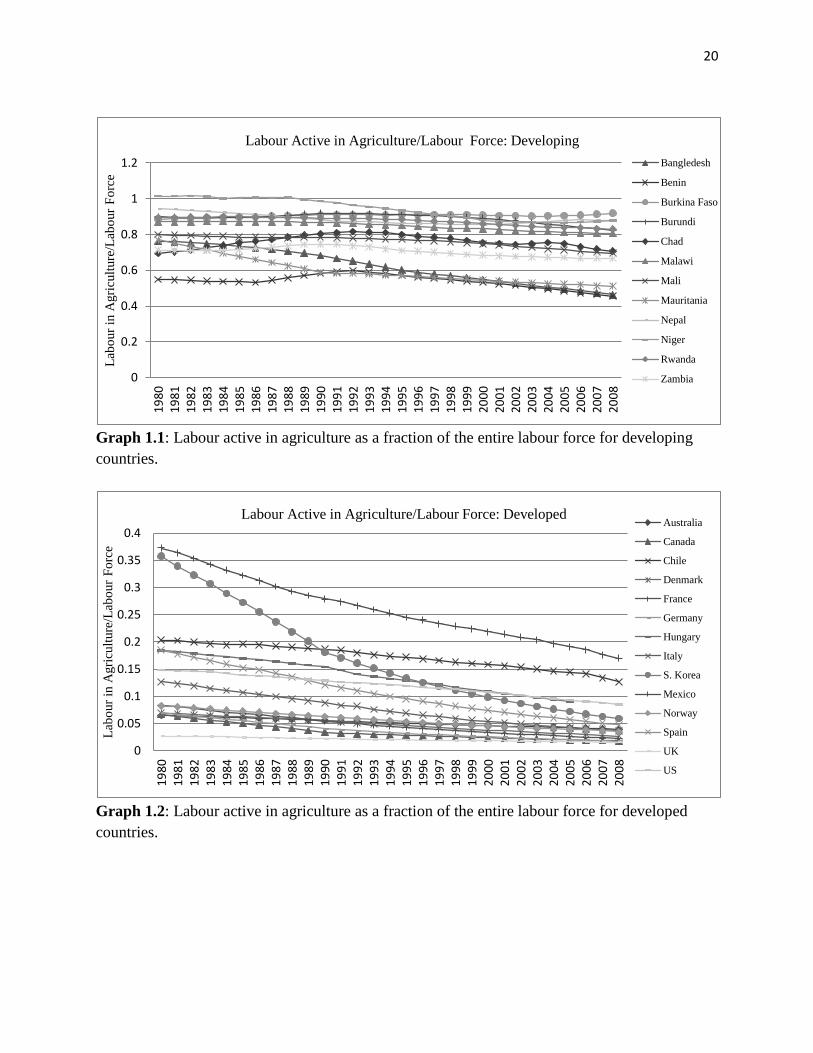
The analysis in Graph 1 contains data on the number of people active in the agricultural
sector over the entire labour force. From the panel of developing countries in Graph 1.1 we can
immediately see possible errors in the data collection as labour is shown to be over 100% of the
labour force. Though I suspect this is due to a double-counting error in the data, such a high
degree of agricultural skill adoption indicates a smaller degree of skill specialization in separate
sectors of the economy. Using the Labour Index in Graph 1.3 and Graph 1.4, we can see the
cumulative change in labour committed to agriculture amongst our panel of countries. With
respect to equal cost-shares devoted to the labour factor among developing Sub Saharan
countries and developed European countries, declining commitments to labour are indicative of
increasing income gaps between our two panels. Furthermore, it supports the evidence that
agricultural decisions in developing countries are based on necessity with regard to the relative
availability of labour rather than production maximizing combinations of factor input.
Consistent rates of labour devoted to agriculture have prompted analysis into why this is
the case. Similar to my own findings, Restuccia, Yang, & Zhu (2007) state, "despite very low
productivity in agriculture, the poorest countries allocate 86% of their employment to this sector,
as compared to only 4% in the richest countries" (p.235). Chayanov's (1966) micro-economic
analysis of farm family decisions suggests production happens on the basis of the number of
family members employable and the level of consumption needs. However, as Ploeg (2008)
states, "through labour investments and... time-consuming improvement in [other factors], both
the resource base and the process of production are improved. More yields results in higher
earnings" (p.45). Ploeg supports an efficient redistribution of cost-shares, but at the risk over
simplifying: he is aware that this must happen in the context of high unemployment, marginality
9
among demographics, and lack of information to guide production decisions. The absence of this
change among increasingly difficult conditions has led Ploeg and others to argue that developing
agriculture is becoming completely alienated from the global economy.
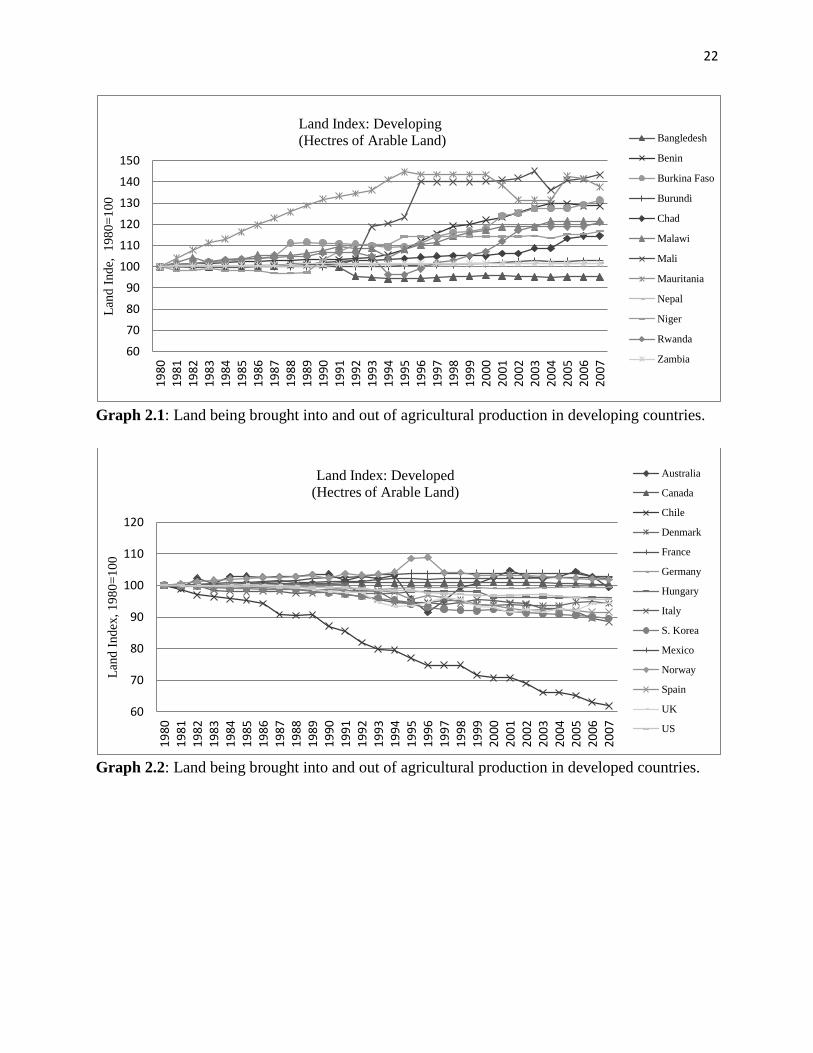
3.2 Land
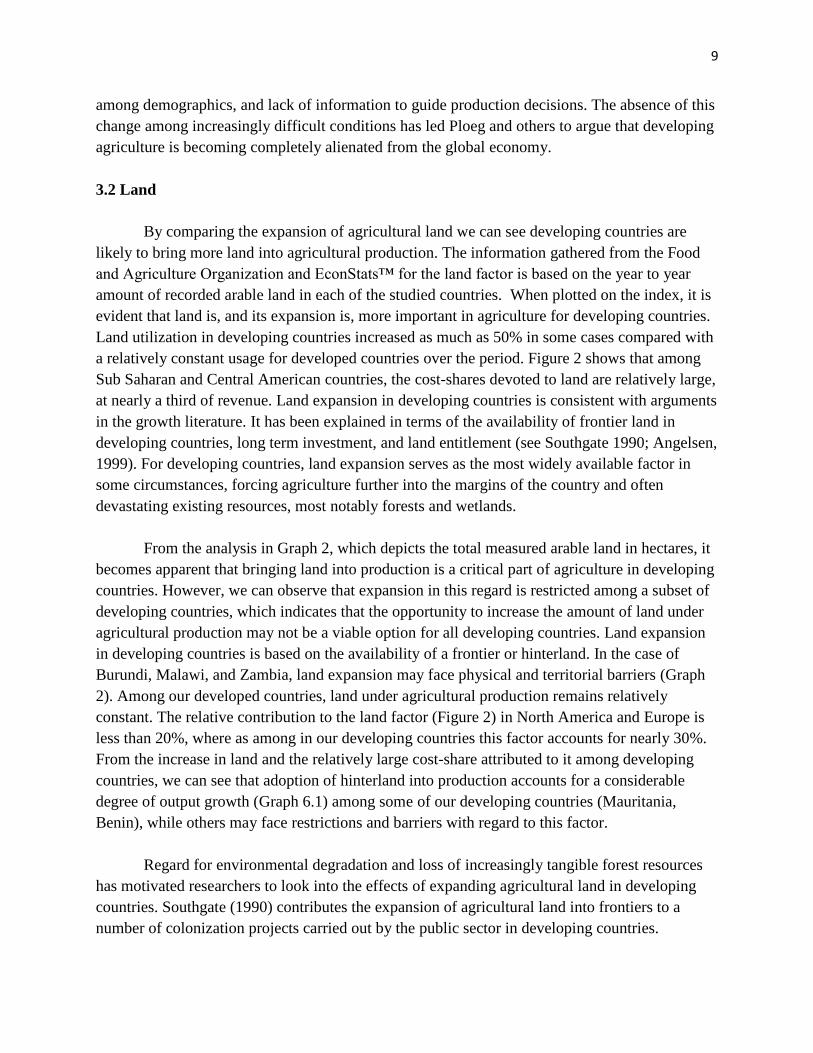
By comparing the expansion of agricultural land we can see developing countries are
likely to bring more land into agricultural production. The information gathered from the Food
and Agriculture Organization and EconStats™ for the land factor is based on the year to year
amount of recorded arable land in each of the studied countries. When plotted on the index, it is
evident that land is, and its expansion is, more important in agriculture for developing countries.
Land utilization in developing countries increased as much as 50% in some cases compared with
a relatively constant usage for developed countries over the period. Figure 2 shows that among
Sub Saharan and Central American countries, the cost-shares devoted to land are relatively large,
at nearly a third of revenue. Land expansion in developing countries is consistent with arguments
in the growth literature. It has been explained in terms of the availability of frontier land in
developing countries, long term investment, and land entitlement (see Southgate 1990; Angelsen,
1999). For developing countries, land expansion serves as the most widely available factor in
some circumstances, forcing agriculture further into the margins of the country and often
devastating existing resources, most notably forests and wetlands.
From the analysis in Graph 2, which depicts the total measured arable land in hectares, it
becomes apparent that bringing land into production is a critical part of agriculture in developing
countries. However, we can observe that expansion in this regard is restricted among a subset of
developing countries, which indicates that the opportunity to increase the amount of land under
agricultural production may not be a viable option for all developing countries. Land expansion
in developing countries is based on the availability of a frontier or hinterland. In the case of
Burundi, Malawi, and Zambia, land expansion may face physical and territorial barriers (Graph
2). Among our developed countries, land under agricultural production remains relatively
constant. The relative contribution to the land factor (Figure 2) in North America and Europe is
less than 20%, where as among in our developing countries this factor accounts for nearly 30%.
From the increase in land and the relatively large cost-share attributed to it among developing
countries, we can see that adoption of hinterland into production accounts for a considerable
degree of output growth (Graph 6.1) among some of our developing countries (Mauritania,
Benin), while others may face restrictions and barriers with regard to this factor.
Regard for environmental degradation and loss of increasingly tangible forest resources
has motivated researchers to look into the effects of expanding agricultural land in developing
countries. Southgate (1990) contributes the expansion of agricultural land into frontiers to a
number of colonization projects carried out by the public sector in developing countries.
10
Expansion in this manner is seen as beneficial for the state and the farmer because "agricultural
colonists benefit from grace periods for development credit and other subsidies," while
maintaining regimes that "promote deforestation" (p.93). Similarly, Angelsen (1999) approaches
this problem from under a micro-economic lens, arguing "Decisions about agricultural expansion
(deforestation) in many frontier areas should be modelled as an investment decision, because
forest clearing commonly gives farmers rights to the forest. Deforestation, [as] a title
establishment strategy ... is unproductive... because it gives a negative contribution to overall
production... and is a kind of rent-seeking" (Angelsen, 1999, pp.186-200). In contrast, VICE
Media (2015) and Mostafiz (2013) have reported agriculture production in Bangladesh is
beginning to suffer due to rising sea levels, which substantially facilitates migration further into
the margins. My data shows land to be an important factor for agriculture in developing
countries, yet presents trade-off between expansion and deforestation.
3.3 Livestock
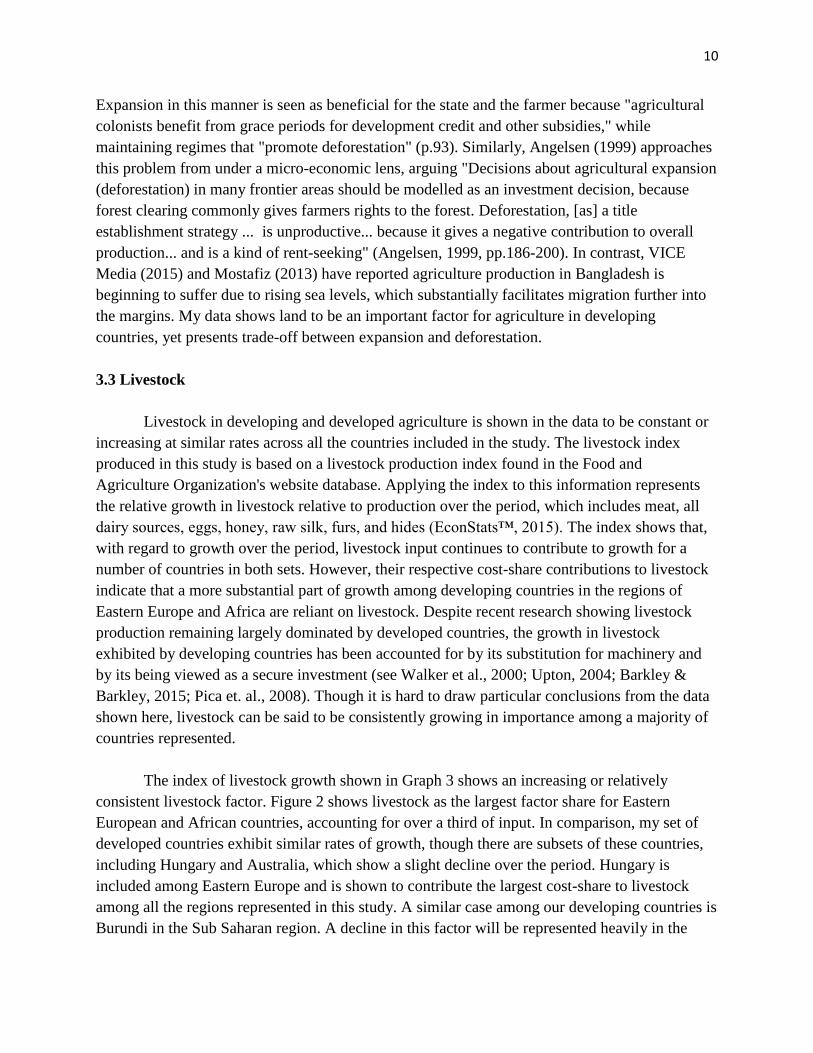
Livestock in developing and developed agriculture is shown in the data to be constant or
increasing at similar rates across all the countries included in the study. The livestock index
produced in this study is based on a livestock production index found in the Food and
Agriculture Organization's website database. Applying the index to this information represents
the relative growth in livestock relative to production over the period, which includes meat, all
dairy sources, eggs, honey, raw silk, furs, and hides (EconStats™, 2015). The index shows that,
with regard to growth over the period, livestock input continues to contribute to growth for a
number of countries in both sets. However, their respective cost-share contributions to livestock
indicate that a more substantial part of growth among developing countries in the regions of
Eastern Europe and Africa are reliant on livestock. Despite recent research showing livestock
production remaining largely dominated by developed countries, the growth in livestock
exhibited by developing countries has been accounted for by its substitution for machinery and
by its being viewed as a secure investment (see Walker et al., 2000; Upton, 2004; Barkley &
Barkley, 2015; Pica et. al., 2008). Though it is hard to draw particular conclusions from the data
shown here, livestock can be said to be consistently growing in importance among a majority of
countries represented.
The index of livestock growth shown in Graph 3 shows an increasing or relatively
consistent livestock factor. Figure 2 shows livestock as the largest factor share for Eastern
European and African countries, accounting for over a third of input. In comparison, my set of
developed countries exhibit similar rates of growth, though there are subsets of these countries,
including Hungary and Australia, which show a slight decline over the period. Hungary is
included among Eastern Europe and is shown to contribute the largest cost-share to livestock
among all the regions represented in this study. A similar case among our developing countries is
Burundi in the Sub Saharan region. A decline in this factor will be represented heavily in the
11
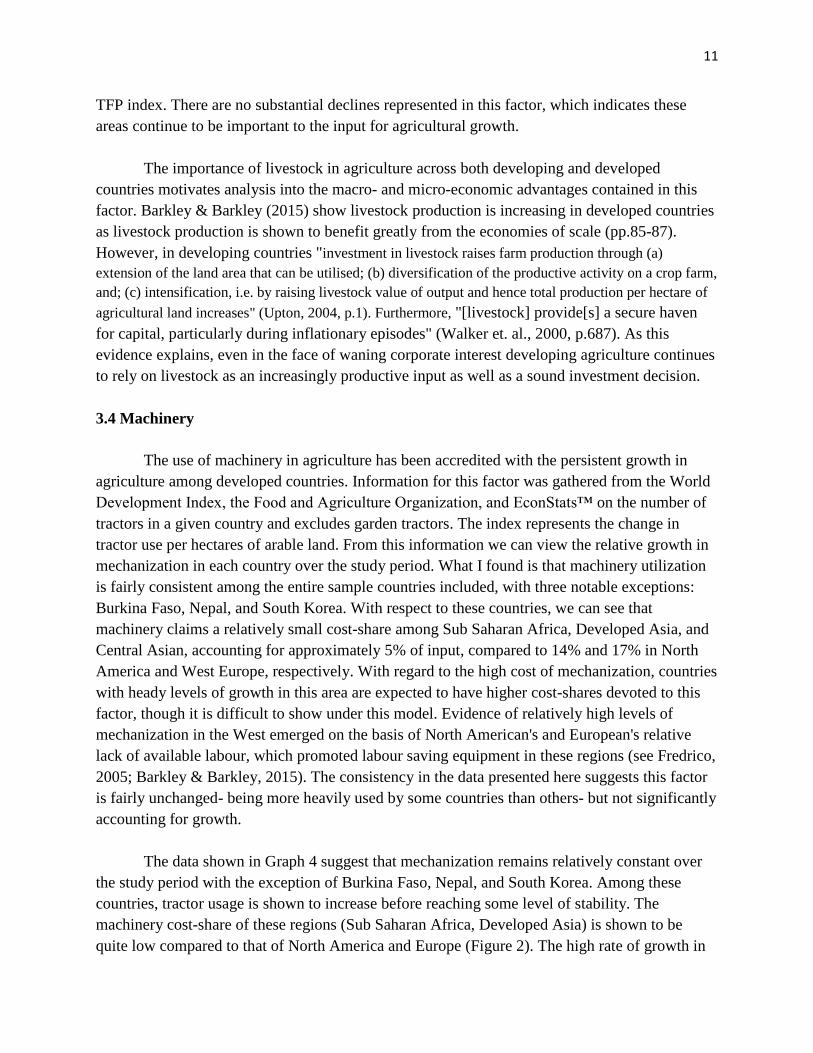
TFP index. There are no substantial declines represented in this factor, which indicates these
areas continue to be important to the input for agricultural growth.
The importance of livestock in agriculture across both developing and developed
countries motivates analysis into the macro- and micro-economic advantages contained in this
factor. Barkley & Barkley (2015) show livestock production is increasing in developed countries
as livestock production is shown to benefit greatly from the economies of scale (pp.85-87).
However, in developing countries "investment in livestock raises farm production through (a)
extension of the land area that can be utilised; (b) diversification of the productive activity on a crop farm,
and; (c) intensification, i.e. by raising livestock value of output and hence total production per hectare of
agricultural land increases" (Upton, 2004, p.1). Furthermore, "[livestock] provide[s] a secure haven
for capital, particularly during inflationary episodes" (Walker et. al., 2000, p.687). As this
evidence explains, even in the face of waning corporate interest developing agriculture continues
to rely on livestock as an increasingly productive input as well as a sound investment decision.
3.4 Machinery
The use of machinery in agriculture has been accredited with the persistent growth in
agriculture among developed countries. Information for this factor was gathered from the World
Development Index, the Food and Agriculture Organization, and EconStats™ on the number of
tractors in a given country and excludes garden tractors. The index represents the change in
tractor use per hectares of arable land. From this information we can view the relative growth in
mechanization in each country over the study period. What I found is that machinery utilization
is fairly consistent among the entire sample countries included, with three notable exceptions:
Burkina Faso, Nepal, and South Korea. With respect to these countries, we can see that
machinery claims a relatively small cost-share among Sub Saharan Africa, Developed Asia, and
Central Asian, accounting for approximately 5% of input, compared to 14% and 17% in North
America and West Europe, respectively. With regard to the high cost of mechanization, countries
with heady levels of growth in this area are expected to have higher cost-shares devoted to this
factor, though it is difficult to show under this model. Evidence of relatively high levels of
mechanization in the West emerged on the basis of North American's and European's relative
lack of available labour, which promoted labour saving equipment in these regions (see Fredrico,
2005; Barkley & Barkley, 2015). The consistency in the data presented here suggests this factor
is fairly unchanged- being more heavily used by some countries than others- but not significantly
accounting for growth.
The data shown in Graph 4 suggest that mechanization remains relatively constant over
the study period with the exception of Burkina Faso, Nepal, and South Korea. Among these
countries, tractor usage is shown to increase before reaching some level of stability. The
machinery cost-share of these regions (Sub Saharan Africa, Developed Asia) is shown to be
quite low compared to that of North America and Europe (Figure 2). The high rate of growth in

12
this factor is indicative of its increasing importance in a select few countries and, in some
circumstances, results in a greater share of input over the period. The growth of mechanization in
these countries encourages further research into modeling how the cost-shares are changing over
time with respect to factor inputs (see Li & Stewart, 2014). Because the factor shares given by
the literature cannot account for possible changes over time, the growth of machinery in these
countries may lead to growth in this sector not being properly accounted for in output.
The notable productivity gains in North America and Europe due to mechanization of
agriculture readily suggests the same model could be practiced in developing Africa and other
regions. With respect to our developing countries, "Vast amounts of available land in the US,
Canada, Australia, and Argentina led to the rapid adoption of... mechanized agriculture" (Barkley
& Barkley, 2015, p.21). Furthermore "The first half of the twentieth century featured a boom in
the consumption of fertilizer in Europe, and a boom of mechanization in the United States"
(Fredrico, 2005, p.114). Fredrico (2005) notes the difficulty in measuring capital in this regard
and mentions that milking machines, which are not represented in the data, were a significant
part of livestock production increases. Fredrico also uses machinery tractors as a relative
measure of mechanization (p.48). The significant conclusion we can draw from this analysis is
that mechanization depends on a number of external factors- not the least of which are time,
investment, and infrastructure. Furthermore, the methods of measuring mechanization could
stand to be greatly improved. With regard to our panel, the problem is exacerbated when
countries show significant increases in this area which cannot be properly measured.
3.5 Fertilizer
Similar to mechanization, the difference in fertilizer usage across developing and
developed countries serves as a point of interest for economists. Information on fertilizer,
provided in metric tonnes of consumption, was collected from the Food and Agriculture
Organization's database. The statistics collected include nitrogenous potash and phosphate
fertilizers, and do not include estimations of traditional fertilizers, such as animal and plant
matter. The index shows large variations in fertilizer usage among developing countries
compared to relatively constant usage in developed countries. Fertilizer accounts for less than
10% of input in Eastern Europe, Central America, and Sub Saharan Africa (Figure 2). In North
America and Developed Asia (applied to South Korea) fertilizer claims approximately 20% of
input revenue. Sporadic usage of fertilizer has been noted as having an effect on the high
variability in crop yields and the farmers’ decisions based on the availability and price of
chemical fertilizer in developing countries (see Morris et. al., 2007). Furthermore, access to
fertilizer in developing countries suffers from profiteering on the side of producers and public
support programs due to its relatively high value and return (see World Economic Forum, 2013).
These issues seem to be exhibited in the data indicating that fertilizer usage in developing
countries shows more variation than any of the other factors.
13
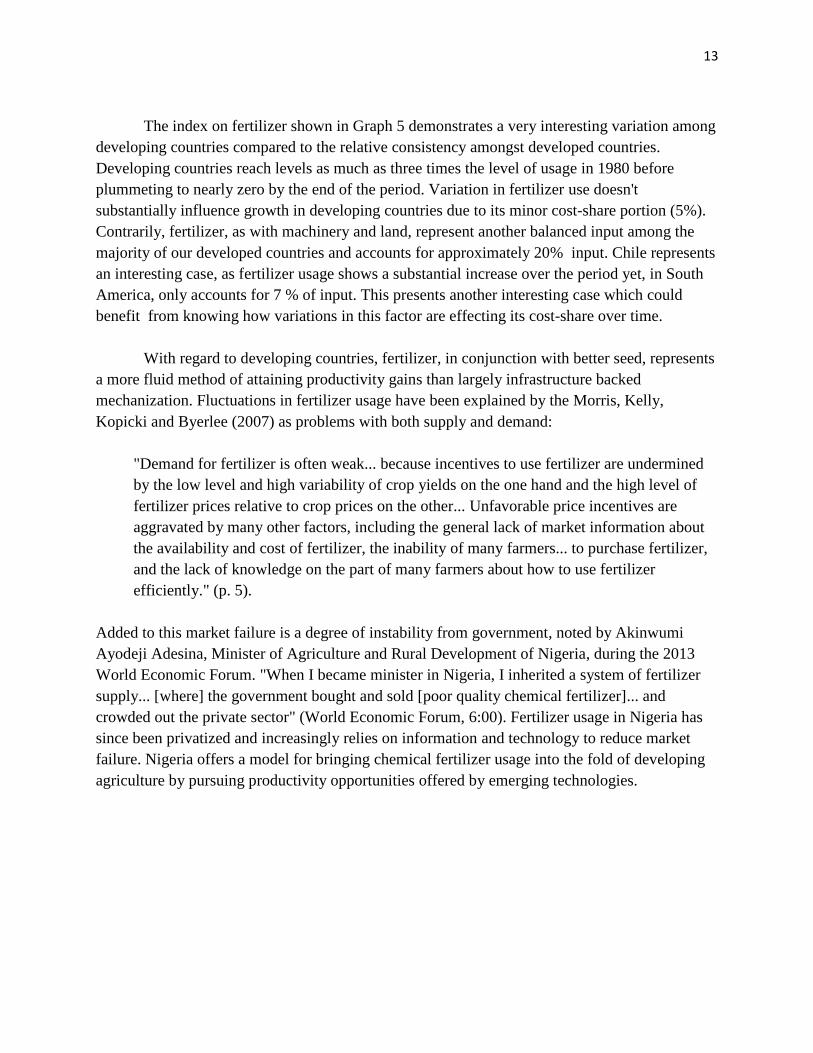
The index on fertilizer shown in Graph 5 demonstrates a very interesting variation among
developing countries compared to the relative consistency amongst developed countries.
Developing countries reach levels as much as three times the level of usage in 1980 before
plummeting to nearly zero by the end of the period. Variation in fertilizer use doesn't
substantially influence growth in developing countries due to its minor cost-share portion (5%).
Contrarily, fertilizer, as with machinery and land, represent another balanced input among the
majority of our developed countries and accounts for approximately 20% input. Chile represents
an interesting case, as fertilizer usage shows a substantial increase over the period yet, in South
America, only accounts for 7 % of input. This presents another interesting case which could
benefit from knowing how variations in this factor are effecting its cost-share over time.
With regard to developing countries, fertilizer, in conjunction with better seed, represents
a more fluid method of attaining productivity gains than largely infrastructure backed
mechanization. Fluctuations in fertilizer usage have been explained by the Morris, Kelly,
Kopicki and Byerlee (2007) as problems with both supply and demand:
"Demand for fertilizer is often weak... because incentives to use fertilizer are undermined
by the low level and high variability of crop yields on the one hand and the high level of
fertilizer prices relative to crop prices on the other... Unfavorable price incentives are
aggravated by many other factors, including the general lack of market information about
the availability and cost of fertilizer, the inability of many farmers... to purchase fertilizer,
and the lack of knowledge on the part of many farmers about how to use fertilizer
efficiently." (p. 5).
Added to this market failure is a degree of instability from government, noted by Akinwumi
Ayodeji Adesina, Minister of Agriculture and Rural Development of Nigeria, during the 2013
World Economic Forum. "When I became minister in Nigeria, I inherited a system of fertilizer
supply... [where] the government bought and sold [poor quality chemical fertilizer]... and
crowded out the private sector" (World Economic Forum, 6:00). Fertilizer usage in Nigeria has
since been privatized and increasingly relies on information and technology to reduce market
failure. Nigeria offers a model for bringing chemical fertilizer usage into the fold of developing
agriculture by pursuing productivity opportunities offered by emerging technologies.

14
4.1 Results
As the final part of the study, the data accumulated was combined with the output data in
Graph 6 to estimate the change in the TFP from year to year over the period. Output data is based
on value-added per worker data retrieved from the World Bank National and the Food and
Agriculture Organization, and compiled by EconStats™. Value Added "agriculture measures the
output of the agricultural sector (ISIC divisions 1-5) less the value of intermediate inputs.
Agriculture comprises value added from forestry, hunting and fishing as well as cultivation of
crops and livestock production" (EconStats™, 2015, WB, WDI). Indexing output for my panel
of countries exhibits a strong contrast between the relatively constant developing countries and
the consistently increasing developed countries. The large degree of separation between the
panel countries, in addition to the analysis presented here, offers a conjecture as to why this
productivity gap exists. Furthermore, the growth in the factors present here are assumed to
explain much larger productivity gains among developing countries, which makes maximizing
cost-share combinations a convenient argument.
The results provided in Graph 7 are not surprising considering the consistent levels of
output exhibited over the period by developing countries. The rates of change in the TFP
represented by the index shows very impressive growth among our developing countries,
however, among the panel of developing countries the results are far more dismal and show
slightly declining levels of TFP over the study period, meaning productivity and efficiency levels
fell from the relative level in 1980. This was to be expected as constant levels of output in
combination with growth of inputs, like livestock and land, which also retain a large cost-share,
increasing with population, could possibly be driving these results. Regardless, the results in
Graph 7 display an alarming trend, indicating that developing agriculture is less 'developing' than
declining. The more profound effects of this decline advocate a deeper alienation of developing
agriculture and the need for innovation and improvement in this area.
The results shown in this study are assumed to overestimate TFP for the developed panel
due to the data on mechanization of agriculture not accounting for the growth in mechanization
outside changes in tractor use. With regard to my developing panel, a substantial degree of
output is centralized in three primary factors: labour, land, and livestock; and can account for
much of the productivity growth in these countries. Evidence found in the literature also
demonstrates how barriers outside of agriculture prevent the development of mechanization and
fertilizer usage in developing countries (see also "development traps" Collier, 2007).
Prescriptions for improvements in these areas have largely been based on improving access to
information and markets through expanding use of information technology, which has proved to
be inexpensive and accessible. With regard to the results in the data, productivity gains in
developed countries are show to come from some degree of unmeasured growth, but also a
higher relative productivity of inputs.

15
4.2 Conclusion
From this analysis we can draw three important conclusions. Drawing on this data and
support from the literature, it is apparent that decreasing marginal returns produced by a
burgeoning agricultural labour sector suggests demographic growth is not a sustainable method
of driving agricultural growth. Labour intense agriculture drives land expansion projects. In
some circumstances investment decisions are made on the basis of entitlement, which can lead to
unproductive expansion. Under the physical restrictions of land input and constant labour inputs,
with respect to the overall increase of the economy, may result in decreasing returns to scale and
decline. Increasing farms at the frontier or hinterland margins is not a viable factor of growth in
the face of rising population demands. Secondly, mechanization, because it cannot be properly
measured, is assume to account for some portion of TFP thereby leading to its over estimation.
Mechanization, however has been shown to be an integral part of western agricultural
development, but requires a large degree of infrastructure outside of agriculture (Fredrico, 2007;
Ploeg, 2008; Barkley & Barkley, 2015). Fertilizer, then, has offered a more immediate solution
to productivity loss in developing countries, but it too suffers from market failure and
government interference. Finally, agriculture in developing countries primary relies on labour,
land, and livestock- out of the factors presented here. Because these factors are well recorded,
productivity growth in developing countries can largely be accounted for by our measurements.
Contrarily, the expansive factors used in developed agriculture makes it difficult to measuring
these inputs resulting in substantial and unwanted bias in TFP growth calculations. Under these
circumstances the relative TFP shows characteristics of a strong economy compared to that of a
developing economy relative to the included factors. In this sense we can see TFP as the
unmeasured factor productivity comparison rather than over estimated quantities.
16
Reference List
Angelsen, A. (1999). Agricultural expansion and deforestation: modelling the impact of
population, market forces and property rights. Journal of Development Economics,
58(1), pp.185-218. http://ac.els-cdn.com.ezproxy.library.uvic.ca/.
Barkley, A., & Barkely, P. W. (2015). Depolarizing food and agriculture: An economic
approach. New York, Routledge Press.
Bezemer, D., & Headey, D. (2008). Agriculture, development, and urban bias. World
Development, 36(8), pp. 1342–1364.
Boserup, E. (1970). Evolution Agrarie et pression demographique. Paris: Flammarion.
Chayanov, A.V. (1966). The theory of peasant economy, Edited by D. Thorner, B. Kerblay & R.
Smith. Published for the American Economic Association, by R.D. Irwin.
Coelli, T., & Rao, D. S. P. (2005). Total factor productivity growth in agriculture: A malmquist
index analysis of 93 countries, 1980-2000. Agricultural Economics, 32, pp. 115-134.
Collier, P. (2007).The Bottom Billion: Why the Poorest Countries are Failing and What Can Be
Done About It. Oxford & New York: Oxford University Press.
Comin, D. (2006). Total Factor Productivity. NBER and New York University.
http://www.people.hbs.edu/dcomin/def.pdf
Dougherty, Christopher (1991) A comparison of productivity and economic growth in the G-7
countries, Ph. D. Dissertation, Harvard University.
Easterly, W. (2001). The Elusive Quest for Growth: Economists' Adventures and Misadventures
in the Tropics. Cambridge: MIT Press.
Easterly, W., Levine R. (2001). What have we learned from a decade of empirical research on
growth? It's not factor accumulation: Stylized fact and growth models. World Bank
Economic Review, 15(2), pp.177-219.
http://wber.oxfordjournals.org/content/15/2/177.short
EconStats™ (2015). World Bank, World Development Indicators, and EconStats™.
http://www.econstats.com/wdi/wdic_AFG.htm
Food and Agriculture Organization of the United Nations, (2015). Databases
http://www.fao.org/statistics/databases/en/
Fuglie, K. (2010). The shifting patterns of agricultural production and productivity worldwide,
Chap. 4. Iowa: Iowa State University Press.
Gollin, D., Lagakos, D., & Waugh, M. (2012). Agricultural productivity gap in developing
countries. The Quarterly Journal of Economics. Oxford and New York: Oxford
University Press. http://homes.chass.utoronto.ca/~xzhu/GDC/GollinLagakosWaugh.pdf
International Statistics Institute (2015). List of developing countries in 2013. http://www.isi-
web.org/component/content/article/5-root/root/577-developing2012
Lagos, R. (2006). A model of TFP. Review of Economic Studies, 73(4), pp. 983-1007.
http://restud.oxfordjournals.org/content/73/4/983.short

17
Li, J., & Stewart, K. (2014). Factor substitution, factor-augmenting technical progress, and
trending factor shares: The Canadian evidence. Econometrics Working Paper EWP1403.
University of Victoria, BC, Canada.
Ludena, C.E., Hertel, T.W. Preckel, P.V. Foster, K. and Nin. A. (2007). Productivity growth
and convergence in crop, ruminant, and nonruminant production: Measurement and fore-
casts. Agricultural Economics, 37, pp.1-17.
Morris, M., Kelly, V., Kopicki, R., and Byerlee, D. (2007). Fertilizer Use in African Agriculture:
Lessons Learn and Good Practice Guidelines. Washington: World Bank Publication.
Mostafiz, M. (2013). Climate induced conflict in Bangladesh: Can aid help Bangladesh cope
with climate hazards and alleviate the climate induced conflicts? acedemia.edu.
http://www.academia.edu/11870649/Climate_Induced_Conflict_in_Bangladesh?
OECD (2015). List of OECD member countries. http://oecd.org/about/membersandpartners/list-
oecd-member-countries.htm
Pica, G., Pica-Ciamarra, U., & Otte, J. (2008). Pro-poor livestock policy initiative: a living from
livestock research report. World Development Report: Re-assessing the Policy
Priorities, 1 RR Nr 08-07.
Ploeg, J. (2008). The new peasantries: Struggles for autonomy and sustainability in an era of
empire and globalization. London and Sterling: Earth Scan Publishing.
http://www.sciencedirect.com.ezproxy.library.uvic.ca/science/article/
Restuccia, D., Yang, D. T., & Zhu, X. (2007). Agriculture and aggregate productivity: a
quantitative cross-country analysis. Journal of Monetary Economics, 55(2), pp. 234-250.
http://www.sciencedirect.com/science/article/pii/S0304393207001481
Sachs, J. (2005). The End of Poverty: Economic possibilities for Our Time. New York: The
Penguin Press.
Southgate, D. (1990). The causes of land degradation along "spontaneously" expanding
agricultural frontiers in the Third World. Land Economics, 66(1), pp. 93-101.
http://www.jstor.org.ezproxy.library.uvic.ca/stable/pdf/3146686.pdf?acceptTC=true
Upton M. (2004). The Role of Livestock in Economic Development and Poverty Reduction.
PPLPI Working Paper No. 10, FAO, Rome.
http://www.fao.org/Ag/Againfo/Programmes/En/pplpi/docarc/execsumm_wp10.pdf
VICE News, (2015). Our Rising Oceans: Vice on HB. Season 3 Episode 1, 3:00.
https://www.youtube.com/watch?v=jEiETD8HKZA
Walker, R., Moran, E., & Anselin, L. (2000). Deforestation and cattle ranching in the Brazilian
Amazon. World Development, 28(4)., pp.683-699.
http://docs.lib.purdue.edu/cgi/viewcontent.cgi?article=1034&context=gtapwp
World Economic Forum, (2013). Africa 2013 - Agriculture: Investing in Transformation. 5mins,
30sec. https://www.youtube.com/watch?v=2vQgoKMhbMUw
http://www.fao.org/waicent/Faoinfo/agricult/againfo/programmes/en

18
Young, A. (1995). The tyranny of numbers: confronting the statistical realities of the east Asian
growth experience,” Quarterly Journal of Economics, 110: 641-680.

19
Graphs and Figures:
List of Study Countries
Developed
Developing
North America/Australia
Western
Africa
Australia
Benin
Canada
Eastern Africa
US
Burundi
Northwest Europe
Rwanda
Denmark
Malawi
France
Zambia
Germany
Sahel Africa
Norway
Burkina Faso
South Europe
Chad
Italy
Mali
Spain
Mauritania
South & Central America
Niger
Chile
South Asia
Mexico
Bangledesh
Eastern Europe
Nepal
Hungary
Developed Asia
S. Korea
Figure 1: List of countries for which a full set of important year- to- year data is available and was
included in this study.
Figure 2: Factor Shares gathered according to a number of independent regional studies and
categorized according Fuglie (2010).
00.10.20.30.40.50.60.70.80.9
1
Co
st S
har
e o
f In
put
Region Applied
Fertlizer
Machinery
Livestock
Land
Labour
Factor Shares Gather by Fuglie (2010)
20
Graph 1.1: Labour active in agriculture as a fraction of the entire labour force for developing
countries.
Graph 1.2: Labour active in agriculture as a fraction of the entire labour force for developed
countries.
0
0.2
0.4
0.6
0.8
1
1.21
98
01
98
11
98
21
98
31
98
41
98
51
98
61
98
71
98
81
98
91
99
01
99
11
99
21
99
31
99
41
99
51
99
61
99
71
99
81
99
92
00
02
00
12
00
22
00
32
00
42
00
52
00
62
00
72
00
8
Lab
our
in A
gri
cult
ure
/Lab
our
Fo
rce
Bangledesh
Benin
Burkina Faso
Burundi
Chad
Malawi
Mali
Mauritania
Nepal
Niger
Rwanda
Zambia
Labour Active in Agriculture/Labour Force: Developing
0
0.05
0.1
0.15
0.2
0.25
0.3
0.35
0.4
19
80
19
81
19
82
19
83
19
84
19
85
19
86
19
87
19
88
19
89
19
90
19
91
19
92
19
93
19
94
19
95
19
96
19
97
19
98
19
99
20
00
20
01
20
02
20
03
20
04
20
05
20
06
20
07
20
08
Lab
our
in A
gri
cult
ure
/Lab
our
Fo
rce
Australia
Canada
Chile
Denmark
France
Germany
Hungary
Italy
S. Korea
Mexico
Norway
Spain
UK
US
Labour Active in Agriculture/Labour Force: Developed
21
Graph 1.3: Portion of the labour force devoted to agriculture for developing countries.
Graph 1.4: Portion of the labour force devoted to agriculture for developed countries.
20
30
40
50
60
70
80
90
100
110
1201
98
01
98
11
98
21
98
31
98
41
98
51
98
61
98
71
98
81
98
91
99
01
99
11
99
21
99
31
99
41
99
51
99
61
99
71
99
81
99
92
00
02
00
12
00
22
00
32
00
42
00
52
00
62
00
72
00
8
Lab
our
Ind
ex,
19
80
=1
00
Labour Index: Developing
(Active in Agriculture/Labour Force) Bangledesh
Benin
Burkina Faso
Burundi
Chad
Malawi
Mali
Mauritania
Nepal
Niger
Rwanda
Zambia
20
30
40
50
60
70
80
90
100
110
19
80
19
81
19
82
19
83
19
84
19
85
19
86
19
87
19
88
19
89
19
90
19
91
19
92
19
93
19
94
19
95
19
96
19
97
19
98
19
99
20
00
20
01
20
02
20
03
20
04
20
05
20
06
20
07
20
08
Lab
our
Ind
ex,
19
80
=1
00
Labour Index: Developed
(Active in Agriculture/Labour Force) Australia
Canada
Chile
Denmark
France
Germany
Hungary
Italy
S. Korea
Mexico
Norway
Spain
UK
US
22
Graph 2.1: Land being brought into and out of agricultural production in developing countries.
Graph 2.2: Land being brought into and out of agricultural production in developed countries.
60
70
80
90
100
110
120
130
140
1501
98
01
98
11
98
21
98
31
98
41
98
51
98
61
98
71
98
81
98
91
99
01
99
11
99
21
99
31
99
41
99
51
99
61
99
71
99
81
99
92
00
02
00
12
00
22
00
32
00
42
00
52
00
62
00
7
Lan
d I
nd
e,
19
80
=1
00
Bangledesh
Benin
Burkina Faso
Burundi
Chad
Malawi
Mali
Mauritania
Nepal
Niger
Rwanda
Zambia
Land Index: Developing
(Hectres of Arable Land)
60
70
80
90
100
110
120
19
80
19
81
19
82
19
83
19
84
19
85
19
86
19
87
19
88
19
89
19
90
19
91
19
92
19
93
19
94
19
95
19
96
19
97
19
98
19
99
20
00
20
01
20
02
20
03
20
04
20
05
20
06
20
07
Lan
d I
nd
ex,
19
80
=1
00
Australia
Canada
Chile
Denmark
France
Germany
Hungary
Italy
S. Korea
Mexico
Norway
Spain
UK
US
Land Index: Developed
(Hectres of Arable Land)

23
Graph 3.1: Change in livestock related production in developing countries. Based on
information from the Food and Agriculture Organisation electronic files and EconStats™.
Graph 3.2: Change in livestock related production in developed countries. Based on information
from the Food and Agriculture Organisation electronic files and EconStats™.
80
100
120
140
160
180
200
1980 1982 1984 1986 1988 1990 1992 1994 1996 1998 2000 2002 2004 2006
Liv
esto
ck I
nd
ex,
19
80
=1
00
Bangledesh
Benin
Burkina Faso
Burundi
Chad
Malawi
Mali
Mauritania
Nepal
Niger
Rwanda
Zambia
Livestock Index: Developing
(FAO Livestock Production Index)
80
100
120
140
160
180
200
1980 1982 1984 1986 1988 1990 1992 1994 1996 1998 2000 2002 2004 2006
Liv
esto
ck I
nd
ex,
19
80
=1
00
Australia
Canada
Chile
Denmark
France
Germany
Hungary
Italy
S. Korea
Mexico
Norway
Spain
UK
US
Livestock Index: Developed
(FAO Livestock Production Index)
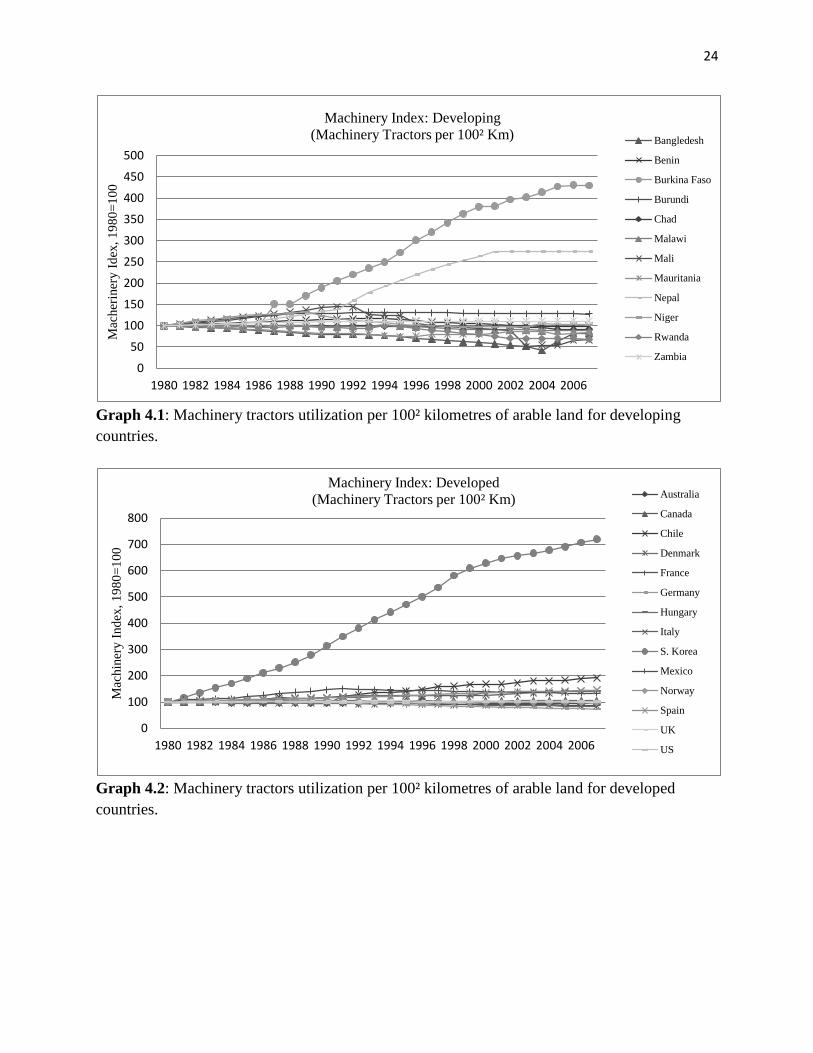
24
Graph 4.1: Machinery tractors utilization per 100² kilometres of arable land for developing
countries.
Graph 4.2: Machinery tractors utilization per 100² kilometres of arable land for developed
countries.
0
50
100
150
200
250
300
350
400
450
500
1980 1982 1984 1986 1988 1990 1992 1994 1996 1998 2000 2002 2004 2006
Mac
her
iner
y I
dex
, 1
98
0=
10
0
Bangledesh
Benin
Burkina Faso
Burundi
Chad
Malawi
Mali
Mauritania
Nepal
Niger
Rwanda
Zambia
Machinery Index: Developing
(Machinery Tractors per 100² Km)
0
100
200
300
400
500
600
700
800
1980 1982 1984 1986 1988 1990 1992 1994 1996 1998 2000 2002 2004 2006
Mac
hin
ery I
nd
ex,
19
80
=1
00
Australia
Canada
Chile
Denmark
France
Germany
Hungary
Italy
S. Korea
Mexico
Norway
Spain
UK
US
Machinery Index: Developed
(Machinery Tractors per 100² Km)

25
Graph 5.1: Change in Fertilizer utilization as tonnes of fertilizer per hectares of arable land in
developing countries.
Graph 5.2: Change in Fertilizer utilization as tonnes of fertilizer per hectares of arable land in
developed countries.
0
50
100
150
200
250
300
350
19
80
19
81
19
82
19
83
19
84
19
85
19
86
19
87
19
88
19
89
19
90
19
91
19
92
19
93
19
94
19
95
19
96
19
97
19
98
19
99
20
00
20
01
20
02
20
03
20
04
20
05
20
06
Fer
tili
zer
Ind
ex,
19
80
=1
00
Bangledesh
Benin
Burkina Faso
Burundi
Chad
Malawi
Mali
Mauritania
Nepal
Niger
Rwanda
Zambia
Fertilizer Index Developing
(Tonnes of Fertilizer per Hectare of Arable Land)
0
50
100
150
200
250
300
350
19
80
19
81
19
82
19
83
19
84
19
85
19
86
19
87
19
88
19
89
19
90
19
91
19
92
19
93
19
94
19
95
19
96
19
97
19
98
19
99
20
00
20
01
20
02
20
03
20
04
20
05
20
06
Fer
tili
zer
Ind
ex,
19
80
=1
00
Fertilizer Index: Developed
(Tonnes of Fertilizer per Hectare of Arable Land)
Australia
Canada
Chile
Denmark
France
Germany
Hungary
Italy
S. Korea
Mexico
Norway
Spain
UK
US

26
Graph 6.1: Change in output per work as a measure of sector output in $US 2000 in developing
countries.
Graph 6.2: Change in output per worker as a measure of sector output in $US 2000 in developed
countries.
60
80
100
120
140
160
180
200
19
80
19
81
19
82
19
83
19
84
19
85
19
86
19
87
19
88
19
89
19
90
19
91
19
92
19
93
19
94
19
95
19
96
19
97
19
98
19
99
20
00
20
01
20
02
20
03
Outp
ut
Ind
ex,
19
80
=1
00
Bangledesh
Benin
Burkina Faso
Burundi
Chad
Malawi
Mali
Mauritania
Nepal
Niger
Rwanda
Zambia
Output Index: Developing
(Output per worker $US 2000)
60
80
100
120
140
160
180
200
19
80
19
81
19
82
19
83
19
84
19
85
19
86
19
87
19
88
19
89
19
90
19
91
19
92
19
93
19
94
19
95
19
96
19
97
19
98
19
99
20
00
20
01
20
02
20
03
20
04
20
05
20
06
Outp
ut
Ind
ex,
19
80
=1
00
Australia
Canada
Chile
Denmark
France
Germany
Hungary
Italy
S. Korea
Mexico
Norway
Spain
UK
US
Output Index: Developed
(Output per worker $US 2000)
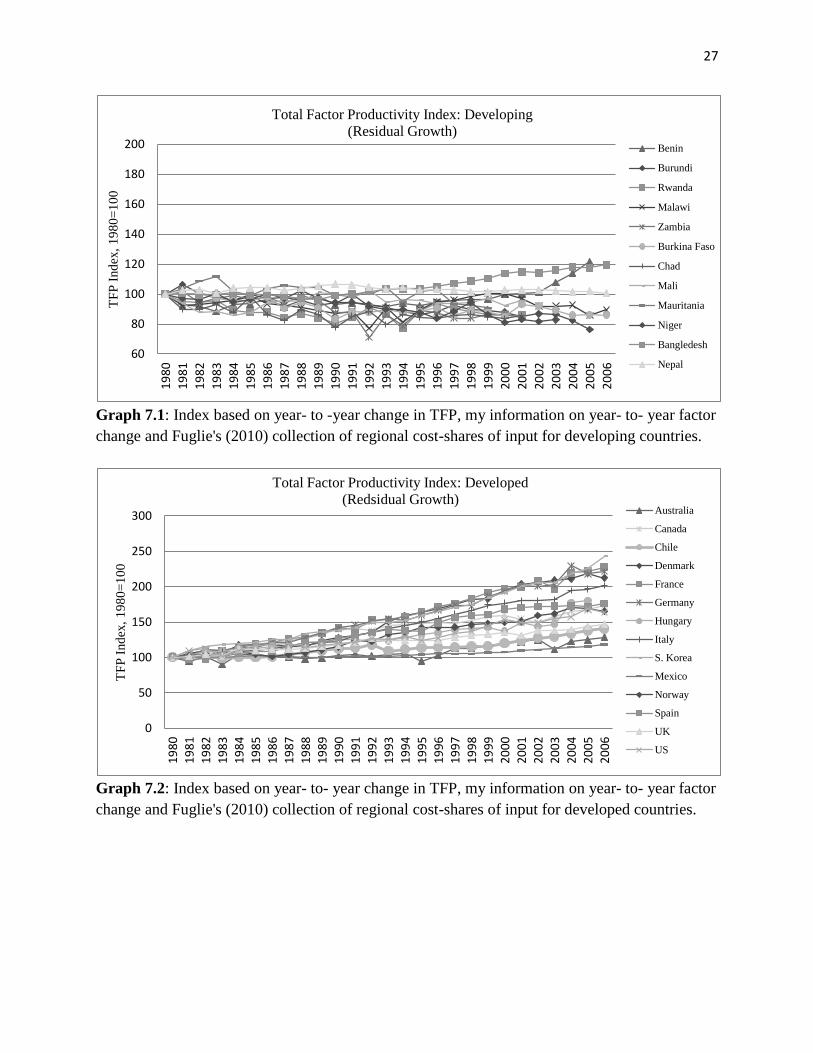
27
Graph 7.1: Index based on year- to -year change in TFP, my information on year- to- year factor
change and Fuglie's (2010) collection of regional cost-shares of input for developing countries.
Graph 7.2: Index based on year- to- year change in TFP, my information on year- to- year factor
change and Fuglie's (2010) collection of regional cost-shares of input for developed countries.
60
80
100
120
140
160
180
200
19
80
19
81
19
82
19
83
19
84
19
85
19
86
19
87
19
88
19
89
19
90
19
91
19
92
19
93
19
94
19
95
19
96
19
97
19
98
19
99
20
00
20
01
20
02
20
03
20
04
20
05
20
06
TF
P I
nd
ex,
19
80
=1
00
Total Factor Productivity Index: Developing
(Residual Growth) Benin
Burundi
Rwanda
Malawi
Zambia
Burkina Faso
Chad
Mali
Mauritania
Niger
Bangledesh
Nepal
0
50
100
150
200
250
300
19
80
19
81
19
82
19
83
19
84
19
85
19
86
19
87
19
88
19
89
19
90
19
91
19
92
19
93
19
94
19
95
19
96
19
97
19
98
19
99
20
00
20
01
20
02
20
03
20
04
20
05
20
06
TF
P I
nd
ex,
19
80
=1
00
Australia
Canada
Chile
Denmark
France
Germany
Hungary
Italy
S. Korea
Mexico
Norway
Spain
UK
US
Total Factor Productivity Index: Developed
(Redsidual Growth)