Embed Size (px)
Citation preview

To
KW
a
ARA
KCRQRP
1
idtIai
iCPeAstW
Cf
0d
Economics of Education Review 29 (2010) 187–199
Contents lists available at ScienceDirect
Economics of Education Review
journa l homepage: www.e lsev ier .com/ locate /econedurev
he effects of quantitative skills training on collegeutcomes and peers�
ristin F. Butcher, Patrick J. McEwan ∗, Corrine H. Taylorellesley College, United States
r t i c l e i n f o
rticle history:eceived 11 June 2009ccepted 12 June 2009
eywords:
a b s t r a c t
This paper estimates the causal effect of taking a course in quantitative reasoning onstudents’ academic performance and classroom peer-group composition at a liberal artscollege. To identify effects, the paper compares the outcomes of otherwise similar studentswho barely passed a baseline quantitative skills assessment (not taking the course) withstudents who barely failed (taking the course). The regression-discontinuity estimates show
ollegeegression discontinuityuantitative skillsemedialeer groups
little impact on academic outcomes for student close to the passing cutoff, including gradeson subsequent courses with quantitative content, but we are unable to distinguish smallfrom zero effects. Exogenous course assignment does affect the composition of students’classroom peer groups in subsequent years. The effects can only be generalized to studentsin the vicinity of the passing threshold (but not students with much worse quantitative
e). We
skills at the baselin. Introduction
Colleges and universities enroll students from diversentellectual, economic, racial, and ethnic backgrounds. Thisiversity necessarily means that some students are bet-
er prepared in some academic subject areas than others.n recognition of this diversity of skills and past training,nd in order to ensure that all students become proficientn mathematical, logical, and statistical tools required in� We are grateful to Larry Baldwin and Jessica Polito for their helpn organizing and interpreting the administrative data, and to Yo-Judheng and Sadia Raveendran for excellent research assistance. We thankaco Martorell, Tom Dee, and the participants of the Mellon 23 Confer-nce (September 2008) at Wellesley College for helpful comments. Thendrew W. Mellon Foundation and Wellesley College provided financialupport. We are responsible for any errors. The views expressed here arehe authors’ and not necessarily those of Wellesley College, the Andrew
. Mellon Foundation, or any other entity.∗ Corresponding author at: Wellesley College, Dept. of Economics, 106entral St., Wellesley, MA 02481, United States. Tel.: +1 781 283 2987;
ax: +1 781 283 2177.E-mail address: [email protected] (P.J. McEwan).
272-7757/$ – see front matter © 2009 Elsevier Ltd. All rights reserved.oi:10.1016/j.econedurev.2009.06.001
discuss implications for research and policy on remediation.© 2009 Elsevier Ltd. All rights reserved.
the curriculum, Wellesley College implemented a quanti-tative reasoning (QR) requirement in 1997. Students musttake a QR assessment administered during first-year ori-entation. If they fail that test, they must take and pass aone-semester quantitative skills course in their first year.1
This course is designed to teach applied quantitative skillsto students who were unable to pass the assessment examsuch that they can effectively participate in any course inthe curriculum.
Courses designed to deliver skills to allow students toeffectively participate in the broader curriculum are oftentermed remedial, developmental, or gatekeeper2 programsin American higher education. Such courses are common
1 The QR requirement has two parts. After passing either the QR examor the one-semester QR course, students must subsequently pass a QR“overlay” course—drawn from a menu across the curriculum—that appliesquantitative skills in a disciplinary setting. There is a list of courses thatfulfill this requirement, all of which require analysis of data.
2 The QR course at Wellesley is best described as a “gatekeeper” coursein this over-arching literature, since students earn credit toward a degreeby taking the course. Developmental and remedial courses often are notcredit-bearing.

f Educat
188 K.F. Butcher et al. / Economics oand costly, despite weak evidence on their impact on stu-dent learning (Koski & Levin, 1998; Levin & Calcagno, 2008).Impact estimates are often based on simple comparisons ofpost-program outcomes between participating and non-participating students. Students are usually assigned toparticipate on the basis of attributes (like baseline testscores) correlated with lower performance. Thus, suchcomparisons are almost preordained to yield disappoint-ing and biased assessments of program effects. Instead,this paper uses a regression-discontinuity design to obtaininternally valid estimates of the causal effect of taking a QRskills course on subsequent student performance (Imbens& Lemieux, 2008; Lee, 2008).
Our empirical approach is facilitated by test-basedassignment of students to the QR course. We compare stu-dents whose initial QR assessment scores fell just below thepassing cutoff score (the treatment group) with studentswhose scores fell just above the cutoff (the control group).We confirm that students’ probabilities of taking the courseincrease sharply below the cutoff, but that treatment andcontrol students are otherwise similar in their baselinecharacteristics such as race and SAT scores. We examinethe impact of taking the course on a number of academicoutcomes, including overall grade point averages, grades inthe first QR “overlay” course, the number of courses takenwith quantitative content, and the composition of students’classroom peer groups throughout their college careers. Wefind no consistent and statistically significant differencesin this limited set of academic outcomes, though we dofind that the course causes a statistically significant differ-ence in the composition of students’ classroom peer groups.Specifically, the course assignment increases the likelihoodthat students take courses with other students with lowbaseline quantitative skills, even by their senior year. Onehypothesis, not directly testable in our data, is that thereduced-form findings of our paper mask two countervail-ing effects on student learning: a positive effect of receivingquantitative skills training, but a potentially negative peereffect.
There are two important caveats to these findings.First, the empirical strategy identifies the causal effectfor students close to the passing cutoff. The aver-age math SAT score among these students is 600–650,which is very high compared to scores of typical stu-dents in remedial, developmental or gatekeeper classesat many institutions.3 We would also like to determinewhether the course has a measurable impact on stu-dents with the lowest baseline skills, but this wouldrequire a different evaluation design. Second, a smallcollege has, almost by definition, a small sample prob-lem. We attempt to overcome this by pooling multiple
years of data, facilitated by a common assessment andcourse assignment rule across 10 years. Even so, our sta-tistical tests are not powerful enough to detect smalleffects on student outcomes (although we do identify3 In comparison, the average among all college-bound high schoolseniors in 2007 was 515 (College Board SAT, 2007). The average math SATamong a sample of Florida students in public 2-year and 4-year collegeswas 490 (Calcagno and Long, 2008).
ion Review 29 (2010) 187–199
effects of course-taking on subsequent peer-group compo-sition).
These results generate additional research and policyquestions. For example, if this course, and courses like it, donot have an impact on the academic performance of the stu-dents who are on the current threshold of being assigned totake the course, should the threshold be lowered, perhapsallowing more intensive targeting of resources toward stu-dents at the bottom of the skills distribution? If so, how canwe credibly and feasibly evaluate whether such a programhas a causal impact on outcomes? Finally, if the currentmethod of delivering basic skills has an unintended con-sequence of shifting students’ peer groups, can treatmentsbe delivered in a way that avoids the potentially negativeconsequences of peer sorting?
The paper proceeds as follows. Section 2 discussesprior research on remedial, developmental and gatekeepercourses. Section 3 provides detailed background on theQR program. Section 4 describes the data, and Section 5presents the details on the empirical strategy. Section 6presents the results, and Section 7 concludes and discussesadditional research and policy questions.
2. Prior research
This study has much in common with a small numberof papers that use quasi-experimental techniques to eval-uate the causal impact of remedial, developmental, andgatekeeper courses on student outcomes. Understandingthe impact of these courses is very important: perhapsone-third of students entering post-secondary educationare not ready for college-level work (Bettinger & Long,2009). Tremendous resources are devoted to remedial edu-cation, but little is known about the causal impact ofthese programs on academic outcomes of at-risk students(Levin & Calcagno, 2008). Several recent papers apply aregression-discontinuity design in settings where place-ment in remedial programs is based on test score cutoffs.These papers compare the post-program differences in out-comes between students just below and just above theassignment threshold.
Calcagno and Long (2008) examine administrative datafor 100,000 students at Florida’s 2-year and 4-year colleges.All college students take a standardized test that measuresbasic skills, and are referred to remedial education coursesbased on the exam score. Martorell and McFarlin (2007)use administrative data on more than 450,000 2-year and4-year college students in Texas where students are alsoreferred to remedial education based on their score on anassessment exam relative to a strict cutoff. Lesik (2006,2007) uses data from a single cohort entering one 4-yearpublic university (approximately 1200 students), exploit-ing a similar discontinuity strategy.
The evidence from these papers is mixed. Lesik (2006,2007) finds positive effects, with a remedial math courseincreasing the probability of passing a subsequent college-
level math course and decreasing the probability ofdropping out of college. Calcagno and Long (2008) find thatwhile assignment to remediation appears to increase per-sistence to the second year and the total number of creditscompleted, it does not appear to increase the comple-
f Educat
tMrmco
aOearTctttlti
cgorladgui(stms
FaootaosWaoo
3
3
piaees
dents with the QR skills they will need in their subsequentquantitative coursework, including, but not limited to, therequired QR overlay course. QR skills are also required inother courses with quantitative content (such as introduc-
K.F. Butcher et al. / Economics o
ion of college-level credits or eventual degree completion.artorell and McFarlin (2007) find weak evidence that
emediation improves the grades received in college-levelath, but no evidence that remediation improves years of
ollege completed, academic credits attempted, the receiptf a college degree, or labor market performance.
Bettinger and Long (2009) find different results usingdifferent empirical strategy for administrative data fromhio. They exploit the fact that different institutionsmploy different rules for referring students to remedi-tion. Thus, students with a given test score might beeferred to remediation at one institution, but not another.hey use the distance between a student’s home and stateolleges to control for a student’s selection of which insti-ution to attend. They find that students who are inducedo take remedial education classes by virtue of their insti-ution’s rules are more likely to persist in college and moreikely to complete a degree than are students with similarest scores and background characteristics who were notnduced to take remedial classes.
Finally, in addition to the quasi-experimental evidenceited above, there is some experimental evidence on pro-rammatic interventions to improve academic outcomesf at-risk students. Angrist, Lang, and Oreopoulos (2009)eport on the results of a randomized controlled trial at aarge Canadian university concerned about drop out ratesnd poor achievement. Low-achieving students were ran-omly assigned to a control group and three treatmentroups, including (1) a financial incentive (cash award ofp to a full year’s tuition); (2) academic support services
ncluding mentoring and supplemental instruction; and3) a combination of both financial incentives and supportervices. Women’s grades were significantly higher in thewo groups that received financial incentives, and there is
odest evidence that the combination of incentives andervices was more effective than incentives alone.
Our paper differs from this research in several ways.irst, the average “remedial” student in our sample is higherchieving than other samples, and exclusively female. Sec-nd, the content of the QR treatment is different: it consistsf a single, intensively applied, and relatively homogeneousreatment (unlike the multiple, heterogeneous treatmentspplied across state university systems). Third, the studentutcomes of interest are different. Prior research focuses ontudent retention, drop out rates, and course completion.
ellesley College has a very low drop out rate (McEwannd Soderberg, 2006), so we instead focus on the numberf quantitative courses completed, and grades in these andther courses.
. Background
.1. The quantitative reasoning requirement
The Quantitative Reasoning (QR) requirement has twoarts: (1) a “basic skills” component, to ensure that enter-
ng students are well prepared for quantitative courseworkcross the curriculum, and (2) an “overlay” component, tonsure that graduating students are proficient in math-matical, logical, and statistical tools (Taylor, 2006). Atudent satisfies the basic skills requirement by passing the
ion Review 29 (2010) 187–199 189
QR assessment upon entering the College, or by passing aone-semester basic skills course (“Introduction to Quanti-tative Reasoning”) in her first year at the college. Fulfilmentof the QR basic skills requirement is a prerequisite for sub-sequent courses with quantitative content. To satisfy thesecond requirement, a student must pass a QR “overlay”course that emphasizes statistical analysis and interpreta-tion of data. Some overlay courses are discipline-specificstatistics courses; others are laboratory science courses inwhich students collect and analyze data and present theirfindings in labs.
3.2. Testing and course assignment
The QR assessment, administered during first-year ori-entation, consists of 18 questions, mainly open-response.Each response is graded as full-credit, half-credit, or nocredit. A score of 9.5 (out of 18) or better is required to passthe assessment; a similar assessment and passing thresholdhave been employed since 1997. Students whose highestassessment score is between 9.5 and 12.0 are advised thatthey may opt to take the basic skills class to improve theirQR skills. Students who score 9 or below are required toenroll in the basic skills course in their first year at thecollege.
Students can voluntarily take a re-test 1 day after tak-ing the first test. We denote T1
ias student i’s score on the
first assessment and T2i
as her score on the optional re-test. In practice, few students opt to re-test if T1
i> 9, and
few students voluntarily take the QR basic skills courseif max(T1
i, T2
i) > 9. If max(T1
i, T2
i) ≤ 9, then the course is
mandatory.
3.3. Description of the treatment
Depending on the year, between 6 and 10% of the enter-ing class is required to take the QR basic skills course.In the semester-long course, students review mathemat-ical content from secondary school (including numeracy,algebra, linear and exponential modeling, graphing, geom-etry, basic probability and statistics, and formal logic).The students practice with these skills in a variety ofauthentic contexts, such as medical decision-making andpersonal finance. The basic skills course enhances students’capabilities in six areas: (1) reading and understand-ing quantitative information; (2) interpreting quantitativeinformation and drawing appropriate references; (3) solv-ing problems; (4) estimating answers and checking forreasonableness; (5) communicating quantitative informa-tion; and (6) recognizing the limits of mathematical orstatistical models.4
This approach is designed to provide first-year stu-
4 These are the six key QR areas identified by the Mathematics Asso-ciation of America. They are consistent with many of the best-practiceelements of courses identified by Koski and Levin (1998).
190 K.F. Butcher et al. / Economics of EducatTa
ble
1D
escr
ipti
vest
atis
tics
.
Full
sam
ple
Stu
den
td
idn
otta
kequ
anti
tati
vesk
ills
cou
rse
Stu
den
tto
okqu
anti
tati
vesk
ills
cou
rse
Mea
nS.
D.
NM
ean
S.D
.N
Mea
nS.
D.
N
Took
cou
rse
0.08
363
110.
00
057
851.
00
052
6Fi
rst
asse
ssm
ent
scor
e(T
1)
12.6
162.
985
6311
13.1
512.
433
5785
6.72
92.
004
526
1{T1
≤9}
0.13
563
110.
060
5785
0.95
852
6St
ud
ent
took
re-t
est
0.09
063
110.
060
5785
0.41
652
6R
e-te
stsc
ore
(T2)
9.93
82.
824
565
11.6
011.
867
346
7.31
11.
949
219
1{T2
≤9}
0.37
556
50.
017
346
0.94
121
9G
rad
ep
oin
tav
erag
e0.
00
01.
00
063
040.
044
0.98
157
78−0
.484
1.07
852
6Pr
opor
tion
oflo
wgr
ades
0.04
70.
100
6310
0.04
40.
098
5784
0.07
40.
121
526
“Ove
rlay
”co
urs
egr
ade
0.0
00
1.0
00
440
60.
053
0.96
841
26−0
.775
1.14
128
0N
o.of
cou
rses
take
nw
ith
quan
t.sk
ills
pre
requ
isit
e3.
057
1.70
563
113.
110
1.70
557
852.
473
1.60
452
6M
ath
SAT
scor
e67
3.14
366
.350
5887
680
.853
60.8
6254
5457
6.02
854
.961
433
Ver
balS
AT
scor
e6
84.7
7669
.804
5886
688
.694
67.9
3054
5363
5.42
774
.202
433
AC
Tsc
ore
29.1
882.
927
1582
29.5
872.
625
1425
25.5
733.
058
157
Afr
ican
-Am
eric
an0.
050
6311
0.03
357
850.
234
526
Lati
na
0.05
263
110.
043
5785
0.14
852
6A
sian
orA
sian
-Am
eric
an0.
240
6311
0.25
857
850.
051
526
Oth
er0.
212
6311
0.21
357
850.
203
526
Wh
ite
0.4
4663
110.
454
5785
0.36
352
6N
on-t
rad
itio
nal
stu
den
t0.
026
6311
0.01
857
850.
103
526
Not
e:St
and
ard
dev
iati
ons
are
not
rep
orte
dfo
rbi
nar
yva
riab
les.
See
text
for
det
ails
ofsa
mp
lean
dva
riab
les.
ion Review 29 (2010) 187–199
tory economics or physics courses) for which the basic skillsclass is a prerequisite.
The basic skills course is typically offered four timeseach year, with three sections in the fall and one in thespring. Class enrollments are usually capped at 15. Thesmall class size allows for cooperative learning and indi-vidualized attention. Classes meet in “lecture” twice eachweek and in “lab” once each week. The “lecture” meetingsare in a conference room so that students face each otherat one large table and have ample opportunities to workwith each other. The “lab” meetings are held in a computerlaboratory and often involve the use of Excel to practiceQR skills with real data. Anecdotally, students report thatmeeting three times each week in such a collaborative envi-ronment results in their getting to know each other betterin this first-year class than in most other lower-level classesat the College. Thus, a potential concern is that weaker stu-dents who are “tracked” into the basic skills course willcontinue to attend courses and study with lower-achievingpeers instead of students with relatively stronger QR skills.
4. Data
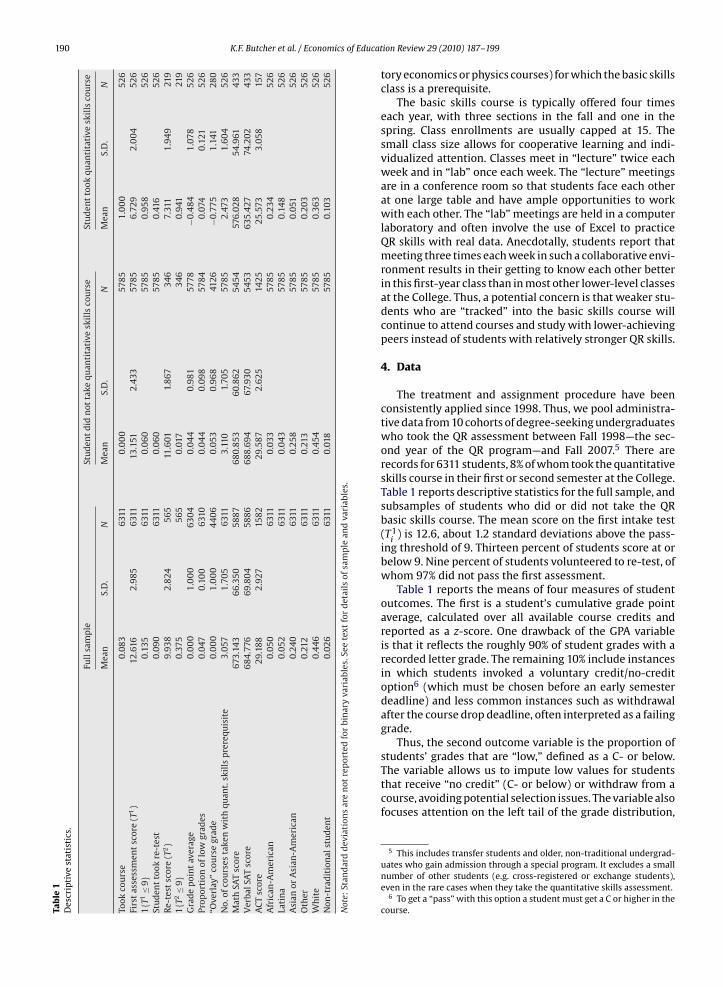
The treatment and assignment procedure have beenconsistently applied since 1998. Thus, we pool administra-tive data from 10 cohorts of degree-seeking undergraduateswho took the QR assessment between Fall 1998—the sec-ond year of the QR program—and Fall 2007.5 There arerecords for 6311 students, 8% of whom took the quantitativeskills course in their first or second semester at the College.Table 1 reports descriptive statistics for the full sample, andsubsamples of students who did or did not take the QRbasic skills course. The mean score on the first intake test(T1
i) is 12.6, about 1.2 standard deviations above the pass-
ing threshold of 9. Thirteen percent of students score at orbelow 9. Nine percent of students volunteered to re-test, ofwhom 97% did not pass the first assessment.
Table 1 reports the means of four measures of studentoutcomes. The first is a student’s cumulative grade pointaverage, calculated over all available course credits andreported as a z-score. One drawback of the GPA variableis that it reflects the roughly 90% of student grades with arecorded letter grade. The remaining 10% include instancesin which students invoked a voluntary credit/no-creditoption6 (which must be chosen before an early semesterdeadline) and less common instances such as withdrawalafter the course drop deadline, often interpreted as a failinggrade.
Thus, the second outcome variable is the proportion ofstudents’ grades that are “low,” defined as a C- or below.
The variable allows us to impute low values for studentsthat receive “no credit” (C- or below) or withdraw from acourse, avoiding potential selection issues. The variable alsofocuses attention on the left tail of the grade distribution,5 This includes transfer students and older, non-traditional undergrad-uates who gain admission through a special program. It excludes a smallnumber of other students (e.g. cross-registered or exchange students),even in the rare cases when they take the quantitative skills assessment.
6 To get a “pass” with this option a student must get a C or higher in thecourse.
f Educat
wltfaqtti
taogficc
acitamc
abdsoss
5
sp
O
waXεeTcit
miieo
aa
K.F. Butcher et al. / Economics o
hich includes disproportionate numbers of students withow quantitative skills. The third outcome variable is the let-er grade in the mandatory QR “overlay” course, taken afterulfilling the basic skills requirement. It is also reported asz-score.7 The fourth variable is the number of (optional)uantitative courses taken by students over the course ofheir college careers. We define these as courses that listhe QR basic skills components as a prerequisite, includingntroductory courses across the social and natural sciences.
Finally, we posit that students’ exogenous assignmento the QR basic skills course also represents an exogenousssignment to a set of classroom peers. To assess the effectsf the treatment on the composition of classroom peerroups over time, we calculate for each student—in theirrst, second, third, and fourth years—the proportion of theirlassmates in that year who ever took the QR basic skillsourse.
In Table 1, the mean differences in outcome vari-bles favor students who did not take the QR basic skillsourse. This is unsurprising, given that course assignments based on objective measures of pre-enrollment quan-itative skills. However, it highlights the pitfalls in naïvettempts to estimate course treatment effects by simpleean comparisons, or even regression approaches that
ondition on a limited set of student background variables.Other variables in Table 1 show that students are racially
nd ethnically diverse, and arrive at the College with highaseline achievement on standardized tests. However, stu-ents are clearly not assigned at random to the quantitativekills course. African-American and Latina students arever-represented, as are students with “low” SAT and ACTcores. It bears emphasis, however, that these scores aretill high compared to national samples.
. Empirical strategy
We wish to estimate the causal effect of the QR basickills course on students’ academic outcomes. A startingoint is the following linear regression:
i = ˇ0 + ˇiRi + Xiˇ2 + εi (1)
here Oi is the outcome of student i, Ri is a dummy vari-ble indicating whether a student has taken the course,i is a vector of student-specific control variables, andi is an error term. One can interpret ˇ1 as the causalffect of taking a remedial course, but only if cov(Ri,εi) = 0.he assumption is implausible in settings where studentshoose, or are assigned to, remedial courses on the basis ofmperfectly observed variables, such as ability or motiva-ion, that also affect performance.
In contrast, course assignment at Wellesley College pri-arily occurs on the basis of observed intake assessments,
n concert with a pre-determined passing threshold. Todentify the course effect ˇ1, we rely upon sharp andxogenous variation in the probability of course-taking thatccurs when students cross this threshold. Consider the
7 We estimated specifications using a binary variable indicating low-chievement in an overlay course, but these always yielded similar results,nd are not reported in this paper.
ion Review 29 (2010) 187–199 191
following equations, estimated by two-stage least squares(TSLS) in the full sample of students (see Imbens & Lemieux,2008; McEwan & Shapiro, 2008 for related discussion):
Ri = ˛0 + ˛1 × 1{T1i ≤ 9} + f (T1
i ) + �i (2)
Oi = ˇ0 + ˇ1Ri + f (T1i ) + ωi (3)
In Eq. (2), the first-stage, the course-taking dummy vari-able is regressed on a dummy variable indicating scores onthe first assessment below the assignment threshold—theindicator function 1{T1
i≤ 9}—which serves as the excluded
instrument. Eq. (2) also controls for a smooth function of T1i
,initially specified as a piecewise quadratic polynomial:
f (T1i ) = ı1T1
i + ı2(T1i )
2 + ı3 × 1{T1i ≤ 9} × (T1
i − 9) + ı4
×1{T1i ≤ 9} × (T1
i − 9)2
We assess the fit of this functional form by visual inspec-tion of the unsmoothed means of the dependent variablewithin discrete tests score values, and also by verifying thatresults are robust to alternate specifications of the piece-wise spline of test scores. In all subsequent regressions, weadjust standard errors for clustering within the smallestdiscrete values of the assignment variables, to account forpotential misspecification of functional form (Lee & Card,2008).
We anticipate that a score below the passing cutoff willnot perfectly predict course-taking (0 < �˛1 < 1), since aportion of students might choose to re-test and obtain apassing score. Further, a small number of students chooseto take the course despite obtaining a barely passing scoreon the first assessment.
In the second-stage regression (Eq. (3)), ˇ1 identifiesthe causal effect of course-taking if cov(1{T1
i≤ 9}, ωi) = 0.
Stated differently, students close to the passing thresh-old must be similar in observed and unobserved waysthat affect outcomes, conditional on the smooth func-tion of T1
i. This seems likely, as long as students’ precise
scores on T1i
—whether 9 or just above—have a randomcomponent. It would be less likely if students or admin-istrators precisely manipulate T1
iin the vicinity of the
threshold, perhaps inducing correlations between T1i
andstudent attributes (Lee, 2008; McCrary, 2008). This seemsimplausible in the present context since testing con-ditions are carefully monitored to avoid cheating, andthe actual tests are graded without students’ identifyingdata.
Still, we can explicitly test whether the observed charac-teristics Xi vary sharply around the threshold by estimatingEq. (2) with each Xi as a dependent variable. Further, esti-mates of course effects should be insensitive to controls forXi. Finally, we can examine the histogram of V1
ito search for
clustering of students on either side of the passing thresh-old, indicative of score manipulation.
Finally, it bears emphasis that the treatment effect maybe heterogeneous across subpopulations of students. In thiscase, Eq. (3) yields estimates of local average treatmenteffect for students who: (1) obtain scores on T1
ithat are
close to 9, and (2) are induced to take the course by virtue of

192 K.F. Butcher et al. / Economics of Education Review 29 (2010) 187–199
eport hite value
Fig. 1. Quantitative assessments and course-taking. Note: The top panels rcircles indicate the proportion of students taking the course within discrequadratic polynomials estimated on either side of the cutoff.
scoring below the threshold (typically students who optednot to re-test, or did so unsuccessfully).
6. Results
6.1. Assignment to the quantitative skills course
We first confirm that course assignment followed thestated procedures. The top-left panel of Fig. 1 reports a his-togram of the first assessment score (T1
i). It is relatively
smooth, and there is no evidence of bunching of observa-tions to the right or left of the passing cutoff (indicated bya dotted line), which could indicate test score manipula-tion. In the bottom-left panel, circles illustrate mean values
of the course-taking dummy variable, taken within bins of0.5 points on the first assessment score (the smallest unitof T1i). The solid lines are fitted values of quadratic poly-
nomials, estimated separately on either side of the passingthreshold. The panel shows a sharp increase in the propor-tion of course-takers as scores decline from 9.5 to 9.8 In
8 The panel also shows that students well below the threshold are morelikely to take the course than students just below it. Students closer tothe threshold are more likely to take the re-test, ensuring for some thatmax(T1
i, T2
i) > 9 and that they can avoid taking the course.
stograms of three quantitative assessment variables. In the bottom panels,s of each quantitative assessment variable. Lines indicate fitted values of
column (1) of Table 2, we report estimates based on Eq. (2),the empirical counterpart to the panel. The estimated sizeof the break in course-taking is 0.35. It is highly significant(T = 19.4), and invariant to the inclusion of an additional setof student background controls (column 2). The upcomingresults will rely on this source of variation in the course-taking probability to identify effects on student outcomes.
The middle and right-most panels of Fig. 1 suggest twoother empirical approaches; we will argue that the first isless feasible and the second is inadvisable. In the upper-middle panel, we report the histogram of the re-test score(T2
i), among the 9% of our sample that opted to take it. The
much smaller sample size is evident from the y-axis scaleand the more jagged distribution. The bottom-middle panelshows, as expected, that the re-test score results are bind-ing, since the vast majority students with T2
i≤ 9 take the
course. We could potentially leverage this source of vari-ation to estimate course effects. Empirically, the analysiswould be based on Eqs. (2) and (3), replacing T1
iwith T2
iand
limiting the sample to re-test students. While we reportresults from this specification as a robustness check, the
much smaller sample size severely limits the precision ofestimates.The upper-right panel of Fig. 1 shows the histogram ofmax(T1
i, T2
i), the maximum assessment score obtained by
a student on either the first test or the re-test. In some col-

K.F. Butcher et al. / Economics of Educat
Tab
le2
Firs
t-st
age
esti
mat
esan
dch
ecks
for
smoo
thn
ess
ofba
ckgr
oun
dva
riab
les
arou
nd
cuto
ff.
Dep
end
ent
vari
able
:
Took
quan
tita
tive
skil
lsco
urs
eM
ath
SAT
Ver
balS
AT
AC
TA
fric
an-A
mer
.La
tin
aA
sian
/Asi
an-A
mer
.O
ther
Wh
ite
Old
erst
ud
ent
(1)
(2)
(3)
(4)
(5)
(6)
(7)
(8)
(9)
(10)
(11)
1{T1
≤9}
0.34
9**(0
.018
)0.
349**
(0.0
19)
−0.2
50(3
.110
)−2
.442
(5.1
65)
0.57
1(0
.361
)−0
.005
(0.0
21)
0.03
2(0
.023
)−0
.005
(0.0
26)
−0.0
15(0
.038
)−0
.006
(0.0
29)
0.01
7(0
.011
)O
bser
vati
ons
6294
6294
5878
5877
1579
6294
6294
6294
6294
6294
6294
Ad
j.R
20.
574
0.58
40.
413
0.06
20.
273
0.07
20.
033
0.04
70.
004
0.01
10.
024
Con
trol
s?N
oYe
sN
oN
oN
oN
oN
oN
oN
oN
oN
o
* Sta
tist
ical
sign
ifica
nce
at5%
.Not
e:R
obu
stst
and
ard
erro
rsar
ein
par
enth
eses
,clu
ster
edon
dis
cret
eva
lues
ofT
1 i.A
llre
gres
sion
sco
ntr
olfo
ra
pie
cew
ise
quad
rati
cp
olyn
omia
lof
T1 i
(see
text
for
det
ails
).C
olu
mn
(2)
con
trol
sfo
rm
ath
and
verb
alSA
Tsc
ores
,AC
Tsc
ores
,an
dd
um
my
vari
able
sin
dic
atin
gm
issi
ng
valu
esof
thes
eva
riab
les.
Con
trol
sal
soin
clu
de
du
mm
yva
riab
les
ind
icat
ing
non
-tra
dit
ion
alst
ud
ents
,gro
up
sof
race
and
eth
nic
ity,
and
the
year
inw
hic
hth
equ
anti
tati
veas
sess
men
tw
asta
ken
.**
Stat
isti
cals
ign
ifica
nce
at1%
.
ion Review 29 (2010) 187–199 193
lege settings, this is the only variable recorded in officialdatabases, but its use in regression-discontinuity designsis potentially problematic.9 Our histogram suggests why:there is a significant notch of the distribution, just below9, that has been (non-randomly) removed. It is the resultof voluntary re-test students increasing their maximumscores. The bottom-right panel confirms that almost all stu-dents with maximum scores below 9.5 take the course.
At first blush, the sharp variation in course-takinginduced by the “maximum score” assignment variableseems to make it a good candidate for implementing a dis-continuity design. However, the voluntary re-testing andre-sorting of students around the threshold could introducecorrelations between the maximum test score and unex-plained outcomes (e.g., less motivated students are lesslikely to voluntarily re-test, more likely to take the course,and less likely to obtain high grades). It is a special case ofthe common phenomenon of assignment variable manip-ulation in the regression-discontinuity design (McEwan &Shapiro, 2008; McCrary, 2008). In a robustness check, wewill report estimates of Eqs. (2) and (3) that use max(T1
i, T2
i)
as the assignment variable instead of T1i
. The results suggestthat course-taking could actually have an adverse effect onstudent outcomes, but these estimates are likely biased byendogenous re-testing.
6.2. Smoothness of student variables around cutoffs
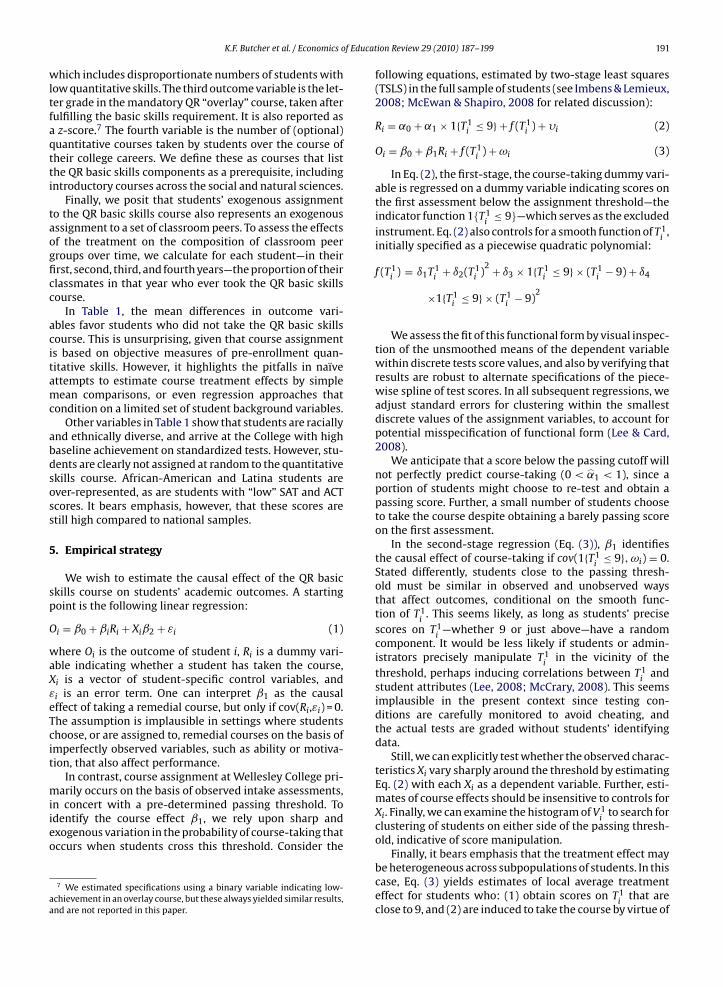
Fig. 2 reports an important test of whether sharp vari-ation in course-taking probabilities is exogenous. In eachpanel, the circles show mean values of student variablestaken within discrete values of T1
i, in addition to fitted val-
ues of piecewise quadratic polynomials. The panels revealthat students with lower assessment scores are more likelyto have lower entrance exam scores, and more likely tobe African-American. This is consistent with the descrip-tive statistics in Table 1, suggesting that course assignmentrules disproportionately “tracks” relatively lower-abilityand non-white students into separate classes.
However, there is no evidence of sharp breaks in thesestudent characteristics close to the passing cutoff at 9.To the contrary, it appears that students just below andabove the cutoffs are observably similar (and, by impli-cation, similar in their unobserved attributes that affectstudent outcomes). Table 2 confirms this by reporting pointestimates of the size of the difference at the cutoff; theestimates are based on Eq. (2) and successively use eachstudent background variable as the dependent variable. Thecoefficients are generally small and statistically insignifi-cant, lending credibility to our empirical strategy.
As the sample sizes in Tables 1 and 2 indicate, somestudents do not report SAT or ACT scores. This raises thepossibility that sample selection in test-taking close to thethreshold artificially creates the appearance of smoothness.
9 As in this paper, Martorell and McFarlin (2007) focus on students’first test score as the assignment variable in a regression-discontinuitydesign. Calcagno and Long (2008) only have access to students’ mostrecent placement score, but attempt to identify a subset of institutionswhere re-testing is not commonly employed.
194 K.F. Butcher et al. / Economics of Education Review 29 (2010) 187–199
: Circlesdratic p
Fig. 2. Quantitative assessments and students’ background variables. Noteof the quantitative assessment variable. Lines indicate fitted values of qua
In results not reported here, we compared the proportionof students reporting SAT and ACT scores near cutoffs, and
found no evidence of a sharp break in sample selection nearthe threshold. In subsequent regression estimates that con-dition on student variables, we include dummy variablesfor missing values of these variables, to avoid eliminatingany observations from regressions.Fig. 3. Quantitative assessments and students’ academic outcomes. Note: Circlesof the quantitative assessment variable. Lines indicate fitted values of quadratic p
indicate the mean values of y-axis variables, taken within discrete valuesolynomials estimated on either side of the cutoff.
6.3. Effects on student outcomes
We use four measures of college performance, asdescribed in Section 4. These include (1) each student’scumulative grade point average (GPA), (2) each student’sproportion of courses with a low grade (C- or below), (3)each student’s grade in the mandatory QR “overlay” course,
indicate the mean values of y-axis variables, taken within discrete valuesolynomials estimated on either side of the cutoff.
f Education Review 29 (2010) 187–199 195
atp
ddashlsan
rovmapacrmtcs
miocvtmto
oIeiofd
6
smctfip
b
n(
stsq
uar
eses
tim
ates
.
Prop
orti
onlo
wgr
ades
Ove
rlay
grad
eN
um
ber
ofqu
anti
tati
veco
urs
esta
ken
Prop
.of
“eve
r-ta
kers
”in
firs
tye
ar
Prop
.of
“eve
r-ta
kers
”in
seco
nd
year
Prop
.of
“eve
r-ta
kers
”in
thir
dye
ar
Prop
.of
“eve
r-ta
kers
”in
fou
rth
year
(3)
(4)
(5)
(6)
(7)
(8)
(9)
(10)
(11)
(12)
(13)
(14)
(15)
(16)
7 3)0.
003
(0.0
10)
0.0
03(0
.011
)0.
123
(0.1
00)
0.12
8(0
.114
)−0
.025
(0.1
04)
0.06
6(0
.084
)0.
029**
(0.0
02)
0.03
0**
(0.0
02)
0.0
03(0
.002
)0.
004
(0.0
02)
0.0
06(0
.005
)0.
005
(0.0
04)
0.0
08**
(0.0
02)
0.0
08**
(0.0
02)
6293
6293
440
04
400
6294
6294
6294
6294
5390
5390
3876
3876
3754
3754
0.01
00.
031
0.09
50.
135
0.01
90.
199
0.34
40.
418
0.12
50.
213
0.07
10.
127
0.07
40.
123
8 2)0.
008
(0.0
29)
0.0
09(0
.031
)0.
386
(0.3
19)
0.40
8(0
.373
)−0
.073
(0.2
97)
0.19
0(0
.24
8)0.
082**
(0.0
07)
0.08
6**
(0.0
05)
0.01
0(0
.006
)0.
012
(0.0
07)
0.01
7(0
.012
)0.
013
(0.0
12)
0.02
4**
(0.0
07)
0.02
3**
(0.0
07)
6293
6293
440
04
400
6294
6294
6294
6294
5390
5390
3876
3876
3754
3754
No
Yes
No
Yes
No
Yes
No
Yes
No
Yes
No
Yes
No
Yes
te:
Rob
ust
stan
dar
der
rors
are
inp
aren
thes
es,c
lust
ered
ond
iscr
ete
valu
esof
T1 i.I
np
anel
A,r
egre
ssio
ns
con
trol
for
ap
iece
wis
equ
adra
tic
pol
ynom
ialo
fT
1 i(s
eete
xtfo
rd
etai
ls).
nd
verb
alSA
Tsc
ores
,AC
Tsc
ores
,an
dd
um
my
vari
able
sin
dic
atin
gm
issi
ng
valu
esof
thes
eva
riab
les.
Con
trol
sal
soin
clu
de
du
mm
yva
riab
les
ind
icat
ing
non
-tra
dit
ion
alst
ud
ents
,h
eye
arin
wh
ich
the
quan
tita
tive
asse
ssm
entw
asta
ken
.In
pan
elB
,eac
hce
llis
the
coef
fici
entf
rom
ase
par
ate
TSLS
regr
essi
on,w
ith
the
du
mm
yva
riab
le1{
T1≤
9}as
the
excl
ud
edd
(3).
Firs
t-an
dse
con
d-s
tage
regr
essi
ons
con
trol
for
ap
iece
wis
equ
adra
tic
pol
ynom
ialo
fT1 i.
K.F. Butcher et al. / Economics o
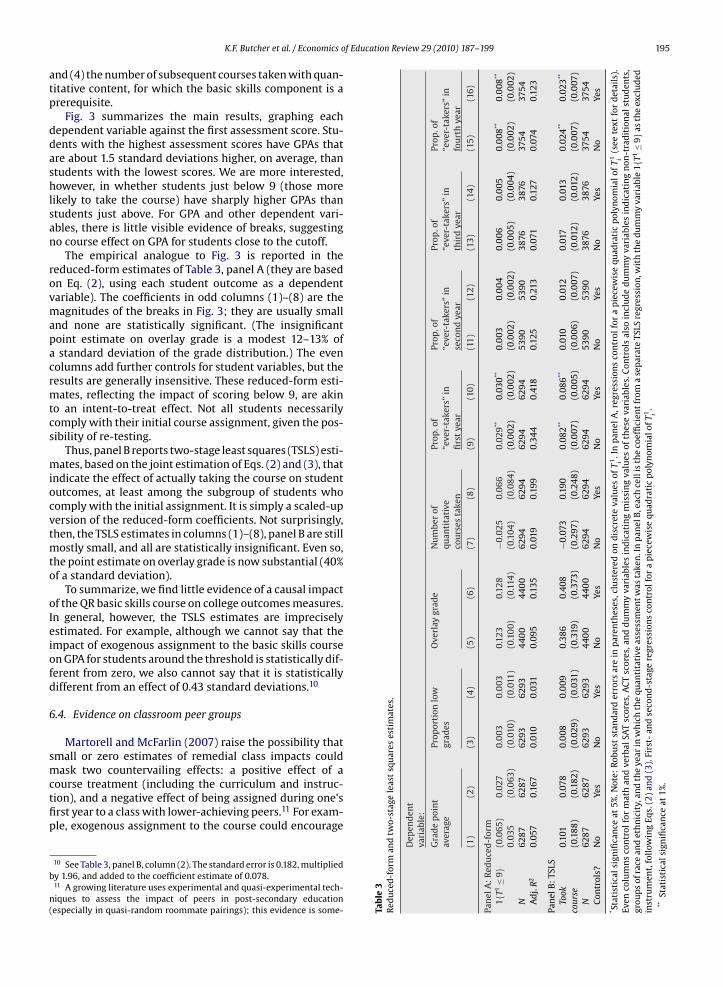
nd (4) the number of subsequent courses taken with quan-itative content, for which the basic skills component is arerequisite.
Fig. 3 summarizes the main results, graphing eachependent variable against the first assessment score. Stu-ents with the highest assessment scores have GPAs thatre about 1.5 standard deviations higher, on average, thantudents with the lowest scores. We are more interested,owever, in whether students just below 9 (those more
ikely to take the course) have sharply higher GPAs thantudents just above. For GPA and other dependent vari-bles, there is little visible evidence of breaks, suggestingo course effect on GPA for students close to the cutoff.
The empirical analogue to Fig. 3 is reported in theeduced-form estimates of Table 3, panel A (they are basedn Eq. (2), using each student outcome as a dependentariable). The coefficients in odd columns (1)–(8) are theagnitudes of the breaks in Fig. 3; they are usually small
nd none are statistically significant. (The insignificantoint estimate on overlay grade is a modest 12–13% ofstandard deviation of the grade distribution.) The even
olumns add further controls for student variables, but theesults are generally insensitive. These reduced-form esti-ates, reflecting the impact of scoring below 9, are akin
o an intent-to-treat effect. Not all students necessarilyomply with their initial course assignment, given the pos-ibility of re-testing.
Thus, panel B reports two-stage least squares (TSLS) esti-ates, based on the joint estimation of Eqs. (2) and (3), that
ndicate the effect of actually taking the course on studentutcomes, at least among the subgroup of students whoomply with the initial assignment. It is simply a scaled-upersion of the reduced-form coefficients. Not surprisingly,hen, the TSLS estimates in columns (1)–(8), panel B are still
ostly small, and all are statistically insignificant. Even so,he point estimate on overlay grade is now substantial (40%f a standard deviation).
To summarize, we find little evidence of a causal impactf the QR basic skills course on college outcomes measures.n general, however, the TSLS estimates are impreciselystimated. For example, although we cannot say that thempact of exogenous assignment to the basic skills coursen GPA for students around the threshold is statistically dif-erent from zero, we also cannot say that it is statisticallyifferent from an effect of 0.43 standard deviations.10
.4. Evidence on classroom peer groups
Martorell and McFarlin (2007) raise the possibility thatmall or zero estimates of remedial class impacts couldask two countervailing effects: a positive effect of a
ourse treatment (including the curriculum and instruc-ion), and a negative effect of being assigned during one’srst year to a class with lower-achieving peers.11 For exam-le, exogenous assignment to the course could encourage
10 See Table 3, panel B, column (2). The standard error is 0.182, multipliedy 1.96, and added to the coefficient estimate of 0.078.11 A growing literature uses experimental and quasi-experimental tech-iques to assess the impact of peers in post-secondary educationespecially in quasi-random roommate pairings); this evidence is some- Ta
ble
3R
edu
ced
-for
man
dtw
o-st
age
lea
Dep
end
ent
vari
able
:
Gra
de
poi
nt
aver
age
(1)
(2)
Pan
elA
:R
edu
ced
-for
m1{
T1≤
9}(0
.065
)0.
035
0.02
(0.0
6N
6287
6287
Ad
j.R
20.
057
0.16
7
Pan
elB
:TS
LSTo
okco
urse
0.10
1(0
.188
)0.
07(0
.18
N62
8762
87C
ontr
ols?
No
Yes
* Sta
tist
ical
sign
ifica
nce
at5%
.No
Even
colu
mn
sco
ntr
olfo
rm
ath
agr
oup
sof
race
and
eth
nic
ity,
and
tin
stru
men
t,fo
llow
ing
Eqs.
(2)
an**
Stat
isti
cals
ign
ifica
nce
at1%
.

196 K.F. Butcher et al. / Economics of Education Review 29 (2010) 187–199
years.ed value
Fig. 4. Quantitative assessments and students’ classroom peers during 4discrete values of the quantitative assessment variable. Lines indicate fitt
associations with classmates who, by definition, havebelow-average quantitative skills. This, in turn, could affectstudents’ longer-term preferences for and performance inquantitatively oriented courses. These potential counter-vailing curriculum and peer effects may explain the zeroimpact we estimate for academic outcomes.
In the present setting, we cannot separately identify atrue course effect from a peer effect (the prior estimatescombine both). However, we can identify whether exoge-nous assignment to the basic skills course affected thesubsequent composition of classroom peers. For each stu-dent, and in each of her college years (1–4), we calculate theproportion of her classmates during that year who ever tookthe basic skills course. The panels in Fig. 4 graph the averageof these proportions against scores on the first quantitativeassessment.
We first note that there is a clear negative correlation:in all years, students with higher assessment scores attendclasses with lower proportions of QR course “ever-takers.”Of course, this could reflect shared course preferencesamong students with similar assessment scores. We aremore interested in whether exogenous assignment tothe course exerts an additional influence on one’s like-lihood of attending class with “ever-takers” of the QRcourse. Among first-year students (the upper-left panel),
students to the left of the passing cutoff attend classwith a sharply higher proportion of “ever-takers.” Thelarge first-year effect is mechanical, since these peersinclude the basic skills course itself. But even in subse-what mixed on the magnitude of peer effects and the appropriatefunctional form (McEwan and Soderberg, 2006).
Note: Circles indicate the mean values of y-axis variables, taken withins of quadratic polynomials estimated on either side of the cutoff.
quent years, especially the fourth, a small gap seems topersist.
In panel B of Table 3 (columns (9)–(16)), the TSLS esti-mates suggest that taking the basic skills course increasethe proportion of “ever-taker” classroom peers by about 8percentage points in the first year. The effects are not sta-tistically significant in years 2 and 3, but during students’senior years, the effect is just over 2 percentage points andstatistically significant. To put this magnitude in context,the mean proportion of course “ever-takers” in fourth-yearclasses for the overall sample is 9%. Thus, early assignmentto the skills course increases students’ fourth-year “expo-sure” to classmates with lower quantitative skills by 22%.As with the results for academic performance, the discon-tinuity design only tells us what the effect is for studentsclose to the threshold. The peer group shift might be largeror smaller for students at other points in the quantitativeskills distribution.
Also bear in mind that we do not know whether thisexogenous effect on classroom peer composition is larger orsmaller than one would find with other first-year courses.Unfortunately, we have no credible source of exogenousvariation with which to assess the impact of assignment to,for example, a particular introductory calculus class. Whatthese results do suggest is that exogenous assignment tothe QR basic skills course increases a student’s classroomassociation with other students who have low quantitativeskills, over and above levels produced merely by shared
preferences or abilities. Of course, we also do not knowwhether this shifting of peer groups has a adverse impacton students’ academic outcomes; we only know that thepeer groups do shift due to assignment to the course—ifthe peer group shift lowers academic achievement, then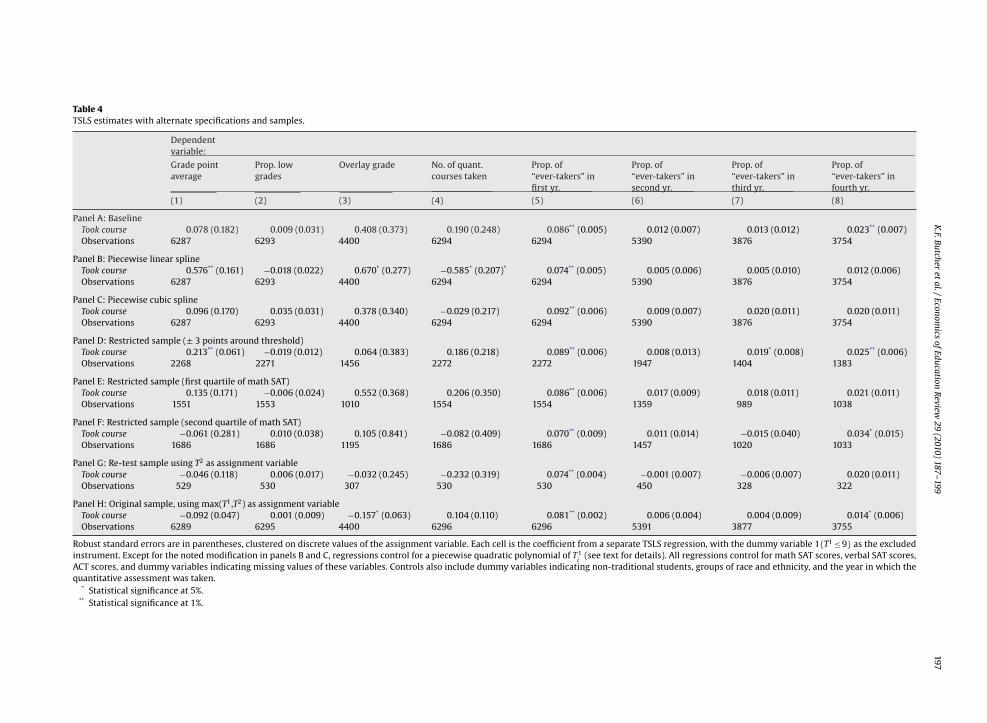
K.F.Butcher
etal./Econom
icsofEducation
Review29
(2010)187–199
197
Table 4TSLS estimates with alternate specifications and samples.
Dependentvariable:
Grade pointaverage
Prop. lowgrades
Overlay grade No. of quant.courses taken
Prop. of“ever-takers” infirst yr.
Prop. of“ever-takers” insecond yr.
Prop. of“ever-takers” inthird yr.
Prop. of“ever-takers” infourth yr.
(1) (2) (3) (4) (5) (6) (7) (8)
Panel A: BaselineTook course 0.078 (0.182) 0.009 (0.031) 0.408 (0.373) 0.190 (0.248) 0.086** (0.005) 0.012 (0.007) 0.013 (0.012) 0.023** (0.007)Observations 6287 6293 4400 6294 6294 5390 3876 3754
Panel B: Piecewise linear splineTook course 0.576** (0.161) −0.018 (0.022) 0.670* (0.277) −0.585* (0.207)* 0.074** (0.005) 0.005 (0.006) 0.005 (0.010) 0.012 (0.006)Observations 6287 6293 4400 6294 6294 5390 3876 3754
Panel C: Piecewise cubic splineTook course 0.096 (0.170) 0.035 (0.031) 0.378 (0.340) −0.029 (0.217) 0.092** (0.006) 0.009 (0.007) 0.020 (0.011) 0.020 (0.011)Observations 6287 6293 4400 6294 6294 5390 3876 3754
Panel D: Restricted sample (± 3 points around threshold)Took course 0.213** (0.061) −0.019 (0.012) 0.064 (0.383) 0.186 (0.218) 0.089** (0.006) 0.008 (0.013) 0.019* (0.008) 0.025** (0.006)Observations 2268 2271 1456 2272 2272 1947 1404 1383
Panel E: Restricted sample (first quartile of math SAT)Took course 0.135 (0.171) −0.006 (0.024) 0.552 (0.368) 0.206 (0.350) 0.086** (0.006) 0.017 (0.009) 0.018 (0.011) 0.021 (0.011)Observations 1551 1553 1010 1554 1554 1359 989 1038
Panel F: Restricted sample (second quartile of math SAT)Took course −0.061 (0.281) 0.010 (0.038) 0.105 (0.841) −0.082 (0.409) 0.070** (0.009) 0.011 (0.014) −0.015 (0.040) 0.034* (0.015)Observations 1686 1686 1195 1686 1686 1457 1020 1033
Panel G: Re-test sample using T2 as assignment variableTook course −0.046 (0.118) 0.006 (0.017) −0.032 (0.245) −0.232 (0.319) 0.074** (0.004) −0.001 (0.007) −0.006 (0.007) 0.020 (0.011)Observations 529 530 307 530 530 450 328 322
Panel H: Original sample, using max(T1,T2) as assignment variableTook course −0.092 (0.047) 0.001 (0.009) −0.157* (0.063) 0.104 (0.110) 0.081** (0.002) 0.006 (0.004) 0.004 (0.009) 0.014* (0.006)Observations 6289 6295 4400 6296 6296 5391 3877 3755
Robust standard errors are in parentheses, clustered on discrete values of the assignment variable. Each cell is the coefficient from a separate TSLS regression, with the dummy variable 1{T1 ≤ 9} as the excludedinstrument. Except for the noted modification in panels B and C, regressions control for a piecewise quadratic polynomial of T1
i(see text for details). All regressions control for math SAT scores, verbal SAT scores,
ACT scores, and dummy variables indicating missing values of these variables. Controls also include dummy variables indicating non-traditional students, groups of race and ethnicity, and the year in which thequantitative assessment was taken.
* Statistical significance at 5%.** Statistical significance at 1%.

f Educat
198 K.F. Butcher et al. / Economics othat would at least partially offset positive effects of thecourse and help explain why we are estimating no impactof the QR course on academic outcomes.
6.5. Robustness
Table 4 presents additional estimates with varying spec-ifications and in several subsamples. Panel A repeats thebaseline TSLS results that include controls for student char-acteristics (taken from even columns of Table 3, panel B).Panels B and C show the results of fitting a piecewise lin-ear spline and piecewise cubic spline, respectively, to theassessment score on either side of the threshold. Panel Dshows the results of restricting the sample to those scoringwithin three points of the passing threshold. For studentoutcome variables in columns (1)–(4), there are some sta-tistically significant coefficients, but little evidence of arobust pattern that would overturn our previous conclu-sions. For the peer variables in columns (5)–(8), in contrast,the results are substantively similar.
Panels E and F examine whether there are heteroge-neous effects among different groups of students, focusingon the two lowest College quartiles of math SAT scores(since these students are the vast majority of students nearthe passing cutoff). Panel E shows the baseline specifica-tion for students with SAT scores in the lowest quartile,and Panel F shows the baseline results for students withSAT scores in the second quartile. There are no significantcoefficients on the college performance variables, but witheven stronger caveats about sample size and power. Again,the results on peer variables are robust.
Panel G reports an alternate specification based exclu-sively on the smaller re-test sample, as described earlierand illustrated in the middle panels of Fig. 1. Not surpris-ingly, there are no statistically significant coefficients onthe performance variables. However, the peer coefficientsare similar, and the fourth-year coefficient is at the marginof statistical significance. Finally, Panel H reports TSLS esti-mates within the original sample, but using the maximumassessment score (including the first and the optional re-test). We argued above that this analysis could introducebias from endogenous re-test sorting around the cutoff.While still largely inconclusive, the results reverse the signsof prior estimates (on GPA and the “overlay” grade).
7. Conclusions
We identify the causal effect of a course in quantita-tive skills on academic performance and classroom peergroups, using a regression-discontinuity design. WellesleyCollege requires that all first-year students take a quan-titative skills assessment exam during orientation period.If students score below a passing cutoff, they must takea QR basic skills course during their first year. We com-pare outcomes for students just below and just above thiscutoff. While students close to the cutoff are observably
similar, they have sharply different probabilities of takingthe course.We find no impact of taking the QR basic skills course onoutcomes that include overall GPA, the overall proportionof courses with low grades, the grade in the subsequent QR
ion Review 29 (2010) 187–199
“overlay” course, and the number of subsequent coursestaken with quantitative content. These conclusions onlyapply to the subgroup of students with assessment scoresclose to the passing cutoff. The conclusions are further tem-pered by the imprecision of many of the coefficients, andwe cannot discard the possibility that we are simply unableto distinguish small effects in our dataset.
However, we do find robust effects of the course onclassroom peer-group composition. Even in their senioryears, students who are exogenously induced to take theQR basic skills course take courses with a higher fraction ofother students who also took the QR course. This is not sim-ply an artifact of students with similar academic abilities orpreferences choosing courses that appeal to them.
Our results leave unanswered many questions forresearch and policy. The previous findings can be general-ized to the subgroup of students who are close to the cutoff,and who comply with the initial course assignment. AtWellesley College, these students have fairly high math SATscores. We cannot say whether the same results would beobtained among students with lower baseline quantitativeskills (the same problem is faced by the larger-scale dis-continuity studies discussed in Section 2). To do so wouldrequire a different research design, such as a randomizedexperiment in the spirit of Angrist et al. (2009), which wasable to identify average effects among all students offeredthe program.
Absent such evidence, the results might at least seem tocall for a reduction in the passing threshold, since resourcesavings could then be used to apply a more intensive ver-sion of the quantitative skills training (e.g., smaller classsizes or more instructional hours). However, we are verycautious about making such a recommendation. First, sucha decision could unwittingly sacrifice benefits for excludedstudents, since our research design is not able to distin-guish small or even modestly sized effects for students atthe current threshold.
Second, such a decision would, at the margin, intensify“tracking” of first-year students by their baseline quantita-tive skills (and correlated variables, such as race). This couldpotentially alter the observed patterns of peer-group sort-ing in the longer-run, although it is not clear how this wouldaffect student outcomes. On the one hand, it may furtherlimit classroom mixing of students with heterogeneousskill levels and backgrounds (which is an implied goal of adiverse liberal arts college), and prevent positive classroomspillovers from higher-ability to lower-ability students. Onthe other hand, friendships formed in an even smaller andmore intense basic skills course could build social capitaland improve students’ experiences at the College.
References
Angrist, J., Lang, D., & Oreopoulos, P. (2009). Incentives and services forcollege achievement: Evidence from a randomized trial. American Eco-nomic Journal: Applied Economics, 1(1), 136–163.
Bettinger, E. P., & Long, B. T. (2009). Addressing the needs of underprepared
students in higher education: Does college remediation work? Journalof Human Resources, 44(3), 736–771.Calcagno, J. C., & Long, B. T. (2008). The impact of postsecondary remedia-tion using a regression discontinuity design: Addressing endogenoussorting and noncompliance. Working Paper 14194, National Bureau ofEconomic Research.
f Educat
C
I
K
L
L
L
L
McEwan, P. J., & Soderberg, K. A. (2006). Roommate effects on grades:Evidence from first-year housing assignments. Research in Higher Edu-
K.F. Butcher et al. / Economics o
ollege Board SAT. (2007). 2007 College-Bound Seniors: Total GroupProfile Report. College Board. Downloaded February 22, 2009 from:http://www.collegeboard.com/prod downloads/about/news info/cbsenior/yr2007/national-report.pdf.
mbens, G. W., & Lemieux, T. (2008). Regression discontinuity designs: Aguide to practice. Journal of Econometrics, 142(2), 615–635.
oski, W. S., & Levin, H. M. (1998). Replacing remediation with acceleration inhigher education: Preliminary report on literature review and initial inter-views. Stanford, CA: National Center for Postsecondary Improvement,Stanford University.
ee, D. S. (2008). Randomized experiments from non-random selection inU.S. house elections. Journal of Econometrics, 142(2), 675–697.
ee, D. S., & Card, D. (2008). Regression discontinuity inference with spec-ification error. Journal of Econometrics, 142(2), 655–674.
esik, S. A. (2006). Applying the regression-discontinuity design to infer
causality with non-random assignment. The Review of Higher Educa-tion, 30(1), 1–19.esik, S. A. (2007). Do developmental mathematics programs have a causalimpact on student retention? An application of discrete-time survivaland regression-discontinuity analysis. Research in Higher Education,48(5), 583–608.
ion Review 29 (2010) 187–199 199
Levin, H. M., & Calcagno, J. C. (2008). Remediation in the communitycollege: An evaluator’s perspective. Community College Review, 35(3),181–207.
Martorell, P. & McFarlin, I. (2007). Help or hindrance? The effectsof college remediation on academic and labor market out-comes. Unpublished manuscript, RAND and University of Texas atDallas.
McCrary, J. (2008). Manipulation of the running variable in the regressiondiscontinuity design: A density test. Journal of Econometrics, 142(2),698–714.
McEwan, P. J., & Shapiro, J. S. (2008). The benefits of delayed primary schoolenrollment: Discontinuity evidence using exact birth dates. Journal ofHuman Resources, 43(1), 1–29.
cation, 47(3), 347–370.Taylor, C. (2006). Quantitative reasoning at Wellesley College. In R. Gillman
(Ed.), Current Practices in Quantitative Literacy (pp. 141–146). Mathe-matics Association of America.