Embed Size (px)
DESCRIPTION
Donald Rissmiller Chief Economist Strategas Research Partners
Citation preview

1 of 28
ECONOMICS HIGHLIGHTS
What Will Muddle-Through Growth Do To Profits?
Don Rissmiller Chief Economist
Strategas Research Partners
March 1, 2013
(212) 906-0134 [email protected]
2011 2012 2013 2014
4Q 1Q 2Q 3Q 4Q 1QF 2QF 3QF 4QF 1QF 2QF 3QF 4QF
Real GDP Q/Q % AR 4.1% 2.0% 1.3% 3.1% 0.1% 2.0% 2.0% 2.3% 3.0% 2.5% 2.0% 2.0% 1.0%
Core CPI Q/Q % AR 1.9% 2.1% 2.4% 1.6% 1.7% 1.0% 1.0% 1.5% 1.5% 2.0% 2.0% 2.0% 2.0%
Fed Funds EOP 0.1% 0.1% 0.1% 0.1% 0.1% 0.1% 0.1% 0.1% 0.1% 0.1% 0.1% 0.1% 0.1%
F = Forecast; EOP = End of Period

www.strategasrp.com 2
STRATEGAS BASE CASE
4 Macro Issues: 1) U.S. Fiscal policy, 2) Euro-area uncertainty, 3) China slowing, 4) Oil price Volatility.
Most are better (for now). U.S. fiscal sequester still an issue.
U.S. fiscal cliff was a big punt: “kicking-the-can” again. o Fiscal Cliff becomes a Fiscal Slope
Divergences: o Business confidence vs. Consumer confidence o Capital Spending vs. Employment
Fed and other central banks likely to remain easy (not close to 6.5% U.S. unemployment)
With the output gap, inflation is not a problem, for now. “Reflation” comes before inflation.
U.S. pent-up demand in 1H: household formation, capex (down already).
PMIs suggest some economic momentum as we start 2013.
As business cycle matures, profit margins likely peaking.
Question of sustainability: still looking at only 4% nominal growth. A Mid-Cycle slowdown, or an “Intra-cycle slowdown”?

www.strategasrp.com 3
WHERE ARE WE IN THIS BUSINESS CYCLE?
What Puts the “Mid” in Mid-cycle Slowdown?
Real Gross Domestic Product
% Change - Year to Year SAAR, Bil.Chn.2005$
10050095908580757065605550
Source: Bureau of Economic Analysis
15
10
5
0
-5
15
10
5
0
-5
More frequent recessions on the
left hand side of this chart… WHY?

www.strategasrp.com 4
GDP = C + I + G + NX
Real PCE: Contribution to Real GDP Change4-qtr MovingAverage SAAR, %
Real Gross Pvt Dom Investmnt: Contribution to Real GDP Chg4-qtr MovingAverage SAAR, %
10050095908580
Source: Bureau of Economic Analysis
7.5
5.0
2.5
0.0
-2.5
-5.0
7.5
5.0
2.5
0.0
-2.5
-5.0
Consumption = 71% (still !)
Investment = 13%
Govt = 19%
Net Exports = -3%
Investment
Consumption

www.strategasrp.com 5
IMPACTS OF THE FISCAL CLIFF: PENT-UP DEMAND
CAPEX (10% OF THE U.S. ECONOMY): DOWN
CONSUMER SPENDING (71% ECONOMY): NOT DOWN
Mfrs' New Orders: Nondefense Capital Goods ex Aircraft
SA, Mil.$
10050095Source: Census Bureau
75000
67500
60000
52500
45000
37500
75000
67500
60000
52500
45000
37500
CAPEX EQP PROXY

www.strategasrp.com 6
BOTH CEOs & CFOs HAVE BEEN MORE CAUTIOUS
Duke/CFO Outlook: Expected Growth in Capital Spending in Next 12 Months
%
131211100908070605040302
Source: Duke Fuqua School of Business/CFO Magazine
15
10
5
0
-5
-10
-15
15
10
5
0
-5
-10
-15
CEO Economic Outlook Survey Diffusion Index
50+=Expansion
131211100908070605040302
Source: Business Roundtable
125
100
75
50
25
0
-25
125
100
75
50
25
0
-25

www.strategasrp.com 7
HOW WILL THIS DIVERGENCE END?
Mfrs' New Orders: Nondefense Capital Goods ex Aircraft% Change - Year to Year SA, Mil.$
All Employees: Total Nonfarm% Change - Year to Year SA, Thous
10050095Sources: Census Bureau, Bureau of Labor Statistics
40
20
0
-20
-40
4
2
0
-2
-4
-6
This gap has to narrow between the employment
of capital and the employment of
labor.
Capex proxy
Jobs
www.strategasrp.com 8
PMI SUGGESTS SOME MOMENTUM TO START 2013
ISM Manufacturing: New Orders Index
SA, 50+=Increasing
13121110090807060504Source: Institute for Supply Management
80
70
60
50
40
30
20
80
70
60
50
40
30
20

www.strategasrp.com 9
ECONOMIC SYMMETRY: It Wasn’t a “V” or a “U” Recovery …
1) SQUARE-ROOT SHAPED RECOVERY.
2) REVERSE SQUARE-ROOT SHAPED EXPANSION?
Disposable Personal Income
% Change - Year to Year SAAR, Bil.$
1312111009080706050403020100
Source: Bureau of Economic Analysis
10.0
7.5
5.0
2.5
0.0
-2.5
-5.0
10.0
7.5
5.0
2.5
0.0
-2.5
-5.0

www.strategasrp.com 10
A RETURN OF HOUSEHOLD FORMATION WILL BE KEY
Total Number of Households, Break-adjusted
% Change - Year to Year Thous
10050095
Source: Census Bureau/Haver Analytics
2.4
2.0
1.6
1.2
0.8
0.4
0.0
2.4
2.0
1.6
1.2
0.8
0.4
0.0

www.strategasrp.com 11
SYMMETRY:
1) SQUARE-ROOT SHAPED RECOVERY.
2) REVERSE SQUARE-ROOT SHAPED EXPANSION?
2012 Muddle
Through
(Deleveraging)
Late-2012, early
2013 Slowdown
(Fiscal Cliff /
Sequester
Uncertainty)
2013-14
Recovery
(We get housing
& capex back)
2011 Muddle
Through
(Deleveraging) 2009-2010
Moderate
Recovery
(Missing
housing)
2007-2009 Deep
Recession
www.strategasrp.com 12
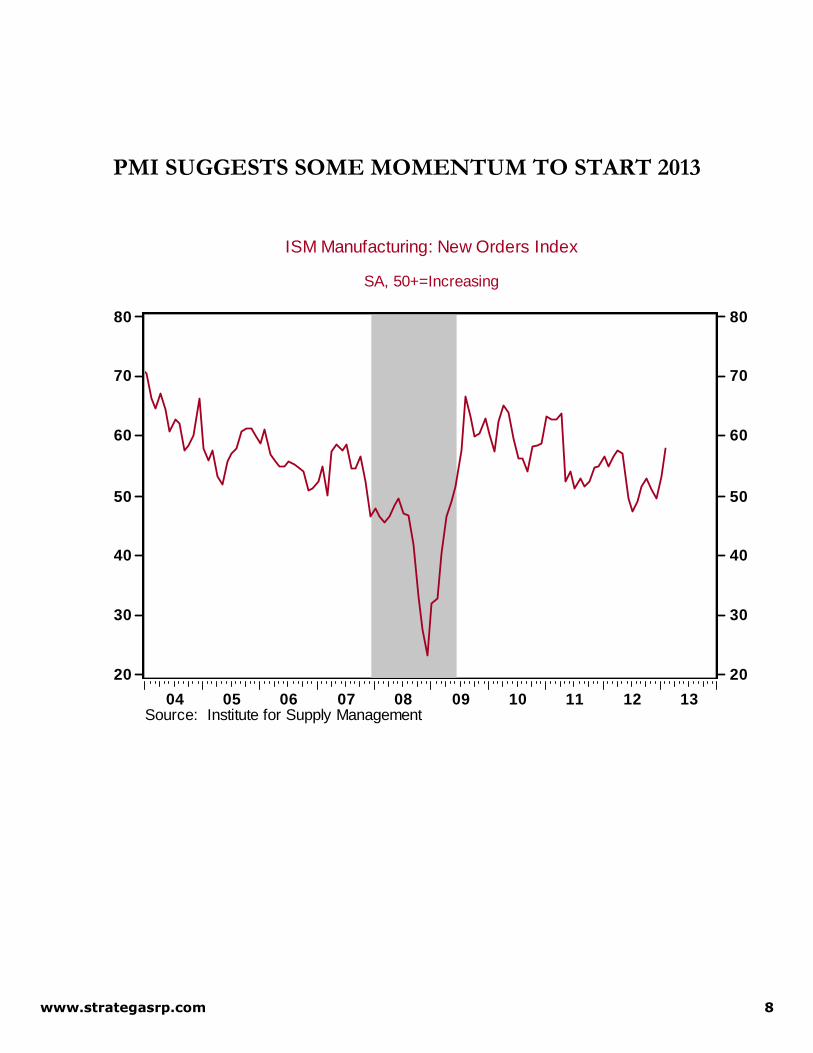
HOUSING IS BOTTOMING …
… BUT HOUSING IS A VERY SEASONAL VARIABLE.
S&P/Case-Shiller Home Price Index: Composite 20
SA, Jan-00=100
1312111009080706050403
Source: Standard & Poor's
220
200
180
160
140
120
220
200
180
160
140
120

www.strategasrp.com 13
HOUSING SEASONALITY MATTERS …

www.strategasrp.com 14
WHY IS U.S. FISCAL POLICY SO DIFFICULT TO FINISH?
There’s no market reason for a problem (Treasury rates low).
Debate not on deficits/crowding out, but on size of govt.
Federal Receipts as a Percentage of GDP
FY, %
1005009590858075706560555045403530
Source: Office of Management and Budget
24
20
16
12
8
4
0
24
20
16
12
8
4
0
Federal Outlays as a Percentage of GDP
FY, %
1005009590858075706560555045403530
Source: Office of Management and Budget
45.0
37.5
30.0
22.5
15.0
7.5
0.0
45.0
37.5
30.0
22.5
15.0
7.5
0.0
“Hauser’s Law”

www.strategasrp.com 15
3 TYPES OF TAXES:
1) INCOME
2) WEALTH
3) TRANSACTION
U.S. DEBT/GDP MUST GO SIDEWAYS AS A DEFINITION OF FISCAL SUSTAINABILITY
Debt
Nominal GDP
Taxes
Spending
Real GDP
Inflation
This ratio needs to go sideways long-term as a definition of fiscal sustainability (otherwise, interest costs would eventually consume the entire federal budget).
Population Productivity

www.strategasrp.com 16
WITH THE SLOWDOWN, INFLATION IS NOT A WORRY (FOR NOW).
REFLATION COMES BEFORE INFLATION.
Nonfarm Business Sector: Compensation Per Hour% Change - Year to Year SA, 2005=100
CPI-U: All Items% Change - Year to Year SA, 1982-84=100
1005009590858075706560
Source: Bureau of Labor Statistics
16
12
8
4
0
-4
16
12
8
4
0
-4
Compensation

www.strategasrp.com 17
INFLATION IS A LAGGING INDICATOR
Real GDP
CPI

www.strategasrp.com 18
MODEL OF CORE CPI STILL TAME.
TREND PRICE GROWTH SHOULD REMAIN NEAR THE FED’S FORECAST.
Model Equation: Core CPI Y/Y = -0.2 + 0.9x [Core CPI Y/Y, Lagged 1 Yr] + 0.2 x [U.S. Output Gap, Lagged 1YR] + 0.1 x [Import Price Deflator Y/Y – Core CPI Y/Y, Lagged 1 Yr]. Estimated 1962-2012 with an R2 of 84%.

www.strategasrp.com 19
THERE’S LITTLE EVIDENCE OF EITHER SUBSTANTIAL
INFLATION OR DEFLATION IN THE PIPELINE
CPI: All Items
Core CPI
Core Finished
Core Crude

www.strategasrp.com 20
THE SEQUESTERED FED RATE HIKES?
BY THE FOMC’S OWN METRICS, THE FED IS NOT DONE.
Civilian Unemployment Rate: 16 yr +
SA, %
1005009590858075706560Source: Bureau of Labor Statistics
12
10
8
6
4
2
12
10
8
6
4
2
www.strategasrp.com 21
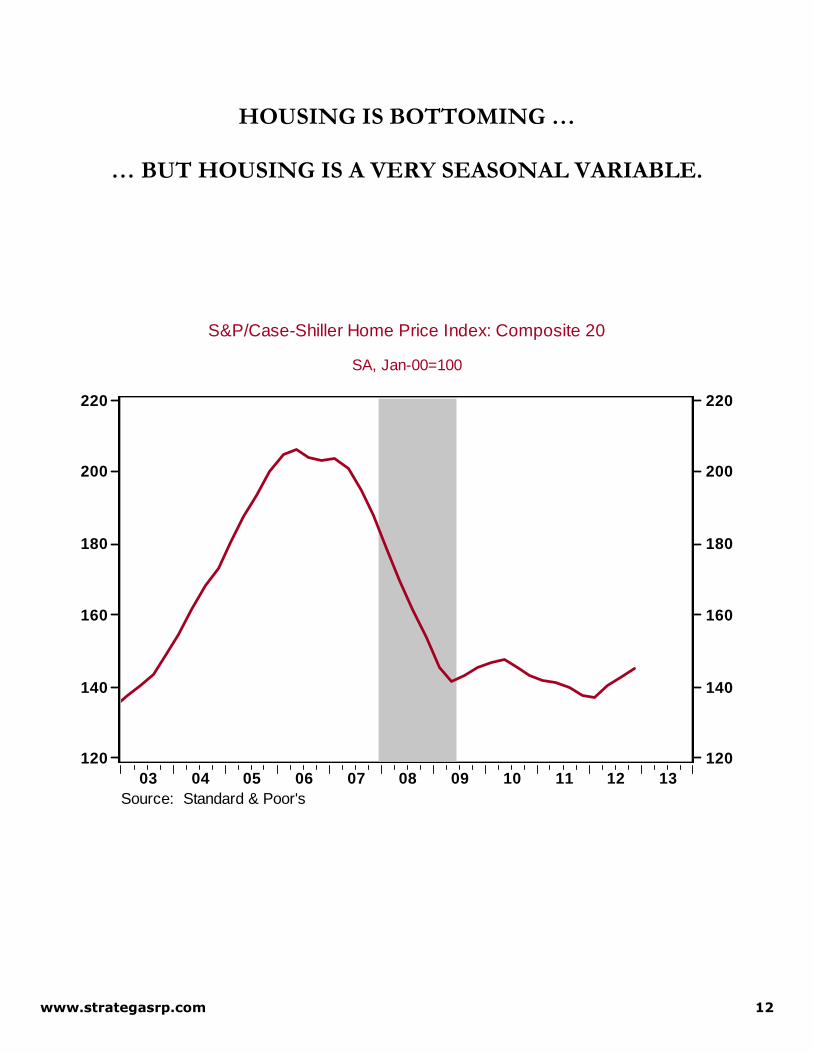
WHY MORE FED QE: USING THE 1937 EXAMPLE (We’ve made this decision before)
There were numerous mistakes in the 1930s that led to the Great Depression, but in terms of policy generally, we count 4 major issues: 1) tighter monetary policy, 2) tighter fiscal policy as taxes went up, 3) tighter trade policy given tariffs, and 4) tighter regulatory policy as the Securities Acts of the early 1930s were implemented, all at the same time. Together, these policies combined to create the “1937 mistake”, as the economy turned back down sharply, entrenching the Depression mentality.
Real Gross Domestic Product
% Change - Year to Year Bil.Chn.2005$
3938373635343332313029
Source: Bureau of Economic Analysis
15
10
5
0
-5
-10
-15
15
10
5
0
-5
-10
-15
1930s
Even in the Depression, there was a 1934-36 recovery, but then …

www.strategasrp.com 22
WHAT DOES FED QE DO?
1) Avoid Deflation (Inflation back to 2%) 2) Help unemployment come down ??
QE PRICE EFFECT RATHER THAN REAL ECONOMIC IMPACT
CPI-U: All Items
% Change - Year to Year SA, 1982-84=100
1312111009080706050403Source: Bureau of Labor Statistics
6
4
2
0
-2
6
4
2
0
-2
Civilian Unemployment Rate: 16 yr +
SA, %
1312111009080706050403Source: Bureau of Labor Statistics
10
9
8
7
6
5
4
10
9
8
7
6
5
4
Target
Target
Hit
Miss

www.strategasrp.com 23
MUDDLE-THROUGH?
HISTORICALLY, IT HAS TAKEN ROUGHLY 2% U.S. REAL GDP FOR PROFITS TO GO FLAT
Real Gross Domestic Product% Change - Year to Year SAAR, Bil.Chn.2005$
S&P 500 Composite: Operating Earnings per share% Change - Year to Year $/share
05009590
Sources: Bureau of Economic Analysis, Standard & Poor's
6
4
2
0
-2
40
20
0
-20
-40
GDP

www.strategasrp.com 24
ARE PROFIT MARGINS PEAKING?
GAP CURRENTLY BETWEEN GDP AND EMPLOYMENT.
Real Gross Domestic ProductSAAR, Bil.Chn.2005$
All Employees: Total NonfarmSA, Thous
1312111009080706050403020100
Sources: Bureau of Economic Analysis, Bureau of Labor Statistics
14000
13500
13000
12500
12000
11500
11000
138000
136000
134000
132000
130000
128000
PRODUCTIVITY (MORE OUTPUT PER WORKER) CAN GO TO:
1) RAISE WAGES
2) LOWER PRICES
3) HAVE MORE PROFIT
GDP, LHS
Employment

www.strategasrp.com 25
WATCHING LABOR’S SHARE OF INCOME FOR AN INDICATION OF PROFIT MARGINS.
U.S. Corporate Compensation % Corporate GDP
10050095908580757065605550
Source: Haver Analytics
70
68
66
64
62
60
58
70
68
66
64
62
60
58
LABOR DOWN, PROFITS UP.

www.strategasrp.com 26
U.S. UNEMPLOYMENT BY EDUCATIONAL DISTRIBUTION SHOWS CYCLICAL & STRUCTURAL UNEMPLOYMENT
Unemployment Rate: < HS Diploma: 25+ Years (SA, %)
Unemployment Rate: HS Diploma, No College: 25+ Years (SA, %)
Unemployment Rate: < Bachelor's Degree: 25+ Years (SA, %)
Unemployment Rate: College Graduates: 25+ Years (SA, %)
1312111009080706050403Source: BLS
16
12
8
4
0
16
12
8
4
0

www.strategasrp.com 27
HOLD THE BANKING SYSTEM TOGETHER, AND “FRACK” OUR WAY OUT OF THE CURRENT SITUATION?
NATURAL GAS PRICES HAVE ALREADY FALLEN, AND
EXPECTATIONS ARE BUILDING THEY WILL STAY LOW.
Natural Gas Price, Henry Hub, LA
$/mmbtu
10050095Source: Wall Street Journal
15.0
12.5
10.0
7.5
5.0
2.5
0.0
15.0
12.5
10.0
7.5
5.0
2.5
0.0
A study, funded by the nonpartisan Alfred P. Sloan Foundation and performed by the University
of Texas, examined 15,000 wells drilled in the Barnett Shale formation in northern Texas, mostly
over the past decade. It is among the first to study the geology and economics of shale drilling.
Looking at data from actual wells rather than relying on estimates and extrapolations, the study
broadly confirms conclusions by the energy industry and the U.S. government, which in December
forecast rising gas production.
WSJ, 2/27/2013

www.strategasrp.com 28