Embed Size (px)
Citation preview
Economics: Good Choice of Major for Future CEOs
By Patricia M. Flynn and Michael A. Quinn*
Abstract
It is often suggested that Economics is a good major for individuals interested in becoming business leaders. Despite this widespread assertion, little research has been conducted on this topic. Using the Standard and Poor (S&P) 500 companies, this paper examines the validity of such a claim. We find evidence that Economics is a good choice of major for those aspiring to become a CEO. Economics ranked third with 9% of the CEOs of the S&P 500 companies in 2004 being undergraduate Economics majors, behind Business Administration and Engineering majors, each of which accounted for 20% of the CEOs. When adjusting for size of the pool of graduates, those with undergraduate degrees in Economics are shown to have had a greater likelihood of becoming an S&P 500 CEO than any other major. That is, the share of graduates who were Economics majors who were CEOs in 2004 was greater than that for any other major, including Business Administration and Engineering. The findings also show that a higher percentage of CEOs who were Economics majors subsequently completed a graduate degree – often an MBA -- than did their counterparts with Business Administration and Engineering degrees. The paper demonstrates that while women now comprise over half of all bachelors and masters degrees awarded, they remain a minority in terms of undergraduate degrees awarded in Economics and in MBA degrees conferred. Economics programs may try to appeal to more women students as a stepping stone to becoming a CEO, especially as women continue to account for less than 2 percent of the S&P 500 CEOs. Keywords: undergraduate major, CEO, economics degrees, gender mix of students JEL: A2 I. Introduction In discussing whether to major in economics as an undergraduate, the Princeton Review writes
that “a thorough working knowledge of how Economics shapes businesses is necessary if you’re
going to become a CEO one day” (Princeton Review 2006). This sentiment is echoed by
numerous Economics Department faculty and websites. Common reasons given for the
desirability of Economics in this regard are analytical and problem solving skills, knowledge of
markets and the “big picture” perspective.
* Patricia M. Flynn, PhD., Departments of Economics and Management, Bentley College, Waltham, MA, [email protected]. Michael A. Quinn, PhD., Department of Economics, Bentley College, [email protected], 781-891-2938.

2
In spite of these claims, and an extensive literature on trends in Economics majors, there
has been little analysis on Economics being a good choice for achieving high-level business
leadership positions. This paper helps fill this gap by analyzing the educational backgrounds of
the CEOs of the S&P 500 companies in 2004, and by assessing the likelihood of Economics
majors becoming CEOs, relative to other bachelor degree recipients.
While research is often hindered by the lack of a comprehensive data series on starting
salaries and lifetime earnings, Economics majors have been shown to fare relatively well in
several areas. Craft and Baker (2003), for example, found that lawyers with an undergraduate
degree in Economics earn more than lawyers with other majors, ceteris paribus. Nieswiadomy
(1998) shows that Economics majors rank first among the 14 most common majors taking the
LSAT, and third among all majors taking the test. Black, Sanders & Taylor (2003) demonstrate
that Economics majors earn more advanced degrees in business and in law than other majors.
And among baccalaureate degree holders who do not earn a graduate degree, Black, Sanders and
Taylor (2003) show that Economics majors generally earn more than their counterparts with
other majors. In their study of CEOs, Boone and Kurtz (2001) note that business was the most
popular undergraduate degree, but that Engineering, Economics and Humanities were also
popular majors.1
In this paper we use CEO data for the Standard and Poor (S&P) 500 companies to
explore the question: is an undergraduate Economics degree a good predictor for becoming a
CEO? To address this question, we use statistical and econometric techniques, including logistic
analysis. We find evidence to support the claim that Economics is a good choice for graduates
who aspire to become a corporate CEO; especially for Economics majors who complete an MBA
degree.

3
The paper proceeds with a discussion of the educational backgrounds of S&P 500 CEOs
in 2004. This is followed by a review of trends in the absolute and relative size of undergraduate
degrees awarded in Economics since 1960, and a discussion of the patterns by gender for
undergraduate and MBA degrees. Thereafter, the paper examines the likelihood of individuals
with Economics degrees and other degrees becoming a CEO.
II. Educational Backgrounds of the S&P 500 CEOs2 Over 98 percent of the S&P 500 CEOs in 2004 had a bachelor’s degree. Liberal Arts, Science &
Engineering, and Business graduates are all well-represented among these CEOs. Liberal Arts
graduates comprise the largest group with just over one-third (34.3%) of these business leaders.
Economics majors are the largest subset of the Liberal Arts graduates, with approximately nine
percent (9.2%) of the CEOs holding an undergraduate degree in Economics. Liberal arts majors
in History and Political Science follow with 5.0% and 4.2% of the CEOs, respectively. Twenty-
eight percent (28.1%) of the CEOs have Science & Engineering degrees, approximately three-
quarters of which are in Engineering. Another 28.5% of the CEOs have undergraduate degrees
in Business fields. Dominating the Business graduates are Business Administration majors, who
comprise 20.7% of the CEOs; just fewer than five percent (4.8%) of the CEOs are Accounting
majors, and 3.0% majored in Finance.
Thus, the three most prevalent undergraduate majors among these CEOs are Economics,
Engineering and Business Administration. See Table 1 for the distribution of majors of all the
S&P 500 CEOs.
1 Their article, however, does not provide the relevant share statistics. 2 This section is based on data on the S&P 500 CEOs as compiled by Spencer Stuart, a leading executive search firm that annually conducts research on the backgrounds and professional experience of CEOs in the United States. Spencer Stuart provides this data free of charge on its website www.spencerstuart.com.

4
Table 1. S&P 500 CEOs by Undergraduate Major, 2004
Number Percentage
Science & Engineering 141 28.1%
Biology 6 1.2Computer Science 6 1.2Engineering 103 20.5Health Sciences 6 1.2Sciences, n.e.c. 20 4.0
Liberal Arts 172 34.3
Economics 46 9.2English 9 1.8History 25 5.0Liberal Arts, n.e.c 46 9.2Math 17 3.4Political Science 21 4.2Psychology 4 0.8Sociology 4 0.8
Business 143 28.5
Accounting 24 4.8Business Administration 104 20.7Finance 15 3.0
Other (Education) 1 0.2Unspecified 37 7.4No Degree 8 1.6
Total 502 100%Note: There are 502 observations due to 2 companies having more than one CEO in 2004; "n.e.c" stands for not elsewhere classified.
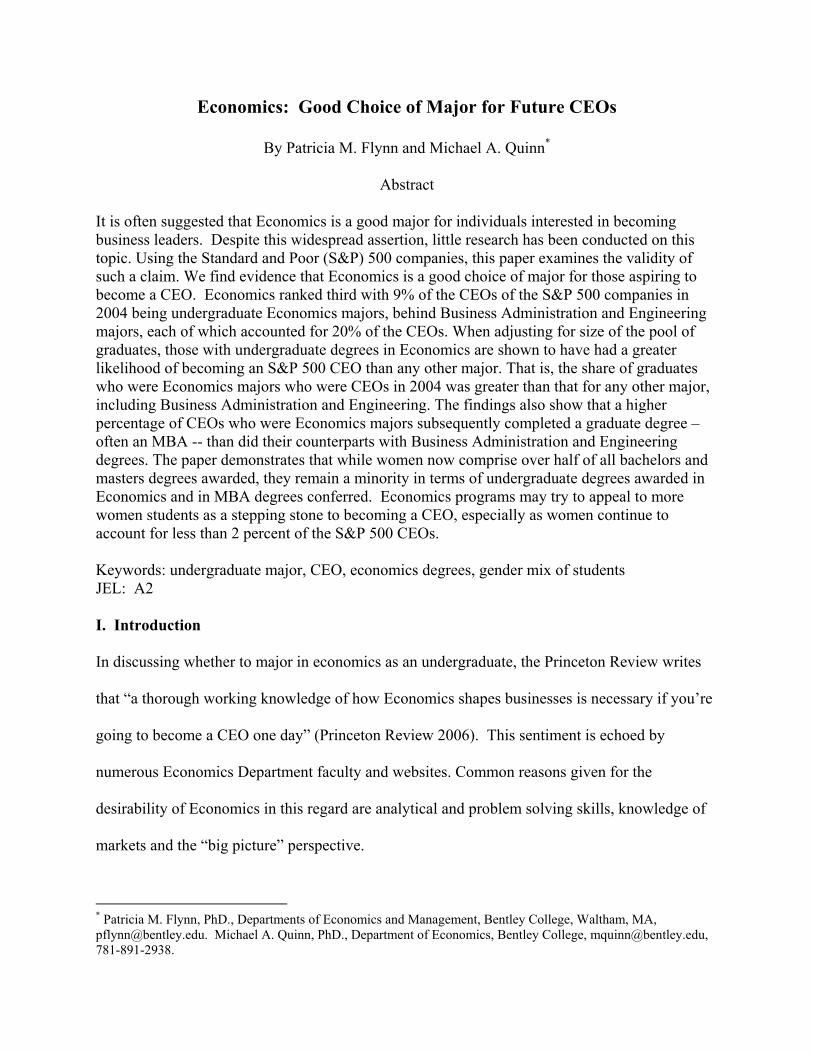
S&P 500 CEOs received their undergraduate degrees from over 200 colleges and universities.
Nineteen institutions have five or more of these CEOs as undergraduate alumni. The University
of Wisconsin leads the list with 17 graduates (3.4% of the total), followed by Harvard University
with 15. Princeton University, Stanford University and the University of Texas, each have 10
graduates among the S&P 500 CEOs. Approximately one in ten (11.2%) of the S&P 500 CEOs
graduated from an Ivy League college or university (See Table 2).
5
Table 2. Dominant Undergraduate Colleges & Universities, S&P 500 CEOs, 2004
Institution Number of CEOsUniversity of Wisconsin 17Harvard University* 15Princeton University* 10Stanford University* 10University of Texas 10City University of New York 8University of North Carolina 8University of Washington 8Yale University* 8U.S. Naval Academy 7University of Pennsylvania* 7University of Missouri 6Dartmouth College* 5Duke University 5Michigan State University 5Northwestern University 5University of Notre Dame 5Ohio State University 5University of Alabama 5Note: * Denotes Ivy League institution
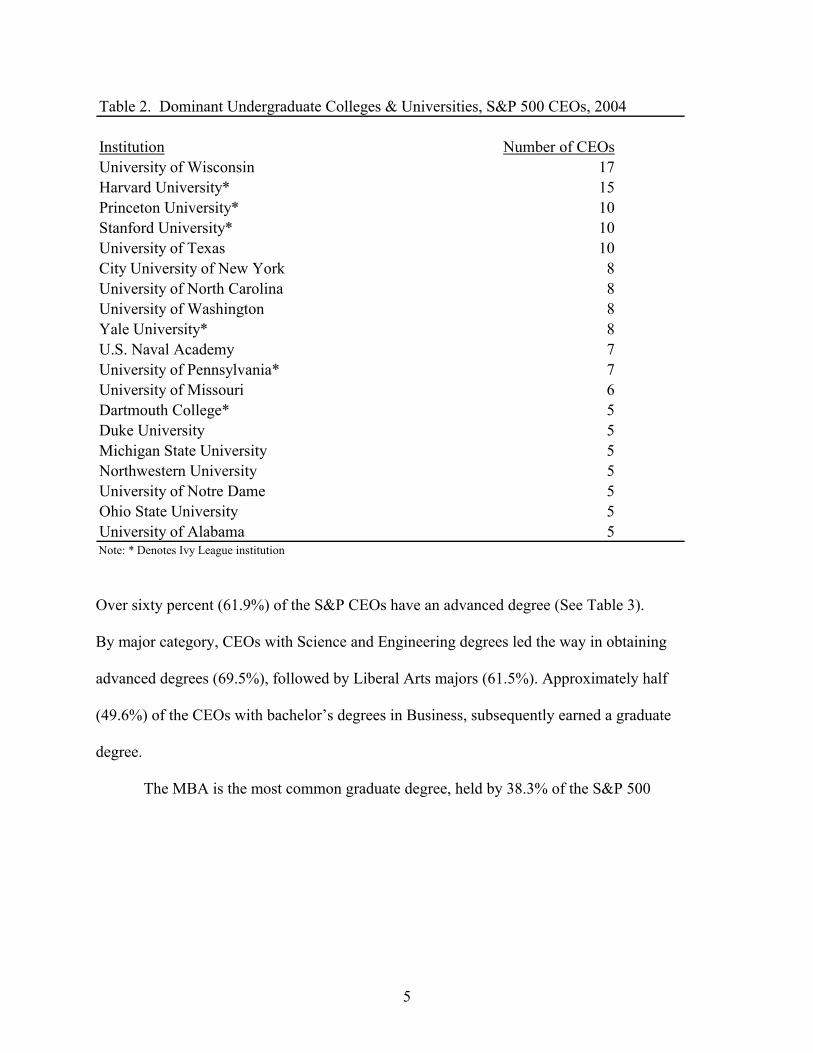
Over sixty percent (61.9%) of the S&P CEOs have an advanced degree (See Table 3).
By major category, CEOs with Science and Engineering degrees led the way in obtaining
advanced degrees (69.5%), followed by Liberal Arts majors (61.5%). Approximately half
(49.6%) of the CEOs with bachelor’s degrees in Business, subsequently earned a graduate
degree.
The MBA is the most common graduate degree, held by 38.3% of the S&P 500

6
CEOs.3 Approximately nine percent of the CEOs hold law degrees; another six percent have a
Ph.D. Almost fifteen percent (14.9%) of the Science and Engineering graduates went on to
complete a Ph.D., compared to 2.7% of the Liberal Arts and 2.3% of the Business majors.
Of the CEOs with undergraduate degrees in Economics, almost three-quarters (73.9%)
earned a graduate degree. Over half (54.4%) of the CEOs who majored in Economics completed
an MBA degree. Four percent of the CEOs with Economics majors earned a law degree; another
four percent completed a Ph.D.
3 In their analysis of Business Week’s top 1000 American corporations in 1987, Rose and Wong (1989) also found the MBA to be the most common graduate degree of CEOs. At that time, approximately 19% of the CEOs had earned an MBA.
7
Table 3. Graduate Degree Attainment by Undergraduate Major, S&P 500 CEOs, 2004Percentages
MBA Law PhD Other TotalScience & Engineering 33% 4% 15% 18% 70%
Computer Science 17 0 0 17 33Biology 33 17 0 16 67Engineering 39 2 12 20 72Health Sciences 17 0 17 0 33Physical Science 15 10 40 15 80
Liberal Arts 48 13 4 8 71
Economics 54 4 4 11 74English 22 22 0 11 56History 52 20 4 8 80Liberal Arts,n.e.c. 55 19 4 6 83Math 35 0 0 6 41Political Science 43 19 5 5 62Psychology 50 0 0 25 75Sociology 0 25 0 0 25
Business 37 7 2 7 50
Accounting 38 8 8 9 54Business 36 7 1 7 49
Overall 38% 9% 6% 11% 62%Note: Some individuals have more than one graduate degree. Because of rounding, not all rows sum across to the total number.
III. The Larger Context: Trends in Undergraduate Degrees in Economics and in MBAs.4
This section looks in more detail at trends in degrees awarded at the undergraduate level in
Economics. Given the importance of the MBA degree, especially to CEOs who are Economics
majors, trends in MBAs also are highlighted.
4 The source of data in this section is the National Center for Educational Statistics, U.S. Department of Education.

8
Undergraduate Degrees Awarded in Economics The number of undergraduate degrees awarded in Economics since 1960 has risen overall, but
not consistently (See Chart 1). By 2004, approximately 23,025 students graduated annually with
a bachelor’s degree in Economics, more than triple the number in 1960. There were, however,
two major periods of decline during this period. The first was in the early 1970s, when
Economics graduates fell by over 18% (from 17,197 in 1970 to 14,046 in 1975), after a decade in
which their number had more than doubled. The second decline occurred from 1991 to 1997,
when Economics graduates fell by almost a third (30.9%) after a 15-year period of expansion.
From 1997 to 2004, Economics degrees awarded rose again, during this time by 39.2%. By
2004, the number of undergraduate Economics degrees awarded annually almost equaled those
in the peak year of 1990.
Chart 1. Bachelor Degrees Awarded in Economics, 1960-2004
0
5,000
10,000
15,000
20,000
25,000
30,000
1960
1964
1968
1971
1973
1975
1977
1979
1981
1983
1985
1987
1989
1991
1993
1995
1997
1999
2001
2003

9
More telling is the status of Economics degrees relative to other fields. The above noted
swings in Economics majors occurred during a period of long-term growth in college graduates,
with the number of bachelor’s degrees awarded growing by over 240% from 1960 to 2004. The
share of undergraduate degrees awarded in Economics during this period fell from 1.90% to
1.73%
This share pattern, too, is cyclical (See Chart 2). Economics increased its share of
bachelor degrees awarded to 2.40% in 1968, before losing ground and falling to 1.51% in 1974.
Economics then gained share reaching 2.30% in 1988, but fell to a low of 1.40% in 1997.
Thereafter, Economics degrees expanded relative to other majors, rising to 1.73% in 2004.
Chart 2. Economics Majors as Share of Total Bachelor's Degrees Awarded, 1960-2004
0.0
0.5
1.0
1.5
2.0
2.5
3.0
1960
1964
1968
1971
1973
1975
1977
1979
1981
1983
1985
1987
1989
1991
1993
1995
1997
1999
2001
2003
Year
% o
f tot
al d
egre
es

10
The cycles in Economics degrees awarded, especially the declines, have been the focus of
considerable attention.5 While a review of this literature is beyond the scope of this paper, the
Siegfried (2005) and the Margo and Siegfried (1996) studies are worth noting here as they focus
on the share of Economics degrees. These authors demonstrate that undergraduate degrees
awarded in Economics exhibit a “reversion to the mean” pattern, with a long-term steady-state
level of approximately 2.1%. Chart 2 provides support for this hypothesis. In this paper, we
focus on Economics majors vis-à-vis their counterparts from other majors.
Where Did Potential Economics Majors Go?
Which fields were students selecting instead of Economics during these periods of relative
decline? The patterns in undergraduate degrees awarded during these two periods differ
significantly. (See Chart 3.) In the 1970s, for instance, burgeoning student interest in business
and in business degrees dominates the story resulting in the share of most non-business fields
falling (Green 2002). Economics is often viewed as a substitute for a business degree, especially
in liberal arts colleges that do not offer a business major (Siegfried and Wilkinson 1982; Salemi
and Eubanks, 1996; Brasfield et al., 1996). From 1968 to 1975, while Economics share of total
degrees was declining, the number of students graduating with bachelors degrees in business
(including Business Administration, Accounting and Finance) rose by over 80%. With 76,000
additional students, the share of undergraduate degrees awarded in business rose from 12.5% to
14.4% during that period.
This was not the case in the 1991 to 1997 time frame. Undergraduate degrees awarded in
business peaked in absolute terms (309,923) in 1992; their relative share had peaked back in
5 See, for example, Conrad, 1996; Salemi, 1996; Willis and Pieper, 1996; Siegfried and Round, 2001; Worthington

11
1988 (at 24.4%). The discouraged business major (DBM) hypothesis demonstrated by Salemi
and Eubanks (1996) helps to explain why Economics degrees might still be considered a
substitute for business and continue to fall even when Business degrees are in decline. The DBM
hypothesis suggests that requirements for entry to business majors rise in periods of excess
demand, as business schools exercise control over the quantity and quality of their business
majors. In these situations, students who are turned away from business majors might opt for
Economics as an alternative. Thus, when the number of undergraduate business degrees awarded
declined in the early 1990s, students who might have been turned down in an earlier period may
have been accepted as business majors, and hence not majored in Economics.
Chart 3. Share of Bachelor Degrees Awarded, by Field, 1960-2004
0.00
0.10
0.20
0.30
0.40
0.50
0.60
1960
1964
1968
1971
1973
1975
1977
1979
1981
1983
1985
1987
1989
1991
1993
1995
1997
1999
2001
2003
Science/EnginLiberal ArtsBusiness/AcctEconomics
Annual surveys of college freshmen also demonstrate the decline in interest in
business careers and majors following significant public attention to corporate scandals.
and Higgs, 2004; Skoorka and Condon, 2003; and Siegfried, 2004.

12
Interest in business careers fell considerably in the late 1980s and early 1990s: peaking in 1987
at 24.2%, then dropping to about 14% in the early 1990s (Astin, et. al 2002). By 2001, interest
in business careers was at a 25-year low. Interest in choice of business as a major showed a
similar pattern of decline (dropping from 25.7% in 1987 to 16.6% in 2001). After 1988, teaching
and medical careers became more popular, while interest in business, law and engineering fell.
By 2005, there had been slight increases in interest in business careers and business majors,
which rose to 15.0% and 17.5%, respectively (Pryor et al 2005).
Historically, freshmen have shown considerably less interest in majoring in Economics
than in business, with less than one percent of college freshmen in any given year indicating
intent to select Economics as a major in any given year. Freshmen interest in Economics peaked
in the late 1980s (at 0.7%); after falling to a low of 0.4% in the mid 1990s, it rose to 0.6% in
2005 (Pryor et. al 2005).
Given Economics’ unique status as a liberal arts degree as well as a substitute for
business, it is also useful to see how other liberal arts degrees fared during this period. Liberal
arts degrees (not including Economics) rebounded in the late 1980s and early 1990s, with 78,000
more degrees awarded in 1992 than in 1988; Sociology, History and English majors, in
particular, experienced relatively high growth during that time. However, the share of liberal
arts degrees awarded also fell after reaching 29.9% in 1989. Liberal arts degrees remain
considerably below their peak of over 50% of all bachelor degrees awarded in the early 1970s.
In contrast, Science degrees expanded significantly from 1992 to 1997, in both absolute
(from 146,178 to 193,905) and relative (from 12.9% to 16.1%) terms. Degrees in Biology
(+48.9%) and Health Sciences (+38.7%), in particular, gained in popularity during these years

13
and could have been the choice of students who might otherwise have selected Economics as a
major.
MBA Degrees
As noted above, the majority of the S&P 500 CEOs who were Economics majors also earned an
MBA degree. MBA degrees awarded have continued an upward trend since 1960 (See Chart 4).
They grew at a double-digit pace annually in the 1960s and throughout much of the 1970s. Their
growth slowed to between 4 and 6 percent a year from the late 1970s to the mid-1980s. After a
couple of years of expanding by less than one percent, they resumed their annual rate of growth
of 3% or more until stalling out to growth rates of near zero in the mid-1990s. In 1997, the
number of MBA degrees began to rise again and continued through 2004 to increase at annual
growth rates of between 4 and 9 percent.
Chart 4. Number of MBA Degrees Awarded, 1960-2004
0
20,000
40,000
60,000
80,000
100,000
120,000
140,000
160,000
1960
1964
1968
1971
1973
1975
1977
1979
1981
1983
1985
1987
1989
1991
1993
1995
1997
1999
2001
2003

14
The Changing Gender Mix
The major shift in the gender composition of college graduates in recent years has implications
for both undergraduate Economics and MBA degrees awarded, and thus for the preparation of
potential women CEOs.
Undergraduate Female Students and Economics
Female students have been the major thrust behind the growth in college enrollments in recent
decades. Women earned 35.3% of the undergraduate degrees awarded in the United States in
1960; half (50.3%) by 1982; and 58.1% by 2004 (See Chart 5).
Chart 5. Undergraduate Degrees Awarded (Percentage), by Gender, 1960-2005
0.000
0.100
0.200
0.300
0.400
0.500
0.600
0.700
1960
1962
1964
1966
1968
1970
1982
1974
1976
1978
1980
1982
1984
1986
1988
1990
1992
1994
1996
1998
2000
2002
2004
WomenMen

15
Business degrees have proven attractive to undergraduate women students. Whereas women
earned just 7.5% of the bachelor’s degrees in business in 1960, more women (50.3%) than men
were awarded bachelor degrees in business in 2004 (See Chart 6).6
Chart 6. Bachelor's Degrees Awarded (%) in Business, by Gender, 1960-2004
0.00
0.10
0.20
0.30
0.40
0.50
0.60
0.70
0.80
0.90
1.00
1960
1964
1968
1971
1973
1975
1977
1979
1981
1983
1985
1987
1989
1991
1993
1995
1997
1999
2001
2003
WomenMen
In contrast, women remain the minority in Economics (See Chart 7). Women peaked at 34.5%
of Economics bachelor degree earners in the mid 1980s. After dropping in 1994 to 29.5%,
women’s share of bachelor’s degrees awarded in Economics rose to 32.8% in 2004.
A variety of factors have been attributed to the relatively low participation of women
majoring in Economics. These include a lack of female role models, a chilly and unwelcoming
6 This definition of business includes Finance and Accounting, in addition to Business Administration degrees.

16
classroom climate, significant peer group effects, overt and more subtle discrimination, less
quantitative preparation, evaluation methods that favor male learning styles, and less interest in
the topics and methodologies of the field.7
Chart 7. Bachelor's Degrees Awarded in Economics, by Gender, 1960-2004
0.000
0.100
0.200
0.300
0.400
0.500
0.600
0.700
0.800
0.900
1.000
1960
1964
1968
1970
1972
1974
1976
1978
1980
1982
1984
1986
1988
1990
1992
1994
1996
1998
2000
2002
2004
WomenMen
Women MBAs
Women have earned more masters degrees than men since the mid 1980s. However, while more
women than men earn business degrees at the undergraduate level, women are still the minority
in MBA degrees awarded (See Chart 8). They have, however, risen to 42.0% in 2004 up from
33.9% in 1990 and 22.3% in 1980.
7 See, for instance, Horvath et al., 1992; Ferber, 1995; Nelson, 1995; Anderson & Siegfried, 1997; Becker, 1997; Dynan and Rouse, 1997; Siegfried, 1997; Haslehurst, Hopkins and Thorpe, 1998; Hughes, 1998; Richardson, 1998;

17
Chart 8. Masters Degrees Awarded (%) in Business, by Gender, 1960-2004
0.00
0.20
0.40
0.60
0.80
1.00
1.20
1956
1960
1964
1968
1971
1973
1975
1977
1979
1981
1983
1985
1987
1989
1991
1993
1995
1997
1999
2001
2003
WomenMen
IV. The Likelihood of Economics Graduates Becoming CEOs
As noted above, undergraduate degrees awarded in Economics are well-represented among the
leading CEOs, with 9.2% of the S&P 500 CEOs in 2004 having majored in Economics. This
statistic is even more compelling given the relatively small share of undergraduate degrees
accounted for by Economics (around 2.0%). When adjusting for size of the pool of graduates,
Economics majors are shown to have had a greater likelihood of becoming an S&P 500 CEO in
2004 than any other undergraduate major. That is, the share of Economics majors who became
Chizmar, 2000; Jensen and Owen, 2000; Ashworth & Evans, 2001; and Worthington and Higgs, 2004.

18
CEOs was greater than that for any other major, including Business Administration and
Engineering.
Using the data on S&P 500 CEOs in 2004, this section of the paper analyzes the
likelihood of Economics majors becoming a CEO relative to their counterparts in other fields.
Empirical Methods and Results
Two empirical methodologies are used to analyze the data. The first involves calculation of a
ratio of relevant majors to determine the probabilities of being a CEO. The second employs a
logistic regression (logit) to determine the impact of major on being a CEO.
Probabilities of Becoming a CEO
Tabulations of the number of CEOs by major tell us how many events occur, (i.e., the number of
CEOs who have an undergraduate degree in Economics). However, to determine the probability
of an event occurring, (i.e., the likelihood of an Economics major becoming a CEO), requires the
size of the sample from which the CEOs are drawn. A ratio is calculated comparing the number
of all bachelors degrees awarded in Economics as compared to each other major. This ratio
varies both by major and by year. For instance, in 1971, there were 15,758 graduates in
Economics and 92,285 graduates in Business Administration, resulting in an
Economics/Business Administration ratio that year of 0.171. The numbers of CEOs by major
and by year of graduation are then tabulated and multiplied by the appropriate ratio. The
resulting ‘adjusted’ numbers of CEOs by major are then summed for the 39 years (in which
CEOs in the sample were awarded their degrees) and compared to Economics (as the base
category) to determine the probabilities.
19
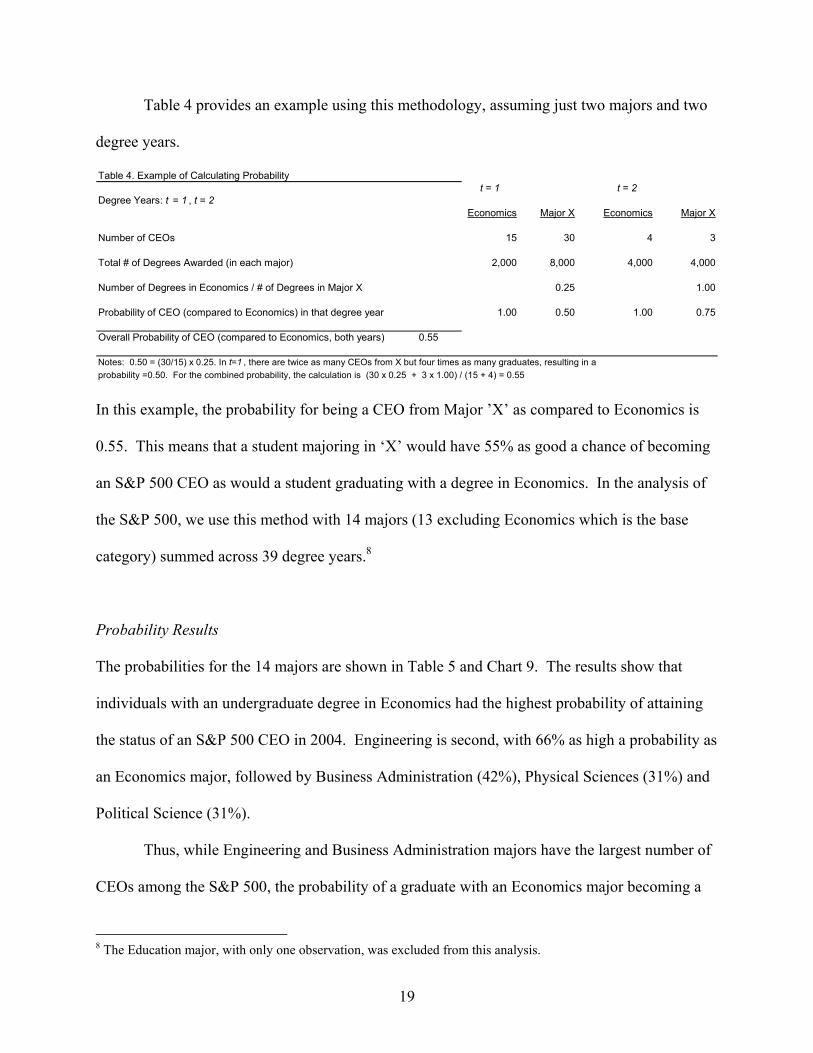
Table 4 provides an example using this methodology, assuming just two majors and two
degree years.
Table 4. Example of Calculating Probability t = 1 t = 2
Degree Years: t = 1 , t = 2Economics Major X Economics Major X
Number of CEOs 15 30 4 3
Total # of Degrees Awarded (in each major) 2,000 8,000 4,000 4,000
Number of Degrees in Economics / # of Degrees in Major X 0.25 1.00
Probability of CEO (compared to Economics) in that degree year 1.00 0.50 1.00 0.75
Overall Probability of CEO (compared to Economics, both years) 0.55
Notes: 0.50 = (30/15) x 0.25. In t=1 , there are twice as many CEOs from X but four times as many graduates, resulting in a probability =0.50. For the combined probability, the calculation is (30 x 0.25 + 3 x 1.00) / (15 + 4) = 0.55
In this example, the probability for being a CEO from Major ’X’ as compared to Economics is
0.55. This means that a student majoring in ‘X’ would have 55% as good a chance of becoming
an S&P 500 CEO as would a student graduating with a degree in Economics. In the analysis of
the S&P 500, we use this method with 14 majors (13 excluding Economics which is the base
category) summed across 39 degree years.8
Probability Results
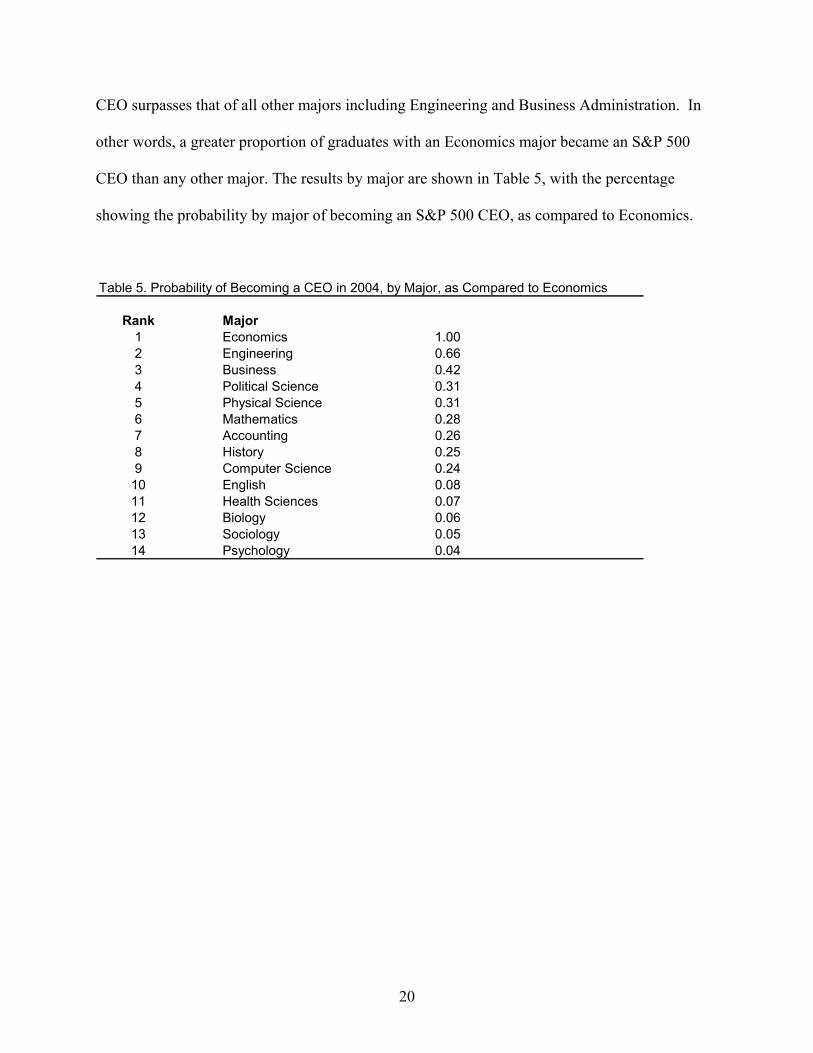
The probabilities for the 14 majors are shown in Table 5 and Chart 9. The results show that
individuals with an undergraduate degree in Economics had the highest probability of attaining
the status of an S&P 500 CEO in 2004. Engineering is second, with 66% as high a probability as
an Economics major, followed by Business Administration (42%), Physical Sciences (31%) and
Political Science (31%).
Thus, while Engineering and Business Administration majors have the largest number of
CEOs among the S&P 500, the probability of a graduate with an Economics major becoming a
8 The Education major, with only one observation, was excluded from this analysis.
20
CEO surpasses that of all other majors including Engineering and Business Administration. In
other words, a greater proportion of graduates with an Economics major became an S&P 500
CEO than any other major. The results by major are shown in Table 5, with the percentage
showing the probability by major of becoming an S&P 500 CEO, as compared to Economics.
Table 5. Probability of Becoming a CEO in 2004, by Major, as Compared to Economics
Rank Major1 Economics 1.002 Engineering 0.663 Business 0.424 Political Science 0.315 Physical Science 0.316 Mathematics 0.287 Accounting 0.268 History 0.259 Computer Science 0.2410 English 0.0811 Health Sciences 0.0712 Biology 0.0613 Sociology 0.0514 Psychology 0.04

21
Chart 9. Probability of Becoming an S&P 500 CEO, by Major, as Compared to Economics
0.00
0.20
0.40
0.60
0.80
1.00
1.20
Econ Engin Busin Poli Science Math Acct Hist Comput Engl Health Bio Soc Psych
Grouping the 14 majors into the four categories used earlier in the trend analysis, Economics,
Business, Science & Engineering and Liberal Arts (excluding Economics), generates the results
shown in Chart 10. When Engineering is combined with Science, it moves to third place, after
Business.

22
Chart 10. Probability of Becoming an S&P 500 CEO, by Major Category, as Compared to Economics
0.00
0.20
0.40
0.60
0.80
1.00
1.20
Economics Bus/Acct Sci/Engin Liberal Arts
Logistic Regression: Impact of Major
The second empirical method, a logistic regression, is used to determine the impact of major in
becoming a CEO. The logit analysis, used in cases of a dichotomous dependent variable, has the
dependent variable: whether or not an individual is an S& P 500 CEO. The sample used for this
analysis is all individuals who graduated from U.S. colleges and universities in the same years as
did the CEOs in the S&P 500 in 2004. This comprises a sample of over 15 million observations.
Each of these observations is coded for major, degree year, and whether or not they were an S&P
CEO in 2004.
23
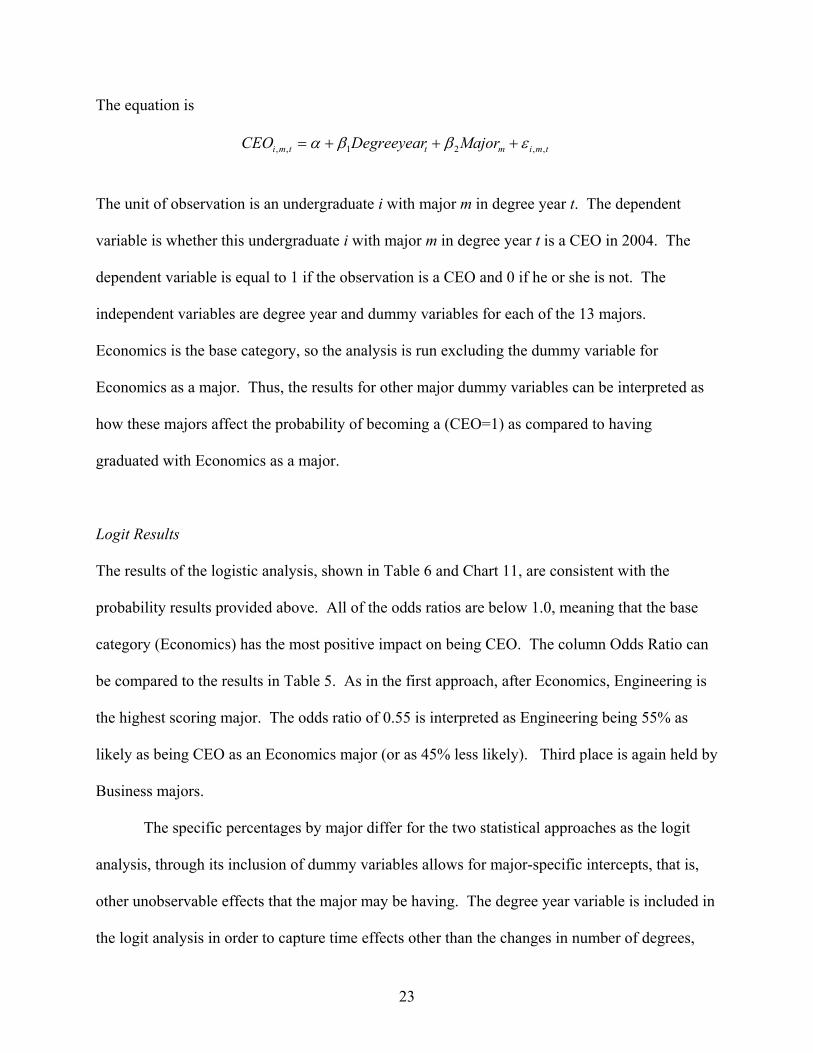
The equation is
tmimttmi MajorDegreeyearCEO ,,21,, εββα +++=
The unit of observation is an undergraduate i with major m in degree year t. The dependent
variable is whether this undergraduate i with major m in degree year t is a CEO in 2004. The
dependent variable is equal to 1 if the observation is a CEO and 0 if he or she is not. The
independent variables are degree year and dummy variables for each of the 13 majors.
Economics is the base category, so the analysis is run excluding the dummy variable for
Economics as a major. Thus, the results for other major dummy variables can be interpreted as
how these majors affect the probability of becoming a (CEO=1) as compared to having
graduated with Economics as a major.
Logit Results
The results of the logistic analysis, shown in Table 6 and Chart 11, are consistent with the
probability results provided above. All of the odds ratios are below 1.0, meaning that the base
category (Economics) has the most positive impact on being CEO. The column Odds Ratio can
be compared to the results in Table 5. As in the first approach, after Economics, Engineering is
the highest scoring major. The odds ratio of 0.55 is interpreted as Engineering being 55% as
likely as being CEO as an Economics major (or as 45% less likely). Third place is again held by
Business majors.
The specific percentages by major differ for the two statistical approaches as the logit
analysis, through its inclusion of dummy variables allows for major-specific intercepts, that is,
other unobservable effects that the major may be having. The degree year variable is included in
the logit analysis in order to capture time effects other than the changes in number of degrees,

24
such as the likelihood that people from certain degree years being more likely to be CEOs than
individuals from other years. Including the degree year variable to account for time effects
leaves the major dummy variables to capture the cross-sectional impacts of major choice. These
features also account for some small differences in order of ranking of the majors, with the
biggest gainer being History which rises from #9 to #5 in the relative rankings. One should note
that since Economics is the base category of comparison, the Economics major dummy variable
is excluded from the logit. All odds ratios are as compared to Economics. The z-statistics of all
the majors variables are significant at the 1% level.
Table 6. Logit Analysis: Likelihood of CEO by Major Compared to Economics
Rank Variable Odds Ratio Z-statistic
2 Engineering 0.55 -3.393 Business 0.41 -5.104 Political Science 0.35 -4.025 History 0.32 -4.616 Mathematics 0.32 -4.067 Physical Science 0.30 -4.528 Accounting 0.29 -4.859 Computer Science 0.27 -2.9910 Sociology 0.07 -5.0611 English 0.07 -7.1312 Biology 0.06 -6.5213 Health Sciences 0.05 -7.0614 Psychology 0.04 -6.02
Observations 15,514,554 Log likelihood 4592.99
Notes: Economics, the base category, ranks 1. Degree year variable is included in logit. All odds ratios are as compared to Economics.

25
Chart 11. Logit Results - Likelihood of CEO by Undergraduate Major as Compared to Economics
0.00
0.20
0.40
0.60
0.80
1.00
1.20
Econo
mics
Engine
ering
Busine
ss
Politic
al Scie
nce
History Math
Physic
al Scie
nce
Accou
nting
Compu
ter S
cienc
e
Sociol
ogy
Englis
h
Biolog
y
Health
Psych
ology
Grouping the 14 majors into the four categories used earlier provides the results shown in Chart
12. These results are similar to those shown in Chart 10 using the probability ratios.

26
Chart 12. Logit Results - Likelihood of CEO by Undergraduate Major Category as Compared to Economics
0.00
0.20
0.40
0.60
0.80
1.00
1.20
Economics Bus/Acct Sci/Engin Liberal Arts
Additional Analyses
In order to test for robustness, several additional analyses were also performed. For the
sake of brevity, these results are not included in the paper but are available on request. The first
additional check for robustness is done by splitting the sample into two subsamples based on the
degree year variable. The relative ordering of the top five majors is consistent based on several
different break years. The different degree years tested as structural breaks were 1967, 1970,
1975 and 1978.
As a test of the Discouraged Business Major (DBM) hypothesis we split the sample based
on whether the share of Economics’ majors was rising or falling for that year. The analysis did
find that the relative ordering of the top three majors was consistent across the two subsamples:
Economics, Engineering and Business Administration (including finance). In trough (versus

27
peak) years for Economics, Engineering is eight points higher (.59 versus .51) but Business is
two points lower (.40 versus .42). The Physical Sciences gained 14 points (.37 versus .23) and
Political Science gained 14 points (.42 versus .28). The fall in the Business majors’ likelihood
during trough years for Economics goes against the prediction of the DBM hypothesis.
Economics did, however, fare slightly less well in trough years than in peak years but Business is
not the field that seems to be benefiting from it.
The third additional test re-ran the analyses with the earliest year of data available from
Spencer Stuart, which is 2000. The results are consistent to those from the S&P 500 for the year
2004 that are reported in the body of the paper. The probabilities of Engineering and Business
fell from 0.66 to .62 and from .42 to .37, respectively. Economics maintained the highest
likelihood.
Summary and Conclusions The Economics major is a good choice for prospective CEOs. When adjusting for the size of the
pool of graduates, Economics majors are shown to have had a greater likelihood of becoming a
CEO in 2004 than other majors. That is, the share of graduates who were Economics majors who
became an S&P 500 CEO was greater than that for any other major, including Business
Administration and Engineering. Engineering majors were 66% as likely as Economics majors
to become a CEO; Business Administration majors, 42%.
Economics majors aspiring to become CEOs should plan on attending graduate school, and
consider, in particular, earning an MBA. Almost three-quarters (73.9%) of the CEOs with

28
undergraduate degrees in Economics, also completed an advanced degree. The majority (54.4%)
of the CEOs who had majored in Economics, held an MBA degree.
The CEOs who majored in Economics earned their bachelor and advanced degrees at a
variety of institutions. At the undergraduate level, they graduated from 38 colleges and
universities; 30.4% from Ivy League institutions. At the graduate level, 16 institutions were
represented; in terms of just the MBA, 11 institutions had conferred their degrees.
Less than 2% of the S&P 500 CEOs in 2004 were female. One of these six women
majored in Economics as an undergraduate. Women have been the major thrust behind the
growth in college graduates in recent decades, and by 2004 accounted by 58.1% of bachelor’s
degrees awarded. Women remain, however, underrepresented in Economics. In 2004, women
accounted for one-third of undergraduate degrees awarded in Economics, an increase over 1994,
but below their peak (34.5%) in the mid-1980s. In contrast, women received just over half
(50.3%) of the undergraduate degrees awarded in business in 2004.
Women also now earn more masters degrees than do men, but are still a minority (42.0%)
in terms of MBA degrees awarded. Women’s participation in MBA programs has, however,
exhibited an upward trend, and their share of MBA graduates has almost doubled since 22.3% in
1980. Moreover, freshman surveys show females are now more interested than their male
counterparts in obtaining a graduate degree. By 2005, two-thirds (75.5%) of freshman females
expressed interest in pursuing an advanced degree, up from 45.0% in 1966. The comparable
figures for freshmen males are 70.7% in 2005 and 62.4% in 1966. Freshmen females, however,
showed the greatest interest in continuing their education in law and medicine, rather than
business.

29
Economics programs and faculties can try to appeal to more women students as a
stepping stone to a career as a CEO. They may, however, be more successful in attracting
women students to Economics as a precursor to studying law, especially given the track record of
Economics majors in excelling in the LSAT exam and in outperforming other majors in the
earnings of lawyers.
Lastly, this research poses an interesting conundrum. Expanding the marketing of the
Economics major as the one which has had the greatest probability of becoming a CEO relative
to other majors, could expand the pool of Economics majors and possibly the number of CEOs
with these degrees. If the share of undergraduate degrees awarded in Economics also increases,
then this larger share could actually reduce the statistical likelihood of any given Economics
major becoming a CEO relative to other undergraduate majors.
30
REFERENCES
Anderson, K.H., and J.J. Siegfried, 1997. Gender differences in rating the teaching of economics. Eastern Economic Journal. 18(3):91-95. Ashworth, John and J. Lynne Evans. 2001. Modeling student subject choice at secondary and tertiary level: A cross-section study. Journal of Economic Education. 32(4): 311-320. Astin, Alexander W., Leticia Oseguera, Linda J. Sax, and William S. Korn. 2002. The American Freshman: Thirty-Five Year Trends. Los Angeles: Higher Education Research Institute, UCLA. Becker, W.E. 1997. Teaching economics to undergraduates. Journal of Economic Literature 35 (September):1347-1373. Black, Dan A., Seth Sanders and Lowell Taylor. 2003. The economic reward for studying economics. Economic Inquiry. 41(3): 365-377. Boone, Louis E., and David L. Kurtz. 2001. CEOs: A Group Profile. Business Horizons (July-August): 38-42. Brasfield, D.W., D. Harrison, J. McCoy, and M. Milkman. 1996. Why have some schools not experienced a decrease in the percentage of students majoring in economics? Journal of Economic Education 27(4):362-370. Chizmar, John F. 2000. A discrete-time hazard analysis of the role of gender in persistence in the economics major. Journal of Economic Education. 31(2): 107-118. Conrad, Cecilia.A. 1996. Where have all the majors gone? Comment. Journal of Economic Education. 27(3):376-378. Craft, R. Kim and Joe G. Baker. 2003. Do economists make better lawyers? Undergraduate degree field and lawyer earnings. Journal of Economic Education. 34(3): 263-281. Dyan, Karen E. and Cecilia Elena Rouse. 1997. The underrepresentation of women in economics: A study of undergraduate economics students. Journal of Economic Education. 28(4): 350-368. Ferber, M.A. 1995. The study of economics; a feminist critique. American Economic Review. 85(2):357-361. Green, Kenneth C. 1992. After the Boom: Management Majors in the 1990s. AACSB Special Report. New York: McGraw-Hill, Inc. Horvath, J., B.Q. Beaudin and S. P. Wright. 1992. Persisting in the introductory economics course. An exploration of gender difference. Journal of Economic Education. 23(2):101-108.

31
Haslehurst, J.,S. Hopkins and M. Thorpe. 1998. ‘Not rewarding,’ ‘not relevant,’ ‘not interesting’: Career choice of female economics students. Economic and Labour Relations Review. 9: 108-122. Hughes, H. 1998. An economist’s explanation of the low proportion of women in the economics profession. Economic Papers 17:6-12. Jensen, E.J. and Owen, A.L. 2000. Why are women such reluctant economists? Evidence from liberal arts colleges. American Economic Review 90(2):466-470. Margo, Robert A., and John J. Siegfried. 1996. Long-run trends in economics bachelor’s degrees. Journal of Economic Education. 27(4):326-336. Nelson, J.A. 1995. Feminism and economics. Journal of Economic Perspectives. 9(2):131-148. Nieswiadomy, Michael. 1998. LSAT Scores of economics majors. Journal of Economic Education. 29(4):377-379. Princeton Review. 2006. Undergraduate Majors accessed online August 15, 2006 at http://www.princetonreview.com/college/research/majors/majorBasics.asp?majorID=162 Pryor, John H., Sylvia Hurtado, Victor B. Saenz, Jennifer A. Lindhokm, William S. Korn, and Kathryn M. Mahoney. 2005. The American Freshman: National Norms for Fall 2005. Los Angeles: Higher Education Research Institute, UCLA. Richardson, S. 1998. Why do women make hopeless economists? (Or fail to succeed playing man-made economics by men’s rules). Economic Papers. 17(1):32-41. Rose, Robert E. and Calvin Wong. 1989. The MBA and Corporate Leadership. Business Horizons (September-October0: 54-57. Salemi, Michael K. and Carlie Eubanks. 1996. Long-run trends in economics bachelor’s degrees. Journal of Economic Education. 27(3): 326-336. Salemi, Michael K. 1996. Where have all the majors gone? Journal of Economic Education. 27(4): 323-325. Siegfried, John J. 2005. Trends in undergraduate economics degrees, 1991-2004. Journal of Economic Education. 36(3): 309-312. Siegfried, John J. 1997. Male-female differences in economic education. Journal of Economic Education 28(2): 1-11. Siegfried, John J. and David K. Round. 2001. International trends in economics degrees during the 1990s. Journal of Economic Education. 32(3): 203-218.
32
Siegfried, John J., and J.T. Wilkinson. 1982. The economics curriculum in the US. American Economic Review 72 (May):125-138. Skoorka, Bruce M. and Carol M. Condon. 2003. Trends in U.S. economics majors: Why the decline in the 1990s? Atlantic Economic Journal. 31(2): 195-204. Willis, Rachel A., and Paul J. Pieper. 1996. The economics major: A cross-sectional view. Journal of Economic Education. 27(4):337-349. Worthington, Andrew and Helen Higgs. 2004. Factors explaining the choice of an economics major. International Journal of Social Economics. 31(5/6): 593-613.


![SYLLABUS FOR B.A. [ECONOMICS] UNDER CHOICE BASE CREDIT](https://img.dokumen.tips/doc/110x75/6158c4e8bfc39213f423aac7/syllabus-for-ba-economics-under-choice-base-credit-.jpg)