Embed Size (px)
Citation preview
331
ECONOMICS and COUNTRY – REGIONAL REPORTS
Professor Indar Ramnarine
University of the West Indies
Trinidad and Tobago
332
TILAPIA CULTURE IN TRINIDAD AND TOBAGO: YET ANOTHER UPDATE
Indar W. Ramnarine
Department of Life Sciences The University of the West Indies
St Augustine Trinidad and Tobago
and Capildeo Barrath
Aquaculture Association of Trinidad & Tobago
e-mail: [email protected] ABSTRACT
Production of tilapia began in Trinidad in 1951 with the culture of the Mozambique tilapia,
Oreochromis mossambicus. In the years that followed, although attempts were made to
commercialize its culture, tilapia production remained at a subsistence level with small earthen
ponds being utilized. The Jamaica red tilapia was introduced in 1983 and during the years 1994
to 1998, commercial production was established at the state-owned company, Caroni (1975) Ltd.
Production peaked at 26 tonnes in 1998. The facility was leased in 1999 but production declined
until the project was terminated in 2000. There have been recent attempts at commercial culture
by the Nariva Aquafarm and the Bamboo Grove Fish Farm. Production has increased since 2000
and the annual production is about 10 tonnes, with the Nile tilapia, Oreochromis niloticus, being
the major species. There is again considerable interest in tilapia culture and this is being
aggressively promoted by the Aquaculture Association of Trinidad & Tobago. Within the last year,
there have been significant development; construction of a biofloc system by the Seafood
Industry Development Company, a re-circulating system by the Institute of Marine Affairs, an
Aquaponics system by a private investor, several hatcheries utilizing YY technology and several
smaller enterprises. The trend is towards intensive culture in tanks. The forecast is for increased
production especially as new investors continue to join the industry.
INTRODUCTION
The Republic of Trinidad and Tobago is located between 10°2' and 11°2' North Latitude and
60°30' and 61°50' West Longitude, just off the north-east coast of Venezuela, South America. Its climate is tropical, with an average temperature ranging from 21°C to 34°C. In general nighttime
temperatures are usually 10°C to 15°C lower that during the day. There is a major dry season from late December to early May followed by a rainy season extending from late May to early
December. The rainy season is interrupted by a short dry spell of mean duration two weeks and
termed the petit careme. The average rainfall in NE Trinidad is around 3000 mm per annum while in NW and SW Trinidad, the rainfall is about 1500 mm per annum. The island of Trinidad is
roughly rectangular in shape and has an area of 4760 square kilometers. There are three mountain ranges, the Northern Range (which is a continuation of the Andes), Central Range and
Southern Range. The area between the Northern Range and Central Range is relatively flat and clayey in nature while the area between the Central Range and the Southern Range is gently
rolling. Tobago occupies an area of 308 square kilometers and there is a single mountain range
called the Main Ridge. There are several major drainages in both islands. In Trinidad, the major drainages are the Caroni, North Oropouche, Ortoire and South Oropouche whereas in Tobago,
the major drainages are the Courland, Hillsborough and Goldsborough. There is therefore an

333
ideal climate, abundant water and land resources for the development of an aquaculture
industry, in particular tilapia aquaculture.
HISTORY OF TILAPIA CULTURE
The Mozambique tilapia, Oreochromis mossambicus, was first introduced to Trinidad and Tobago in 1951 via St Lucia by Hickling (Kenny, 1959). Production began in 1951 with the establishment
of the Bamboo Grove Fish Farm at Valsayn as a research and demonstration unit (Ramnarine,
1996). Research was conducted on the species during the 1950s and 1960s. Although a method was developed to restrict reproduction under pond culture (Kenny, 1960), no significant
commercial development took place. This was primarily the result of poor consumer acceptance of the fish due to its acquired muddy taste and dark colour. Also, most of the private farms that
were established were small and subsistence culture was practised. There was very little understanding of pond management such as water quality management, predator control and
feeding. In addition, monosex culture was not practised and this led to the production of
numerous stunted and unmarketable fish. A red tilapia strain was imported from Jamaica in 1983 and the Nile tilapia was introduced into the country in 1986, also from Jamaica (Ramnarine,
1996).
STATUS OF TILAPIA CULTURE
There are currently 1105 food-fish farmers registered with the Ministry of Agriculture but
Manwaring and Romano (1990) identified only 562 active farmers. That number has declined since 1990. These farmers operate small holdings with an average surface area of 0.07 ha and
initially cultured the Mozambique tilapia. Since the mid-1980s they have shifted to culturing mainly the Jamaica red tilapia, but operate, however, at a subsistence level. Today, the number
of active food-fish farmers is thought to be even less that 100 but there is growing interest in the culture of the Nile tilapia.
The major commercial aquaculture project in the country was that operated by the state-owned
Caroni (1975) Limited, a sugar producing company. Their aquaculture project consisted of a
hatchery, outdoor concrete tanks and 9.5 ha of earthen ponds, ranging in size from 0.25 ha to 1 ha (Ramnarine and Batchasingh, 1994). This farm, however, was leased in mid 1999 to a private
farmer, although Caroni (1975) Limited has retained control of the hatchery. The project was closed soon after and although there were attempts to lease the facilities to the private sector in
2005, this was not done and as such, the project remains closed. Another government-owned facility, the Bamboo Grove Fish Farm consists of a small hatchery and 2.4 ha of ponds. This was
leased in 2002 and has been brought back into production. There are two other government
institutions involved in aquaculture. The Institute of Marine Affairs has an aquaculture unit that consists of a hatchery/wet laboratory and nine small earthen ponds with a of total area 0.18 ha.
The Sugarcane Feeds Centre has 13 ponds with a total area of 0.88 ha and a small hatchery. There is a privately owned project at Plum Mitan consisting of about 3 ha of ponds and another
farm at Penal with 1 ha of ponds.
Most projects in the country use earthen ponds but there is a tank culture operation in central
Trinidad that utilizes injected oxygen in their system. The status of this project is unknown. Caroni (1975) Limited and the Sugar Cane Feeds Centre also use concrete and metal tanks, but
production from tank culture is limited. At the Bamboo Grove Fish Farm, there are four octagonal concrete tanks with a solids removal system. Each tank has a capacity of 100 cubic
metres and intensive mixed-sex culture is being carried out in these tanks with encouraging results (Ramnarine, 2004).
The subsistence farmers practise mixed-sex culture while the Institute of Marine Affairs, the
Sugarcane Feeds Centre practise monosex culture. Manual sexing is done by the Institute of
Marine Affairs and the Sugarcane Feeds Centre while Bamboo Fish Farm uses hormonal sex
334
reversal in addition to intensive mixed-sex culture. More recently, the Institute of Marine Affairs
has acquired YY males and monosex production is done using this technology.
Caroni (1975) Limited used a 24 week grow-out period and the average yield per crop ranges between 2,000 to 4,000 kg per ha. A locally manufactured tilapia feed (sinking pellets, 25%
crude protein) was used and costed $US0.38 per kg. A floating pellet is also available and costs $US0.60 per kg. The average size at harvest is 250 to 450 g and the average feed conversion
ratio ranges between 2 : 1 to 4 : 1. The bulk of the fish was marketed fresh, chilled on ice, while some processing was also done by Caroni (1975) Limited. Whole fish was sold at approximately
$US2.00 per kg while fillets are sold at $US3.00 per 450 g package. Tilapia that is currently
produced is sold whole at $US 4.00 per kg representing a significant increase in price over the last 4 years.
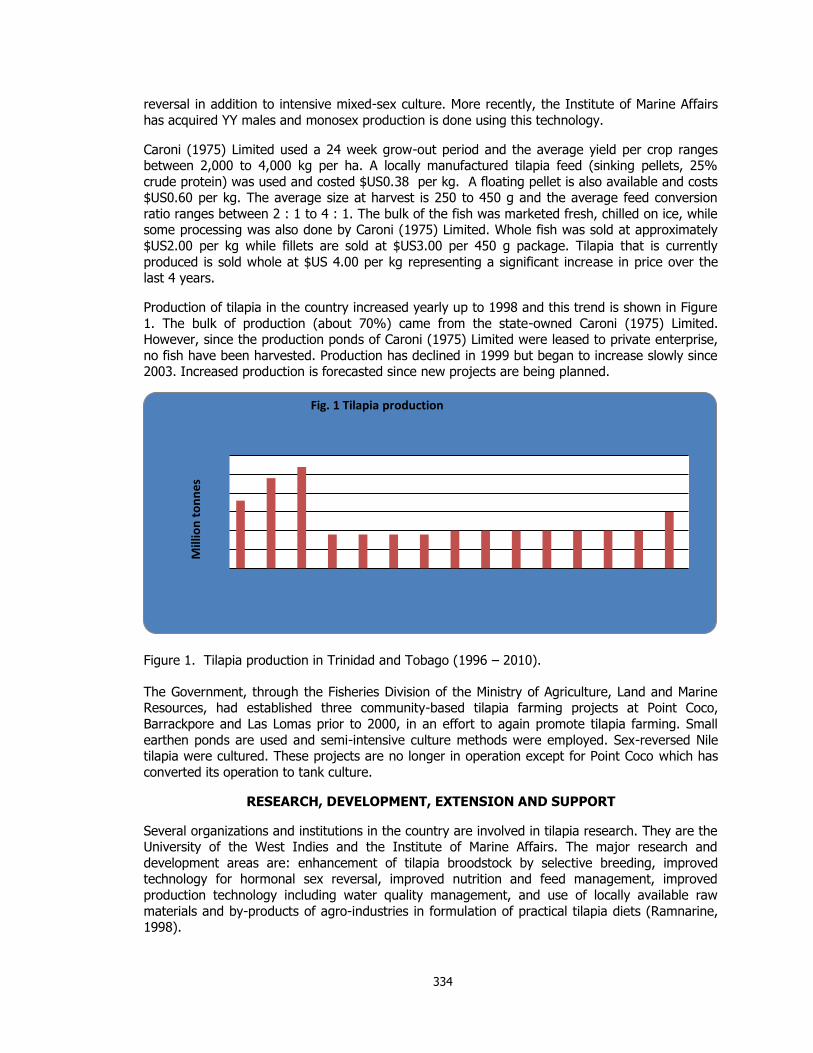
Production of tilapia in the country increased yearly up to 1998 and this trend is shown in Figure
1. The bulk of production (about 70%) came from the state-owned Caroni (1975) Limited. However, since the production ponds of Caroni (1975) Limited were leased to private enterprise,
no fish have been harvested. Production has declined in 1999 but began to increase slowly since 2003. Increased production is forecasted since new projects are being planned.
Figure 1. Tilapia production in Trinidad and Tobago (1996 – 2010).
The Government, through the Fisheries Division of the Ministry of Agriculture, Land and Marine Resources, had established three community-based tilapia farming projects at Point Coco,
Barrackpore and Las Lomas prior to 2000, in an effort to again promote tilapia farming. Small
earthen ponds are used and semi-intensive culture methods were employed. Sex-reversed Nile tilapia were cultured. These projects are no longer in operation except for Point Coco which has
converted its operation to tank culture.
RESEARCH, DEVELOPMENT, EXTENSION AND SUPPORT
Several organizations and institutions in the country are involved in tilapia research. They are the University of the West Indies and the Institute of Marine Affairs. The major research and
development areas are: enhancement of tilapia broodstock by selective breeding, improved technology for hormonal sex reversal, improved nutrition and feed management, improved
production technology including water quality management, and use of locally available raw
materials and by-products of agro-industries in formulation of practical tilapia diets (Ramnarine, 1998).
Mill
ion
to
nn
es
Fig. 1 Tilapia production
335
Various institutions provide technical advice to farmers and conduct field visits, and workshops
are held occasionally. The University of the West Indies, the Institute of Marine Affairs and the Fisheries Division have produced literature on tilapia production methods and pond construction.
Seedstock is currently available through the Institute of Marine Affairs, the Sugarcane Feeds Centre and several private hatcheries. The Government provides a 50% subsidy on the
construction of ponds to a maximum of $US3 175, and a 50% subsidy on the production cost of
freshwater fish up to a maximum of $US0.80 per kg of fish produced to a maximum payment of $US1 587 per farmer per annum. Aquaculture equipment, feed, and broodstock may be imported
duty free and no value-added tax is payable. Concessions may also be given on vehicles and tractors that are used in aquaculture projects. These various incentives came into effect in 1999,
and it is the Government's attempt to develop the aquaculture industry. In addition, the state-owned Agricultural Development Bank, and commercial banks grant loans for aquaculture.
Incentives for aquaculture are currently being revised in an effort to promote the development of
the industry.
RECENT DEVELOPMENTS
Within the last year, there have been significant developments in the growth of the tilapia industry. There are now three private hatcheries that produce all-male tilapia using YY
technology. The Institute of Marine Affairs is also producing males using this technology.
There is a functioning biofloc operation at the Seafood Industry Development Company consisting of six 6-m diameter fiberglass tanks. Technical assistance was provided by the
University of the West Indies in setting up this system. The Institute of Marine Affairs has
established a re-circulating system consisting of ten 6-m diameter fiberglass tanks. Both these operations are quite impressive and are functioning well. There is now considerable interest in
Aquaponics in the country and the University of the West Indies recently hosted a training workshop for potential farmers and investors. This was taught by Drs J. Rakocy and I.
Ramnarine. A commercial system has recently been commissioned and there are three other
commercial systems that are being planned. There is also a lot of interest in tank culture using the biofloc system and two commercial operations are being planned.
CONCLUSIONS
Tilapia production was increasing at a steady rate prior to the lease of the Caroni (1975) Limited aquaculture project in 1999. Production has averaged just under 10 tonnes per annum since then
but now, due to the development of two major projects: the SIDC and the IMA, production is again on the increase. There is renewed interest in intensive and semi-intensive systems using
tanks in particular and also in aquaponics. The future looks very promising.
REFERENCES
Kenny, J.S. (1959) Fish culture prospects in Trinidad and Tobago. W.I. Fish Bulletin, 2: 1 - 15.
Kenny, J.S. (1960) Notes on experiments to determine methods of
restricting population growth of Tilapia mossambica (Peters) under pond culture conditions. BGFF, Ministry of Agriculture, 8 pp.
Manwaring, G. and Romano, H. (1990) Aquaculture marketing; a survey of existing producers. Caribbean Marine Studies 1 No.1: 2 - 10.
Ramnarine, I.W. (1996) A brief history of aquaculture in Trinidad and
Tobago and the potential for the development of an aquaculture industry. In: Proceedings of NIHERST's 7th annual seminar on agricultural research. pp 171 - 174.
Ramnarine, R.N. (1998) A situation analysis of the freshwater fish industry in Trinidad and Tobago. In: Situation Analyses of Agricultural Sub-sectors for the Priority
Setting Process in Trinidad and Tobago (NIHERST) pp 130 - 138.

336
Ramnarine, I.W. and Batchasingh, R.N. (1994) Recent developments in
aquaculture in Trinidad and Tobago. The Caribbean Aquaculturist 9 No 3, p 20. Ramnarine, I.W. , de Souza, G., Ramnarine, R.N., Gooriesingh, K., Soomai,
S., and Henry, L. (1998) A National Aquaculture Policy for Trinidad and Tobago. MALMR, 40 pp.
Ramnarine, I.W. (2004) Mixed-sex culture of tilapia in octagonal concrete tanks.
Proceedings of the 6th International Symposium of Tilapia in Aquaculture. Manila, the Philippines, September 2004.
337
60 YEARS OF TILAPIA AQUACULTURE IN NIGERIA
O. A. FAGBENRO1, O. S. FASASI2, T. JEGEDE3 and O. O. OLAWUSI-PETERS1
1 Department of Fisheries & Aquaculture Technology, Federal University of Technology, Akure, Nigeria.
2 Department of Food Science & Technology, Federal University of Technology, Akure, Nigeria. 3 Department of Forestry, Wildlife & Fisheries, University of Ado Ekiti, Ado Ekiti, Nigeria.
INTRODUCTION
Nigeria is the second largest producer of farm-raised tilapias in Africa, after Egypt
(Adesulu, 1997; Fagbenro, 2002; El-Sayed, 2006; Fagbenro et al., 2010). The first attempt at fish farming was in 1951 at a small experimental station in Onikan and various Tilapia species were
used. Modern pond culture started with a pilot fish farm (20 ha) in Panyam for rearing the common/mirror carp, Cyprinus carpio, following the disappointing results with tilapias. Although
the first years of Panyam fish farm's existence were hardly satisfactory, the trials nevertheless generated sufficient interest that regional governments established more fish farms. Tilapias are
widely cultivated in ponds, reservoirs and cages in Nigeria (Satia, 1990; Fagbenro et al., 2004)
and are suited to low-technology farming systems because of their fast growth rate, efficient use of natural aquatic foods, propensity to consume a variety of supplementary feeds, omnivorous
food habits, resistance to disease and handling, ease of reproduction in captivity, and tolerance to wide ranges of environmental conditions (Fagbenro, 1987).
Tilapia culture in Nigeria remained largely a subsistence level activity until 2000, when it
began to expand rapidly following the successful commercial farming of catfishes during the last decade (Alfred and Fagbenro, 2006; Afolabi et al., 2007). There are over 25 species of tilapias in
Nigeria, out of which about six species are used for aquaculture, namely, Tilapia zillii, T. guineensis (substrate spawners, macro-phytophagous (generally herbivorous), Sarotherodon
galilaeus, S. melanotheron (bi-parental mouth-brooders, micro-phytophagous (planktophagous), Oreochromis niloticus and O. aureus (maternal mouth-brooders, omnivorous). The natural
feeding habits of cultivated tilapias in Nigeria are summarised in Table 1.
Table 1: Natural feeding ecology of tilapias used in fish culture in Nigeria.
Species Food habits
O. aureus Adults omnivorous. Fry feed initially on zooplankton. Exclusively
phytoplanktivorous.
O. niloticus Omnivorous grazer. Feeds on algae but not higher plants.
S. galilaeus
S. melanotheron
Adults feed almost exclusively on phytoplankton. Juveniles feed on
plankton.
T. guineensis, T. Zillii Adults feed exclusively on higher plants. Juveniles consume plankton.
Sources: Idodo-Umeh (2003), Adesulu and Sydenham (2007)

338
TILAPIA FARMING/PRODUCTION SYSTEMS
Tilapia is cultivated in a tremendous diversity of production systems, in ponds, cages, hapas, raceways, concrete tanks, from extensive to super-intensive practices at small-scale and
large-scale level, for self-consumption or marketing and even processing purposes. The technology for tilapia farming is well established and tested, ranging in production from 200
kg.ha-1.yr-1 in stocked rice paddies to over 2000 mt.ha.yr-1 in the more intensive tank culture
system. Tilapia aquaculture industry produced 14,388 tonnes in 2000 and increased to 19,546 tonnes in 2005; and was based mainly on O. niloticus (Fagbenro and Adebayo, 2005; Ayinla,
2007), cultivated under intensive (commercial) and semi-intensive (artisanal) production systems. Tilapias are suited to low-technology farming systems. This is because of their fast growth rate,
efficient use of natural aquatic foods, propensity to consume a variety of supplementary feeds,
omnivorous food habits, resistance to disease and handling, ease of reproduction in captivity and tolerance to wide ranges of environmental conditions; and its use to control aquatic microphytes
(Fagbenro, 1998, 2001; Fagbenro and Akinbode, 1988).
TILAPIA POPULATION CONTROL
Natural reproduction of cultured tilapia species occurs in one of two ways: mouth
brooders or substrate brooders. The ease with which tilapias spawn and produce offspring makes them a good fish to culture. However, this trait creates problems. Survival of young is high and
grow-out ponds can become crowded. Fish become stunted as the supply of natural food organisms in the pond is depleted. Fagbenro (2002) reviewed the several effective methods used
to control such undesirable tilapia population and the advantages and disadvantages of these
control methods were presented, of which very few have progressed from use in experimental studies or development trials to widespread adoption by farmers (Agbebi and Fagbenro, 2006).
Where a thorough assessment of user (farmer and consumer) perspectives are considered, the use of local predatory fish species to control such undesirable tilapia recruitment in ponds is one
of the most effective and practical methods.
Density control of tilapia populations by predators is not thoroughly researched in Nigeria
as only few indigenous predators have been tested. Unlike clariid catfishes, most predators have
some drawbacks (Table 2); hence the combined production of tilapia and clariid catfishes has attracted considerable attention, particularly in Nigeria (Fagbenro, 2000, 2004). The hybrid clariid
catfishes, H. longifilis x C. gariepinus and H. bidorsalis x C. gariepinus, and their reciprocal crosses grow faster than their parental species and have high propensity for piscivory, suggesting
that they could be used to control tilapia recruitment in ponds. Choosing an efficient predator of
a specific size with a recommended optimum predator-tilapia ratio represents a constraint to the success of this technique. Apart from the proper stocking densities and ratios, the effectiveness
of combined culture of tilapias with predators is determined by many interrelated factors: adequate good-quality supplementary feed for tilapias; availability of predator fingerlings for
stocking; dietary habits of predator; appropriate time of introduction of predator.
339
Table 2: Predatory fishes used to control tilapia reproduction in Nigeria.
Predatory species and their qualities
Clarias isheriensis (C. agboinensis) - prefers tilapia eggs to juvenile tilapia
- poor market value due to small adult size - easily propagated in captivity using natural or hormone induced techniques
African (sharptooth) mud catfish - Clarias gariepinus (C. lazera)
- omnivorous with high propensity for carnivory - becomes inefficient, competing for food with prey
- fast growth, attains large adult size - easily propagated in captivity using natural or hormone induced techniques
Heterobranchus bidorsalis, H. bidorsalis/H. longifilis x Clarias gariepinus - carnivorous with high propensity for piscivory - fast growth, attains large adult size
- easily propagated in captivity using natural or hormone induced techniques
Snakehead - Parachanna obscura - voracious predator
- difficulty in obtaining its seeds in natural waters - inability to reproduce in captivity
- attains large size
The jewel cichlid - Hemichromis fasciatus - voracious predator
- a prolific breeder with short generation time (5-6 months) - poor market value due to small adult size
Source: Fagbenro (2000, 2002, 2004)
Even with the use of predators, the main drawback to tilapia culture remains the
excessive recruitment in ponds, which result in low yields of harvestable size. Presently, the use
of less expensive and appropriate technology in solving the problem of uncontrolled reproduction in tilapias using biological inhibitory agents is being advocated. Plants with antifertility properties
may offer solution as they are easy to obtain and can be incorporated into tilapia feeds. Plants that have been tested and proved for their antifertility properties in Nigeria include Quassia amara, Alloe vera, Hibiscus rosa-sinensis, pawpaw (Carica papaya), neem (Azadirachta indica)
and morinda (Morinda lucida) (Raji and Bolarinwa, 1997; Udoh and Kehinde, 1999; Uche-Nwachi et al., 2001; Kusemiju et al., 2002; Oderinde et al., 2002; Adebiyi et al., 2002, 2003; Raji et al., 2003; Yinusa et al., 2005; Jegede, 2010; Ellah, 2011). In Nigeria, extracts of pawpaw seeds, neem leaves, had been investigated as fertility control agents in O. niloticus, and T. zillii and their
contraceptive efficacies in combating the problem of tilapia overpopulation in ponds have been established (Ekanem and Okoronkwo, 2003; Jegede, 2009).
FEEDSTUFFS AND FEED/DIETS FOR TILAPIAS
Both intensive and semi-intensive systems involve input of supplementary and complete feeds, which account for up to 40 and 60% of production costs, respectively (Fagbenro, 1987;
Raji, 1998; Fapohunda and Fagbenro, 2006). Two main types of feeds are produced by both sectors namely herbivorous fish (tilapia) feeds, which contain 30-35% crude protein, and
carnivorous fish (catfish) feeds, which contain 45-50% crude protein. In 2000, the Nigerian
aquaculture industry consumed an estimated 35,570 tonnes of feed (Fagbenro and Adebayo, 2005). The gross ingredient composition used in tilapia feeds follows the least cost formulation
presented in Table 3. The various animal by-products and plant residues that have been evaluated in tilapia diets in Nigeria are shown in Table 4.
340
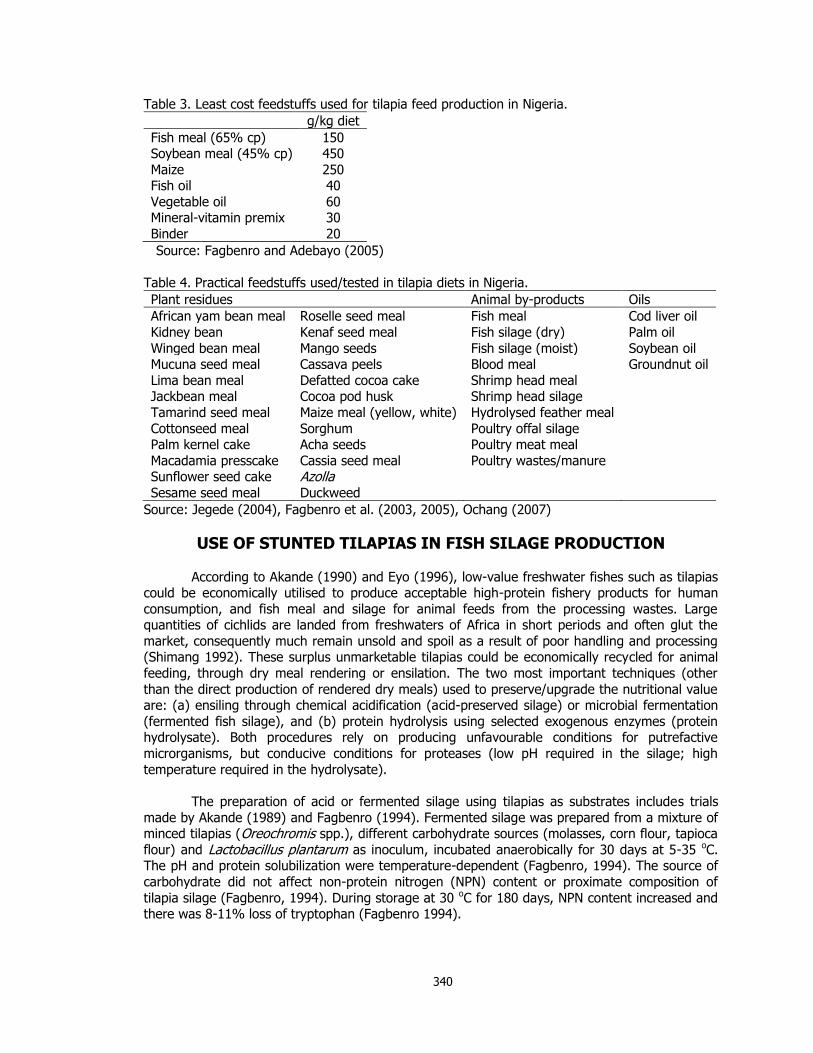
Table 3. Least cost feedstuffs used for tilapia feed production in Nigeria.
g/kg diet
Fish meal (65% cp) 150 Soybean meal (45% cp) 450
Maize 250 Fish oil 40
Vegetable oil 60 Mineral-vitamin premix 30
Binder 20
Source: Fagbenro and Adebayo (2005)
Table 4. Practical feedstuffs used/tested in tilapia diets in Nigeria.
Plant residues Animal by-products Oils
African yam bean meal Roselle seed meal Fish meal Cod liver oil
Kidney bean Kenaf seed meal Fish silage (dry) Palm oil
Winged bean meal Mango seeds Fish silage (moist) Soybean oil Mucuna seed meal Cassava peels Blood meal Groundnut oil
Lima bean meal Defatted cocoa cake Shrimp head meal Jackbean meal Cocoa pod husk Shrimp head silage
Tamarind seed meal Maize meal (yellow, white) Hydrolysed feather meal
Cottonseed meal Sorghum Poultry offal silage Palm kernel cake Acha seeds Poultry meat meal
Macadamia presscake Cassia seed meal Poultry wastes/manure Sunflower seed cake Azolla
Sesame seed meal Duckweed
Source: Jegede (2004), Fagbenro et al. (2003, 2005), Ochang (2007)
USE OF STUNTED TILAPIAS IN FISH SILAGE PRODUCTION
According to Akande (1990) and Eyo (1996), low-value freshwater fishes such as tilapias could be economically utilised to produce acceptable high-protein fishery products for human
consumption, and fish meal and silage for animal feeds from the processing wastes. Large quantities of cichlids are landed from freshwaters of Africa in short periods and often glut the
market, consequently much remain unsold and spoil as a result of poor handling and processing (Shimang 1992). These surplus unmarketable tilapias could be economically recycled for animal
feeding, through dry meal rendering or ensilation. The two most important techniques (other
than the direct production of rendered dry meals) used to preserve/upgrade the nutritional value are: (a) ensiling through chemical acidification (acid-preserved silage) or microbial fermentation
(fermented fish silage), and (b) protein hydrolysis using selected exogenous enzymes (protein hydrolysate). Both procedures rely on producing unfavourable conditions for putrefactive
microrganisms, but conducive conditions for proteases (low pH required in the silage; high
temperature required in the hydrolysate).
The preparation of acid or fermented silage using tilapias as substrates includes trials
made by Akande (1989) and Fagbenro (1994). Fermented silage was prepared from a mixture of minced tilapias (Oreochromis spp.), different carbohydrate sources (molasses, corn flour, tapioca
flour) and Lactobacillus plantarum as inoculum, incubated anaerobically for 30 days at 5-35 oC. The pH and protein solubilization were temperature-dependent (Fagbenro, 1994). The source of
carbohydrate did not affect non-protein nitrogen (NPN) content or proximate composition of
tilapia silage (Fagbenro, 1994). During storage at 30 oC for 180 days, NPN content increased and there was 8-11% loss of tryptophan (Fagbenro 1994).
341
USE OF TILAPIA SILAGE IN FISH DIETS
Fish silage has been used as a feed supplement for various livestock and poultry animals and results have generally shown that it has good nutritional quality. The biological value of its
protein was also comparable with that of fish meal protein. However, only recently has its potential in aquaculture diets been recognised, hence few studies have assessed their suitability.
Generally, fish silage has been compared with fish meal and its suitability (or otherwise) assessed
by fish growth responses, protein utilization and digestibility. Conflicting results have been reported on fish silage as fish meal replacer (either partially or totally) in fish diets. Moist acid
silage has been fed to carps, salmonids, eels, catfish, sea bass and tilapias with satisfactory results but few comparable results are available for fish fed fermented silage. Fagbenro (1994)
showed that O. niloticus and C. gariepinus fed with moist diets containing autolysed protein from
fermented tilapia silage stored for 15-60 days showed good growth performance and protein utilization. There were no differences in body (carcass) composition and hepatosomatic index in
C. gariepinus fed increasing dietary levels of autolysed protein from fermented fish silage and no morphological deformities were observed (Fagbenro, 1994).
Liquid fish silage is viscous, bulky and difficult to transport, stir or store, and can only be fed to pigs directly. There are no solids present to make into presscake; hence water removal by
evaporation is necessary. Because of the low solids concentration, it is difficult to dry alone.
Several methods of removing the water content of silages include spray drying, vacuum evaporation or drum drying. Alternatively, filler can be added and then dried together, after
which the co-dried product can be used as protein supplement for poultry or fish. The nutrient content of the dried product is easily altered by the type and amount of filler material used, such
as wheat offal, palm kernel cake, cassava flour, rice bran, maize flour, whey, potato flour,
soybean-feather meal mixture, soybean meal, poultry by-product meal, meat and bone meal, feather meal (Akande, 1990; Fagbenro, 1994), the choice of which is determined by cost and
local availability. Ayinla and Akande (1988) reported that dietary inclusion of acidulated tilapia silage at 410 g/kg for C. gariepinus resulted in a better weight gain than diets containing 40 g/kg
fish meal. Fermented tilapia silage co-dried with soybean meal replaced up to 75% of fish meal
component in dry diets for O. niloticus and C. gariepinus while total replacement gave inferior growth responses, feed conversion and protein utilization, caused by reduced palatability of diets
or reduced appetite. No differences occurred in the hepatosomatic indices of O. niloticus and C. gariepinus fed increasing dietary levels of co-dried fermented fish silage: soybean blend and no
morphological deformities were observed (Fagbenro, 1994).
USE OF TILAPIA IN SALTED DRIED MINCED FISH CAKE PRODUCTION
Stunted tilapias could also be introduced into the human food chain. One of such ways is
the conversion to mince and cakes. Fish mince is flesh separated in a communited form from skin, bones, scales and fins of fish. Production of mince from underutilized and unused species is
not only an efficient way of recovering flesh for direct human food, but also a wide range of by-
products such as pet foods and livestock meal can be made from bones as well as scales, liver, swim bladder, etc. The production of mince from tilapia could be a valuable source for the
production of a versatile protein-rich product acceptable to the local consumers. In the production of spiced minced fish cakes from stunted tilapias, Akande (1990) concentrated efforts
on producing an inexpensive cake that would be particularly appropriate for the growing fast-food trade as ―raw and ready to fry‖ product. No loss in quality was reported when spiced minced
tilapia cake was fried immediately after preparation and assessment of the product varied from
good to excellent. An advantage of this product is the convenient preparation and lack of bones, which makes it readily consumed by children. It would be particularly appropriate for the
institutional trade as raw, ready to fry product and for the housewife as a ready ―heat-in-the-oven‖ product. Similar works in Nigeria using stunted tilapias as substrates for salted minced fish

342
cakes were conducted by Eyo (1996) and Aluko et al.(2000). The cakes produced were stored at
ambient temperature (25-32 oC) for up to two months during which the microbial count (total viable count, TVC) reduced from 4.4 x 10³ to 1.5 x 10². The drop in TVC was attributed to a
lowering of water activity with increasing water loss. Although no attempts were made to identify the organisms in the total plate count, halotolerant organisms were responsible. The results of a
taste panel confirmed the flavour as good, without a strong ―fishy‖ taste. Odour, texture,
saltiness and colour were satisfactory and no rancid taste was detected.
USE OF TILAPIA PITUITARY IN CATFISH BREEDING
African catfishes, Clarias gariepinus, C. anguillaris, Heterobranchus bidorsalis, H. longifilis, and their hybrids are cultivated for reasons of their high growth rate, disease resistance
and amenability to high density culture, related to their air-breathing habits (Fagbenro et al., 1993; Atanda 2007). The genus Clarias is circumtropical, constituting a major warmwater aquaculture species in Africa and has been introduced for cultivation in Europe and southern Asia
while the genus Heterobranchus is endemic to Africa. Clariid catfishes do not breed in ponds; hence artificial propagation using exogenous hormones to induce oocyte maturation, ovulation
and spawning is necessary. Various synthetic or purified hormones and steroids have induced ovulation in fishes but their use in Nigeria is limited because they are expensive and are not
locally available. To avoid these problems, and to encourage fish breeding programs, the use of
crude piscine hypophyses was advocated.
The reluctance of fish farmers to sacrifice precious catfish brooders as donors for
hypophyses coupled with seasonality of maturation in clariid catfishes (Ayinla and Nwadukwe, 1988), pose hindrances to homoplastic hypophysation in Nigeria. Although pituitary extracts from
non-piscine sources such as African bullfrog (Rana adspersa), common toad (Bufo regularis) and
domestic chicken (Gallus domestica) have also induced spawning in clariid catfishes in Nigeria, (Fagbenro et al., 1992; Nwadukwe, 1993; Inyang and Hettiarachchi, 1994; Salami et al., 1994),
the standardization of methods dosages and concentration of hormones are often inadequate. It is generally more efficient to induce ovulation in fishes with a pituitary gland extract or a
gonadotropin from a teleostean source because of the phylogenetic closeness between the donor
and the recipient.
Sexually-mature tilapias are available all-rear round and could be used as alternative
sources of piscine hypophyses for catfish breeding. Salami et al.(1997) investigated the effectiveness and dosage of acetone-dried pituitary extracts from tilapias (ADTPE) to induce
oocyte maturation, ovulation and spawning in C. gariepinus and H. bidorsalis. Results showed that oocyte maturation and ovulation were induced in female C. gariepinus and H. bidorsalis by
single intramuscular injection of 6-10 mg.kg-1 ADTPE with optimum results obtained with 8
mg.kg-1 acetone-dried tilapia pituitary extracts in both catfishes. At ambient temperature (27oC), ovulation occurred within 14-18 hours post-injection resulting in 16-20% increase in egg
diameter. Fertilization and hatching percentages increased with increasing hormone dosage. Salami et al.(1997) demonstrated that optimal egg and larval quality in C. gariepinus and H. bidorsalis could also be achieved by using the tilapine pituitary hormone extracts to induce
ovulation. The efficacy of ADTPE precludes the depletion of mature catfish (potential brooders) traditionally sacrificed for collection of hypophyses in fish hatcheries.
USE OF TILAPIA: CEREAL BLENDS IN HUMAN NUTRITION
Cereal grains – maize, rice, and sorghum are the staple food of people in the
tropics and provide about 75% of total calorie intake and 67% of total protein (Inhekoronye and
Ngoddy, 1985). Root and tuber crops (cassava, yams, cocoyams, sweet potatoes) rank next in importance in providing the major part of the daily energy needs of people in the tropics

343
(Inhekoronye and Ngoddy, 1985). Cereal grains as well as root and tuber crops therefore provide
the main dietary items for many people, resulting in food with low nutritional value as they are not adequate source of micro and macro nutrients (Brown, 1991). Efforts made to improve the
nutritional value of these staples especially cereals in the past were based on fortification with legumes to boost the deficient amino acids, (Bressani and Eliaz, 1983; Egounlety and Syarief,
1992; Salami, 1988). Deficient amino acids in cassava tuber are methionine, lysine, tryptophan,
phenylalanine and tyrosine while in cereals they are – lysine and tryptophan. Protein quality is therefore synergistically improved in cereal-legume blends because of the lysine contributed by
the legume and methionine contributed by the cereal (Bressani, 1993), but according to Okeiyi and Futrell (1983), the resulting improved diets are of variable organoleptic properties and poor
digestibility, these were attributed to the low solubility of plant protein.
Fasasi et al.(2005, 2006, 2007) however replaced the legume (plant protein) in cereal –
legume diet with the underutilized tilapias (animal protein), with the aim of reducing the post
harvest losses incurred especially in developing countries, and resultant production of highly digestible novel food which will enhance optimal utilization of these worldwide cultured species of
fish. Considering the potentials of ―Cereal-fish flour‖ mixes, investigations were made into the properties - physicochemical, and storage stability studies so as to establish the characteristics
which may affect its behaviour in food systems during processing and storage hence its
usefulness and acceptability for industrial and consumption purposes.
CONCLUSIONS
African aquaculture research and development are producing promising results, despite the economic difficulties under which much of these are undertaken. The future of tilapia farming
remains bright, despite the somewhat disappointing recent statistics. In Nigeria, wherever inland
aquaculture flourishes, tilapias are likely to be a major, if not the major farmed fish commodity. This can be true if research is better directed towards farmers‘ needs; if better breeds and
farming systems are developed together; if anti-tilapia attitudes are changed where they are ill-founded; and if tilapia farming becomes a more sustainable and environmentally compatible
enterprise, well-integrated with other development initiatives.
REFERENCES
Adebiyi, A., Adaikan, P.G. and Prasad, R.N. 2002. Papaya (Carica papaya) consumption is unsafe
in pregnancy: fact or fable? Scientific evaluation of a common belief in some parts of Asia using a rat model. British Journal of Nutrition 88(2): 199-203.
Adebiyi, A., Adaikan, P.G. and Prasad, R.N. 2003. Tocolytic and toxic activity of papaya seed
extract on isolated rat uterus. Life Sciences 74(5): 581-592.
Adesulu, E.A. 1997. Current status of tilapia in Nigerian aquaculture. Proceedings of the Fourth
International Symposium on Tilapia in Aquaculture, pp.577-583 (K. Fitzsimmons, ed.). Orlando, USA.
Adesulu, E.A. and Sydenham, D.H.J. 2007. The freshwater fishes and fisheries of
Nigeria.macmillan Nigeria Publishers Ltd., Ibadan. 397pp.
Afolabi, J.A., Imoudu, P.B. and Fagbenro, O.A. 2000. Peri-urban tilapia culture in homestead
concrete tanks: economic and technical viability in Nigeria. Proceedings of Fifth International Symposium on Tilapia in Aquaculture (ISTA V), pp.575-581. (K.
Fitzsimmons and J.C. Filho, eds.). Rio de Janeiro, Brazil.
Akande, G.R. 1989. Improved utilization of stunted Tilapia spp. Journal of Food Science and Technology 24: 567-571.
344
Akande, G.R. 1990. Stunted tilapias: new ideas on an old problem. Infofish International 6: 14-
16.
Aluko, J.F., Onilude, A.A. and Sanni, O.A. 2000. Microbiological evaluation of spontaneously
fermented tilapia fish. Journal of Fisheries Technology 2: 73-81.
Agbebi, F.O. and Fagbenro, O.A. 2006. Tilapia culture and risk management in Nigeria.
Proceedings of the Seventh International Symposium on Tilapia in Aquaculture (W.M.
Contreras-Sanchez and K. Fitzsimmons, eds.). Veracruz, Mexico.
Alfred, S.D.Y. and Fagbenro, O.A. 2006. Perception of tilapia farmers on information sources in
the coastal region of Ondo State, Nigeria. Proceedings of the Seventh International Symposium on Tilapia in Aquaculture (W.M. Contreras-Sanchez and K. Fitzsimmons,
eds.). Veracruz, Mexico.
Atanda, A.N. 2007. Freshwater fish seed resources in Nigeria. pp.361-380. In: Assessment of
freshwater fish seed resources for sustainable aquaculture (Bondad-Reantaso, M.G., ed.)
FAO Fisheries Technical Paper No. 501. FAO, Rome. 628pp.
Ayinla, O.A. 2007. Analysis of feeds and fertilizers for sustainable aquaculture development in
Nigeria. pp.453-470. In: Study and analysis of feeds and fertilizers for sustainable aquaculture development (Hasan, M.R., Hecht, T., De Silva, S.S. and Tacon, A.G.J., eds).
FAO Fisheries Technical Paper No. 497. FAO, Rome. 510 pp.
Ayinla, O.A. and Akande, G.R. 1988. Growth response of Clarias gariepinus (Burchell 1822) on silage-based diets. NIOMR Technical Paper No. 37. Nigerian Institute for Oceanography
and Marine Research, Lagos. 19pp.
Ayinla, O.A. and Nwadukwe, F.O. 1988. Effect of season on controlled propagation of the African
catfish Clarias gariepinus (Burchell 1822). Pp.198-210, in: G.M. Bernacsek and H. Powles (eds.), Aquaculture Systems Research in Africa. IDRC, Canada.
Brown, K.H. 1991: The importance of dietary quality versus quantity of weanlings in the
developed countries, a frame work of discussion. Food and Nutrition Bulletin 13: 86–93.
Bressani, R. 1993. Grain quality of beans. Food Rev. Int. 9(2): 237-297.
Bressani, R. And Eliaz, E. 1983. Guideline for the development of the processed and packaged weaning foods. Food and Nutrition Bulletin 5: 32-36.
Egounlety, M. and Syarief, R. 1992. Study on supplementation of Ogi with tempe. Nigerian Food Journal 10: 92-102.
Ekanem, S.B. and Okoronkwo, T.E. 2003. Pawpaw seed as fertility control agent on male Nile
tilapia. NAGA 26 (2): 8-10.
Ellah, G. 2011. Antispermatogenic activity of Morinda lucida leaf meal on male Nile tilapia,
Oreochromis niloticus. M.Tech. Thesis, Federal University of Technology, Akure.
El-Sayed, A-F. 2006. Tilapia Culture CABI Publications, Wallingford, UK. 275pp.
Eyo, A.A. 1996. Storage potential and utilization of tilapia mince. pp.135-143. In: A.A. Eyo (ed.).
Proceedings of the 13th Annual conference of the Fisheries Society of Nigeria (FISON), National Institute for Freshwater Fisheries Research Institute (NIFFRI), New Bussa.
Fagbenro, O.A. 1987. A review of biological and economical principles underlying commercial fish culture production in Nigeria. Journal of West African Fisheries 3: 171-177.
Fagbenro, O.A. 1994. Studies on the use of fermented fish silage in diets for juvenile tilapia
(Oreochromis niloticus) and catfish (Clarias gariepinus). Ph.D. Thesis, University of Stirling, Scotland. 200pp.
345
Fagbenro, O.A. 1998. Apparent digestibility of various legume seed meals in Nile tilapia diets.
Aquaculture International 6: 83-87.
Fagbenro, O.A. 2000. Assessment of African clariid catfishes for tilapia population control in
ponds. Proceedings of the Fifth International Symposium on Tilapia in Aquaculture, pp.241-246 (K. Fitzsimmons and J.C. Filho, eds.). Rio de Janeiro, Brazil.
Fagbenro, O.A. 2001. Feedstuff digestibility in culturable freshwater fish species in Nigeria.
Proceedings of the First National Symposium on Fish Nutrition and Fish Feed Technology in Nigeria, pp.26-37 (A.A. Eyo, ed.). Fisheries Society of Nigeria (FISON) and Nigerian
Institute for Oceanography and Marine Research (NIOMR), Lagos, Nigeria.
Fagbenro, O.A. 2002. Tilapia: fish for thought. 32nd Inaugural Lecture, Federal University of
Technology, Akure, Nigeria. 77pp
Fagbenro, O.A. 2004. Predator control of overpopulation in cultured tilapias and the alternative
uses for stunted tilapias in Nigeria. Proceedings of the Sixth International Symposium on
Tilapia in Aquaculture, pp.634-647. (R.B. Bolivar, G.C. Mair and K. Fitzsimmons, eds.). Manila, Philippines. September 12-16, 2004.
Fagbenro, O.A. and Adebayo, O.T. 2005. A review of the animal and aquafeed industries in Nigeria. In: A synthesis of the formulated animal and aquafeed industry in sub-Saharan
Africa, pp.25-36. (John Moel and Matthias Halwart, eds.). CIFA Occasional Paper No.26,
FAO, Rome. 61pp.
Fagbenro, O.A. and Akinbode, G.A. 1988. The use of Tilapia zillii (Gervais) as biological control of
aquatic microphytes in ponds. Nigerian Journal of Weed Science 1: 71-75.
Fagbenro, O.A., Akinbulumo, M.O. and Ojo, S.O. 2004. Aquaculture in Nigeria - past experience,
present situation and future outlook (history, status and prospects). World Aquaculture 35 (2): 23-26.
Fagbenro, O.A., Adeparusi, E.O. and Fapohunda, O.O. 2003. Feedstuffs and dietary substitution
for farmed fish in Nigeria. Proceedings of the National Workshop on Fish Feed Development and Feeding Practices in Aquaculture, pp.60-72. (A.A. Eyo, ed.). Fisheries
Society of Nigeria (FISON), and FAO-National Special Program on Food Security (NSPFS) and National Institute for Freshwater Fisheries Research (NIFFR). New Bussa, Nigeria.
September 15-19.
Fagbenro, O.A, Jegede, T. and Fasasi. O.S. 2010. Tilapia aquaculture in Nigeria. Applied Tropical Agriculture 15: 49-55.
Fagbenro, O.A., Salami, A.A. and Sydenham, D.H.J. 1992. Induced ovulation and spawning in the catfish, Clarias isheriensis (Clariidae) using pituitary extracts from non-piscine sources.
Journal of Applied Aquaculture 1(4): 15-20.
Fagbenro, O.A., Adedire, C.O., Owoseeni, E.A. and Ayotunde, E.O. 1993. Studies on the biology and aquacultural potential of feral catfish, Heterobranchus bidorsalis (Geoffroy Saint Hilaire
1809) (Clariidae). Tropical Zoology 6: 67-79.
Fagbenro, O.A., Nwanna, L.C., Adeparusi, E.O., Adebayo, O.T. and Fapohunda, O.O. 2005. An
overview of the animal feed industry and dietary substitution of feedstuffs for farmed fish in Nigeria. In: Crops: Growth, Quality and Biotechnology (current status and future
prospects) (Ramdane Dris, ed.). WFL Publisher, Helsinki, Finland. ISBN 952-91-8601-0,
3-1: pp.91-107.
Fapohunda, O.O. and Fagbenro, O.A. 2006. Biotechnical factors affecting tilapia culture systems
in the savanna region of Nigeria. Proceedings of the Seventh International Symposium on Tilapia in Aquaculture (W.M. Contreras-Sanchez and K. Fitzsimmons, eds.). Veracruz,
Mexico.
346
Fasasi, O.S., Adeyemi, I.A. and Fagbenro, O.A. 2005. Proximate composition and multi-enzyme
in-vitro protein digestibility of maize-tilapia flour blends. Journal of Food Technology 3 (3): 342-345.
Fasasi, O.S., Adeyemi, I.A. and Fagbenro, O.A. 2006. Physicochemical properties of maize-tilapia flour blends. Proceedings of the Seventh International Symposium on Tilapia in
Aquaculture (W.M. Contreras-Sanchez and K. Fitzsimmons, eds.). Veracruz, Mexico.
Fasasi, O.S., Adeyemi, I.A. and Fagbenro, O.A. 2007. Functional and pasting characteristics properties of fermented maize and Nile tilapia (Oreochromis niloticus) flour diet. Pakistan Journal of Nutrition 6 (4): 304-309.
Idodo-Umeh, G. 2003. Freshwater fishes of Nigeria (taxonomy, ecological notes, diet and
utilization). 1st edition. Ldodo-Umeh Publishers Ltd, Benin City. Nigeria. 238pp.
Ihekoronye, A.I. and Ngoddy, P.O. 1985. Integrated Food Science and Technology for the
Tropics. Macmillian Educational Press Limited. Lagos, Nigeria. pp. 226-336.
Inyang, N.M. and Hettiarachchi, M. 1994. Efficacy of human chorionic gonadotropin (HCG) and crude pituitary extract of fish and frog in oocyte maturation and ovulation in African
catfish Clarias gariepinus Burchell 1822 and Clarias anguillaris (L.) 1762. Aquaculture and Fisheries Management 25: 245-258.
Jegede, O.T. 2004. Replacement value of Cassia fistula seed meal for soybean meal in practical
diets of Nile tilapia (Oreochromis niloticus L.) fingerlings. M.Tech. Thesis, Federal University of Technology, Akure.
Jegede, T. 2009. Population control of farm-raised tilapias (Oreochromis niloticus and Tilapia zillii) using pawpaw seed and neem leaf meals as reproduction inhibitors. Ph.D. Thesis, Federal
University of Technology, Akure, Nigeria. 151pp.
Jegede T. 2010. Control of reproduction in Oreochromis niloticus (Linnaeus 1758) using Hibiscus rosa-sinensis (Linn.) leaf meal as reproduction inhibitor. Journal of Agricultural Science
2(4): 149-154.
Jegede, T. and Fagbenro, O.A. 2007. Tilapia husbandry vs. midwifery: use of antifertility plants.
Proceedings of the Third Annual Conference of the School of Agriculture and Agricultural Technology, pp.118-122. (G.E. Onibi, S.O. Agele, V.A.J. Adekunle and M.O. Olufayo,
eds.). Federal University of Technology, Akure. April 16-19, 2007.
Jegede, T., Ellah, G. and Fagbenro, O. 2010. If overpopulation is the problem in farm-raised tilapias, the use of antifertility plants may be the solution. Paper presented at the 25th
Annual Conference of the Fisheries Society of Nigeria, Lagos, Nigeria. Oct. 25-29, 2010.
Kusemiju, O., Noronha, C. and Okanlawon, A. 2002. The effect of crude extract of the bark of
Carica papaya on the seminiferous tubules of male Sprague-Dawley rats. Nigerian Postgraduate Medical Journal 9(4): 205-209.
Nwadukwe, F.O. 1993. Inducing oocyte maturation, ovulation and spawning in the African catfish
Heterobranchus longifilis Valenciennes (Pisces: Clariidae), using frog pituitary extracts. Aquaculture and Fisheries Management 24: 625-630.
Ochang, S.N. 2007. Use of palm oil, soybean oil or groundnut oil as substitute for fish oil in diets for Nile tilapia (Oreochromis niloticus) and African catfish (Clarias gariepinus). Ph.D.
Thesis, Federal University of Technology, Akure. 170pp.
Oderinde, O., Noronha, C., Oremosu, A., Kusemiju, T. and Okanlawon, O.A. 2002. Abortifacient properties of aqueous extract of Carica papaya (Linn) seeds on female Sprague-Dawley
rats. Nigerian Postgraduate Medical Journal 9(2): 95-98.
347
Okeiyi, L.C. and Futrell, M.F. 1983. Evaluation of protein quality of formulation of sorghum grain
flour and legume seeds. Nutrition Report International 28: 451-456.
Raji, A.A. 1998. A survey of aquacultural management practices in fish farms in Osun State. PGD
Thesis, Federal University of Technology, Akure, Nigeria. 100pp.
Raji, Y. and Bolarinwa, A.F. 1997. Antifertility activity of Quassia amara in male rats- in vivo study. Life Science 64: 1067-1074.
Raji, Y., Udoh, U.S., Mewoyeka, O.O., Ononye, F.C. and Bolarinwa, A.F. 2003. Implication of reproductive endocrine malfunction in male antifertility efficacy of Azadirachta indica
extracts in rats. African Journal of Medical Sciences 32: 159-65.
Salami, A.A., Fagbenro, O.A., Edibite, L. and Fagbemiro, S. 1994. Induced spawning of Clarias gariepinus using non-piscine pituitary extracts. Journal of the World Aquaculture Society 25: 166-168.
Salami, A.A., Bello-Olusoji, O.A., Fagbenro, O.A. and Akegbejo-Samsons, Y. 1997. Induced
breeding of two clariid catfishes, Clarias gariepinus and Heterobranchus bidorsalis using tilapia pituitary extracts. Journal of the World Aquaculture Society 28: 113-117.
Salami, I.L. 1988. An assessment of the nutritional value of corn-pinto bean, Ogi-pinto porridges as food. Journal of Arid Agriculture 1: 107-119.
Satia, B.P. 1990. National reviews for aquaculture development in Africa. 29. Nigeria. FAO
Fisheries Circular No.770.29. FAO, Rome. 193pp.
Shimang, G.N. 1992. Post-harvest losses in inland fisheries in Nigeria with emphasis on Lake
Chad and Lake Kainji. pp.78-83. In: F. Teutscher (ed.) Proceedings of Symposium on Post-harvest Fish Technology. Cairo, Egypt. 21-22 Oct. 1990. CIFA Technical Paper No. 19.
FAO, Rome. 117pp.
Uche-Nwachi, E.O., Ezeokoli, D.C., Adogwa, A.O. and Offiah, V.N. 2001. Effect of water extract of
Carica papaya seed on the germinal epithelium of the seminiferous tubules of Sprague
Dawley rats. Kaibogaku Zasshi 76(6): 517-521.
Udoh, P. and Kehinde, A. 1999. Studies on antifertility effects of pawpaw seeds (Carica papaya) on the gonads of male albino rats. Phytotherapeutic Research 13(3): 226-228.
Yinusa, R., Akinsomisoye, O.S. and Salman, T.M. 2005. Antispermatogenic activity of Morinda lucida extracts in male rats. Asian Journal of Andrology 7(4):405-410.

348
BEST AQUACULTURE PRACTICES STANDARDS FOR THE TILAPIA
INDUSTRY
Darryl JORY

349
A HANDS-ON TRAINING HELPED PROLIFERATION OF TILAPIA
CULTURE IN BANGLADESH
MD. ASADUL BAQUI1 AND RAM C.BHUJEL2
1Fisheries Training Institute, Chandpur, Department of Fisheries (DoF), Bangladesh
2Aquaculture and Aquatic Resources Management (AARM)
SERD, Asian Institute of Technology (AIT)
PO Box 4, Klong Luang, Pathumthani 12120, THAILAND
Abstract
Realizing the need to develop appropriate skills of extension worker, 2nd Fisheries Training
and Extension Project (FTEP-II) funded by Department of International Development (DFID), UK focused to develop the skills of DOF officials as trainers. The main goal of the project was to
demonstrate the direct benefits to the poor that could result in by improving the capacity of trainers and by supporting the application of this capacity in extension service delivery. Under
the project, a group of selected DOF officers (extension workers) were sent to the Asian Institute of Technology (AIT) based in Thailand for training on mono-sex hatchery management
and cage culture of tilapia in 2001.
Thinking to apply the knowledge and skills gained through 4-week hands-on training, one of them upon his return to workplace (Fish Breeding and Training Center, Raipur) collected
F6 generation of Genetically Improved Farmed Tilapia (GIFT) from Bangladesh Fisheries Research Institute (BFRI) which was originally from ICLARM, now World Fish Center. Applying
selective breeding high quality seeds of GIFT were produced and 3.7 million seeds were
distributed among the farmers during 2002. By motivating the private farmer and providing the technical support, a mono-sex tilapia hatchery and grow-out farm (Ambar Fisheries) was
established in Laxmipur district in 2002. In the same year, cage culture was promoted among private entrepreneurs. As a result, 40 cages (6mX3mX1.5m=27m3) were set in the Dakatia
River in Chandpur. Following the success, cage culture expanded to Laxmipur district in 2006
due to which demand for seed increased. Under the technical assistance of the same person, Pioneer Fisheries and hatcheries started its operation in Chandpur district in the same year.
After the success of these first few hatcheries which produced several millions of high quality sex-reversed tilapia fry, many others showed interest. At least four hatcheries came into
operation between 2006 and 2008 in mid-southern part of Bangladesh. After this, proliferation of mono-sex hatcheries and cage culture started in many parts of Bangladesh. About 3,500
cages are in operation now in Chandpur along the Dakatia River, 500 cages in Laxmipur along
the Meghna River. Culture involves stocking of 37-40 sex-reversed tilapia fry of 20-25 g size per m3. Fish grow around 400 g in 6-7 months giving around 15kg/m3 productivity when fed floating
feeds. Mortality remains <5% and FCR around 1.75. Altogether, these cages are producing at least 3,200 metric tons of tilapia annually. At least 600 people including 5% women are working
in the cages. Four feed producing companies are providing 6,000 MT of floating feed annually.
Probably, as a result of intensification and contamination from other countries, farmers as in other countries, are facing disease problem which is threatening the tilapia industry. A solution
has to be explored.
350
INTRODUCTION
Background
Bangladesh has the sub-tropical monsoon climate with temperature range ranging from 11 to 340C. Bangladesh is composed of mainly the great combined delta and flood plains criss-
crossed by numerous rivers and their tributaries. There are over 250 large rivers in the country. The three major rivers, the Padma, the Brahmaputra and the Meghna, drain a catchment
extending over Bhutan, Nepal, India, Bangladesh and China. The total area of these river basins
is about 1.5 million sq km of which 8% is in Bangladesh. Bangladesh alone has about 4 million hectares of inland open water area and 0.3 million hectares of inland closed waterbed
(Banglapedia, 2003). The inland closed water bodies especially the ponds and shrimp-farms are almost on peak of utilization and losing their production potentials day-by-day. But most of the
inland open water bodies including extensive floodplains are still left for capturing the natural stocks and un-utilized. Increasing pressure of population over the natural resources, siltation, and
water pollution by industries and agriculture are causing decline in the natural fish stock critically
while the demand is increasing rapidly. Wise use of the potential vast flowing water by promoting culture fish in cages could assist in fulfilling the demand of national protein intake as in other
Asian countries. After the liberation of the country a number of NGOs (e.g. CARE-Bangladesh and others) along with the relevant government department tried for decades but unfortunately due
to some factors the technology didn‘t sustain in the country. However, Department of fisheries
(DoF) collaborating with other governments and NGOs continue to promote cage culture. A remarkable breakthrough was achieved when some DoF field level officials had the opportunity to
receive training from the Asian Institute of Technology (AIT) based near Bangkok, where the technology mono-sex seed production was developed. One of the authors of this paper serving
for the DoF being based in Fisheries Training Institute was able to translate the knowledge and
skill gained from the high quality training into practice in Bangladesh. Cage culture in rivers has been introduced in Bangladesh successfully to support poor communities residing in two districts;
Chandpur and Laxmipur. Six large-scale mono-sex hatcheries have been established so far working with the private sector. The technology has been disseminated to other parts of the
country. Gradually, a number of organizations along with the government and various social sects have also been involved. This has efforts has been a model as it brought in a huge direct and
indirect benefits to the communities in a number of ways, such as, by producing high quality
protein near the doors, creating employment opportunity, increasing family income and supporting economic activities through linkages with private sector. This paper highlights the
approaches used hoping that it could be a model for others in Bangladesh as well as rest of the world.
Tilapia – species of choice
Tilapia, especially Nile tilapia (Oreochromis niloticus), better known as aquatic-chicken, has become the second most important fish species in world aquaculture after carps overtaking
salmonids. Although native to Africa tilapia have been introduced around the globe and its farming is growing rapidly especially in Asia including Bangladesh because of their fast growth,
ease of breeding and accept a wide range of feeds including planktons from natural sources, high disease-resistance and tolerance to poor water quality and low dissolved oxygen levels. Tilapia is
gaining popularity in the west as well because of its white muscle with mild flavor with no intra-
muscular bones. Tilapias are a good source of protein and a popular target for artisanal and commercial fisheries in Bangladesh. Although tilapia is alien species, it is considered almost like a
native species in Asia. It is raised in inland ponds, lakes, reservoir, and artificial tanks and even in lowland agricultural fields. Developing the GIFT variety by ICLARM (now WorldFish Center) and
development of Sex Reversed Tilapia (SRT) seed production technology by the Asian Institute of
Technology (AIT) has added new dimension in tilapia aquaculture. Farmers have been well-acquainted with tilapia culture. Mozambique Tilapia (Oreochromis mossambicus) was first
introduced to Bangladesh in 1954 but due to the black color, excessive breeding nature, and low
351
productivity character of the fish it could not be well accepted by the farmers. In 1974, UNICEF
arranged the introduction of Chitralada strain of Nile tilapia from Thailand (Hossain, 2005) which proved to be far better and farmers started its farming. Further introduction was in 1994 by the
WorldFish Center. Tilapia farming gained importance in Bangladesh during last ten years only.
Cage culture
Cage culture has been successfully practiced most Asian countries adopting which China,
Vietnam, Thailand, Taiwan and Malaysia have increased their national fish production by several folds and leading the international tilapia market and producing better sized tilapia whole frozen
and fillet (Am. Tilapia Assoc., 2010). As Bangladesh has high population density and regularly
loosing agricultural lands for urbanization, closed water bodies to produce fish are limited; and production has reached to high enough of its capacity. Now is the time to introduce cages in
flowing river-water to increase the fish production promptly. Vast open water-bodies are still unused. Following the other countries of Asia, cage culture here may be the appropriate tool for
additional fish production. Although for the last three decades Asia is leading in cage culture
whereas Bangladesh was and still is far behind despite having huge water resource. Various attempts were made in promoting cage culture as summarized in Table 1.
Although cage culture has a history, due to various reasons, cage culture in Bangladesh did not take off as in other Asian countries. Almost all the efforts, even well-established CARE-
Cages, encountered sustainability problem due to the following reasons:
1. Lack of quality net
2. Lack of suitable floating feed
3. Poor selection of fish species suitable for cage farming
4. Lack of required technical know-how
5. Absence of skilled manpower to operate the cages
6. Lack of concerted efforts and
7. Socio-economic problems (e.g. poaching, conflicts etc.)

352
Table 1: History of cage culture in Bangladesh
Duration Activities Remarks
1977 Commercial cage culture was included in the National
Development Program.
Target was to promote fish production
utilizing the vast open water.
1978 Department of Fisheries and Bangladesh Agricultural
University introduced cage culture mainly for research
of the post-graduate students of Fisheries Faculty.
These experimental cages were mainly
as a part of post graduate student‘s
course-curriculum.
1980 Bangladesh Fisheries Development Corporation and
Bangladesh Krishi Bank jointly started cage project in
Kaptai Lake.
Poor management and lack of technical
know-how resulted ending of project.
1986-87 Department of Fisheries introduced cage culture of
Indian major carps in Kaptai lake.
Hand-made feed could not bring any
good result.
1981-84 Department of Fisheries derived experimental cage
culture in different places of the country; the
remarkable one was the cages in Dhandmondi lake in
Dhaka town.
Survival rate was good but production of
O. niloticus was not up to the
satisfactory level.
1983-84 In the same Dhanmondi lake cage culture of Rohu
Catla, Mirgal, Bighead, Silver and Nile tilapia was
trialed. Survival rate was high and production rate
was poor.
The survival rate was high.
1987-1991 BFRI tried experimental cage culture in Kaptai Lake. Hand-made feed was used, no good
result was obtained.
1992 CARE-Bangladesh and North-west Fishery Extension
project introduced cage culture in Kakrul beel
(floodplain) in Rangpur.
Leasing complexity of the beel caused
stopping of the activities.
1993-95 North-west Fishery Extension project run cage culture
with women groups in many places of Chirirbondor
and Parbotipur.
Cutting off the nets by crabs finally
became a threat.
1995 CARE-Bangladesh undertook the project ―Cage
Aquaculture for Greater Economic Security‖ (CAGES)
for experimenting in Meghna-Gomti river.
The technology couldn‘t be proved
economically sound and therefore, was
not disseminated.
1996 North-west Fishery Extension project along with RDRS
started cage culture at Dimla and Aditmari.
Tilapia was found to be the best species
for cage culture followed by Pangsias.
Source: DoF, Bangladesh
NEW APPROACHES OF TECHNOLOGY TRANSFER This section describes the approaches of technology transfer activities step-wise. High Quality Training
Funded by the Department of International Development (DFID), UK, Fisheries Training and Extension Project (FTEP-II) realized the need to develop appropriate skills of extension
353
workers of DOF officials as trainers. The ultimate goal of the project was to demonstrate the
direct benefits to the poor that could result in by improving the capacity of trainers and by supporting the application of this capacity in extension service delivery. Under the project, a
group of 18-members DOF officers (extension workers) were selected for training at the Asian Institute of Technology (AIT) based in Thailand on mono-sex hatchery management and cage
culture of tilapia in July 2001. The 4-week long training program that combined with theoretical
knowledge with practical hands-on session in field work and exposure visits to operating farms provided adequate information and skill to promote the tilapia culture upon return.
Initiation at Office
Immediately upon return after receiving the training, broodstock of GIFT F6 generation
from Cox‘s Bazaar Marine Station one of the BFRI‘s stations were obtained and reared at government Fish Hatchery and Training Center (FH&TC), Raipur. As FH&TC was supplying high
quality seeds of carps to the fish farmers of mid-to-southern part of the country, there was a
good opportunity to provide information and motivate them supplying them some GIFT seeds for their trial. Within short period of time farmers of the region showed interests in GIFT due to its
good performance. Within a year in 2002, about 3.7 millions of GIFT fry were produced and supplied to the fish-farmers which were produced through selective breeding and feeding with
simply wheat bran twice a day. In addition to supplying high quality fry, FH&TC provided
technical supports to the farmers including field visits.
Public-Private Partnership I: Ambar Hatchery
Farmers gradually realized the need of SRT hatchery in their area. Fortunately during the farm visit at Laxmipur district, 15 km away from the station, a private entrepreneur was about to
start a fish farm who was in need of technical support to expand the farm. Providing technical supports, a small unit of SRT hatchery was requested to add expanding its area to 40 acres in
mid of 2002. The hatchery unit started producing SRT seed commercially from 2003. The brood
stock was developed from the GIFT stock from Fish Hatchery and Training Center, Raipur. Annual this hatchery is supplying about 50 millions tilapia. After knowing it, five small farm owners
showed their interests in starting tilapia culture. With required technical assistance these farms also started culture of mono-sex tilapia since 2004. Gradually the mono-sex tilapia started getting
popularity replacing mixed-sex tilapia farming.
Introduction of Cage Culture in Dakatia River, Chandpur
During the establishment of Ambar Fisheries and Hatchery, a net factory at Comilla, 60
km away from the hatchery, was communicated about the demand / need of a large amount of netting materials required to prepare hapas. It was also revealed that the Managing Director
visited Thailand several times for the raw materials of net-production and who was also
encouraged to initiate cage culture. As a result, interest in producing the cage-nets was started. After getting technical specification, nylon nets suitable for cage culture started. Initial trials with
some 40 cages in Dakatia River in September 2002 were funded by the net factory itself. For the trial, initially Indian major carps were used with feeding of hand-made feeds using feeding trays
but without a success. Failure was due to jumping nature of the carps against the water current, low growth and occurrence of diseases. Even then the trial continued with shrimps and Thai
Sarputi (Barbodes gonionotus), but still with no good result. Finally, mono-sex tilapia fry were
selected which was the turning point for the success of tilapia cage culture. The fish got marketable size in six months. After a year of success operation people of surrounding areas
were suggested to apply the same technique.
354
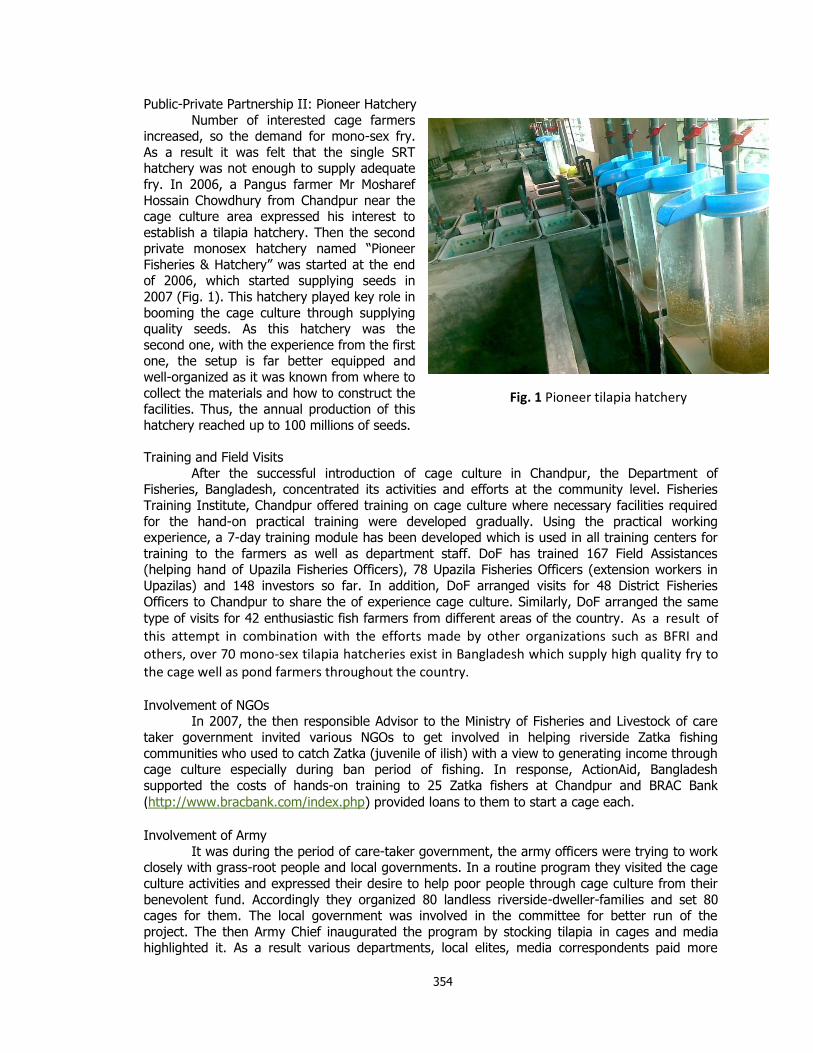
Fig. 1 Pioneer tilapia hatchery
Public-Private Partnership II: Pioneer Hatchery
Number of interested cage farmers increased, so the demand for mono-sex fry.
As a result it was felt that the single SRT hatchery was not enough to supply adequate
fry. In 2006, a Pangus farmer Mr Mosharef
Hossain Chowdhury from Chandpur near the cage culture area expressed his interest to
establish a tilapia hatchery. Then the second private monosex hatchery named ―Pioneer
Fisheries & Hatchery‖ was started at the end of 2006, which started supplying seeds in
2007 (Fig. 1). This hatchery played key role in
booming the cage culture through supplying quality seeds. As this hatchery was the
second one, with the experience from the first one, the setup is far better equipped and
well-organized as it was known from where to
collect the materials and how to construct the facilities. Thus, the annual production of this
hatchery reached up to 100 millions of seeds.
Training and Field Visits
After the successful introduction of cage culture in Chandpur, the Department of Fisheries, Bangladesh, concentrated its activities and efforts at the community level. Fisheries
Training Institute, Chandpur offered training on cage culture where necessary facilities required
for the hand-on practical training were developed gradually. Using the practical working experience, a 7-day training module has been developed which is used in all training centers for
training to the farmers as well as department staff. DoF has trained 167 Field Assistances (helping hand of Upazila Fisheries Officers), 78 Upazila Fisheries Officers (extension workers in
Upazilas) and 148 investors so far. In addition, DoF arranged visits for 48 District Fisheries
Officers to Chandpur to share the of experience cage culture. Similarly, DoF arranged the same
type of visits for 42 enthusiastic fish farmers from different areas of the country. As a result of this attempt in combination with the efforts made by other organizations such as BFRI and others, over 70 mono-sex tilapia hatcheries exist in Bangladesh which supply high quality fry to the cage well as pond farmers throughout the country.
Involvement of NGOs In 2007, the then responsible Advisor to the Ministry of Fisheries and Livestock of care
taker government invited various NGOs to get involved in helping riverside Zatka fishing
communities who used to catch Zatka (juvenile of ilish) with a view to generating income through cage culture especially during ban period of fishing. In response, ActionAid, Bangladesh
supported the costs of hands-on training to 25 Zatka fishers at Chandpur and BRAC Bank (http://www.bracbank.com/index.php) provided loans to them to start a cage each.
Involvement of Army
It was during the period of care-taker government, the army officers were trying to work closely with grass-root people and local governments. In a routine program they visited the cage
culture activities and expressed their desire to help poor people through cage culture from their
benevolent fund. Accordingly they organized 80 landless riverside-dweller-families and set 80 cages for them. The local government was involved in the committee for better run of the
project. The then Army Chief inaugurated the program by stocking tilapia in cages and media highlighted it. As a result various departments, local elites, media correspondents paid more
355
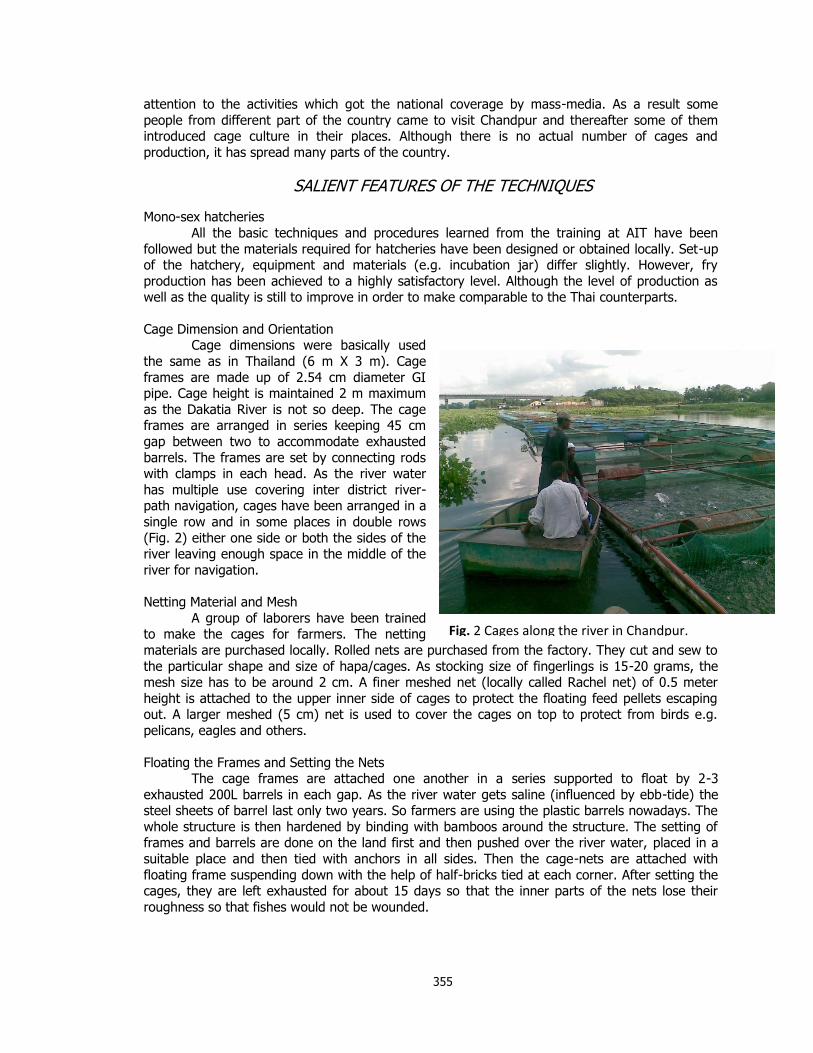
Fig. 2 Cages along the river in Chandpur.
attention to the activities which got the national coverage by mass-media. As a result some
people from different part of the country came to visit Chandpur and thereafter some of them introduced cage culture in their places. Although there is no actual number of cages and
production, it has spread many parts of the country.
SALIENT FEATURES OF THE TECHNIQUES
Mono-sex hatcheries
All the basic techniques and procedures learned from the training at AIT have been
followed but the materials required for hatcheries have been designed or obtained locally. Set-up of the hatchery, equipment and materials (e.g. incubation jar) differ slightly. However, fry
production has been achieved to a highly satisfactory level. Although the level of production as well as the quality is still to improve in order to make comparable to the Thai counterparts.
Cage Dimension and Orientation Cage dimensions were basically used
the same as in Thailand (6 m X 3 m). Cage
frames are made up of 2.54 cm diameter GI pipe. Cage height is maintained 2 m maximum
as the Dakatia River is not so deep. The cage frames are arranged in series keeping 45 cm
gap between two to accommodate exhausted
barrels. The frames are set by connecting rods with clamps in each head. As the river water
has multiple use covering inter district river-path navigation, cages have been arranged in a
single row and in some places in double rows
(Fig. 2) either one side or both the sides of the river leaving enough space in the middle of the
river for navigation.
Netting Material and Mesh
A group of laborers have been trained to make the cages for farmers. The netting
materials are purchased locally. Rolled nets are purchased from the factory. They cut and sew to
the particular shape and size of hapa/cages. As stocking size of fingerlings is 15-20 grams, the mesh size has to be around 2 cm. A finer meshed net (locally called Rachel net) of 0.5 meter
height is attached to the upper inner side of cages to protect the floating feed pellets escaping out. A larger meshed (5 cm) net is used to cover the cages on top to protect from birds e.g.
pelicans, eagles and others.
Floating the Frames and Setting the Nets The cage frames are attached one another in a series supported to float by 2-3
exhausted 200L barrels in each gap. As the river water gets saline (influenced by ebb-tide) the steel sheets of barrel last only two years. So farmers are using the plastic barrels nowadays. The
whole structure is then hardened by binding with bamboos around the structure. The setting of frames and barrels are done on the land first and then pushed over the river water, placed in a
suitable place and then tied with anchors in all sides. Then the cage-nets are attached with
floating frame suspending down with the help of half-bricks tied at each corner. After setting the cages, they are left exhausted for about 15 days so that the inner parts of the nets lose their
roughness so that fishes would not be wounded.
356
Stocking Size and Stocking Density
Farmers stock larger fingerlings e.g. 20 g although there is higher mortality compared to smaller ones during transportation from hatcheries/nursery ponds. Stock of 1,000-1,100 mono-
sex tilapia fingerlings per cage of 27m3 (6m X 3m X 1.5m) i.e. 37-40 per m3 is applied. Increasing the density beyond this increases the mortality.
Feeding Rate, Frequency and FCR
Floating feed was first introduced by RUPSHEE fish feed in Bangladesh only in 2006. Before 2006 feeding in cages was difficult job as it was not clear how the sinking feeds were
used by the fish. Production of floating feeds assisted farmers a lot as farmers can observe and control feeding. Feeding is done twice daily to satiation level spreading over the water surface in
each cage. During feeding the cages are not disturbed by any other activities. A number of companies are supplying floating feeds; the quality of them is more or less similar. Good feeding
management in cages ensures the FCR remain less than 1.75, whereas, inexperienced new
farmers use more feeds unnecessarily.
Sorting and Grading
Depending on the feed quality, variation in fish size becomes obvious. Fishes are graded and kept in different cages. Better the quality of feed and shorter will be the seed sorting
interval. Normally, sorting is done once a month that means during the culture cycle of 6-7
months it requires 5-6 sortings. Fish are sold when they get larger than 400 gm. If smaller fish are kept further to grow. Sorting is done from late morning to noon.
Marketing Pattern Unlike pond cultured fish, marketing of caged fish is very easy. Retailers come to the
cage sites at a pre-set time, and collect on desired amount of fishes. The cage operators usually sort out the marketable sized fishes a day before selling date. Feeding is stopped 6 hours before
harvest. Usually fish sellers collect two times from the cages, in the morning and in the afternoon
and sell them in different markets even in neighboring village markets. In addition, some sellers collect live caged-fishes early in the morning and ferry them to the urban housing areas to sell
live fishes.
RESULTS AND IMPACTS
Extension Trends of the Technology
Until the end of 2005, nobody paid attention to the activities in Chandpur. Farmers
started showing interest only when it was demonstrated from trials with farmers and proved to be economically profitable at the household level. Once proved, number of families interested
increased gradually and so the number of cages (Fig. 3). Various social sects such as, other businessmen, unemployed youth groups, primary school teacher, started involving in the venture.
Thus at the end of 2006, a total 276 cages were functioning in Dakatia river and in 2007 the
number increased to 578. Especially, after the involvement of Bangladesh Army, mass media highlighted and many more people came to learn about the activities and many people started
getting involved indiscriminately and remarkable competition was observed for placing the cages in the rivers. At the end of 2008 the number raised to 1,580 and in following two years (2009
and 2010) the figure raised to 2,375 and 3,241 respectively and at the moment there are 3,510 cages in the river Dakatia alone in Chandpur.
It was also possible later in October 2006 to transfer the cage culture technology to
nearby district i.e. Laxmipur only after having success in the district where training center was located. A total of 78 cages were introduced first in a canal of Meghna river near Barishal-
Laxmipur steamer Ghat. In the following year the number increased to 273 and then in 2008 it reached to 550 covering 2 km canal leaving only one side for navigation. However, during the
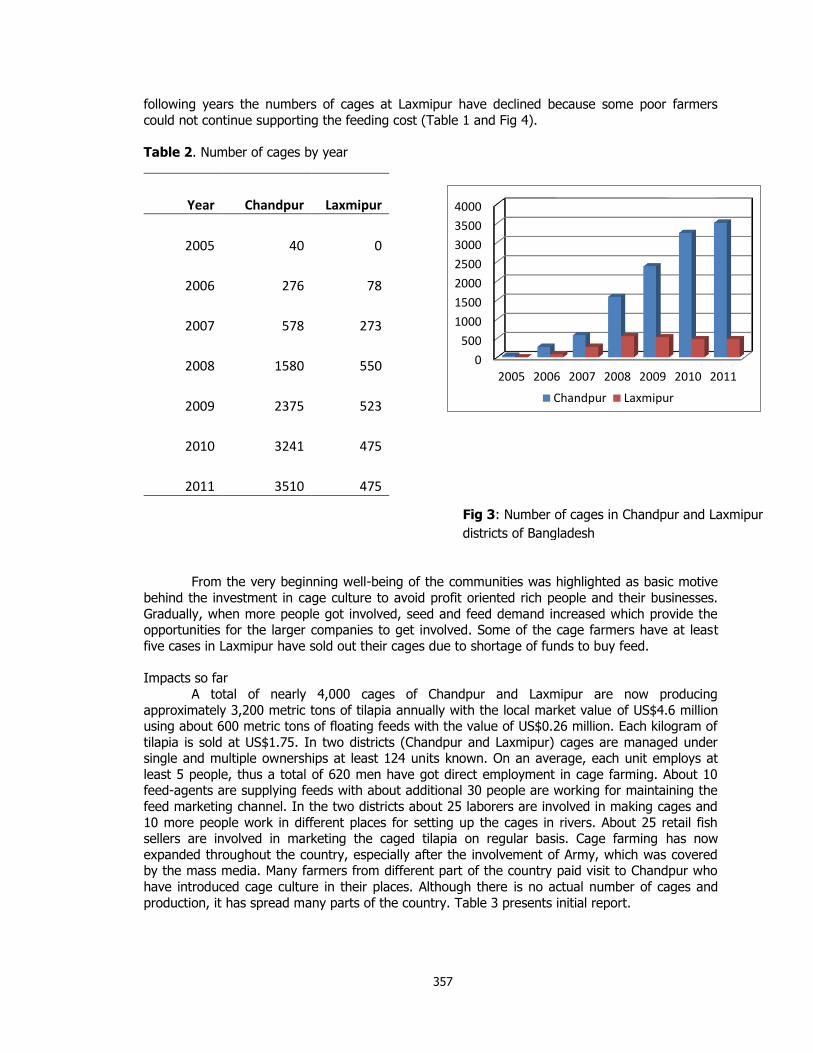
357
following years the numbers of cages at Laxmipur have declined because some poor farmers
could not continue supporting the feeding cost (Table 1 and Fig 4).
Table 2. Number of cages by year
Year Chandpur Laxmipur
2005 40 0
2006 276 78
2007 578 273
2008 1580 550
2009 2375 523
2010 3241 475
2011 3510 475
From the very beginning well-being of the communities was highlighted as basic motive
behind the investment in cage culture to avoid profit oriented rich people and their businesses.
Gradually, when more people got involved, seed and feed demand increased which provide the opportunities for the larger companies to get involved. Some of the cage farmers have at least
five cases in Laxmipur have sold out their cages due to shortage of funds to buy feed.
Impacts so far
A total of nearly 4,000 cages of Chandpur and Laxmipur are now producing
approximately 3,200 metric tons of tilapia annually with the local market value of US$4.6 million using about 600 metric tons of floating feeds with the value of US$0.26 million. Each kilogram of
tilapia is sold at US$1.75. In two districts (Chandpur and Laxmipur) cages are managed under single and multiple ownerships at least 124 units known. On an average, each unit employs at
least 5 people, thus a total of 620 men have got direct employment in cage farming. About 10 feed-agents are supplying feeds with about additional 30 people are working for maintaining the
feed marketing channel. In the two districts about 25 laborers are involved in making cages and
10 more people work in different places for setting up the cages in rivers. About 25 retail fish sellers are involved in marketing the caged tilapia on regular basis. Cage farming has now
expanded throughout the country, especially after the involvement of Army, which was covered by the mass media. Many farmers from different part of the country paid visit to Chandpur who
have introduced cage culture in their places. Although there is no actual number of cages and
production, it has spread many parts of the country. Table 3 presents initial report.
0
500
1000
1500
2000
2500
3000
3500
4000
2005 2006 2007 2008 2009 2010 2011
Chandpur Laxmipur
Fig 3: Number of cages in Chandpur and Laxmipur
districts of Bangladesh
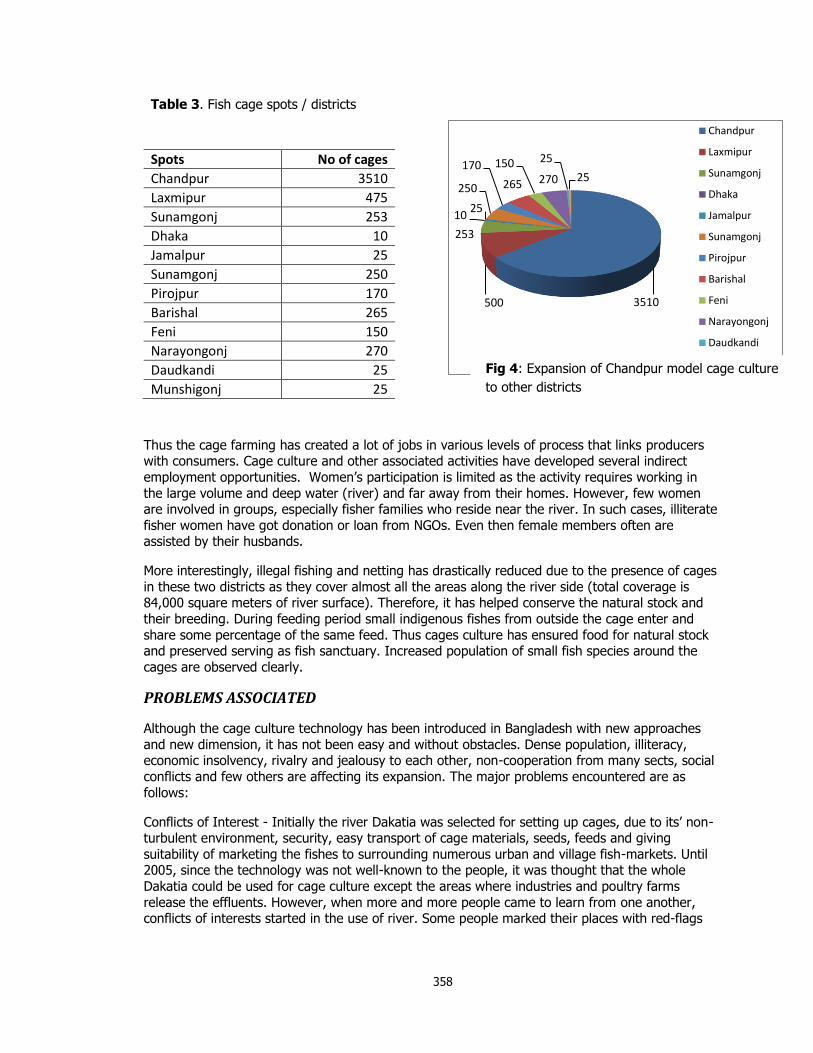
358
Table 3. Fish cage spots / districts
Spots No of cages
Chandpur 3510
Laxmipur 475
Sunamgonj 253
Dhaka 10
Jamalpur 25
Sunamgonj 250
Pirojpur 170
Barishal 265
Feni 150
Narayongonj 270
Daudkandi 25
Munshigonj 25
Thus the cage farming has created a lot of jobs in various levels of process that links producers with consumers. Cage culture and other associated activities have developed several indirect
employment opportunities. Women‘s participation is limited as the activity requires working in
the large volume and deep water (river) and far away from their homes. However, few women are involved in groups, especially fisher families who reside near the river. In such cases, illiterate
fisher women have got donation or loan from NGOs. Even then female members often are assisted by their husbands.
More interestingly, illegal fishing and netting has drastically reduced due to the presence of cages
in these two districts as they cover almost all the areas along the river side (total coverage is 84,000 square meters of river surface). Therefore, it has helped conserve the natural stock and
their breeding. During feeding period small indigenous fishes from outside the cage enter and
share some percentage of the same feed. Thus cages culture has ensured food for natural stock and preserved serving as fish sanctuary. Increased population of small fish species around the
cages are observed clearly.
PROBLEMS ASSOCIATED
Although the cage culture technology has been introduced in Bangladesh with new approaches
and new dimension, it has not been easy and without obstacles. Dense population, illiteracy, economic insolvency, rivalry and jealousy to each other, non-cooperation from many sects, social
conflicts and few others are affecting its expansion. The major problems encountered are as
follows:
Conflicts of Interest - Initially the river Dakatia was selected for setting up cages, due to its‘ non-turbulent environment, security, easy transport of cage materials, seeds, feeds and giving
suitability of marketing the fishes to surrounding numerous urban and village fish-markets. Until 2005, since the technology was not well-known to the people, it was thought that the whole
Dakatia could be used for cage culture except the areas where industries and poultry farms
release the effluents. However, when more and more people came to learn from one another, conflicts of interests started in the use of river. Some people marked their places with red-flags
3510 500
253
10 25
250
170
265
150
270
25
25
Chandpur
Laxmipur
Sunamgonj
Dhaka
Jamalpur
Sunamgonj
Pirojpur
Barishal
Feni
Narayongonj
Daudkandi
MunshigonjFig 4: Expansion of Chandpur model cage culture
to other districts
359
until they installed the cages; turning some cases into cruel conflicts. Concerned authorities and
sects had to compromise with the riverside dwellers to solve the crisis.
Cages Damaged by Ships - The same rivers are used for inter district navigation. A good number of steamers run from Dhaka to Chandpur daily. All these steamers crossing the main stream of
Meghna reach Chandpur. On their arrival they settle down in the secure inner ghats which are about 5-7 km inside from the Dakatia, where numerous cages have been installed on both the
sides. The steamers especially in the foggy winter night sometimes run over the cages unknowingly. Thus another type of conflicts aroused between cage-owners and steamer-drivers.
The strong association of steamer owners did not pay attention to the crying of cage operators.
As a measure, the cage operators have installed security lights with series of bamboo poles over the cage structures. At the same time, the steamer drivers have been requested to drive their
vehicles cautiously particularly around the cage culture area.
Lack of Legal Right - According to the public rule of the Bangladesh each citizen has an equal right over the river on condition that he/she doesn‘t disturb others. However, nobody can set any
permanent structure on the river. Sites have been selected with due consideration of these rules. Cages have been installed leaving ghats which are used by villagers for bath and collecting water
for house-hold use and leaving navigation route free. Even then when the cages are great in
serving people by producing rich protein, creating employment opportunities, farmers still can‘t have legal right over the places in river. Considering this as a critical problem, cage farmers
formally submit request to the District Collector (DC) and they have been allowed in condition that the cage structures are only temporary and would not disturb any navigation route.
Disease Problem - Since 2008, in the cages at Chandpur and Lamxipur are facing the most acute
problem with disease. Like other countries in Asia, the pond tilapia aquaculture is also suffering from diseases. Last year about 30% of the cages fishes died due to disease. A particular size of
fishes was affected by the diseases. Teachers and Fish disease scientists from Bangladesh
Agricultural University and BFRI visited the cages during the crisis. According to them it was due to the bacterial disease caused by Streptococcus sp. However, no specific diagnosis was possible.
In addition to the disease, it might have been due to the combination of factors involving water quality. Some solution is still to be explored to help the farmers.
RECOMMENDATIONS AND CONCLUSIONS
Unlike some of the other Asian countries, cage culture in Bangladesh is still in its infancy. There
are still a lot to do to reach the level that cage farming would play an important role of food security to the poor people as well as earn foreign currency by export. Based on the experience
of direct involvement, the followings are recommended:
Government should formulate appropriate policies and regulations for the cage farming and
provide legal right over the places charging annual fees per cage or unit area. If necessary, quota system can be established for a given area/village selected based on the suitability.
Keeping in mind that tilapia can be a good source of foreign earnings as other Asian countries,
technical expertise should be developed within relevant departments so that whole production process can be monitored and certified. For example, environmental condition, seed quality,
stocking density, feeds and feeding practices, post harvest handling, processing and so on.
There are about 145 shrimp export companies in Bangladesh, 63 of which are approved by EU. These have the capacity of exporting 265,000 MT fish and shrimps. But these factories are
getting only 50,000 MT for export which means only 18-20% of their capacity has been used so far. They do not have anything to export especially during October to late February. As tilapia is
produced throughout the year, exporting tilapia fillets would be one of the best options.
Therefore, production of export quality tilapia in cages in huge volume would need concerted
360
efforts including developing national policies and promotion. In order to create export market
some sorts of certification schemes for export grade tilapia production, would be necessary e.g. good aquaculture practices (GAP) and HACAP.
Since the mono-sex tilapia hatcheries are the base of tilapia industry, they should be well-
equipped with technology and quality brood stocks. Some hatcheries are dealing with the broods from authentic sources through BFRI, but majority are using broods either from unknown origin
or from residual seeds of some farms which are genetically inferior. International organizations, such as AIT and GIFT Foundation, should have direct involvement for periodical refreshment of
the brood stocks and monitoring and certification of seed produced local hatcheries.
Floating feeds are mostly produced in the country, partially from Thailand as well, and production
of quality tilapia greatly depends on feed quality. A lot of farmers are complaining about the quality of feed produced in Bangladesh. Government should monitor the production process and
the quality including the levels of nutrients as mentioned in the feed-bags.
A number of issues emerged among the cage owners which were not possible to solve on individual basis. Some issues such as, moving workers from one cage-owner to another, fish
poaching, conflicts with ship-owners, lack of legal right over position on river-site, became too burning ones to stop the tread. Considering all the issues the cage owners arranged a meeting
on 14th August 2010 and formed an association named ―Bangladesh Cage-Owners Association‖
and its legal registration procedure is ongoing. They have setup an association office at Chandpur, from where they do the formal communications to relevant parties and organizations
in any crisis.
In conclusion, cage culture has started a new era for aquaculture history in Bangladesh. Farmers are dreaming of big success in the venture. Cage farming needs expansion throughout the
country. A good training to enthusiastic staff and practical exercise to develop and test new model of technology at the center where they are based play a critical role. Once a successful
model is demonstrated, farmers and other stakeholders get interested in to apply and also
support. Transfer to technology is more efficient through public-private partnership. As a result of this venture, cage culture of tilapia has been expanded in Bangladesh producing quite a large
volume. However, production is consumed within the country. Bangladesh may start exporting tilapia, if production further increases and if the marketing infrastructure is developed that
emphasize certification of quality, processing, and storage, and exploring the market. World is looking for quality farmed fish to feed the people. Tilapia has been considered the best candidate
species. When the fish is started to export, it will further boost tilapia farming in Bangladesh.
Similar to Prawn / shrimp, tilapia could play greater role towards reducing poverty through generating more income to the farmers, increasing employment and supplying animal nutrition.
Every relevant and interested sect, government or non-government organization needs to join in hands to make it a success.
REFERENCES
American Tilapia Association, 2010. American Tilapia Association web site.
Banglapedia, 2003. National Encyclopedia of Bangladesh. Vol 4, Asiatic Society of Bangladesh. Dhaka.
March, 2003.
Beverage, M.C.M. 1987. Cage Culture, Fishing News Book, 351p.
Department of Fisheries (DoF), Bangladesh A training Manual on Cage Culture, Dakatia model
Hossain, M.G. 2005. Aquaculture of tilapia in Bangladesh, 125p.
Infofish. 2007. Infofish magazine at www.infofish.org.
361
STATUS AND SUSTAINABILITY ANALYSIS OF THE TILAPIA
AQUACULTURE IN CHINA
Liu Liping*1, Zhang Wenbo1, Francis Murrary2, David Little2
1College of Fisheries and Life Science, Shanghai Ocean University, Shanghai 201306, China
2Institute of Aquaculture, University of Stirling, Stirling, FK9 4LA, Scotland, UK
E-mail: [email protected]
Abstract
Global consumption of seafood and associated trade volumes have risen dramatically over the
last decade due to rising population, growing affluence and changing eating habits. Today more
than half of all seafood is internationally traded with net transfers from developing to developed
countries.
Tilapia is a worldwide fish of great commercial importance. In China, tilapia is an important
species with annual production of more than 1.2 million tons, which accounted for about 45% of
the total tilapia production in the world in 2008. Guangdong, Hainan and Guangxi provinces
ranked top three in annual production in China. However, with over two decades of rapid growth,
tilapia aquaculture in China has been facing many challenges in the past years.
To investigate the sustainability problems, a large scale survey was carried out through
integrated top–down and bottom–up approaches. Secondary statistic data were collected at
national and district level, and farm data were collected by field visit. Participation and
perspectives from different local stakeholders along the value chain were emphasized to
contextualize and understand sustainability constraints. Through these activities, we summarized
that the sustaining development of the tilapia industry depends on the market price of products,
disease control, water quality, climate, seed supply and seed quality.
362
Tilapia; The Search for a Sustainable Model to Balance Between
Environment, People and Economy.
Yedod Snir and Israel Snir
Neve Eitan Fish Farm, Israel 38885, Inversiones miel - Honduras
During the past decade, World Tilapia production has experienced impressive and continues growth mainly in Asia and mostly by China. Same years and in parallel, very meaningful
production scenarios and projects developed away from the Far East, closer to the main export
market in the USA, with significant impacts on the industry - beyond the numbers and statistics.
The Seafood market as a whole is evolving and we are witnessing extreme changes in the basic
characteristics of the demand. The end client today is more educated, expects the story behind
the product, and has more ways to channel his requirements upwards, through the retailer or wholesaler, to the grower. Today, the big Tilapia exporters must give equal emphasis on
production volumes, as too adopting more of a holistic approach in an attempt to find the right balance between environmental, social, and economic impacts of their activity.
Driven by the increased USA market, Tilapia consumption per capita has made an impressive
growth, however with limited impact on the overall ―USA seafood consumption‖ per capita – which implies Tilapia is replacing other marine species. Based on this very rapid unprecedented
production and market increase worldwide, FAO, public and private research institutes, potential
investors, are all trying to understand and predict the tendencies and the real overall potential for the continuing development of the Tilapia industry. What are the limiting factors? How
sustainable Is this growth?
Many years have passed since Tilapia was first introduced to the Boston seafood show in 1979; today it is covering half of the floor. Will the same trend continue? How much more Tilapia will be
needed? Where and how will Tilapia be produced? Which products? In what cost? All those
recent years the focus was on fast production growth and it took its toll. Between others the apparent ―victims‖ are the environment, the product quality and industry wholesomeness, the
people involved, communities, and unfortunately the economy. Many big projects ended bankrupted and many single small farmers and farms lost control and disappeared. On the
market side Tilapia is still suffering from low image reflecting low prices and more economical constrains. To increase production and develop stable demand it takes a balanced approach
which requires going through each of these seven principal components, in the order they appear
and simultaneously.
1. Water & environment
2. Financing
3. Animals & Husbandry
4. People & Management
5. Facilities & Technology
6. Feed & Raw materials ingredients
7. Market the story behind the product

363
The challenge and the mission are to find the right balance between all of these factors, or as
the term is often used today, to make this industry more ´´Sustainable´´.
The question for the grower today is, how much more sustainable is your competition?
Examples - Salmon is mainly being produced by two rich countries and consumed worldwide by
the richer upper-class markets; American Catfish is being produced by few farmers in Southern
USA and most of it is consumed right there; The emerged Vietnam Catfish industry is producing most Pangasius sold worldwide, little is eaten locally; Shrimp is produced mainly in poor countries
by poor people who can‘t afford to consume this product themselves but only to satisfy rich exclusive markets…
Tilapia is a very different story;
Tilapia is being produced all over the globe, mainly by ―low income food deficit countries‖
Tilapia is being consumed all over the globe in various socioeconomics groups, levels, with no
distinction.
Tilapia on one hand has the potential to secure food availability for the poor nations and on the other hand to improve commercial balance for better and stable developing economies.
And even more so when the entire world economy, nations, societies, are undergoing a scaring
food scarce warning.
It is a unique historically dangerous combination between climatologically changes, world politics, social unrest and real shortage due to increase in demand.
Tilapia, like any other live protein domestic production is competing with human being for same
plants production – maize, soya, wheat and others.
In order to fulfill its nutritional expectations and future role – Tilapia (and other animals) must be produced on byproducts conversion to high quality animal proteins from raw materials not suited
anymore for human consumption.
It is only then, that Tilapia will become an indispensible food staple for the low income societies to balance their nutrition and at the same time available for the white tablecloth markets.
In my presentation I am discussing the potentials and the limits for the Tilapia industry
continuous growth and market expansion. This based on one little country‘s experience that should serve as a model for the potential impact on many other communities and societies.
364
Tilapia – the historical promise for today’s social justice and security
Yedod Snir and Israel Snir –
Neve Eitan Fish Farm, Israel 38885, Inversiones miel – Honduras
Abstract
Big companies policy on social and environment responsibility is always questionable. Is this just
another way to clean their guilty conscience, a deceiving strategy which aims primarily to
improve their short term and immediate economical and financial results? Or is it a real
understanding that taking care of people and the environment is the best investment strategy
they can make for long term sustainability and profitability?
Whatever we do, as human beings, will have its impact on the environment. From the moment
we born we indeed contaminate – as we breathe, as we eat, as we build, as we fight, as we live.
The ever-present need to produce and to stay active, in order to sustain ourselves, our families,
and our countries - the humanity – is a destructive process.
As we are all aware the globe is hosting more and more habitants – world‘s population keeps
growing, meanwhile the natural resources we all depend on for our basic existence are quickly
depleting, because of us, and because of others.
We all understand this process is accelerated each and every day. We are all desperately
searching for the right formula which will allow more mouths to depend on fewer resources,
more newborn given the opportunity to a fair life. Hopefully this will be a life which could help us
balance between our indispensable needs and our economical and livelihood activities.
Aquaculture as a whole is an ―industry‖ involved in land, water, air and people; could Tilapia be
the ―promised‖ specie to offer the best reasonable potentially balanced formula which at the
same time is considerably caring about peoples, the environment, and the benefit of the
economy – the investor?.
This paper is describing a very small country located in Central America. It is only a two hours
flight from Miami which is closer than most other major cities in America. While it is only three
days boat ride, from the USA, the country is basically a different planet, different globe, light
years of distance, far away from the daily routine we all familiar with. With an annual GDP of a
few hundred dollars or in the best case few thousands, how can one face the enormous
challenges for maintaining basic daily life and society order? Let alone when it comes for
“altruistic causes” like preserving the environment or caring about others or looking for more
justice.
Despite all these hardships, typical constrains in such an underdeveloped country, almost all of
the aquatic products (better term than Seafood) America eats is coming from countries with a
similar unfortunate circumstances around the globe and in the case of Tilapia Tropical countries.
It is quite obvious to the world that those who have will do whatever they can to ensure a
continuous flow from those who don‘t have. Of course, these are the markets, the banks, the
stomachs that can afford paying for this activity and they are those who making the rules.
365
The recent flourishes of so many certifying organizations, mostly NGOs, are primarily aimed at
―selfish‖ approach to assure the quality, acceptability and stability of the aquatic products supply
– in the current terminology - transparency and sustainability. However, one must be very
careful in making sure it is not becoming a way to express a modern colonialism…
This is exactly the point I will try to demonstrate - how a small country, remote communities,
forgotten children, after so many years of traditional environmentally destructive practices – how
they transformed and were able to put together a sustainable project which is changing their life,
ours. How they manage to combine natural resource, water, energy, Tilapia, foresting,
communities, health, education, government, private sector, investor – how they all together
made the change. How local native stakeholders learn to watch their OWN long term interests,
how big companies investment in people becoming a strategy, how illiterates people interpreted
amorphous and theoretical terminology into day to day constructive practices for the benefit of
all, their families, communities, countries, and us - the globe. It is a modest attempt to show
some of the process where so many people were and are involved – and hopefully to inspire
others.
366
GROW OUT SYSTEMS
Professor Emmanuel Frimpong
Virginia Tech University
USA
367
The International Aquaponics and Tilapia Aquaculture Course at the
University of the Virgin Islands
James E. Rakocy*, Donald S. Bailey, R. Charlie Shultz and Jason J. Danaher
Agricultural Experiment Station University of the Virgin Islands
RR 1, Box 10,000, Kingshill, VI 00850, U.S. Email: [email protected]
Introduction
For nearly three decades the Aquaculture Program at the University of the Virgin Islands (UVI) has focused on the development of two intensive tilapia production systems that conserve
and reuse water and recycle nutrients. Dry conditions and limited arable land in the Virgin Islands
provided the impetus for this research. A commercial-sized aquaponic system was developed. This system can annually produce 5 mt of tilapia and 5-13 mt of leafy green vegetables on 0.05
ha of land. A 0.02-ha biofloc system was developed which can produce 7 mt of tilapia annually. The biofloc system could be scaled up to a larger size. Using geotextile technology, solid waste
from these systems can be recovered, dewatered and used as a soil amendment for field crops,
replacing the need for inorganic fertilizers.
After 19 years of research and development, the aquaculture program started to promote
and teach these technologies while continuing to conduct research. In 1999, the 1st Annual Aquaponics and Tilapia Aquaculture Short Course was held and attended by 17 students.
Advertising for the 1-week course was conducted mainly by sending out flyers and placing ads in
aquaculture publications. As the Internet became widely used, most attendees learned of the course through the Internet and the use of flyers was discontinued. Attendance gradually
increased until the capacity of the lecture room (33) was consistently reached and exceeded, resulting in the rejection of many applicants. During the last 4 years, a new conference room
became available and attendance in 2007, 2008, 2009 and 2010 was 63, 73, 56 and 92 students, respectively. In 2008, the 10th anniversary of the course, its name was changed to the
International Aquaponics and Tilapia Aquaculture Course. During that year students came from
all seven continents, including a researcher from Antarctica.
A team of four aquaculturists teach the course which is divided into 26 hours of
classroom instruction and 22 hours of hands-on field exercises. During 2007-2009, two lectures were delivered during each course by an aquaponics researcher (Dr. Wilson Lennard) from
Australia over the phone while his PowerPoint slides were shown in the conference room.
Total course attendance to date has been 510 students from 45 U.S states and territories and 52 other countries (Table 1). Former students have offered their own short courses in
Florida, Illinois, Oklahoma, Hawaii and Mexico and have attracted hundreds of students. The course instructors are sometimes asked to conduct aquaponics training at other locations
including Virginia, Pennsylvania, Wisconsin, Hawaii, Mexico, Trinidad and Australia. As a result of the UVI course and the efforts of many others, aquaponics is becoming remarkably popular but
mainly at the hobby level so far. Biofloc system adoption is slower, but its potential in tropical
areas is great. Biofloc technology training should be conducted in a separate course for a different audience.

368
Table 1. Breakdown of participants taking the ―International Aquaponics and Tilapia Aquaculture
Course‖ by state, territory and country during 13 course offerings from 1999-2010.
U.S. States Student No. West Indian Countries,
Territories, Departments
Student No.
Alabama 11
Arizona 6 Antigua 9
Arkansas 2 Barbados 3
California 20 British Virgin Islands 2
Colorado 8 Cayman Islands 4
Connecticut 7 Curacao 3
Florida 39 Dominican Republic 3
Georgia 16 Haiti 3
Hawaii 6 Jamaica 6
Idaho 1 Martinique 5
Illinois 5 Montserrat 1
Indiana 1 Nevis 2
Iowa 1 St. Eustatius 2
Kansas 3 St. Lucia 5
Kentucky 1 St. Maarten 7
Louisiana 11 Trinidad and Tobago 16
Maine 1
Maryland 3 Other Countries
Massachusetts 3 Argentina 1
Michigan 7 Australia 3
Minnesota 2 Bahamas 3
Missouri 2 Belize 1
New Hampshire 2 Botswana 1
New Jersey 8 Bulgaria 1
New York 16 Canada 21
North Carolina 5 Colombia 4
Ohio 5 Costa Rica 2
Oklahoma 5 Cyprus 2
Oregon 4 Denmark 1
Pennsylvania 8 Ethiopia 1
Rhode Island 2 Finland 1
South Carolina 3 France 1
South Dakota 1 France (Réunion Island) 1
Tennessee 4 Guatemala 2
Texas 18 Honduras 1
Utah 3 China (Hong Kong) 3
Virginia 11 Hungary 1
Washington 4 Indonesia 2
West Virginia 1 Italy 1
Wisconsin 1 Japan 1
Lebanon 1
District of Columbia 1 Malaysia 8
Mexico 9
Nigeria 2
U.S. Virgin Islands Norway 1
St. Croix 34 Peru 2
St. John 1 Republic of Benin 1
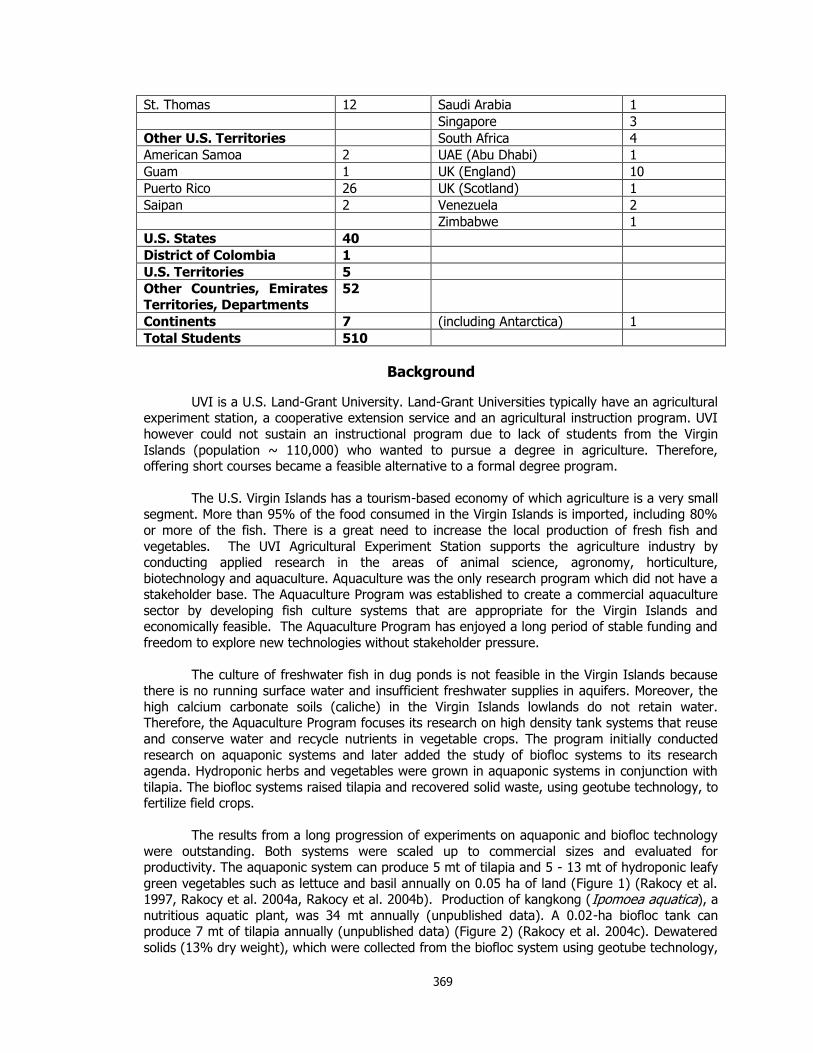
369
St. Thomas 12 Saudi Arabia 1
Singapore 3
Other U.S. Territories South Africa 4
American Samoa 2 UAE (Abu Dhabi) 1
Guam 1 UK (England) 10
Puerto Rico 26 UK (Scotland) 1
Saipan 2 Venezuela 2
Zimbabwe 1
U.S. States 40
District of Colombia 1
U.S. Territories 5
Other Countries, Emirates
Territories, Departments
52
Continents 7 (including Antarctica) 1
Total Students 510
Background
UVI is a U.S. Land-Grant University. Land-Grant Universities typically have an agricultural experiment station, a cooperative extension service and an agricultural instruction program. UVI
however could not sustain an instructional program due to lack of students from the Virgin
Islands (population ~ 110,000) who wanted to pursue a degree in agriculture. Therefore, offering short courses became a feasible alternative to a formal degree program.
The U.S. Virgin Islands has a tourism-based economy of which agriculture is a very small segment. More than 95% of the food consumed in the Virgin Islands is imported, including 80%
or more of the fish. There is a great need to increase the local production of fresh fish and
vegetables. The UVI Agricultural Experiment Station supports the agriculture industry by conducting applied research in the areas of animal science, agronomy, horticulture,
biotechnology and aquaculture. Aquaculture was the only research program which did not have a stakeholder base. The Aquaculture Program was established to create a commercial aquaculture
sector by developing fish culture systems that are appropriate for the Virgin Islands and economically feasible. The Aquaculture Program has enjoyed a long period of stable funding and
freedom to explore new technologies without stakeholder pressure.
The culture of freshwater fish in dug ponds is not feasible in the Virgin Islands because there is no running surface water and insufficient freshwater supplies in aquifers. Moreover, the
high calcium carbonate soils (caliche) in the Virgin Islands lowlands do not retain water. Therefore, the Aquaculture Program focuses its research on high density tank systems that reuse
and conserve water and recycle nutrients in vegetable crops. The program initially conducted
research on aquaponic systems and later added the study of biofloc systems to its research agenda. Hydroponic herbs and vegetables were grown in aquaponic systems in conjunction with
tilapia. The biofloc systems raised tilapia and recovered solid waste, using geotube technology, to fertilize field crops.
The results from a long progression of experiments on aquaponic and biofloc technology
were outstanding. Both systems were scaled up to commercial sizes and evaluated for productivity. The aquaponic system can produce 5 mt of tilapia and 5 - 13 mt of hydroponic leafy
green vegetables such as lettuce and basil annually on 0.05 ha of land (Figure 1) (Rakocy et al. 1997, Rakocy et al. 2004a, Rakocy et al. 2004b). Production of kangkong (Ipomoea aquatica), a
nutritious aquatic plant, was 34 mt annually (unpublished data). A 0.02-ha biofloc tank can produce 7 mt of tilapia annually (unpublished data) (Figure 2) (Rakocy et al. 2004c). Dewatered
solids (13% dry weight), which were collected from the biofloc system using geotube technology,

370
produced comparable yields of vegetables when used as an organic fertilizer compared to
standard applications of slow release inorganic fertilizers (Danaher 2009).
Training
By 1999 the development of the UVI aquaponic system reached a stage where it was
ready for commercial application. While continuing to conduct research and refine the aquaponic and biofloc systems, the Aquaculture Program also began to promote this technology and train
students by initiating the annual ―Aquaponics and Tilapia Aquaculture Short Course.‖
The course begins on a Sunday in the middle of June. After the instructors are
introduced, the students introduce themselves, stating where they come from and what their
goal is in taking the course. At this point the students are given CDs containing numerous publications and a class schedule. Students generally belong to one of the following categories:
farmers, entrepreneurs, teachers, researchers, extension agents, missionaries or hobbyists.
Figure 1. The UVI aquaponic system with a basil crop.
The course is taught at a very fundamental level, assuming the students have little or no
knowledge of aquaculture or horticulture. The course is comprised of 6 days of instruction and a field trip on the seventh day. Instruction is divided into 26 hours of classroom presentations and
14 hours of hands-on field work. The lectures are given by four professional staff members in the Aquaculture Program and an aquaponics expert from Australia who calls in his two 1-hour
presentations while his PowerPoint slides are shown to the class. The lecture topics emphasize
the principles and practical applications of aquaponics and biofloc technologies (Table 2).
One topic that is always well received is the development of the UVI aquaponic system.
This is a 2-hour PowerPoint presentation with many photos of the 2-decade evolution of the UVI system. It shows three scale-ups of the system to the current commercial size and many design
iterations of the commercial system. Emphasis is placed on the mistakes that were made in a trial

371
and error process. The goal of this lecture is to have students learn from these mistakes, not
repeat them and realize that small changes can lead to unintended consequences in a biological system.
Hands-on field work is a very important aspect of the course. After an initial comprehensive introductory tour of the aquaculture facility, students actively participate in
several field activities (Table 3).
Figure 2. The UVI biofloc system.
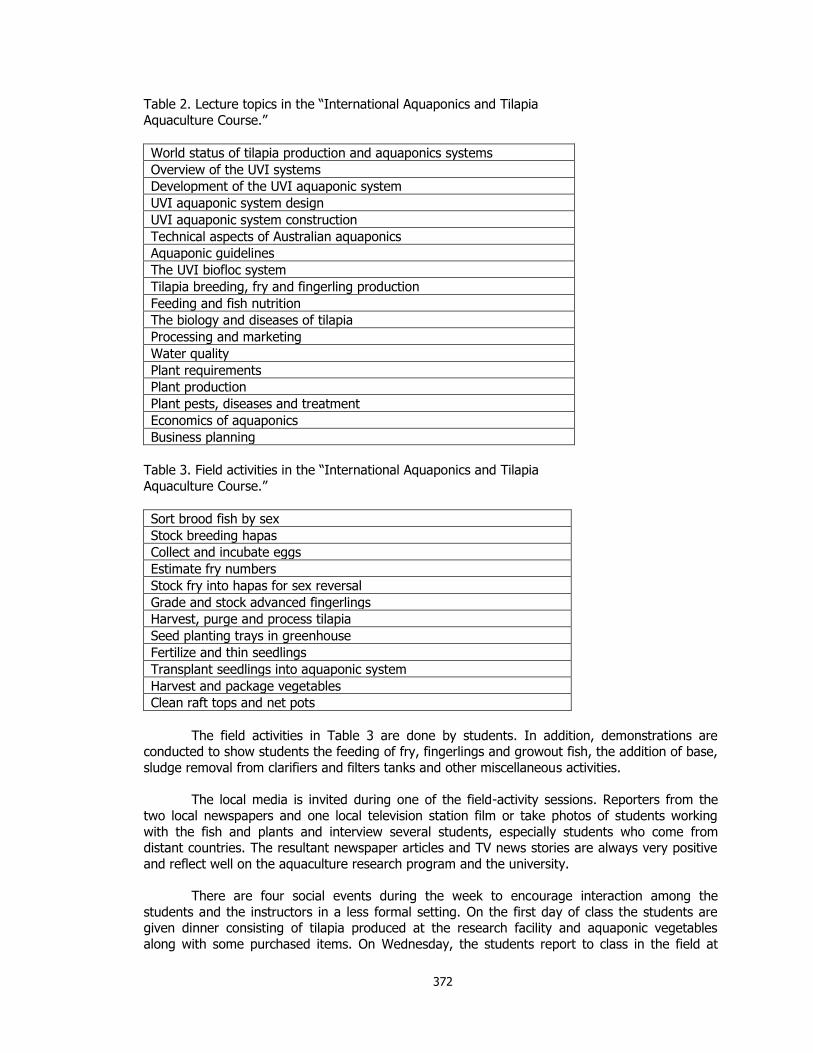
372
Table 2. Lecture topics in the ―International Aquaponics and Tilapia
Aquaculture Course.‖
World status of tilapia production and aquaponics systems
Overview of the UVI systems
Development of the UVI aquaponic system
UVI aquaponic system design
UVI aquaponic system construction
Technical aspects of Australian aquaponics
Aquaponic guidelines
The UVI biofloc system
Tilapia breeding, fry and fingerling production
Feeding and fish nutrition
The biology and diseases of tilapia
Processing and marketing
Water quality
Plant requirements
Plant production
Plant pests, diseases and treatment
Economics of aquaponics
Business planning
Table 3. Field activities in the ―International Aquaponics and Tilapia
Aquaculture Course.‖
Sort brood fish by sex
Stock breeding hapas
Collect and incubate eggs
Estimate fry numbers
Stock fry into hapas for sex reversal
Grade and stock advanced fingerlings
Harvest, purge and process tilapia
Seed planting trays in greenhouse
Fertilize and thin seedlings
Transplant seedlings into aquaponic system
Harvest and package vegetables
Clean raft tops and net pots
The field activities in Table 3 are done by students. In addition, demonstrations are conducted to show students the feeding of fry, fingerlings and growout fish, the addition of base,
sludge removal from clarifiers and filters tanks and other miscellaneous activities.
The local media is invited during one of the field-activity sessions. Reporters from the
two local newspapers and one local television station film or take photos of students working
with the fish and plants and interview several students, especially students who come from distant countries. The resultant newspaper articles and TV news stories are always very positive
and reflect well on the aquaculture research program and the university.
There are four social events during the week to encourage interaction among the
students and the instructors in a less formal setting. On the first day of class the students are given dinner consisting of tilapia produced at the research facility and aquaponic vegetables
along with some purchased items. On Wednesday, the students report to class in the field at
373
7:00 a.m. to harvest fish and vegetables, restock the fish tank and transplant seedling. After
lunch on this day the students are given an island tour which finishes at a beach bar for drinks. On Friday night a banquet is held at a luxury resort which includes a cultural show. On Saturday
the students go on a full day sailing and snorkel trip to Buck Island National Park. On the return trip the sail boat moors at a deserted beach on St. Croix for a beach barbecue.
A class photo is taken Thursday afternoon. By Friday copies of this photo are printed,
laminated and distributed at the class closing ceremony. The students are given certificates of completion and T-shirts with a design signifying aquaponics. The students are also given an
access code so that they may view all the PowerPoint presentations on a website called Blackboard. The students fill out and submit evaluation forms, which are used to improve the
course. There is no formal method to follow up on the students after the course. The students are encouraged to call or e-mail the instructors if they want additional information or need
clarification on some topic. A few students have taken the course a second time as they get
closer to constructing their operation. Several students have sent photos of their aquaponic operations. The course has lead to the installation of many aquaponic systems, but the full extent
of application is not known.
Students learn the principles of aquaponics during this intensive course. They see a
working model of a commercial-scale aquaponic system and develop a good sense of the steps
required to prepare an aquaponic business plan and to construct and operate an aquaponic system. However, it has become apparent over the years that students could benefit from an
internship program where they are given full responsibility for operating an aquaponic system for a two or three-month period while having instructors available to assist them if problems develop
or they are uncertain about some aspect of the operation. A trained intern would have the confidence and knowledge to start their own aquaponic business or work for someone else in a
management capacity.
References
Danaher, J.J. 2009. Evaluating geotextile technology to enhance sustainability of agricultural production systems in the U.S. Virgin Islands. University of the Virgin Islands, Technical Bulletin #14, 4 pp.
Rakocy, J.E., D.S. Bailey, K.A. Shultz and W.M. Cole. 1997. Evaluation of a commercial-scale aquaponic unit for the production of tilapia and lettuce. Pages 357-372 in K. Fitzsimmons, ed. Tilapia Aquaculture: Proceedings of the Fourth International Symposium on Tilapia in Aquaculture, Orlando, Florida.
Rakocy, J.E., D.S. Bailey, R.C. Shultz and E.S. Thoman. 2004a. Update on tilapia and vegetable production in the UVI aquaponic system. Pages 676-690 in R.B. Bolivar, G.C. Mair, K. Fitzsimmons, Eds. Proceedings from the Sixth International Symposium on Tilapia in Aquaculture, Manila, Philippines.
Rakocy, J.E., Shultz, R.C., Bailey D.S. and Thoman, E.S. 2004b. Aquaponic production of tilapia and basil: comparing a batch and staggered cropping system. Acta
Horticulturae (ISHS) 648:63-69. (http://www.actahort.org/books/648/648_8.htm) Rakocy, J.E., D.S. Bailey, E.S. Thoman and R.C. Shultz. 2004c. Intensive tank culture of tilapia with a suspended, bacterial-based, treatment process. Pages 584-596 in R.B. Bolivar, G.C. Mair and K. Fitzsimmons, Eds. Proceedings from the Sixth International Symposium on Tilapia in Aquaculture, Manila, Philippines
374
A Commercial-Scale Aquaponic System Developed at the University of the
Virgin Islands
James E. Rakocy*, Donald S Bailey, R. Charlie Shultz, and Jason J. Danaher
Agricultural Experiment Station University of the Virgin Islands
RR 1, Box 10,000, Kingshill, VI 00850 U.S. [email protected]
Abstract
Aquaponics is the combined culture of fish and plants in recirculating systems. Nutrients
generated by the fish, either by direct excretion or microbial breakdown of organic wastes, are absorbed by plants cultured hydroponically. Fish provide most of the nutrients required for plant
nutrition. As the aquaculture effluent flows through the hydroponic component of the
recirculating system, fish waste metabolites are removed by nitrification and direct uptake by plants, thereby treating the water, which flows back to the fish rearing component for reuse.
The University of the Virgin Islands Aquaculture Program has developed a commercial-scale aquaponic system. The system consists of four fish rearing tanks (7.8 m3 each, water
volume), two cylindro-conical clarifiers (3.8 m3 each), four filter tanks (0.7 m3 each), one degassing tank (0.7 m3), six hydroponic tanks (11.3 m3 each, 214 m2 of plant growing area), one
sump (0.6 m3), and one base addition tank (0.2 m3). The system contains 110 m3 of water and
occupies a land area of 0.05 ha. Major inputs are fish feed, water (1.5% of system volume daily on average), electricity (2.21 kW), base [Ca(OH)2 and KOH] and supplemental nutrients (Ca, K,
Fe). The system can produce nearly 5 mt of tilapia along with 1400 cases (24-30 heads per case) of leaf lettuce or 5 mt of basil or a variety of other crops.
The UVI system represents an appropriate or intermediate technology that can be
applied outdoors under suitable growing conditions or in an environmentally controlled greenhouse. The system conserves and reuses water, recycles nutrients and requires very little
land. The system can be used on a subsistence level or commercial scale. Production is continuous and sustainable. The system is simple, reliable and robust. The UVI aquaponic
system does require a relatively high capital investment, moderate energy inputs and skilled management, though management is easy if production guidelines are followed.
INTRODUCTION
Aquaponics is the combined culture of fish and plants in recirculating systems. Nutrients, which are excreted directly by the fish or generated by the microbial breakdown of organic
wastes, are absorbed by plants cultured hydroponically (without soil). Fish feed provides most of
the nutrients required for plant growth. As the aquaculture effluent flows through the hydroponic component of the recirculating system, fish waste metabolites are removed by
nitrification and direct uptake by the plants, thereby treating the water, which flows back to the fish-rearing component for reuse.
Aquaponics has several advantages over other recirculating aquaculture systems and
hydroponic systems that use inorganic nutrient solutions. The hydroponic component serves as a biofilter, and therefore a separate biofilter is not needed as in other recirculating systems.
Aquaponic systems have the only biofilter that generates income, which is obtained from the sale of hydroponic produce such as vegetables, herbs and flowers. In the UVI system, which employs
raft hydroponics, only calcium, potassium and iron are supplemented. The nutrients provided by the fish would normally be discharged and could contribute to pollution. Removal of nutrients by
plants prolongs water use and minimizes discharge. Aquaponic systems require less water
quality monitoring than individual recirculating systems for fish or hydroponic plant production. Aquaponics increases profit potential due to free nutrients for plants, lower water requirements,
elimination of a separate biofilter, less water quality monitoring and shared costs for operation and infrastructure.

375
Design Evolution and Operation
Aquaponic research at UVI began with six replicated systems that consisted of a rearing tank (12.8 m3), a cylindro-conical clarifier (1.9 m3), two hydroponic tanks (13.8 m2) and a sump
(1.4 m3) (Rakocy 1997). The hydroponic tanks (6.1 m long by 1.22 m wide by 28 cm deep) were
initially filled with gravel supported by wire mesh above a false bottom (7.6 cm). The gravel bed, which served as a biofilter, was alternately flooded with culture water and drained. Due to the
difficulty of working with gravel, the gravel was removed and a raft system, consisting of floating sheets (2.44 m long x 1.22 m wide x 3.8 cm thick) of polystyrene, was installed. A rotating
biological contactor (RBC) was then used for nitrification. Effluent from the clarifier was split into two flows, one going to the hydroponic tanks and the other to the RBC. These flows merged in
the sump, from which the treated water was pumped back to the rearing tank.
The rearing tank in this design proved to be too large relative to the plant growing surface area
of the hydroponic tanks, or, conversely, the hydroponic tanks were too small relative to the size of the rearing tank. When the rearing tank was stocked with Nile tilapia (Oreochromis niloticus) at commercial rates, nutrients rapidly accumulated to levels that exceeded the recommended
upper limits for hydroponic nutrient solutions [2,000 mg/L as total dissolved solids (TDS)] (Rakocy et al. 1993). Using Bibb lettuce, the optimum ratio between the fish feeding rate and
plant growing area was determined (Rakocy 1989). At this ratio (57 g of feed/m2 of plant growing area/day) the nutrient accumulation rate decreased and the hydroponic tanks were
capable of providing sufficient nitrification. Therefore, the RBCs were removed and the fish stocking rates were reduced to levels that allowed feed to be administered near the optimum
rate for good plant growth.
The experimental system has been scaled up three times. In the first scale-up, the
length of each hydroponic tank was increased from 6.1 m to 29.6 m. The optimum design ratio was used to allow the rearing tank to be stocked with tilapia at commercial levels (for a diffused
aeration system) without excessive nutrient accumulation. In the second scale-up, the number
of hydroponic tanks (29.6 m in length) was increased to six; the number of fish rearing tanks was increased to four (each with a water volume of 4.4 m3); the number of clarifiers was
increased to two; four filter tanks (0.7 m3 each) were added and the sump was reduced to 0.6 m3. This production unit, commercial aquaponics 1 (CA1), represented a realistic commercial
scale, although there are many possible size options and tank configurations. The final scale-up,
commercial aquaponics 2 (CA2), involved the enlargement of the four fish rearing tanks (each with a water volume of 7.8 m3) and the two clarifiers (each with a water volume of 3.8 m3) and
the addition of a 0.7-m3 degassing tank (Figure 1). The commercial-scale units could be configured to occupy as little as 0.05 ha of land.
The rearing tanks and water treatment tanks were situated under an opaque canopy,
which inhibited algae growth, lowered water temperature, which is beneficial for hydroponic plant
production, and created more natural lighting conditions for the fish.
The system used multiple fish rearing tanks to simplify stock management. Tilapia production was staggered in four rearing tanks so that one rearing tank was harvested every 6
weeks. The fish were not moved during their 24-week growout cycle. In a 2.5-year production
trial in CA 1 using sex-reversed Red tilapia, annual production was 3,096 kg, based on the last 11 harvests out of 19 harvests (Rakocy et al. 1997). Fingerlings, stocked at 182 fish/m3, grew at an
average rate of 2.85 g/day to a size of 487 g. The final biomass averaged 81.1 kg/m3. This was equivalent to annual production of 175.7 kg/m3 of rearing tank space. The average feed
conversion and survival were 1.76 and 91.6%
376
The stocking density appeared to be too high for maximum growth and efficient feed
conversion. Midway through each production cycle, ad libitum feeding leveled off at approximately 5 kg per rearing tank. As the fish grew in the last half of the production cycle,
feed consumption did not increase. Therefore more of the feed was used for maintenance and less was used for growth, leading to a relatively high feed conversion ratio for 487-g fish. In CA2
the stocking rate for red tilapia has been lowered by 15% to 154 fish/ m3. The growth of Nile
tilapia was evaluated at a stocking rate of 77 fish/m3. With larger rearing tanks and higher growth rates, it was anticipated that CA2 could produce 5 mt of tilapia annually.
Based on the results of 20 harvests (four for Red tilapia and 16 for Nile tilapia) with the
CA2 system, Red tilapia grew to an average of 512.5 g (Rakocy et al. 2004a). The West Indian market prefers a colorful whole fish that is served with its head on. At this density production
averaged 70.7 kg/m3, and the growth rate averaged 2.69 g/day. Nile tilapia averaged 813.8 g, a
preferable size for the fillet market. At this density production averaged 61.5 kg/m3, and the growth rate averaged 4.40 g/day. The stocking rates appeared to be nearly optimal for the
desired product size. Nile tilapia attained a higher survival rate (98.3%) and a lower feed conversion ratio (1.7) than Red tilapia (89.9% and 1.8, respectively). Projected annual
production was 4.16 mt for Nile tilapia and 4.78 mt for Red tilapia.
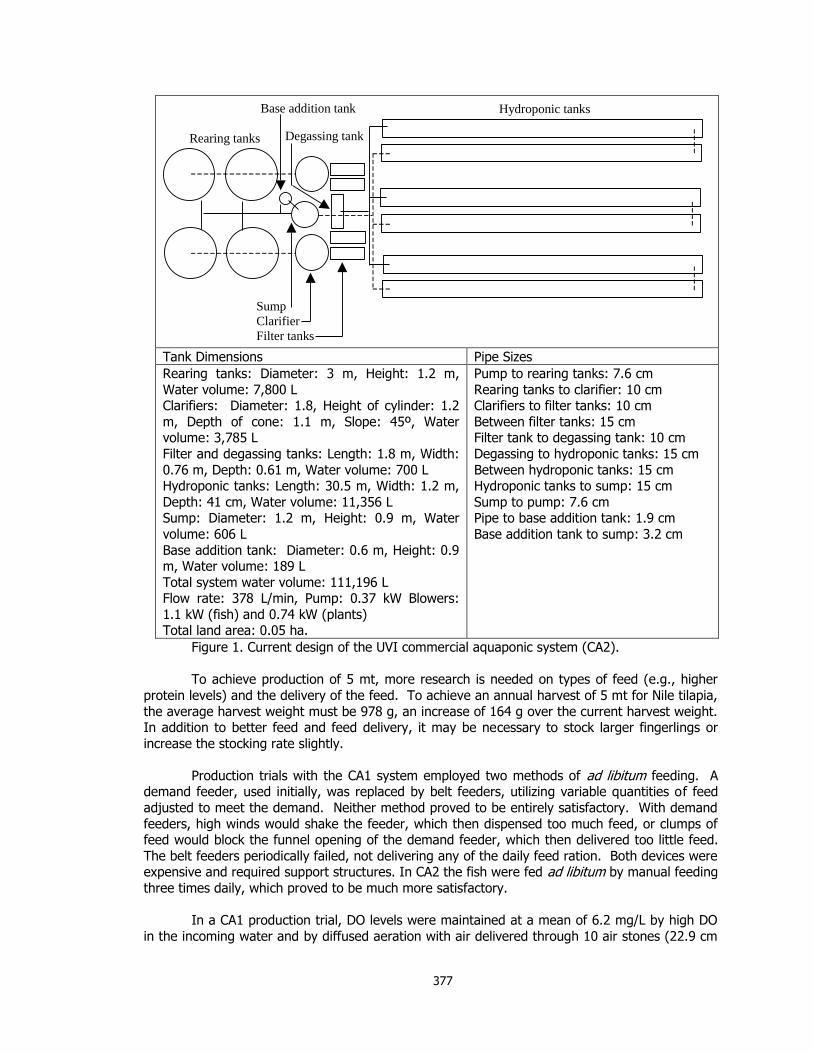
377
Tank Dimensions Pipe Sizes
Rearing tanks: Diameter: 3 m, Height: 1.2 m,
Water volume: 7,800 L Clarifiers: Diameter: 1.8, Height of cylinder: 1.2
m, Depth of cone: 1.1 m, Slope: 45º, Water volume: 3,785 L
Filter and degassing tanks: Length: 1.8 m, Width:
0.76 m, Depth: 0.61 m, Water volume: 700 L Hydroponic tanks: Length: 30.5 m, Width: 1.2 m,
Depth: 41 cm, Water volume: 11,356 L Sump: Diameter: 1.2 m, Height: 0.9 m, Water
volume: 606 L
Base addition tank: Diameter: 0.6 m, Height: 0.9 m, Water volume: 189 L
Total system water volume: 111,196 L Flow rate: 378 L/min, Pump: 0.37 kW Blowers:
1.1 kW (fish) and 0.74 kW (plants) Total land area: 0.05 ha.
Pump to rearing tanks: 7.6 cm
Rearing tanks to clarifier: 10 cm Clarifiers to filter tanks: 10 cm
Between filter tanks: 15 cm Filter tank to degassing tank: 10 cm
Degassing to hydroponic tanks: 15 cm
Between hydroponic tanks: 15 cm Hydroponic tanks to sump: 15 cm
Sump to pump: 7.6 cm Pipe to base addition tank: 1.9 cm
Base addition tank to sump: 3.2 cm
Figure 1. Current design of the UVI commercial aquaponic system (CA2).
To achieve production of 5 mt, more research is needed on types of feed (e.g., higher
protein levels) and the delivery of the feed. To achieve an annual harvest of 5 mt for Nile tilapia,
the average harvest weight must be 978 g, an increase of 164 g over the current harvest weight. In addition to better feed and feed delivery, it may be necessary to stock larger fingerlings or
increase the stocking rate slightly.
Production trials with the CA1 system employed two methods of ad libitum feeding. A demand feeder, used initially, was replaced by belt feeders, utilizing variable quantities of feed
adjusted to meet the demand. Neither method proved to be entirely satisfactory. With demand
feeders, high winds would shake the feeder, which then dispensed too much feed, or clumps of feed would block the funnel opening of the demand feeder, which then delivered too little feed.
The belt feeders periodically failed, not delivering any of the daily feed ration. Both devices were expensive and required support structures. In CA2 the fish were fed ad libitum by manual feeding
three times daily, which proved to be much more satisfactory.
In a CA1 production trial, DO levels were maintained at a mean of 6.2 mg/L by high DO
in the incoming water and by diffused aeration with air delivered through 10 air stones (22.9 cm
Rearing tanks
Hydroponic tanks
Degassing tank
Base addition tank
Sump
Clarifier
Filter tanks

378
x 3.8 cm x 3.8 cm) around the perimeter of the tank. In the last 12 weeks of the growout
period, a 40-watt vertical lift pump was placed in the center of the tank for additional aeration. The pump pushed the floating feed to the perimeter of the tank and some feed pellets were
splashed out of the tank during initial feeding frenzies. Vigorous aeration vented carbon dioxide gas into the atmosphere and prevented its buildup. A high water exchange rate quickly removed
suspended solids and toxic waste metabolites (ammonia and nitrite) from the rearing tank. A
0.74-kW in-line pump moved water at an average rate of 378 L/min from the sump to the rearing tanks (mean retention time, 0.8 h). Values of ammonia-nitrogen and nitrite-nitrogen in the
rearing tanks averaged 1.47 and 0.52 mg/L, respectively. A pH of 7.2 was maintained by frequently adding equal amounts of calcium hydroxide and potassium hydroxide. Total alkalinity
averaged 56.5 mg/L as calcium carbonate.
In CA2 the vertical lift pump was eliminated, and the number of air stones around the
rearing tank perimeter was increased to 22 (15.2 cm x 3.8 cm x 3.8 cm). The air stones pushed feed to the center of the tank and no feed was lost due to feeding frenzy splashing. With larger
water volumes, the retention time increased to an average of 1.37 hours. A 1.1 kW blower provided sufficient aeration for the fish rearing tanks while a 0.74 kW blower was used for the
hydroponic tanks.
Effluent from the fish rearing tanks flowed into two 1.9-m3 clarifiers in the CA1
production trial. Separate drains from two of the rearing tanks were connected to each clarifier [see Rakocy (1997) for a detailed description]. The clarifiers removed settleable solids, but the
amount of solids collected was not as great with the 9.5-minute retention time in the production trial as it had been in previous trials with longer retention times (>20 minutes). Therefore, in
CA2 the clarifiers were increased in size to 3.8 m3 and the retention time increased to 19
minutes. The bottom slope of the new clarifiers was 45º as compared to 60º slopes in the 1.9-m3 clarifiers. Sludge was removed from the clarifiers three times daily.
Settleable solids in the clarifiers adhered to the sides of the cones and did not slide to the
bottom where they could be removed by opening the drain line. It was necessary to stock about
20 male tilapia in the each clarifier. They were not fed. As these fish fed on organisms growing on the clarifier walls, solids rolled to the cone bottom and were easily removed by opening the
drain line. The tilapia also swam into the rearing tank drain lines and kept them free of biofouling organisms. Tilapia in the clarifiers grew rapidly and needed to be replaced every 12 weeks with
smaller (~ 50 g) fingerlings. If they became too large, their swimming activity stirred up the
settled solids, which was counterproductive to clarification.
Suspended solids levels, which decline slightly on passage through the clarifier, were reduced further before the effluent entered the hydroponic tanks. Excessive solids were
detrimental to plant growth. Solids adhered to plant roots, created anaerobic conditions and blocked nutrient uptake. Two filter tanks in series, each with a volume of 0.7 m3 and filled with
orchard netting (1.9 cm mesh), received effluent from the clarifier and removed considerable
amounts of suspended solids, which adhered to the orchard netting. In the CA1 production trial, total suspended solids averaged 9.0 mg/L in the rearing tanks, 8.2 mg/L in the effluent from the
clarifiers (a 9% reduction) and 4.5 mg/L in the effluent from the filter tanks (a 45% reduction). The filter tanks were drained and the orchard netting was washed with a high-pressure sprayer
once or twice per week. Solids from the filter tanks and clarifiers were discharged through drain
lines into two 16-m3, lined ponds, which were continuously aerated using air stones. As one pond was being filled over a 2 to 4-week period, water from the other pond was used to irrigate
and fertilize field crops.
379
A separate study showed that of the total amount of solids removed from the system the
clarifiers removed approximately 50% (primarily settleable solids) while the filter tanks removed the remaining 50% (primarily suspended solids).
The relatively slow removal of solids from the system (three times daily from the
clarifiers and 1-2 times weekly from the filter tanks) was an important design feature. While
solids remained in the system, they were mineralized. The generation of dissolved inorganic nutrients promoted vigorous plant growth. In addition, filter-tank solids created anaerobic zones
where denitrification occurred. As water flowed through the accumulated organic matter on the orchard netting, nitrate ions were reduced to nitrogen gas. Nitrate was the predominant nutrient
in the aquaponic systems. High nitrate levels promoted vegetative growth but inhibited fruiting. With fruiting plants such as tomatoes, low nitrate concentrations maximized fruit production.
Nitrate levels were controlled by regulating the cleaning frequency of the filter tanks. If the filter
tanks were cleaned twice per week, there was less solids accumulation, less denitrification and higher nitrate levels. If the filter tanks were cleaned once per week, there was more solids
accumulation, more denitrification and lower nitrate levels.
Alkalinity is produced during denitrification and by plants which excrete alkaline ions
though their roots. There were periods when the pH did not decline for weeks at a time, which was detrimental to plant growth since calcium and potassium could not be supplemented through
the addition of base. To prevent periods of stable pH, the filter tanks were cleaned more frequently (twice per week) and any accumulation of solids on the bottom of the hydroponic
tanks, which could be anaerobic, were removed.
Organic decomposition in the filter tanks produced carbon dioxide, methane, hydrogen
sulfide, nitrogen and other gases. If filter-tank effluent entered the hydroponic tanks directly, it retarded the growth of plants near the inlet. Therefore, a 0.7-m3 degassing tank was added to
the CA2 system. Filter-tank effluent entered the degassing tank and was vigorously aerated, venting potentially harmful gasses into the atmosphere. Degassing-tank effluent was split into
three equal portions, each of which passed through a set of two hydroponic tanks. In each set of
tanks, water flowed 59.2 m before returning to the sump and being pumped back to the fish rearing tank
The hydroponic tanks retained the fish culture water for an average of three hours before it returned to the fish rearing tanks. Each set of hydroponic tanks contained 48 air stones
(7.6 cm x 2.5 cm x 2.5 cm), located 1.22 m apart along the central axis of the tank, which re-
aerated and mixed the water, exposing it to a film of nitrifying bacteria that grew on the tank surface areas, especially the underside of the polystyrene sheets. In the CA1 production trial, DO
increased from 4.0 to 6.9 mg/L on passage through the hydroponic tanks (Rakocy et al. 1997). Through direct nutrient uptake by plants or bacterial oxidation, Gloger et al. (1995) found that
the UVI raft hydroponic tanks removed an average of 0.56 g of total ammonia-nitrogen, 0.62 g of nitrite-nitrogen, 30.29 g of chemical oxygen demand, 0.83 g of total nitrogen and 0.17 g of total
phosphorous per m2 of plant growing area per day using romaine lettuce. The maximum
sustainable wastewater treatment capacity of raft hydroponics was found to be equivalent to a feeding rate of 180 g/m2 of plant growing area/day. Therefore raft hydroponics exhibited excess
treatment capacity.
The optimum feeding rate ratio of 57 g of feed/m2 of plant growing area/day, needed to
reduce nutrient accumulation, was determined using the initial small-scale systems. Nutrient levels increased but at a lower rate, and there was no filter tank. As the system design evolved to
the final commercial size (CA2), up to 5,600 L of water were dumped weekly (5% of the system water volume) during the filter tank cleaning process, which resulted in nutrient concentrations
remaining in a steady state at feeding rate ratios of 60 to 100 g/m2/day. This range of feeding rate ratios was well within the wastewater treatment capacity of 180 g/m2/day. Therefore, after
380
an initial acclimation period of one month, it was not necessary to monitor ammonia or nitrite
values in the commercial-scale system provided that the film on nitrifying bacteria on the underside of the rafts remained intact.
Several materials were used to construct the hydroponic tanks. The best construction
materials consisted of poured concrete walls (40 cm high and 10 cm wide) and a 23-mil high-
density polyethylene tank liner. The black liners used for CA1 absorbed considerable heat along the top of the tank walls. For CA2 the portion of the liners above the water level was painted
white to reflect heat. Subsequently UV-resistant, white liners were used. The polystyrene sheets were painted white with a potable grade latex paint to reflect heat and prevent the deterioration
that results if it is exposed to direct sunlight.
There were several advantages to raft culture. There was no limitation on tank size.
Rafts provided maximum exposure of the roots to the culture water and avoided clogging. The sheets shielded the water from direct sunlight and maintained lower than ambient water
temperatures, which was beneficial to plant growth. A disruption in pumping did not affect the plant‘s water supply. The sheets were easily moved along the channel to a harvesting point,
where they were lifted out of the water and placed on supports at an elevation that was
comfortable for workers. A disadvantage of raft culture was that the plant roots were vulnerable to damage caused by zooplankton, snails, leeches and other aquatic organisms. Biological
methods have been successful in controlling these invasive organisms. Ornamental fish, particularly tetras (Gymnocorymbus ternetzi), were effective in controlling zooplankton, and red
ear sunfish (shellcrackers, Lepomis microlophus) were effective in controlling snails. Shellcrackers also prey on leeches.
During the 2.5-year production trial for tilapia and lettuce in CA1, total annual lettuce production averaged 1,404 cases (Rakocy et al 1997). Lettuce production cycles from
transplanting seedlings to harvest were 4 weeks. In 112 lettuce harvests, marketable production averaged 27 cases per week and ranged from 13-38 cases (24-30 heads/case). Average harvest
weight was 269 g for Sierra (red leaf), 327 g for Parris Island (romaine), 314 g for Jericho
(romaine) and 265 g for Nevada (green leaf). The plants were weighed after the lower leaves were trimmed. Production was always greater during the cooler winter months when water
temperature averaged 25.1ºC than in the summer months when water temperature averaged 27.5ºC.
Fish feed provided adequate levels of 10 of the 13 nutrients required for plant growth. The nutrients requiring supplementation were K, Ca and Fe. During the production trial, 168.5
kg of KOH, 34.5 kg of CaO, 142.9 kg of Ca(OH)2 and 62.7 kg of iron chelate (10%) were added to the system, which was equivalent to the addition of 16.1, 3.3, 13.7 and 6.0 g, respectively, for
every kilogram of feed added to the system. The amount of Ca and K added was the result of the quantity of base required to maintain pH at 7.2. The optimum pH value for the UVI
aquaponic system has been revised to 7.0. Rainwater was used in all the aquaponic systems at
UVI because the NaCl content of groundwater in the Virgin Islands was too high. Two species of pathogenic root fungi (Pythium myriotylum and P. dissoticum) caused production
to decline during the warmer months. Pythium myriotylum caused root death while P. dissoticum caused general retardation in the maturation rate of the plant. CA2 was designed to lower water
temperature, through shading, reflective paint and heat dissipation manifolds (attached to the
blowers), in an effort to minimize the effects of Pythium. A plant potting media containing coconut fibers (coir) was used to produce transplants for CA2 instead of the peat-based potting
media used for CA1 because some peat products contain Pythium spores. The use of resistant varieties and antagonistic organisms also offer potential for Pythium control in aquaponic
systems.
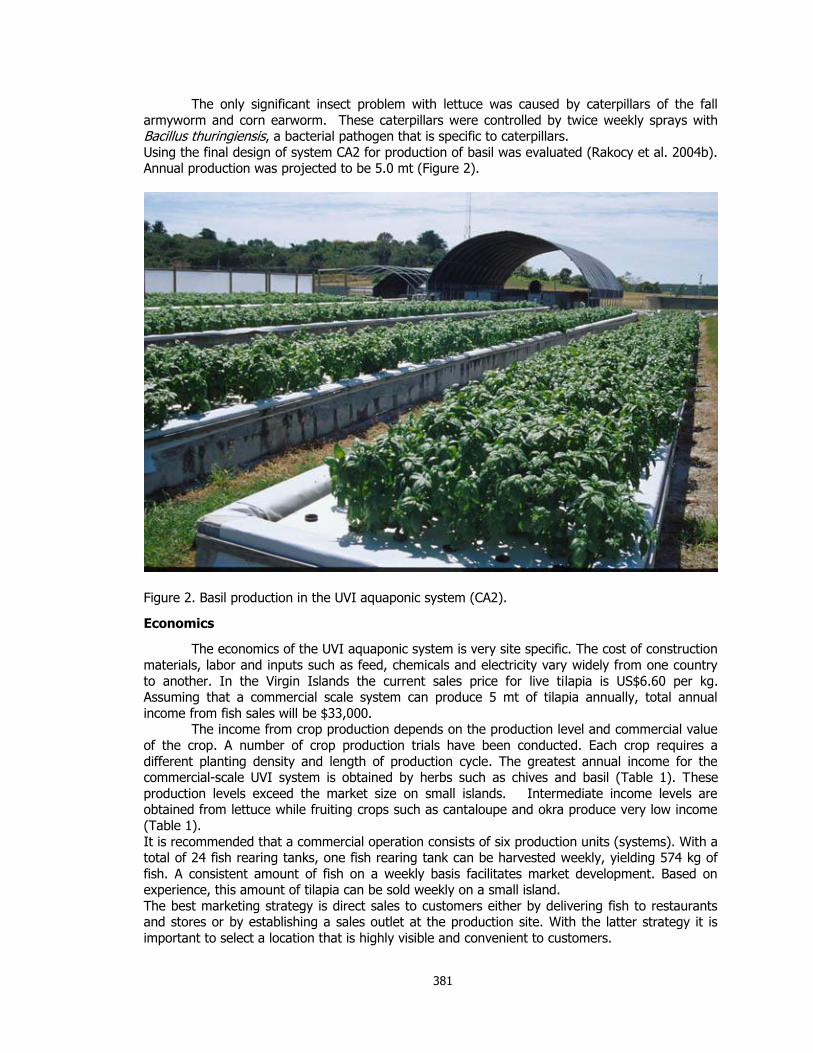
381
The only significant insect problem with lettuce was caused by caterpillars of the fall
armyworm and corn earworm. These caterpillars were controlled by twice weekly sprays with Bacillus thuringiensis, a bacterial pathogen that is specific to caterpillars.
Using the final design of system CA2 for production of basil was evaluated (Rakocy et al. 2004b). Annual production was projected to be 5.0 mt (Figure 2).
Figure 2. Basil production in the UVI aquaponic system (CA2).
Economics
The economics of the UVI aquaponic system is very site specific. The cost of construction
materials, labor and inputs such as feed, chemicals and electricity vary widely from one country
to another. In the Virgin Islands the current sales price for live tilapia is US$6.60 per kg. Assuming that a commercial scale system can produce 5 mt of tilapia annually, total annual
income from fish sales will be $33,000. The income from crop production depends on the production level and commercial value
of the crop. A number of crop production trials have been conducted. Each crop requires a
different planting density and length of production cycle. The greatest annual income for the commercial-scale UVI system is obtained by herbs such as chives and basil (Table 1). These
production levels exceed the market size on small islands. Intermediate income levels are obtained from lettuce while fruiting crops such as cantaloupe and okra produce very low income
(Table 1).
It is recommended that a commercial operation consists of six production units (systems). With a total of 24 fish rearing tanks, one fish rearing tank can be harvested weekly, yielding 574 kg of
fish. A consistent amount of fish on a weekly basis facilitates market development. Based on experience, this amount of tilapia can be sold weekly on a small island.
The best marketing strategy is direct sales to customers either by delivering fish to restaurants and stores or by establishing a sales outlet at the production site. With the latter strategy it is
important to select a location that is highly visible and convenient to customers.
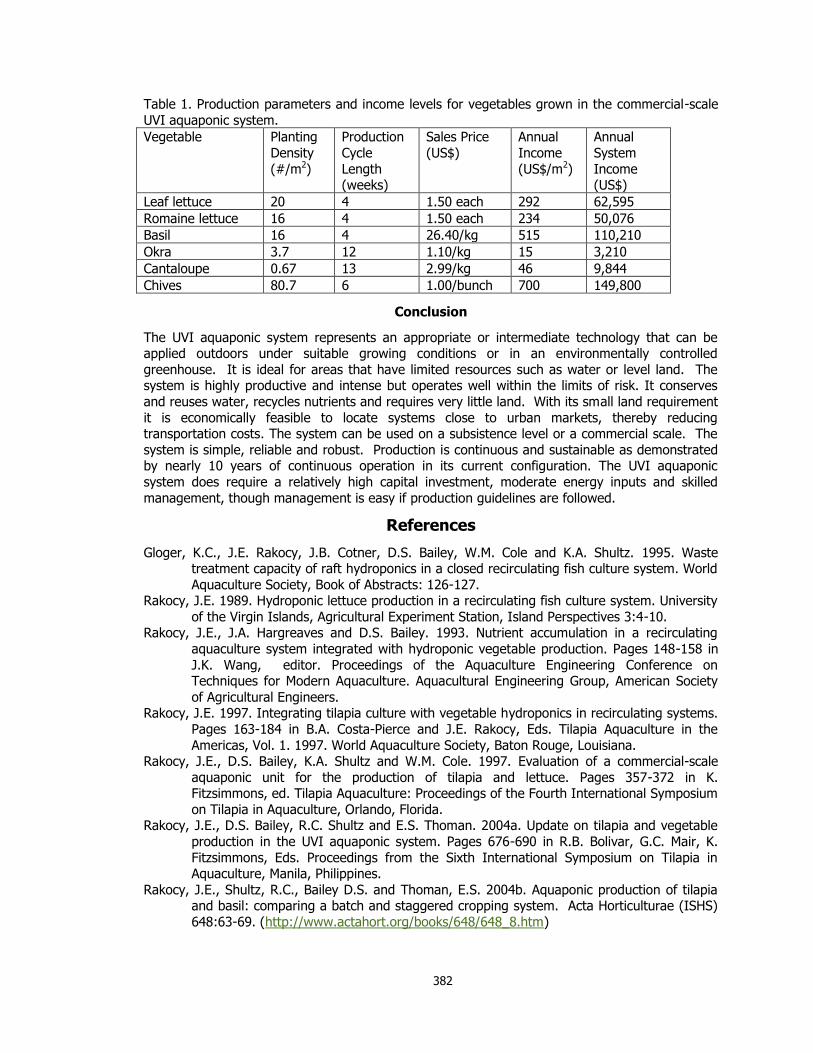
382
Table 1. Production parameters and income levels for vegetables grown in the commercial-scale
UVI aquaponic system.
Vegetable Planting
Density
(#/m2)
Production
Cycle
Length (weeks)
Sales Price
(US$)
Annual
Income
(US$/m2)
Annual
System
Income (US$)
Leaf lettuce 20 4 1.50 each 292 62,595
Romaine lettuce 16 4 1.50 each 234 50,076
Basil 16 4 26.40/kg 515 110,210
Okra 3.7 12 1.10/kg 15 3,210
Cantaloupe 0.67 13 2.99/kg 46 9,844
Chives 80.7 6 1.00/bunch 700 149,800
Conclusion
The UVI aquaponic system represents an appropriate or intermediate technology that can be applied outdoors under suitable growing conditions or in an environmentally controlled
greenhouse. It is ideal for areas that have limited resources such as water or level land. The system is highly productive and intense but operates well within the limits of risk. It conserves
and reuses water, recycles nutrients and requires very little land. With its small land requirement
it is economically feasible to locate systems close to urban markets, thereby reducing transportation costs. The system can be used on a subsistence level or a commercial scale. The
system is simple, reliable and robust. Production is continuous and sustainable as demonstrated by nearly 10 years of continuous operation in its current configuration. The UVI aquaponic
system does require a relatively high capital investment, moderate energy inputs and skilled
management, though management is easy if production guidelines are followed.
References
Gloger, K.C., J.E. Rakocy, J.B. Cotner, D.S. Bailey, W.M. Cole and K.A. Shultz. 1995. Waste treatment capacity of raft hydroponics in a closed recirculating fish culture system. World
Aquaculture Society, Book of Abstracts: 126-127. Rakocy, J.E. 1989. Hydroponic lettuce production in a recirculating fish culture system. University
of the Virgin Islands, Agricultural Experiment Station, Island Perspectives 3:4-10. Rakocy, J.E., J.A. Hargreaves and D.S. Bailey. 1993. Nutrient accumulation in a recirculating
aquaculture system integrated with hydroponic vegetable production. Pages 148-158 in
J.K. Wang, editor. Proceedings of the Aquaculture Engineering Conference on Techniques for Modern Aquaculture. Aquacultural Engineering Group, American Society
of Agricultural Engineers. Rakocy, J.E. 1997. Integrating tilapia culture with vegetable hydroponics in recirculating systems.
Pages 163-184 in B.A. Costa-Pierce and J.E. Rakocy, Eds. Tilapia Aquaculture in the
Americas, Vol. 1. 1997. World Aquaculture Society, Baton Rouge, Louisiana. Rakocy, J.E., D.S. Bailey, K.A. Shultz and W.M. Cole. 1997. Evaluation of a commercial-scale
aquaponic unit for the production of tilapia and lettuce. Pages 357-372 in K. Fitzsimmons, ed. Tilapia Aquaculture: Proceedings of the Fourth International Symposium
on Tilapia in Aquaculture, Orlando, Florida. Rakocy, J.E., D.S. Bailey, R.C. Shultz and E.S. Thoman. 2004a. Update on tilapia and vegetable
production in the UVI aquaponic system. Pages 676-690 in R.B. Bolivar, G.C. Mair, K.
Fitzsimmons, Eds. Proceedings from the Sixth International Symposium on Tilapia in Aquaculture, Manila, Philippines.
Rakocy, J.E., Shultz, R.C., Bailey D.S. and Thoman, E.S. 2004b. Aquaponic production of tilapia and basil: comparing a batch and staggered cropping system. Acta Horticulturae (ISHS)
648:63-69. (http://www.actahort.org/books/648/648_8.htm)
383
Development of a Biofloc System for the Production of Tilapia
James E. Rakocy, Jason J. Danaher, Donald S. Bailey and R. Charlie Shultz
University of the Virgin Islands Agricultural Experiment Station
RR 1, Box 10,000, Kingshill, VI 00850, U.S. [email protected]
Abstract
A 200-m3 circular tank was stocked with sex-reversed Nile tilapia (Oreochromis niloticus) and evaluated in four production trials. Water treatment methods consisted of aeration, mixing,
solids removal, nitrification and denitrification. The fish were fed ad libitum twice a day with a complete (32% protein), floating pellet. Ammonia and nitrite concentrations were generally
acceptable for tilapia growth. During the four trials, there were two non-toxic TAN spikes (~8 mg/L) and three nitrite-nitrogen spikes (14-18 mg/L) that were prevented from being lethal by
adding chloride ions (~300 mg/L) at the outset of the trials. The nitrate-nitrogen concentration
increased throughout the first two trials and reached 654 and 707 mg/L in Trials 1 and 2, respectively, which indicated a high rate of nitrification in the water column and the need for a
denitrification treatment process. Two external denitrification channels (15.2 m x 1.2 m x 0.6 m) were established and used in Trials 3 and 4, resulting in lower peak nitrate-nitrogen
concentrations (341 and 364 mg/L, respectively). Total suspended solids (TSS) increased throughout the first two trials and reached peaks values of 1,300 and 1,960 mg/L in Trials 1 and
2, respectively. Horizontal water velocity was too high for effective sedimentation of suspended
solids for removal by a 45º cone situated in the center of the tank bottom. The addition of an external clarifier (1.8 m3, 60º slope) to the system for the last 3 weeks of Trial 2 removed 360 kg
of dry weight solids, resulting in the reduction of TSS levels from to 1,700 to 600 mg/L. The reduction of TSS improved other water quality parameters and fish feeding response. The use of
the central cone was discontinued, and the external clarifier was used throughout Trials 3 and 4,
in which TSS reached peak values of 540 and 550 mg/L and averaged 317 and 368 mg/L, respectively. In Trial 4 the entire tank was covered with bird netting in lieu of less effective bird
deterrence methods. As a result, survival increased from a high of 86% in Trial 3 to 99.7% in Trial 4. For optimal performance the UVI biofloc system requires an external clarifier, a
denitrification unit and complete enclosure with bird netting.
Introduction
Pond culture is the standard method of producing tilapia in the tropics. Pond culture
depends on phytoplankton to generate oxygen and absorb dissolved nitrogenous waste. The
feeding rate limit for fed ponds is determined by the ability of the pond‘s microbial community to assimilate fish waste products such as ammonia and solid waste, which undergoes microbial
decomposition. The feeding rate limit determines a pond‘s production capacity. A standard production level for a fed pond is 5,000 kg/ha. The production level can be increased with
aeration and/or water exchange. An intensive biofloc system was developed at the University of the Virgin Islands, which
reduces the limitations of pond culture (Rakocy et al. 2000; Rakocy et al. 2002, Rakocy et al.
2004). The biofloc tank was continuously aerated and did not depend on phytoplankton for oxygen production. The primary component of the microbial community was shifted from
phytoplankton to chemoautotrophic bacteria, which removed ammonia and nitrite. Settleable solid waste was removed daily through a sedimentation process. The culture water was mixed to
suspend the microbial community and maximize contact between bacteria and waste products.

384
The culture water contained high concentrations of phytoplankton, but the phytoplankton
community did not play as dominant a role in maintaining water quality as in pond culture. As four production trials were conducted, the system was modified to enhance performance and
maximize production.
Materials and Methods
A 200-m3 circular tank (surface area = 200 m2) was constructed outdoors in St. Croix, U.S. Virgin Islands (Figures 1 and 2). The tank was 16 m wide by 1.22 m deep. The walls of the
tank were constructed from six tiers of lintel blocks (knock out bond beam blocks), which were reinforced horizontally and vertically with steel reinforcement bar and core filled with concrete. A
prefabricated plastic liner (30 mil HDPE) was installed inside the tank wall. The sides of the liner
were pulled over the wall to the outside and secured by fastening lumber (5 cm by 20 cm) to the top of the wall. Soil was backfilled around the outside of the tank so that only 0.4 m of the tank
wall was above grade.
Figure 1. A 200-m3 rearing tank with center cone and external drain line.
The bottom of the tank sloped 3% to a central, 1-m3, fiberglass cone with a 45 slope.
The liner was attached to a wide flange around the top of the cone with double-sided tape. A 10-
cm, PVC drainpipe extended from the apex of the cone to a 1-m3 fiberglass tank located outside
the rearing tank. By opening a gate valve in the drainpipe once a day, solid waste from the cone flowed into the small tank through an internal standpipe, and its volume was measured.
This system of solids removal was modified during the last 3 weeks of Trial 2. A 1.9-m3 cylindro-conical clarifier was installed outside the rearing tank (Figure 3). The clarifier was
constructed with fiberglass-reinforced rigid plastic sheeting (1 mm thick). The cylindrical portion of the clarifier was situated above ground and contained a central baffle that was perpendicular
to the incoming water flow. The lower conical portion, with a 60o slope, was buried under
ground. A 3-cm, PVC drainpipe extended from the apex of the cone to the top of the 1-m3 sludge tank. Rearing tank effluent was drawn from a depth of 0.8 m along the side of the rearing tank
through a 3.8-cm pipe and pumped, with a 0.25-hp centrifugal pump, into the clarifier just below the water surface at a rate of 38 L/minute to create a 50-minute retention time. The incoming
water was deflected upward by a 45o PVC elbow to dissipate the current. As water flowed under
the baffle, turbulence diminished and solids settled to the bottom of the cone. A ball valve was opened to drain solids from the cone into the sludge tank for measurement. The clarifier was
operated during the last 21 days of the trial. Solids were removed from the cone an average of eight times daily for the first 6 days. During days 7-21, solids were removed once in the morning.
During this 21-day period, solids were also removed from the cone in the center of the rearing tank once per day during late afternoon. The sludge was sampled several times to
measure total suspended solids and determine the dry weight of solids removed.
16 m
1.2 m 3 % slope
10 cm PVC drain line
1.8 m
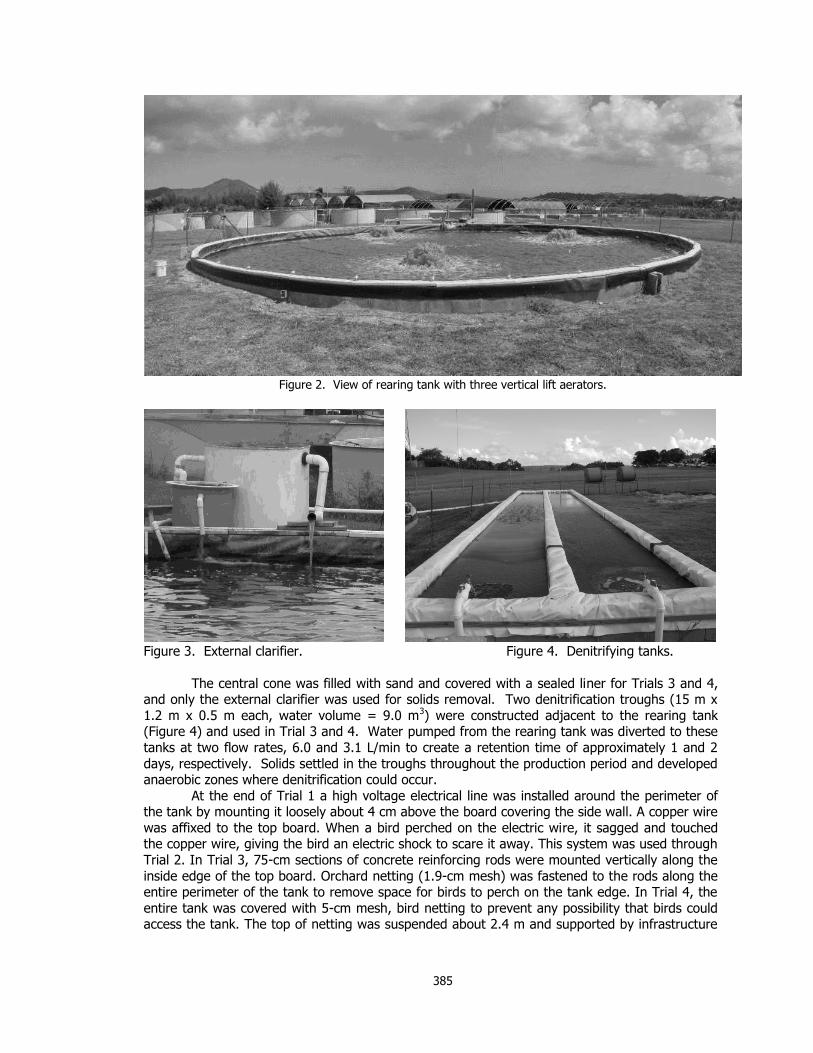
385
Figure 2. View of rearing tank with three vertical lift aerators.
Figure 3. External clarifier. Figure 4. Denitrifying tanks.
The central cone was filled with sand and covered with a sealed liner for Trials 3 and 4, and only the external clarifier was used for solids removal. Two denitrification troughs (15 m x
1.2 m x 0.5 m each, water volume = 9.0 m3) were constructed adjacent to the rearing tank (Figure 4) and used in Trial 3 and 4. Water pumped from the rearing tank was diverted to these
tanks at two flow rates, 6.0 and 3.1 L/min to create a retention time of approximately 1 and 2
days, respectively. Solids settled in the troughs throughout the production period and developed anaerobic zones where denitrification could occur.
At the end of Trial 1 a high voltage electrical line was installed around the perimeter of the tank by mounting it loosely about 4 cm above the board covering the side wall. A copper wire
was affixed to the top board. When a bird perched on the electric wire, it sagged and touched the copper wire, giving the bird an electric shock to scare it away. This system was used through
Trial 2. In Trial 3, 75-cm sections of concrete reinforcing rods were mounted vertically along the
inside edge of the top board. Orchard netting (1.9-cm mesh) was fastened to the rods along the entire perimeter of the tank to remove space for birds to perch on the tank edge. In Trial 4, the
entire tank was covered with 5-cm mesh, bird netting to prevent any possibility that birds could access the tank. The top of netting was suspended about 2.4 m and supported by infrastructure
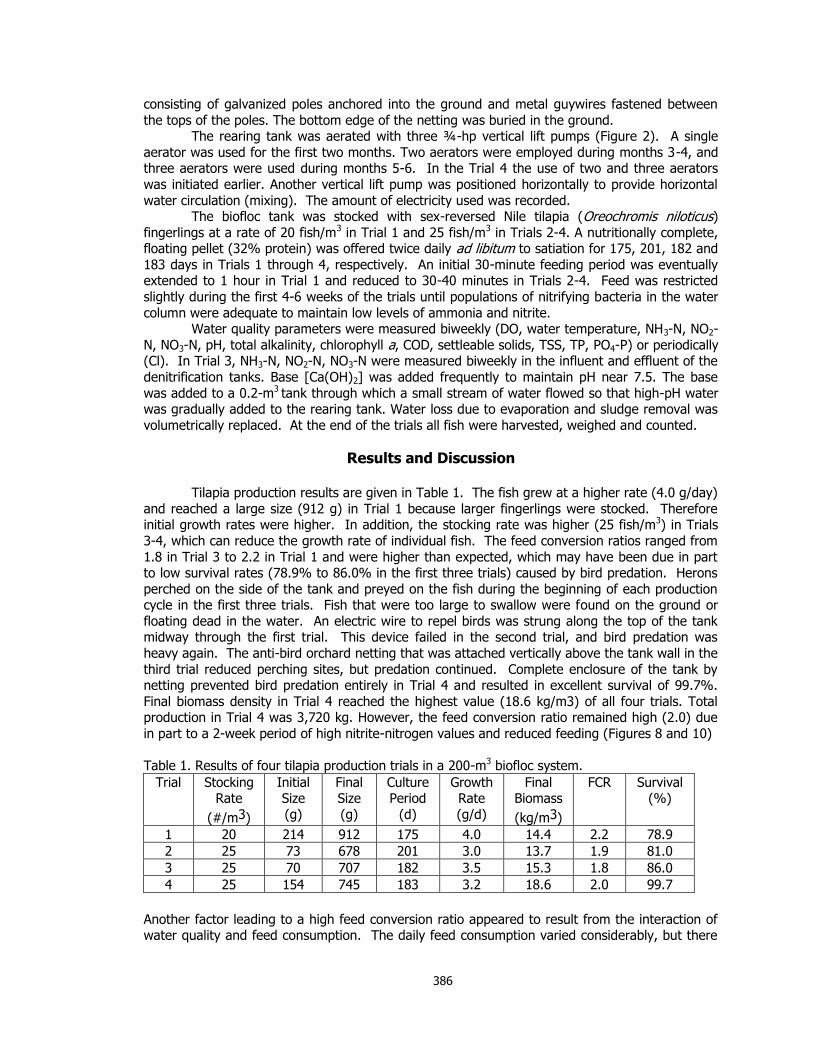
386
consisting of galvanized poles anchored into the ground and metal guywires fastened between
the tops of the poles. The bottom edge of the netting was buried in the ground. The rearing tank was aerated with three ¾-hp vertical lift pumps (Figure 2). A single
aerator was used for the first two months. Two aerators were employed during months 3-4, and three aerators were used during months 5-6. In the Trial 4 the use of two and three aerators
was initiated earlier. Another vertical lift pump was positioned horizontally to provide horizontal
water circulation (mixing). The amount of electricity used was recorded. The biofloc tank was stocked with sex-reversed Nile tilapia (Oreochromis niloticus)
fingerlings at a rate of 20 fish/m3 in Trial 1 and 25 fish/m3 in Trials 2-4. A nutritionally complete, floating pellet (32% protein) was offered twice daily ad libitum to satiation for 175, 201, 182 and
183 days in Trials 1 through 4, respectively. An initial 30-minute feeding period was eventually extended to 1 hour in Trial 1 and reduced to 30-40 minutes in Trials 2-4. Feed was restricted
slightly during the first 4-6 weeks of the trials until populations of nitrifying bacteria in the water
column were adequate to maintain low levels of ammonia and nitrite. Water quality parameters were measured biweekly (DO, water temperature, NH3-N, NO2-
N, NO3-N, pH, total alkalinity, chlorophyll a, COD, settleable solids, TSS, TP, PO4-P) or periodically (Cl). In Trial 3, NH3-N, NO2-N, NO3-N were measured biweekly in the influent and effluent of the
denitrification tanks. Base [Ca(OH)2] was added frequently to maintain pH near 7.5. The base
was added to a 0.2-m3 tank through which a small stream of water flowed so that high-pH water was gradually added to the rearing tank. Water loss due to evaporation and sludge removal was
volumetrically replaced. At the end of the trials all fish were harvested, weighed and counted.
Results and Discussion
Tilapia production results are given in Table 1. The fish grew at a higher rate (4.0 g/day)
and reached a large size (912 g) in Trial 1 because larger fingerlings were stocked. Therefore initial growth rates were higher. In addition, the stocking rate was higher (25 fish/m3) in Trials
3-4, which can reduce the growth rate of individual fish. The feed conversion ratios ranged from
1.8 in Trial 3 to 2.2 in Trial 1 and were higher than expected, which may have been due in part to low survival rates (78.9% to 86.0% in the first three trials) caused by bird predation. Herons
perched on the side of the tank and preyed on the fish during the beginning of each production cycle in the first three trials. Fish that were too large to swallow were found on the ground or
floating dead in the water. An electric wire to repel birds was strung along the top of the tank midway through the first trial. This device failed in the second trial, and bird predation was
heavy again. The anti-bird orchard netting that was attached vertically above the tank wall in the
third trial reduced perching sites, but predation continued. Complete enclosure of the tank by netting prevented bird predation entirely in Trial 4 and resulted in excellent survival of 99.7%.
Final biomass density in Trial 4 reached the highest value (18.6 kg/m3) of all four trials. Total production in Trial 4 was 3,720 kg. However, the feed conversion ratio remained high (2.0) due
in part to a 2-week period of high nitrite-nitrogen values and reduced feeding (Figures 8 and 10)
Table 1. Results of four tilapia production trials in a 200-m3 biofloc system.
Trial
Stocking Rate
(#/m3)
Initial Size
(g)
Final Size
(g)
Culture Period
(d)
Growth Rate
(g/d)
Final Biomass
(kg/m3)
FCR
Survival (%)
1 20 214 912 175 4.0 14.4 2.2 78.9
2 25 73 678 201 3.0 13.7 1.9 81.0
3 25 70 707 182 3.5 15.3 1.8 86.0
4 25 154 745 183 3.2 18.6 2.0 99.7
Another factor leading to a high feed conversion ratio appeared to result from the interaction of water quality and feed consumption. The daily feed consumption varied considerably, but there
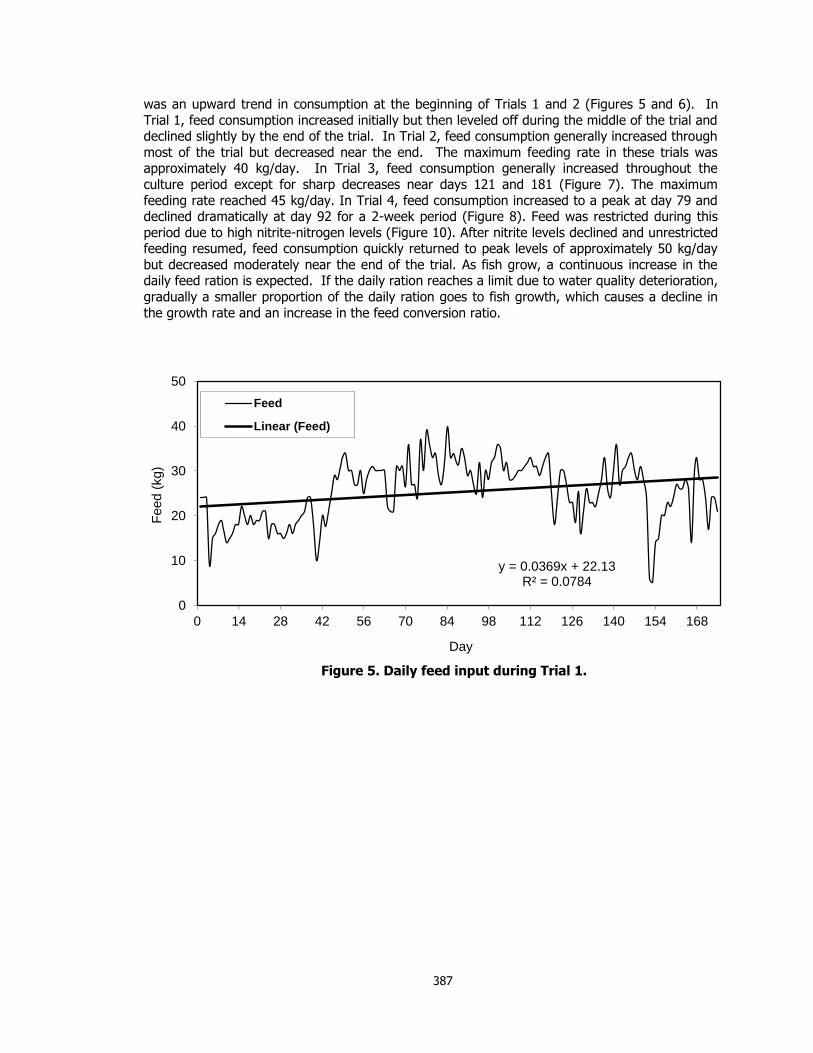
387
was an upward trend in consumption at the beginning of Trials 1 and 2 (Figures 5 and 6). In
Trial 1, feed consumption increased initially but then leveled off during the middle of the trial and declined slightly by the end of the trial. In Trial 2, feed consumption generally increased through
most of the trial but decreased near the end. The maximum feeding rate in these trials was approximately 40 kg/day. In Trial 3, feed consumption generally increased throughout the
culture period except for sharp decreases near days 121 and 181 (Figure 7). The maximum
feeding rate reached 45 kg/day. In Trial 4, feed consumption increased to a peak at day 79 and declined dramatically at day 92 for a 2-week period (Figure 8). Feed was restricted during this
period due to high nitrite-nitrogen levels (Figure 10). After nitrite levels declined and unrestricted feeding resumed, feed consumption quickly returned to peak levels of approximately 50 kg/day
but decreased moderately near the end of the trial. As fish grow, a continuous increase in the daily feed ration is expected. If the daily ration reaches a limit due to water quality deterioration,
gradually a smaller proportion of the daily ration goes to fish growth, which causes a decline in
the growth rate and an increase in the feed conversion ratio.
Figure 5. Daily feed input during Trial 1.
y = 0.0369x + 22.13 R² = 0.0784
0
10
20
30
40
50
0 14 28 42 56 70 84 98 112 126 140 154 168
Fe
ed (
kg)
Day
Feed
Linear (Feed)
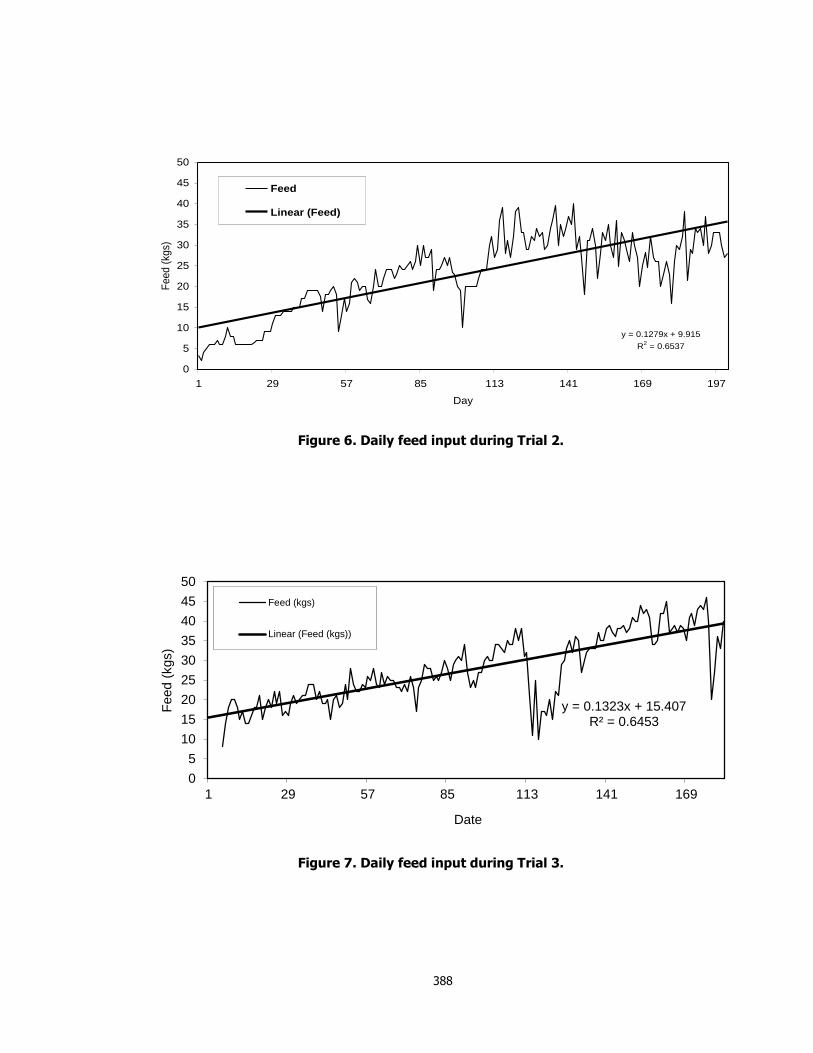
388
Figure 6. Daily feed input during Trial 2.
Figure 7. Daily feed input during Trial 3.
y = 0.1279x + 9.915
R2 = 0.6537
0
5
10
15
20
25
30
35
40
45
50
1 29 57 85 113 141 169 197
Day
Feed (
kgs)
Feed
Linear (Feed)
y = 0.1323x + 15.407 R² = 0.6453
0
5
10
15
20
25
30
35
40
45
50
1 29 57 85 113 141 169
Feed (
kgs)
Date
Feed (kgs)
Linear (Feed (kgs))
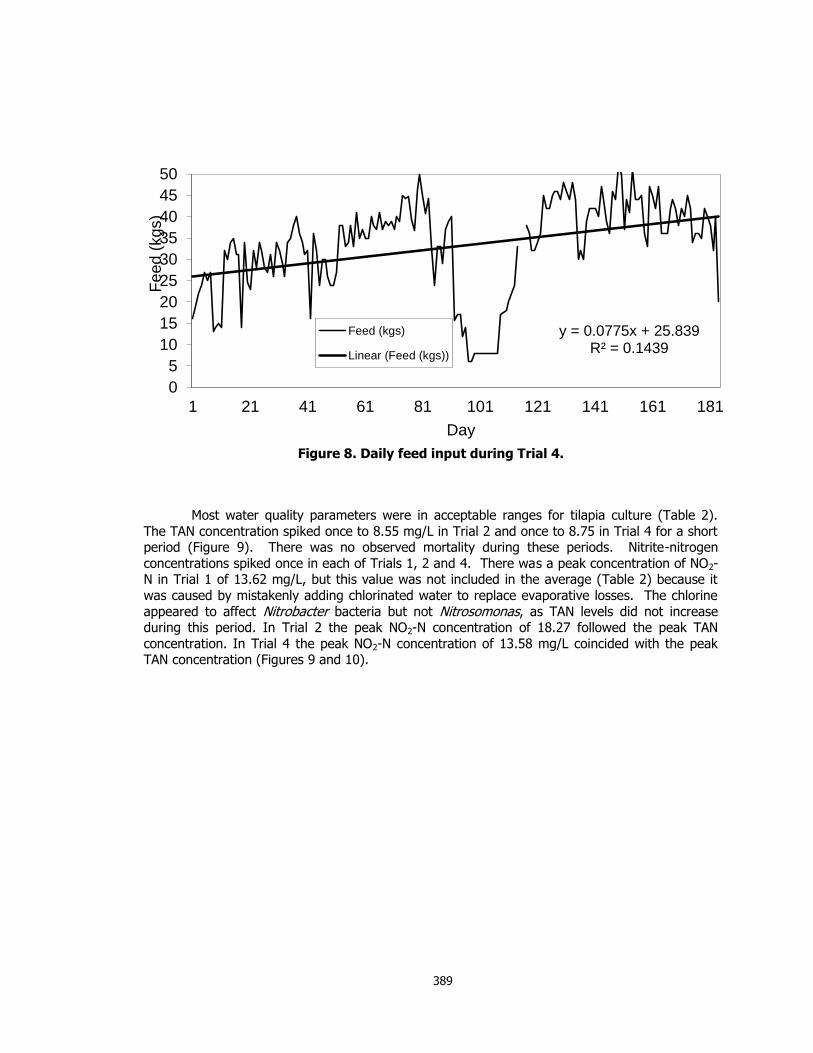
389
Figure 8. Daily feed input during Trial 4.
Most water quality parameters were in acceptable ranges for tilapia culture (Table 2).
The TAN concentration spiked once to 8.55 mg/L in Trial 2 and once to 8.75 in Trial 4 for a short period (Figure 9). There was no observed mortality during these periods. Nitrite-nitrogen
concentrations spiked once in each of Trials 1, 2 and 4. There was a peak concentration of NO2-N in Trial 1 of 13.62 mg/L, but this value was not included in the average (Table 2) because it
was caused by mistakenly adding chlorinated water to replace evaporative losses. The chlorine
appeared to affect Nitrobacter bacteria but not Nitrosomonas, as TAN levels did not increase during this period. In Trial 2 the peak NO2-N concentration of 18.27 followed the peak TAN
concentration. In Trial 4 the peak NO2-N concentration of 13.58 mg/L coincided with the peak TAN concentration (Figures 9 and 10).
y = 0.0775x + 25.839 R² = 0.1439
0
5
10
15
20
25
30
35
40
45
50
1 21 41 61 81 101 121 141 161 181
Fe
ed
(kg
s)
Day
Feed (kgs)
Linear (Feed (kgs))
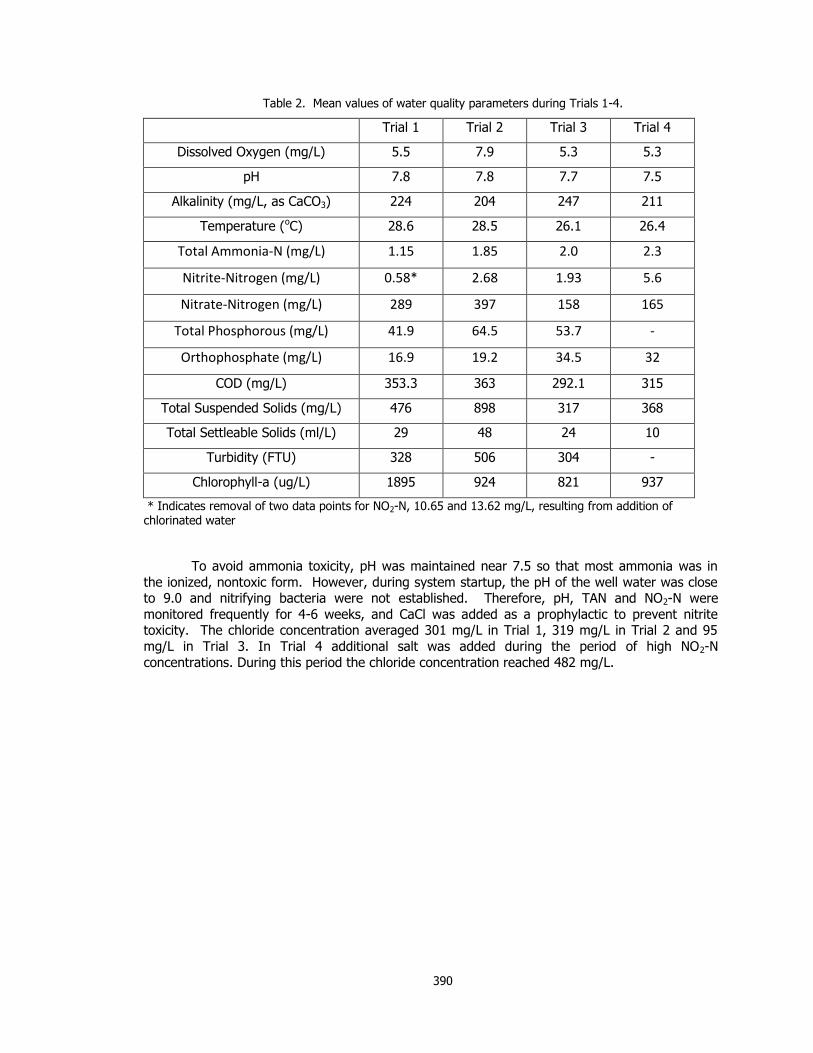
390
Table 2. Mean values of water quality parameters during Trials 1-4.
Trial 1 Trial 2 Trial 3 Trial 4
Dissolved Oxygen (mg/L) 5.5 7.9 5.3 5.3
pH 7.8 7.8 7.7 7.5
Alkalinity (mg/L, as CaCO3) 224 204 247 211
Temperature (oC) 28.6 28.5 26.1 26.4
Total Ammonia-N (mg/L) 1.15 1.85 2.0 2.3
Nitrite-Nitrogen (mg/L) 0.58* 2.68 1.93 5.6
Nitrate-Nitrogen (mg/L) 289 397 158 165
Total Phosphorous (mg/L) 41.9 64.5 53.7 -
Orthophosphate (mg/L) 16.9 19.2 34.5 32
COD (mg/L) 353.3 363 292.1 315
Total Suspended Solids (mg/L) 476 898 317 368
Total Settleable Solids (ml/L) 29 48 24 10
Turbidity (FTU) 328 506 304 -
Chlorophyll-a (ug/L) 1895 924 821 937
* Indicates removal of two data points for NO2-N, 10.65 and 13.62 mg/L, resulting from addition of chlorinated water
To avoid ammonia toxicity, pH was maintained near 7.5 so that most ammonia was in
the ionized, nontoxic form. However, during system startup, the pH of the well water was close to 9.0 and nitrifying bacteria were not established. Therefore, pH, TAN and NO2-N were
monitored frequently for 4-6 weeks, and CaCl was added as a prophylactic to prevent nitrite toxicity. The chloride concentration averaged 301 mg/L in Trial 1, 319 mg/L in Trial 2 and 95
mg/L in Trial 3. In Trial 4 additional salt was added during the period of high NO2-N
concentrations. During this period the chloride concentration reached 482 mg/L.
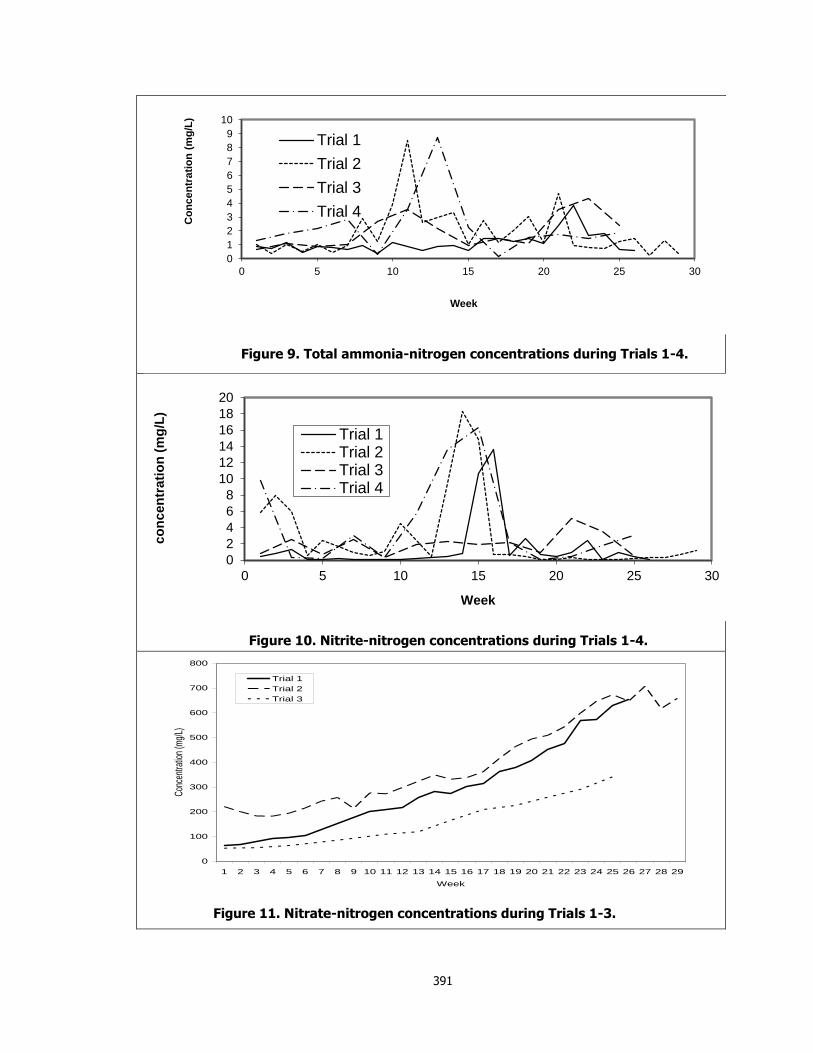
391
Figure 9. Total ammonia-nitrogen concentrations during Trials 1-4.
Figure 10. Nitrite-nitrogen concentrations during Trials 1-4.
Figure 11. Nitrate-nitrogen concentrations during Trials 1-3.
0
1
2
3
4
5
6
7
8
9
10
0 5 10 15 20 25 30
Co
nc
en
tra
tio
n (
mg
/L)
Week
Trial 1
Trial 2
Trial 3
Trial 4
0
2
4
6
8
10
12
14
16
18
20
0 5 10 15 20 25 30
co
ncen
trati
on
(m
g/L
)
Week
Trial 1Trial 2Trial 3Trial 4
0
100
200
300
400
500
600
700
800
1 2 3 4 5 6 7 8 9 10 11 12 13 14 15 16 17 18 19 20 21 22 23 24 25 26 27 28 29
Week
Con
cent
ratio
n (m
g/L)
Trial 1
Trial 2
Trial 3
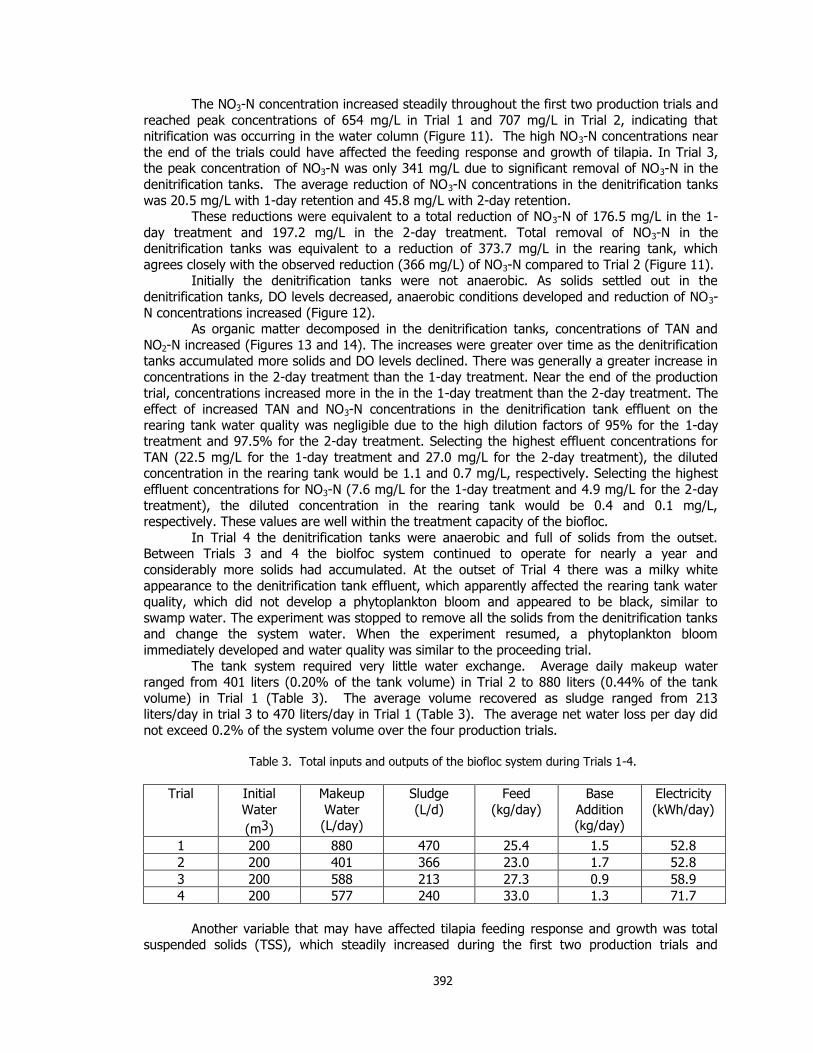
392
The NO3-N concentration increased steadily throughout the first two production trials and
reached peak concentrations of 654 mg/L in Trial 1 and 707 mg/L in Trial 2, indicating that nitrification was occurring in the water column (Figure 11). The high NO3-N concentrations near
the end of the trials could have affected the feeding response and growth of tilapia. In Trial 3, the peak concentration of NO3-N was only 341 mg/L due to significant removal of NO3-N in the
denitrification tanks. The average reduction of NO3-N concentrations in the denitrification tanks
was 20.5 mg/L with 1-day retention and 45.8 mg/L with 2-day retention. These reductions were equivalent to a total reduction of NO3-N of 176.5 mg/L in the 1-
day treatment and 197.2 mg/L in the 2-day treatment. Total removal of NO3-N in the denitrification tanks was equivalent to a reduction of 373.7 mg/L in the rearing tank, which
agrees closely with the observed reduction (366 mg/L) of NO3-N compared to Trial 2 (Figure 11). Initially the denitrification tanks were not anaerobic. As solids settled out in the
denitrification tanks, DO levels decreased, anaerobic conditions developed and reduction of NO3-
N concentrations increased (Figure 12). As organic matter decomposed in the denitrification tanks, concentrations of TAN and
NO2-N increased (Figures 13 and 14). The increases were greater over time as the denitrification tanks accumulated more solids and DO levels declined. There was generally a greater increase in
concentrations in the 2-day treatment than the 1-day treatment. Near the end of the production
trial, concentrations increased more in the in the 1-day treatment than the 2-day treatment. The effect of increased TAN and NO3-N concentrations in the denitrification tank effluent on the
rearing tank water quality was negligible due to the high dilution factors of 95% for the 1-day treatment and 97.5% for the 2-day treatment. Selecting the highest effluent concentrations for
TAN (22.5 mg/L for the 1-day treatment and 27.0 mg/L for the 2-day treatment), the diluted concentration in the rearing tank would be 1.1 and 0.7 mg/L, respectively. Selecting the highest
effluent concentrations for NO3-N (7.6 mg/L for the 1-day treatment and 4.9 mg/L for the 2-day
treatment), the diluted concentration in the rearing tank would be 0.4 and 0.1 mg/L, respectively. These values are well within the treatment capacity of the biofloc.
In Trial 4 the denitrification tanks were anaerobic and full of solids from the outset. Between Trials 3 and 4 the biolfoc system continued to operate for nearly a year and
considerably more solids had accumulated. At the outset of Trial 4 there was a milky white
appearance to the denitrification tank effluent, which apparently affected the rearing tank water quality, which did not develop a phytoplankton bloom and appeared to be black, similar to
swamp water. The experiment was stopped to remove all the solids from the denitrification tanks and change the system water. When the experiment resumed, a phytoplankton bloom
immediately developed and water quality was similar to the proceeding trial.
The tank system required very little water exchange. Average daily makeup water ranged from 401 liters (0.20% of the tank volume) in Trial 2 to 880 liters (0.44% of the tank
volume) in Trial 1 (Table 3). The average volume recovered as sludge ranged from 213 liters/day in trial 3 to 470 liters/day in Trial 1 (Table 3). The average net water loss per day did
not exceed 0.2% of the system volume over the four production trials.
Table 3. Total inputs and outputs of the biofloc system during Trials 1-4.
Trial
Initial
Water
(m3)
Makeup
Water (L/day)
Sludge
(L/d)
Feed
(kg/day)
Base
Addition (kg/day)
Electricity
(kWh/day)
1 200 880 470 25.4 1.5 52.8
2 200 401 366 23.0 1.7 52.8
3 200 588 213 27.3 0.9 58.9
4 200 577 240 33.0 1.3 71.7
Another variable that may have affected tilapia feeding response and growth was total suspended solids (TSS), which steadily increased during the first two production trials and
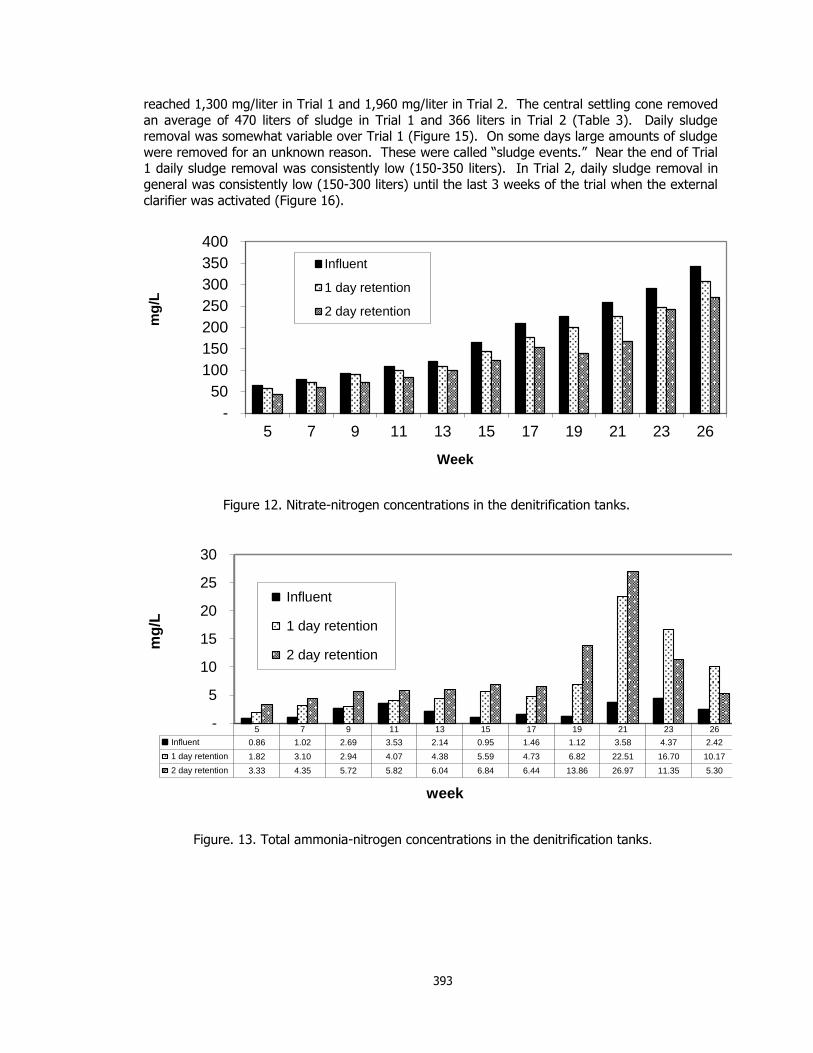
393
reached 1,300 mg/liter in Trial 1 and 1,960 mg/liter in Trial 2. The central settling cone removed
an average of 470 liters of sludge in Trial 1 and 366 liters in Trial 2 (Table 3). Daily sludge removal was somewhat variable over Trial 1 (Figure 15). On some days large amounts of sludge
were removed for an unknown reason. These were called ―sludge events.‖ Near the end of Trial 1 daily sludge removal was consistently low (150-350 liters). In Trial 2, daily sludge removal in
general was consistently low (150-300 liters) until the last 3 weeks of the trial when the external
clarifier was activated (Figure 16).
Figure 12. Nitrate-nitrogen concentrations in the denitrification tanks.
Figure. 13. Total ammonia-nitrogen concentrations in the denitrification tanks.
-
50
100
150
200
250
300
350
400
5 7 9 11 13 15 17 19 21 23 26
mg
/L
Week
Influent
1 day retention
2 day retention
5 7 9 11 13 15 17 19 21 23 26
Influent 0.86 1.02 2.69 3.53 2.14 0.95 1.46 1.12 3.58 4.37 2.42
1 day retention 1.82 3.10 2.94 4.07 4.38 5.59 4.73 6.82 22.51 16.70 10.17
2 day retention 3.33 4.35 5.72 5.82 6.04 6.84 6.44 13.86 26.97 11.35 5.30
-
5
10
15
20
25
30
mg
/L
week
Influent
1 day retention
2 day retention
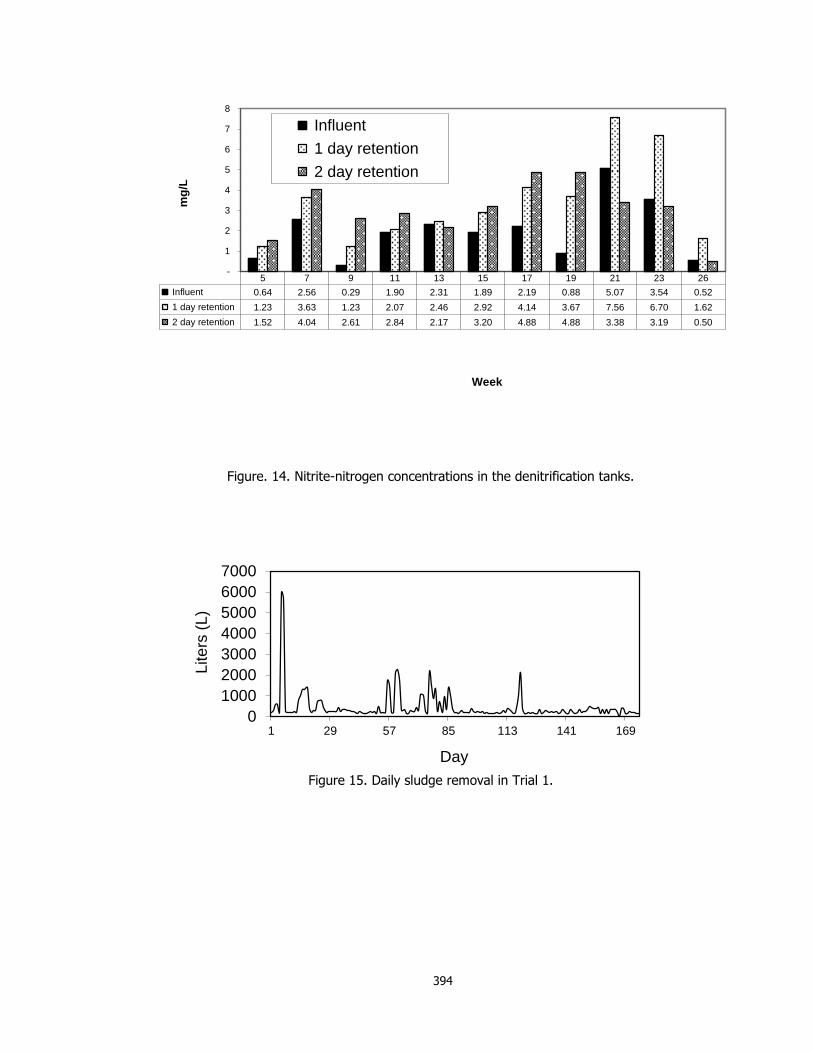
394
Figure. 14. Nitrite-nitrogen concentrations in the denitrification tanks.
5 7 9 11 13 15 17 19 21 23 26
Influent 0.64 2.56 0.29 1.90 2.31 1.89 2.19 0.88 5.07 3.54 0.52
1 day retention 1.23 3.63 1.23 2.07 2.46 2.92 4.14 3.67 7.56 6.70 1.62
2 day retention 1.52 4.04 2.61 2.84 2.17 3.20 4.88 4.88 3.38 3.19 0.50
-
1
2
3
4
5
6
7
8
mg
/L
Week
Influent
1 day retention
2 day retention
Figure 16. Daily sludge removal in Trial 2
0
1000
2000
3000
4000
5000
6000
7000
1 29 57 85 113 141 169
Lite
rs (
L)
Day
Figure 15. Daily sludge removal in Trial 1.

395
As each trial progressed, the buildup of TSS could be observed by the appearance of the
water. There were clear streaks in the culture water that looked like solids were settling as the water circulated around the perimeter. However, the current was fast and re-suspended the
solids on each pass through the horizontal mixing device. Water circulated completely around the perimeter of the tank every 2.5 minutes, a horizontal velocity of 20 m/minute. This
phenomenon was most apparent in the last few weeks of the production trial when TSS levels
were near their peak. At the end of Trials 1 and 2 a sample of culture water was collected and sampled for TSS every 5 minutes over a 30-minute period. The settling curves show that 89% of
the solids settled out in 30 minutes (Figure 17). In Trial 2, 84% of the solids settled out in 5 minutes. These results showed that the mixing was too rapid for
Figure 17. Total suspended solids settling curve for Trials 1 and 2.
suspended solids to settle out in the central cone for effective removal on a daily basis. As TSS increased, it likely affected the fish directly through physical irritation of the gills, exerted a high
biochemical oxygen demand (BOD) and led to secondary ammonification. Paradoxically, rapid
mixing and high TSS levels created an effective biofilter. An external clarifier was installed to reduce TSS levels in during the last 3 weeks of Trial 2.
The solids removal efficiency of the external clarifier was 88.5% (Table 4). The effectiveness of the external clarifier is clearly indicated in Figure 18. Sludge TSS was 26,230
mg/L, which is 2.6% dry weight solids. During the first 6 days of operation, the external clarifier
removed 175.5 kg of dry weight solids from the rearing tank compared to 5.9 kg of dry weight solids removal by the central cone (Table 5). During this 6-day period, the external clarifier
0
200
400
600
800
1000
1200
1400
1600
1800
2000
0 5 10 15 20 25 30
Time (min)
Concentr
ation (
mg/L
)
Trial 1
Trial 2
0
1000
2000
3000
4000
5000
6000
7000
Lite
rs (
L)
Day
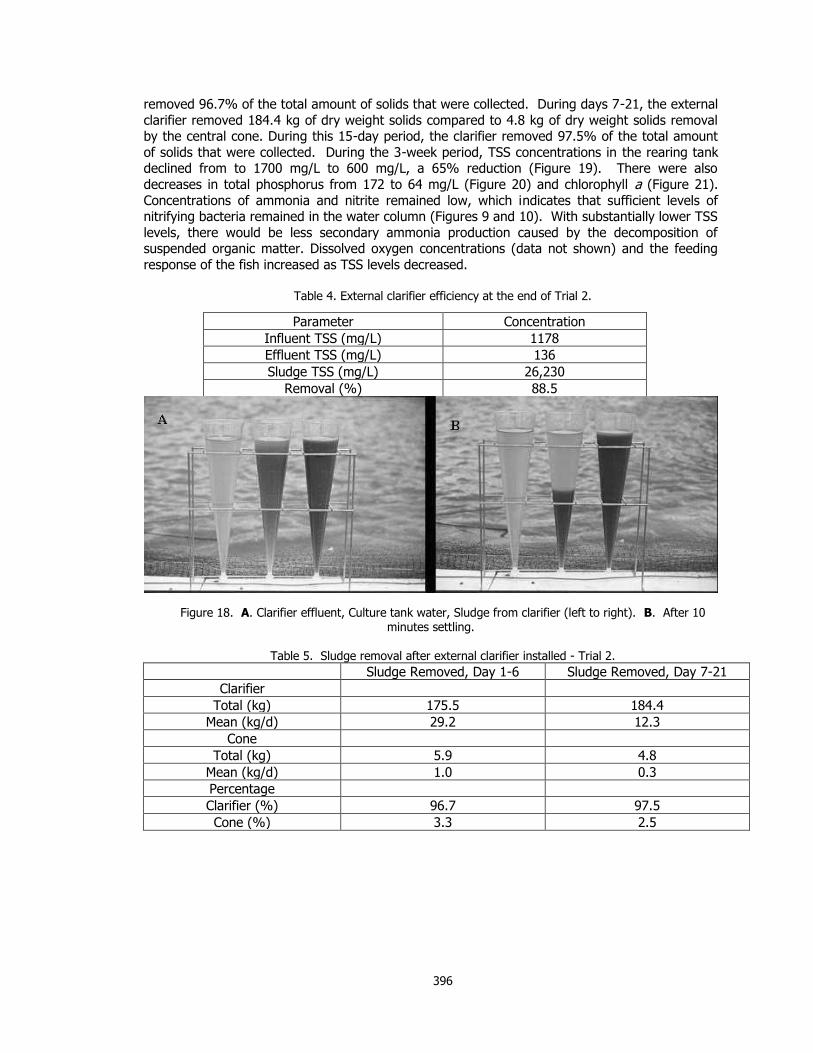
396
removed 96.7% of the total amount of solids that were collected. During days 7-21, the external
clarifier removed 184.4 kg of dry weight solids compared to 4.8 kg of dry weight solids removal by the central cone. During this 15-day period, the clarifier removed 97.5% of the total amount
of solids that were collected. During the 3-week period, TSS concentrations in the rearing tank declined from to 1700 mg/L to 600 mg/L, a 65% reduction (Figure 19). There were also
decreases in total phosphorus from 172 to 64 mg/L (Figure 20) and chlorophyll a (Figure 21).
Concentrations of ammonia and nitrite remained low, which indicates that sufficient levels of nitrifying bacteria remained in the water column (Figures 9 and 10). With substantially lower TSS
levels, there would be less secondary ammonia production caused by the decomposition of suspended organic matter. Dissolved oxygen concentrations (data not shown) and the feeding
response of the fish increased as TSS levels decreased.
Table 4. External clarifier efficiency at the end of Trial 2.
Parameter Concentration
Influent TSS (mg/L) 1178
Effluent TSS (mg/L) 136
Sludge TSS (mg/L) 26,230
Removal (%) 88.5
Figure 18. A. Clarifier effluent, Culture tank water, Sludge from clarifier (left to right). B. After 10 minutes settling.
Table 5. Sludge removal after external clarifier installed - Trial 2.
Sludge Removed, Day 1-6 Sludge Removed, Day 7-21
Clarifier
Total (kg) 175.5 184.4
Mean (kg/d) 29.2 12.3
Cone
Total (kg) 5.9 4.8
Mean (kg/d) 1.0 0.3
Percentage
Clarifier (%) 96.7 97.5
Cone (%) 3.3 2.5
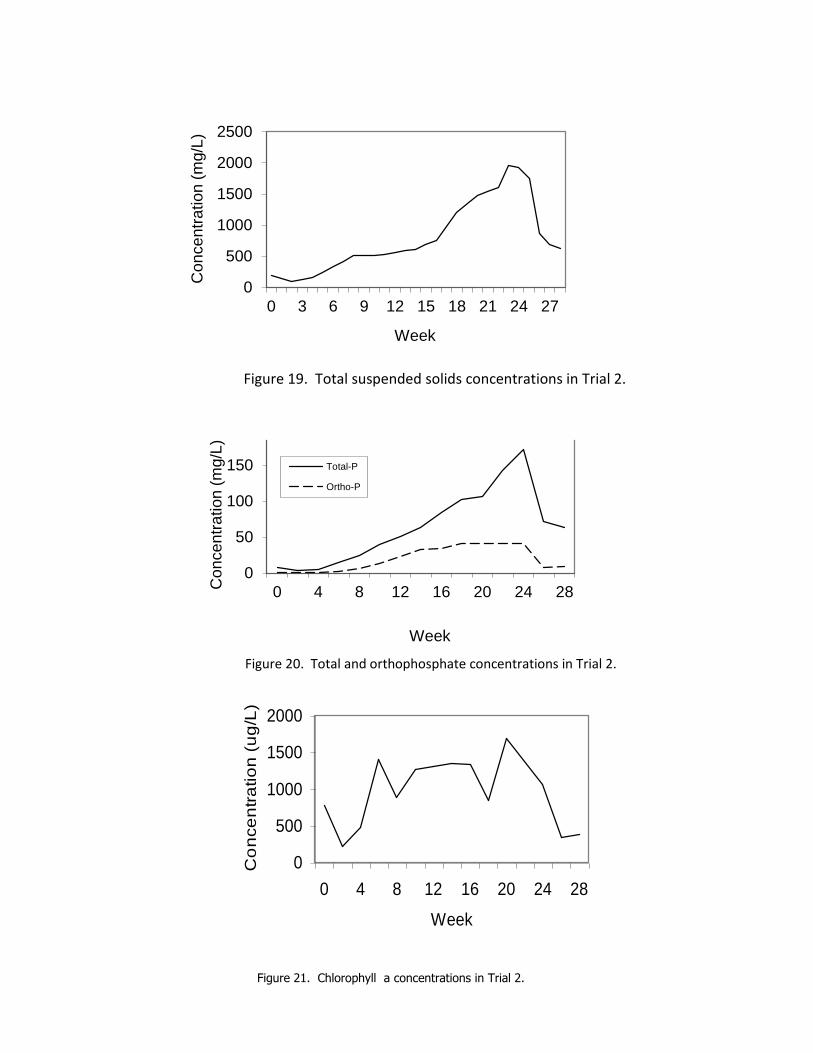
397
Figure 20. Total and orthophosphate concentrations in Trial 2.
0
500
1000
1500
2000
2500
0 3 6 9 12 15 18 21 24 27
Con
ce
ntr
ation
(m
g/L
)
Week
Figure 21. Chlorophyll a concentrations in Trial 2.
0
50
100
150
200
0 4 8 12 16 20 24 28Con
ce
ntr
ation
(m
g/L
)
Week
Total-P
Ortho-P
Figure 20. Total and orthophosphate concentrations in Trial 2.
Figure 19. Total suspended solids concentrations in Trial 2.
0
500
1000
1500
2000
0 4 8 12 16 20 24 28
Week
Co
nce
ntr
atio
n (
ug
/L)
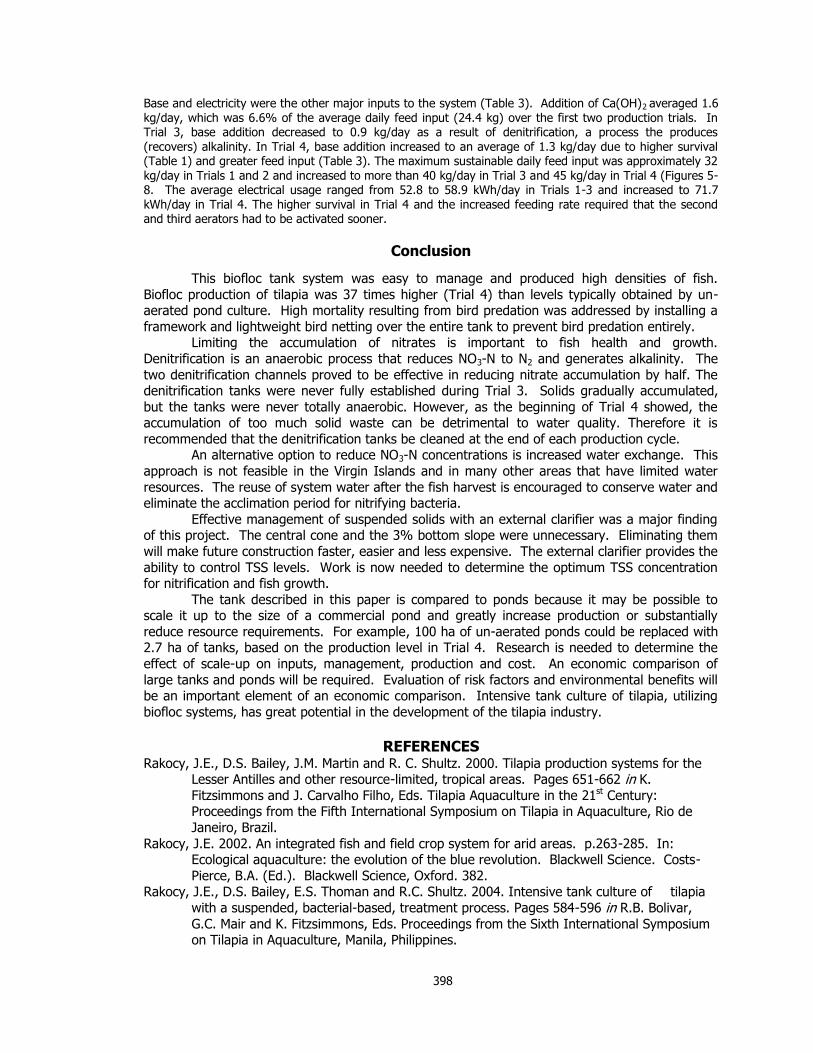
398
Base and electricity were the other major inputs to the system (Table 3). Addition of Ca(OH)2 averaged 1.6 kg/day, which was 6.6% of the average daily feed input (24.4 kg) over the first two production trials. In Trial 3, base addition decreased to 0.9 kg/day as a result of denitrification, a process the produces (recovers) alkalinity. In Trial 4, base addition increased to an average of 1.3 kg/day due to higher survival (Table 1) and greater feed input (Table 3). The maximum sustainable daily feed input was approximately 32 kg/day in Trials 1 and 2 and increased to more than 40 kg/day in Trial 3 and 45 kg/day in Trial 4 (Figures 5-8. The average electrical usage ranged from 52.8 to 58.9 kWh/day in Trials 1-3 and increased to 71.7 kWh/day in Trial 4. The higher survival in Trial 4 and the increased feeding rate required that the second and third aerators had to be activated sooner.
Conclusion
This biofloc tank system was easy to manage and produced high densities of fish.
Biofloc production of tilapia was 37 times higher (Trial 4) than levels typically obtained by un-aerated pond culture. High mortality resulting from bird predation was addressed by installing a
framework and lightweight bird netting over the entire tank to prevent bird predation entirely. Limiting the accumulation of nitrates is important to fish health and growth.
Denitrification is an anaerobic process that reduces NO3-N to N2 and generates alkalinity. The
two denitrification channels proved to be effective in reducing nitrate accumulation by half. The denitrification tanks were never fully established during Trial 3. Solids gradually accumulated,
but the tanks were never totally anaerobic. However, as the beginning of Trial 4 showed, the accumulation of too much solid waste can be detrimental to water quality. Therefore it is
recommended that the denitrification tanks be cleaned at the end of each production cycle. An alternative option to reduce NO3-N concentrations is increased water exchange. This
approach is not feasible in the Virgin Islands and in many other areas that have limited water
resources. The reuse of system water after the fish harvest is encouraged to conserve water and eliminate the acclimation period for nitrifying bacteria.
Effective management of suspended solids with an external clarifier was a major finding of this project. The central cone and the 3% bottom slope were unnecessary. Eliminating them
will make future construction faster, easier and less expensive. The external clarifier provides the
ability to control TSS levels. Work is now needed to determine the optimum TSS concentration for nitrification and fish growth.
The tank described in this paper is compared to ponds because it may be possible to scale it up to the size of a commercial pond and greatly increase production or substantially
reduce resource requirements. For example, 100 ha of un-aerated ponds could be replaced with 2.7 ha of tanks, based on the production level in Trial 4. Research is needed to determine the
effect of scale-up on inputs, management, production and cost. An economic comparison of
large tanks and ponds will be required. Evaluation of risk factors and environmental benefits will be an important element of an economic comparison. Intensive tank culture of tilapia, utilizing
biofloc systems, has great potential in the development of the tilapia industry.
REFERENCES
Rakocy, J.E., D.S. Bailey, J.M. Martin and R. C. Shultz. 2000. Tilapia production systems for the Lesser Antilles and other resource-limited, tropical areas. Pages 651-662 in K.
Fitzsimmons and J. Carvalho Filho, Eds. Tilapia Aquaculture in the 21st Century: Proceedings from the Fifth International Symposium on Tilapia in Aquaculture, Rio de
Janeiro, Brazil.
Rakocy, J.E. 2002. An integrated fish and field crop system for arid areas. p.263-285. In: Ecological aquaculture: the evolution of the blue revolution. Blackwell Science. Costs-
Pierce, B.A. (Ed.). Blackwell Science, Oxford. 382. Rakocy, J.E., D.S. Bailey, E.S. Thoman and R.C. Shultz. 2004. Intensive tank culture of tilapia
with a suspended, bacterial-based, treatment process. Pages 584-596 in R.B. Bolivar,
G.C. Mair and K. Fitzsimmons, Eds. Proceedings from the Sixth International Symposium on Tilapia in Aquaculture, Manila, Philippines.
399
Tilapia Production Using BioFloc Technology (BFT)
Yoram Avnimelech
Dept. of Civil & Environmental Eng.,Technion, Israel Inst. Of Technology Haifa, 32000, Israel
ABSTRACT
Production of tilapia, for home or local consumption and for export, has been raised
tremendously in the last few decades. The tonnage of world wide tilapia production (in 2010, about 3 million tons) is second, among fish, only to carps. Global production of tilapia was
estimated to be 2.5 billion US$ in 2010. The present trends indicate a continuous growth of production and expanded penetration of that fish to a variety of markets, from expensive
restaurants to local households all around the world.
Higher production levels are needed and anticipated; however, increasing aquaculture production is limited, globally, by the severe limitations of water and availability of suitable land.
The only feasible and environmentally acceptable way to raise aquaculture production is by the use of intensive systems. The choice of suitable intensive systems to produce commodity fish is
limited due to the need to produce the fish at a cost lower than the market price. One of the systems that enable intensification at a relatively reasonable investment and running costs is
biofloc technology.
Biofloc technology is based upon the running of the pond using minimal water exchange, subsequent development of dense microbial population and managing the microbial population
through the adjustment of the C/N ratio so that it controls inorganic nitrogen concentration in the water. The bacteria, forming bioflocs, assimilate TAN, produce microbial proteins and enable to
recycle the unused feed protein. BFT systems are widely used for shrimp production world wide.
(For more details: Yoram Avnimelech, Biofloc Technology, A Practical Handbook, World Aquaculture Soc. 2010). Tilapia is ideally adapted to BFT systems. It is herbivore, essentially a
filter-feeder adapted to the harvest of bioflocs suspended in the water, it can grow and flourish in dense systems and is overall a strong and stable fish. Using BFT systems for tilapia production is
an obvious choice.
INTRODUCTION
An essential feature of BFT tilapia production systems, especially as compared to shrimp
systems, is the very high biomass. In our experience, tilapia biomass can reach 20-30 kg/m3 (200-300 ton/ha), as compared to shrimp biomass of about 2 kg/m3 (20 tons/ha) in very good
ponds. This difference is a very significant feature for minimal water exchange systems. The
daily TAN release, if untreated and left in the water is high enough to lead to fish mortality. Two microbial mediated processes are acting in BFT systems to control TAN concentrations.
One microbial process taking place is nitrification that converts the toxic ammonia and nitrite to nitrate. Another process quite specific to BFT systems is the assimilation of TAN by
heterotrophic bacteria into microbial protein. In systems with high levels of available carbon as compared to nitrogen (C/N ratio > 15), bacteria utilize the carbon as a building stone of new cell
material, yet, since microbial cells are made of protein, they need nitrogen and take up
ammonium from the water. Both experience and theory demonstrates that when C/N is higher than 15 (15-20), TAN concentration is kept low. It is important to notice that both processes
can take place only if the proper microbial consortia are present in sufficient levels in the water. The heterotrophic consortia develop rather fast following the build up of organic matter in the
water. Nitrifying community develops slowly and it takes about 4 weeks before it reaches its
capacity, unless proper inoculum is applied. Microbial assimilation of nitrogen has a high capacity to control nitrogen levels in the
water. Microbial protein is produced concomitantly, and may serve as a high quality feed source to fish. In dense microbial systems (Bacterial density in BFT systems is 107 - 10 cells/ml); the
400
bacteria stick together with many other organisms and organic particles, forming bioflocs that
range in size from 0.1 to a few mm. Such particles are easily harvested and assimilated by tilapia. The amounts of protein stored in the bioflocs are very significant. In a typical pond, even if only
50% of the excreted TAN (i.e. 7 mg N/l) is assimilated and available as a fish feed, this process adds, in any given day, 45 mg protein/l, an amount equivalent to feeding with 30% protein
pellets at a daily ration of 150 mg/l or 150 g/m3. This is a significant contribution to the feed.
Moreover, unlike the applied feed, the bioflocs are harvested and utilized by the fish continuously all day long. Observing feeding behavior of tilapia growing in BFT pond with tilapia in equivalent
control ponds, it could be seen that fish in the control ponds were very hungry and rushed wildly to the feed pellets that were applied twice a day, while tilapia growing at the BFT ponds ate
quietly, showing that they were not starved before feeding. It is expected that the semi continuous feeding through the harvest of the bioflocs will help the smaller fish that hardly
compete with larger fish in regular ponds, and thus higher uniformity is expected In BFT ponds.
Total suspended solids (TSS) accumulate in the pond at a fast rate when fish biomass is high. As to be discussed later, TSS or biofloc volume has to be monitored. The desired microbial
community and reserves of feed are associated with the TSS. Thus we should not release it carelessly out of the pond. However, excessive levels of TSS are not favorable since it adds to
oxygen consumption and at very high levels may clog the gills of the fish. In addition, if water
mixing is not well controlled, or when TSS concentration exceeds the mixing capacity of the system, solid particles settle down and may accumulate and create anaerobic layer or pockets.
The existence of anaerobic sites in the pond bottom may lead to the production of toxic reduced compounds and eventually severely hamper fish growth. TSS levels may be controlled by
drainage of sludge, proper mixing of the water and good design of pond bottom. This is one of the essential controls in BFT tilapia production systems.
Feeding is an important control means. Proper feeding enables one to get the proper C/N
ratio (>15) that will promote the uptake of ammonium from the water. In addition, proper feed strategy is required to utilize the recycled microbial protein, to reduce costs and to minimize
residues. There is a need for more research in order to get the right feed composition and ration. Some questions are still open.
a. The recommended C/N ratio can be obtained by either feeding with pellets of low
protein percentage or by augmenting the feed pellets through the application of carbonaceous material (molasses, cassava, wheat or other flour, etc.). The first option may save labor.
However we rely upon the passage and excretion of the added carbohydrates through the fish to be used by the bacteria. This assumption may not hold.
b. Feed rations can be lower than the ones used in conventional tilapia ponds. With
shrimp in tanks it was found that feed ration can be reduced by 30% as compared to conventional systems. It was estimated, but not proven, that feed ration in tilapia BFT systems
can be lowered be at least 20% as compared with conventional systems. Oxygen consumption in intensive BFT tilapia culture is rather high, both due to the
respiration of the dense fish biomass as well as due to respiration of the microbial community that metabolize the organic residues. Oxygen consumption was estimated or modeled by several
scientists however, there are a number of critical assumptions depended on specific pond
conditions. The range of required aeration is 10-20 hp for a pond of 1000m2. The exact aeration rate needed for a given pond under given conditions should be adjusted following the daily
determination of oxygen in the pond, normally setting a minimal level of 4 mgO2/l. One should adjust aerator usage to the size of the fish and pond's biomass. Usually, lower aeration can be
applied at the start of the cycle when fish biomass is low, though it is recommended to utilize the
capacity of the pond by stocking large number of fingerlings and maintain a relatively constant biomass by appropriate transfers.
Proper placement of aerators is very important. Most pond aeration deployment is made in a way to obtain a circular movement of water so as to concentrate the settled particles as
close as possible to the center drain. However, there are conflicting demands in this matter. We want to be able to effectively drain out the excessive sludge, yet we want to keep bioflocs
401
suspended in the water. To prevent a fast sedimentation of particles near the center drain, it is
advised to place an aspirator type aerator or air-lifts to resuspend particles sedimenting at the center. By properly adjusting the location of these units, we can approach an optimum of
resuspending the less dense bioflocs while sedimenting and eventually draining the heavier particles.
An important role of the aeration system is to properly mix the water and to
prevent build up of sludge piles in locations were it is not effectively drained out. In case one finds such accumulation, aerators deployment has to be adjusted as soon as possible. Placement
of aerators is still an art, we lack models and we do not have appropriate aerators in the market. A very important demand is to have a sensitive and reliable monitoring and backup
system. A fault in the aeration when the fish biomass is so high may be critical if no backup is activated within less than an hour.
Intensive tilapia BFT ponds are rather small, 100 -1000m2, mostly due to the difficulty in
the perfect mixing of a large water body. Most ponds are round or square with rounded corners, the floor of the pond slopes toward the center to facilitate sludge concentration in the center. A
central drain is located in the center, operated using a stand pipe or a valve. The drain is opened usually twice daily, letting the dark sludge to drain out, till a point when clear pond water is
exiting.
Though the BFT tilapia ponds are rather simple to operate, the system demands a careful monitoring and a fast response to defects, when ever detected. It has to be remembered that
the pond is highly loaded and that any fault not responded to, may develop and become critical. Normal aquaculture monitoring is certainly needed. Of special importance are the following
parameters: a. Oxygen, if oxygen is high, you can reduce number of applied aerators to save
electricity. However, if O2 is less than 4 mg/l, add aerators.
b. TAN. Low TAN concentration (<0.5 mg/l) means that the system works fine. You may consider lowering carbon addition. If TAN increases respond quickly by raising carbon addition.
c. NO2. Nitrite may negatively affect tilapia, yet the effect is limited in salty water. However, an increase in NO2 may be an indication of the build up of anaerobic sites. In case of
an increase of nitrite one should carefully check the presence of sludge piles in the pond and if
found change aerators deployment. d. Floc volume (FV) determination using Imhoff cones is easy and cheap. FV should be
in the range of 5-50 ml/l. If it is too low add carbohydrates and in cases it is higher than 50 raise sludge removal.
Summary
Biofloc systems enable to intensify tilapia production. The fish is adaptable to conditions
in BFT systems, grows well, harvest the bioflocs and utilize them as a feed source. The recycling of feed and minimization of water exchange are important contribution to the economy of tilapia
production. Understanding the system, monitoring and fast response to negative developments
are essential to the success of the culture.

402
Tilapia production using biofloc technology (BFT)
Yoram Avnimelech
Dept. of Civil & Environmental Eng. Technion, Israel Inst. Of Technology
Haifa, 32000, Israel [email protected]
ABSTRACT
Bio Floc Technology (BFT) is a new approach toward management of ponds, in most
cases intensive tilapia or shrimp ponds. Water scarcity, the demand for bio-security and economy, all leads to minimizing water exchange, even down to zero. Under these conditions, a
major problem is the accumulation of ammonia and nitrite, both toxic to shrimp and fish. One
way to solve this is to recycle the water through a bio-filter system. Recirculating Aquaculture Systems (RAS) are known to work well, yet they have two major problems: First they are
expensive in both investment and maintenance and secondly, they recycle water but do not recycle feed residues. Feed is becoming more and more expensive and its recycling is essential.
An alternative approach, the Bio Floc Technology (BFT) is based upon the activity of the microbial community within the pond. Water treatment is done within the pond, with no need for
a separate water treatment compartment. Very dense microbial community develops when water
exchange is limited. Typically, we find 10-1000 million microbial cells (107-109) in 1 cm3 of pond water. If we add carbonaceous material (molasses, starch, tapioca and others) to adjust the C/N
ratio in feeds to 15-20, the microbes take up the ammonium from the water and create microbial protein. By the adjustment of the C/N ratio, the nitrogen problem can be easily and consistently
solved as described and formulated by Avnimelech (1999).
An important feature of BFT is the ability to recycle proteins. In conventional
aquaculture, only about 20-25% of feed protein is retained by fish or shrimp. The rest is excreted to the water, mostly as ammonium. In BFT the ammonium is converted to microbial protein
(through the addition of carbohydrates), that can be used as a protein source. The micro-organisms in the water tend to aggregate and form bio-flocs that can be filtered and harvested
by tilapia or shrimp. It was found, using 15N tagging of bio flocs, that more that 20% of protein
eaten by shrimp or fish growing in BFT systems comes from bio flocs harvesting. The amount of feed protein retained in BFT systems is double than that in traditional ponds, since the protein is
practically used twice: Once when pellets are eaten by fish and then when the bio flocs are harvested. The doubled feed efficiency is a very important factor, especially now, when feed
costs are rising. Both protein recycling and water quality control are achieved through the
addition of carbonaceous feed and adjustment of the C/N ratio.
Extensive work had been done on the composition and nutritive value of the flocs. A detailed work by Tacon and coworkers (2003) demonstrated the presence of more than 30%
protein, containing essential amino acids in sufficient quantities. In addition, it was demonstrated that the microbial flocs contain vitamins and trace metals enabling to omit those from the feed,
saving about 25% of the Protein is an expensive feed component. In addition, it is, at least
partially, made of fish meal, a component that is scarce and its harvest in the ocean leads to environmental damage. Thus, the fact that protein utilization rises from 15-25% in conventional
ponds to 45% in BFT is very important. The utilization of microbial flocs as a source of feed protein leads to a lower expenditure on feed. Avnimelech reported that feed cost for tilapia
production was lowered from $0.84/kg fish in conventional ponds to $0.58 in BFT. McIntosh
reported that feed cost using the lowered protein diet in Belize Aquaculture was about 50% as compared to conventional shrimp farming.
403
BFT systems are environmentally friendly, mostly due to the fact that there is almost no
release of nutrient rich drainage water to the environment. According to existing calculations and farm experience, BFT is a way to grow shrimp or fish (tilapia) in a profitable way, saving in
investment and maintenance and lowering disease outbreaks.
INTRODUCTION
Production of tilapia, for home or local consumption and for export, has been raised
tremendously in the last few decades. The tonnage of world wide tilapia production (in 2010, about 3 million tons) is second, among fish, only to carps. Global production of tilapia was
estimated to be 2.5 billion US$ in 2010. The present trends indicate a continuous growth of
production and expanded penetration of that fish to a variety of markets, from expensive restaurants to local households all around the world.
Higher production levels are needed and anticipated; however, increasing aquaculture
production is limited, globally, by the severe limitations of water and availability of suitable land. The only feasible and environmentally acceptable way to raise aquaculture production is by the
use of intensive systems. The choice of suitable intensive systems to produce commodity fish is
limited due to the need to produce the fish at a cost lower than the market price. One of the systems that enable intensification at a relatively reasonable investment and running costs is
biofloc technology.
Biofloc technology is based upon the running of the pond using minimal water exchange,
subsequent development of dense microbial population and managing the microbial population through the adjustment of the C/N ratio so that it controls inorganic nitrogen concentration in the
water. The bacteria, forming bioflocs, assimilate TAN, produce microbial proteins and enable to recycle the unused feed protein. BFT systems are widely used for shrimp production world wide.
(For more details: Yoram Avnimelech, Biofloc Technology, A Practical Handbook, World Aquaculture Soc. 2010).
Tilapia is ideally adapted to BFT systems. It is herbivore, essentially a filter-feeder adapted to the harvest of bioflocs suspended in the water, it can grow and flourish in dense
systems and is overall a strong and stable fish. Using BFT systems for tilapia production is an obvious choice. An essential feature of BFT tilapia production systems, especially as compared
to shrimp systems, is the very high biomass. In our experience, tilapia biomass can reach 20-30
kg/m3 (200-300 ton/ha), as compared to shrimp biomass of about 2 kg/m3 (20 tons/ha) in very good ponds. This difference is a very significant feature for minimal water exchange systems.
The daily TAN release, if untreated and left in the water is high enough to lead to fish mortality. Two microbial mediated processes are acting in BFT systems to control TAN concentrations.
One microbial process taking place is nitrification that converts the toxic ammonia and
nitrite to nitrate. Another process quite specific to BFT systems is the assimilation of TAN by
heterotrophic bacteria into microbial protein. In systems with high levels of available carbon as compared to nitrogen (C/N ratio > 15), bacteria utilize the carbon as a building stone of new cell
material, yet, since microbial cells are made of protein, they need nitrogen and take up ammonium from the water. Both experience and theory demonstrates that when C/N is higher
than 15 (15-20), TAN concentration is kept low.
It is important to notice that both processes can take place only if the proper microbial
consortia are present in sufficient levels in the water. The heterotrophic consortia develop rather fast following the build up of organic matter in the water. Nitrifying community develops slowly
and it takes about 4 weeks before it reaches its capacity, unless proper inoculum is applied.
Microbial assimilation of nitrogen has a high capacity to control nitrogen levels in the water.
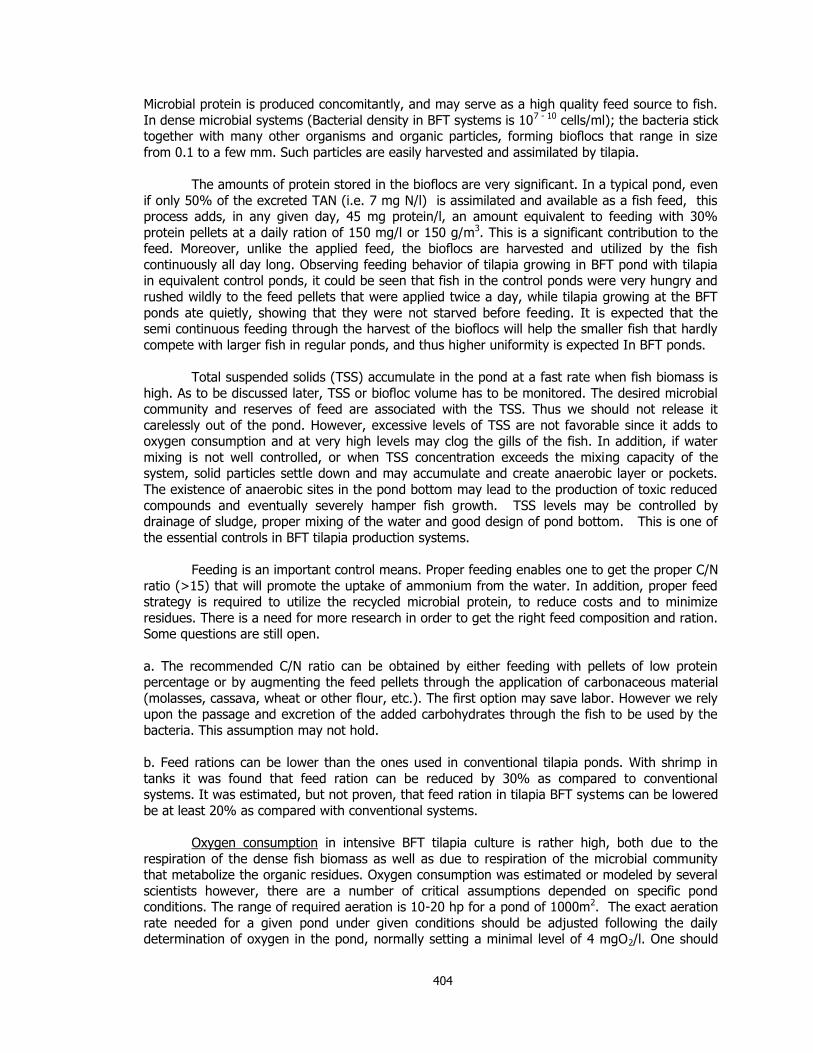
404
Microbial protein is produced concomitantly, and may serve as a high quality feed source to fish.
In dense microbial systems (Bacterial density in BFT systems is 107 - 10 cells/ml); the bacteria stick together with many other organisms and organic particles, forming bioflocs that range in size
from 0.1 to a few mm. Such particles are easily harvested and assimilated by tilapia.
The amounts of protein stored in the bioflocs are very significant. In a typical pond, even
if only 50% of the excreted TAN (i.e. 7 mg N/l) is assimilated and available as a fish feed, this process adds, in any given day, 45 mg protein/l, an amount equivalent to feeding with 30%
protein pellets at a daily ration of 150 mg/l or 150 g/m3. This is a significant contribution to the feed. Moreover, unlike the applied feed, the bioflocs are harvested and utilized by the fish
continuously all day long. Observing feeding behavior of tilapia growing in BFT pond with tilapia in equivalent control ponds, it could be seen that fish in the control ponds were very hungry and
rushed wildly to the feed pellets that were applied twice a day, while tilapia growing at the BFT
ponds ate quietly, showing that they were not starved before feeding. It is expected that the semi continuous feeding through the harvest of the bioflocs will help the smaller fish that hardly
compete with larger fish in regular ponds, and thus higher uniformity is expected In BFT ponds.
Total suspended solids (TSS) accumulate in the pond at a fast rate when fish biomass is
high. As to be discussed later, TSS or biofloc volume has to be monitored. The desired microbial community and reserves of feed are associated with the TSS. Thus we should not release it
carelessly out of the pond. However, excessive levels of TSS are not favorable since it adds to oxygen consumption and at very high levels may clog the gills of the fish. In addition, if water
mixing is not well controlled, or when TSS concentration exceeds the mixing capacity of the system, solid particles settle down and may accumulate and create anaerobic layer or pockets.
The existence of anaerobic sites in the pond bottom may lead to the production of toxic reduced
compounds and eventually severely hamper fish growth. TSS levels may be controlled by drainage of sludge, proper mixing of the water and good design of pond bottom. This is one of
the essential controls in BFT tilapia production systems.
Feeding is an important control means. Proper feeding enables one to get the proper C/N
ratio (>15) that will promote the uptake of ammonium from the water. In addition, proper feed strategy is required to utilize the recycled microbial protein, to reduce costs and to minimize
residues. There is a need for more research in order to get the right feed composition and ration. Some questions are still open.
a. The recommended C/N ratio can be obtained by either feeding with pellets of low protein percentage or by augmenting the feed pellets through the application of carbonaceous material
(molasses, cassava, wheat or other flour, etc.). The first option may save labor. However we rely upon the passage and excretion of the added carbohydrates through the fish to be used by the
bacteria. This assumption may not hold.
b. Feed rations can be lower than the ones used in conventional tilapia ponds. With shrimp in
tanks it was found that feed ration can be reduced by 30% as compared to conventional systems. It was estimated, but not proven, that feed ration in tilapia BFT systems can be lowered
be at least 20% as compared with conventional systems.
Oxygen consumption in intensive BFT tilapia culture is rather high, both due to the
respiration of the dense fish biomass as well as due to respiration of the microbial community that metabolize the organic residues. Oxygen consumption was estimated or modeled by several
scientists however, there are a number of critical assumptions depended on specific pond conditions. The range of required aeration is 10-20 hp for a pond of 1000m2. The exact aeration
rate needed for a given pond under given conditions should be adjusted following the daily determination of oxygen in the pond, normally setting a minimal level of 4 mgO2/l. One should
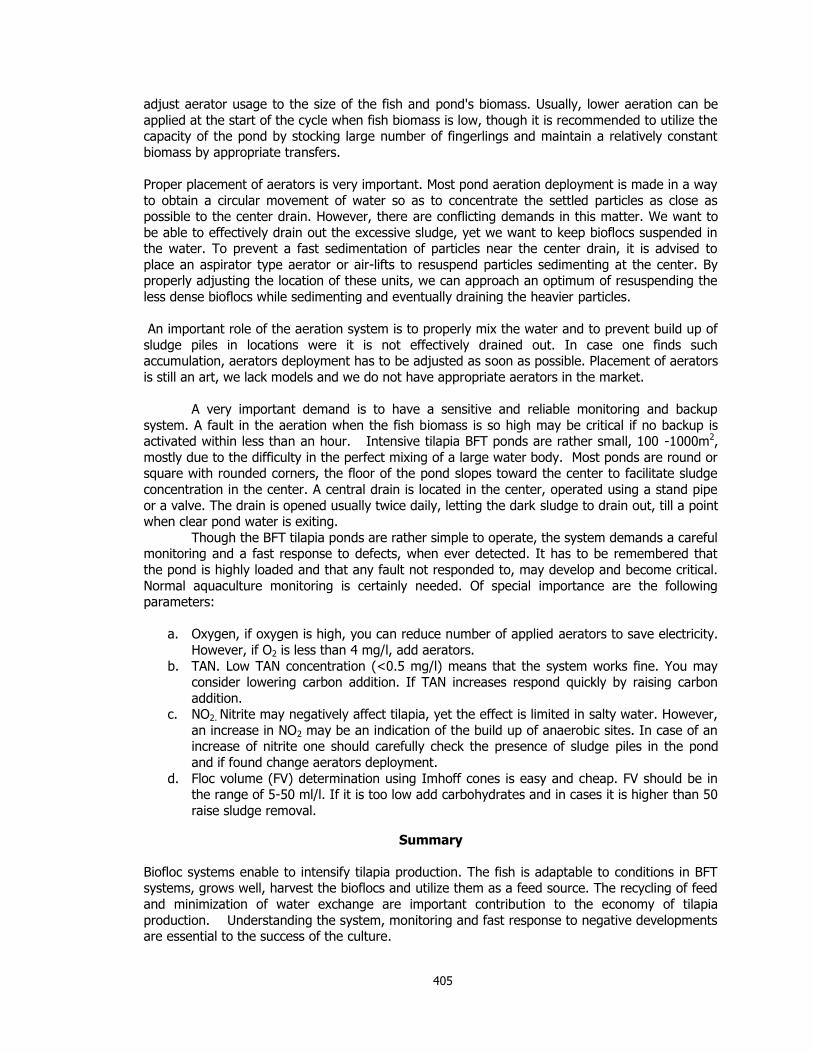
405
adjust aerator usage to the size of the fish and pond's biomass. Usually, lower aeration can be
applied at the start of the cycle when fish biomass is low, though it is recommended to utilize the capacity of the pond by stocking large number of fingerlings and maintain a relatively constant
biomass by appropriate transfers.
Proper placement of aerators is very important. Most pond aeration deployment is made in a way
to obtain a circular movement of water so as to concentrate the settled particles as close as possible to the center drain. However, there are conflicting demands in this matter. We want to
be able to effectively drain out the excessive sludge, yet we want to keep bioflocs suspended in the water. To prevent a fast sedimentation of particles near the center drain, it is advised to
place an aspirator type aerator or air-lifts to resuspend particles sedimenting at the center. By properly adjusting the location of these units, we can approach an optimum of resuspending the
less dense bioflocs while sedimenting and eventually draining the heavier particles.
An important role of the aeration system is to properly mix the water and to prevent build up of
sludge piles in locations were it is not effectively drained out. In case one finds such accumulation, aerators deployment has to be adjusted as soon as possible. Placement of aerators
is still an art, we lack models and we do not have appropriate aerators in the market.
A very important demand is to have a sensitive and reliable monitoring and backup
system. A fault in the aeration when the fish biomass is so high may be critical if no backup is activated within less than an hour. Intensive tilapia BFT ponds are rather small, 100 -1000m2,
mostly due to the difficulty in the perfect mixing of a large water body. Most ponds are round or square with rounded corners, the floor of the pond slopes toward the center to facilitate sludge
concentration in the center. A central drain is located in the center, operated using a stand pipe
or a valve. The drain is opened usually twice daily, letting the dark sludge to drain out, till a point when clear pond water is exiting.
Though the BFT tilapia ponds are rather simple to operate, the system demands a careful monitoring and a fast response to defects, when ever detected. It has to be remembered that
the pond is highly loaded and that any fault not responded to, may develop and become critical.
Normal aquaculture monitoring is certainly needed. Of special importance are the following parameters:
a. Oxygen, if oxygen is high, you can reduce number of applied aerators to save electricity.
However, if O2 is less than 4 mg/l, add aerators.
b. TAN. Low TAN concentration (<0.5 mg/l) means that the system works fine. You may consider lowering carbon addition. If TAN increases respond quickly by raising carbon
addition. c. NO2. Nitrite may negatively affect tilapia, yet the effect is limited in salty water. However,
an increase in NO2 may be an indication of the build up of anaerobic sites. In case of an increase of nitrite one should carefully check the presence of sludge piles in the pond
and if found change aerators deployment.
d. Floc volume (FV) determination using Imhoff cones is easy and cheap. FV should be in the range of 5-50 ml/l. If it is too low add carbohydrates and in cases it is higher than 50
raise sludge removal.
Summary
Biofloc systems enable to intensify tilapia production. The fish is adaptable to conditions in BFT systems, grows well, harvest the bioflocs and utilize them as a feed source. The recycling of feed
and minimization of water exchange are important contribution to the economy of tilapia
production. Understanding the system, monitoring and fast response to negative developments are essential to the success of the culture.
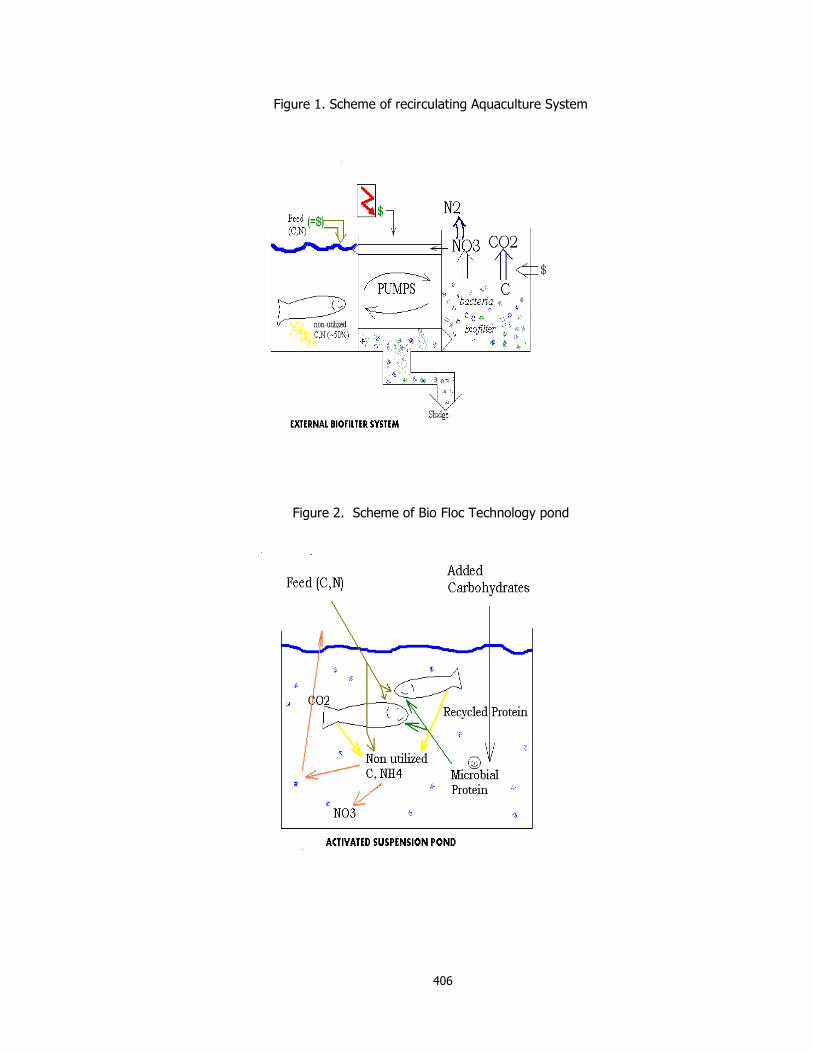
406
Figure 1. Scheme of recirculating Aquaculture System
Figure 2. Scheme of Bio Floc Technology pond

407
LENGTH-WEIGHT RELATIONSHIP OF Oreochromis niloticus IN A
CONCRETE POND OF HABIB ADM, HUB, BALOCHISTAN
M. Y. Laghari, B. A. Dars, and N. T. Narejo, *Baoping Xin
Department of Fresh Water Biology and Fisheries, University of Sindh, Jamshoro 67080, sindh_Pakistan.
*School of Chemical Engineering and Environment, B.I.T, Beijing_China.
Abstract
The length-weight relationship and condition factor was investigated from 500 specimens
of Oreochromis niloticus maintained in a concrete pond at Habib ADM Hub, Balochistan, Pakistan for six months, March to September, 2008. The experimental fish ranged from 15. 5 - 37. 8 cm
and 50. 4 - 635. 4 g in length and weight respectively. The value of regression co-efficient
obtained for the length-weight relationship 4.55. This suggests positive allometry growth from the entire specimens sampled. There was no significant statistical difference in the regression co-
efficients. The mean values of condition factor computed for all the specimens of Oreochromis niloticus was 1.07 ± 0.45, which indicated that the specimens were healthy. The length-weight
relationship of sexes combined as shown by the following equation:
Log W= -4.07 + 4.55 Log L.
Key words: Length- weight relationship, Condition factor, Oreochromis niloticus, Concrete pond,
Balochistan.
Introduction
Oreochromis niloticus is locally known as `Daya` belongs to the family percidae of the
order perciformes. Oreochromis niloticus could be easily identified by dark bands or stripes founds on their bodies are most prominent in mature forms. They inhabit fresh water and water
bodies of low salinity, as is typical of most Tilapia species Olurin and Aderibigbe 2006). Length –weight relationship give information on the condition and growth patterns of fish (Bengal and
Tesch, 1978). Fish are said to exhibit isometric growth when length increases in equal
proportions with body weight for constant specific gravity. The regression co-efficient for isometric growth is 3 and values greater of than 3 indicate allometric growth condition factor
studies take into consideration the health and general well-being of a fish as related to its environment; hence it represents how fairly deep bodied or robust fishes are (Reynold, 1968).
Pauly (1983) reported the importance of length-weight relationship in the calculation of an equation of growth in length into an equation of growth in weight. Whereas Arsalan et al (2004)
stated that it is usually easier to measure length than weight and weight can be predicated later
on using the length –weight relationship which helps among other fish given its definite length Olurin and Aderibigbe (2006) calculated the length-weight relationship and condition factor of
pond reared Juvenile Oreochromis niloticus. But no work is available on to determine the length-weight relationship and condition factor of Oreochromis niloticus reared in concrete ponds from
Pakistan. The present study aims to provide information on the length-weight relationship and
condition factor of Oreochromis niloticus reared in concrete ponds of Habib ADM at Hub, Balochistan with a view to determine the suitability of stocking in concrete pond.

408
Materials and Methods
Experimental fish
Five hundred fish samples were collected from concrete pond at Habib ADM Hub, Balochistan, Pakistan, with the help of fish catching net. The specimens were transported to the
laboratory in a large polythene bag with 5% formalin.
Laboratory analysis
The collected specimens were washed and mopped on filter paper to remove excess water from their body surfaces. Length of fishes was measured to the nearest cm and weight up
to 0.1g by using a scale sensitive portable battery operated balance (Model No., CT, 1200-S, Made in USA ) respectively. The experimental fish were ranging from 15.5 – 37.8 (cm) in total
length (TL) and 50.4-635.4 g in weight respectively.
Length–weight relationship and condition factor
The regression of weight against length was computed from the logarithmic formula: log a + b log L. Ponderal index (Kn) was observed of different length groups. It was calculated for
each 5cm length interval. The smoothed mean weights W/W, for each length group has been
computed from the log formula suggested by LeCren (1951) modified formulae: Kn =W/aLn has been adapted for the calculation of the relative condition factor.
Results
Length-weight relationship
The length–weight relationship equations were determined for sexes combined only. The expression can be transformed logarithmically as suggested by LeCren (1951) log a + b log L.
When empirical values of lengths were plotted against their respective weight on an arithmetic scale, smooth curves were obtained (Fig .1). A plot of weight against length on double
logarithmic paper however yielded a straight line (Figs. 2, 3 and 4) as expected. The data of
length-weight of Oreochromis niloticus is presented in (Table 1).
The regression coefficients, when calculated using the methods of least squares for samples of Oreochromis niloticus in size ranged between 15.5 – 37.8 (cm) gave the following
equation:
Log W=- 4. 07 + 4.55 × Log L
As observed from the above equations values for all specimens were practically identical and followed the cube law (b= 3). The agreement between the empirical weight and computed
weight from regression can be termed as ideal growth (positive allometry).
Relative condition factor
The relative condition factor (Kn) for all fish samples was determined from the average lengths and weights of 5cm interval of total length groups (Table 2). The relative condition factor
(Kn) was determined for all samples in case of sexes combined only Kn values were ranging from 0.49-1.84 with mean was 1.0 ± 0.5. The values of Kn showed ideal or good growth of all
specimens in all size groups of fish.
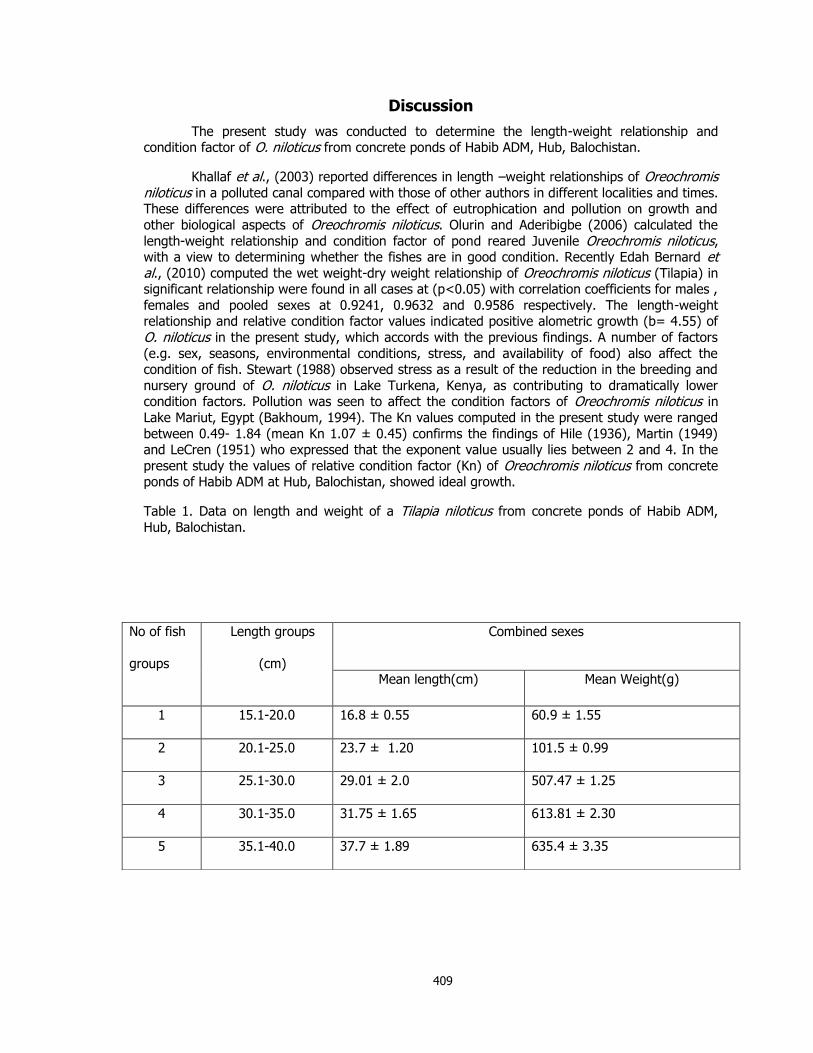
409
Discussion
The present study was conducted to determine the length-weight relationship and condition factor of O. niloticus from concrete ponds of Habib ADM, Hub, Balochistan.
Khallaf et al., (2003) reported differences in length –weight relationships of Oreochromis niloticus in a polluted canal compared with those of other authors in different localities and times. These differences were attributed to the effect of eutrophication and pollution on growth and
other biological aspects of Oreochromis niloticus. Olurin and Aderibigbe (2006) calculated the
length-weight relationship and condition factor of pond reared Juvenile Oreochromis niloticus, with a view to determining whether the fishes are in good condition. Recently Edah Bernard et al., (2010) computed the wet weight-dry weight relationship of Oreochromis niloticus (Tilapia) in significant relationship were found in all cases at (p<0.05) with correlation coefficients for males ,
females and pooled sexes at 0.9241, 0.9632 and 0.9586 respectively. The length-weight relationship and relative condition factor values indicated positive alometric growth (b= 4.55) of O. niloticus in the present study, which accords with the previous findings. A number of factors
(e.g. sex, seasons, environmental conditions, stress, and availability of food) also affect the condition of fish. Stewart (1988) observed stress as a result of the reduction in the breeding and
nursery ground of O. niloticus in Lake Turkena, Kenya, as contributing to dramatically lower condition factors. Pollution was seen to affect the condition factors of Oreochromis niloticus in Lake Mariut, Egypt (Bakhoum, 1994). The Kn values computed in the present study were ranged
between 0.49- 1.84 (mean Kn 1.07 ± 0.45) confirms the findings of Hile (1936), Martin (1949) and LeCren (1951) who expressed that the exponent value usually lies between 2 and 4. In the
present study the values of relative condition factor (Kn) of Oreochromis niloticus from concrete ponds of Habib ADM at Hub, Balochistan, showed ideal growth.
Table 1. Data on length and weight of a Tilapia niloticus from concrete ponds of Habib ADM,
Hub, Balochistan.
No of fish
groups
Length groups
(cm)
Combined sexes
Mean length(cm) Mean Weight(g)
1 15.1-20.0 16.8 ± 0.55 60.9 ± 1.55
2 20.1-25.0 23.7 ± 1.20 101.5 ± 0.99
3 25.1-30.0 29.01 ± 2.0 507.47 ± 1.25
4 30.1-35.0 31.75 ± 1.65 613.81 ± 2.30
5 35.1-40.0 37.7 ± 1.89 635.4 ± 3.35
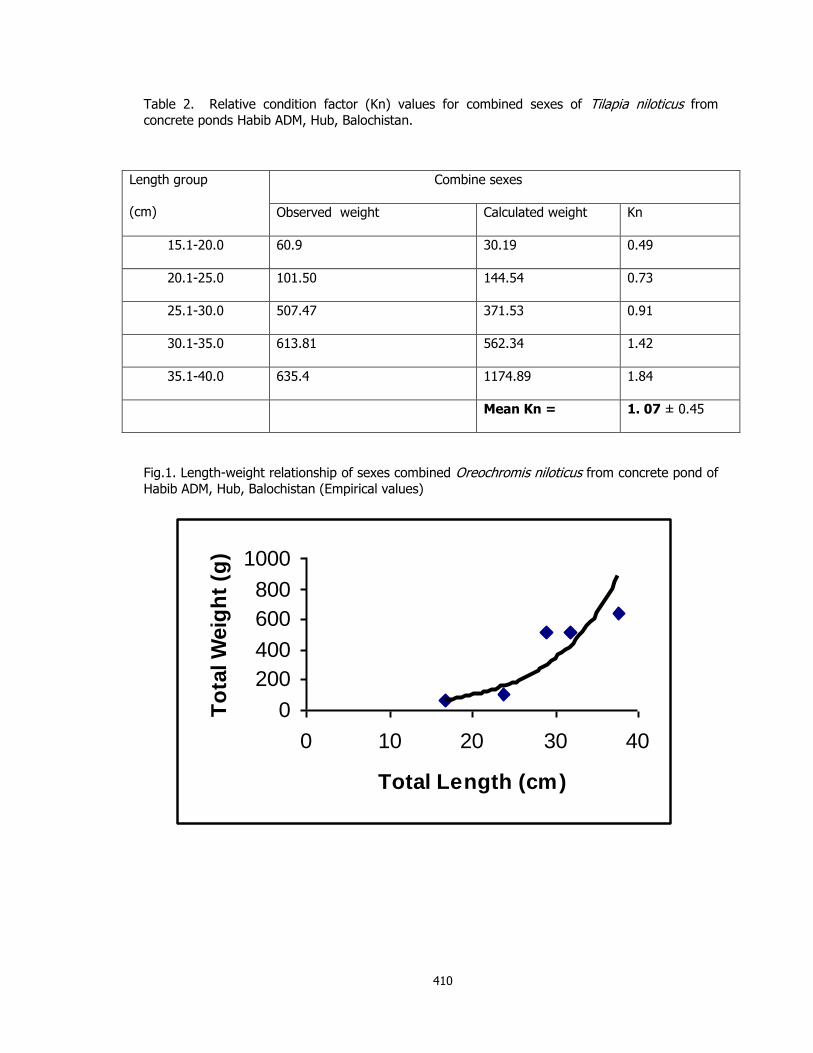
410
Table 2. Relative condition factor (Kn) values for combined sexes of Tilapia niloticus from
concrete ponds Habib ADM, Hub, Balochistan.
Length group
(cm)
Combine sexes
Observed weight Calculated weight Kn
15.1-20.0 60.9 30.19 0.49
20.1-25.0 101.50 144.54 0.73
25.1-30.0 507.47 371.53 0.91
30.1-35.0 613.81 562.34 1.42
35.1-40.0 635.4 1174.89 1.84
Mean Kn = 1. 07 ± 0.45
Fig.1. Length-weight relationship of sexes combined Oreochromis niloticus from concrete pond of
Habib ADM, Hub, Balochistan (Empirical values)
0
200
400
600
800
1000
0 10 20 30 40
Total Length (cm)
To
tal W
eig
ht
(g)
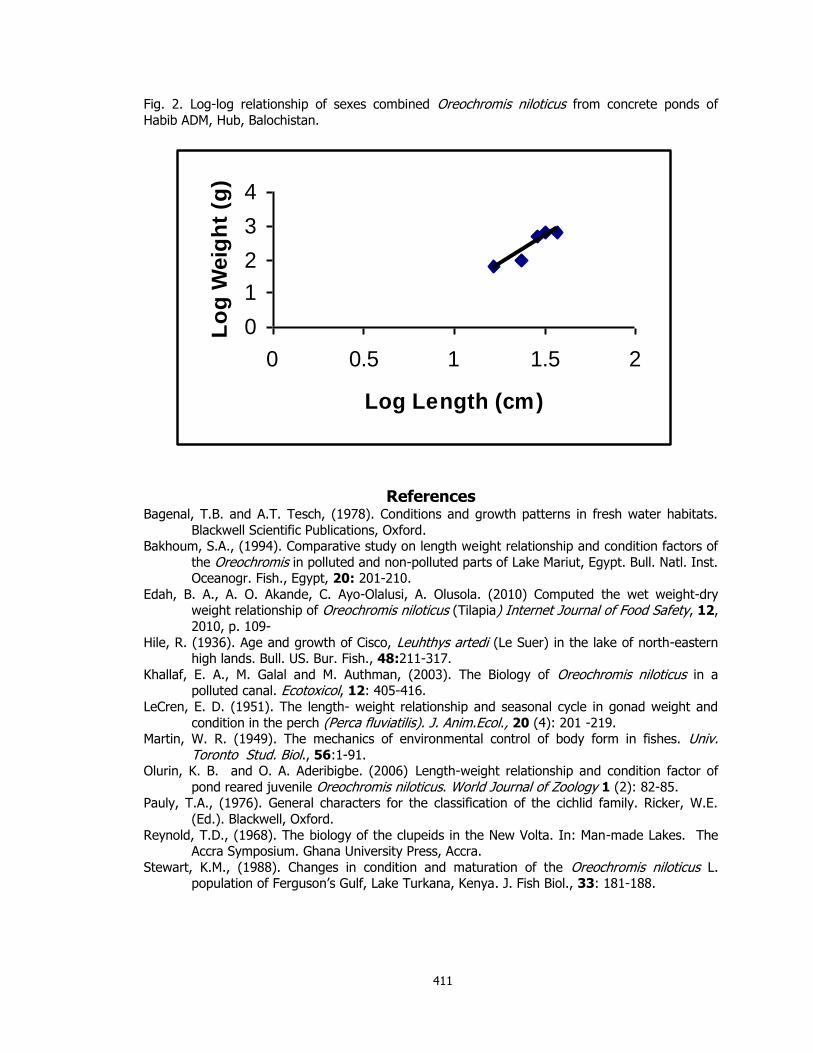
411
Fig. 2. Log-log relationship of sexes combined Oreochromis niloticus from concrete ponds of
Habib ADM, Hub, Balochistan.
References Bagenal, T.B. and A.T. Tesch, (1978). Conditions and growth patterns in fresh water habitats.
Blackwell Scientific Publications, Oxford. Bakhoum, S.A., (1994). Comparative study on length weight relationship and condition factors of
the Oreochromis in polluted and non-polluted parts of Lake Mariut, Egypt. Bull. Natl. Inst. Oceanogr. Fish., Egypt, 20: 201-210.
Edah, B. A., A. O. Akande, C. Ayo-Olalusi, A. Olusola. (2010) Computed the wet weight-dry weight relationship of Oreochromis niloticus (Tilapia) Internet Journal of Food Safety, 12,
2010, p. 109-
Hile, R. (1936). Age and growth of Cisco, Leuhthys artedi (Le Suer) in the lake of north-eastern high lands. Bull. US. Bur. Fish., 48:211-317.
Khallaf, E. A., M. Galal and M. Authman, (2003). The Biology of Oreochromis niloticus in a polluted canal. Ecotoxicol, 12: 405-416.
LeCren, E. D. (1951). The length- weight relationship and seasonal cycle in gonad weight and
condition in the perch (Perca fluviatilis). J. Anim.Ecol., 20 (4): 201 -219. Martin, W. R. (1949). The mechanics of environmental control of body form in fishes. Univ.
Toronto Stud. Biol., 56:1-91. Olurin, K. B. and O. A. Aderibigbe. (2006) Length-weight relationship and condition factor of
pond reared juvenile Oreochromis niloticus. World Journal of Zoology 1 (2): 82-85. Pauly, T.A., (1976). General characters for the classification of the cichlid family. Ricker, W.E.
(Ed.). Blackwell, Oxford.
Reynold, T.D., (1968). The biology of the clupeids in the New Volta. In: Man-made Lakes. The Accra Symposium. Ghana University Press, Accra.
Stewart, K.M., (1988). Changes in condition and maturation of the Oreochromis niloticus L. population of Ferguson‘s Gulf, Lake Turkana, Kenya. J. Fish Biol., 33: 181-188.
0
1
2
3
4
0 0.5 1 1.5 2
Log Length (cm)
Lo
g W
eig
ht
(g)

412
SCALING UP OF CAGE-CUM-POND CULTURE SYSTEM OF CATFISH AND TILAPIA IN CAGES IN CARP POLYCULTURE PONDS
Ram B. Mandal
1, Madhav K. Shrestha
1*, Dilip K. Jha
1, Jharendu Pant
2 and Narayan P.
Pandit1
1Institute of Agriculture and Animal Science (IAAS), Rampur, Chitwan, Nepal 2WorldFish Center, Penang, Malaysia
ABSTRACT
A scaling up experiment on cage-cum-pond culture system of African catfish (Clarias gariepinus) and Nile tilapia (Oreochromis niloticus) with carps, developed by AquaFish CRSP, was conducted using 20 farmers‘ earthen ponds (65-370 m2) in Chitwan district of Nepal for 150 days
to evaluate the production and profitability of these system. The experiment was conducted in a completely randomized design (CRD) with four treatments replicated five times. The treatments
were (1) carps in ponds without cage (control), (2) tilapia at 30 fish/m3 in cage and carps in open
pond, (3) catfish at 100 fish/m3 in cage and carps in open pond, (4) tilapia and catfish at 30 and 100-fish/m3, respectively, in separate cages and carps in open pond. Carps were stocked at 1
fish/m2 (silver, common, bighead, rohu, mrigal and grass carp at 4:2:1.5:1:1:0.5 ratio) in all the treatments. The cage occupied about three percent of the pond area. Caged tilapia and catfish
were fed with locally prepared pellet feeds (29% crude protein), while no feed or fertilizer was
added into open water of treatment ponds. The control ponds were fertilized weekly using diammonium phosphate (DAP) and urea at rates of 4 kg N and 2 kg P/ha/d.
The results showed that the combined net yields were significantly higher in tilapia-carps (3.0 t/ha/crop) and tilapia-catfish-carp integration system (3.6 t/ha/crop) than control (1.4
t/ha/crop) (p<0.05). The net yields of carps were not significantly different between control and treatments. The cage-cum-pond system increased productivity by 2-3 times. The mean
temperature, dissolved oxygen, pH and transparency were not significantly different among
treatments. The benefit-cost ratio was significantly higher in the tilapia-carps integration system (7.4) than control (3.3) (p<0.05). This experiment demonstrated that the cage-cum-pond
integration with Nile tilapia in cage and carps in open pond is one of the best technologies to increase production and profitability for small farmers.
INTRODUCTION
Rural pond aquaculture in Nepal is typically small-scale and semi-intensive polyculture of Chinese and Indian major carps with an average production of 3.3 t/ha/yr (DoFD, 2009).
Increasing fish productivity as well as total production in country is a challenging task and necessary in order to provide for increasing demand for fish as food without increasing import
from neighboring countries. Nile tilapia (Oreochromis niloticus) and African catfish (Clarias gariepinus) are the well proven species for aquaculture in many countries but they are newly
introduced fish species in Nepal (Shrestha and Bhujel, 1999). The major production system for
Nile tilapia is semi-intensive with inorganic or organic fertilizer inputs while African catfish is generally cultured at high stocking densities with intensive feeding (Lin and Diana, 1995; Rai and
Lin, 1999). One of the most problematic aspects of intensive catfish culture is its effects on the environment (Lin and Diana, 1995). In most of the countries, Nile tilapia at a size greater than
500 g fetch a much higher price than fish at 250-300 g, the size commonly produced in fertilized
pond systems (Yi et al., 1996). In this context, the AquaFish CRSP has developed a high production and eco-friendly technology, so-called integrated cage-cum-pond culture system,
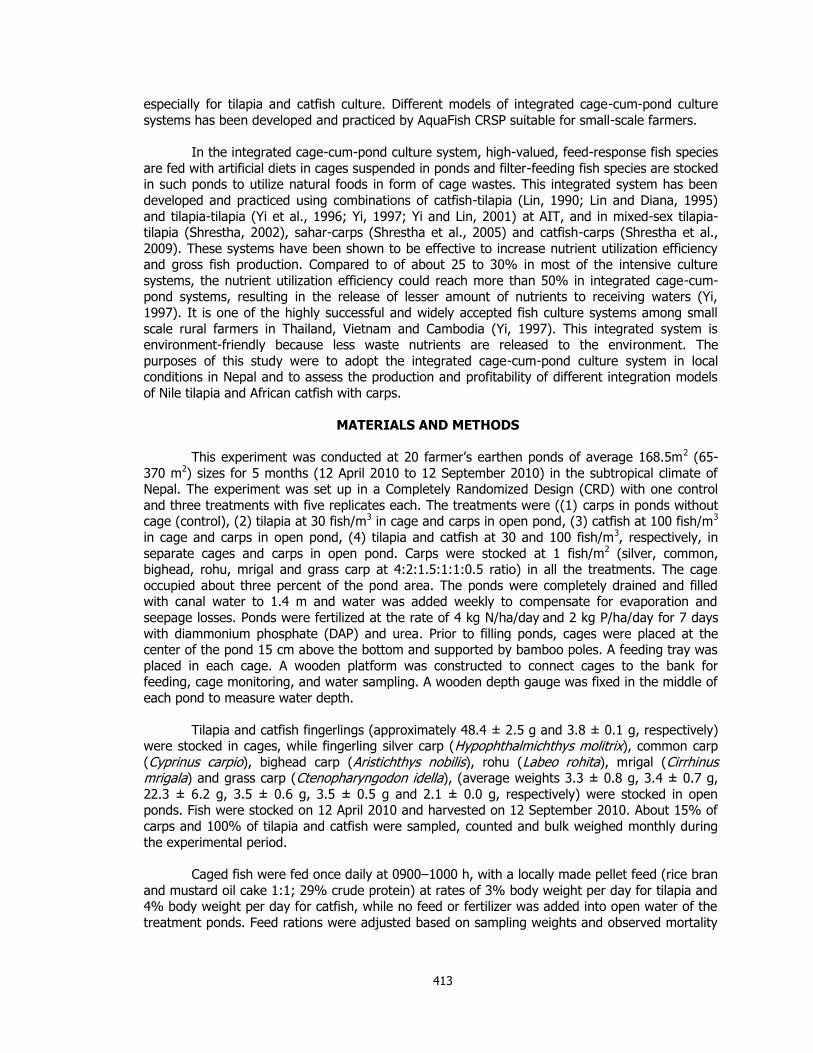
413
especially for tilapia and catfish culture. Different models of integrated cage-cum-pond culture
systems has been developed and practiced by AquaFish CRSP suitable for small-scale farmers.
In the integrated cage-cum-pond culture system, high-valued, feed-response fish species
are fed with artificial diets in cages suspended in ponds and filter-feeding fish species are stocked in such ponds to utilize natural foods in form of cage wastes. This integrated system has been
developed and practiced using combinations of catfish-tilapia (Lin, 1990; Lin and Diana, 1995)
and tilapia-tilapia (Yi et al., 1996; Yi, 1997; Yi and Lin, 2001) at AIT, and in mixed-sex tilapia-tilapia (Shrestha, 2002), sahar-carps (Shrestha et al., 2005) and catfish-carps (Shrestha et al.,
2009). These systems have been shown to be effective to increase nutrient utilization efficiency and gross fish production. Compared to of about 25 to 30% in most of the intensive culture
systems, the nutrient utilization efficiency could reach more than 50% in integrated cage-cum-pond systems, resulting in the release of lesser amount of nutrients to receiving waters (Yi,
1997). It is one of the highly successful and widely accepted fish culture systems among small
scale rural farmers in Thailand, Vietnam and Cambodia (Yi, 1997). This integrated system is environment-friendly because less waste nutrients are released to the environment. The
purposes of this study were to adopt the integrated cage-cum-pond culture system in local conditions in Nepal and to assess the production and profitability of different integration models
of Nile tilapia and African catfish with carps.
MATERIALS AND METHODS
This experiment was conducted at 20 farmer‘s earthen ponds of average 168.5m2 (65-
370 m2) sizes for 5 months (12 April 2010 to 12 September 2010) in the subtropical climate of Nepal. The experiment was set up in a Completely Randomized Design (CRD) with one control
and three treatments with five replicates each. The treatments were ((1) carps in ponds without cage (control), (2) tilapia at 30 fish/m3 in cage and carps in open pond, (3) catfish at 100 fish/m3
in cage and carps in open pond, (4) tilapia and catfish at 30 and 100 fish/m3, respectively, in
separate cages and carps in open pond. Carps were stocked at 1 fish/m2 (silver, common, bighead, rohu, mrigal and grass carp at 4:2:1.5:1:1:0.5 ratio) in all the treatments. The cage
occupied about three percent of the pond area. The ponds were completely drained and filled with canal water to 1.4 m and water was added weekly to compensate for evaporation and
seepage losses. Ponds were fertilized at the rate of 4 kg N/ha/day and 2 kg P/ha/day for 7 days
with diammonium phosphate (DAP) and urea. Prior to filling ponds, cages were placed at the center of the pond 15 cm above the bottom and supported by bamboo poles. A feeding tray was
placed in each cage. A wooden platform was constructed to connect cages to the bank for feeding, cage monitoring, and water sampling. A wooden depth gauge was fixed in the middle of
each pond to measure water depth.
Tilapia and catfish fingerlings (approximately 48.4 ± 2.5 g and 3.8 ± 0.1 g, respectively) were stocked in cages, while fingerling silver carp (Hypophthalmichthys molitrix), common carp
(Cyprinus carpio), bighead carp (Aristichthys nobilis), rohu (Labeo rohita), mrigal (Cirrhinus mrigala) and grass carp (Ctenopharyngodon idella), (average weights 3.3 ± 0.8 g, 3.4 ± 0.7 g,
22.3 ± 6.2 g, 3.5 ± 0.6 g, 3.5 ± 0.5 g and 2.1 ± 0.0 g, respectively) were stocked in open ponds. Fish were stocked on 12 April 2010 and harvested on 12 September 2010. About 15% of
carps and 100% of tilapia and catfish were sampled, counted and bulk weighed monthly during
the experimental period.
Caged fish were fed once daily at 0900–1000 h, with a locally made pellet feed (rice bran
and mustard oil cake 1:1; 29% crude protein) at rates of 3% body weight per day for tilapia and 4% body weight per day for catfish, while no feed or fertilizer was added into open water of the
treatment ponds. Feed rations were adjusted based on sampling weights and observed mortality
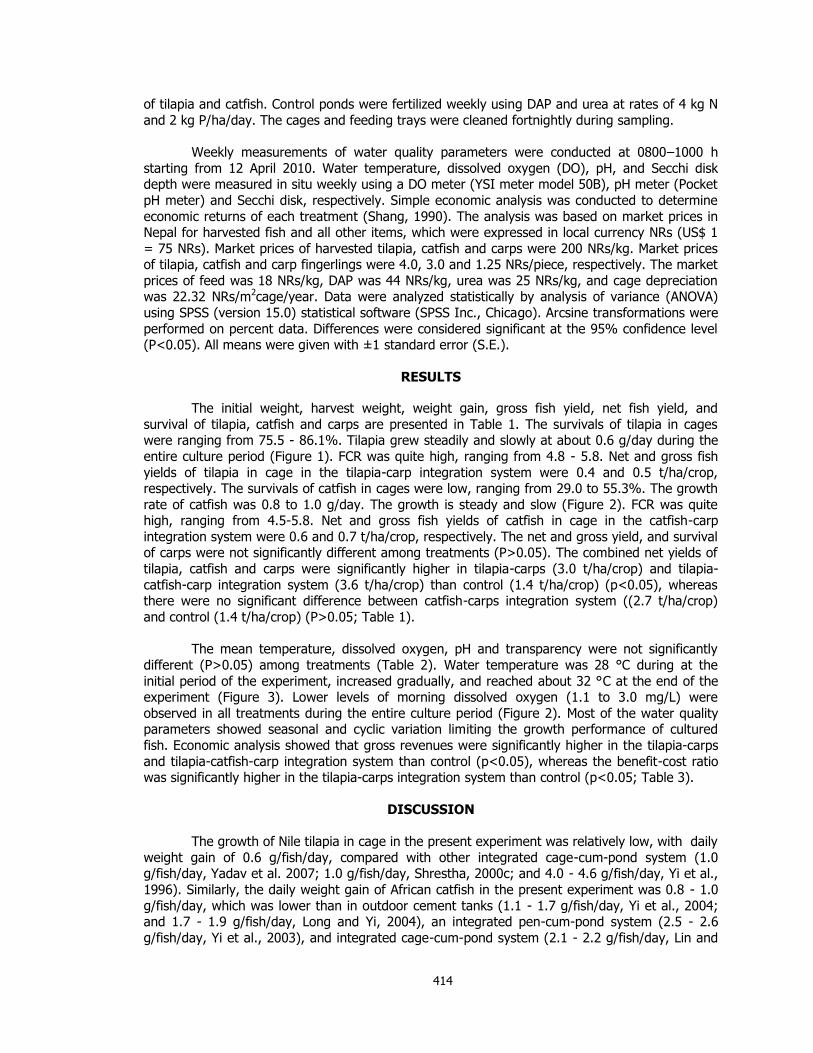
414
of tilapia and catfish. Control ponds were fertilized weekly using DAP and urea at rates of 4 kg N
and 2 kg P/ha/day. The cages and feeding trays were cleaned fortnightly during sampling.
Weekly measurements of water quality parameters were conducted at 0800–1000 h
starting from 12 April 2010. Water temperature, dissolved oxygen (DO), pH, and Secchi disk depth were measured in situ weekly using a DO meter (YSI meter model 50B), pH meter (Pocket
pH meter) and Secchi disk, respectively. Simple economic analysis was conducted to determine
economic returns of each treatment (Shang, 1990). The analysis was based on market prices in Nepal for harvested fish and all other items, which were expressed in local currency NRs (US$ 1
= 75 NRs). Market prices of harvested tilapia, catfish and carps were 200 NRs/kg. Market prices of tilapia, catfish and carp fingerlings were 4.0, 3.0 and 1.25 NRs/piece, respectively. The market
prices of feed was 18 NRs/kg, DAP was 44 NRs/kg, urea was 25 NRs/kg, and cage depreciation was 22.32 NRs/m2cage/year. Data were analyzed statistically by analysis of variance (ANOVA)
using SPSS (version 15.0) statistical software (SPSS Inc., Chicago). Arcsine transformations were
performed on percent data. Differences were considered significant at the 95% confidence level (P<0.05). All means were given with ±1 standard error (S.E.).
RESULTS
The initial weight, harvest weight, weight gain, gross fish yield, net fish yield, and
survival of tilapia, catfish and carps are presented in Table 1. The survivals of tilapia in cages were ranging from 75.5 - 86.1%. Tilapia grew steadily and slowly at about 0.6 g/day during the
entire culture period (Figure 1). FCR was quite high, ranging from 4.8 - 5.8. Net and gross fish
yields of tilapia in cage in the tilapia-carp integration system were 0.4 and 0.5 t/ha/crop, respectively. The survivals of catfish in cages were low, ranging from 29.0 to 55.3%. The growth
rate of catfish was 0.8 to 1.0 g/day. The growth is steady and slow (Figure 2). FCR was quite high, ranging from 4.5-5.8. Net and gross fish yields of catfish in cage in the catfish-carp
integration system were 0.6 and 0.7 t/ha/crop, respectively. The net and gross yield, and survival of carps were not significantly different among treatments (P>0.05). The combined net yields of
tilapia, catfish and carps were significantly higher in tilapia-carps (3.0 t/ha/crop) and tilapia-
catfish-carp integration system (3.6 t/ha/crop) than control (1.4 t/ha/crop) (p<0.05), whereas there were no significant difference between catfish-carps integration system ((2.7 t/ha/crop)
and control (1.4 t/ha/crop) (P>0.05; Table 1).
The mean temperature, dissolved oxygen, pH and transparency were not significantly
different (P>0.05) among treatments (Table 2). Water temperature was 28 °C during at the
initial period of the experiment, increased gradually, and reached about 32 °C at the end of the experiment (Figure 3). Lower levels of morning dissolved oxygen (1.1 to 3.0 mg/L) were
observed in all treatments during the entire culture period (Figure 2). Most of the water quality parameters showed seasonal and cyclic variation limiting the growth performance of cultured
fish. Economic analysis showed that gross revenues were significantly higher in the tilapia-carps
and tilapia-catfish-carp integration system than control (p<0.05), whereas the benefit-cost ratio was significantly higher in the tilapia-carps integration system than control (p<0.05; Table 3).
DISCUSSION
The growth of Nile tilapia in cage in the present experiment was relatively low, with daily
weight gain of 0.6 g/fish/day, compared with other integrated cage-cum-pond system (1.0 g/fish/day, Yadav et al. 2007; 1.0 g/fish/day, Shrestha, 2000c; and 4.0 - 4.6 g/fish/day, Yi et al.,
1996). Similarly, the daily weight gain of African catfish in the present experiment was 0.8 - 1.0
g/fish/day, which was lower than in outdoor cement tanks (1.1 - 1.7 g/fish/day, Yi et al., 2004; and 1.7 - 1.9 g/fish/day, Long and Yi, 2004), an integrated pen-cum-pond system (2.5 - 2.6
g/fish/day, Yi et al., 2003), and integrated cage-cum-pond system (2.1 - 2.2 g/fish/day, Lin and
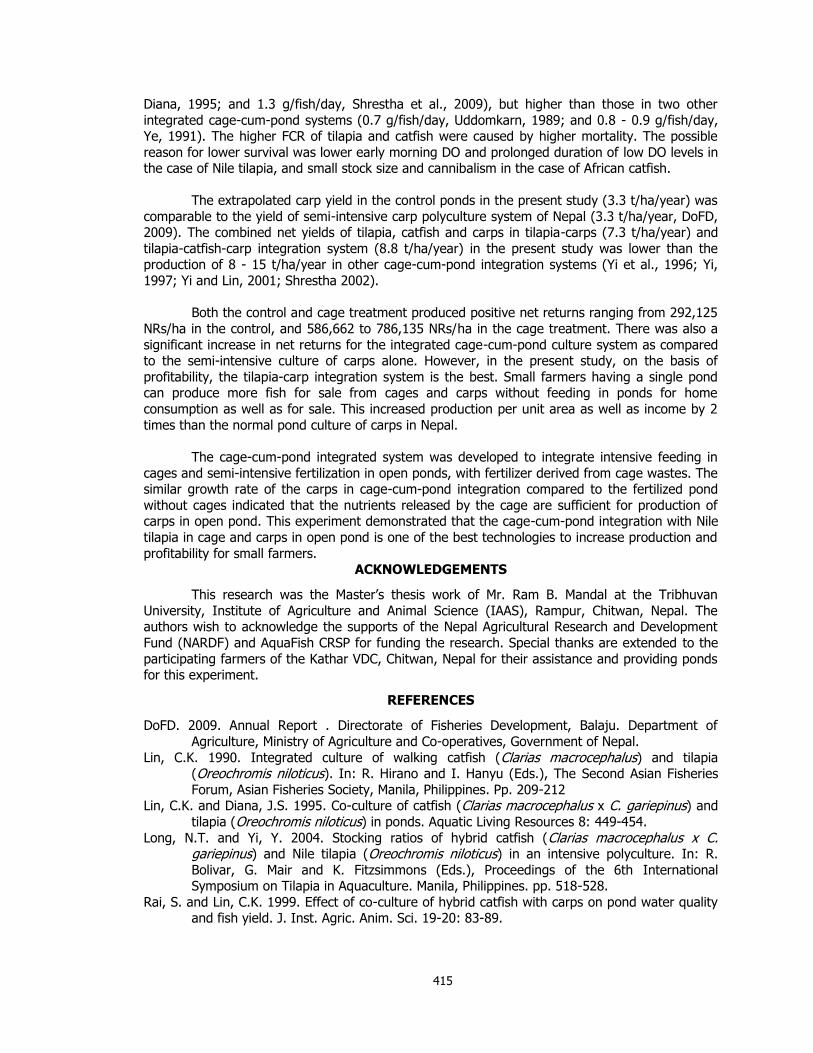
415
Diana, 1995; and 1.3 g/fish/day, Shrestha et al., 2009), but higher than those in two other
integrated cage-cum-pond systems (0.7 g/fish/day, Uddomkarn, 1989; and 0.8 - 0.9 g/fish/day, Ye, 1991). The higher FCR of tilapia and catfish were caused by higher mortality. The possible
reason for lower survival was lower early morning DO and prolonged duration of low DO levels in the case of Nile tilapia, and small stock size and cannibalism in the case of African catfish.
The extrapolated carp yield in the control ponds in the present study (3.3 t/ha/year) was
comparable to the yield of semi-intensive carp polyculture system of Nepal (3.3 t/ha/year, DoFD, 2009). The combined net yields of tilapia, catfish and carps in tilapia-carps (7.3 t/ha/year) and
tilapia-catfish-carp integration system (8.8 t/ha/year) in the present study was lower than the production of 8 - 15 t/ha/year in other cage-cum-pond integration systems (Yi et al., 1996; Yi,
1997; Yi and Lin, 2001; Shrestha 2002).
Both the control and cage treatment produced positive net returns ranging from 292,125
NRs/ha in the control, and 586,662 to 786,135 NRs/ha in the cage treatment. There was also a
significant increase in net returns for the integrated cage-cum-pond culture system as compared to the semi-intensive culture of carps alone. However, in the present study, on the basis of
profitability, the tilapia-carp integration system is the best. Small farmers having a single pond can produce more fish for sale from cages and carps without feeding in ponds for home
consumption as well as for sale. This increased production per unit area as well as income by 2
times than the normal pond culture of carps in Nepal.
The cage-cum-pond integrated system was developed to integrate intensive feeding in
cages and semi-intensive fertilization in open ponds, with fertilizer derived from cage wastes. The similar growth rate of the carps in cage-cum-pond integration compared to the fertilized pond
without cages indicated that the nutrients released by the cage are sufficient for production of carps in open pond. This experiment demonstrated that the cage-cum-pond integration with Nile
tilapia in cage and carps in open pond is one of the best technologies to increase production and
profitability for small farmers. ACKNOWLEDGEMENTS
This research was the Master‘s thesis work of Mr. Ram B. Mandal at the Tribhuvan
University, Institute of Agriculture and Animal Science (IAAS), Rampur, Chitwan, Nepal. The authors wish to acknowledge the supports of the Nepal Agricultural Research and Development
Fund (NARDF) and AquaFish CRSP for funding the research. Special thanks are extended to the
participating farmers of the Kathar VDC, Chitwan, Nepal for their assistance and providing ponds for this experiment.
REFERENCES
DoFD. 2009. Annual Report . Directorate of Fisheries Development, Balaju. Department of
Agriculture, Ministry of Agriculture and Co-operatives, Government of Nepal.
Lin, C.K. 1990. Integrated culture of walking catfish (Clarias macrocephalus) and tilapia (Oreochromis niloticus). In: R. Hirano and I. Hanyu (Eds.), The Second Asian Fisheries
Forum, Asian Fisheries Society, Manila, Philippines. Pp. 209-212 Lin, C.K. and Diana, J.S. 1995. Co-culture of catfish (Clarias macrocephalus x C. gariepinus) and
tilapia (Oreochromis niloticus) in ponds. Aquatic Living Resources 8: 449-454.
Long, N.T. and Yi, Y. 2004. Stocking ratios of hybrid catfish (Clarias macrocephalus x C. gariepinus) and Nile tilapia (Oreochromis niloticus) in an intensive polyculture. In: R.
Bolivar, G. Mair and K. Fitzsimmons (Eds.), Proceedings of the 6th International Symposium on Tilapia in Aquaculture. Manila, Philippines. pp. 518-528.
Rai, S. and Lin, C.K. 1999. Effect of co-culture of hybrid catfish with carps on pond water quality and fish yield. J. Inst. Agric. Anim. Sci. 19-20: 83-89.
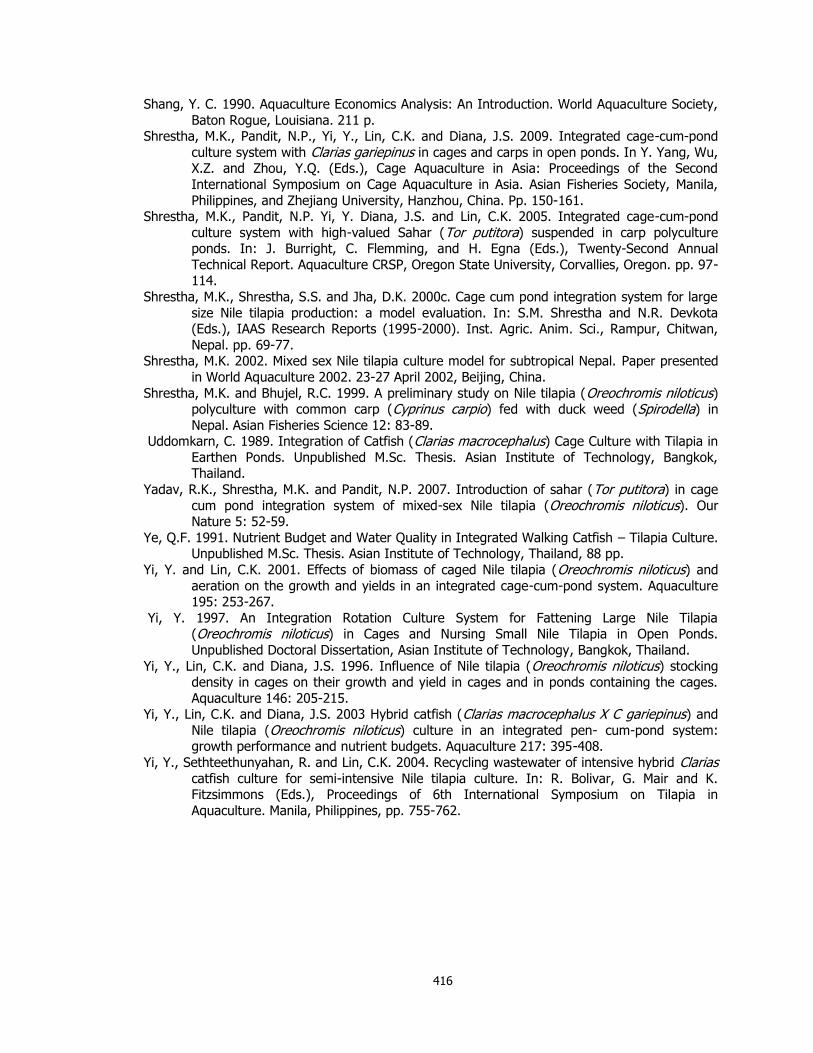
416
Shang, Y. C. 1990. Aquaculture Economics Analysis: An Introduction. World Aquaculture Society,
Baton Rogue, Louisiana. 211 p. Shrestha, M.K., Pandit, N.P., Yi, Y., Lin, C.K. and Diana, J.S. 2009. Integrated cage-cum-pond
culture system with Clarias gariepinus in cages and carps in open ponds. In Y. Yang, Wu, X.Z. and Zhou, Y.Q. (Eds.), Cage Aquaculture in Asia: Proceedings of the Second
International Symposium on Cage Aquaculture in Asia. Asian Fisheries Society, Manila,
Philippines, and Zhejiang University, Hanzhou, China. Pp. 150-161. Shrestha, M.K., Pandit, N.P. Yi, Y. Diana, J.S. and Lin, C.K. 2005. Integrated cage-cum-pond
culture system with high-valued Sahar (Tor putitora) suspended in carp polyculture ponds. In: J. Burright, C. Flemming, and H. Egna (Eds.), Twenty-Second Annual
Technical Report. Aquaculture CRSP, Oregon State University, Corvallies, Oregon. pp. 97-114.
Shrestha, M.K., Shrestha, S.S. and Jha, D.K. 2000c. Cage cum pond integration system for large
size Nile tilapia production: a model evaluation. In: S.M. Shrestha and N.R. Devkota (Eds.), IAAS Research Reports (1995-2000). Inst. Agric. Anim. Sci., Rampur, Chitwan,
Nepal. pp. 69-77. Shrestha, M.K. 2002. Mixed sex Nile tilapia culture model for subtropical Nepal. Paper presented
in World Aquaculture 2002. 23-27 April 2002, Beijing, China.
Shrestha, M.K. and Bhujel, R.C. 1999. A preliminary study on Nile tilapia (Oreochromis niloticus) polyculture with common carp (Cyprinus carpio) fed with duck weed (Spirodella) in
Nepal. Asian Fisheries Science 12: 83-89. Uddomkarn, C. 1989. Integration of Catfish (Clarias macrocephalus) Cage Culture with Tilapia in
Earthen Ponds. Unpublished M.Sc. Thesis. Asian Institute of Technology, Bangkok, Thailand.
Yadav, R.K., Shrestha, M.K. and Pandit, N.P. 2007. Introduction of sahar (Tor putitora) in cage
cum pond integration system of mixed-sex Nile tilapia (Oreochromis niloticus). Our Nature 5: 52-59.
Ye, Q.F. 1991. Nutrient Budget and Water Quality in Integrated Walking Catfish – Tilapia Culture. Unpublished M.Sc. Thesis. Asian Institute of Technology, Thailand, 88 pp.
Yi, Y. and Lin, C.K. 2001. Effects of biomass of caged Nile tilapia (Oreochromis niloticus) and
aeration on the growth and yields in an integrated cage-cum-pond system. Aquaculture 195: 253-267.
Yi, Y. 1997. An Integration Rotation Culture System for Fattening Large Nile Tilapia (Oreochromis niloticus) in Cages and Nursing Small Nile Tilapia in Open Ponds.
Unpublished Doctoral Dissertation, Asian Institute of Technology, Bangkok, Thailand.
Yi, Y., Lin, C.K. and Diana, J.S. 1996. Influence of Nile tilapia (Oreochromis niloticus) stocking density in cages on their growth and yield in cages and in ponds containing the cages.
Aquaculture 146: 205-215. Yi, Y., Lin, C.K. and Diana, J.S. 2003 Hybrid catfish (Clarias macrocephalus X C gariepinus) and
Nile tilapia (Oreochromis niloticus) culture in an integrated pen- cum-pond system: growth performance and nutrient budgets. Aquaculture 217: 395-408.
Yi, Y., Sethteethunyahan, R. and Lin, C.K. 2004. Recycling wastewater of intensive hybrid Clarias catfish culture for semi-intensive Nile tilapia culture. In: R. Bolivar, G. Mair and K. Fitzsimmons (Eds.), Proceedings of 6th International Symposium on Tilapia in
Aquaculture. Manila, Philippines, pp. 755-762.
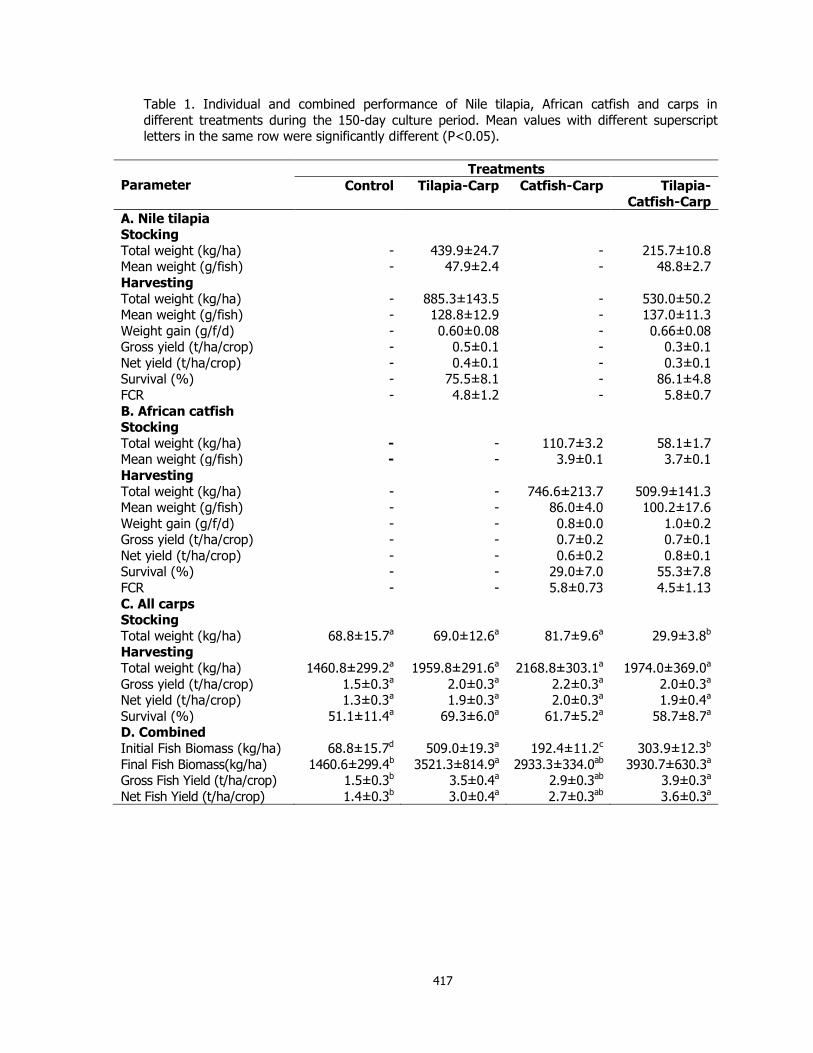
417
Table 1. Individual and combined performance of Nile tilapia, African catfish and carps in
different treatments during the 150-day culture period. Mean values with different superscript letters in the same row were significantly different (P<0.05).
Parameter
Treatments
Control Tilapia-Carp Catfish-Carp Tilapia-
Catfish-Carp
A. Nile tilapia Stocking
Total weight (kg/ha) Mean weight (g/fish)
- -
439.9±24.7 47.9±2.4
- -
215.7±10.8 48.8±2.7
Harvesting
Total weight (kg/ha) Mean weight (g/fish)
Weight gain (g/f/d) Gross yield (t/ha/crop)
Net yield (t/ha/crop) Survival (%)
FCR
- -
- -
- -
-
885.3±143.5 128.8±12.9
0.60±0.08 0.5±0.1
0.4±0.1 75.5±8.1
4.8±1.2
- -
- -
- -
-
530.0±50.2 137.0±11.3
0.66±0.08 0.3±0.1
0.3±0.1 86.1±4.8
5.8±0.7
B. African catfish Stocking
Total weight (kg/ha) Mean weight (g/fish)
- -
- -
110.7±3.2 3.9±0.1
58.1±1.7 3.7±0.1
Harvesting
Total weight (kg/ha) Mean weight (g/fish)
Weight gain (g/f/d) Gross yield (t/ha/crop)
Net yield (t/ha/crop) Survival (%)
FCR
- -
- -
- -
-
- -
- -
- -
-
746.6±213.7 86.0±4.0
0.8±0.0 0.7±0.2
0.6±0.2 29.0±7.0
5.8±0.73
509.9±141.3 100.2±17.6
1.0±0.2 0.7±0.1
0.8±0.1 55.3±7.8
4.5±1.13
C. All carps Stocking
Total weight (kg/ha)
68.8±15.7a
69.0±12.6a
81.7±9.6a
29.9±3.8b Harvesting
Total weight (kg/ha)
Gross yield (t/ha/crop) Net yield (t/ha/crop)
Survival (%)
1460.8±299.2a
1.5±0.3a 1.3±0.3a
51.1±11.4a
1959.8±291.6a
2.0±0.3a 1.9±0.3a
69.3±6.0a
2168.8±303.1a
2.2±0.3a 2.0±0.3a
61.7±5.2a
1974.0±369.0a
2.0±0.3a 1.9±0.4a
58.7±8.7a D. Combined
Initial Fish Biomass (kg/ha)
Final Fish Biomass(kg/ha) Gross Fish Yield (t/ha/crop)
Net Fish Yield (t/ha/crop)
68.8±15.7d
1460.6±299.4b 1.5±0.3b
1.4±0.3b
509.0±19.3a
3521.3±814.9a 3.5±0.4a
3.0±0.4a
192.4±11.2c
2933.3±334.0ab 2.9±0.3ab
2.7±0.3ab
303.9±12.3b
3930.7±630.3a 3.9±0.3a
3.6±0.3a
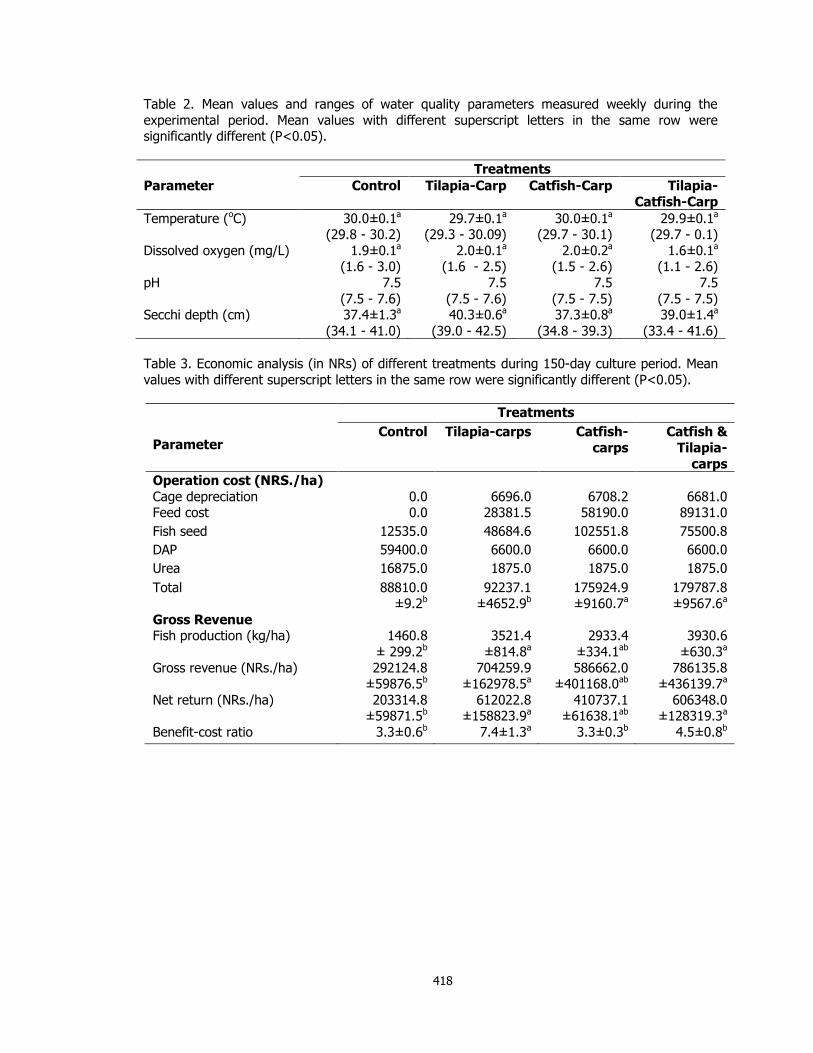
418
Table 2. Mean values and ranges of water quality parameters measured weekly during the
experimental period. Mean values with different superscript letters in the same row were significantly different (P<0.05).
Treatments
Parameter Control Tilapia-Carp Catfish-Carp Tilapia-
Catfish-Carp
Temperature (oC) 30.0±0.1a (29.8 - 30.2)
29.7±0.1a (29.3 - 30.09)
30.0±0.1a (29.7 - 30.1)
29.9±0.1a (29.7 - 0.1)
Dissolved oxygen (mg/L) 1.9±0.1a (1.6 - 3.0)
2.0±0.1a (1.6 - 2.5)
2.0±0.2a (1.5 - 2.6)
1.6±0.1a (1.1 - 2.6)
pH 7.5
(7.5 - 7.6)
7.5
(7.5 - 7.6)
7.5
(7.5 - 7.5)
7.5
(7.5 - 7.5) Secchi depth (cm) 37.4±1.3a
(34.1 - 41.0)
40.3±0.6a
(39.0 - 42.5)
37.3±0.8a
(34.8 - 39.3)
39.0±1.4a
(33.4 - 41.6)
Table 3. Economic analysis (in NRs) of different treatments during 150-day culture period. Mean
values with different superscript letters in the same row were significantly different (P<0.05).
Parameter
Treatments
Control Tilapia-carps Catfish-
carps
Catfish &
Tilapia-
carps
Operation cost (NRS./ha)
Cage depreciation
0.0
6696.0
6708.2
6681.0 Feed cost 0.0 28381.5 58190.0 89131.0
Fish seed 12535.0 48684.6 102551.8 75500.8
DAP 59400.0 6600.0 6600.0 6600.0
Urea 16875.0 1875.0 1875.0 1875.0
Total 88810.0 ±9.2b
92237.1 ±4652.9b
175924.9 ±9160.7a
179787.8 ±9567.6a
Gross Revenue Fish production (kg/ha)
1460.8
± 299.2b
3521.4
±814.8a
2933.4
±334.1ab
3930.6
±630.3a
Gross revenue (NRs./ha) 292124.8 ±59876.5b
704259.9 ±162978.5a
586662.0 ±401168.0ab
786135.8 ±436139.7a
Net return (NRs./ha) 203314.8 ±59871.5b
612022.8 ±158823.9a
410737.1 ±61638.1ab
606348.0 ±128319.3a
Benefit-cost ratio 3.3±0.6b 7.4±1.3a 3.3±0.3b 4.5±0.8b

419
Figure 1. Growth of Nile tilapia in cages in different treatments during the experimental period.
T2 = tilapia-carps integration and T4 = tilapia-catfish-carps integration system.
Figure 2. Growth of African catfish in cages in different treatments during the experimental
period. T3 = catfish-carps integration and T4 = tilapia-catfish-carps integration system.
Mea
n w
eig
ht
(g)
Experimental period (days)
T2 T4
Mea
n w
eigh
t (g
)
Experimental period (days)
T3 T4

420
1
Figure 3. Fluctuations in water temperature (at dawn) in different treatments during the
experimental period. T1 = control, T2 = tilapia-carps integration, T3 = catfish-carps integration,
and T4 = tilapia-catfish-carps integration.
Figure 4. Fluctuations in dissolved oxygen (at dawn) in different treatments during the
experimental period. T1 = control, T2 = tilapia-carps integration, T3 = catfish-carps integration,
and T4 = tilapia-catfish-carps integration.

421
BRACKISHWATER POLYCULTURE OF TILAPIA WITH MILKFISH IN
ACEH, INDONESIA
Hasan Hasanuddin and Michael Rimmer

422
POLYCULTURE OF TILAPIA AND SEAWEEDS IN SOFT-SHELL CRAB
PONDS IN INDONESIA AND THAILAND
May Myat Noe LWIN

423
STOCKING TILAPIA IN SHRIMP CULTURE RESERVOIR: FIELD TRIAL IN ACEH, INDONESIA
Sidrotun Naim1, Cut Desyana2
1University of Arizona, Tucson, USA 2WWF – Indonesia
ABSTRACT
Shrimp culture was started in Indonesia in 1980‘s and tilapia culture became popular in the last ten years. Both species are considered as the main fisheries commodities by the
government. Previous research findings suggested that shrimp-tilapia polyculture may help to
minimize the risks of Vibriosis and WSSV infection.The use of water from a tilapia culture pond reduced the prevalence of bacterial infections in shrimp ponds from luminous Vibriosis. Field
experiment of shrimp-tilapia polyculture has been conducted in Aceh by stocking tilapia in the reservoir. After two months, the shrimps were infected with WSSV. The tilapia was able to
survive and grown up to harvest time.
INTRODUCTION
Polyculture has been a long tradition in Asian countries, including Indonesia. While milkfish culture was started in the 17th century, shrimp aquaculture was not initiated until the
beginning of 1980‘s. Since then, shrimp-milkfish polyculture has been practiced in extensive, semi-intensive and intensive culture systems. In most shrimp-milkfish polyculture systems,
shrimp is cultured as the primary; while milkfish is cultured as the secondary species to reuse the shrimp feed wastes and to improve the water quality.
Having one of the longest coastlines in the tropical countries, the people in Indonesia are
more familiar to marine fish. Only in the last five years, tilapia, one of the freshwater fish has become popular. In fact, tilapia was already present in Indonesia since 1930‘s. In Indonesia,
tilapia is known as ‗ikan nila‘ (for Oreochromis niloticus) and ‗ikan mujair‘ (for O. mossambicus). Not a native to Indonesia, but the local name ‗mujair‘ for mossambicus came from the persons
who found the fish in 1939 in the Serang River, Blitar, East Java. Most probably, the Dutch
during the colonial era shipped the live fish from South Africa to Indonesia. This history also explains how Mossambicus is also known as the Java Tilapia, as it was already found in Java in
1930‘s. As tilapia became popular, the shrimp-polyculture had already started on a small scale in some places.
The use of water from a tilapia culture pond reduced the prevalence of bacterial infections in shrimp ponds from luminous Vibriosis (Huervana, et.al., 2004; Tendencia,
et.al.,2006). Vibrio harveyi is a bacterial pathogens common in shrimp culture nd is a gram
negative, while waters which have been used for fish culture tend to be dominated by gram positive bacteria (Yi and Fitzsimmons, 2004).
In Indonesia, traditional extensive shrimp farms usually have a reservoir, where the water from the coast is settled before entering the pond, particularly if the farms are far away
from the nearest coast. Most of the time, farmers do not stock shrimps or fish in the reservoir.
The field experiment aims to investigate the stocking of tilapia in the reservoir.
MATERIAL AND METHODS Pond preparation Infrastructure work commenced on the embankment and the sludge was removed. Standard
measurements for pH, DO, and salinity were conducted periodically. The pond was fertilized, limed, and irrigated. Saponin was added before stocking with shrimps.
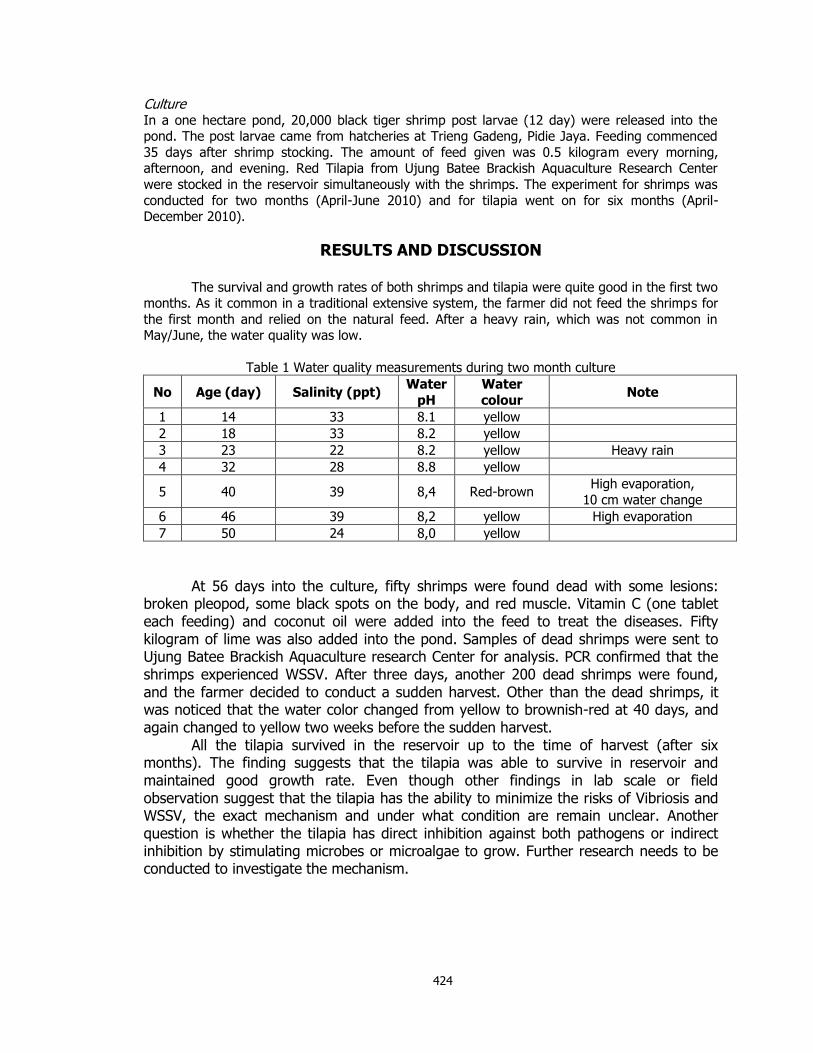
424
Culture
In a one hectare pond, 20,000 black tiger shrimp post larvae (12 day) were released into the pond. The post larvae came from hatcheries at Trieng Gadeng, Pidie Jaya. Feeding commenced
35 days after shrimp stocking. The amount of feed given was 0.5 kilogram every morning, afternoon, and evening. Red Tilapia from Ujung Batee Brackish Aquaculture Research Center
were stocked in the reservoir simultaneously with the shrimps. The experiment for shrimps was
conducted for two months (April-June 2010) and for tilapia went on for six months (April-December 2010).
RESULTS AND DISCUSSION
The survival and growth rates of both shrimps and tilapia were quite good in the first two months. As it common in a traditional extensive system, the farmer did not feed the shrimps for
the first month and relied on the natural feed. After a heavy rain, which was not common in May/June, the water quality was low.
Table 1 Water quality measurements during two month culture
No Age (day) Salinity (ppt) Water
pH
Water
colour Note
1 14 33 8.1 yellow
2 18 33 8.2 yellow
3 23 22 8.2 yellow Heavy rain
4 32 28 8.8 yellow
5 40 39 8,4 Red-brown High evaporation,
10 cm water change
6 46 39 8,2 yellow High evaporation
7 50 24 8,0 yellow
At 56 days into the culture, fifty shrimps were found dead with some lesions:
broken pleopod, some black spots on the body, and red muscle. Vitamin C (one tablet each feeding) and coconut oil were added into the feed to treat the diseases. Fifty kilogram of lime was also added into the pond. Samples of dead shrimps were sent to Ujung Batee Brackish Aquaculture research Center for analysis. PCR confirmed that the shrimps experienced WSSV. After three days, another 200 dead shrimps were found, and the farmer decided to conduct a sudden harvest. Other than the dead shrimps, it was noticed that the water color changed from yellow to brownish-red at 40 days, and again changed to yellow two weeks before the sudden harvest.
All the tilapia survived in the reservoir up to the time of harvest (after six months). The finding suggests that the tilapia was able to survive in reservoir and maintained good growth rate. Even though other findings in lab scale or field observation suggest that the tilapia has the ability to minimize the risks of Vibriosis and WSSV, the exact mechanism and under what condition are remain unclear. Another question is whether the tilapia has direct inhibition against both pathogens or indirect inhibition by stimulating microbes or microalgae to grow. Further research needs to be conducted to investigate the mechanism.
425
Acknowledgement The field experiment in Indonesia was funded by the L‘Oréal Indonesia For Women in Science
Program. SN would like to thank the US Department of State, the Schlumberger Foundation Faculty for the Future Program, and the University of Arizona for supporting the PhD study and
research component in the US.
References
Huervana. F.R., J.J.Y De la Cruz, C.M.A.Caipang. 2006. Inhibition of luminous Vibrio harveyi by green water obtained from tank culture of tilapia Oreochromis mossambicus. Acta ichthyologica et piscatorial 36 (1): 17-23
Tendencia, E.A. M.R. de la Pena. C.H. Choresca. 2006. Effect of shrimp biomass and feeding
on the anti-Vibrio harveyi activity of Tilapia sp. in a simulated shrimp tilapia polyculture system. Aquaculture 253 (1-4): 154-162.
Y, Yi., Fitzsimmons, K., 2004. Tilapia-shrimp polyculture in Thailand. pp. 777-790. In: Bolivar, R., Mair, G. and Fitzsimmons, K. (eds). New Dimensions in Farmed Tilapia. Proceedings of
ISTA 6. Bureau of Fisheries and Aquatic Resources. Manila, Philippines.
2010. Peradaban ikan mujair air tawar. http://www.manifest-2010.co.cc/2010/12/peradaban-ikan-mujair-air-tawar.html

426
POSTERS
427
Abstract for Poster presentation for ISTA9:
THE DEVELOPMENT OF CORRELATIVE MICROSCOPY TECHNIQUES TO DEFINE
MORPHOLOGY AND ULTRASTRUCTURE IN CHLORIDE CELLS OF NILE TILAPIA
(Oreochromis niloticus (L.)) YOLK-SAC LARVAE.
Fridman, S.1, Bron, J.E.1 and Rana, K.J.1
1 Institute of Aquaculture, University of Stirling, Scotland.
Abstract
The Nile tilapia, the predominant farmed tilapia species worldwide, displays an ability to thrive in
low salinity waters not otherwise used for culture of conventional freshwater fish. The ability of
early life stages to osmoregulate relies initially on chloride cells which are located on the body
surface of larvae. These specialised cells are responsible for the trans-epithelial transport of ions,
this being achieved using the transport protein Na+-K+-ATPase. In this study FluoroNanogold™
was used in combination with a Na+/K+-ATPase antibody on yolk-sac larvae of Nile tilapia that
had been incubated and reared in brackish water. Chloride cells were detected directly by
confocal scanning laser microscopy and subsequently by transmission electron microscopy.
Scanning electron microscopy confirmed the appearance of the structure of the chloride cells on
the surface of larvae. Results demonstrate that this integrated approach - used here for the first
time on whole-mount fish specimens – offers valuable insight into the cellular localisation of
Na+/K+-ATPase and morphology of chloride cells.

428
ADDRESSING THE GOALS AND OBJECTIVES OF THE FEED THE FUTURE INITIATIVE:
ENHANCING THE PROFITABILITY OF SMALL AQUACULTURE OPERATIONS IN GHANA,
KENYA, AND TANZANIA
Stephanie Ichien* and Hillary Egna
Abstract
The Aquaculture & Fisheries Collaborative Research Support Program (AquaFish CRSP),
located at Oregon State University, brings together resources from US and host country
institutions to develop sustainable solutions in aquaculture and fisheries for improving
health, building wealth, conserving natural environments for future generations, and
strengthening poorer societies‘ ability to self-govern in ways that respect the sanctity of
all. In aligning strategies and goals with Feed the Future (FTF), the US government‘s
new global hunger and food security initiative, USAID recognizes that providing the poor
with better access to well managed water resources can help eradicate poverty and
improve livelihoods, health, and ecosystems. In 2010, AquaFish CRSP received funding
from USAID for a three-year project to enhance small-scale aquaculture operations in
Ghana, Kenya, and Tanzania. This project works toward reducing the prevalence of
poverty by accelerating inclusive agriculture sector growth through improved agriculture
productivity, expanded markets and trade, and increased economic resilience in
vulnerable rural communities. Using three components of outreach—central media,
demonstrations, and lateral diffusion—this project looks to promote the adoption of best
management practices for pond aquaculture within three target technologies:
1. Effluent Management Practices: Includes guidelines on pond operations, settling ponds and vegetation ditches, draining to wetlands, top-releases for partial drainage, and water re-use (by holding or re-circulating to other ponds).
2. Nutrient Management Practices: Includes guidelines relating to fertilizing and feeding regimes that avoid wastes or, in worse cases, result in deteriorated water quality that threatens the health or condition of the fish.
3. Profitability Analysis: Appropriate stocking and feeding regimes can reduce the cost of production through reduced aeration, better water quality, higher survival, reduced use of medication and chemicals, improved feed conversions, and thereby increased profitability.
429
AQUAFISH CRSP: MITIGATING THE NEGATIVE ENVIRONMENTAL IMPACTS OF
AQUACULTURE PRACTICES THROUGH DEVELOPING SUSTAINABLE FEED
TECHNOLOGIES
Stephanie Ichien*, Ford Evans, and Hillary Egna
Abstract
With the rapid growth in aquaculture production worldwide, negative environmental
impacts are of increasing concern. Aquaculture is associated with a range of issues
including dependence on fishmeal, habitat degradation, contaminated water systems,
increases in the spread of fish diseases, and the introduction of alien species. Mitigation
of these adverse effects is key to developing sustainable end-user level aquaculture
systems. Fish feeds are a major expense for small-scale aquaculture farms. Ingredients
can be costly, particularly protein sources such as fishmeal. Other costs are attributed to
feed wastage due to uneaten diets or poor feed conversion efficiency. In moving away
from the dependence on fishmeal, feed research is now focusing on locally available
protein sources derived from plant materials and food processing by-products.
Therefore, the development of nutritionally efficient diets and optimal feeding strategies
will not only reduce operating costs but also minimize environmental impacts.
Funded by the United States Agency for International Development (USAID), the
Aquaculture & Fisheries Research Support Program (AquaFish CRSP) strives to enrich
livelihoods and promote health through international multidisciplinary partnerships that
advance science, research, education, and outreach in aquatic resources. AquaFish CRSP
is currently supporting research on sustainable feed technologies, as part of a larger
research portfolio. The goal of this work is to lower costs and to improve feed
efficiencies while reducing the ecological footprint of fish culture. AquaFish CRSP
investigations in Africa, Asia, and Latin America are exploring different sustainable feed
technology approaches, including:
Replacement of fishmeal and other costly protein sources in diets of omnivorous and carnivorous fish with protein from sustainable local sources;
Optimizing feeding schedules to lower feed input; Adoption of least-cost formulation and feed manufacturing technologies to
develop less expensive and more efficient feeds.
430
PROMOTING SUSTAINABLE AQUACULTURE AND FISHERIES DEVELOPMENT THROUGH CAPACITY BUILDING: A SYNOPSIS OF SHORT- AND LONG-TERM
TRAINING CONDUCTED BY THE AQUAFISH CRSP
Ford Evans*, James Bowman, Lisa Reifke, and Hillary Egna [email protected]
AquaFish CRSP, 418 Snell Hall, Oregon State University, Corvallis OR 97331 USA
ABSTRACT
The Aquaculture and Fisheries Collaborative Research Support Program (AquaFish CRSP) is actively engaged in aquaculture and fisheries research, training, and outreach activities in 17 countries in Africa, Asia, and the Americas. These efforts are made successful through close collaboration between researchers and educators at 16 US and 29 Host Country institutions. One of the key objectives of the AquaFish CRSP is to build and strengthen the capacities of aquaculture and fisheries institutions and personnel at all levels. Capacity building under the AquaFish CRSP largely emphasizes human resource and institutional development through training and outreach activities. Training supported by the program takes a number of forms, with the most important being short-term and long-term training programs. Short-term training is under 6 months in duration and typically includes seminars, workshops, short-courses, and internships. Long-term training is defined as formal training occurring in an academic setting lasting 6 months or longer and culminating in either an academic degree or a technical certificate. Ensuring gender-equitable access to training opportunities and resources is a high priority in all aspects of the CRSP‘s capacity building activities and therefore a target for participation by women is set at 50%. During 2010 the AquaFish CRSP supported 196 long-term trainees and 25 short-term training events including 694 trainees. Since its inception in2006, the program has supported the training of 288 long-term students and conducted 115 short-term trainings involving over 4000 trainees. AquaFish CRSP capacity building efforts benefit stakeholders in the US and in participating Host Countries through the transfer of knowledge and technology and the dissemination of information about best management practices, offering increased economic opportunities that ultimately enhance the sustainability of aquaculture and fisheries in all regions.

431
PROMOTING SUSTAINABLE RICE-FISH AQUACULTURE IN IRRIGATED SYSTEMS IN MALI
Coulibaly, H., L. Liping, D. Yuan, A.S. Toure, J.R. Bowman, and H.S. Egna*
*Hillary Egna, AquaFish CRSP, 418 Snell Hall, Oregon State University, Corvallis, OR 97331 USA [email protected]
Abstract
Through a series of hands-on trainings in Mali and China from mid-2008 to 2010, rice
producers in Mali learned and applied updated techniques for producing crops of fish along with
their rice crops. The AquaFish CRSP Mali project, which ended in December 2010, partnered with
Mali‘s Direction Nationale de la Pêche (DNP) and China‘s Shanghai Ocean University on this work.
Project activities involved various stakeholders in the Mali aquaculture industry, including
farmers, extension and technical personnel, and members of local NGOs. In little under two
years, the project identified appropriate strategies for the implementation of integrated rice and
fish farming, adapted rice-fish technologies from China to Mali (2 trainees from Mali studied in
China), set up and ran rice-fish demonstration plots in the Baguineda irrigation area, and
conducted workshops on appropriate aquaculture technologies for Mali.
In the first workshop, ―Up-to-Date Techniques for Rice-Fish Culture in China,‖ the
Malians who had trained in China shared technical information on rice-fish culture, including
options for modifying and managing rice fields, with potential farmers and interested government
and NGO personnel in Mali. The second workshop, on ―Appropriate Aquaculture Post-harvest
Technologies,‖ involved fishers, fish farmers, fish traders, marketers, processors, government
officers responsible for aquatic food quality and safety. The objectives were to examine the
current status of post-harvest processing practices, review available technologies, identify
constraints and problems in post-harvest processing, and recommend appropriate technologies
for small post-harvest businesses. The third workshop, on ―Training and Extension Capacity for
Rice-Fish Culture,‖ followed immediately after the first in late November 2009 and involved 27
participants. It aimed to build training and extension capacity for government extension officers,
university teachers, and others working to develop rice-fish culture techniques. The fourth short-
course was a four-day stakeholder workshop on ―Best Aquaculture Practices (BMPs) and
Aquaculture Policy in Mali,‖ organized by the DNP for approximately 20 participants in early 2010.
The objective was to generate recommendations regarding development and implementation of
BMPs for Mali aquaculture through careful review of the current status of aquaculture practices
and policies in Mali, critical examination of existing guidelines and standards, and consultation
with multiple stakeholders and experts. A document on fisheries standards in use in China was
translated and recommended for submission to the DNP: Le standard industriel de la
poissonnerie dans la République populaire de Chine.
Four rice-fish demonstrations were started in July 2009 and the fish were harvested from
the first rice field, that of farmer Mamadou Samake, in late November. His field of approximately
840 m2 (0.084 ha) in area yielded 115 kg of fish, or about 1360 kg per hectare. This result was
very appealing to Mr. Samake because of the additional income he was able to receive by selling
the fish. These results generated a great deal of interest among other rice producers in the
Baguineda area. Local interest in rice-fish increased five-fold following the initial demonstrations,
with at least 22 new farmers eager to invest their own resources in this new rice-fish enterprise

432
based on the successes they saw their neighbors achieve. Several new designs for the layout of
fish sump and access channels in the fields are being tried, and DNP technical officers have been
monitoring the preparation and stocking of fields. The rice-fish farmers of the Baguineda area
have formed a cooperative to better organize themselves for sharing and spreading this new
technology. Also, farmers far from the original test sites have indicated their interest to DNP
technicians, who plan to begin extending technologies in the next year. After many reported
failures in rice-fish culture in Mali, this experience speaks to success and a way forward for small-
scale farmers in Mali.
433
Tilapia: Silent Booming in Bangladesh
Sk. Ahmad-Al-Nahid1, M. Mahfujul Haque1, Md. Abdul Wahab1, David C. Little2 and Francis Murray2
1 Corresponding author: [email protected] 1 Faculty of Fisheries, Bangladesh Agricultural University, Mymensingh, Bangladesh
2 Institute of Aquaculture, University of Stirling, Stirling FK9 4LA U.K.
Abstract This study was part of a scoping study on commercially important aquaculture species traded from Asia into Europe under an European Commission (EC) funded project ‗Sustaining Ethical Aquaculture Trade‘ (SEAT). The objective was to assess the current production status and development trends of four important species, one of them is tilapia. Methods included literature review and rapid rural appraisal (RRA) exercises in Comilla (important for flood plain tilapia culture), Chandpur (for cage culture), Pabna (for monoculture), Khulna (polyculture with shrimp and prawn), Jessore (polyculture with carps), and Mymensingh (polyculture with catfish and carps) districts. During September 2009 to April 2010, 24 tilapia farms (4 per district; 2 small: farm size ≤ 0.20 ha, 1 medium: farm size 0.21 to 0.80 ha and 1 large: ≥ 0.81 ha in each instance), 6 Tilapia hatcheries (1 per district), 6 markets (1 per district) and 2 processing plants (in Khulna) were visited. For this exercise, 24 Tilapia farmers, 6 hatchery owners, 18 retailers and 18 consumers (3 retailers and 3 consumers at each market) and 2 processors were also interviewed individually.
At present there are about approximately 70 commercial tilapia hatcheries in the country, of which the first to start was a mono-sex tilapia seed production in Cox‘s Bazar in 1992. It was found that the increasing availability of tilapia seed made diverse positive impacts on traditional aquaculture practices. Results demonstrated that tilapia has several encouraging attributes (e.g. suitable for culture in both fresh and brackish water, country-wide low cost seed availability, high resistant to diseases, high local market demand, comfortable price for both farmers and consumers, stable market price, two crops year-1, cash flow round the year etc.) which collectively resulted in higher adoption at the farmers‘ level. It can be cultured in various densities and combinations from mono- to polyculture with carps, shrimp, prawn, or with catfish (Pangasius, Heteropneustes and Clarias), and in different containments including ponds, rice fields, gher (low lying wet lands used for shrimp and prawn), flood plains, river cages, tea garden ponds, small reservoirs etc. Moreover, tilapia has provided a strategic means for farmer households for mitigate cropping risks. Pangasius catfish farmers culture tilapia as an alternative, to compensate when catfish market price is low, while shrimp and prawn farmers stock tilapia to minimize diseases. With the expansion of tilapia production, there is a growing interest observed at the level of private entrepreneurs to explore the potentials of its export market. Understanding on the increasing trend of tilapia‘s sex-reversal seed production, positive attributes at culture systems and its environmental impacts will contribute to the development of EAFI (Ethical Aquatic Food Index). The broader understanding on different issues will be contributing to the studies of other work packages (e.g. WP3-LCA) of SEAT project and policy development.
434
PRELIMINARY STUDY ON MICROBIAL ACTIVITY ASSOCIATED WITH TILAPIA
CULTURE AGAINST Vibrio harveyi
Sidrotun Naim
The University of Arizona, Tucson, USA. [email protected] Bandung Institute of Technology, Indonesia. [email protected]
Many shrimp ponds in coastal areas have been abandoned in many parts of the
world due to diseases, poor management such as overstocking, and environmental
degradation. Black tiger shrimps (Penaeus monodon), whiteleg shrimps (Litopenaeus
vannamei) and tilapia (Oreochromis spp.) are commonly cultured in extensive, semi-
intensive, or intensive systems in tropical countries includes Indonesia. Traditional
farming is typically classified as extensive system which means that shrimps are stocked
at low density, feed and fertilizer inputs are generally low, and environmental impacts
from nutrient release are mild. The polyculture of shrimp-tilapia at low stocking density
may provide an opportunity to develop a sustainable aquaculture system to best utilize
abandoned shrimp ponds. To investigate the potential of shrimp-tilapia polyculture for
traditional farming setting, a preliminary study has been conducted in the field with
shrimps as the main species in Aceh and East Java provinces, Indonesia. Shrimp‘s
survival and growth rates were increased in polyculture compared to in monoculture.
A laboratory study was conducted to describe how the presence of tilapia can
help the shrimps. With continue exposure to sunlight in an aquarium system, it was
obvious that tilapia stimulates microalgae growth. This green water helps maintaining
the water quality. Challenge study with Vibrio harveyi, a pathogenic bacteria for
shrimps, was found that the number of the Vibrio on TCBS media was lower in a
polyculture system. Interestingly, the system stimulates other bacteria to grow based
on Heterotrophic Plate Count on TSA media. Molecular study with PCR technique found
that different bacteria attached on the fish mucus after the Vibrio injection into the
water.
Follow up study in the laboratory has been conducted to find the major factor
that responsible in lowering the Vibrio count. It could be the tilapia itself secreting a kind
of natural antibiotics, or the microalgae which has that ability, or the other bacteria that
competing and minimizing the growth of the Vibrio. Follow up in the field will include the
study on freshwater shrimp-tilapia polyculture. If the system works well, polyculture
would be a good model as a sustainable and profitable farming system in both
freshwater and brackishwater aquaculture.

435
The effects of plankton on Tilapia growth using organic and inorganic fertilizers and what causes phytoplankton bloom to “crash”
Pamila Ramotar
University of Arizona
Abstract
Plankton is also one of the main sources of food for fish. They are the most common prey for all fish larvae. Plankton has its place in the lower regions of the food chain and is the basic source
of food for small aquatic animals like fish larvae. During the early stage of their life cycle fish rely on their yolk sac for nutrition. They also rely on plankton to survive during its development stage.
And if the number of plankton decreases, the population of fishes will be greatly affected. This
cycle clearly demonstrates the impact of plankton upon pond life. Fish farmers have increased fish yields in ponds by using inorganic or chemical fertilizers and organic fertilizers or "manures."
(Bocek, 2009)
When ponds are fertilized with organic and inorganic fertilizers, nutrients stimulate the growth of
microscopic plants in the water (phytoplankton). Phytoplankton is food for other organisms (zooplankton and larger animals) that are eaten by fish. Abundant growth of these microscopic
plants gives water a turbid, greenish color (called a ―bloom‖) that can prevent light from reaching the pond bottom and reduce the growth of rooted aquatic weeds. Fish farmers and recreational
farm pond owners fertilize ponds to increase fish. Aquaculture ponds are fertilized to increase the
available natural food (phytoplankton and zooplankton) for fry or larval fish, or for species that are efficient filter feeders.
Some ponds have very dense algae blooms dominated by one or two species. For reasons that
are not well understood, these blooms are subject to spectacular collapse, often called a ―crash,‖
where all the algae suddenly die. This research would highlight the effects of plankton on Tilapia growth using organic and inorganic fertilizers and the causes of phytoplankton blooms to
―crashes.‖
It was found that when organic fertilizers are used there is a higher phytoplankton bloom and
higher oxygen level in the tanks where as when inorganic fertilizers are used there is a greater zooplankton population. When organic and inorganic fertilizers are combined it provides food for
fishes and the fishes in the combined tank had the highest weight gained. Brachionus pala and Daphnia pulex which are plankton-feeding animals, will decrease the numbers of the
phytoplankton very rapidly when present in high numbers.
Introduction
A fishpond is a unique environment created by man. It must be managed properly to achieve good fish production. For centuries fish farmers have increased fish yields in ponds by using
inorganic or chemical fertilizers and organic fertilizers or "manures." (Bocek, 2009)
The major objective of applying fertilizers in fishponds is to enhance the primary productivity of the fish ponds i.e. to assure abundance of different fish food organisms (mainly phytoplankton,

436
benthos and periphyton) in the aquatic environment. This encourages growth and production of
fishes which feed on these organisms. Improved primary productivity in a fish pond requires adequate space, moisture, light, nutrients, favorable pH, temperature and absence of toxic
substances. Of these, considerable importance has been laid on the influence of nutrient concentrations of pond environment on primary productivity. Other factors remaining favorable,
nutrient concentrations determine the magnitude of phytoplankton growth, which relates to total
fish production. Hence for obtaining maximum fish production, it is necessary to maintain the nutrient status of the pond to an optimum range. (Brunson et al, 1999).
A well-managed fertilized recreational pond can produce 200 to 400 pounds of fish per acre
annually. This is three to four times the fish production that can be obtained without fertilization.
Phytoplanktons are free-floating microscopic algae. Photosynthetic activity by large plankton populations can produce enough oxygen to cause oxygen super saturation of water during mid-
afternoon on bright sunlit days.
Phytoplankton growth is stimulated by addition of nitrogen, phosphorous and potassium.
Populations may "bloom" 7 to 10 days after large inputs of nutrients, or "crash" when nutrients are depleted, or if toxic chemicals are added to the water. Phytoplankton respiration may be
nearly 80% of oxygen consumption in water, and respiration by large phytoplankton populations may deplete oxygen in ponds during sustained periods of cloudy weather or at night.
There are two main sources of algal species used in aquaculture. These are: (1) natural populations of phytoplankton, either as they are found in nature or from cultures enriched by
adding nutrients and (2) unialgal cultures. Unialgal cultures are essential when a high quality feed source with known nutritional properties is required. Most species are unicellular or
filamentous freshwater forms. The best known algae, such as Chlorella, Chlamydomonas, Dunaliella and Haematococcus, belong to this group. Some species accumulate high
concentrations of carotenoids under certain culture conditions.
Chlorella is spherical in shape, about 2 to 10 μm in diameter, and is without flagella. Chlorella contains the green photosynthetic pigments chlorophyll-a and -b in its chloroplast. Through photosynthesis it multiplies rapidly requiring only carbon dioxide, water, sunlight, and a small
amount of minerals to reproduce.
Literature review
The natural productivity of a fish culture system depends largely on the availability of natural food organisms and on favorable environmental conditions for the fish.
Phytoplankton, the floating microscopic plants that give water its green color, are the first step in
the food chain of fish ponds. Other organisms also feed on them and multiply, increasing the
availability of natural food for fish stocked in the pond. In addition to carbon dioxide (C02) , water and sunlight for carbohydrate synthesis, phytoplankton need mineral elements including nitrogen,
phosphorus, potassium, calcium, sulfur, iron, manganese, copper and zinc for their growth and nutrition. To promote phytoplankton growth and maintain the optimum natural productivity of
ponds, the water must contain adequate amounts of these nutrients.
What are Fertilizers?
Fertilizers are natural or synthetic substances that are used in ponds to increase the production of the natural food organisms to be eaten by the fish. These organisms include phytoplankton, zooplankton and insects they are all part of a complex food web converging toward fish

437
production. By increasing the availability of major nutrients, fertilizers promote the development of plank tonic algae, which provide food for many fish. Fertilization also leads to the development of animals which feed on algae, including some fish such as the Chinese silver carp and the Nile
tilapia. (See Annex I)
When a fertilizer is added to a fish pond, the chemicals it contains dissolve in the water, where a
portion is usually rapidly taken up by the phytoplankton present, either to be stored, sometimes in quite large proportions, or to be assimilated and used for growth, reproduction, etc.;
Another portion is attracted by and becomes attached to the organic and mineral particles
present, both in the pond water and in the upper layers of the bottom mud or soil.
This second portion may also assist the development of bacteria, responsible for the
decomposition of organic matter. The decomposition of organic matter may in turn release more nutrients back into the mud or water. The chemicals attached to soil particles may also later be released back into the water slowly, over a long period of time. They may also migrate deeper
into mud and soil, where they will no longer affect the water body, unless the pond bottom is dried or ploughed.
Most of these phenomena are linked with and controlled by water quality and in particular
temperature, pH, alkalinity and dissolved oxygen level. (Brunson et al, 1999)
Types of Fertilizers
Brunson, (1999) indicated that pond fertilizers form two distinct groups: mineral or inorganic fertilizers, which contain only mineral nutrients and no organic matter; they are manufactured
industrially to be used in agriculture for improving crop production and they can be obtained from specialized suppliers.
Organic fertilizers, contains a mixture of organic matter and mineral nutrients; which are produced locally, for example as wastes from farm animals or as agricultural wastes.
The formulation of a fertilizer tells the percent by weight of nitrogen (N), phosphorus (as P2O5),
and potassium (as K2O) in the fertilizer. For example, an 11-37-0 fertilizer contains 11 percent
nitrogen, 37 percent phosphorus (as P2O5), and 0 percent potassium (as K2O). Phosphorus is the most important nutrient in ponds, but nitrogen and potassium may be needed occasionally. In
new ponds, some nitrogen may be beneficial, while potassium is rarely, if ever, needed.
Organic materials are not recommended for fertilizing recreational farm ponds, as excessive
amounts may lower dissolved oxygen to a critical level, possibly killing fish. The fertilizers can promote the growth of undesirable filamentous algae (commonly known as ―Blue green algae‖,
―pond moss‖ or ―pond scum‖). Fertilizers are available through any farm supply dealer and are formulated specifically for ponds, but any fertilizer formulation with the appropriate nutrient
levels can be used unless the product contains other ingredients that may be harmful to fish or
other aquatic organisms. For example, do not Use fertilizers intended for lawn or turf application that contain either herbicides or insecticides. (Brunson et al, 1999)
WHY FERTILIZE PONDS?
Microscopic green plants called algae or "phytoplankton" form the base of the food chain for fish. All green plants need proper temperature, light, and nutrients for growth. If sufficient light and
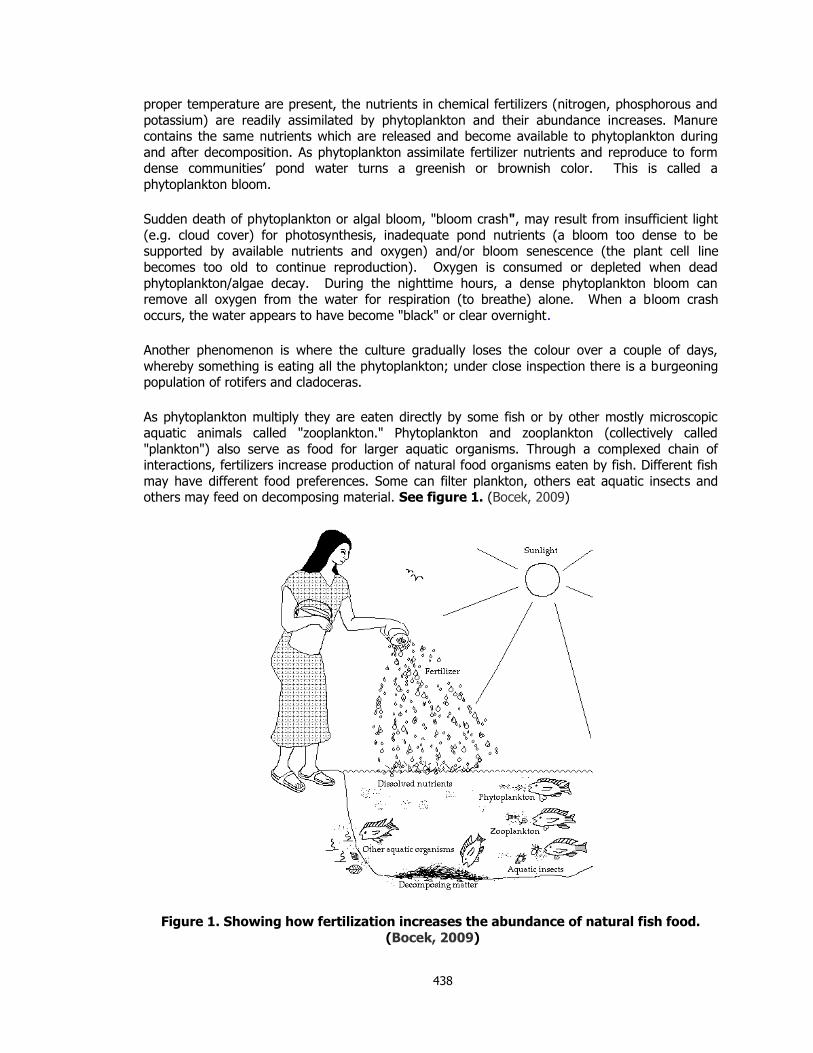
438
proper temperature are present, the nutrients in chemical fertilizers (nitrogen, phosphorous and
potassium) are readily assimilated by phytoplankton and their abundance increases. Manure contains the same nutrients which are released and become available to phytoplankton during
and after decomposition. As phytoplankton assimilate fertilizer nutrients and reproduce to form dense communities‘ pond water turns a greenish or brownish color. This is called a
phytoplankton bloom.
Sudden death of phytoplankton or algal bloom, "bloom crash", may result from insufficient light
(e.g. cloud cover) for photosynthesis, inadequate pond nutrients (a bloom too dense to be supported by available nutrients and oxygen) and/or bloom senescence (the plant cell line
becomes too old to continue reproduction). Oxygen is consumed or depleted when dead
phytoplankton/algae decay. During the nighttime hours, a dense phytoplankton bloom can remove all oxygen from the water for respiration (to breathe) alone. When a bloom crash
occurs, the water appears to have become "black" or clear overnight.
Another phenomenon is where the culture gradually loses the colour over a couple of days,
whereby something is eating all the phytoplankton; under close inspection there is a burgeoning population of rotifers and cladoceras.
As phytoplankton multiply they are eaten directly by some fish or by other mostly microscopic aquatic animals called "zooplankton." Phytoplankton and zooplankton (collectively called
"plankton") also serve as food for larger aquatic organisms. Through a complexed chain of interactions, fertilizers increase production of natural food organisms eaten by fish. Different fish
may have different food preferences. Some can filter plankton, others eat aquatic insects and others may feed on decomposing material. See figure 1. (Bocek, 2009)
Figure 1. Showing how fertilization increases the abundance of natural fish food.
(Bocek, 2009)
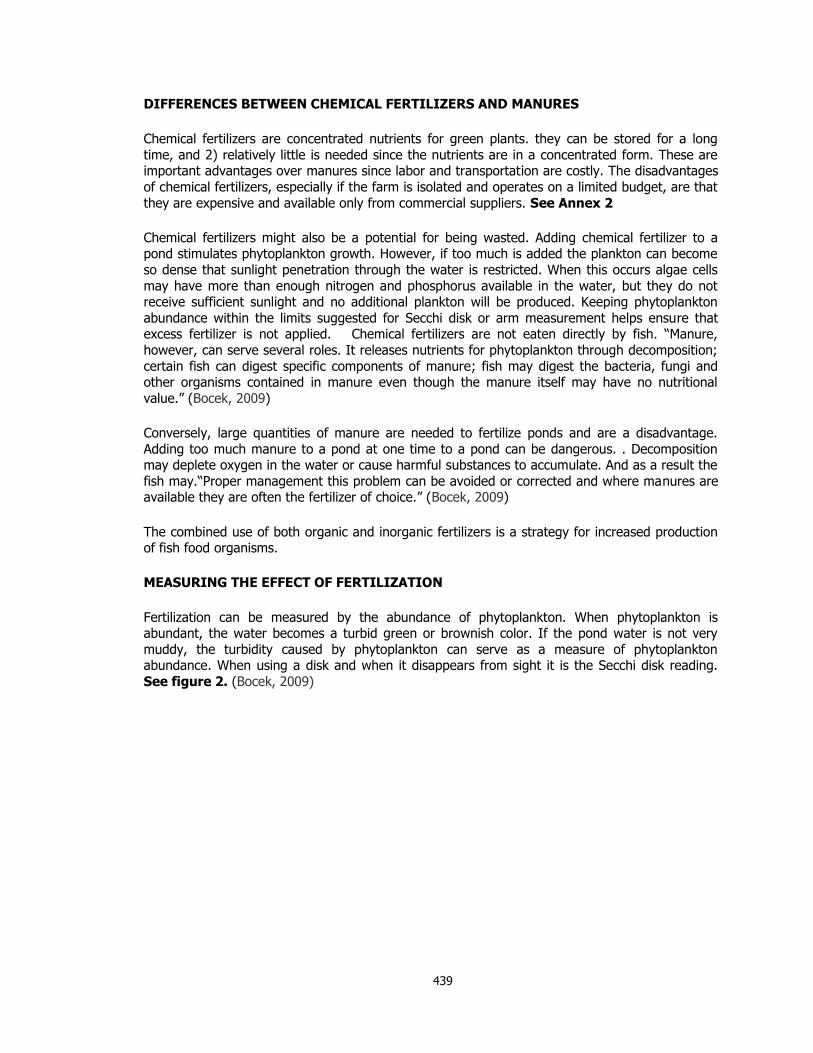
439
DIFFERENCES BETWEEN CHEMICAL FERTILIZERS AND MANURES
Chemical fertilizers are concentrated nutrients for green plants. they can be stored for a long
time, and 2) relatively little is needed since the nutrients are in a concentrated form. These are important advantages over manures since labor and transportation are costly. The disadvantages
of chemical fertilizers, especially if the farm is isolated and operates on a limited budget, are that
they are expensive and available only from commercial suppliers. See Annex 2
Chemical fertilizers might also be a potential for being wasted. Adding chemical fertilizer to a pond stimulates phytoplankton growth. However, if too much is added the plankton can become
so dense that sunlight penetration through the water is restricted. When this occurs algae cells
may have more than enough nitrogen and phosphorus available in the water, but they do not receive sufficient sunlight and no additional plankton will be produced. Keeping phytoplankton
abundance within the limits suggested for Secchi disk or arm measurement helps ensure that excess fertilizer is not applied. Chemical fertilizers are not eaten directly by fish. ―Manure,
however, can serve several roles. It releases nutrients for phytoplankton through decomposition;
certain fish can digest specific components of manure; fish may digest the bacteria, fungi and other organisms contained in manure even though the manure itself may have no nutritional
value.‖ (Bocek, 2009)
Conversely, large quantities of manure are needed to fertilize ponds and are a disadvantage.
Adding too much manure to a pond at one time to a pond can be dangerous. . Decomposition may deplete oxygen in the water or cause harmful substances to accumulate. And as a result the
fish may.―Proper management this problem can be avoided or corrected and where manures are available they are often the fertilizer of choice.‖ (Bocek, 2009)
The combined use of both organic and inorganic fertilizers is a strategy for increased production of fish food organisms.
MEASURING THE EFFECT OF FERTILIZATION
Fertilization can be measured by the abundance of phytoplankton. When phytoplankton is abundant, the water becomes a turbid green or brownish color. If the pond water is not very
muddy, the turbidity caused by phytoplankton can serve as a measure of phytoplankton abundance. When using a disk and when it disappears from sight it is the Secchi disk reading.
See figure 2. (Bocek, 2009)
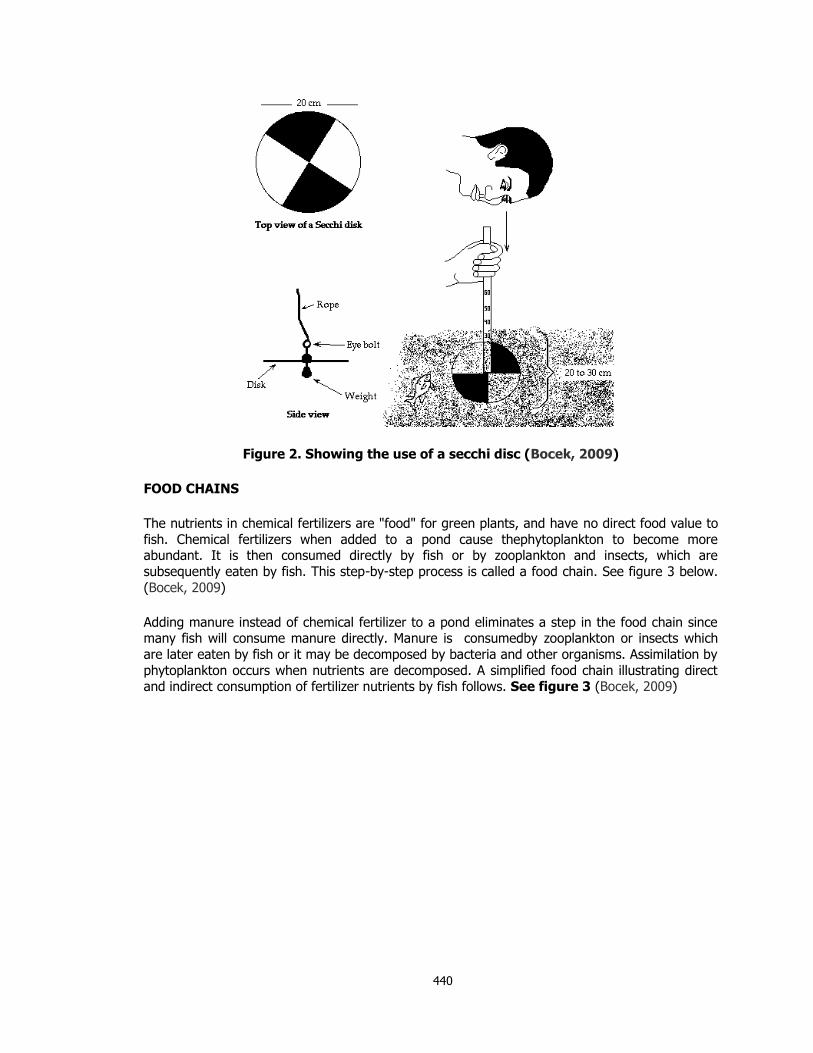
440
Figure 2. Showing the use of a secchi disc (Bocek, 2009)
FOOD CHAINS
The nutrients in chemical fertilizers are "food" for green plants, and have no direct food value to
fish. Chemical fertilizers when added to a pond cause thephytoplankton to become more abundant. It is then consumed directly by fish or by zooplankton and insects, which are
subsequently eaten by fish. This step-by-step process is called a food chain. See figure 3 below.
(Bocek, 2009)
Adding manure instead of chemical fertilizer to a pond eliminates a step in the food chain since many fish will consume manure directly. Manure is consumedby zooplankton or insects which
are later eaten by fish or it may be decomposed by bacteria and other organisms. Assimilation by
phytoplankton occurs when nutrients are decomposed. A simplified food chain illustrating direct and indirect consumption of fertilizer nutrients by fish follows. See figure 3 (Bocek, 2009)
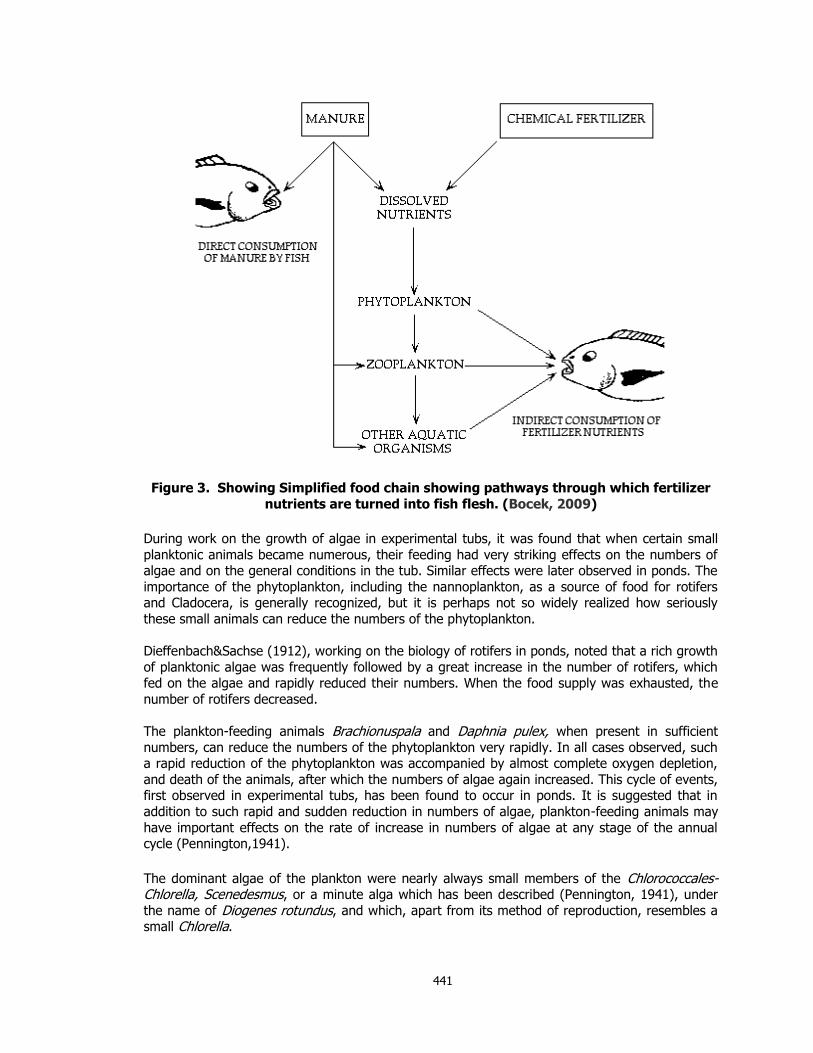
441
Figure 3. Showing Simplified food chain showing pathways through which fertilizer
nutrients are turned into fish flesh. (Bocek, 2009)
During work on the growth of algae in experimental tubs, it was found that when certain small
planktonic animals became numerous, their feeding had very striking effects on the numbers of algae and on the general conditions in the tub. Similar effects were later observed in ponds. The
importance of the phytoplankton, including the nannoplankton, as a source of food for rotifers and Cladocera, is generally recognized, but it is perhaps not so widely realized how seriously
these small animals can reduce the numbers of the phytoplankton.
Dieffenbach&Sachse (1912), working on the biology of rotifers in ponds, noted that a rich growth
of planktonic algae was frequently followed by a great increase in the number of rotifers, which fed on the algae and rapidly reduced their numbers. When the food supply was exhausted, the
number of rotifers decreased.
The plankton-feeding animals Brachionuspala and Daphnia pulex, when present in sufficient
numbers, can reduce the numbers of the phytoplankton very rapidly. In all cases observed, such a rapid reduction of the phytoplankton was accompanied by almost complete oxygen depletion,
and death of the animals, after which the numbers of algae again increased. This cycle of events, first observed in experimental tubs, has been found to occur in ponds. It is suggested that in
addition to such rapid and sudden reduction in numbers of algae, plankton-feeding animals may
have important effects on the rate of increase in numbers of algae at any stage of the annual cycle (Pennington,1941).
The dominant algae of the plankton were nearly always small members of the Chlorococcales-Chlorella, Scenedesmus, or a minute alga which has been described (Pennington, 1941), under
the name of Diogenes rotundus, and which, apart from its method of reproduction, resembles a small Chlorella.

442
At the time when the population of a tub had reached a high, more or less constant, level,
Diogenes rotundus almost invariably formed the bulk of the phytoplankton, and in bright summer weather its numbers often exceeded 20,000 per cu. mm., when the water would be bright green
and almost opaque (Pennington,1941).
In such a tub, it was frequently observed that in the course of a few days the colour changed
from bright green to a dull olive green, and then to black, and at the same time became sufficiently clear to show the bottom of the tub.
Counts of the algae showed that their numbers had decreased very rapidly, and on examination,
the water was found to contain enormous numbers of small animals-in every case either the
rotifer, Brachionuspala, or the crustacean, Daphnia pulex. This sudden destruction of the algae by small invertebrate animals is here termed a 'crash'(Pennington,1941).
When the significance of the 'crash' phenomenon was appreciated, further investigations of the
feeding habits of small animals from the tubs were carried out. The gut contents were examined,
and those species which appeared to feed on plankton algae were kept and observed in cultures in beakers. Then closer investigations were made of their feeding habits in the tubs, and the
course of a crash followed in detail.
Gut contents
Of all the small animals whose gut contents were investigated, it appeared that only rotifers and
Daphnia were important in reducing the numbers of plankton algae. Brachionuspala and Daphnia pulex both had large numbers of the smaller plankton algae from the tubs in their stomachs-in
fact, these algae appeared to be their main diet in the tub environment. Live individuals of
Brachionuspala in a culture of Diogenes were observed to take in large numbers of the algae by the action of the cilia on their trochal disks. Once eaten by a rotifer, the algae fairly rapidly
became unrecognizable, only the somewhat misshapen cell wall surviving digestion. In the gut of Daphnia, the algae retained their shape over a longer period. Neither of these animals appeared
to show any selectivity in feeding, apart from that imposed by the relative sizes of animals and
algae. Brachionus ate Chlorella as well as Diogenes rotundus, when both were present, but nothing larger. Daphnia ate any alga occurring in the cultures in which it was grown, up to the
size of PediastrumBoryanum, small individuals of which were found in its gut (Pennington,1941) .
The other animals commonly present in the tubs were not important in reducing the numbers of
plankton algae. The only other plankton feeder was the larva of Culex sp., which was frequent in the summer. The guts of these were full of plankton algae, but the larvae did not occur in
sufficiently large numbers to cause an appreciable reduction in the numbers of algae in the tub (Pennington,1941).
The Objectives of the experiment were as follows:
1. To determine the effects of plankton on growth rates of tilapia. 2. To compare the differences between organic fertilizers (cow manure) and inorganic
fertilizers (Triple Super Phosphate (TSP) and urea) on phytoplankton ―bloom‖
3. What causes phytoplankton bloom to ―crash or die off‖

443
Materials used in the experiments are:
Four tanks each measuring 7.3 m.
Triple Super Phosphate (TSP) Urea
Cow manure 1 Secchi disk
Agricultural lime Biological microscope
Slides
Digital camera pH meter
DO meter Temperature meter
40 fishes, 10 fish per tank
Procedure used for conducting the experiment:
1. The tanks 1, 2, 3 and 4 at the SatyadeowSawh Aquaculture were treated with agriculture lime to kill any unwanted fish and increase the pH of the water.
2. Water sample was collected from the concrete ponds, using a microscope the samples were examine to identify the algae present; chlorella was isolated and culture in the lab.
It was then used to inoculate the selective tanks.
3. Tank 1 was not fertilized nor inoculated with chlorella, tank 2 was fertilized with cow manure (0.14g/m2) and inoculated with chlorella, tank 3 was fertilized with TSP
(0.014g/m2) and Urea (0.014g/m2) not inoculated with chlorella, while tank 4 was fertilized with cow manure (0.14g/m2), TSP (0.014g/m2) and Urea (0.014g/m2) and
inoculated with chlorella.
4. Ten fishes between 20 – 25g were placed into each tank. 5. Every two weeks they were weighted and the figures recorded
6. The transparency of the water was checked twice weekly (Tuesday and Friday) using a secchi disc to monitor the fertilization process.
7. The pH meter was used to check the pH daily (morning at 9 hrs and afternoon at 15 hrs).
8. The DO meter was used to check the dissolved oxygen level daily (morning at 9 hrs and
afternoon at 15 hrs). 9. The thermometer was used to check the temperature of the water daily (morning at 9
hrs and afternoon at 15 hrs). 10. Water samples were collected once a week and observed under the microscope.
11. Water exchange was conducted on Mondays and Fridays or as a need arise.
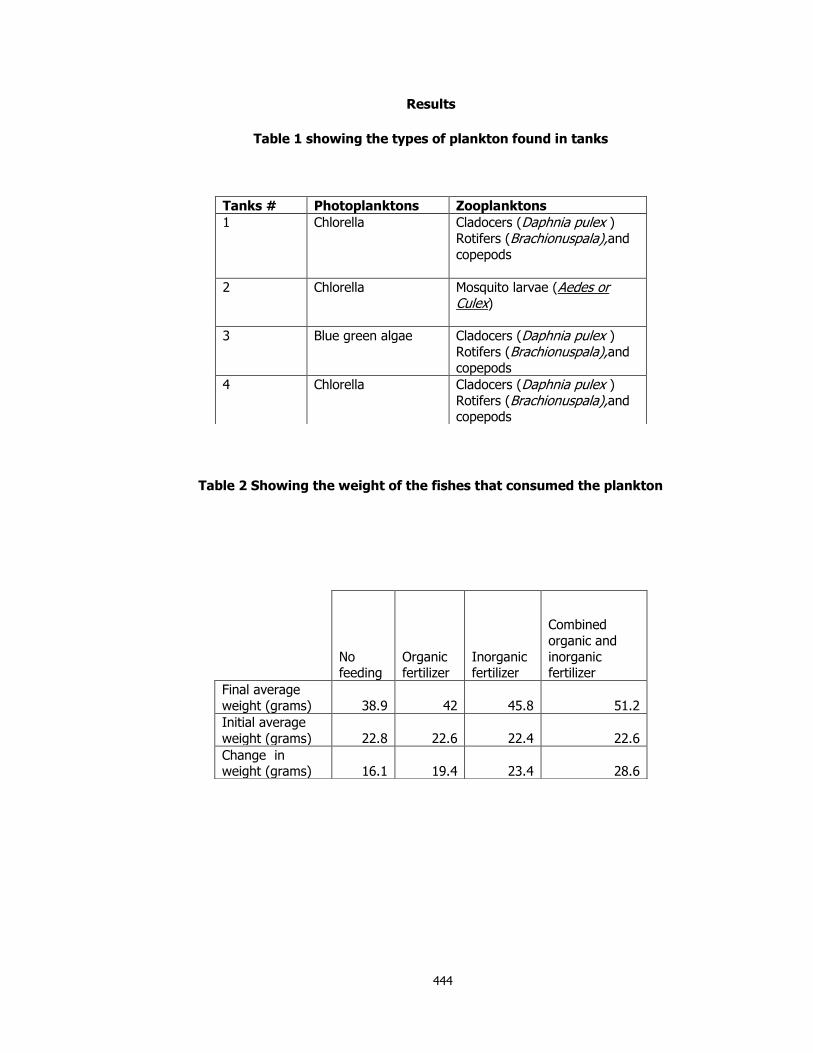
444
Results
Table 1 showing the types of plankton found in tanks
Table 2 Showing the weight of the fishes that consumed the plankton
Tanks # Photoplanktons Zooplanktons
1 Chlorella Cladocers (Daphnia pulex )
Rotifers (Brachionuspala),and
copepods
2 Chlorella Mosquito larvae (Aedes or Culex)
3 Blue green algae Cladocers (Daphnia pulex )
Rotifers (Brachionuspala),and
copepods
4 Chlorella Cladocers (Daphnia pulex )
Rotifers (Brachionuspala),and copepods
No feeding
Organic fertilizer
Inorganic fertilizer
Combined
organic and
inorganic fertilizer
Final average
weight (grams) 38.9 42 45.8 51.2
Initial average
weight (grams) 22.8 22.6 22.4 22.6
Change in weight (grams) 16.1 19.4 23.4 28.6
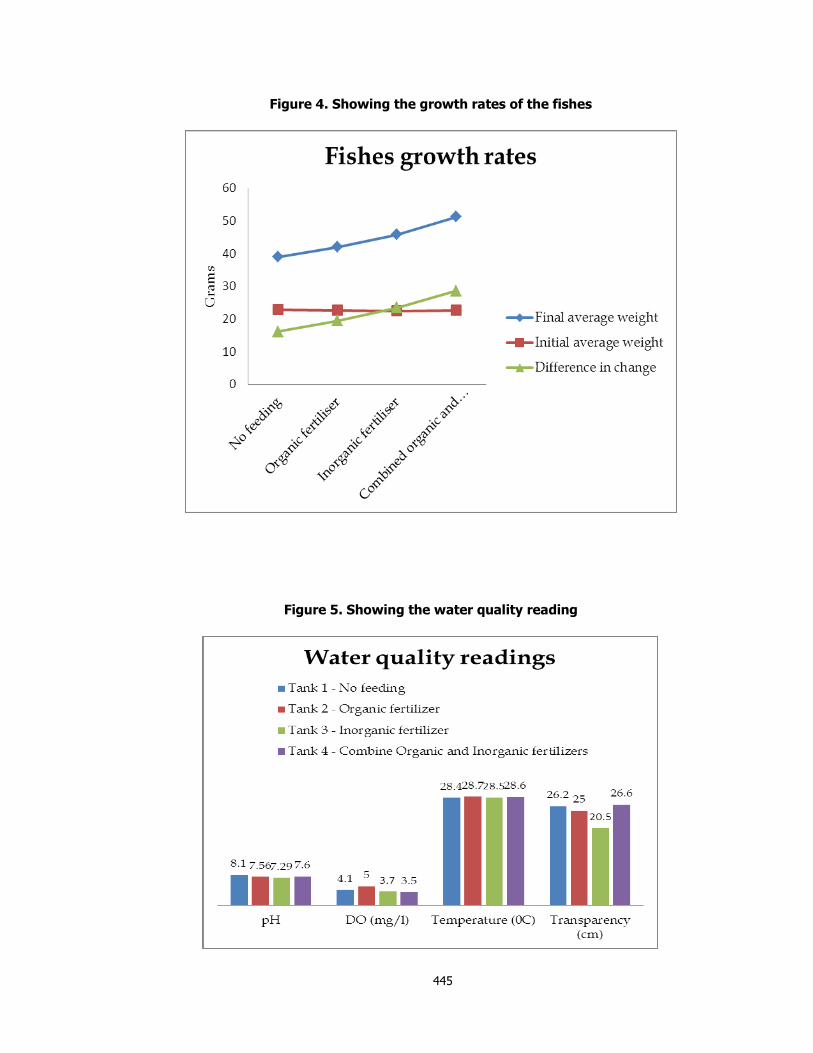
445
Figure 4. Showing the growth rates of the fishes
Figure 5. Showing the water quality reading
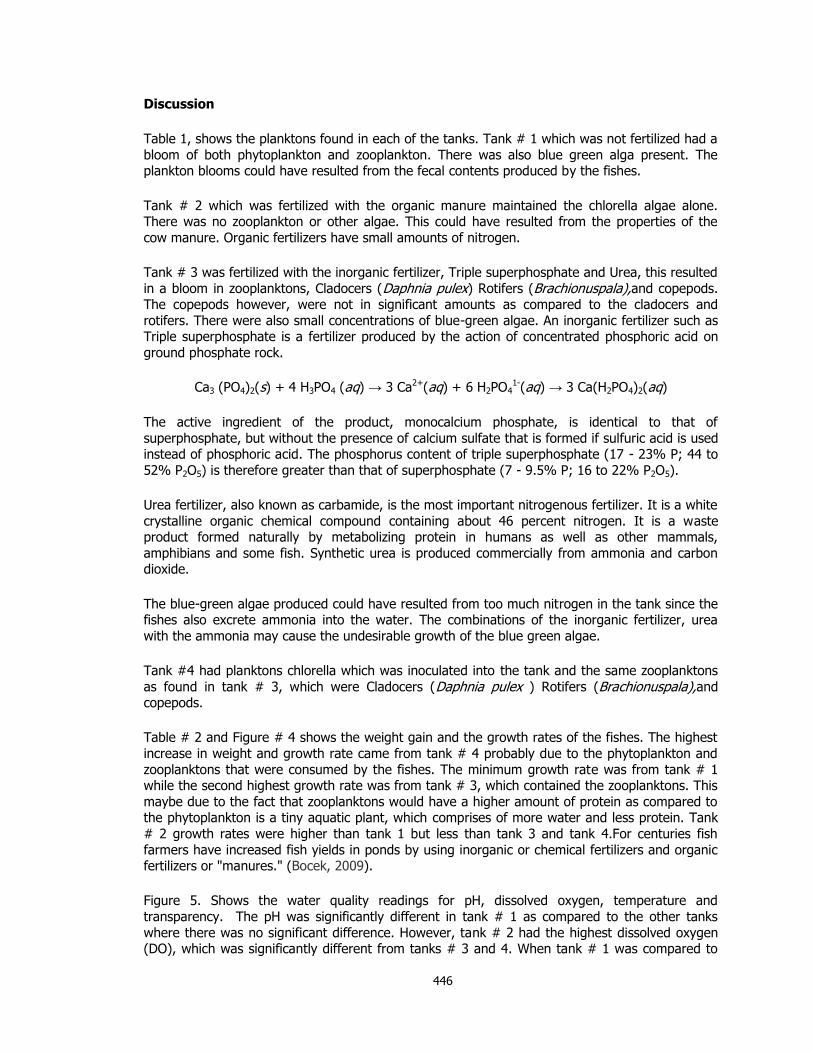
446
Discussion
Table 1, shows the planktons found in each of the tanks. Tank # 1 which was not fertilized had a
bloom of both phytoplankton and zooplankton. There was also blue green alga present. The plankton blooms could have resulted from the fecal contents produced by the fishes.
Tank # 2 which was fertilized with the organic manure maintained the chlorella algae alone. There was no zooplankton or other algae. This could have resulted from the properties of the
cow manure. Organic fertilizers have small amounts of nitrogen.
Tank # 3 was fertilized with the inorganic fertilizer, Triple superphosphate and Urea, this resulted
in a bloom in zooplanktons, Cladocers (Daphnia pulex) Rotifers (Brachionuspala),and copepods. The copepods however, were not in significant amounts as compared to the cladocers and
rotifers. There were also small concentrations of blue-green algae. An inorganic fertilizer such as Triple superphosphate is a fertilizer produced by the action of concentrated phosphoric acid on
ground phosphate rock.
Ca3 (PO4)2(s) + 4 H3PO4 (aq) → 3 Ca2+(aq) + 6 H2PO41-(aq) → 3 Ca(H2PO4)2(aq)
The active ingredient of the product, monocalcium phosphate, is identical to that of
superphosphate, but without the presence of calcium sulfate that is formed if sulfuric acid is used instead of phosphoric acid. The phosphorus content of triple superphosphate (17 - 23% P; 44 to
52% P2O5) is therefore greater than that of superphosphate (7 - 9.5% P; 16 to 22% P2O5).
Urea fertilizer, also known as carbamide, is the most important nitrogenous fertilizer. It is a white
crystalline organic chemical compound containing about 46 percent nitrogen. It is a waste product formed naturally by metabolizing protein in humans as well as other mammals,
amphibians and some fish. Synthetic urea is produced commercially from ammonia and carbon dioxide.
The blue-green algae produced could have resulted from too much nitrogen in the tank since the fishes also excrete ammonia into the water. The combinations of the inorganic fertilizer, urea
with the ammonia may cause the undesirable growth of the blue green algae.
Tank #4 had planktons chlorella which was inoculated into the tank and the same zooplanktons
as found in tank # 3, which were Cladocers (Daphnia pulex ) Rotifers (Brachionuspala),and copepods.
Table # 2 and Figure # 4 shows the weight gain and the growth rates of the fishes. The highest
increase in weight and growth rate came from tank # 4 probably due to the phytoplankton and
zooplanktons that were consumed by the fishes. The minimum growth rate was from tank # 1 while the second highest growth rate was from tank # 3, which contained the zooplanktons. This
maybe due to the fact that zooplanktons would have a higher amount of protein as compared to the phytoplankton is a tiny aquatic plant, which comprises of more water and less protein. Tank
# 2 growth rates were higher than tank 1 but less than tank 3 and tank 4.For centuries fish
farmers have increased fish yields in ponds by using inorganic or chemical fertilizers and organic fertilizers or "manures." (Bocek, 2009).
Figure 5. Shows the water quality readings for pH, dissolved oxygen, temperature and
transparency. The pH was significantly different in tank # 1 as compared to the other tanks
where there was no significant difference. However, tank # 2 had the highest dissolved oxygen (DO), which was significantly different from tanks # 3 and 4. When tank # 1 was compared to
447
tank # 2 there was no significant difference, where as, there were significant differences when
compared to tank # 3 and 4. We hypothesized that tank # 2 had the highest DO because there was a higher amount of phytoplankton in that tank. The zooplankton population was higher in
tanks # 3 and # 4, which consumed the phytoplankton, hence a lower DO.Bocek, 2009 had observed this action.
There was no significant difference in temperature between all the tanks.
There was significant difference in tank # 3 as it related to the transparency, which was measured using a Secchi disc where as there were no significant differences in the other tanks.
There reasons why tank # 2 had the lowest transparency is probably because the zooplankton
population was higher in the tanks, which consumed the phytoplankton. This was similar to what Bocek, 2009 had observed.
Phytoplankton populations, or blooms, can grow rapidly, particularly on sunny days when the
water is warm and nutrients are available. Alternatively, they can die-off quickly, especially in the
spring and fall as water temperatures change rapidly with weather fronts. However, a bloom die-off can occur at any time of the year with little or no warning.
Typically during a bloom die-off, the color of the water will start to change. Leading up to a
bloom die-off, the pond water may have a ―streaky‖ appearance. Streaks of brown or gray-black
through the otherwise green water of the pond is an indication that the algae are starting to die. As the die-off progresses, the whole pond will turn from green to gray, brown, or clear. The pond
water will typically clear after a die-off as the dead algae settle to the bottom.
Plankton die-offs cause rapid oxygen depletions for two reasons: 1) the remaining dissolved
oxygen is consumed by aerobic bacteria and fungi in the process of decaying the dead algae and 2) few live phytoplankton‘s remain to produce more oxygen. Secchi disks can be used to monitor
bloom densities. Any bloom that reduces visibility in the pond to 25 cm or less may cause oxygen problems. Plankton-feeding animals control the numbers of the phytoplankton and havean
impact on the numbers of the phytoplankton found in the tanks. This depends on the numbers
of animals and algae present. When the numbers of algae are tiny, a small number of animals may prevent any increase in algal numbers. It is believed that this occurred in the tanks in which
the algal inoculum failed to grow and disappeared.
Once the algae started to increase, the sequence of events described a crash. Initially, there is a
steady increase in the numbers of algae, the reproduction rate is sufficient to compensate for the numbers eaten by animals. However, as the algae reproduction rate begins to slow down, a
critical stage is reached when the reproduction rate, where the numbers balances the daily increase in numbers consumed by animals. Further, an increase in the number of animals at this
stage resulted in a crash, whereby the numbers of algae were rapidly reduced, until nearly all
was destroyed. This produced important changes in water composition, notably almost complete oxygen depletion, as a result of this the animals are frequently destroyed. The few remaining
algae are not destroyed, and after the death of the animals begin to multiply rapidly once more. This may have been the reason why tanks # 3 and #4 had the low oxygen level and tank # 3
had the lowest Secchi reading. The time at which the critical stage is reached is not the same. This is may be due to differences from one tank to another, in the respective reproduction rates
of animals and algae. The factors controlling these reproduction rates are still unknown.
Sometimes the critical stage was reached soon after inoculation, before the numbers of algae were very high, and there was no sudden asphyxiation, but only a gradual disappearance,
apparently from starvation, following the disappearance of the algae. While no direct proof can be offered, it seems likely that the differences were due to variation in the animal population,
448
arising from chance inoculation with animals from previous experiments.
Pennington, (1941) found a phenomenon that was similar to what was described from the
experimental tubs. In the rich culture solution of the tubs, both animals and algae were present in greater concentration than is found in ponds, but there was no reason why similar crashs
should not occur in eutrophic ponds. A crash was observed in a pond near Burghfield Common,
Reading, in the autumn of 1938. A rich growth of algae, comprising mainly of flagellates, developed in the water, and then suddenly disappeared, the disappearance coincided with the
appearance of large numbers of Cladoceran (probably Daphnia sp.) and a Copepod. The water became black and acquired a foul smell, which was typical of anaerobic waters. The late phase of
a crash, in which the zooplankton is concentrated in the upper layers of the water, which are
more oxygenated, and algae have practically disappeared from the water, is common in farm ponds.
The differences in the growth of algae in similarly treated tanks may be due to the chance of variation in the number of plankton-feeding animals. In tanks, the effects of plankton-feeding
animals on the phytoplankton showed no relation to season.
Conclusion
It was found that when organic fertilizers are used there is a higher phytoplankton bloom and
higher oxygen level in the tanks where as when inorganic fertilizers are used there is a greater zooplankton population.
When organic and inorganic fertilizers are combined it provides food for fishes and the fishes in
the combined tank had the highest weight gained. Obtaining maximum fish production, it is
necessary to maintain the nutrient status of the pond to an optimum range. (Brunson et al, 1999). Brachionuspala and Daphnia pulex which are plankton-feeding animals, will decrease the
numbers of the phytoplankton very rapidly when present in high numbers.
It was observed that a rapid reduction of the phytoplankton was accompanied by almost
complete oxygen depletion, and death of the animals, after which the algae population increased again. This cycle of events observed in experimental tubs, has been found to occur in ponds,
Pennington, (1941). In addition to rapid and sudden reduction in numbers of algae, plankton-feeding animals may have important effects on the rate of increase in numbers of algae at any
stage of the annual cycle.
References
Bocek, A. 2009.Water Harvesting and Aquaculture for Rural Development. International
Center for Aquaculture and Aquatic Environments, Swingle Hall. Auburn University,
Alabama 36849-5419 USA. Brunson, W., Stone, N. and Hargreaves, J. 1999. Fertilization of Fish Ponds. PR SRAC
Publication No. 471 SRAC Publication No. 471. Dieffenbach, H. &Sachse, R. (1912). BiologischeUntersuchungenanRadertieren in
Teichgewassern. Internat. Rev. Hydrobiol., Biol. Supp. 4.
Pennington, Winifred (1941). Diogenes rotundus, gen. et sp. nov.-a new alga from experimental tubs. J. Bot. 1941 (in the press).
Winifred Pennington (Aug., 1941) The Control of the Numbers of Freshwater Phytoplankton by Small Invertebrate Animals, Journal of Ecology, Vol. 29, No. 2 (Aug., 1941), pp. 204-211
Published by: British Ecological Society
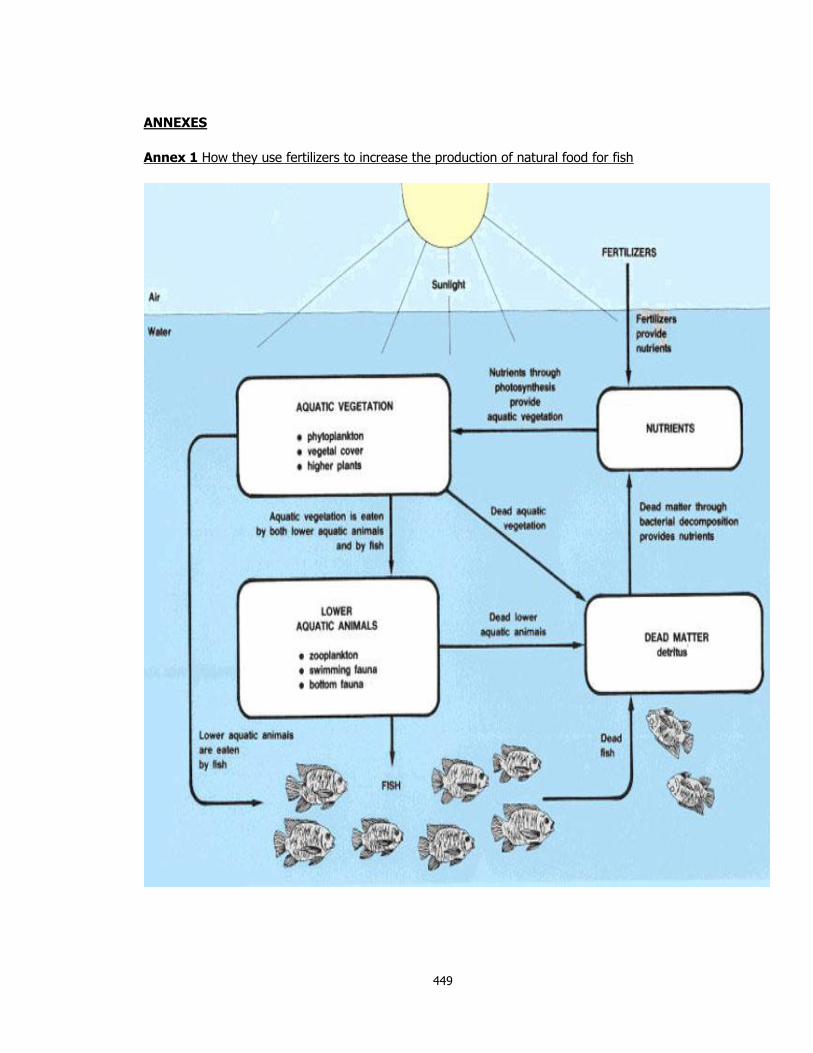
449
ANNEXES
Annex 1 How they use fertilizers to increase the production of natural food for fish
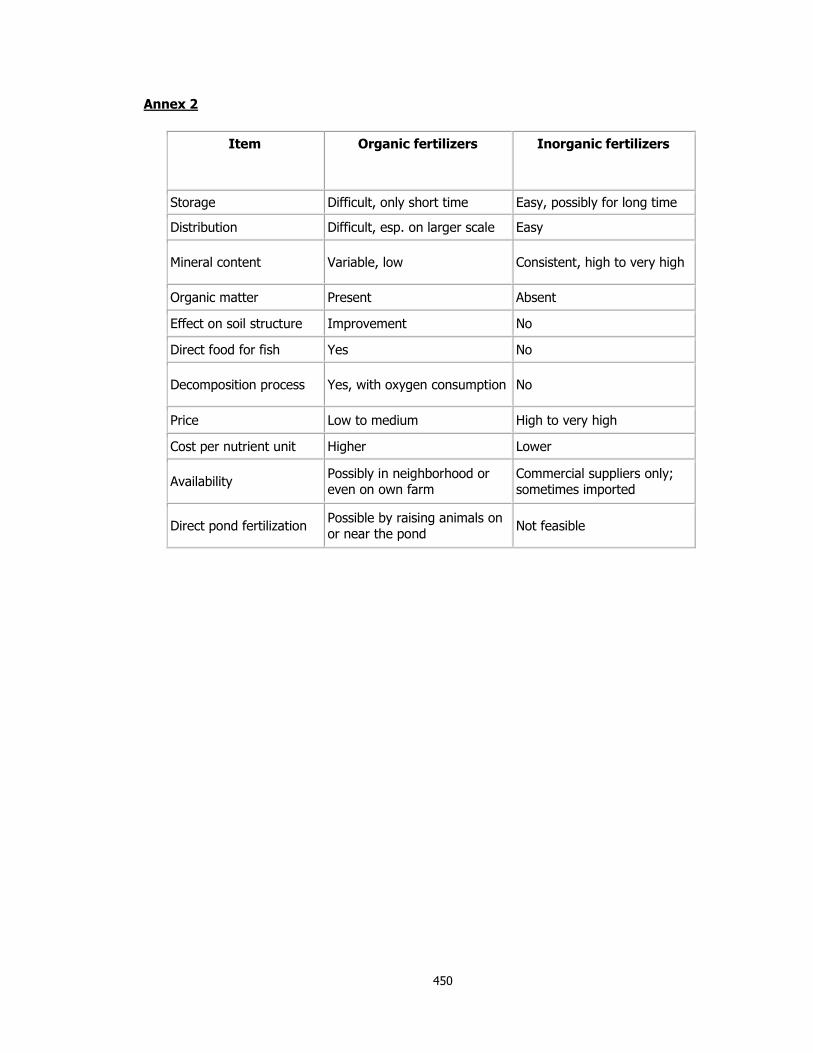
450
Annex 2
Item
Organic fertilizers
Inorganic fertilizers
Storage Difficult, only short time Easy, possibly for long time
Distribution Difficult, esp. on larger scale Easy
Mineral content Variable, low Consistent, high to very high
Organic matter Present Absent
Effect on soil structure Improvement No
Direct food for fish Yes No
Decomposition process Yes, with oxygen consumption No
Price Low to medium High to very high
Cost per nutrient unit Higher Lower
Availability Possibly in neighborhood or even on own farm
Commercial suppliers only; sometimes imported
Direct pond fertilization Possible by raising animals on or near the pond
Not feasible