Embed Size (px)
Citation preview
Economics 209BBehavioral / Experimental Game Theory
(Spring 2008)
Lecture 2: Games with Pure Information Externalities

Background
• Social learning describes any situation in which individuals learn by observ-ing the behavior of others.
• Several economic theories explain the existence of uniform social behavior:
— benefits from conformity
— sanctions imposed on deviants
— network / payoff externalities
— social learning.

The canonical model of social learning
• A set of players N , a finite set of actions A, a set of states of nature Ω,and a common payoff function
U(a, ω)
where a ∈ A is the action chosen and ω ∈ Ω is the state of nature.
• Player i receives a private signal σi(ω), a function of the state of natureω, and uses this private information to identify a payoff-maximizing action.

The canonical assumptions
— Bayes-rational behavior
— Incomplete and asymmetric information
— Pure information externality
— Once-in-a-lifetime decisions
— Exogenous sequencing
— Perfect information

Direct methodological extensions
— Caplin and Leahy (AER 1994)
— Chamley and Gale (ECM 1994)
— Bala and Goyal (RES 1998)
— Avery and Zemsky (AER 1999)
— Çelen and Kariv (GEB 2004)
— Gale and Kariv (GEB 2004)

The model of BHW (JPE 1992)
• There are two decision-relevant events, say A and B, equally likely tooccur ex ante and two corresponding signals a and b.
• Signals are informative in the sense that there is a probability higher than1/2 that a signal matches the label of the realized event.
• The decision to be made is a prediction of which of the events takes place,basing the forecast on a private signal and the history of past decisions.

• Whenever two consecutive decisions coincide, say both predict A, the sub-sequent player should also choose A even if his signal is different b.
• Despite the asymmetry of private information, eventually every player im-itates her predecessor.
• Since actions aggregate information poorly, despite the available informa-tion, such herds / cascades often adopt a suboptimal action.
• Anderson and Holt (AER 1997) investigate the social learning model ofBHW experimentally.
• They report that “rational” herds / cascades formed in most rounds andthat about half of the cascades were incorrect.
• Extensions: Hung and Plott (AER 2001), Kübler and Weizsäcker (RES2004), Goeree, Palfrey, Rogers and McKelvey (RES 2007).

The model of Smith and Sørensen (ECM 2000)
• Two phenomena that have elicited particular interest are informationalcascades and herd behavior.
— Cascade: players ’ignore’ their private information when choosing anaction.
— Herd: players choose the same action, not necessarily ignoring theirprivate information.
• Smith and Sørensen (2000) show that with a continuous signal space herdbehavior arises, yet there need be no informational cascade.
The model of Çelen and Kariv (GEB 2004)
Signals
— Each player n ∈ 1, ..., N receives a signal θn that is private infor-mation.
— For simplicity, θn are independent and uniformly distributed on [−1, 1].
Actions
— Sequentially, each player n has to make a binary irreversible decisionxn ∈ 0, 1.

Payoffs
— x = 1 is profitable if and only ifPn≤N θn ≥ 0, and x = 0 is profitable
otherwise.
Information
— Perfect information
In = θn, (x1, ..., xn−1)
— Imperfect information
In = θn, xn−1
The decision problem
— The optimal decision rule is given by
xn = 1 if and only if EhPN
i=1 θi | Ini≥ 0.
Since In does not provide any information about the content of suc-cessors’ signals, we obtain
xn = 1 if and only if θn ≥ −EhPn−1
i=1 θi | Ini.
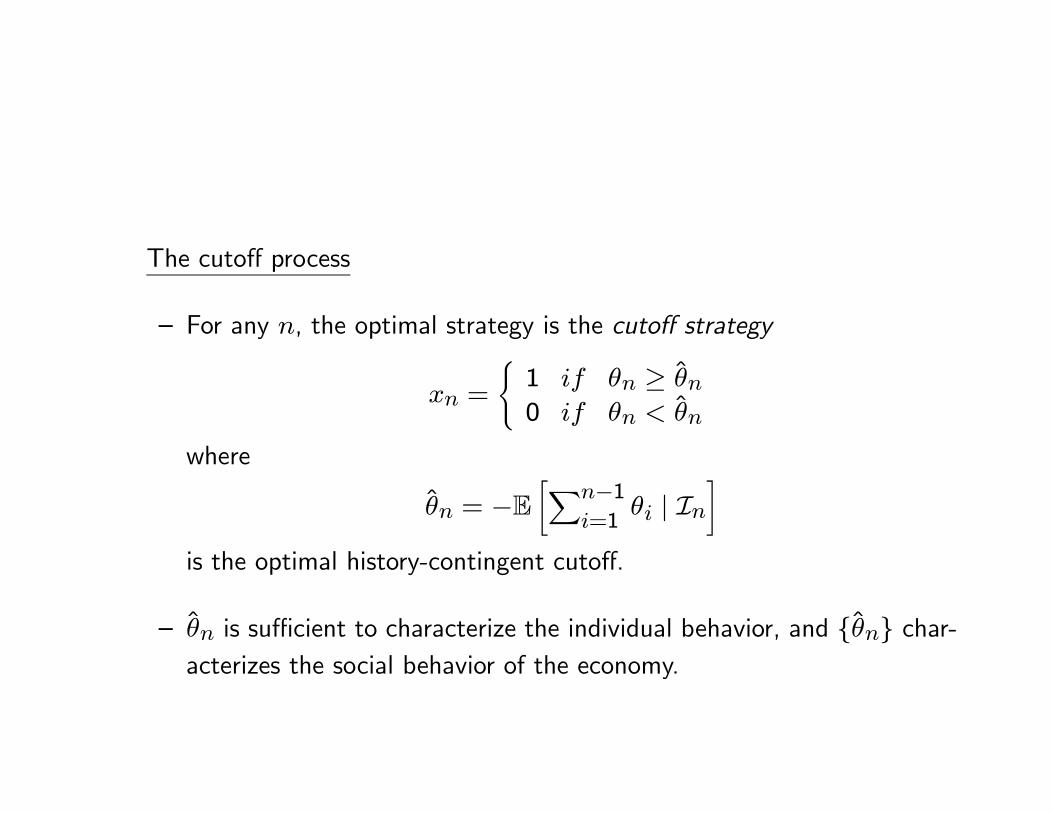
The cutoff process
— For any n, the optimal strategy is the cutoff strategy
xn =
(1 if θn ≥ θn0 if θn < θn
where
θn = −E∙Xn−1
i=1θi | In
¸is the optimal history-contingent cutoff.
— θn is sufficient to characterize the individual behavior, and θn char-acterizes the social behavior of the economy.
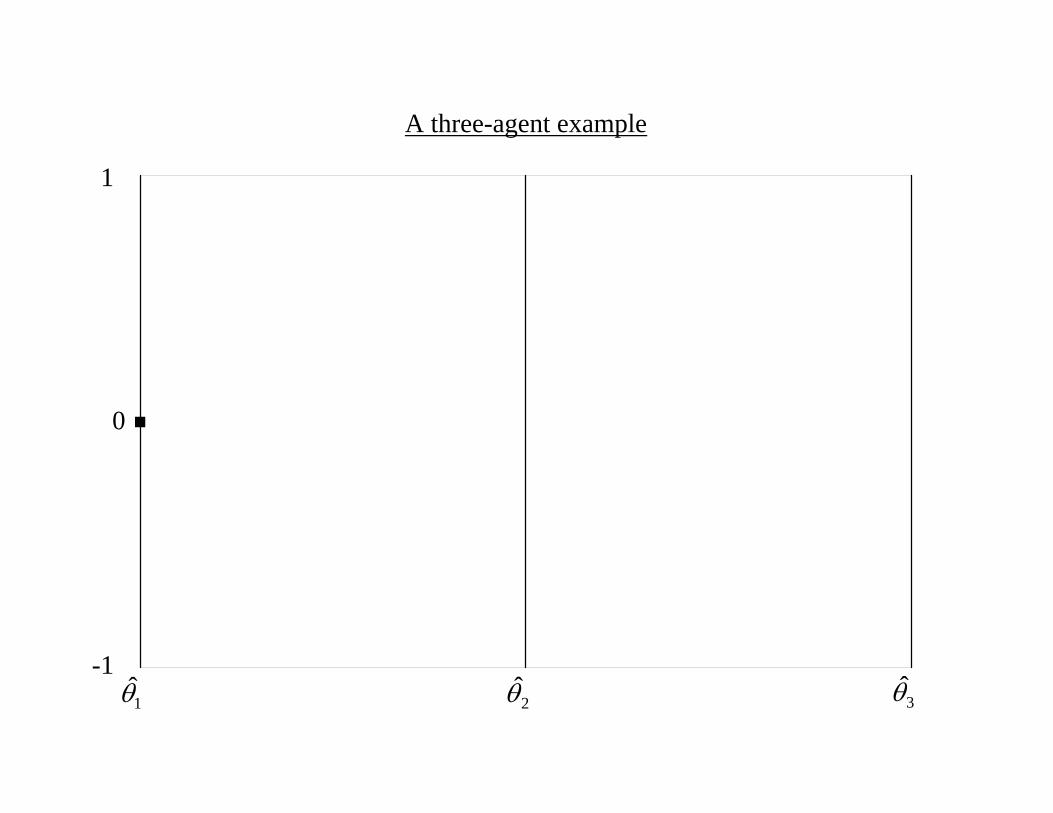
A three-agent example
0
1θ 2θ 3θ
1
-1

A three-agent example
0
- 1/2
1/2
1θ 2θ 3θ
x =0
x =1
1
-1

A three-agent example under perfect information
- 3/4
- 1/2
0
1/2
- 1/4
1/4
3/4
1θ 2θ 3θ
x =0
x =1
1
-1

A three-agent example under imperfect information
- 5/8- 1/2
0
5/81/2
1θ 2θ 3θ
1
-1
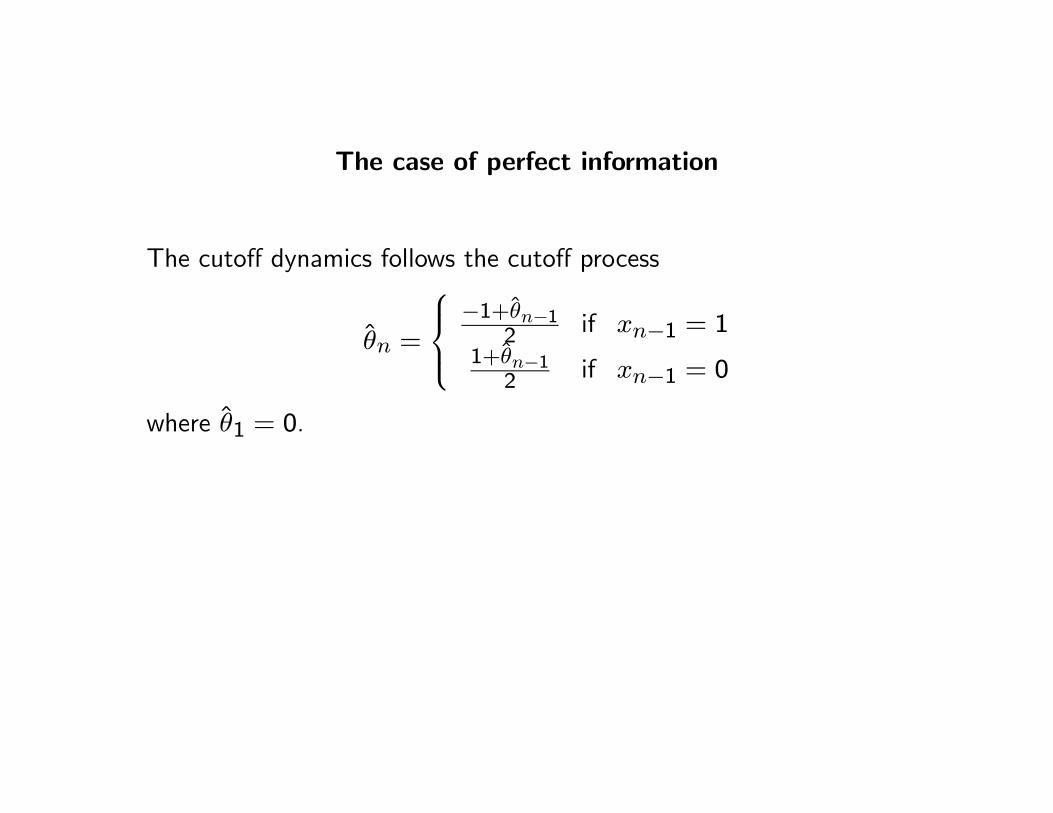
The case of perfect information
The cutoff dynamics follows the cutoff process
θn =
⎧⎪⎨⎪⎩−1+θn−1
2 if xn−1 = 11+θn−1
2 if xn−1 = 0
where θ1 = 0.

A sequence of cutoffs under perfect information
-1.0-0.9-0.8-0.7-0.6-0.5-0.4-0.3-0.2-0.10.0
1 2 3 4 5 6 7 8 9 10Agent
Cut
off
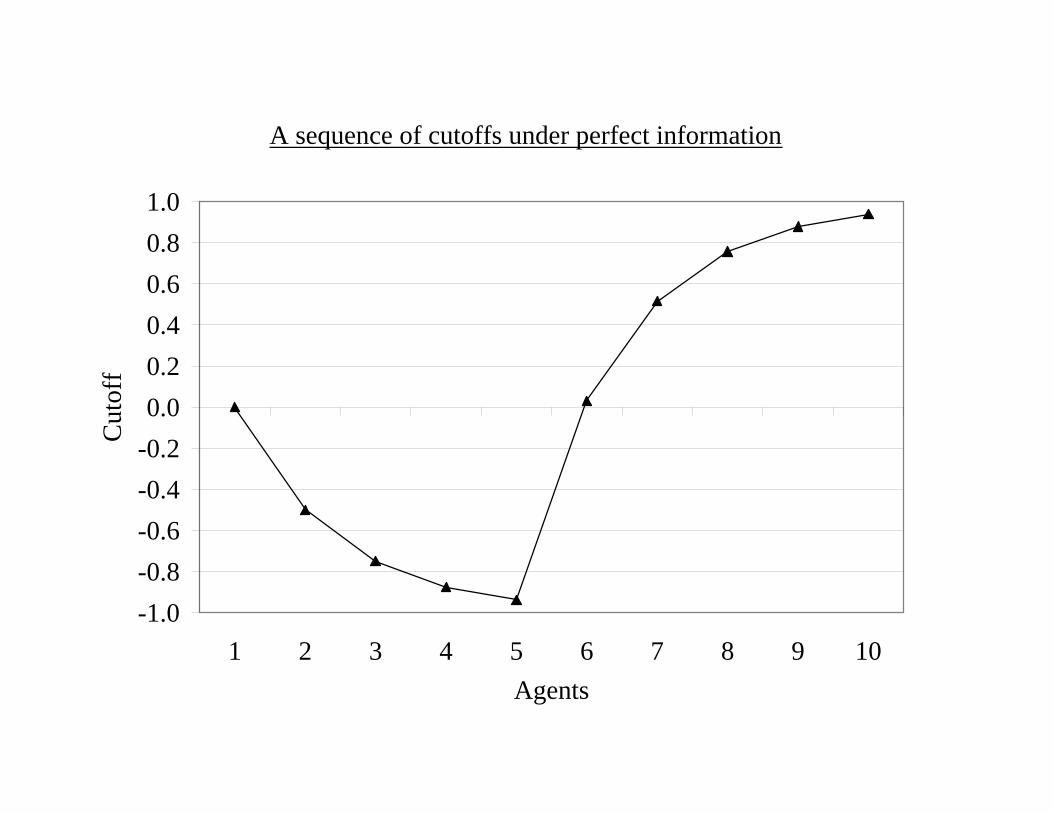
A sequence of cutoffs under perfect information
-1.0-0.8-0.6-0.4-0.20.00.20.40.60.81.0
1 2 3 4 5 6 7 8 9 10Agents
Cut
off
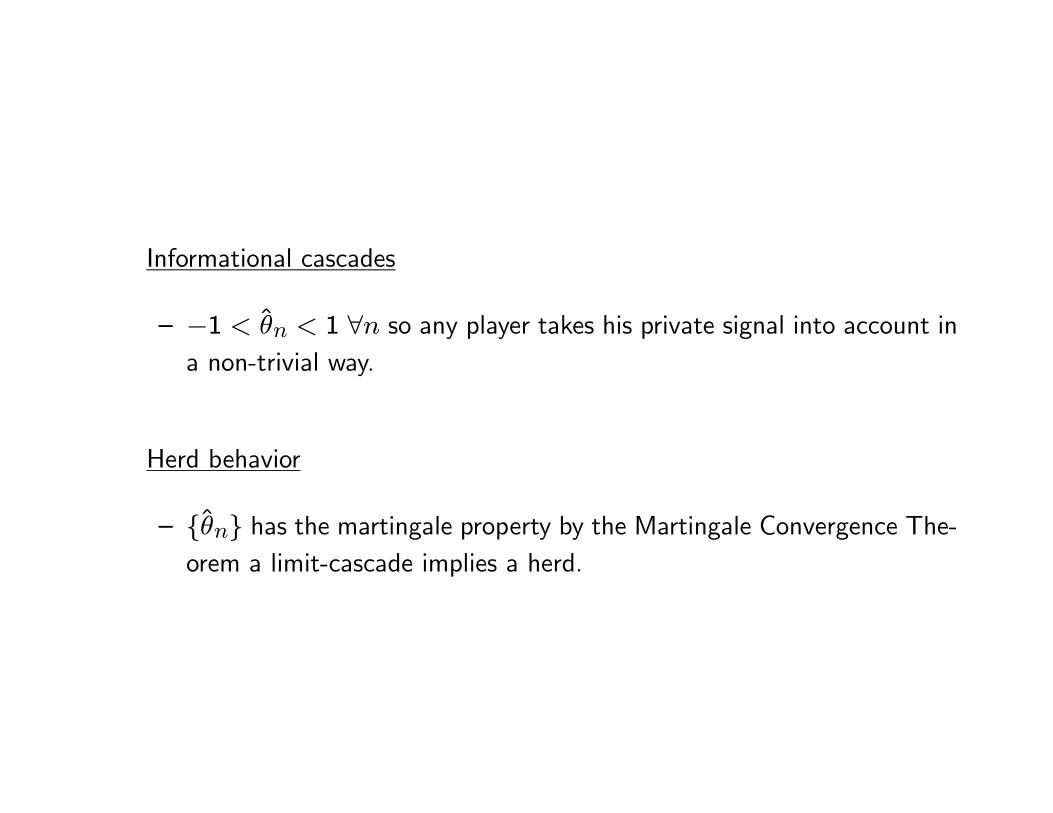
Informational cascades
— −1 < θn < 1 ∀n so any player takes his private signal into account ina non-trivial way.
Herd behavior
— θn has the martingale property by the Martingale Convergence The-orem a limit-cascade implies a herd.

The case of imperfect information
The cutoff dynamics follows the cutoff process
θn =
⎧⎪⎨⎪⎩ −1+θ
2n−12 if xn−1 = 1
1+θ2n−12 if xn−1 = 0
where θ1 = 0.

A sequence of cutoffs under imperfect and perfect information
-1.0-0.9-0.8-0.7-0.6-0.5-0.4-0.3-0.2-0.10.0
1 2 3 4 5 6 7 8 9 10Agent
Cut
off
Perfect
Imperfect
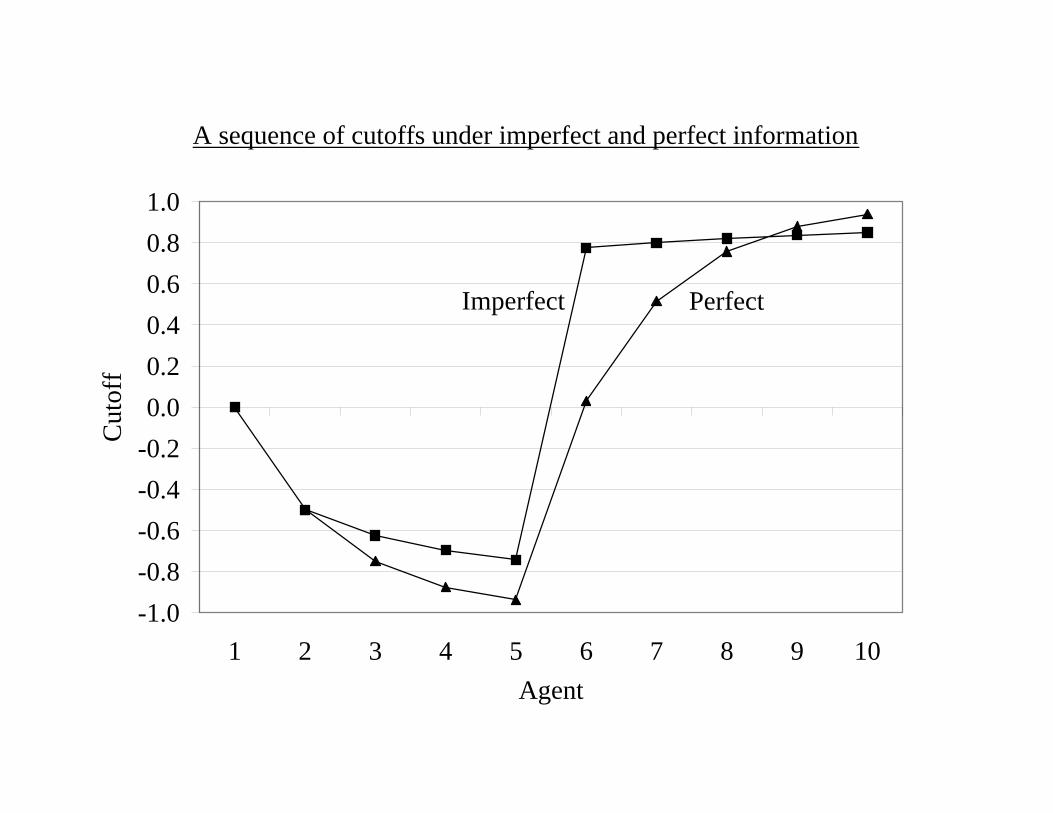
A sequence of cutoffs under imperfect and perfect information
-1.0-0.8-0.6-0.4-0.20.00.20.40.60.81.0
1 2 3 4 5 6 7 8 9 10Agent
Cut
off
PerfectImperfect

Informational cascades
— −1 < θn < 1 ∀n so any player takes his private signal into account ina non-trivial way.
Herd behavior
— θn is not convergent and the divergence of cutoffs implies divergenceof actions.
— Behavior exhibits periods of uniform behavior, punctuated by increas-ingly rare switches.

Takeaways
• The dynamics of social learning depend crucially on the extensive form ofthe game.
• Longer and longer periods of uniform behavior, punctuated by (increasinglyrare) switches.
• A succession of fads: starting suddenly, expiring easily, each replaced byanother fad.
• Why do markets move from ‘boom’ to ‘crash’ without settling down?

The experiments of Çelen and Kariv (AER 2004, ET 2005)
• In market settings, we observe behavior but not beliefs or private informa-tion.
• In the laboratory, we can elicit subjects’ beliefs and control their privateinformation.
• Test the model’s predictions and study the effects of variables about whichour existing theory has little to say.

Perfect information(Mean cutoffs when all predecessors acted alike)
0.00.10.20.30.40.50.60.70.80.91.0
2 3 4 5 6 7 8Subject
Cut
off
Actual
Theory

0%5%
10%15%20%25%30%35%40%45%50%
Concurring Neutral Contrary
Percentage of concurring, neutral and contrary decision points

0%5%
10%15%20%25%30%35%40%45%50%
0 - 2 3 - 5 6 - 8 9 -12 13 - 15
The distribution of contrary subjects
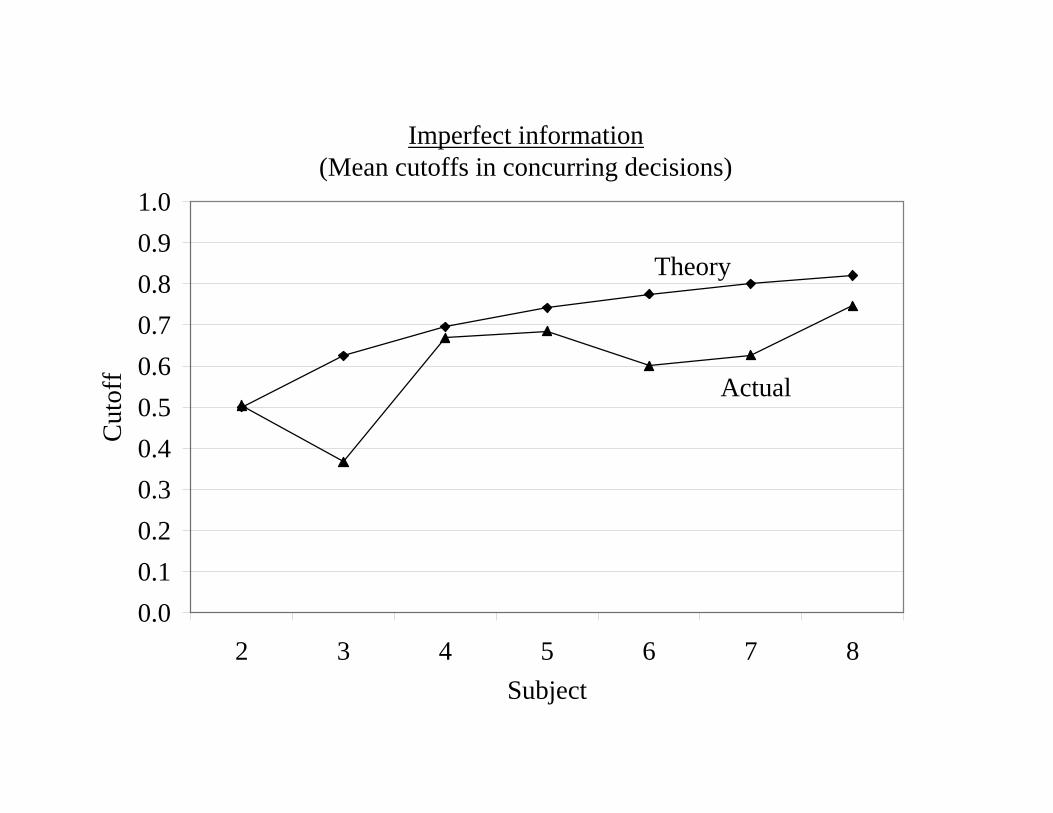
Imperfect information(Mean cutoffs in concurring decisions)
0.00.10.20.30.40.50.60.70.80.91.0
2 3 4 5 6 7 8Subject
Cut
off
Theory
Actual
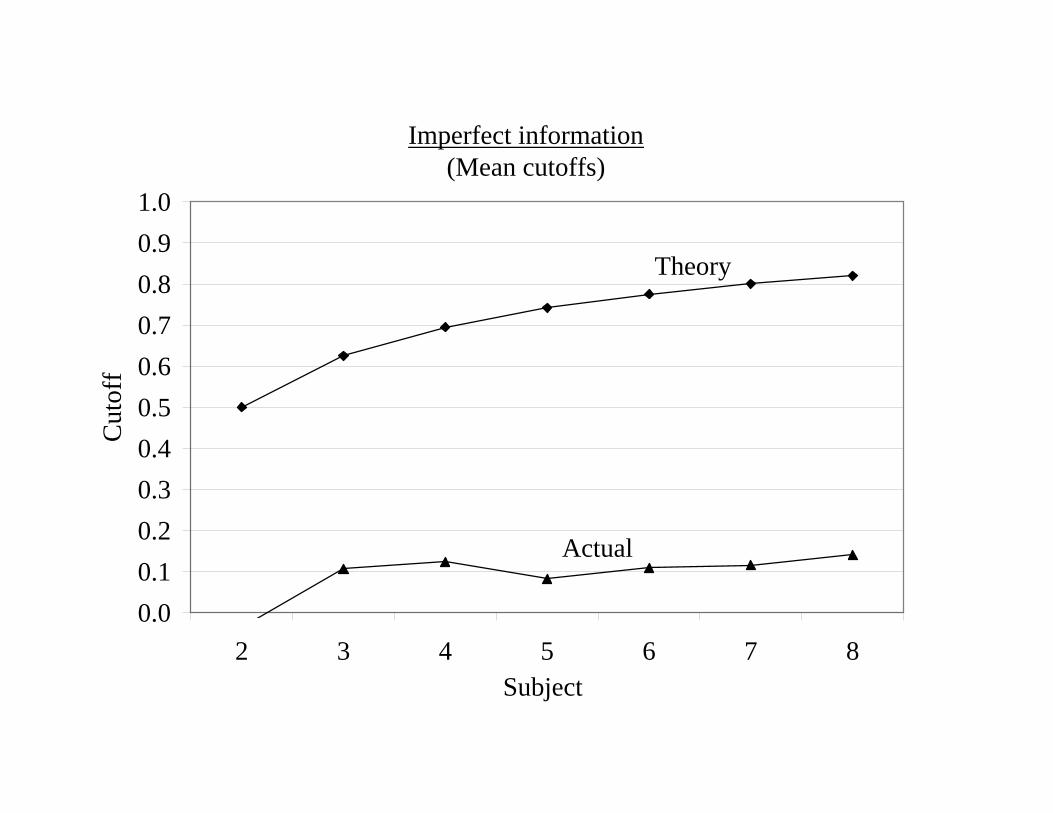
Imperfect information(Mean cutoffs)
0.00.10.20.30.40.50.60.70.80.91.0
2 3 4 5 6 7 8Subject
Cut
off
Theory
Actual

The econometric analysis
• At each decision turn n, with probability pn a player is rationally, and withprobability 1− pn he is noisy.
• The cutoff of a noisy player is a random draw from a distribution functionGn with support [−1, 1] and mean θn.
• Others cannot observe whether a player behavior is noisy, but the sequencespn and Gn are common knowledge.

The estimated cutoff process
— The cutoff dynamics of rational players follow the process
θn = θn−1 −
⎧⎪⎨⎪⎩10+(1−pn−1)θn−1+pn−1θn−1
2 if xn−1 = A,−10+(1−pn−1)θn−1+pn−1θn−1
2 if xn−1 = B,
where θ1 = 0.
— The estimated parameters for the first decision-turn are employed inestimating the parameters for the second turn, and so on.

Sequences of cutoffs under perfect information(Theory and estimated)
-1.0-0.9-0.8-0.7-0.6-0.5-0.4-0.3-0.2-0.10.0
1 2 3 4 5 6 7 8Subject
Cut
off
TheoryEstimated
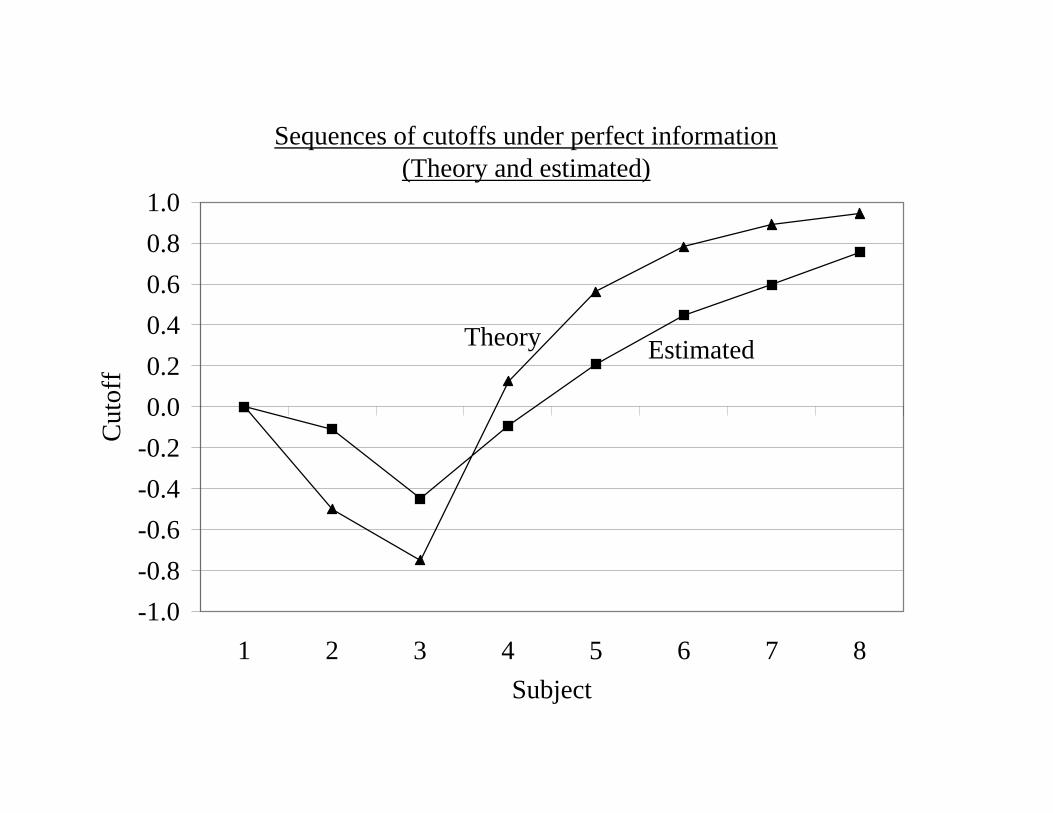
Sequences of cutoffs under perfect information(Theory and estimated)
-1.0-0.8-0.6-0.4-0.20.00.20.40.60.81.0
1 2 3 4 5 6 7 8Subject
Cut
off
Theory Estimated

The model of Gale and Kariv (GEB 2004)
• Agents are bound together by a social network, a complex of relationshipsthat brings them into contact with other agents.
• Markets are characterized by agents connected by complex, multilateralinformation networks.
• The network is represented by a family of sets Ni where Ni denotes theset of agents j 6= i who can be observed by agent i.
• Agents choose actions simultaneously and revise their decisions as newinformation is received.
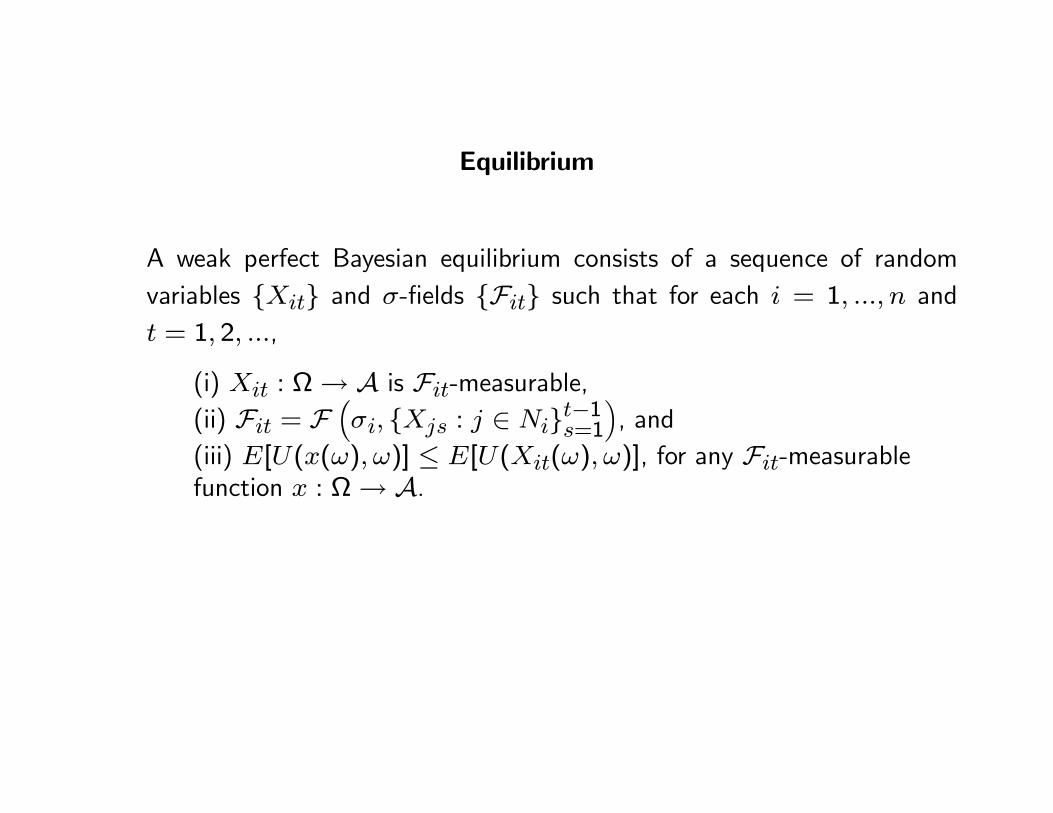
Equilibrium
A weak perfect Bayesian equilibrium consists of a sequence of randomvariables Xit and σ-fields Fit such that for each i = 1, ..., n andt = 1, 2, ...,
(i) Xit : Ω→ A is Fit-measurable,(ii) Fit = F
³σi, Xjs : j ∈ Nit−1s=1
´, and
(iii) E[U(x(ω), ω)] ≤ E[U(Xit(ω), ω)], for any Fit-measurablefunction x : Ω→ A.

Asymptotic properties
• The welfare-improvement principle
— Agents have perfect recall, so expected utility is non-decreasing overtime. This implies that equilibrium payoffs form a submartingale.
• The imitation principle
— In a connected network, asymptotically, all agents must get the sameaverage (unconditional) payoffs.

Convergence Let Xit,Fit : i = 1, ..., n, t = 1, 2, ... be an equilibrium.For each i, define V ∗it : Ω→ R by
V ∗it = E[U(Xit, ·)|Fit].
Then V ∗it is a submartingale with respect to Fit and there exists arandom variable V ∗i∞ such that V ∗it converges to V
∗i∞ almost surely.
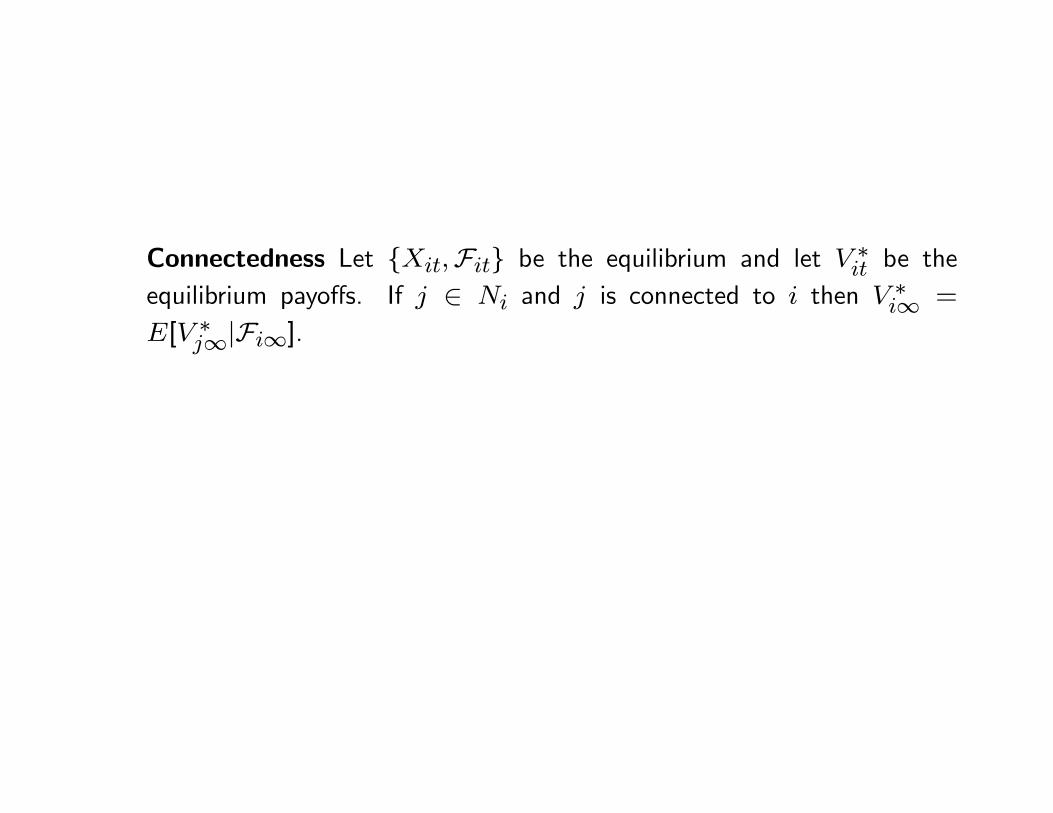
Connectedness Let Xit,Fit be the equilibrium and let V ∗it be theequilibrium payoffs. If j ∈ Ni and j is connected to i then V ∗i∞ =
E[V ∗j∞|Fi∞].

Imitation Let i and j be two agents such that j ∈ Ni and j is connectedto i. Let Eab denote the measurable set on which i chooses a infinitelyoften and j chooses b infinitely often. Then V a
i∞(ω) = V bi∞(ω) for almost
every ω in Eab.
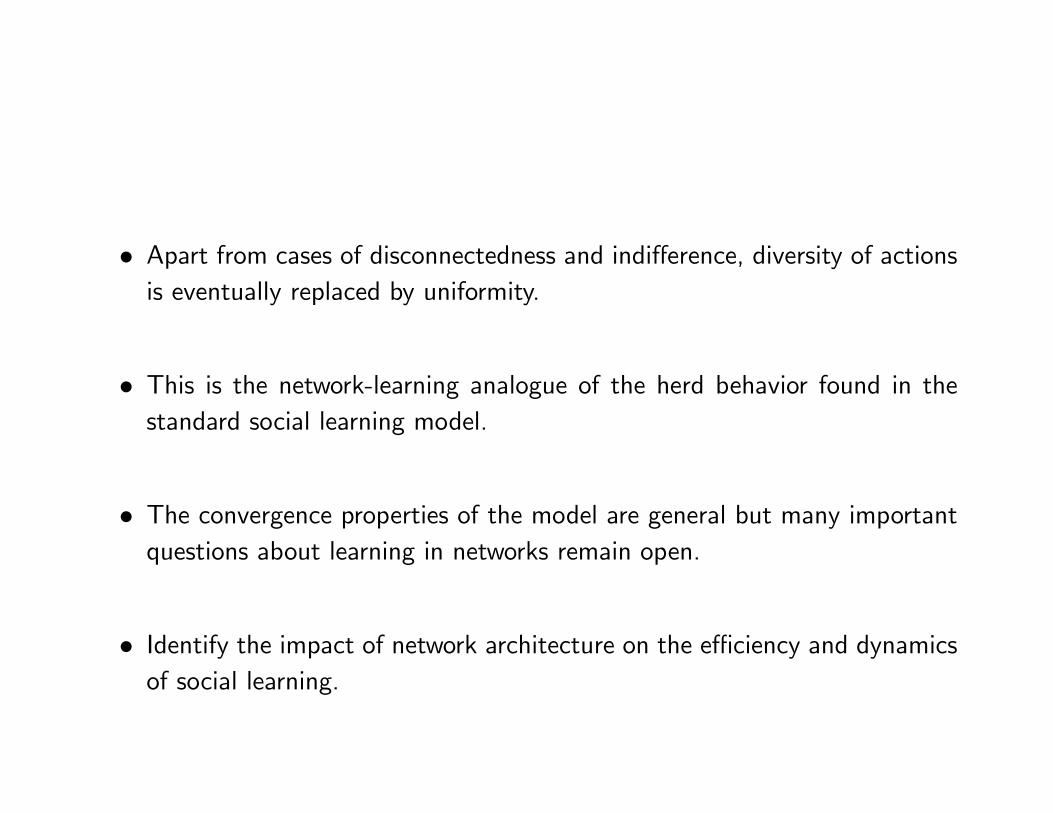
• Apart from cases of disconnectedness and indifference, diversity of actionsis eventually replaced by uniformity.
• This is the network-learning analogue of the herd behavior found in thestandard social learning model.
• The convergence properties of the model are general but many importantquestions about learning in networks remain open.
• Identify the impact of network architecture on the efficiency and dynamicsof social learning.

A three-person example
• The network consists of three agents indexed by i = A,B,C. The neigh-borhoods NA,NB,NC completely define the network.
• Uncertainty is represented by two equally likely events ω = −1, 1 and twocorresponding signals σ = −1, 1.
• Signals are informative in the sense that there is a probability 23 that asignal matches the event.
• With probability q an agent is informed and receives a private signal at thebeginning of the game.
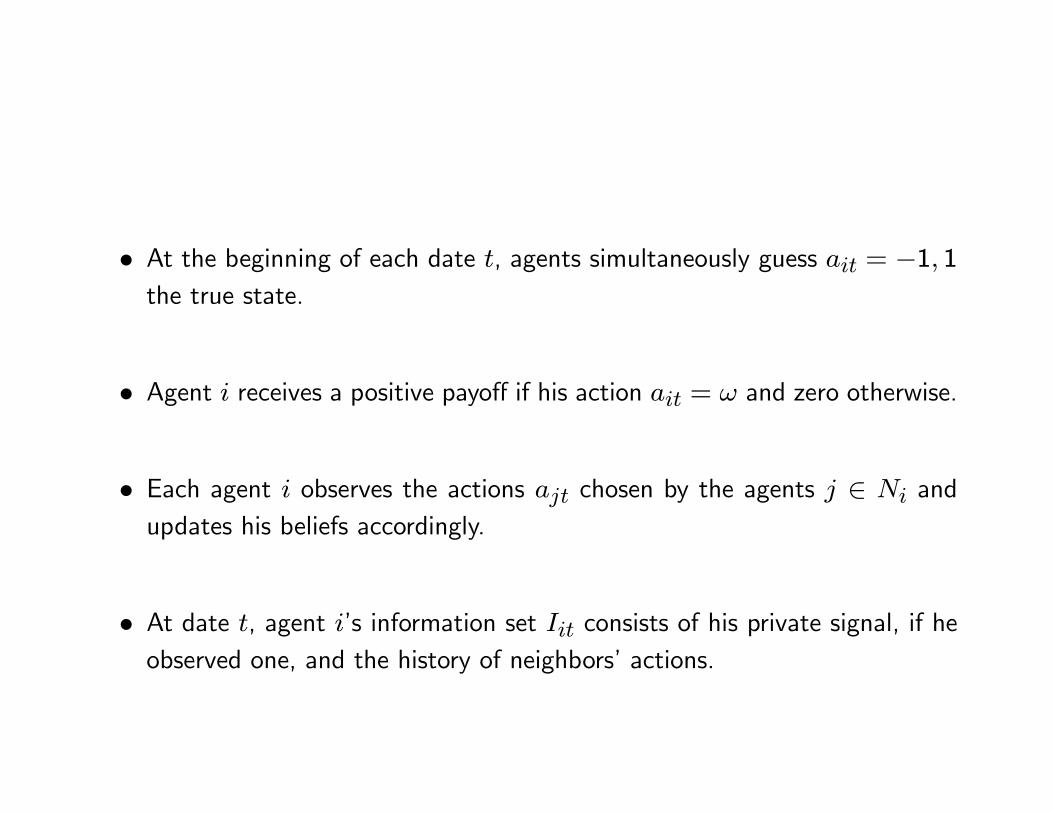
• At the beginning of each date t, agents simultaneously guess ait = −1, 1the true state.
• Agent i receives a positive payoff if his action ait = ω and zero otherwise.
• Each agent i observes the actions ajt chosen by the agents j ∈ Ni andupdates his beliefs accordingly.
• At date t, agent i’s information set Iit consists of his private signal, if heobserved one, and the history of neighbors’ actions.

A
C B
A
C B
A
C B
B
A
C B
Complete Star Circle
A
C

Learning dynamics
• Learning is ‘simply’ a matter of Bayesian updating but agents must takeaccount of the network architecture in order to update correctly.
• If all agents choose the same action at date 1, no further information isrevealed at subsequent dates (an absorbing state).
• We can trace out possible evolutions of play when there is diversity ofactions at date 1.
• The exact nature of the dynamics depends on the signals and the networkarchitecture.
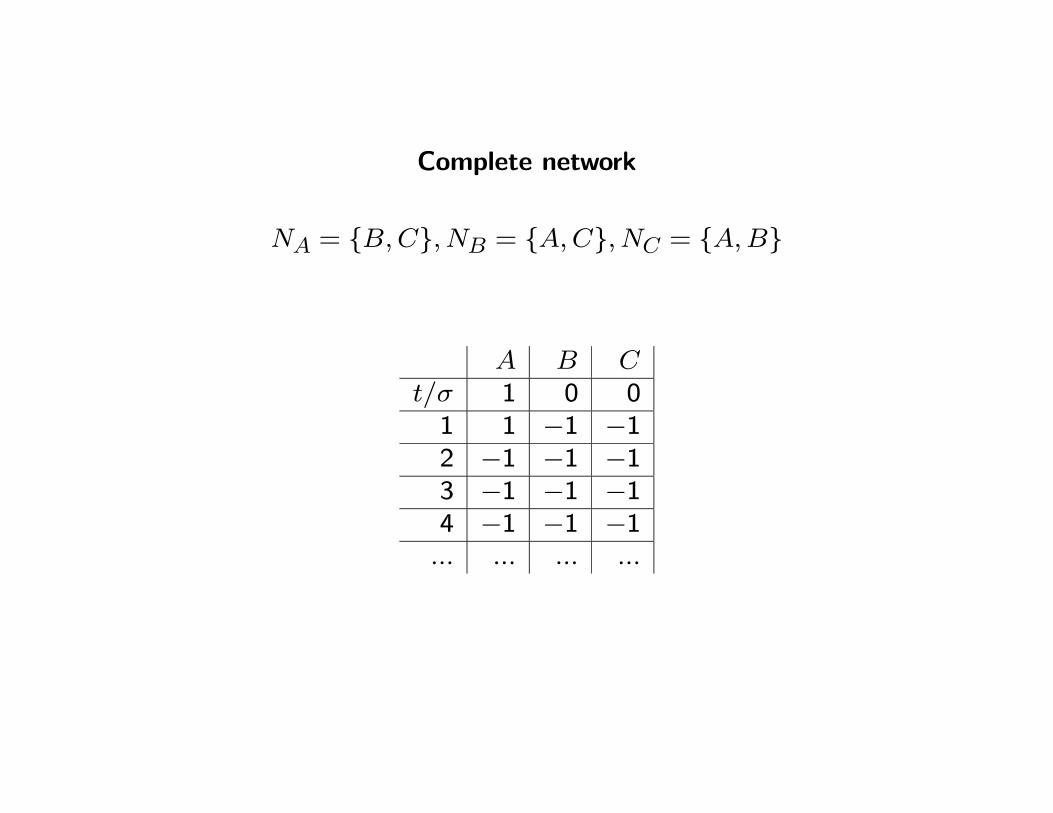
Complete network
NA = B,C, NB = A,C, NC = A,B
A B Ct/σ 1 0 01 1 −1 −12 −1 −1 −13 −1 −1 −14 −1 −1 −1... ... ... ...

Star network
NA = B,C, NB = A, NC = A
A B Ct/σ 1 0 01 1 −1 −12 −1 1 13 1 1 −14 1 1 1... ... ... ...

Circle network
NA = B, NB = C, NC = A
A B Ct/σ 1 0 01 1 −1 −12 1 −1 13 1 1 14 1 1 1... ... ... ...
Takeaways
• Convergence to a uniform action tends to be quite rapid, typically occurringwithin two to three periods.
• Significant differences can be identified in the equilibrium behavior ofagents in different networks.
• Even in the three-person case the process of social learning in networkscan be complicated.
• Because of the lack of common knowledge, inferences agents must drawin order to make rational decisions are quite subtle.
Experimental design
• Each experimental session consisted of 15 independent rounds and eachround consisted of six decision-turns.
• The network structure and the information treatment (q = 13,23, 1) were
held constant throughout a given session.
• The ball-and-urn social learning experiments paradigm of Anderson andHolt (1997).
• A serious test of the ability of a structural econometric model based onthe theory to interpret the data.

Selected data(star network under high-information)
A B Ct/σ 1 0 01 1 −1 −12 −1 1 13 −1 −1 −14 −1 −1 −15 1 1 −16 1 1 1

Herd behavior
Herd behavior is characterized by two related phenomena:
— Stability : the proportion of subjects who continue to choose the sameaction.
— Uniformity : a score function that takes the value 1 if all subjects actalike and takes the value 0 otherwise.
Uniformity will persist and lead to herd behavior if stability takes the value1 at all subsequent turns.
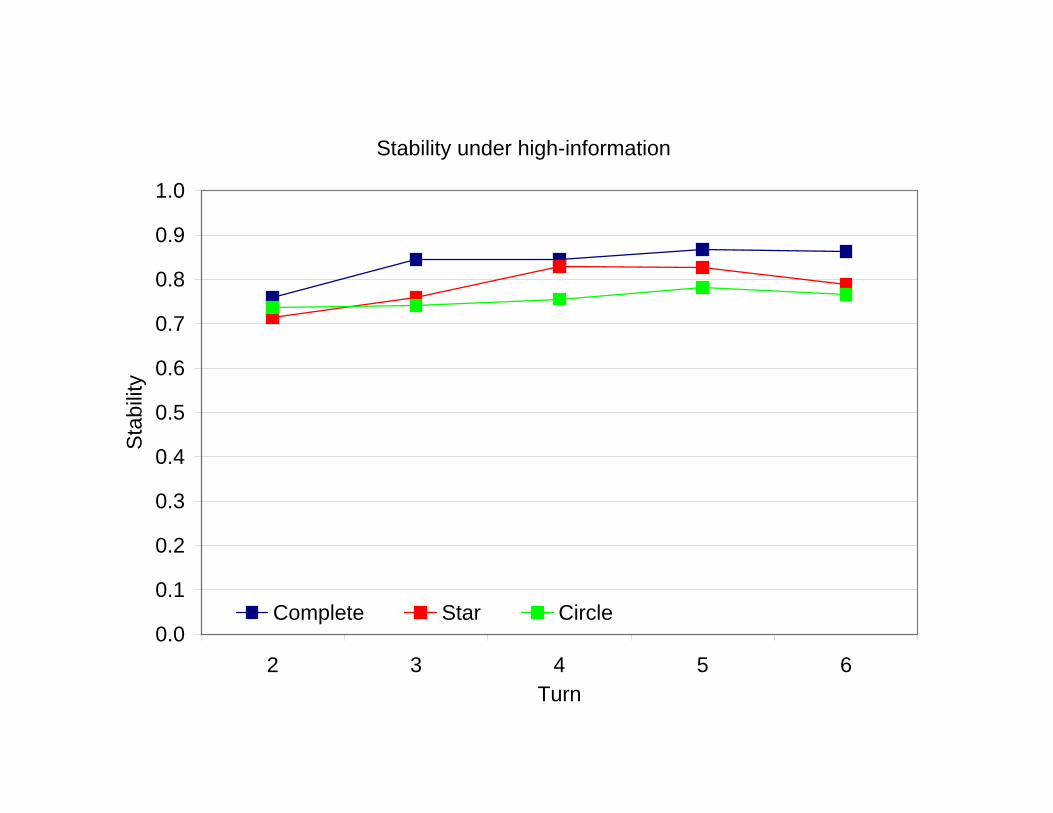
Stability under high-information
0.0
0.1
0.2
0.3
0.4
0.5
0.6
0.7
0.8
0.9
1.0
2 3 4 5 6Turn
Sta
bilit
y
Complete Star Circle

Uniformity under high-information
0.0
0.1
0.2
0.3
0.4
0.5
0.6
0.7
0.8
0.9
1.0
1 2 3 4 5 6Turn
Uni
form
ity
Complete Star Circle
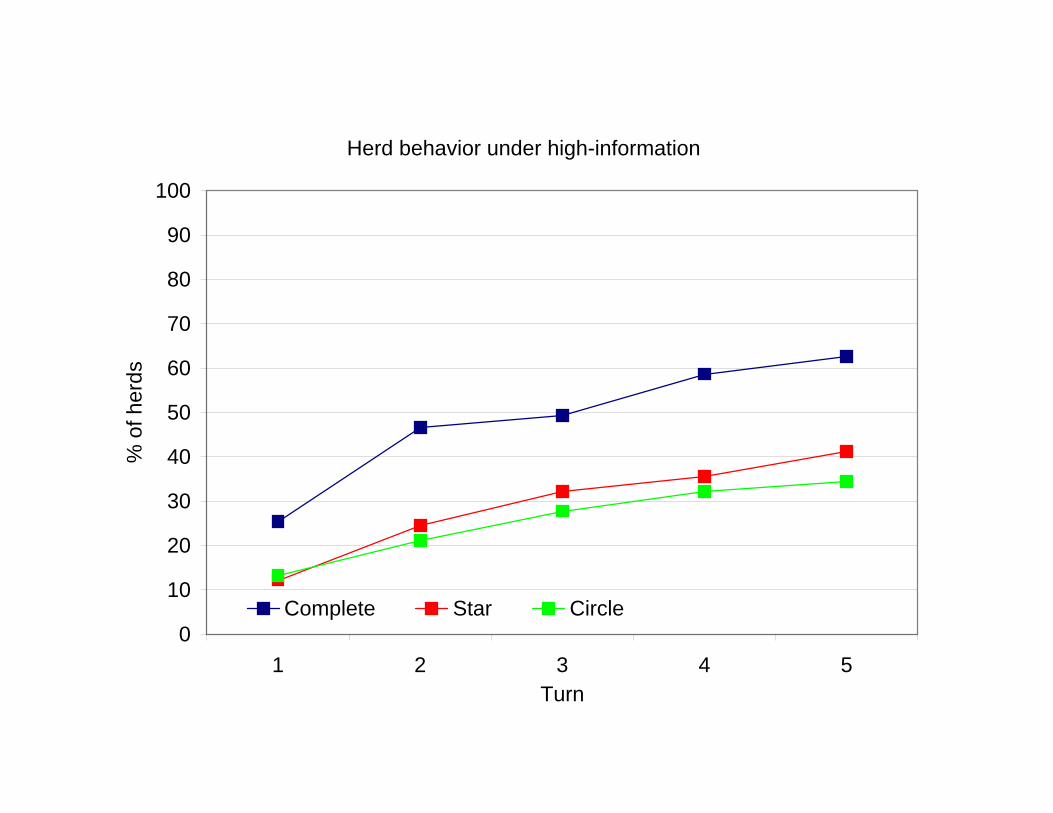
Herd behavior under high-information
0
10
20
30
40
50
60
70
80
90
100
1 2 3 4 5Turn
% o
f her
ds
Complete Star Circle
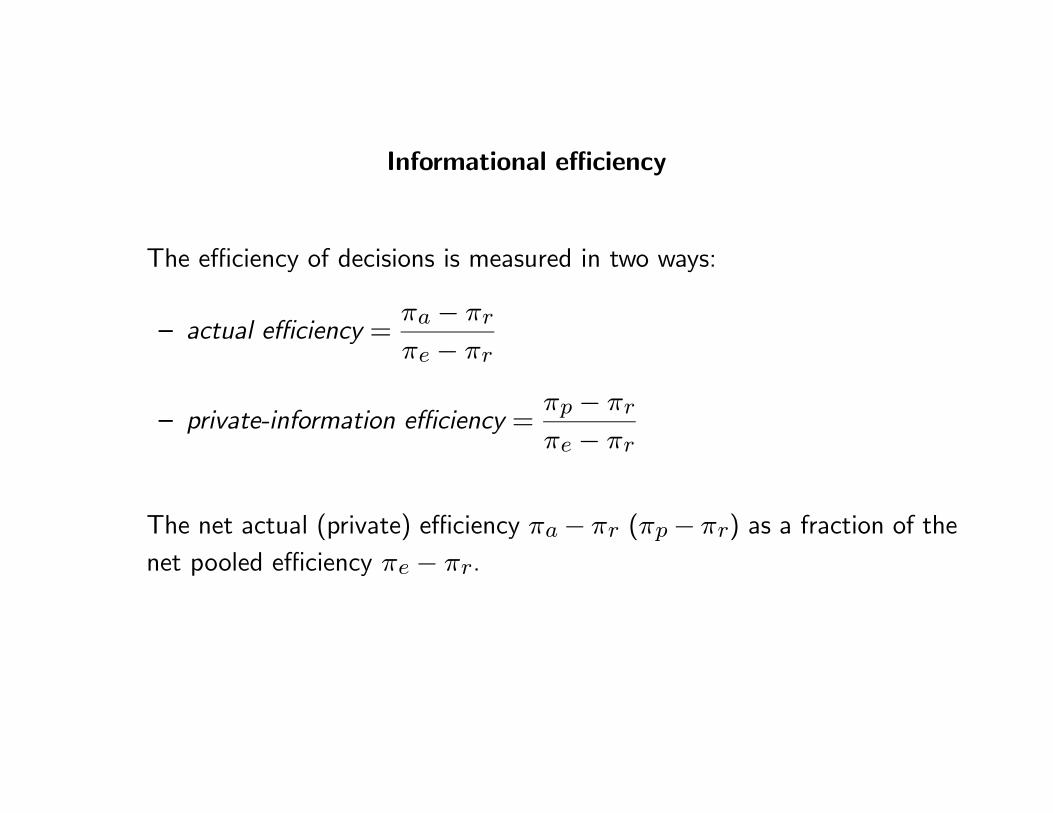
Informational efficiency
The efficiency of decisions is measured in two ways:
— actual efficiency =πa − πr
πe − πr
— private-information efficiency =πp − πr
πe − πr
The net actual (private) efficiency πa− πr (πp− πr) as a fraction of thenet pooled efficiency πe − πr.
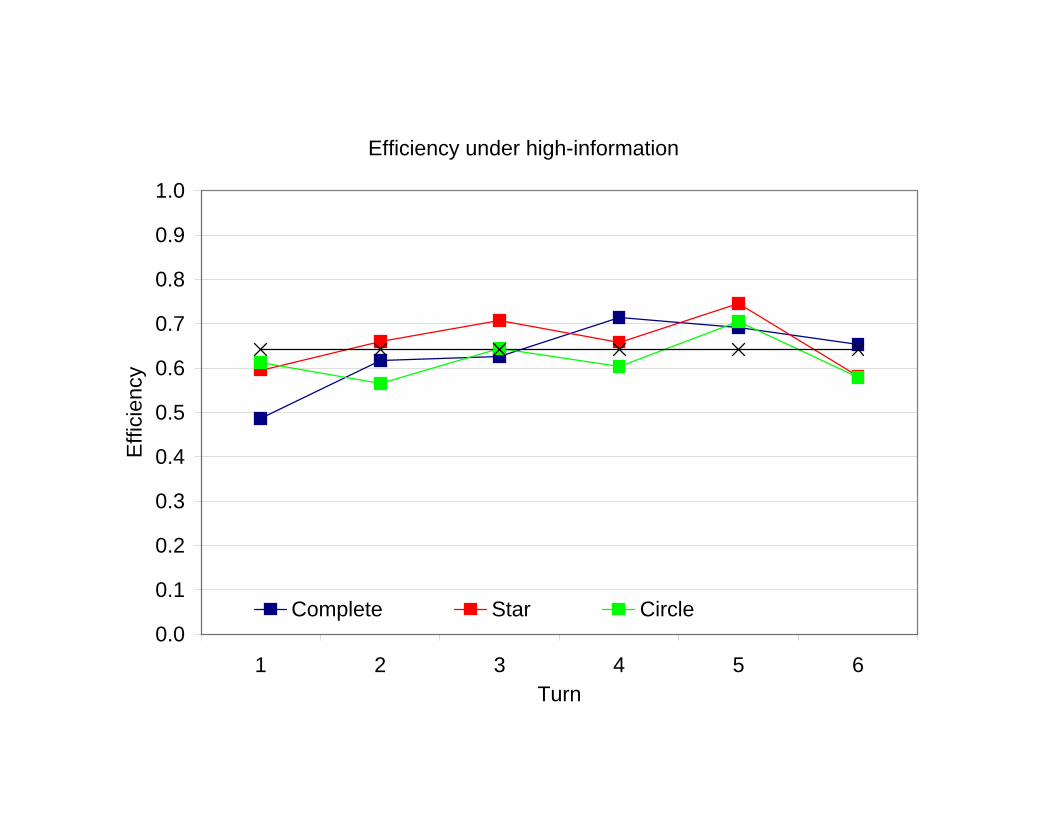
Efficiency under high-information
0.0
0.1
0.2
0.3
0.4
0.5
0.6
0.7
0.8
0.9
1.0
1 2 3 4 5 6Turn
Effi
cien
cy
Complete Star Circle
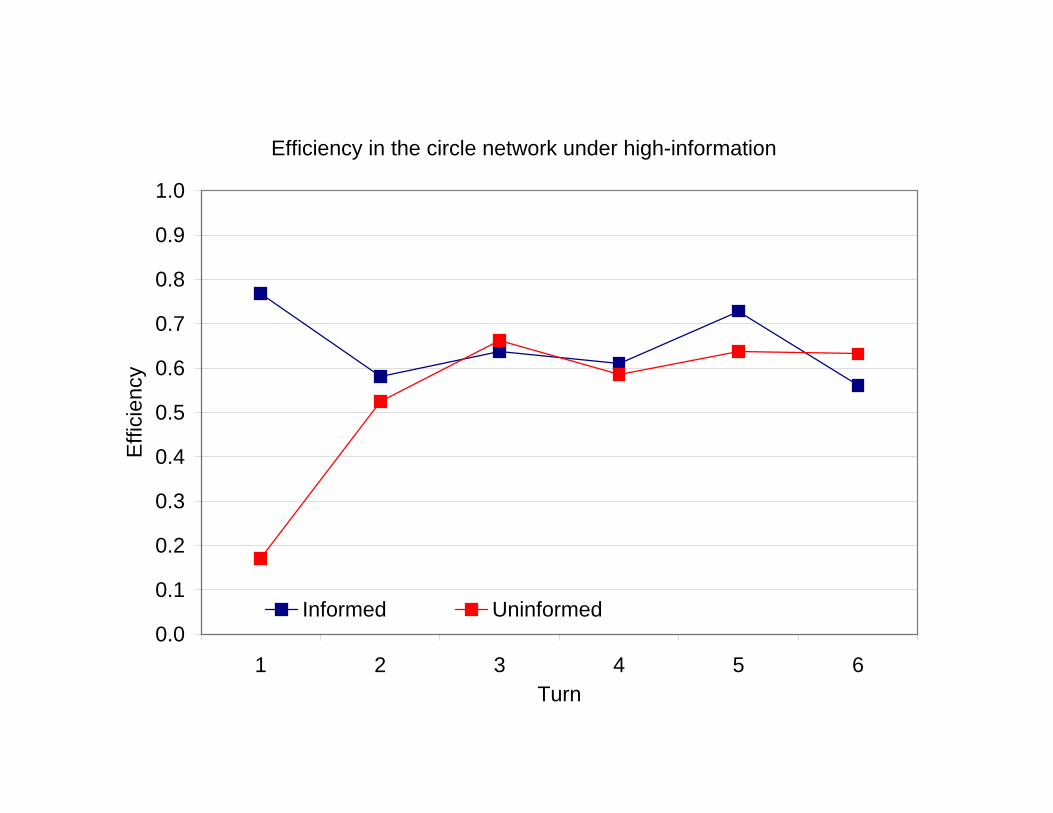
Efficiency in the circle network under high-information
0.0
0.1
0.2
0.3
0.4
0.5
0.6
0.7
0.8
0.9
1.0
1 2 3 4 5 6Turn
Effi
cien
cy
Informed Uninformed

Summary of experimental data
• A strong tendency toward herd behavior and a marked efficiency of infor-mation aggregation.
• There are significant differences between the behavior of different networksand information treatments.
• Differences might be explained by the symmetry or asymmetry of the net-work or the information treatment.
• There is some variation across networks and treatments but the error ratesare uniformly fairly low.

Quantal response equilibrium (QRE)
• Mistakes are made and this should be taken into account in any theory ofrational behavior.
• The payoff from a given action is assumed to be a weighted average of thetheoretical payoff and a logistic disturbance.
• The “weight” placed on the theoretical payoff is determined by a regressioncoefficient.
• The recursive structure of the model enables to estimate the coefficientsof the QRE model for each decision-turn sequentially.

The logit equilibrium can be summarized by a choice probability functionfollowing a binomial logit distribution:
Pr (ait = 1|Iit) =1
1 + exp (−βitxit)
where βit is a coefficient and xit is the difference between the expectedpayoffs from actions 1 and −1.
The regression coefficient β will be positive if the theory has any predictivepower.
• Use the estimated coefficient from turn t to calculate the theoretical payoffsfrom the actions at turn t+ 1.
• The behavioral interpretation is that subjects have rational expectationsand use the true mean error rate.
• The parameter estimates are highly significant and positive, showing thatthe theory does help predict the subjects’ behavior.
• A series of specification tests shows that the restrictions of the QRE modelare confirmed by the data.


The beta time-series under full-information
0
1
2
3
4
5
1 2 3 4 5 6Turn
Bet
a
Complete Star (A) Star (B&C) Circle

The beta time-series under high-information
0
1
2
3
4
5
1 2 3 4 5 6Turn
Bet
a
Complete Star (A) Star (B&C) Circle
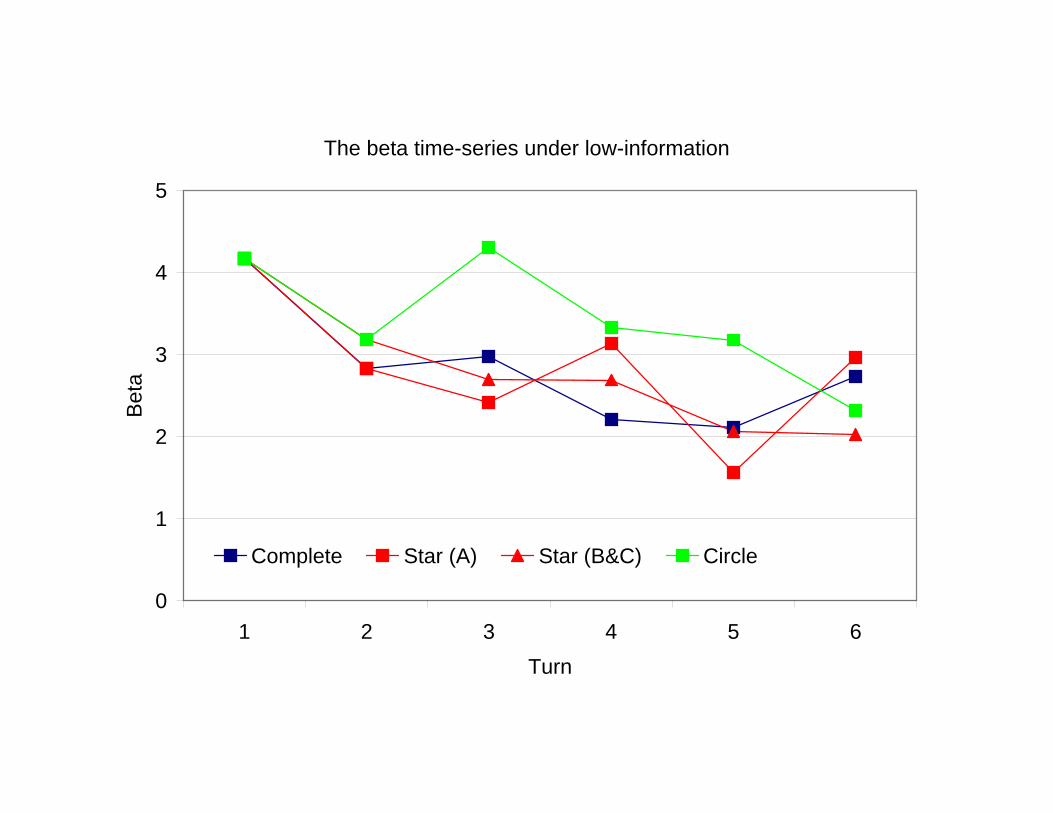
The beta time-series under low-information
0
1
2
3
4
5
1 2 3 4 5 6Turn
Bet
a
Complete Star (A) Star (B&C) Circle

The beta time-series in the circle network
0
1
2
3
4
5
1 2 3 4 5 6Turn
Bet
a
Full High Low
Concluding remarks
• Use the theory to interpret data generated by experiments of social learningin three-person networks.
• The family of three-person networks includes several architectures, each ofwhich gives rise to its own distinctive learning patterns.
• The theory, modified to include the possibility of errors, adequately ac-counts for large-scale features of the data.
• A strong support for the use of models as the basis for structural estimationand the use of QRE to interpret experimental data.