Embed Size (px)
Citation preview

1715
93
Economics 2019 v1.1 IA2 high-level annotated sample response September 2018
Investigation — research report (25%) This sample has been compiled by the QCAA to assist and support teachers to match evidence in student responses to the characteristics described in the instrument-specific marking guide (ISMG).
Assessment objectives This assessment instrument is used to determine student achievement in the following objectives: 1. comprehend economic concepts, principles and models of trade protection, trade
agreements and/or the balance of payments
2. select data and economic information from sources relevant to trade protection, trade agreements and/or the balance of payments
3. analyse an economic issue that involves trade protection, trade agreements and/or the balance of payments
4. evaluate an economic outcome relevant to trade protection, trade agreements and/or the balance of payments
5. create a response that communicates economic meaning to suit the intended purpose in a research report.

Economics 2019 v1.1 IA2 high-level annotated sample response
Queensland Curriculum & Assessment Authority September 2018
Page 2 of 15
Instrument-specific marking guide (ISMG) Criterion: Comprehending
Assessment objectives 1. comprehend economic concepts, principles and models of trade protection, trade
agreements and/or the balance of payments
The student work has the following characteristics: Marks
• comprehensive identification of essential features of trade protection, trade agreements and/or the balance of payments
• perceptive application of economic concepts, principles and models to the trade protection, trade agreements and/or the balance of payments issue
• precise use of economic terminology.
4−5
• effective identification of features of trade protection, trade agreements and/or the balance of payments
• effective application of economic concepts, principles and/or models to the trade protection, trade agreements and/or the balance of payments issue
• adequate use of economic terminology.
2−3
• identification of some economic concepts, principles or models. 1
• does not satisfy any of the descriptors above. 0
Criterion: Selecting
Assessment objectives 2. select data and economic information from sources relevant to trade protection, trade
agreements and/or the balance of payments
The student work has the following characteristics: Marks
• discerning choice of current, accurate and reliable data and economic information from primary and/or secondary sources relevant to trade protection, trade agreements and/or the balance of payments
• perceptive use of data and economic information • consistent and accurate documentation of data and economic information in the form of a
reference list and citations.
3−4
• adequate choice of current, accurate and/or reliable data and economic information from primary and/or secondary sources relevant to trade protection, trade agreements and/or the balance of payments
• adequate use of data and economic information • some documentation of data and economic information in the form of a reference list
and/or citations.
2
• narrow use of data and/or economic information. 1
• does not satisfy any of the descriptors above. 0

Economics 2019 v1.1 IA2 high-level annotated sample response
Queensland Curriculum & Assessment Authority September 2018
Page 3 of 15
Criterion: Analysing
Assessment objectives 3. analyse an economic issue that involves trade protection, trade agreements and/or the
balance of payments
The student work has the following characteristics: Marks
• discerning interpretation of patterns and trends in trade protection, trade agreements and/or balance of payment data and economic information
• discerning explanation of international trade relationships • perceptive use of data and economic information to support the analysis.
5−6
• effective interpretation of patterns and trends in trade protection, trade agreements and/or balance of payment data and economic information
• effective explanation of international trade relationships • adequate use of data and economic information to support the analysis.
3−4
• superficial description of patterns and/or trends in trade protection, trade agreements and/or balance of payment data and/or economic information
• superficial identification of international trade relationships • narrow or inconsistent use of data and/or economic information.
1−2
• does not satisfy any of the descriptors above. 0
Criterion: Evaluating
Assessment objectives 4. evaluate an economic outcome relevant to trade protection, trade agreements and/or the
balance of payments
The student work has the following characteristics: Marks
• discerning synthesis of economic ideas and perspectives to support the conclusion or decision
• perceptive conclusion drawn or decision made about trade protection, trade agreements and/or the balance of payments, based on the use of relevant economic criteria
• critical economic reasoning and justification.
5−6
• effective synthesis of economic ideas and/or perspectives to support the conclusion or decision
• effective conclusion drawn or decision made about trade protection, trade agreements and/or the balance of payments, based on the use of relevant economic criteria
• feasible economic reasoning and justification.
3−4
• opinions and statements about either economic ideas or perspectives • superficial conclusion or decision made about trade protection, trade agreements and/or
the balance of payments • identification of some reasons for the conclusion or decision.
1−2
• does not satisfy any of the descriptors above. 0

Economics 2019 v1.1 IA2 high-level annotated sample response
Queensland Curriculum & Assessment Authority September 2018
Page 4 of 15
Criterion: Creating a response
Assessment objectives 5. create a response that communicates economic meaning to suit the intended purpose in a
research report
The student work has the following characteristics: Marks
• concise expression and development of relevant ideas that enhance economic meaning and effective use of graphs, diagrams and/or statistics
• features of a report genre are consistently demonstrated • minimal errors in spelling, grammar and punctuation.
3−4
• adequate expression and development of ideas that convey economic meaning and some use of graphs, diagrams and/or statistics
• features of a report genre are demonstrated • some errors in spelling, grammar and punctuation.
2
• some elements of report formatting and inconsistent use of language conventions. 1
• does not satisfy any of the descriptors above. 0

Economics 2019 v1.1 IA2 high-level annotated sample response
Queensland Curriculum & Assessment Authority September 2018
Page 5 of 15
Task Create a research report analysing two free trade agreements that the Australian Government is negotiating. Present an evaluation recommending one free trade agreement that would maximise economic returns for Australia.
Sample response Criterion Marks allocated Result
Comprehending Assessment objective 1 5 5
Selecting Assessment objective 2 4 4
Analysing Assessment objective 3 6 6
Evaluating Assessment objective 4 6 6
Creating a response Assessment objective 5 4 4
Total 25 25
The annotations show the match to the instrument-specific marking guide (ISMG) performance-level descriptors.
Creating a response [3–4] features of a report genre are consistently demonstrated content page, and list of figures and tables

Economics 2019 v1.1 IA2 high-level annotated sample response
Queensland Curriculum & Assessment Authority September 2018
Page 6 of 15
Comprehending [4–5] comprehensive identification of essential features of trade agreements perceptive application of economic concepts i.e. scarcity, given different resource allocations and a range of needs and wants Comprehending [4–5] perceptive application of economic concepts and principles reasoned choice of free trade agreements Analysing [5–6] discerning interpretation of patterns and trends correctly describes patterns and trends of GDP per capita and GDP
Introduction
Outline of the report
Australia continues to be the ‘lucky country’ with economic growth above the OECD average and 26 years of uninterrupted expansion (The Economist, 2017). A large part of this success has been Australia’s global trade relationships, which have been propelled by free trade agreements. To continue this achievement, two current free trade agreements that are in the process of being negotiated by the Department of Foreign Affairs and Trade will be analysed and evaluated. A recommendation of which agreement to focus limited budget, time and labour resources on, and to maximise economic returns for Australia will be made. Purpose and choice of free trade agreements
The purpose of a free trade agreement is to maximise the economic benefits of trade. However, a free trade agreement rarely comprises removing all barriers to trade and investment for all transactions. It involves a complicated negotiation of which markets to open to international trade and how much, and involves trade-offs given the resources available to each country and the needs and wants of their consumers. The agreements also develop stronger trade and commercial ties, as well as ‘behind the border’ issues such as standards, professional qualifications and competition policies in trading partner countries (Department of Foreign Affairs and Trade, n.d.) that can represent barriers to trade of goods and services.
There are nine agreements currently under negotiation, according to the latest information from the Department of Foreign Affairs and Trade (refer Table 1) (Department of Foreign Affairs and Trade, 2018). The free trade agreements with India and Indonesia will be analysed and evaluated1, that is, the Australia-India Comprehensive Economic Cooperation Agreement (AI-CECA) and the Indonesia-Australia Comprehensive Economic Partnership Agreement (IA-CEPA). These are both bilateral agreements with countries that are located geographically close (lower transport costs) and are transitioning economies, so that Australia can reap the advantage of economic ties to an economy with a larger population and growth from a low gross domestic production (GDP) per capita base.
Analysis of India and Indonesia’s trade agreements Growth opportunities One major reason for Australia’s growth over the last decade has been the significant trade relationship with China, the most populous economy, during its period of very high economic growth over 7 percent (Trading Economics.com, 2018). This was leveraged as China grew from a low GDP per capita base of $7,300 in 2007 to $16,600 in 2017 (The World FactBook: CIA, 2017). India offers similar future leverage opportunities, currently at a similarly low GDP per capita of $7,200 in 2017, indicating
1 For the purpose of this report, the issue of investor state dispute settlement has not been considered, as the
issue is impacted by legal and political implications, which are out of the scope of this economic analysis.

Economics 2019 v1.1 IA2 high-level annotated sample response
Queensland Curriculum & Assessment Authority September 2018
Page 7 of 15
Analysing [5–6] perceptive use of data and economic information to support the analysis Selecting [3–4] choice of current, accurate and reliable data and economic information statistics have been updated from DFAT website Analysing [5–6] discerning interpretation of patterns and trends annual GDP growth rates and the comparison of GDP trends; interpretation of different graph scales for India and Indonesia; identification of potential distortion Analysing [5–6] perceptive use of data and economic information to support the analysis shown in the graph created by the student in Excel Evaluating [3–4] perceptive conclusion drawn, based on the use of relevant economic criteria using GDP growth as criteria
significant room for growth, and more than that offered by Indonesia at $12,400 per capita (refer Table 1). Indonesia offers attractive but fewer opportunities, with the world’s fourth largest population, after China, India, and the United States and 10 times Australia’s population. The primary difference between India and Indonesia is in the order of magnitude of the size of potential market that Australian businesses would be able to access, as India’s population is more than 4 times the size of Indonesia, and while GDP per capita is almost half, GDP is almost 3 times as large at $9.4 trillion (The World Fact Book: CIA, 2017). (Refer Table 2)
Trading with developing economies such as India and Indonesia mean exporters are exposed to higher economic growth than that experienced by developed economies. This opportunity is shown in Figure 1, (Trading Economics, 2018) where both India and Indonesia have annual GDP growth rates greater than 4 percent over the last five years, while Australia’s average has been 2.4 percent over the same period. The graph shows a downward trend in the Indian growth rate over the last five and ten years, and the Indonesian trend has been similarly negative. Deceptively, the graph is not equally scaled and potentially misrepresents the importance of India’s much higher growth, at 4.6 to 10 %, while Indonesia’s range is a narrower range of 4.7 to 5.6 %.
Accordingly, a free trade agreement with India is more attractive for Australia as the access to higher growth rates from a lower GDP per capita base offers greater growth opportunity than an Indonesian agreement. The growth means greater and growing markets for Australian exporters who have access to greater economies of scale, and this production will increase employment opportunities for Australians.
0
2
4
6
8
10
12
2007 2008 2009 2010 2011 2012 2013 2014 2015 2016 201701234567
Indi
a %
Indo
nesi
a %
Indonesia India
Linear (Indonesia) Linear (India)
Based on data from the World Bank International Comparison program database.
Figure 1 India and Indonesia annual GDP growth rate comparison
Economics 2019 v1.1 IA2 high-level annotated sample response
Queensland Curriculum & Assessment Authority September 2018
Page 8 of 15
Comprehending [4–5] perceptive application of economic concepts clearly explains and applies the more complex concept of trade intensity ratio Analysing [5–6] discerning explanation of international trade relationships complex comparison of trade intensities using indexes Analysing [5–6] perceptive use of data and economic information to support the analysis shown in the graphs through the trend lines added (annotated circles)
Trade intensity
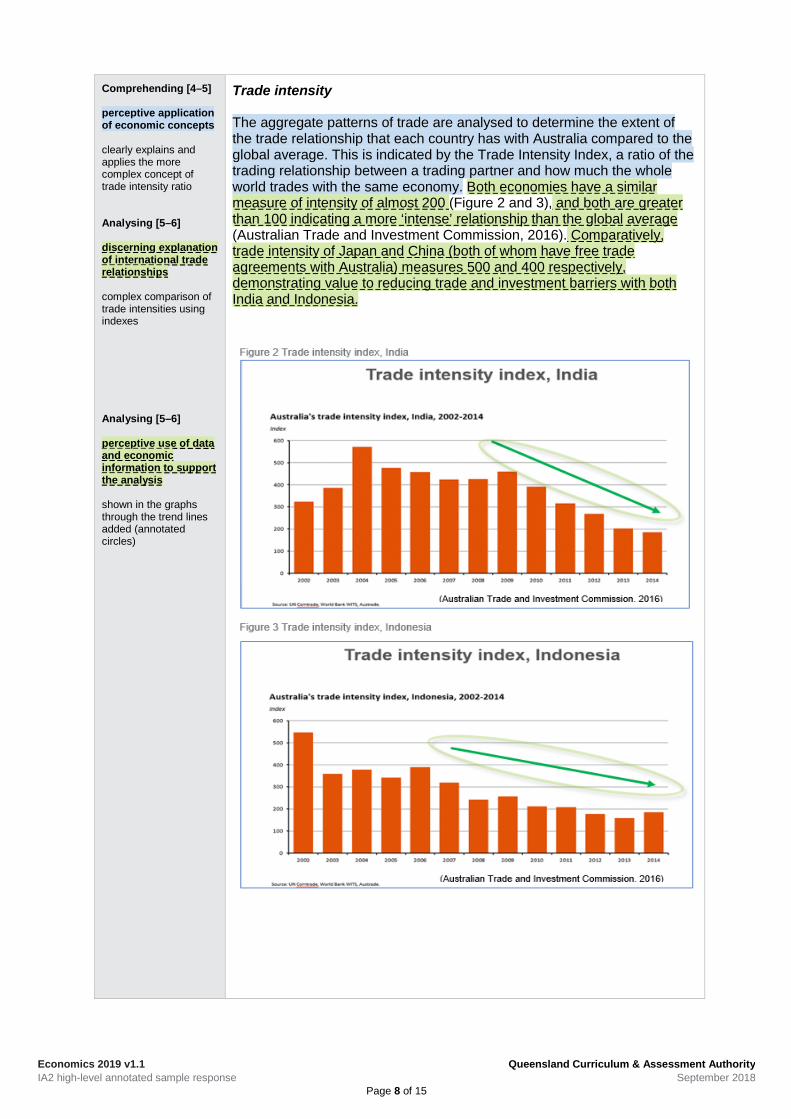
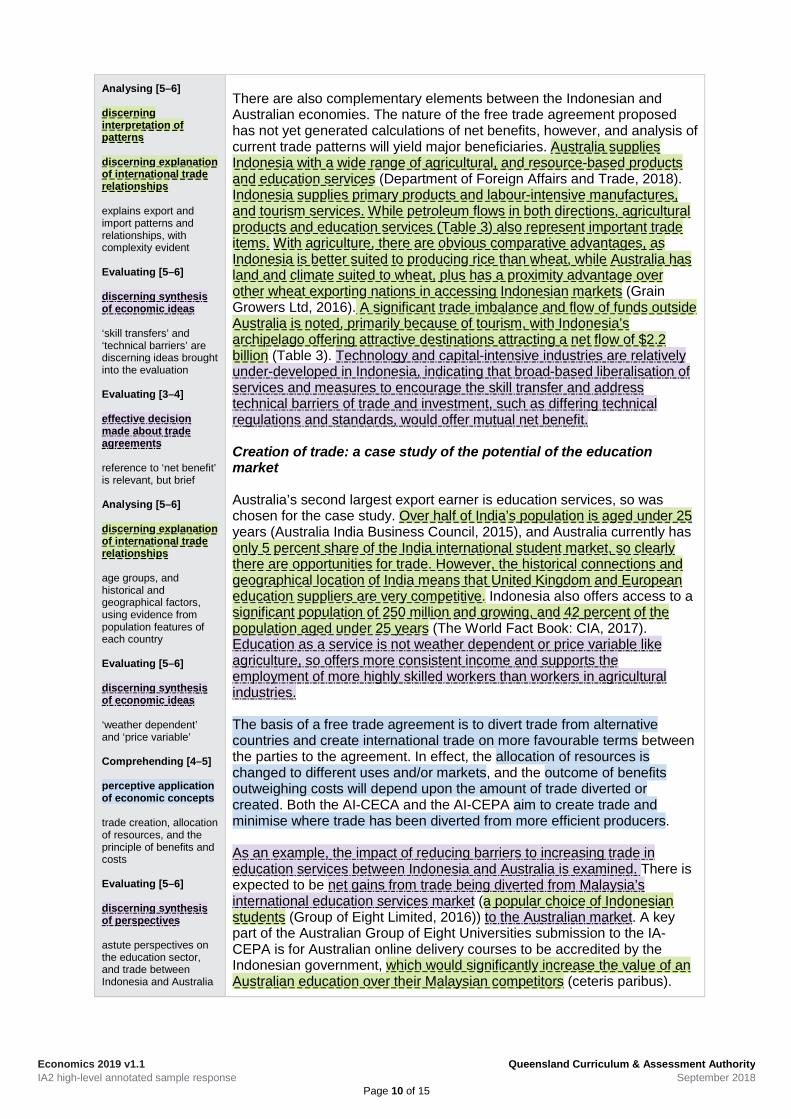
The aggregate patterns of trade are analysed to determine the extent of the trade relationship that each country has with Australia compared to the global average. This is indicated by the Trade Intensity Index, a ratio of the trading relationship between a trading partner and how much the whole world trades with the same economy. Both economies have a similar measure of intensity of almost 200 (Figure 2 and 3), and both are greater than 100 indicating a more ‘intense’ relationship than the global average (Australian Trade and Investment Commission, 2016). Comparatively, trade intensity of Japan and China (both of whom have free trade agreements with Australia) measures 500 and 400 respectively, demonstrating value to reducing trade and investment barriers with both India and Indonesia.

Economics 2019 v1.1 IA2 high-level annotated sample response
Queensland Curriculum & Assessment Authority September 2018
Page 9 of 15
Evaluating [5–6] perceptive conclusion drawn, based on the use of relevant economic criteria perceptive conclusion using trade intensity criteria critical economic reasoning and justification the response adeptly reasons about the benefits to a free trading agreement with each country, foreshadowing the eventual conclusion Analysing [5–6] discerning explanation of international trade relationships Indian–Australian exports and imports flows are explained, with education and coal relationships well-chosen and clear Analysing [5–6] discerning explanation of international trade relationships evidence of a relationship which is deeper than two exports and which has mutual benefits
Consequently, there is evidence to support a priority to Australia’s relationship to each country as the extent of trade with both countries could be increased considerably, with resulting benefits to Australian businesses and workers. While both trading intensities have fallen since 2004, the greater fall in the Indian relationship (Figure 2) relative to Indonesia (Figure 3) should concern Australia and action should be taken to stimulate trade through a trade agreement. Alternatively, trade between two countries is a factor of their GDP and distance – and as Australia and Indonesia are geographically much closer, they should be major trading partners and yet they are not (The Australian, 2017).
Nature of trade
The nature of exports and imports traded reveal patterns that reflect different scarce resources, and so potential comparative advantages available to Australian businesses from both agreements.
The potential benefits of the Indian agreement were estimated by the Centre for International Economics as a net increase in trade for Australia of AUD$42 billion and AUD $44 billion to India, based on the existing and projected imports and exports (Australian Business Consulting & Solutions, 2014). The analysis of Indian exports reveals significant beneficiaries based on the concentration of coal, 46 percent of total export income in 2017, followed by education service providers (and employees) at 16 percent and 11 percent on agricultural products (see Table 3). India uses coal and iron ore to meet growing economic infrastructure demands of electricity and building materials. Indian students represent Australian’s second largest education export clients, who spend on “tuition, accommodation, living expenses and travel during their studies” (ICEF Monitor, 2017). Australian businesses receive benefits from India’s exports of IT skills such as call centres and software development, provided at a lower cost. There are many existing export-import linkages between the two economies, including gold and diamonds exported to India, used to produce jewellery in India which then becomes a major export. Likewise, Australian wool is manufactured in India as clothing and textiles that becomes major export income for India (Department of Foreign Affairs and Trade website, 2018).
Economics 2019 v1.1 IA2 high-level annotated sample response
Queensland Curriculum & Assessment Authority September 2018
Page 10 of 15
Analysing [5–6] discerning interpretation of patterns discerning explanation of international trade relationships explains export and import patterns and relationships, with complexity evident Evaluating [5–6] discerning synthesis of economic ideas ‘skill transfers’ and ‘technical barriers’ are discerning ideas brought into the evaluation Evaluating [3–4] effective decision made about trade agreements reference to ‘net benefit’ is relevant, but brief Analysing [5–6] discerning explanation of international trade relationships age groups, and historical and geographical factors, using evidence from population features of each country Evaluating [5–6] discerning synthesis of economic ideas ‘weather dependent’ and ‘price variable’ Comprehending [4–5] perceptive application of economic concepts trade creation, allocation of resources, and the principle of benefits and costs Evaluating [5–6] discerning synthesis of perspectives astute perspectives on the education sector, and trade between Indonesia and Australia
There are also complementary elements between the Indonesian and Australian economies. The nature of the free trade agreement proposed has not yet generated calculations of net benefits, however, and analysis of current trade patterns will yield major beneficiaries. Australia supplies Indonesia with a wide range of agricultural, and resource-based products and education services (Department of Foreign Affairs and Trade, 2018). Indonesia supplies primary products and labour-intensive manufactures, and tourism services. While petroleum flows in both directions, agricultural products and education services (Table 3) also represent important trade items. With agriculture, there are obvious comparative advantages, as Indonesia is better suited to producing rice than wheat, while Australia has land and climate suited to wheat, plus has a proximity advantage over other wheat exporting nations in accessing Indonesian markets (Grain Growers Ltd, 2016). A significant trade imbalance and flow of funds outside Australia is noted, primarily because of tourism, with Indonesia’s archipelago offering attractive destinations attracting a net flow of $2.2 billion (Table 3). Technology and capital-intensive industries are relatively under-developed in Indonesia, indicating that broad-based liberalisation of services and measures to encourage the skill transfer and address technical barriers of trade and investment, such as differing technical regulations and standards, would offer mutual net benefit.
Creation of trade: a case study of the potential of the education market
Australia’s second largest export earner is education services, so was chosen for the case study. Over half of India’s population is aged under 25 years (Australia India Business Council, 2015), and Australia currently has only 5 percent share of the India international student market, so clearly there are opportunities for trade. However, the historical connections and geographical location of India means that United Kingdom and European education suppliers are very competitive. Indonesia also offers access to a significant population of 250 million and growing, and 42 percent of the population aged under 25 years (The World Fact Book: CIA, 2017). Education as a service is not weather dependent or price variable like agriculture, so offers more consistent income and supports the employment of more highly skilled workers than workers in agricultural industries.
The basis of a free trade agreement is to divert trade from alternative countries and create international trade on more favourable terms between the parties to the agreement. In effect, the allocation of resources is changed to different uses and/or markets, and the outcome of benefits outweighing costs will depend upon the amount of trade diverted or created. Both the AI-CECA and the AI-CEPA aim to create trade and minimise where trade has been diverted from more efficient producers.
As an example, the impact of reducing barriers to increasing trade in education services between Indonesia and Australia is examined. There is expected to be net gains from trade being diverted from Malaysia’s international education services market (a popular choice of Indonesian students (Group of Eight Limited, 2016)) to the Australian market. A key part of the Australian Group of Eight Universities submission to the IA-CEPA is for Australian online delivery courses to be accredited by the Indonesian government, which would significantly increase the value of an Australian education over their Malaysian competitors (ceteris paribus).
Economics 2019 v1.1 IA2 high-level annotated sample response
Queensland Curriculum & Assessment Authority September 2018
Page 11 of 15
Analysing [5–6] discerning explanation of international trade relationships explains education trade relationships; identification of patterns and interconnections is discerning Evaluating [5–6] discerning synthesis of economic ideas critical economic reasoning and justification applies economic concept of consumer surplus in a critical manner Comprehending [4–5] perceptive application of economic model diagram created by the student and modified to demonstrate the economic idea of trade creation Evaluating [5–6] perceptive decision made critical economic reasoning
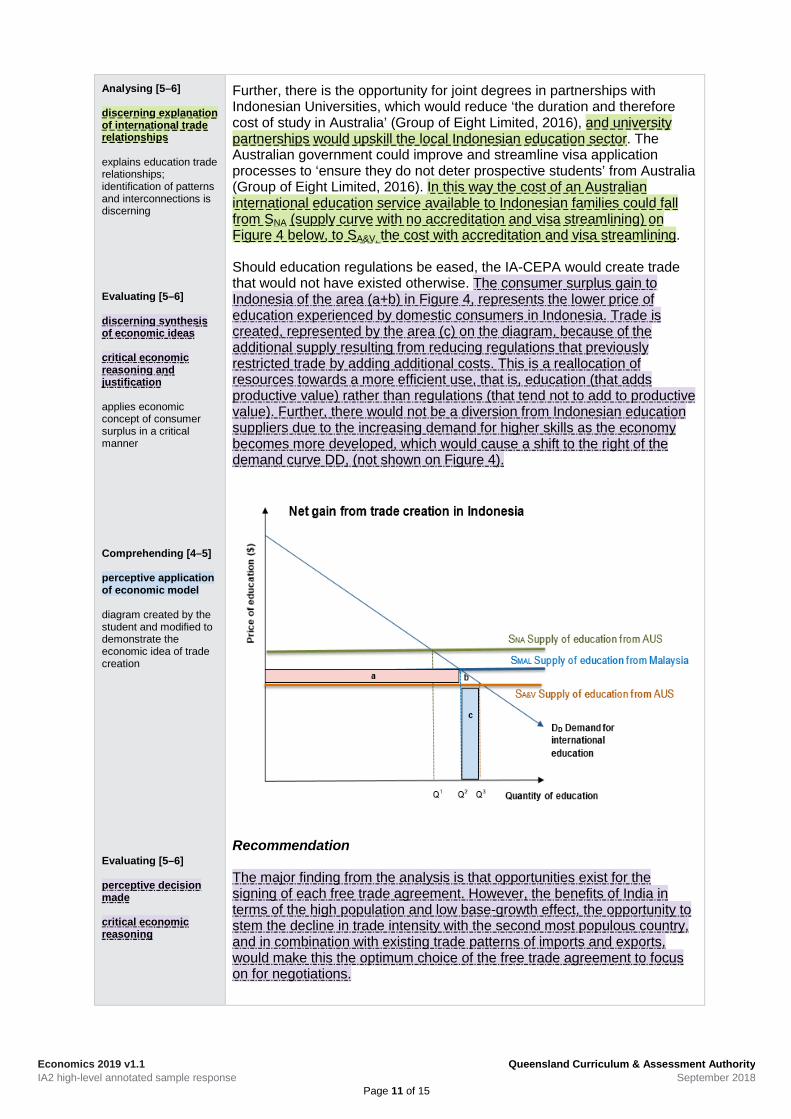
Further, there is the opportunity for joint degrees in partnerships with Indonesian Universities, which would reduce ‘the duration and therefore cost of study in Australia’ (Group of Eight Limited, 2016), and university partnerships would upskill the local Indonesian education sector. The Australian government could improve and streamline visa application processes to ‘ensure they do not deter prospective students’ from Australia (Group of Eight Limited, 2016). In this way the cost of an Australian international education service available to Indonesian families could fall from SNA (supply curve with no accreditation and visa streamlining) on Figure 4 below, to SA&V, the cost with accreditation and visa streamlining.
Should education regulations be eased, the IA-CEPA would create trade that would not have existed otherwise. The consumer surplus gain to Indonesia of the area (a+b) in Figure 4, represents the lower price of education experienced by domestic consumers in Indonesia. Trade is created, represented by the area (c) on the diagram, because of the additional supply resulting from reducing regulations that previously restricted trade by adding additional costs. This is a reallocation of resources towards a more efficient use, that is, education (that adds productive value) rather than regulations (that tend not to add to productive value). Further, there would not be a diversion from Indonesian education suppliers due to the increasing demand for higher skills as the economy becomes more developed, which would cause a shift to the right of the demand curve DD, (not shown on Figure 4).
Recommendation
The major finding from the analysis is that opportunities exist for the signing of each free trade agreement. However, the benefits of India in terms of the high population and low base-growth effect, the opportunity to stem the decline in trade intensity with the second most populous country, and in combination with existing trade patterns of imports and exports, would make this the optimum choice of the free trade agreement to focus on for negotiations.

Economics 2019 v1.1 IA2 high-level annotated sample response
Queensland Curriculum & Assessment Authority September 2018
Page 12 of 15
Evaluating [5–6] discerning synthesis of perspectives discerns different perspectives that affect economic choices and recommendations India’s perspective — a negative net benefit authentic response in terms of more practical impediments that may affect economic decisions and conclusions discerning synthesis of economic ideas ‘second best’ to account for authentic impediments or practical limitations perceptive decision made, based on the use of relevant economic criteria economic support for a decision
Nonetheless, there are economic impediments. Negotiations with India have stalled during 2017 due to disagreements over Indian tariffs (among the highest in the world) and labour mobility (The Economic Times, India, 2017) (Australian Financial Review, 2017), indicating that while Australia’s net benefits are positive, India’s may not be. Both negotiation points represent barriers to free trade and to a freer trade agreement as India’s benefits of retaining higher tariffs appear to be greater than the benefits offered within the proposed agreement, and the tariffs represent significant costs to Australia, not surprising as India does not share the same growth opportunities.
Given this practical reality, there is significant economic evidence that the benefits of proceeding with an agreement with Indonesia, while not as beneficial as India, are still substantial for Australia businesses and workers, through the additional production and employment created. Further, there is the close proximity of Indonesia to support mutual benefits. Therefore, proceeding on the basis of ‘The general theory of the second best’2 (The Economist blog, 2007), the Indonesia-Australia Comprehensive Economic Partnership Agreement (IA-CEPA) is the second-best approach that will delivery significant economic benefits to Australia based on growth opportunities, trade intensity, and the nature of trade. In particular, the case study of Australia’s second largest export market, education, finds that there would be substantial trade created from reducing barriers between Australia and Indonesia.
Conclusion
An analysis of the India and Indonesia free trade agreements currently in the process of negotiation shows that while India has the potential to offer larger opportunities, practical impediments require a second best optimum solution; the focus of the Department of Foreign Affairs and Trade budget resources should be directed towards the IA-CEPA. Accordingly, the government should focus negotiation efforts on the Indonesian Free Trade Agreement.
Notes
2 This theory of second best can be described as a situation where the optimal choice is not possible because of
a particular limitation, the best decision is to make the second best optimal choice.
Analysing [5–6] perceptive use of data and economic information to support the analysis throughout the report
Evaluating [5–6] discerning synthesis of economic ideas and perspectives applied to the analysis throughout the report critical economic reasoning and justification throughout the report
Selecting [3–4] perceptive use of data and economic information throughout the report consistent and accurate documentation of data and economic information in the form of citations
Comprehending [4–5] precise use of economic terminology throughout the report

Economics 2019 v1.1 IA2 high-level annotated sample response
Queensland Curriculum & Assessment Authority September 2018
Page 13 of 15
Selecting [3–4] discerning choice of current, accurate and reliable data and economic information from primary and/or secondary sources relevant to trade agreements consistent and accurate documentation of data and economic information in the form of a reference list
Reference List
Australia India Business Council. (2015, March). Submission to Department of Foreign Affairs and Trade AICECA Negotiations. Retrieved February 28, 2018, from http://dfat.gov.au/trade/agreements/aifta/Documents/australia-india-business-council-submission.pdf
Australian Business Consulting & Solutions. (2014). India – our next Free Trade Agreement. Retrieved February 26, 2018, from http://www.australianbusiness.com.au/international-trade/export-markets/india/india---our-next-free-trade-agreement-
Australian Trade and Investment Commission. (2016, February 17). A look at the ‘intensity’ of Australia’s trading relationships. (Mark Thirlwell) Retrieved February 30, 2018, from https://www.austrade.gov.au/news/economic-analysis/a-look-at-the-intensity-of-australias-trading-relationships
Deloitte Access Economics. (2015, 12). Growth and opportunity in Australian international education. Retrieved February 29, 2018, from Australian Trade and Investment Commission: https://www.austrade.gov.au/Australian/Education/Services/australian-international-education-2025/growth-and-opportunity
Department of Foreign Affairs and Trade. (n.d.). About free trade agreements. Retrieved February 29, 2018, from http://dfat.gov.au/trade/agreements/Pages/about-ftas.aspx
Department of Foreign Affairs and Trade website. (2017, December). India. Retrieved February 29, 2018, from http://dfat.gov.au/trade/resources/Documents/inia.pdf
Department of Foreign Affairs and Trade website. (2017, December). Indonesia. Retrieved February 29, 2018, from http://dfat.gov.au/trade/resources/Documents/indo.pdf
Department of Foreign Affairs and Trade website. (2018). Australia-India Comprehensive Economic Cooperation Agreement. Retrieved February 28, 2018, from http://dfat.gov.au/trade/agreements/aifta/Pages/australia-india-comprehensive-economic-cooperation-agreement.aspx
Creating a response [3–4] concise expression and development of relevant ideas that enhance economic meaning (e.g. the sequencing of ideas shown by subheadings ‘Growth opportunities’, ‘Trade intensity’ and ‘Focus on imports and exports’) and effective use of graphs, diagrams and/or statistics features of a report genre are consistently demonstrated through the cover page, contents page, headings and subheadings; the introduction outlines the aims, establishes the importance of the issue and foreshadows the economic criteria that will be used; the conclusion astutely summarises the main points of the analysis and evaluation minimal errors in spelling, grammar and punctuation throughout the report

Economics 2019 v1.1 IA2 high-level annotated sample response
Queensland Curriculum & Assessment Authority September 2018
Page 14 of 15
Department of Foreign Affairs and Trade website. (2018). Indonesia-Australia Comprehensive Economic Partnership Agreement. Retrieved February 28, 2018, from http://dfat.gov.au/trade/agreements/iacepa/Pages/indonesia-australia-comprehensive-economic-partnership-agreement.aspx
Department of Foreign Affairs and Trade website. (2018). Status of FTA negotiations. Retrieved February 28, 2018, from http://dfat.gov.au/trade/agreements/Pages/status-of-fta-negotiations.aspx
Grain Growers Ltd. (2016, Septermber). The Indonesian market for Australian grains: An overview. Retrieved March 1, 2018, from https://www.aph.gov.au/DocumentStore.ashx?id=f27387b1-b111-4878-a225-2ce837945bb9&subId=463774
Group of Eight Limited. (2016, 12 6). Group of Eight Submission to the Department of Foreign Affairs and Trade Regarding the Proposed. Retrieved from http://dfat.gov.au/trade/agreements/iacepa/Documents/group-of-eight-2016.pdf
HSBC Holdings plc. (2017). Higher and higher, Global report. Retrieved from The Value of Education research study: www.hsbc.com/-/media/hsbc-com/.../2017/pdfs/171205-the-value-of-education.pdf
ICEF Monitor. (2017, October 25). Australian education exports approaching AUS$29 billion. Retrieved March 3, 2018, from http://monitor.icef.com/2017/10/australian-education-exports-approaching-aus29-billion/
The Australian. (2017, June 5). An FTA with Indonesia would remove tradblocks to trade flow. Retrieved February 30, 2018, from https://www.theaustralian.com.au/business/opinion/an-fta-with-indonesia-would-remove-roadblocks-to-trade-flow/news-story/ddc382cfc176741ab8b0d94d09e0e2ae
The Australian Financial Review. (2017, April 10). Time to take India relationship to a new level: Malcolm Turnbull. Retrieved March 4, 2018, from http://www.afr.com/news/time-to-take-india-relationship-to-a-new-level-malcolm-turnbull-20170410-gvhn8d
The Economic Times, India. (2017, April 18). Having good look at proposed FTA with India: Australia . Retrieved from https://economictimes.indiatimes.com/news/economy/foreign-trade/having-good-look-at-proposed-fta-with-india-australia/articleshow/58236846.cms
The Economist. (2017, September 6). How Australia broke the record for economic growth. Retrieved March 4, 2018, from https://www.economist.com/blogs/economist-explains/2017/09/economist-explains-3
The Economist blog. (2007, August 21). Making the second best of it. Retrieved March 1, 2018, from https://www.economist.com/blogs/freeexchange/2007/08/making_the_second_best_of_it

Economics 2019 v1.1 IA2 high-level annotated sample response
Queensland Curriculum & Assessment Authority September 2018
Page 15 of 15
The World Fact Book: CIA. (2017). India. Retrieved February 29, 2018, from https://www.cia.gov/library/publications/the-world-factbook/geos/in.html
The World Fact Book: CIA. (2017). Indonesia. Retrieved February 29, 2018, from https://www.cia.gov/library/publications/the-world-factbook/geos/in.html
The World FactBook: CIA. (2017). China. Retrieved February 28, 2018, from https://www.cia.gov/library/publications/the-world-factbook/geos/ch.html
World Bank. International Comparison Program database 1990–2017. Retrieved May 19, 2018 from https://data.worldbank.org/indicator/NY.GDP.PCAP.PP.CD?view=chart
The Queensland Curriculum and Assessment Authority has reproduced the following materials under Creative Commons licences. This section does not form part of the student response.
Table 1 (image) Tables 2–3 (data)
Creative Commons Attribution 3.0 Australia
Figure 1 (data) Creative Commons Attribution 4.0 International