Embed Size (px)
Citation preview

Economic structure, growth, and convergence
Dani Rodrik
August 2011
Lack of convergence over different time horizons
AUTBELDNKFIN
FRADEUITANLD
NORSWECHE
GBR
IRLGRC
PRTESP
AUSNZLCANUSA
CZEBRA
CHL
MEX
VEN
JAM
CHN
INDIDN
JPN
PHL
KOR
THA
TWN
MMR
HKG
MYS
NPL
SGP
LKA
PRK
VNM
IRN
IRQ
JORLBN
SYRTUR
WBG
DZAEGYMARZAFTUN
0
.01
.02
.03
4 5 6 7 8log GDP per worker, 1820
1820-2008
AUT
BELDNK
FIN
FRADEUITA
NLD
NORSWE
CHE
GBR
IRLGRC
PRT ESP
AUSNZL
CANUSA
ALB BGR CZEHUN
POL
ROM
YUGARGBRA CHLMEX
URY
VEN
JAM
CHN
INDIDN
JPN
PHL
KOR
THA
TWN
MMR
HKG
MYS
NPL
SGP
LKA
PRK
VNM
IRN
IRQ
JOR
LBN
SYRTUR
WBG
DZAEGY
GHA
MAR ZAF
TUN
0
.01
.02
.03
6 6.5 7 7.5 8log GDP per worker, 1870
1870-2008
AUTBELDNK
FIN
FRADEUITA
NLD
NOR
SWECHE
GBR
IRLGRCPRTESP
AUSNZL
CANUSAALB BGR CZE
HUNPOL
ROM
YUG
ARG
BRA
CHLCOL MEXPER
URY
VEN
JAM
CHN
IND IDN
JPN
PHL
KOR
THA
TWN
MMR
HKG
MYS
NPL
SGP
LKA
PRK
VNM
IRN
IRQ
JOR
LBN
SYRTUR
WBG
DZAEGY
GHA
MAR
ZAF
TUN
0
.01
.02
.03
.04
6.5 7 7.5 8 8.5log GDP per worker, 1913
1913-2008
AUTBEL
DNK
FINFRA
DEUITANLD
NORSWE
CHEGBR
IRLGRCPRTESP
AUSNZL
CANUSAALB
BGRCZEHUNPOLROMYUG
ARG
BRA CHLCOLMEXPER URY
VENBOL
CRI
CUB
DOM
ECUSLVGTM
HTI
HND
JAM
NIC
PAN
PRY
PRITTO
CHN
INDIDN
JPN
PHL
KOR
THA
TWN
BGD
MMR
HKG
MYS
NPLPAK
SGP
LKA
AFG
KHM
LAOMNG
PRK
VNMBHRIRN
IRQ
ISR
JOR
KWT
LBN
OMN
QAT
SAUSYRTUR
ARE
YEMWBGDZA
AGOBEN
BWA
BFA
BDICMR
CPV
CAF
TCDCOM
COG
CIVDJI
EGY
GNQ
ETH
GABGMB GHA
GINGNBKEN
LSO
LBR
LBY
MDG
MWIMLIMRT
MUS
MARMOZ NAM
NER
NGARWASTP
SEN
SYC
SLE SOM
ZAFSDN
SWZ
TZA
TGO
TUN
UGA
ZAR
ZMBZWE
-.02
0
.02
.04
.06
6 7 8 9 10log GDP per worker, 1950
1950-2008
Unconditional and conditional convergence -.
2-.
10
.1.2
.3
Gro
wth
of G
DP
per
work
er,
ort
hogonal part
6 8 10 12 14log of initial real GDP per worker
coeff = -0.034 (clustered t-stat = 4.69)
-.5
-.4
-.3
-.2
-.1
Gro
wth
of G
DP
per
work
er,
ort
hogonal part
6 8 10 12 14log of initial real GDP per worker
Each observation corresponds to one country over a specific decade. Right panel includes country dummies.
unconditional (left panel) and conditional (right panel)
Pooled decadal convergence regressions, 1970-2008
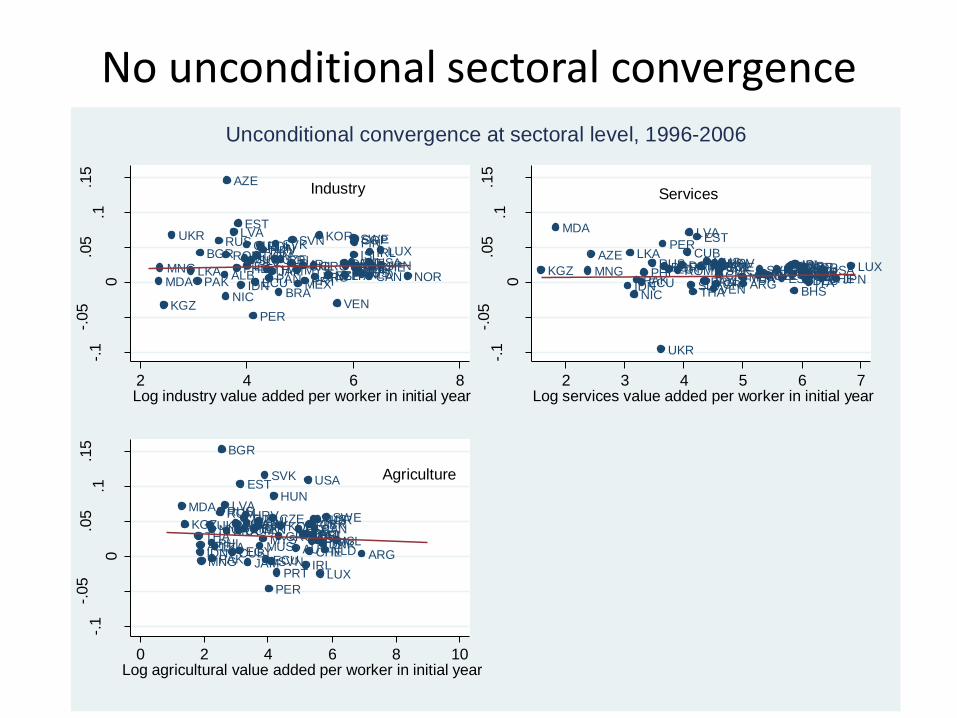
No unconditional sectoral convergence
ALB ARG AUSAUT
AZE
BEL
BGR
BRA
CANCHECHL
CRICUB
CZE DEUDNKDOM
ECU
EGYESP
EST
FIN
FRAGBRGRC
HRVHUN
IDN
IRLISL
ITAJAM JPN
KGZ
KOR
LKA
LUX
LVA
MDA MEX
MNGMUS
MYS
NIC
NLD NORNZLPAK PAN
PER
PHL
POL
PRT
ROMRUS SGP
SLV
SVKSVN SWE
THATUR
UKR
USA
VEN
Industry
-.1
-.05
0
.05
.1.1
5
2 4 6 8Log industry value added per worker in initial year
ARG
AUSAUT
AZE
BELBGR
BHSBRA
CANCHECHL
CRI
CUBCZE
DEUDNK
DOM
ECUEGY
ESP
EST
FINFRAGBRGRC
HRVHUN
IDN
IRLISL
ITAJAM JPNKGZ KOR
LKALUX
LVAMDA
MEXMNG
MUSMYS
NIC
NLDNOR
NZLPAKPAN
PER
PHLPOL
PRTROMRUS SGP
SLV
SVK SVN SWE
THATUR
UKR
USA
VEN
Services
-.1
-.05
0
.05
.1.1
5
2 3 4 5 6 7Log services value added per worker in initial year
ARG
AUS
AUTAZEBEL
BGR
BHSBRA CAN
CHE
CHLCRI
CUB
CZE
DEUDNK
DOM
ECUEGY
ESP
EST
FIN
FRA
GBRGRC
HRV
HUN
IDNIRL
ISLITA
JAM
JPN
KGZ KOR
LKA
LUX
LVAMDA
MEX
MNG
MUSMYS
NIC
NLD
NOR
NZL
PAK
PAN
PER
PHL
POL
PRT
ROMRUSSLV
SVK
SVN
SWE
THA
TURUKR
USA
VEN
Agriculture
-.1
-.05
0
.05
.1.1
5
0 2 4 6 8 10Log agricultural value added per worker in initial year
Unconditional convergence at sectoral level, 1996-2006
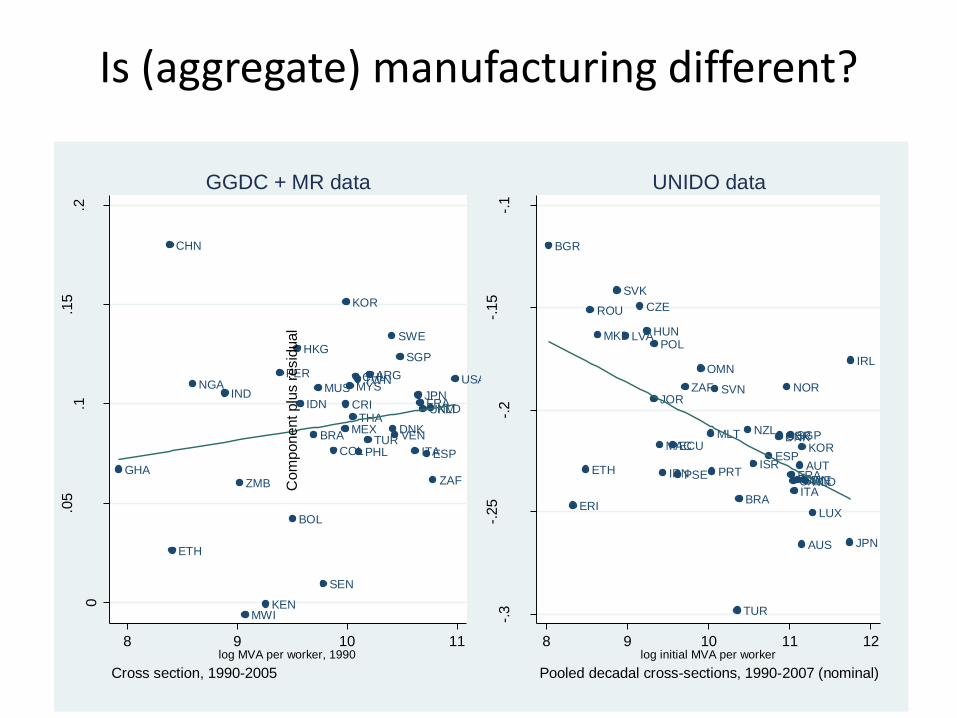
Is (aggregate) manufacturing different?
GHA
CHN
ETH
NGAIND
ZMB
MWIKEN
PER
BOL
HKG
IDN
BRA
MUS
SEN
COL
MEX
CRI
KOR
MYS
THA
CHLTWN
PHLTUR
ARG
SWE
DNKVEN
SGP
ITA
JPNFRAUKM
ESP
NLD
ZAF
USA
0
.05
.1.1
5.2
8 9 10 11log MVA per worker, 1990
Cross section, 1990-2005
GGDC + MR data
BGR
ERI
ETH
ROU
MKD
SVK
LVA
CZE
HUN
JOR
POL
MAC
IRN
ECU
PSE
ZAF
OMN
MLT
PRT
SVN
TUR
BRA
NZL
ISRESP
DNKGBR
NOR
SGP
FRACANITASWE
AUT
AUS
KOR
FINNLD
LUX
JPN
IRL
-.3
-.25
-.2
-.15
-.1
Com
ponent plu
s r
esid
ual
8 9 10 11 12log initial MVA per worker
Pooled decadal cross-sections, 1990-2007 (nominal)
UNIDO data
Details on data and methods
• UNIDO INDSTAT4 dataset: 4-digit manufacturing
• Coverage: largely organized firms
• Data on employment and (nominal) value added– labor productivity = VA/employment
• Time series tend to be short– I pool cross-sections over overlapping decades between 1990-2007 to
maximize no. of countries
– No. of countries: 40 (for 10-year horizon); 72 (for 5-year horizon)
• Number of industries included per country: 1-152, in double digits in most cases
Methods (I)Let denote (nominal) labor productivity in industry i¸country j,
time t.
The rate of growth of labor productivity in real terms:
,
where is the increase in the industry-level deflator
Let growth depend both on convergence and country-specific
factors:
,
where is a dummy variable that stands in for all time-invariant
country-specific factors.
is the convergence coefficient we are interested in estimating.
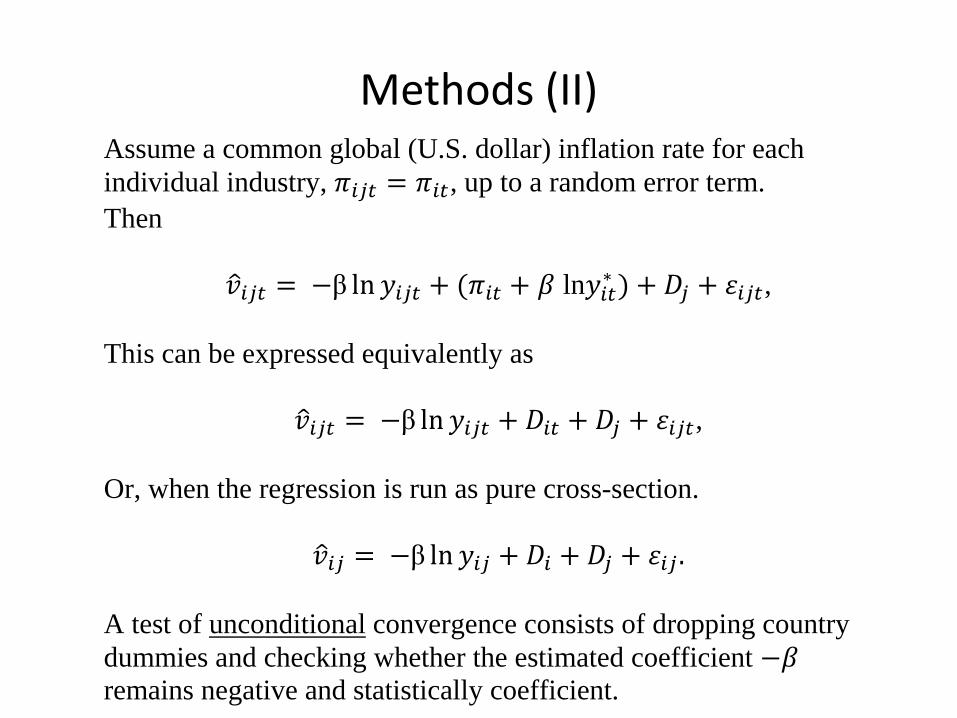
Methods (II)Assume a common global (U.S. dollar) inflation rate for each
individual industry, , up to a random error term.
Then
ln ,
This can be expressed equivalently as
,
Or, when the regression is run as pure cross-section.
A test of unconditional convergence consists of dropping country
dummies and checking whether the estimated coefficient
remains negative and statistically coefficient.
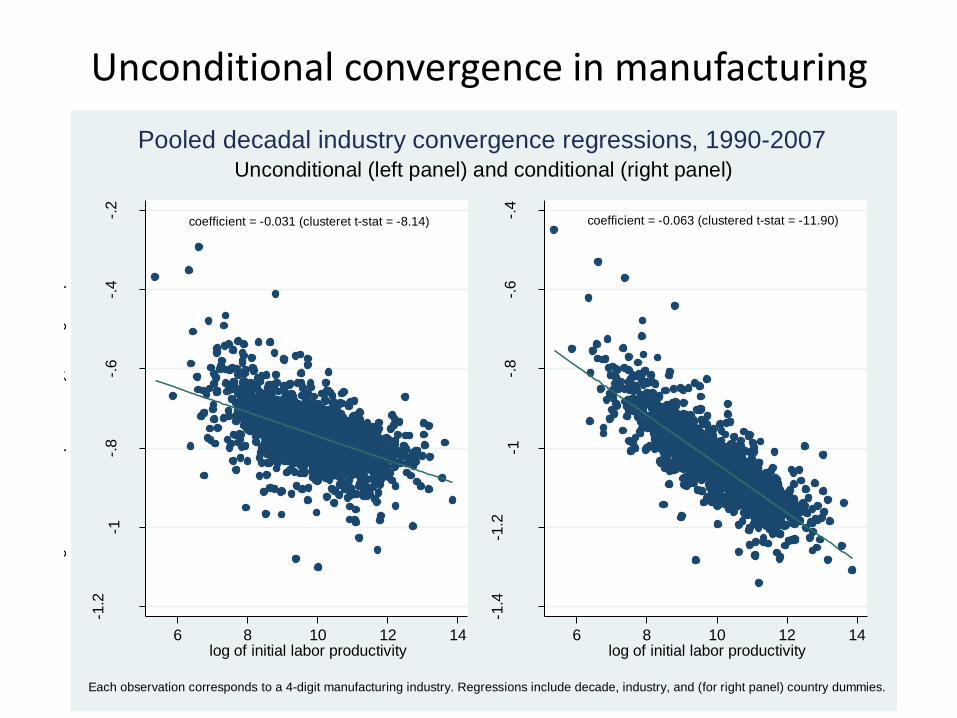
Unconditional convergence in manufacturing
coefficient = -0.031 (clusteret t-stat = -8.14)
-1.2
-1-.
8-.
6-.
4-.
2
gro
wth
of la
bor
pro
ductivity, ort
hogonal part
6 8 10 12 14log of initial labor productivity
coefficient = -0.063 (clustered t-stat = -11.90)
-1.4
-1.2
-1-.
8-.
6-.
4
gro
wth
of la
bor
pro
ductivity, ort
hogonal part
6 8 10 12 14log of initial labor productivity
Each observation corresponds to a 4-digit manufacturing industry. Regressions include decade, industry, and (for right panel) country dummies.
Unconditional (left panel) and conditional (right panel)
Pooled decadal industry convergence regressions, 1990-2007
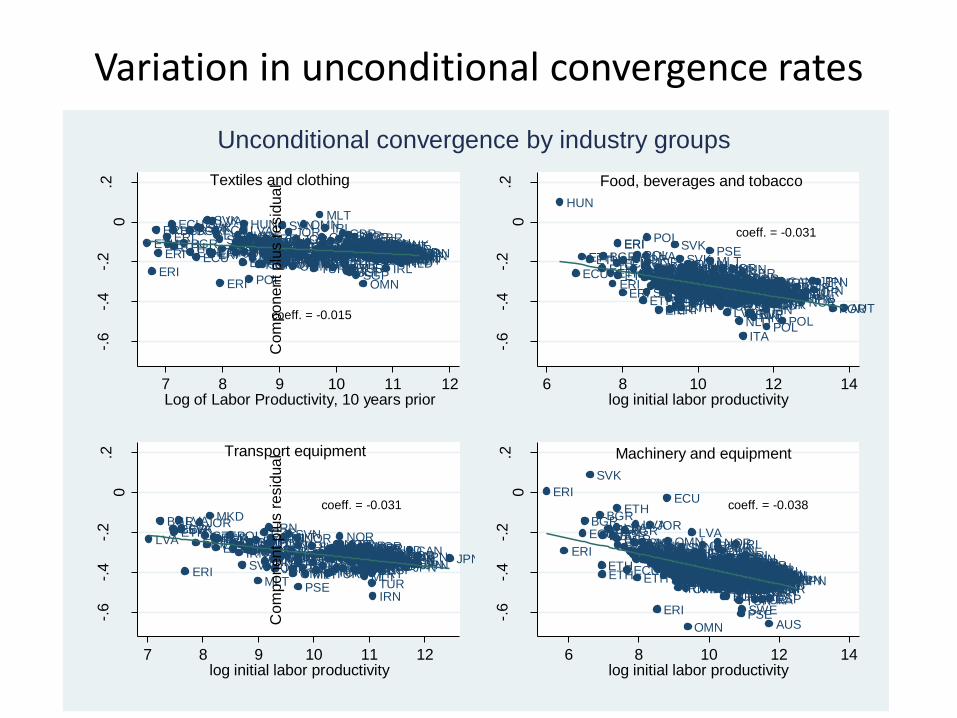
Variation in unconditional convergence rates
ETH
ERI
ERI
ERI
ERIETH
ECUBGR
ETHBGRBGR
ETHECU
SVKSVKSVK
ETHERI
LVA
ERI
ECULVASVK
ERI
LVASVKSVKJOR
HUNCZEHUNCZE
ERI
LVALVA
HUN
IRNECUECUJOR
POL
ECUCZESVK
POLJORPOLPOLCZE
HUN
POLIRNPOLECU
JORECUCZEECUPSE
LVAPOLCZECZEIRNJOR
ETHCZEPOLLVAIRNIRNIRNIRNPOLECUIRNPOLZAFIRNJOR
SVN
JORIRN
CZE
JOR
BRAOMN
JOR
MACPRTIRNSVNBRA
OMN
SVNOMNTUR
SVN
PRTIRNTURTURTURTURPRTECUMLTSVN
MLT
SVNTURMLTOMN
ISRMLTSVNPRT
IRL
SGPTUR
ISRBRASVNSVNPRT
TURISRESPESPGBR
TUR
GBR
ESPTUR
SVN
TURIRL
MLT
ESPGBRCANGBR
ESPGBRCAN
SGP
GBRESPTUR
CANESPCANNORNORNOR
SGP
CANESPCANAUTESPESPFRAFRACANIRLESPNORFIN
OMN
ITAITAGBRGBRSWEFRAFRAFRAKORNORFINAUTFINIRLIRLFRALUXNLD
GBR
FRAKORJPNFINESPITAIRLFINKORKORSWEITAFINDNKDNKCANITADNKGBRSWEKORCANFRAKORNORSWESWEFRAAUTFINFRAGBRCANFINSWEDNKCAN
FINITAAUTFINKORCANNLDFRANORNORITAAUTSWEITAGBRKORJPNKORFIN
FRADNKSWESWE
IRL
NLDNLDITANLDITANORITAAUTSWEKORAUTITAAUTJPNSWENORKORJPNDNKAUT
JPNKORJPNDNKJPNNLDJPNNLDNLDFINNLDJPN
NLDSVNAUTJPNJPNJPN
Textiles and clothing
coeff. = -0.015
-.6
-.4
-.2
0.2
Com
ponent plu
s r
esid
ual
7 8 9 10 11 12Log of Labor Productivity, 10 years prior
HUN
ECU
ETHETHETHBGR
ETHERI
ECU
ERIERI
ETH
ERI
ETHSVKJORPOL
JOR
ETH
SVKHUNSVKLVA
SVK
HUN
POL
JORJORPOLLVAETHLVAPOLECUECUHUNSVK
JORLVA
JORPOLCZE
ERI
IRN
SVKCZESVKETHIRNHUNETHLVAHUNECUPOLCZEECUSVKIRNETHSVKERI
BGRSVKIRNLVAIRN
ERI
ECUOMNSVKIRNHUN
SVK
ERI
HUNECUOMNECUECUIRN
PRTPOLCZEPOL
IRN
LVAHUN
SVK
ECUECUECU
ECUOMN
ETH
IRNIRN
JORPRT
OMNHUN
IRNJORHUNOMNPOLECU
TURPOLTURMLTMLTPRTECUMLT
IRNPOLIRNIRN
SVNOMNHUN
MLTETHLVATURLVAJORIRNTURTUR
ECUIRN
OMNMLTHUNSVNSVNJORTURPRTOMNPRTSGPPOLSGPIRNESPMLTETHSVN
ERI
PSE
PRT
MLT
ROUOMNESP
SVK
NORTURSVNPRTSGPNORFINSVN
GBRDNK
KORSGPCAN
IRL
ERIBRAPRTKORGBR
OMN
SVN
TURSGPESPNORMLTESPLUX
TURITAGBRDNKSGPTUR
PRT
TURMLTIRLESPFRAFRASVNNLD
NOR
FRANOR
LUXDNKDNK
JORAUTFINCANFRAFIN
LVATURSWEAUTSWEAUTIRLFRAHUNNLDFRACANTURFINTUR
ESPSWEESPITAKORHUN
FINISRSWEAUT
TURESPITAFINITAESPNLDKORDNKITADNKAUTESPAUTFRAFRANORGBRFRAKORFINSGPSGPESPITASWEESP
NLD
FRAJPNGBRFINCANSWECANNORCANESPKORAUTSWE
GBRIRLJPNBRA
ITA
ITADNKGBRITAITACANJPNNOR
ITASWEGBRKORPRTFINJPNGBRKORITAFINITAFINJPNNORITA
IRLSWE
CAN
AUTAUTCANITAITAJPNNLDAUTNORFINFRA
TUR
NLDCANITANLDFRACAN
FIN
IRLFINOMNGBRKORKORNORFINSWESWEGBRNLDFRACANESPESPSVNKORAUSNLDFRA
KOR
CANCANLUXCANAUTIRLIRLJOR
FINNLD
POL
JPNESPNLDJPNCAN
DNKCANKORKORITAJPNKORJPNJPNJPN
CAN
POL
GBRJPNECUNLD
KORJPNNORJPNKORJPNJPNJPN
KORAUT
Food, beverages and tobacco
coeff. = -0.031
-.6
-.4
-.2
0.2
Com
ponent plu
s r
esid
ual
6 8 10 12 14log initial labor productivity
LVA
BGRBGRETHLVASVKLVA
ERI
ERI
JORCZELVA
MKD
BGRECUECULVAPOL
ECUHUNHUNIRNECU
SVK
LVAPOLPOLPOLPOLOMNSVKETH
MLT
HUN
CZE
IRNJOR
CZE
IRN
POLHUNHUN
LVAJOR
POLIRNIRNIRNIRN
MLT
PRTTUR
SVN
PRT
OMNIRN
NOR
TUR
PSE
PRTPRTPOL
HUNMLT
SVN
MLTBRAPRT
SVN
BRAESPECUTUR
KORIRLESPSVN
TUR
ESPESPIRL
SGP
ISR
SGP
NORBRAGBRIRLGBRNOR
KORGBRSWEESPSWECANTURFRAIRNIRLITAKORNORCANITAITAHUNFRAFRAFINITA
KORFINFINSWESGP
ESPGBRITAFRAAUTITANORDNKGBRNORFRAFINSWEFINFRADNKNOR
ISRITAGBRNLDESPAUTGBRITAESPFINNLD
MLTITASWESWEITAKOR
NLDSWEAUTFINSWEFRAFIN
NORKORNORAUTGBRCANESPCANFRAPRTFRAFRA
TURIRN
NLDBRASWECANBRAGBRNLDGBRCANESPKORKORKORSGPNLD
NLDJPNCANKOR
AUTJPNJPNJPN
CANJPNJPNJPN
JPN
Transport equipment
coeff. = -0.031
-.6
-.4
-.2
0.2
Com
ponent plu
s r
esid
ual
7 8 9 10 11 12log initial labor productivity
ERI
ERI
ECUBGR
SVK
BGR
ETHETH
LVAECUBGRBGRLVA
ETH
BGRBGRBGR
BGR
ECU
BGRBGRSVKLVASVK
LVA
LVA
ETH
OMNSVKSVKSVK
SVKLVAECUJORLVASVKECUSVKBGR
JOR
HUNSVKLVALVAJORSVKSVKECULVAECULVAMKDLVAIRNLVABGR
ERI
LVASVKSVKSVKCZEJOR
SVK
IRNLVAPOLSVKLVAJORCZELVAJORSVKSVK
ECU
OMNCZESVKECUCZECZEHUN
SVKECUSVKECUPOLSVKPOLPOLECUCZEIRNPOLJORIRNHUNPOLCZEIRN
IRNPOLCZE
IRNIRNCZE
POLIRNCZE
ECUPOLPOLPSE
CZE
IRN
POLPOL
IRNIRNPOLIRNECUIRNPOLPOL
IRN
SVN
IRNIRNCZEPOLCZEPOLPOLPOLCZEPOLSVKJORPOLOMNPOLIRN
POLIRNOMN
IRNSVK
OMN
ECUJORIRNHUNECUIRNPOLMLTIRNTUR
HUN
LVA
LVA
CZECZEIRNPOLTURCZECZE
HUN
TURCZESVNECUTURTURIRNPRT
IRL
POLSVNPOLSVNSVNSVN
OMN
GBR
SVN
SVNMLTIRNIRNPRTTUROMNMLTPOLJORSVNIRNPRTMLTTUR
TURSVNBRAPRTSVNPRTPRT
SVNSVN
BRASVNSVN
TURPRTMLTPOLPRTSVNPRTTURPRTSVNSVNIRNHUNPRTPRTIRLESP
SGPTUROMNMLTPRTTURSVN
TURJORPRTTUR
SVN
NORGBR
ISR
OMN
MLTSVNIRL
BRASVNMLTTURPRTSGP
KORPRT
OMN
IRLTURESPSVNBRA
TURTUR
GBRSWETURDNKSGPDNK
ECUTUR
SGPESPSVNESPESPIRL
ISR
SVNMLTIRLFRASGPBRAGBRSGPTUR
SWEGBR
ESPFINTUR
GBRNORDNKBRA
FRA
SGP
IRLNORGBR
BRAIRLESPIRLKORCANISRESPGBRFRAKORDNKCANCAN
BRASWEKORGBRMLTSGP
GBRCANNLDESPDNKIRLFINDNKDNKFRADNKESPKORSGPESPNORESPGBRNOR
BRA
IRL
NORISRBRAESPDNKKORSGPESPESPGBRAUT
ESPESPFINESPESPFRAKORSGPAUTCANGBRKORKORNORFRADNK
ITAFRAGBRNLDSWECANITASGPITABRAFIN
GBRNORKORCANESPFRAITAIRLIRLITA
TUR
NORCANNORNLDNLDDNK
TURISRDNKNORITAESPFINFINSWELUXCANSWECANSWEFRAFINFRA
OMN
DNKDNKFINAUT
ESPSGPITANORESPDNKDNKESPGBRFRAITANOR
PSE
CANGBRKORESPFINDNKDNKNLDFRAKORFRASGPGBRSWEGBRNLDKOR
SWE
NLDFRAAUTISRFRANLDDNKSWEKORDNKNORITAKORFRAITACANSGPNLDCANSWEFRACANFRAITAFRASWENORNLDESPESPCANAUTKORIRLNORNLDITAFRAKORSWEFRAGBRGBRSWEIRLDNKNORNORITAFINDNKSWENLDKORSGPFRASWEGBRAUTNLDFRASVNBRANLDAUTAUTAUTFINCANITACANFINSWEAUTNLDITATUR
IRL
ITAKORSWENLDCANSWEAUTAUTAUTFINGBRITAITASWEFRASGPITA
AUTITANORSWEAUTITAAUTKORJPNKORCANAUTDNKAUTAUTAUTITA
NLD
DNKAUTITATURKORITAITAFRANLDGBRNORAUTNORFRASGPSWESGPITAIRLGBRCANESPAUTSWEISRMLTJPNFINAUTSWEFINSWEFINFINSGPFRADNKKORNLDSWENLDITAFINNLDFINITANORKORGBRFINFINFINESP
KORFRANLDDNKAUTNORFINSWE
NOR
SWEAUTSWEAUTSWEFINNORITANOR
TUR
IRLAUTNORKORGBRAUTNLD
NLD
CANSGPAUTJPNISRIRL
KORKORJPNFINITA
JPNNORKORJPNFIN
FRA
JPNJPNNORGBRIRLJPNJPNJPNCAN
JPNFRAGBRJPNJPNJPNSGPBRAJPNJPNJPNSGPIRLJPN
AUS
OMNESP
JPNGBRJPNJPNJPNJPNFINJPNKORJPNJPNJPNJPNJPN
Machinery and equipment
coeff. = -0.038-.
6-.
4-.
20
.2
Com
ponent plu
s r
esid
ual
6 8 10 12 14log initial labor productivity
Unconditional convergence by industry groups
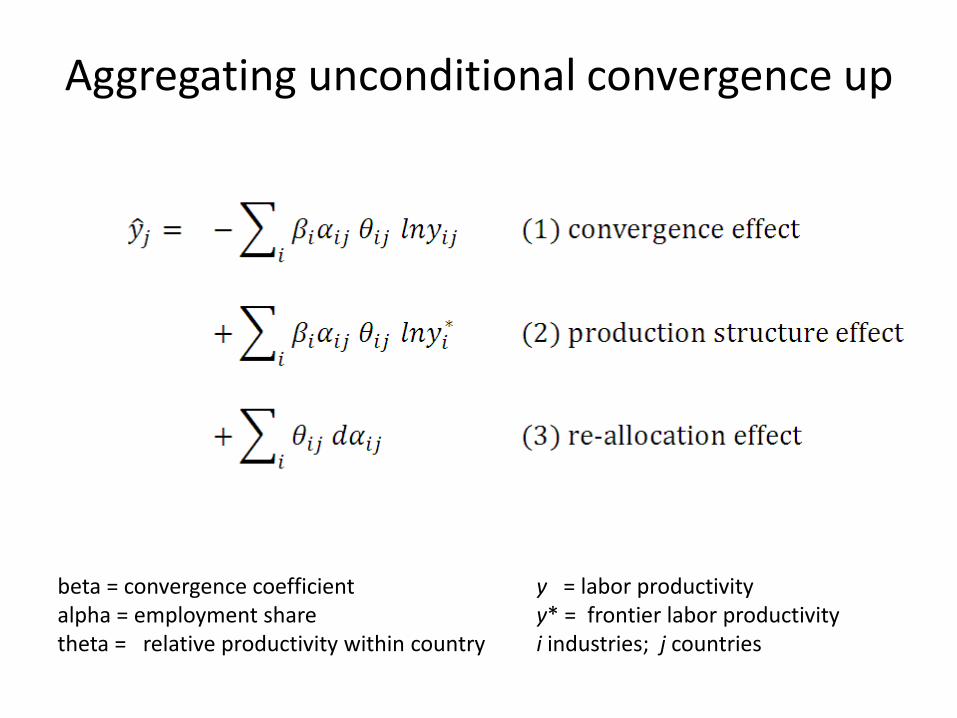
Aggregating unconditional convergence up
beta = convergence coefficient y = labor productivityalpha = employment share y* = frontier labor productivitytheta = relative productivity within country i industries; j countries
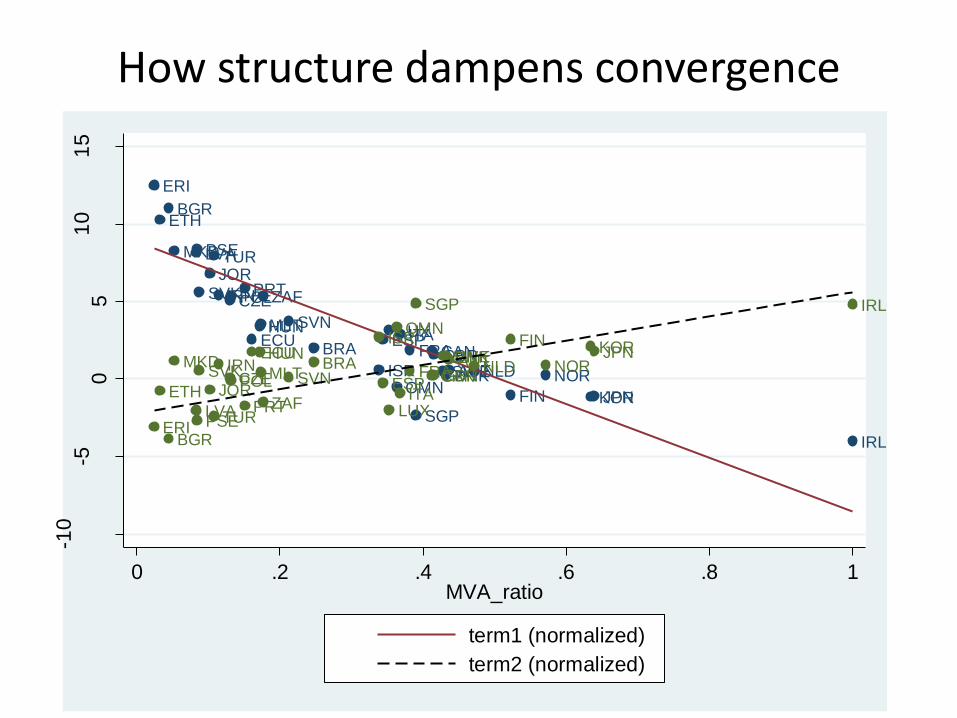
How structure dampens convergence
AUT
BRA
BGR
CAN
CZE
DNK
ECU
ERI
ETH
FIN
FRA
HUN
IRN
IRL
ISR
ITA
JPN
JOR
LVA
LUXMLT
NLD NOR
PSE
OMN
POLPRT
KORSGP
SVK
SVN
ZAF
ESP
SWE
MKD TUR
GBRAUTBRA
BGR
CANCZE
DNKECU
ERI
ETH
FIN
FRAHUN
IRN
IRL
ISR
ITA
JPN
JOR
LVA LUX
MLT NLD NOR
PSE
OMN
POL
PRT
KOR
SGP
SVK SVN
ZAF
ESP
SWEMKD
TUR
GBR
-10
-50
51
01
5
0 .2 .4 .6 .8 1MVA_ratio
term1 (normalized)
term2 (normalized)
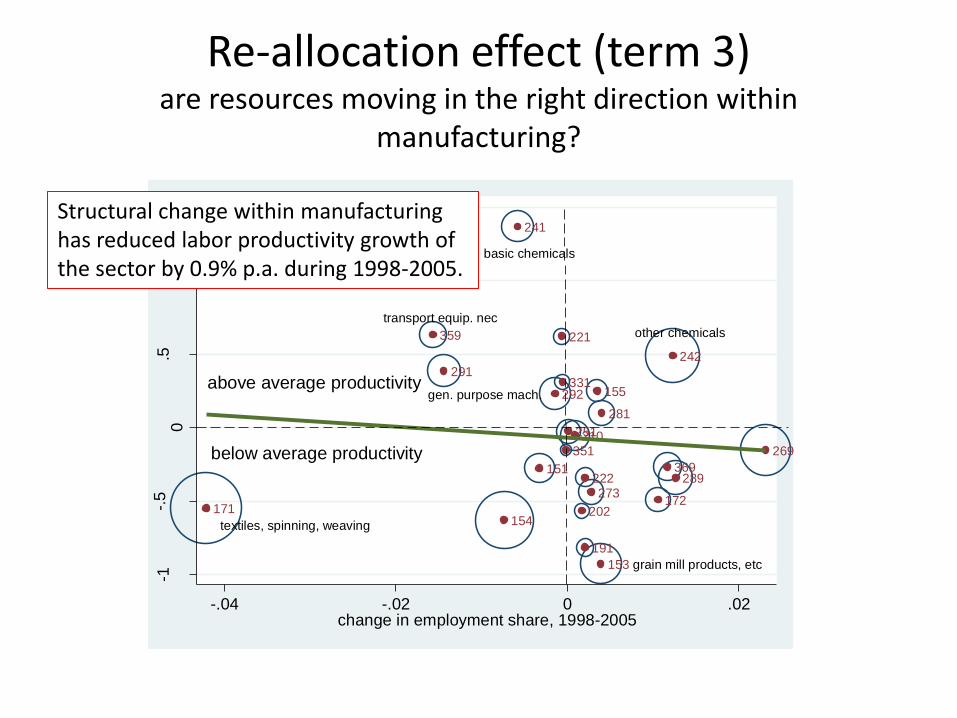
Re-allocation effect (term 3)are resources moving in the right direction within
manufacturing?
151
153
154
155
171172
191
202
210
221
222
241
242
251
269
273
281
289
291
292331
351
359
369
above average productivity
below average productivity
textiles, spinning, weaving
basic chemicals
transport equip. nec
gen. purpose mach.
other chemicals
grain mill products, etc
-1-.
50
.51
1.5
-.04 -.02 0 .02change in employment share, 1998-2005
Structural change within manufacturing has reduced labor productivity growth of the sector by 0.9% p.a. during 1998-2005.

(Economy-wide) productivity growth decomposition in Latin America
Productivity decomposition in Latin America across different periods
(annual growth rates)
-0.01 -0.005 0 0.005 0.01 0.015 0.02 0.025 0.03 0.035 0.04 0.045
1990 - 2005
1975 - 1990
1950 - 1975
Sectoral productivitygrowth
Structural change
Data from Pages, Carmen ed., The Age of Productivity, Inter-American Development Bank, Washington, D.C., 2010.
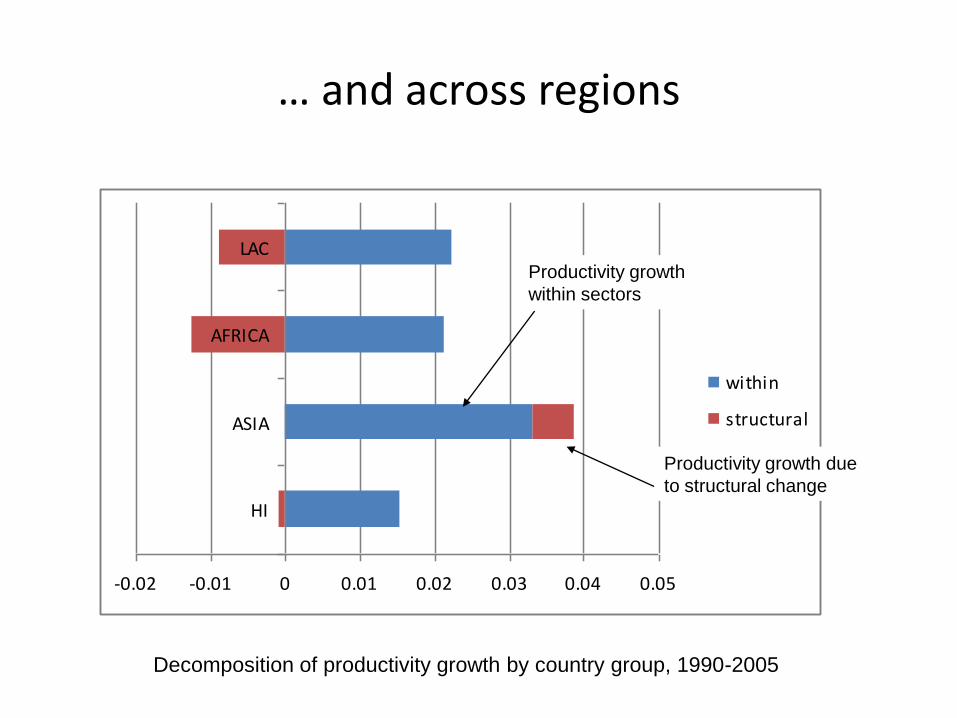
… and across regions
-0.02 -0.01 0 0.01 0.02 0.03 0.04 0.05
HI
ASIA
AFRICA
LAC
within
structural
Decomposition of productivity growth by country group, 1990-2005
Productivity growth
within sectors
Productivity growth due
to structural change
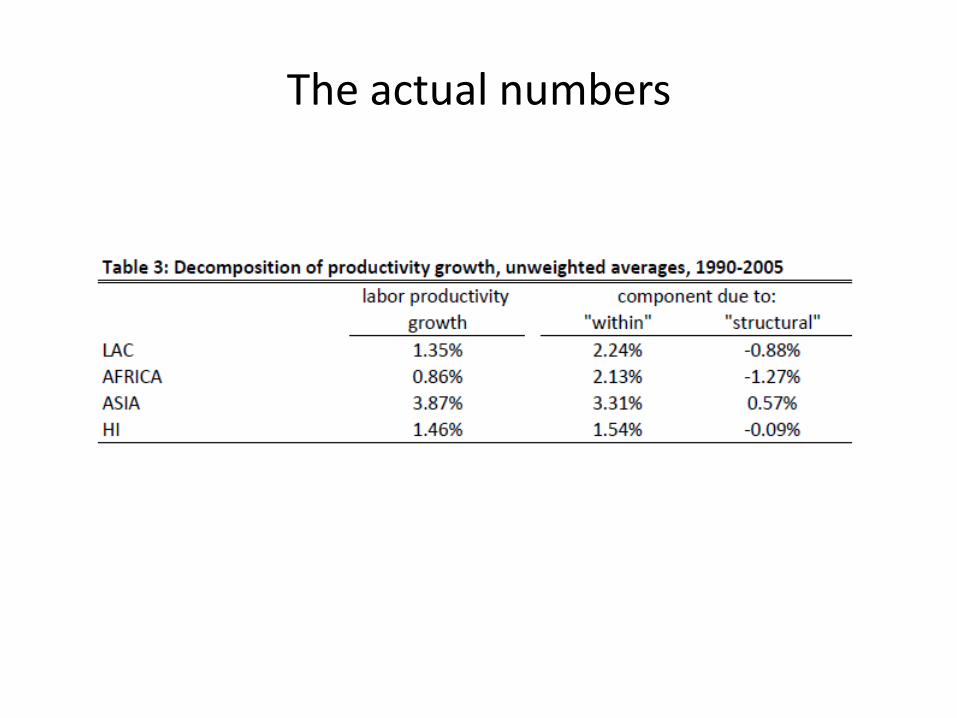
The actual numbers
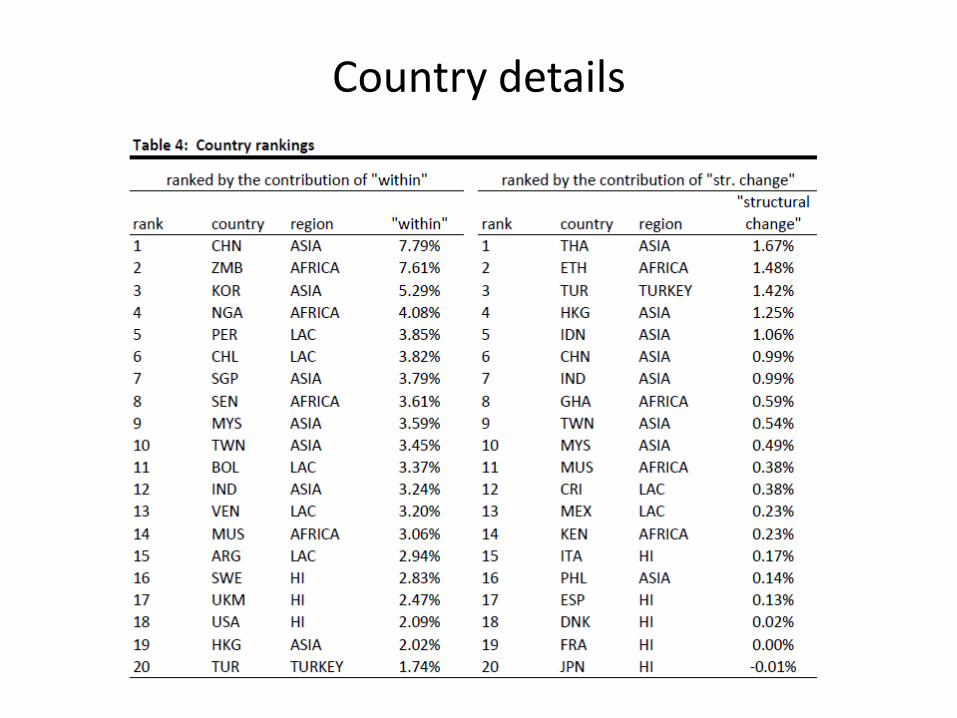
Country details
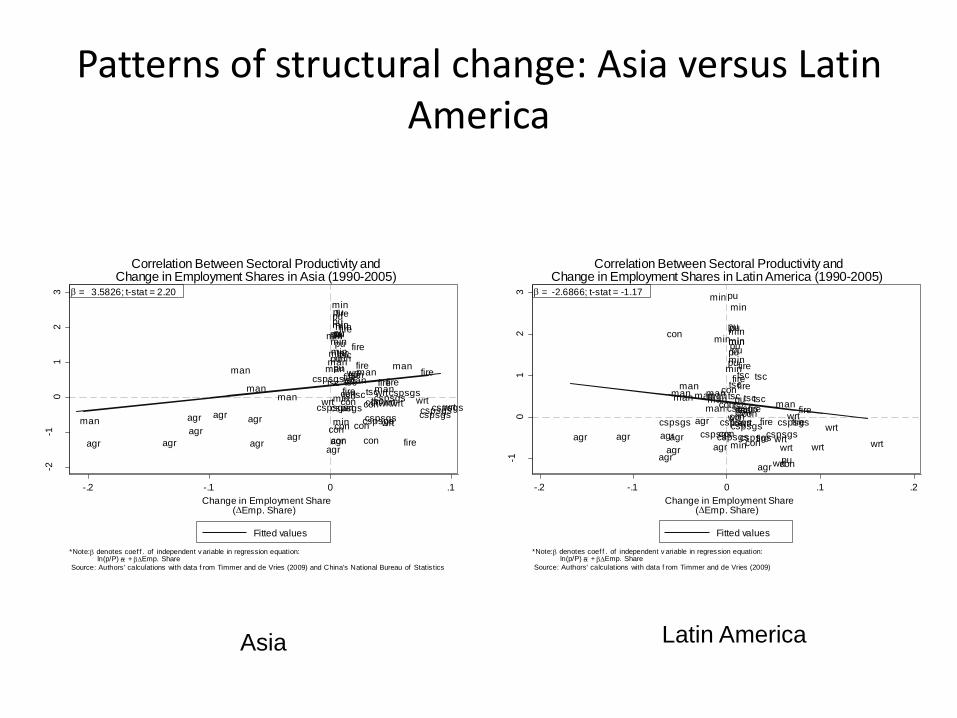
Patterns of structural change: Asia versus Latin America
agr con
cspsgsfire
man
min
pu
tsc
wrt
agr
con
cspsgs
fire
man
min
pu
tsc
wrtagr
con
cspsgs
fire
man
min
pu
tsc
wrt
agr
con
cspsgs
fire
man
minpu
tsc
wrtagr
concspsgsfireman
min
pu
tsc
wrtagr concspsgs
fire
man
min
pu
tsc
wrt
agr
con
cspsgs fire
man
minpu
tsc
wrt
agr
con
cspsgs
fireman
min
pu
tsc
wrt
agr
con
cspsgs
fire
man
min
pu
tsc
wrt
-10
12
3
Lo
g o
f S
ecto
ral P
rod
uctivity/T
ota
l P
rodu
ctiv
ity
-.2 -.1 0 .1 .2
Change in Employment Share(Emp. Share)
Fitted values
*Note: denotes coef f . of independent v ariable in regression equation: ln(p/P) = + Emp. Share
Source: Authors' calculations with data f rom Timmer and de Vries (2009)
= -2.6866; t-stat = -1.17
Correlation Between Sectoral Productivity andChange in Employment Shares in Latin America (1990-2005)
agr
con cspsgs
fire
man
minpu
tsc
wrt
agr
con
cspsgs
fire
man
min
pu
tsc wrt
agr
concspsgs
fire
man
min
pu
tsc wrt
agr
concspsgs
fire
man
min
pu
tsc
wrt
agr
con
cspsgs
fire
man
min
pu
tsc
wrtagr
con
cspsgs
fire
man
min
pu
tsc
wrtagr
concspsgs
fire
man
min
pu
tsc
wrt
agr
concspsgs
fireman
min
pu
tscwrt
agr
con
cspsgsfire
man
min
pu
tsc
wrt
agr con
cspsgsfire
man
min
pu
tsc
wrt
-2-1
01
23
Lo
g o
f S
ecto
ral P
rod
uctivity/T
ota
l P
rodu
ctiv
ity
-.2 -.1 0 .1
Change in Employment Share(Emp. Share)
Fitted values
*Note: denotes coef f . of independent v ariable in regression equation: ln(p/P) = + Emp. Share
Source: Authors' calculations with data f rom Timmer and de Vries (2009) and China's National Bureau of Statistics
= 3.5826; t-stat = 2.20
Correlation Between Sectoral Productivity andChange in Employment Shares in Asia (1990-2005)
Asia Latin America
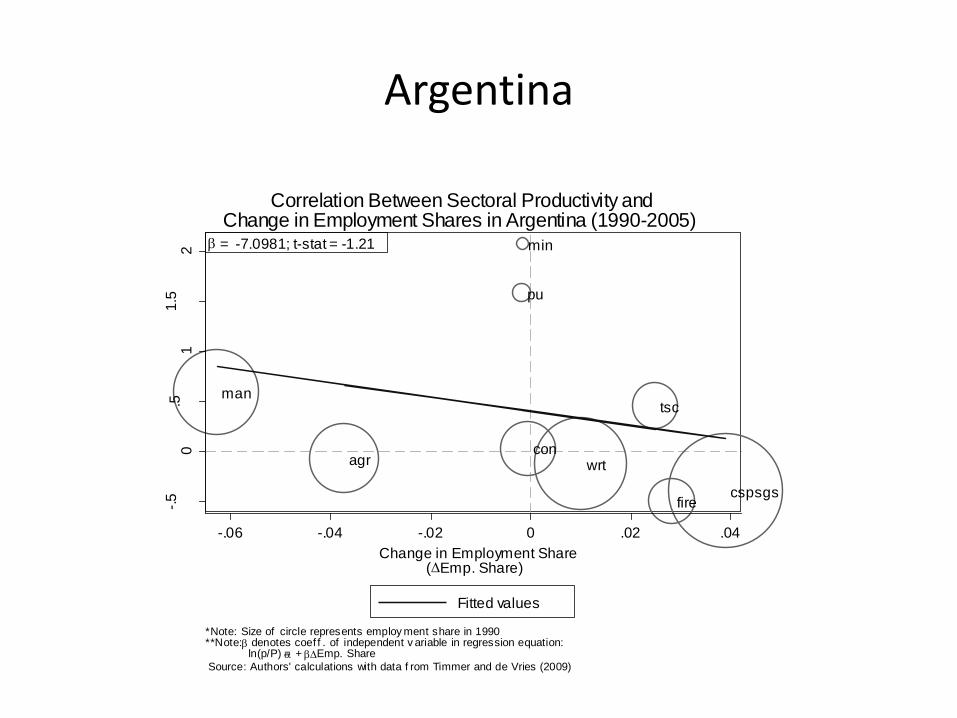
Argentina
agrcon
cspsgsfire
man
min
pu
tsc
wrt
-.5
0.5
11.5
2
Lo
g o
f S
ecto
ral P
rod
uctivity/T
ota
l P
rodu
ctiv
ity
-.06 -.04 -.02 0 .02 .04
Change in Employment Share(Emp. Share)
Fitted values
*Note: Size of circle represents employ ment share in 1990**Note: denotes coef f . of independent v ariable in regression equation: ln(p/P) = + Emp. Share
Source: Authors' calculations with data f rom Timmer and de Vries (2009)
= -7.0981; t-stat = -1.21
Correlation Between Sectoral Productivity andChange in Employment Shares in Argentina (1990-2005)
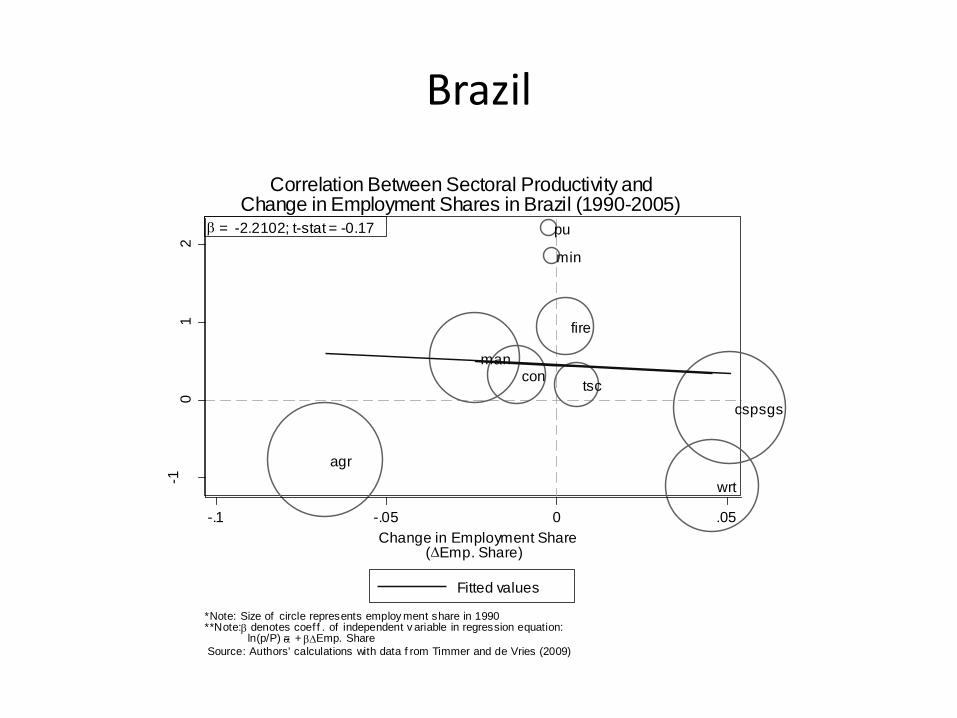
Brazil
agr
con
cspsgs
fire
man
min
pu
tsc
wrt
-10
12
Lo
g o
f S
ecto
ral P
rod
uctivity/T
ota
l P
rodu
ctiv
ity
-.1 -.05 0 .05
Change in Employment Share(Emp. Share)
Fitted values
*Note: Size of circle represents employ ment share in 1990**Note: denotes coef f . of independent v ariable in regression equation: ln(p/P) = + Emp. Share
Source: Authors' calculations with data f rom Timmer and de Vries (2009)
= -2.2102; t-stat = -0.17
Correlation Between Sectoral Productivity andChange in Employment Shares in Brazil (1990-2005)
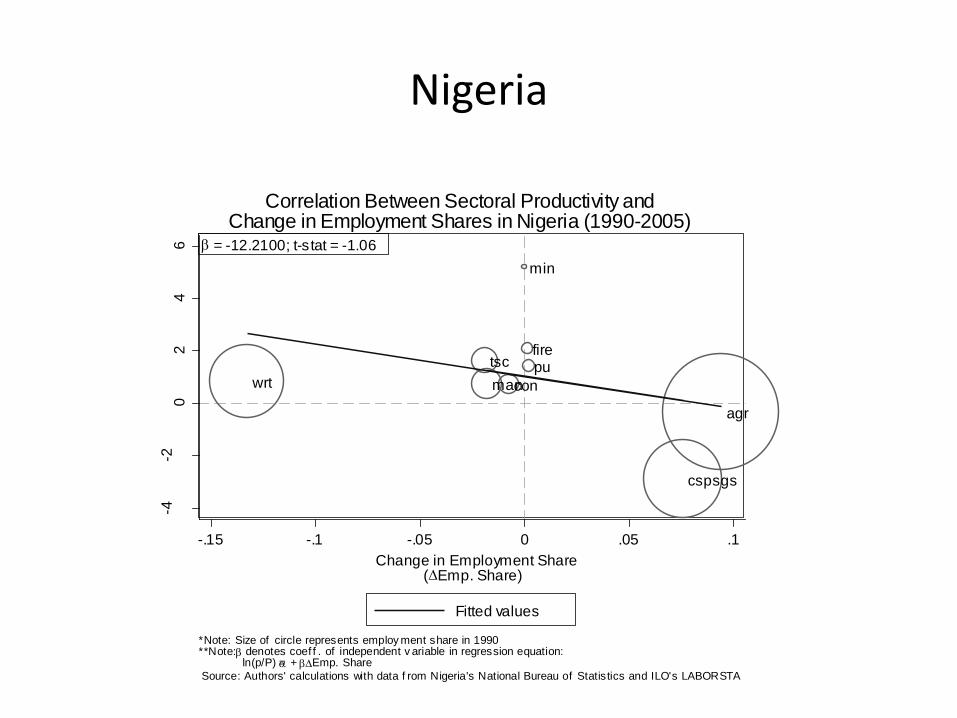
Nigeria
agr
con
cspsgs
fire
man
min
putsc
wrt
-4-2
02
46
Lo
g o
f S
ecto
ral P
rod
uctivity/T
ota
l P
rodu
ctiv
ity
-.15 -.1 -.05 0 .05 .1
Change in Employment Share(Emp. Share)
Fitted values
*Note: Size of circle represents employ ment share in 1990**Note: denotes coef f . of independent v ariable in regression equation: ln(p/P) = + Emp. Share
Source: Authors' calculations with data f rom Nigeria's National Bureau of Statistics and ILO's LABORSTA
= -12.2100; t-stat = -1.06
Correlation Between Sectoral Productivity andChange in Employment Shares in Nigeria (1990-2005)
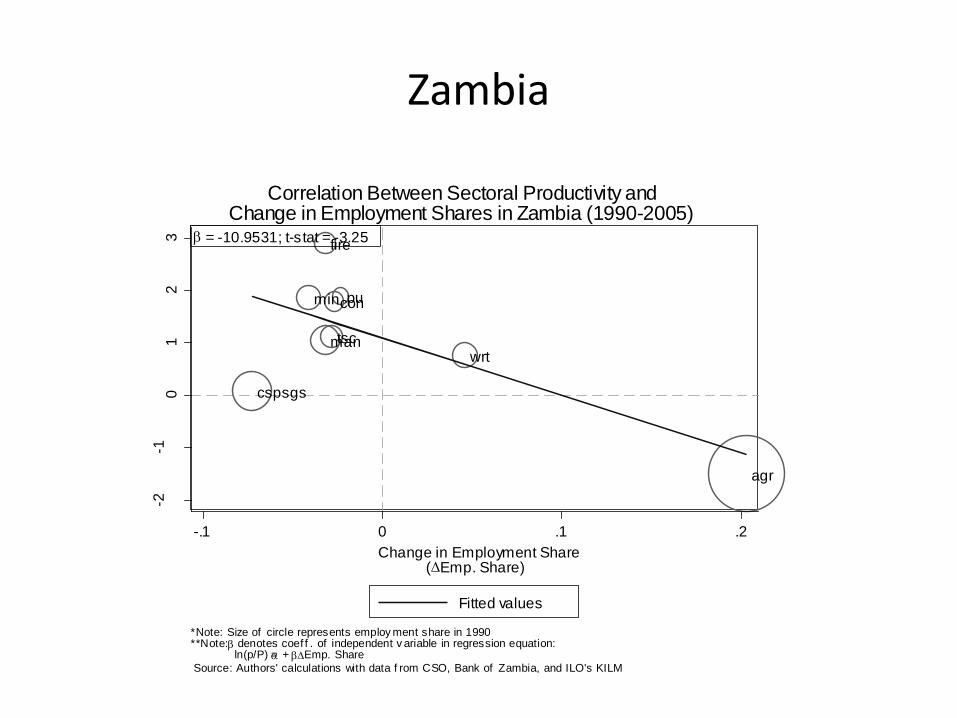
Zambia
agr
con
cspsgs
fire
man
min pu
tsc
wrt
-2-1
01
23
Lo
g o
f S
ecto
ral P
rod
uctivity/T
ota
l P
rodu
ctiv
ity
-.1 0 .1 .2
Change in Employment Share(Emp. Share)
Fitted values
*Note: Size of circle represents employ ment share in 1990**Note: denotes coef f . of independent v ariable in regression equation: ln(p/P) = + Emp. Share
Source: Authors' calculations with data f rom CSO, Bank of Zambia, and ILO's KILM
= -10.9531; t-stat = -3.25
Correlation Between Sectoral Productivity andChange in Employment Shares in Zambia (1990-2005)
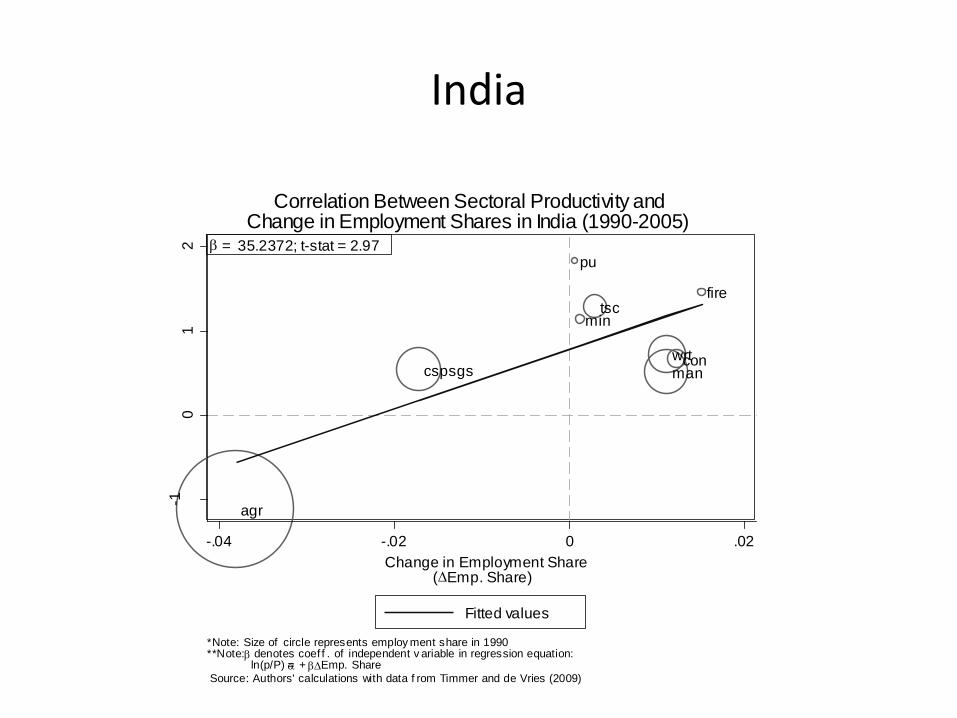
India
agr
concspsgs
fire
man
min
pu
tsc
wrt
-10
12
Lo
g o
f S
ecto
ral P
rod
uctivity/T
ota
l P
rodu
ctiv
ity
-.04 -.02 0 .02
Change in Employment Share(Emp. Share)
Fitted values
*Note: Size of circle represents employ ment share in 1990**Note: denotes coef f . of independent v ariable in regression equation: ln(p/P) = + Emp. Share
Source: Authors' calculations with data f rom Timmer and de Vries (2009)
= 35.2372; t-stat = 2.97
Correlation Between Sectoral Productivity andChange in Employment Shares in India (1990-2005)
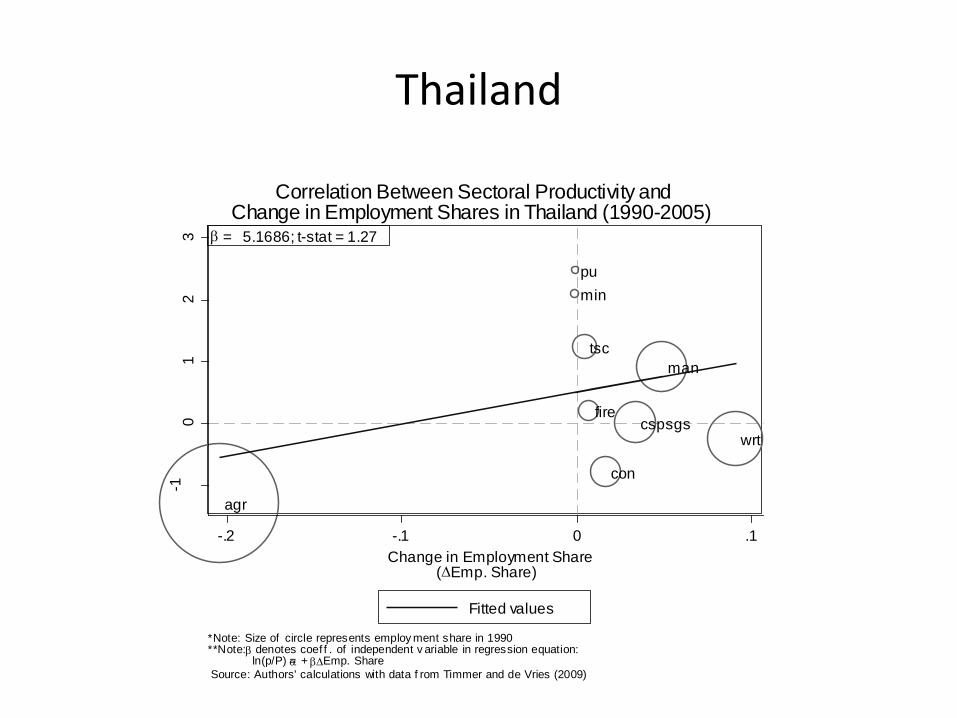
Thailand
agr
con
cspsgsfire
man
min
pu
tsc
wrt
-10
12
3
Lo
g o
f S
ecto
ral P
rod
uctivity/T
ota
l P
rodu
ctiv
ity
-.2 -.1 0 .1
Change in Employment Share(Emp. Share)
Fitted values
*Note: Size of circle represents employ ment share in 1990**Note: denotes coef f . of independent v ariable in regression equation: ln(p/P) = + Emp. Share
Source: Authors' calculations with data f rom Timmer and de Vries (2009)
= 5.1686; t-stat = 1.27
Correlation Between Sectoral Productivity andChange in Employment Shares in Thailand (1990-2005)

What’s going on? Some possibilities:
• Some countries have more “surplus labor” in agriculture than others
• Role of comparative advantage: primary products versus manufactures
• Labor market rigidity: large hiring/firing costs may prevent employment growth in dynamic sectors
• Trade/industrial/currency policies have:– Not encouraged new tradable activities sufficiently
– Exposed tradables to import competition too early and excessively
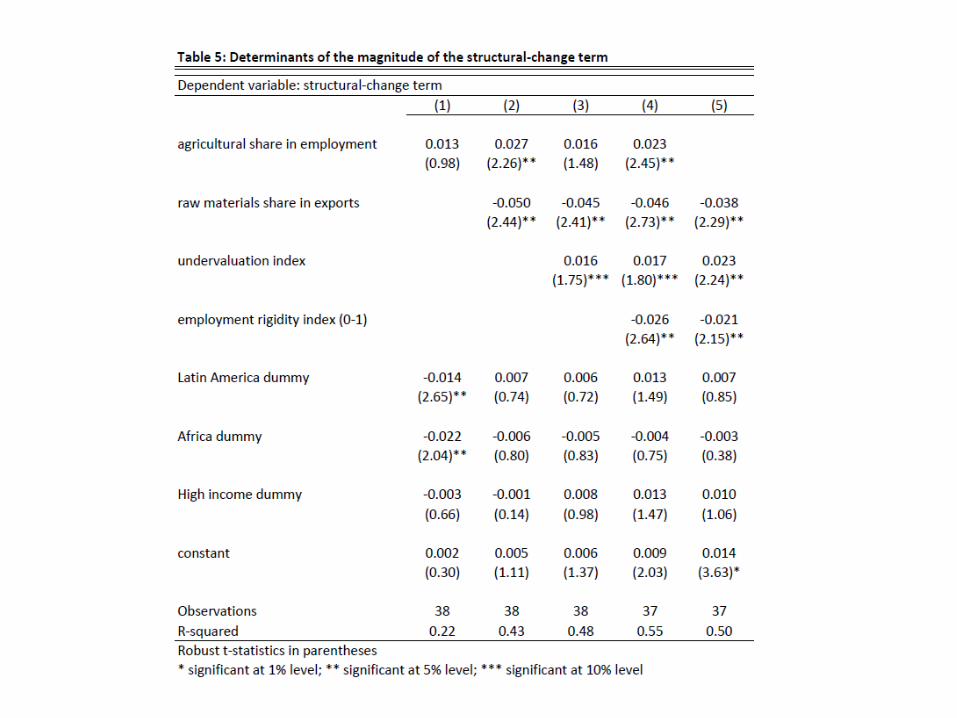
Large reservoir of “excess labor” helps, but only conditionally
SGP
HKG
USAUKM
SWENLDDNKFRA
ITAJPNESP
ARG
TWN
VEN
ZAF
MUS
KOR
CHL
MEX
BRA
MYSCRI
COLPER
BOL
PHL
TUR
NGA
IDN
ZMB
CHN
THA
GHA
SEN
IND
KEN
MWI
ETH
-.08
-.06
-.04
-.02
0
.02
Com
pon
en
t plu
s r
esid
ual
0 .2 .4 .6 .8 1Labor share of agriculture, 1990
SGP
HKG
USAUKM
SWE
NLD
DNK
FRA
ITA
JPN
ESPARG
VEN
ZAF
MUS
KOR
CHL
MEX
BRAMYS
CRI
COL
PER
BOLPHL
TUR
NGA
IDN
ZMB
CHN
THA
GHA
SEN
IND
KEN
MWIETH
-.04
-.02
0
.02
.04
Com
pon
en
t plu
s r
esid
ual
0 .2 .4 .6 .8 1Labor share of agriculture, 1990
Association between the initial labor share in agriculture and the contribution
of structural change to growth
unconditional conditional
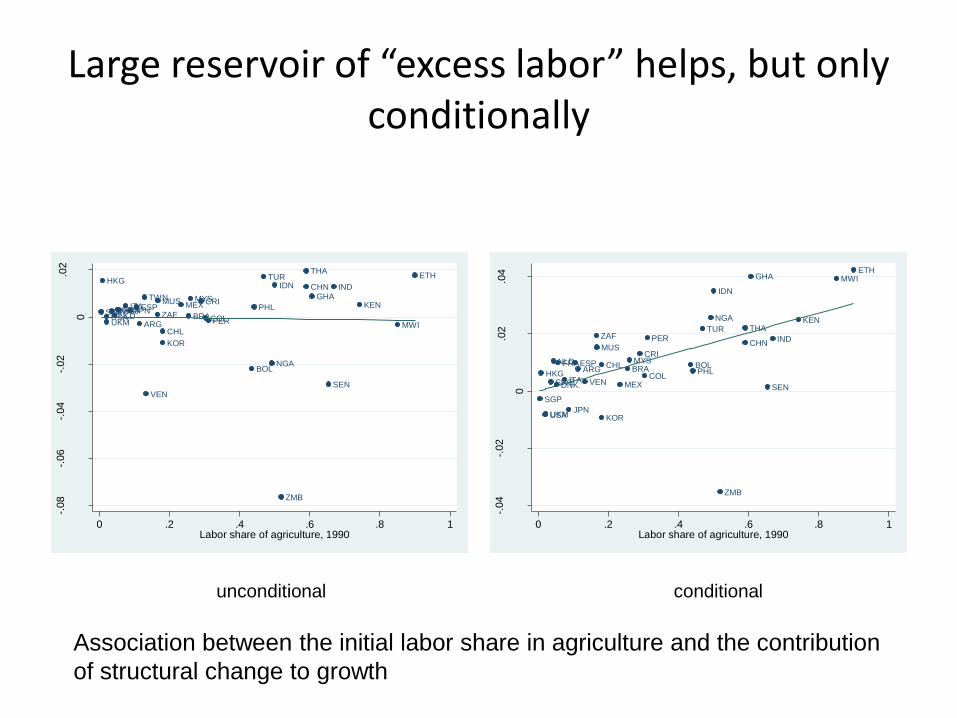
Comparative advantage in primary products is bad news
JPN
HKG
KOR
ITASWETWN
UKMUSASGP
PHL
TUR
CHN
ESPFRA
IND
MUS
THA
MEX
MYSDNKNLD
ZAF
BRA
SEN
KENCRI
IDNETH
COLARG
GHA
PERCHL
BOL
ZMB
MWI
VEN
NGA
-.1
-.08
-.06
-.04
-.02
0
Com
pon
en
t plu
s r
esid
ual
0 .2 .4 .6 .8 1index_exp_rawmat
Partial association between the share of primary products in
exports and the contribution of structural change to growth
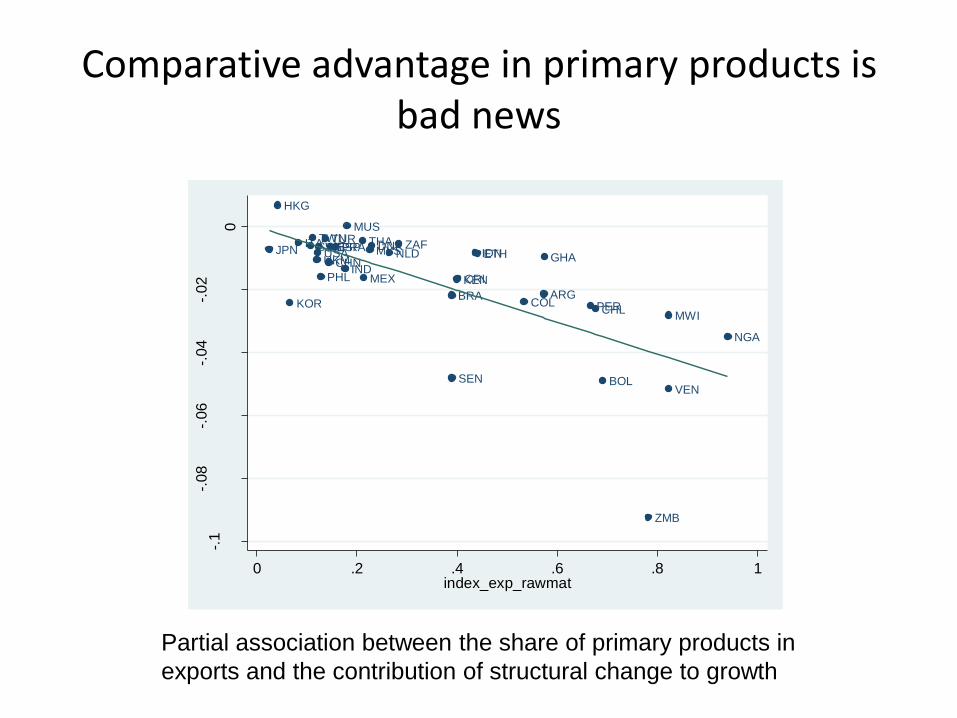
But policy can clearly help: currency undervaluation
JPN
DNK
SWE
NLDFRA
UKM
ITA
NGA
ESP
USA
ZMB
MEX
TWN
SGP
KOR
HKGTURPER
ARG
SEN
VEN
BRA
CRIZAF
BOL
KEN
GHA
CHL
MWI
MYSCOL
THA
ETH
PHL
CHN
IDN
IND
MUS
-.06
-.04
-.02
0
.02
Com
pon
en
t plu
s r
esid
ual
-1 -.5 0 .5 1underval
Partial association between an index of currency “undervaluation”
and the contribution of structural change to growth
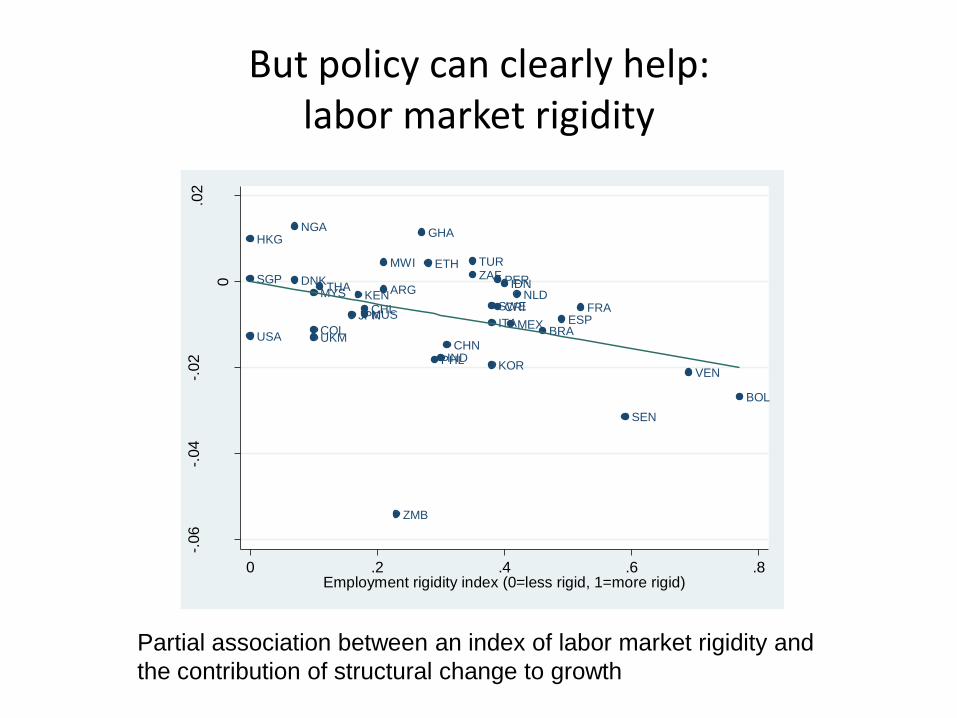
But policy can clearly help: labor market rigidity
Partial association between an index of labor market rigidity and
the contribution of structural change to growth
HKG
USA
SGP DNK
NGA
UKM
MYS
COL
THA
JPN
KEN
MUSCHL
MWI
ARG
ZMB
GHA
ETH
PHLINDCHN
ZAFTUR
SWE
KOR
ITA
PER
CRI
IDN
MEX
NLD
BRAESP
FRA
SEN
VEN
BOL
-.06
-.04
-.02
0
.02
Com
pon
en
t plu
s r
esid
ual
0 .2 .4 .6 .8Employment rigidity index (0=less rigid, 1=more rigid)
Conclusions
• The presence of a large convergence gap ensures significant potential for rapid economic growth in developing world, regardless of what happens in the rich countries
• Fulfilling this potential requires ongoing process of diversification and structural change– towards industries that are higher productivity and on the automatic
escalator up
• This process is not automatic, especially in countries with an initial comparative advantage in primary products