Embed Size (px)
Citation preview

IHS ECONOMICS
The Market Size and Economic Contributions of the Off-Highway Equipment IndustryA report for the Association of Equipment Manufacturers
February 2017 ihs.com
Brendan O’NeilManaging director
Scott HazeltonManaging director
Shane NortonDirector
ECONOMIC IMPACT ANALYSIS
IHS Economics | Report

February 2017 2 © 2017 IHS
IHS Economics | The Market Size and Economic Contributions of the Off -Highway Equipment Industry
About IHS Markit (ihsmarkit.com)
IHS™ ECONOMICS
COPYRIGHT NOTICE AND DISCLAIMER © 2017 IHS. For internal use of IHS clients only. No portion of this report may be reproduced, reused, or otherwise distributed in any form without prior written consent, with the exception of any internal client distribution as may be permitted in the license agreement between client and IHS. Content reproduced or redistributed with IHS permission must display IHS legal notices and attributions of authorship. The information contained herein is from sources considered reliable, but its accuracy and completeness are not warranted, nor are the opinions and analyses that are based upon it, and to the extent permitted by law, IHS shall not be liable for any errors or omissions or any loss, damage, or expense incurred by reliance on information or any statement contained herein. In particular, please note that no representation or warranty is given as to the achievement or reasonableness of, and no reliance should be placed on, any projections, forecasts, estimates, or assumptions, and, due to various risks and uncertainties, actual events and results may diff er materially from forecasts and statements of belief noted herein. This report is not to be construed as legal or fi nancial advice, and use of or reliance on any information in this publication is entirely at client’s own risk. IHS and the IHS logo are trademarks of IHS.
IHS Markit (Nasdaq: INFO) is a world leader in critical information, analytics, and solutions for the major industries and markets that drive economies worldwide. The company delivers next-generation information, analytics, and solutions to customers in business, fi nance, and government, improving their operational e� ciency and providing deep insights that lead to well-informed, confi dent decisions. IHS Markit has more than 50,000 key business and government customers, including 85% of the Fortune Global 500 and the world’s leading fi nancial institutions. Headquartered in London, IHS Markit is committed to sustainable, profi table growth.
IHS Markit is a registered trademark of IHS Markit Ltd. All other company and product names may be trademarks of their respective owners © 2017 IHS Markit Ltd. All rights reserved.
For more information
Brendan O’NeilManaging director, IHS [email protected]
For press information
Katherine Smith Manager media relations, IHS [email protected]
IHS Markit (USA) Inc.1150 Connecticut Avenue NW, Suite 401Washington, DC 20036

© 2017 IHS 3 February 2017
IHS Economics | The Market Size and Economic Contributions of the Off -Highway Equipment Industry
Contents
IHS™ ECONOMICS
COPYRIGHT NOTICE AND DISCLAIMER © 2017 IHS. For internal use of IHS clients only. No portion of this report may be reproduced, reused, or otherwise distributed in any form without prior written consent, with the exception of any internal client distribution as may be permitted in the license agreement between client and IHS. Content reproduced or redistributed with IHS permission must display IHS legal notices and attributions of authorship. The information contained herein is from sources considered reliable, but its accuracy and completeness are not warranted, nor are the opinions and analyses that are based upon it, and to the extent permitted by law, IHS shall not be liable for any errors or omissions or any loss, damage, or expense incurred by reliance on information or any statement contained herein. In particular, please note that no representation or warranty is given as to the achievement or reasonableness of, and no reliance should be placed on, any projections, forecasts, estimates, or assumptions, and, due to various risks and uncertainties, actual events and results may diff er materially from forecasts and statements of belief noted herein. This report is not to be construed as legal or fi nancial advice, and use of or reliance on any information in this publication is entirely at client’s own risk. IHS and the IHS logo are trademarks of IHS.
ContentsExecutive summary and key fi ndings 5
State of the industry 9AEM industry outlook and trends 10
Approach and methodology 21Defi ning the industry 22Extending the segmentation 23Measuring the contribution of the equipment manufacturing industry 23
Economic impact analysis results 27Impact results: Employment 30Sales 31Contribution to GDP 33Labor income 33Taxes 34
Appendix 35Appendix I: Segment, state, and provincial economic impact result tables 36Appendix II: BMI and IMPLAN model 42

February 2017 4 © 2017 IHS
IHS Economics | The Market Size and Economic Contributions of the Off -Highway Equipment Industry
Project directors• Brendan O’Neil, Managing director, Consulting, Economics and Country Risk
• Scott Hazelton, Managing director, Consulting, Economics and Country Risk
Project team• Shane Norton, Director, Consulting, Economics and Country Risk
• Peter Walton, Analyst, Consulting, Economics and Country Risk
AcknowledgementsWe would like to thank the subject matter experts, technical experts, industry experts, and analysts who contributed either directly to this study or indirectly through the study on which the underlying market sizing estimates were based.

© 2017 IHS 5 February 2017
IHS Economics | The Market Size and Economic Contributions of the Off -Highway Equipment Industry
1.0
Executive summary and key fi ndings

February 2017 6 © 2017 IHS
IHS Economics | The Market Size and Economic Contributions of the Off -Highway Equipment Industry
The North American o� highway equipment industry is a signifi cant component of the nation’s manufacturing base and a leader in providing innovative solutions to the global construction, agriculture, mining and forestry sectors. The Association of Equipment Manufacturers (AEM) commissioned IHS to quantify the economic contributions of the North American o� -highway equipment and ancillary products1 industry to the economies of the United States and Canada, and provide enhanced detailed understanding of the industry’s extensive supply chain by economic sector at the national and state/provincial level. The key fi ndings of this study measure the economic contribution the industry makes in terms of jobs supported, value added (contribution to GDP), sales (output), labor income, and taxes within the broader economy.
For 2016, the IHS estimates there was $31.3 trillion in total sales activity in the United States across all sectors; of that total, IHS estimates that $416.2 billion in sales was supported by the o� -highway equipment and ancillary products industry’s economic activity. This occurred through approximately $266.5 billion in direct industry sales activity, such as the sales of equipment like skid steers and combines, which generated additional economic activity as dollars fl owed through the equipment manufacturing supply chain. This multiplier e� ect drove an additional $94.7 billion in indirect sales in the supply chain for goods and services such as steel, electronics and banking services. Further, equipment companies and their suppliers hired and compensated employees, who, in turn, used their incomes to generate additional economic activity through the purchase of consumer goods and services. These third-order or ‘induced’ e� ects amount to $55.0 billion in 2016. The following graphic depicts this fl ow of economic e� ects.
In 2016, the off-highway and ancillary products industry generated $267billion in output to produce end-use goods and services
Meeting this demand generated an
additional $95 billion upstreamsupply chain spending
Supplychain
Employees spent some income in the local economy, resulting in $55 billion of induced sales activity
Employee spending
Employee spending
Flow of US economic impacts from direct spending through income e� ect
Source: IHS © 2017 IHS
The economic activity generated through the sales of o� -highway equipment and ancillary products triggers additional economic benefi ts—workers must be hired and retained to fi ll orders for goods and services, companies reap additional profi ts and make larger contributions to GDP, and companies and their employees must pay taxes. Taking those variables into account, IHS estimates that in 2016, the o� -highway equipment and ancillary products industry directly employed nearly 500,000 people between the United States and Canada in the production of o� -highway equipment.
1 Includes product accessories, tooling, and other supporting components

© 2017 IHS 7 February 2017
IHS Economics | The Market Size and Economic Contributions of the Off -Highway Equipment Industry
The equipment manufacturing industry in the United States • The total direct, indirect and induced employment contribution of the US o� -highway equipment and ancillary
products industry in 2016 totaled 1.3 million workers engaged in the design, production and sale of goods and services and includes the industry’s supporting supply chain and induced local employment.
• Jobs supported by the o� -highway equipment and ancillary products industry represent nearly 1% of the US total employment base.
• Of the 424,000 US employees directly involved with fi rms engaged in the production of o� -highway equipment, 163,000 jobs were tied to the construction equipment industry, 114,000 jobs were tied to the agriculture equipment industry, and the remaining 148,000 jobs were tied to the mining equipment industry.
• Direct o� -highway equipment and ancillary products industry jobs combined with those supported in the industry’s supply chain represented more than 7% of the US manufacturing employment base.
• For every $1 million in direct industry sales, 2.7 jobs are supported within the industry’s supply chain in the United States.
• The o� -highway equipment and ancillary products industry generated $158.8 billion in economic value, which represented 0.9% of 2016 total nominal GDP in the United States.
• The output (industry sales activity) driven by the o� -highway equipment and ancillary products industry directly and through the supply chain represented 5.1% of manufacturing output in the United States.
• Labor income supported by the o� -highway equipment and ancillary products industry represented about 1.3% of US total labor income.
• The average US labor income per job within the o� -highway equipment and ancillary products industry (both producers of end-use goods and services as well as the supply chain) amounted to just over $78,000—or approximately 58% above the national average—refl ecting the highly skilled nature of the workforce.
• Of the total 1.3 million jobs linked to the o� -highway equipment industry, the manufacturing sector is the largest total employment contributor at 39 percent, followed by professional and business services at 23 percent and retail trade at 13 percent.
• Texas leads all states with 16% of total US industry-related employment. Illinois, Wisconsin, and Ohio follow with 9%, 8%, and 6% shares, respectively.
The equipment manufacturing industry in CanadaThe industry also makes a signifi cant economic contribution in Canada, where it supports about 149,000 total jobs—more than 64,000 people directly employed by industries involved in the production of o� -highway equipment and another 84,000 jobs associated with the industry’s supply chain and the income e� ects of the direct and indirect employment. In total, nearly $34 billion in sales activity is generated directly or supported by the industry, which adds nearly $15 billion to Canada’s GDP.2
• The o� -highway equipment and ancillary products industry supports 149,000 total employees in Canada—including 64,000 direct jobs involved in fi rms producing o� -highway equipment.
• Ontario has the largest concentration of direct employment in the manufacturing of o� -highway equipment, with just over 25,000 jobs within the province. Alberta and Quebec are home to the bulk of the remaining direct employment, with 15,000 and 12,000 direct employees, respectively.
2 All Canadian impact results are shown in US dollars

February 2017 8 © 2017 IHS
IHS Economics | The Market Size and Economic Contributions of the Off -Highway Equipment Industry
• The equipment manufacturing industry generates $34 billion in total sales activity in Canada, with more than $15.5 billion of that coming from direct industry activity.
• The direct economic contribution driven by the o� -highway equipment and ancillary products industry represented about 4.1% of Canada’s total share of the manufacturing component of Canada’s GDP.
• The 149,000 total jobs supported by the industry generate $9.7 billion in labor income, with an average annual wage for direct industry employees of $73,500.
• The o� -highway equipment and ancillary products industry generated $14.9 billion in economic value in Canada, which represented 1% of 2016 total nominal GDP.
The North American o� -highway equipment and ancillary products industry is a broad complex of fi rms performing a variety of functions, including the manufacturing of fi nished and semifi nished goods, raw materials, components, systems, and platforms. For the purposes of this analysis, the equipment industry is defi ned by a set of relevant sectors categorized under the North American Industry Classifi cation System (NAICS) that which includes fi rms that produce goods and services for end use by o� -highway equipment and ancillary products industry customers, whereas other subsectors are predominately composed of suppliers that support production.

© 2017 IHS 9 February 2017
IHS Economics | The Market Size and Economic Contributions of the Off -Highway Equipment Industry
2.0
State of the industry

February 2017 10 © 2017 IHS
IHS Economics | The Market Size and Economic Contributions of the Off -Highway Equipment Industry
AEM industry outlook and trends
OverviewThe equipment manufacturing industry is ubiquitous in the US economy. Every day, across the country, men and women make use of an array of equipment to help build roads, bridges, and hospitals; produce energy to fuel cars and heat homes; and grow and harvest crops to feed the world. This industry’s diversity refl ects the extent to which machinery powers our modern economy.
The multitude of sectors that depend on equipment means there are more requirements than ever that shape demand for types of machinery and a� ect how manufacturers in response adjust production and innovate new technology to meet the economy’s needs.
As a result, the equipment manufacturing industry has most recently undergone signifi cant transition. The industry’s overall performance in recent years has struggled owing to declining commodity prices (for agriculture, oil, gas, and minerals), inconsistent government support for infrastructure investment, and declining exports attributable in part to the US dollar’s strength during a time of relatively weak economic performance in key export markets.
There are, however, good reasons for a positive outlook across this important industry whose mission-critical goods account for about 1% of total US GDP yet enable so much more economic activity in the way of new construction, crop production and energy and mineral extraction.
The 2016 US presidential and congressional election prompted a noticeable uptick in consumer and business sentiment, and stock-market indices have surged. Many businesses, including equipment manufacturers, are optimistic that the Trump administration and a Republican-controlled Congress will cut taxes, roll back regulations, and make it easier to repatriate profi ts. President Donald Trump’s pledge to make a major investment in US infrastructure has notably spurred positive business sentiment, especially among manufacturers of construction equipment.
IHS expects overall US real GDP growth to improve from 1.6% in 2016 to 2.3% in 2017. This outlook refl ects an end to the recent surplus inventory correction as well as a rebound in energy-sector investment. It will take longer for policy-related changes to impact real GDP growth to become apparent. This forecast makes the core assumption that elected leaders will reduce the statutory corporate income tax rate from 35% to 20%, partially o� set by a scaling back of tax credits. Even still, the e� ects of these tax cuts and the e� ects of any deregulation may not become apparent until late 2017 or early 2018.
IHS projects real GDP will improve to 2.6% in 2018. Consumer spending growth should pick up in 2017 and 2018, supported by gains in consumer confi dence, employment, real disposable income, and household net worth.
Gradall employs 400 people in an entirely unionized workforce in a single facility in Ohio, where it manufactures Gradall excavators and Vacall vacuum and jetting machines.
All its manufacturing is done domestically, and more than 80% of its sales stay within North America.
Its supply chain has diversifi ed globally over the years, but some purchases remain local, such as steel.
(In this industry) “You live and die by new production and new developments” – Mike Haberman, president
“Hiring has become a challenge. Skill sets are drastically di� erent with respect to technology. If trade schools aren’t staying current with technology, you have a really hard time hiring good people.”
“Logistics are an advantage for domestic manufacturing. When you’re talking logistics, you need to talk infrastructure. As our infrastructure ages, that’s going to get more di� cult. The entire economy is based on free movement.”
Workforce: “We as a country need to stay ahead of the curve on workforce. If we want manufacturing to stay and thrive in this country, we need to stay up-to-date on workforce and development.”

© 2017 IHS 11 February 2017
IHS Economics | The Market Size and Economic Contributions of the Off -Highway Equipment Industry
This forecast is based on an analysis of many of those variables that will drive performance in the equipment manufacturing industry, including construction and energy markets, farm income, interest and exchange rates, and public policies—like tax reform, infrastructure investment, and changes to global trading relationships—that shape all of these issues.
The bottom line for the equipment manufacturing industry is that improving business fundamentals combined with expected policy actions will allow real equipment spending to pick up in the fourth quarter of 2017. We expect spending on equipment will extend into 2018 and beyond, based on many of the key factors outlined in the following sections.
Construction marketsConstruction equipment manufacturing accounts for about 38% of the equipment manufacturing industry, as defi ned by IHS for the purposes of this report. Manufacturers of construction equipment directly employ 163,000 people in the United States and contributed nearly $31 billion to US GDP. This sector’s health is shaped by many variables, most signifi cantly public and private investment in home, commercial, and industrial real estate construction; mines and wells; utilities; institutional spending; and traditional infrastructure projects.
We expect a major infrastructure initiative by the Trump administration, combined with continued growth in residential and nonresidential structures, would stimulate additional demand for construction equipment in 2018 and 2019. The resurgence could be accelerated if Congress enacts any tax reform package, especially if it includes favorable bonus depreciation provisions. As a result, we have a cautiously optimistic forecast for construction equipment manufacturing that has even further upside potential.
HousingSustained growth in employment and real incomes has supported growing demand for housing. Although mortgage rates currently remain low, we expect mortgage interest rates to rise as the US Federal Reserve steadily increases its benchmark rate. However, housing supply is constrained by shortages of labor and available lots. The mismatch between demand and supply has contributed to rising home prices, and the combination of higher prices and higher fi nancing costs is reducing a� ordability and slowing the residential recovery.
As a result, the US home ownership rate has fallen to a 51-year low as many new households choose to rent rather than own. Lean inventories of unsold homes, low rental vacancy rates, and rising prices will encourage builders to increase construction activity. However, the combination of lower a� ordability and high college debt loads among younger households suggests multifamily units will account for one-third of housing starts during the forecast. This would represent a signifi cantly higher share for new housing construction than we have observed since 2000, but it also marks a return to the typical pattern of the US housing industry prior to the residential bubble.
Kubota manufactures machinery and equipment, including a full line of tractors, and is headquartered in Texas, where it moved from California in response to lower tax rates and the availability of skilled labor. Kubota also has a signifi cant employment impact through its 1,100 dealerships scattered across the nation. Its primary production facilities are in Gainesville and Je� erson, Georgia. Its Lincolnshire, Illinois plant makes OEM engines for all of its product lines.
Skilled labor shortages are a key concern. “We have an internship program, where it allows engineers to work over the summer, and it offers them jobs at the conclusion of the program.” – Todd Stucke, Vice President. Finally, Kubota also opens its doors to technical college classes, allowing them on the factory f loor to see engineering at work within its facility.
One way Kubota gives back to the community is through a program that supports veterans transitioning to farming by giving away tractors each year through an a� liated charity.

February 2017 12 © 2017 IHS
IHS Economics | The Market Size and Economic Contributions of the Off -Highway Equipment Industry
Commercial and industrialBusiness spending on structures depends on expected economic growth compared with existing capacity, corporate profi ts, and the cost of capital. E� ciency gains such as increased worker productivity or energy savings have also become increasingly important to businesses as they consider their need for space. Technological advances can also create the need for new or substantially renovated space.
US employment recovered its pre-recession level more than a year ago, and additional employment gains have driven construction growth. This has been particularly true within the commercial segment, and especially regarding o� ces and hotels within that segment. Hotel construction will subside signifi cantly during the forecast, but o� ce construction should continue at reduced rates. Retail construction has been a drag on the commercial sector as electronic commerce has taken share from big-box stores and shopping malls.
By contrast, construction of manufacturing facilities will slow. This segment had seen signifi cant growth as large downstream petroleum facilities were built to produce ethanol, ammonia, and other byproducts of the shale revolution. Given rising employment costs, there has also been signifi cant investment in new equipment and electronics on shop fl oors, which registers as construction spending because of the renovation often required. Still, a slowing construction cycle for large projects, combined with increased international production as a result of the strong US dollar, results in a forecast for some contraction in the industrial construction segment. Tax reform may rejuvenate investment, although its e� ects are too premature to forecast.
Mines and wellsOne of the construction segments that buoyed the equipment sector post-Great Recession and is set to enjoy the strongest turnaround since 2014 is mines and wells. The recovery in energy prices in 2016 was welcome news for oil and gas drilling. As importantly, the downturn in energy prices eliminated weaker players, consolidated supply chains, and drove more e� cient drilling techniques. As a result, the US fracking industry can operate profi tably at lower oil prices. Taken together, we expect a dramatic improvement in activity in 2017 with continued growth to follow. A cautionary note is that this presents a base e� ect—a sharp recovery from a very low level. With a large, idle base of relatively new equipment, there will be a lag before new drilling activity translates into demand for new equipment.
Institutional spendingInstitutional spending is poised for moderate growth. Increased tax revenues at the state and local level will allow construction of previously deferred projects. However, uncertainty about the A� ordable Care Act will weigh against signifi cant gains in healthcare construction. We are likely to see demand for healthcare o� ces around new residential developments and continued growth of specialty care facilities at the expense of large-scale hospitals.
Similarly, weak rates of household formation of recent years, which as a result slows growth in school-age children, will restrain spending on construction of educational facilities.
Infrastructure investmentOur forecast anticipates the passage of some kind of infrastructure legislation under the Trump administration, although the scale and fi nancing of such legislation is uncertain. Trump has called for as much as $1 trillion in infrastructure investment, which could be paid for by methods ranging from bond guarantees to repatriated corporate earnings to general government revenue. This report projects a package of $250 billion over ten years, with a roughly level increase. Although the timing may not be exactly linear, this funding commitment would pump an additional $25 billion into construction spending per year, starting in 2018. This assumption would result in a discrete jump in growth in the construction market in 2018, when the act takes e� ect, followed by more moderate growth at the higher level of spending. Whereas the following table highlights road construction, we would expect the e� ects to include airports, seaports, and other public infrastructure.

© 2017 IHS 13 February 2017
IHS Economics | The Market Size and Economic Contributions of the Off -Highway Equipment Industry
Construction spending growth for key structure types (constant 2009 US dollars)2014 2015 2016 2017 2018 2019 2020
Residential 3.4 11.8 4.7 2.7 3.1 2.5 2.3
Commercial 19.0 10.1 18.0 6.6 5.7 4.6 4.6
Industrial 12.9 30.8 -4.3 -2.8 -4.3 -6.8 1.2
Mines and wells 5.5 -31.2 -43.9 42.4 12.8 6.9 6.6
Healthcare -7.1 10.2 4.7 3.7 2.3 1.9 1.9
Utilities 14.5 -10.6 1.9 -1.9 -0.8 -2.2 -1.9
Highways and streets 1.8 0.6 1.4 1.9 6.0 0.4 -0.2
Total 4.7 2.7 1.4 4.2 3.2 2.2 2.0
Source: IHS © 2017 IHS
Agriculture marketsFarm equipment manufacturing accounts for approximately 27% of the equipment manufacturing industry, as defi ned by IHS for the purposes of this report. Manufacturers of agriculture-related equipment directly employed 114,000 people in the United States in 2016 and contributed nearly $21 billion to US GDP. A variety of interrelated variables shape this sector’s health, most signifi cantly the production and prices of major agricultural commodities, farm incomes, ethanol production, and the current supply of idle equipment that can still be put into service.
Commodity crop productionThe US Department of Agriculture (USDA) updated its 2016/17 levels for plantings and yields for the 2016/17 crops in its February Crop Production Report. All wheat area harvest is seen at 43.9 million acres, with corn at 86.7 million acres, sorghum at 6.2 million acres, soybeans at 82.7 million acres, cotton at 9.5 million acres, and all rice at 3.1 million acres. Given the very conducive planting season, total principal-crop planted area reached 323.1 million acres in 2016/17, up from 319.4 million acres the previous season. The USDA also revised its projected yields to project new record highs for soybeans and sorghum; projections were reduced for corn, rice, and cotton; and US wheat yields were left unchanged. The USDA could further raise soybean yield levels in subsequent production reports since harvest reports imply a very good crop. Corn crops face bigger questions owing to uneven yield reports from di� erent parts of the United States; nonetheless, a majority of the Corn Belt is on track to witness a large crop, and from a balance-sheet perspective, even if yields are reduced slightly, residual-use reduction will help soften the loss of ending stocks. For the remaining crops being harvested—soybeans, cotton, and sorghum—there appears to be no major concern at this time for harvests moving outside of their respective fi ve-year averages.
For the upcoming 2017/18 planting season, corn plantings are forecast to fall to 89.2 million acres, which is contingent on prevented plantings moving back closer to average and would assume average delays to plantings that did not occur in 2016/17. US soybean plantings are estimated at a new record high of 86.4 million acres, as producers capitalize on stronger soybean price ratios compared with other crops, as well as some level of carryover excitement, given the 2016/17 yield level. Sorghum plantings are seen rising minimally to 7 million acres but are at risk of coming in lower if prices are unable to rise back to their more traditional price ratio. A majority of next season’s growth is centered in Texas, which is always at a greater risk for weather di� culties.
We continue to expect yields to move back toward their respective trends, and with another record year in the books, the risks have again increased for a below-trend-line yield event for major commodities, adding to the upward price risk for the end of 2016/17. In 2017/18, US corn yields are forecast at 167.6 bushels per acre, with sorghum at 67.5 bushels per acre, all wheat at 47.1 bushels per acre, all rice at 7,583 pounds per acre, cotton at 831 pounds per acre, and soybeans at 45.4 bushels per acre.

February 2017 14 © 2017 IHS
IHS Economics | The Market Size and Economic Contributions of the Off -Highway Equipment Industry
Ethanol productionUS ethanol production is expected to reach almost 15.1 billion gallons in the 2016/17 marketing year, with conventional, corn-based ethanol representing almost 98% of that total. US ethanol production is not expected to change dramatically during the next two marketing years, as exports and domestic demand remain fl at. The US will continue to lead as a net exporter of ethanol in the immediate future, although this could begin to taper after 2020. The blend wall for ethanol in gasoline sold in the United States is expected to remain at 10% in the short term and is projected to gradually rise, eventually reaching E-13. US gasoline demand is expected to be fl at during the 2016/17 marketing year and may begin to trend lower through 2025 before stabilizing. The US-implied retail ethanol price is forecast at $2.22 per gallon in 2016/17, $0.09 per gallon higher than in 2015/16.
Commodity prices and farm incomeAgricultural commodity prices are expected to rise only slightly in 2017, but energy prices will climb. The result is that agricultural cash receipts and farm incomes are both likely to be down in 2017, with only small increases expected in 2018. Demand for new agricultural equipment is a function of farm income, and because of this, we expect soft domestic demand for farm equipment. Weak domestic demand will be compounded by the strong US dollar, which will diminish manufacturers’ ability to export products to foreign buyers.
IHS projects net farm income at $64.1 billion in 2016 and $63.6 billion in 2017. The cattle price outlook has become a bit more bearish as both live cattle and feeders collapsed to lows not seen since 2010 in their respective futures markets. Texas/Oklahoma cash cattle prices traded at $98 per hundredweight in the middle of October, prices not reached since October 2010. Livestock markets have followed in crops’ footsteps, and like most bear markets, a little faster than anticipated. Cattle prices bounced back above $100 per hundredweight at the end of October, and if strength builds in futures, prices could support a short-term rally.
We expect net farm income will begin to slowly trend higher past 2018, as commodity prices move above recent lows. Net farm income is fi nally forecast to push back above $80 billion after 2021. All livestock cash receipts are forecast at $161.3 billion in 2016 and $169.5 billion in 2017. All crop cash receipts are expected to reach $184.1 billion in 2016, down from $189.4 billion in 2015, and fall slightly to $182.8 billion in 2017. The larger US soybean crop and stronger prices have more than o� set losses in food grain cash receipts in 2016 and 2017. All cash receipts are forecast to jump back higher in 2018 as commodity prices bottom out around the 2017/18 marketing year. Livestock cash receipts will fail to eclipse crop cash receipts until after 2023.
Total expenses have been moving lower and are expected to be $338.7 billion in 2016 and $336.7 billion in 2017. One of the key drivers for lower expenses is cheaper livestock costs as a result of weaker prices. Costs associated with property taxes have moved higher throughout the forecast period, which moderately offset the savings associated with lower fuel and oil prices. Overall, major expense categories such as feed, fertilizer, and oil remain under pressure through 2018 as a result of weaker commodity prices. Following this slump and
0
50
100
150
200
250
300
350
400
450
2007 2008 2009 2010 2011 2012 2013 2014 2015 2016 2017 2018 2019
Cash receipts Net farm income
US agricultural recipts improve, but income remains flat in 2017
© 2017 IHS
Bill
ions
of U
S do
llars
Source: IHS
© 2017 IHS 15 February 2017
IHS Economics | The Market Size and Economic Contributions of the Off -Highway Equipment Industry
a bottoming out of commodity prices, which also includes oils and fertilizers, total expenses will begin to trend higher.
There are anecdotal indicators that the several years of very low crop prices and the downward correction in farm income are beginning to take a toll on farmers. The recent downturn has depleted some farmers’ cash reserves and they are forced to borrow to get them through any rough spot in their cash fl ow. Land prices are also starting to correct. Although the fi nancial di� culties facing farmers are not as grave as during the last crisis, owing to lower interest rates and restrained infl ation, it is worth monitoring as farm incomes remain stalled.
Demand for farm equipmentDemand for agricultural equipment is likely to hit bottom soon, a slump compounded by overinvestment in new equipment prior to the recent downturn. Farmers will begin to make purchases they had deferred for several years.
Combines are likely to be the fi rst area to return to their normal replacement cycle. Combines historically have the quickest turn-over interval for the very large commercial farms that represent the core – new combine market. These farmers replace their units every 1 to 3 years because they have a very low tolerance for down-time. Delays at harvest can be very costly, crop condition, yields, and future fi eld work all su� er when you can’t complete the harvest. The severe downturn in the agricultural equipment market caused even the most committed farmers to delay their replacement cycle, their management process will not allow them to push o� replacements much or any further. The modest turnaround will be limited in part by challenges posed by secondary markets, As the price of trade-ins fall (used combines are selling for $300,000 or more), the cost to replace widens considerably. Farmers that buy good/excellent used combines keep them longer than the fi rst owner (the fi rst owner replaces/rotates combines within one to three years).
For tractors, the bigger they were, the harder they fell—and they continue to fall. There are technologies farmers want to bring online—plug-and-play prescription farming, seeding, fertilizer, auto steering/navigation, etc. Larger farms have equipment with these features, but the next level or two down the size class chain of farms cannot yet a� ord to buy into these more sophisticated technologies. This is helping prop up the good used tractor market, but it is hard to counter low commodity prices.
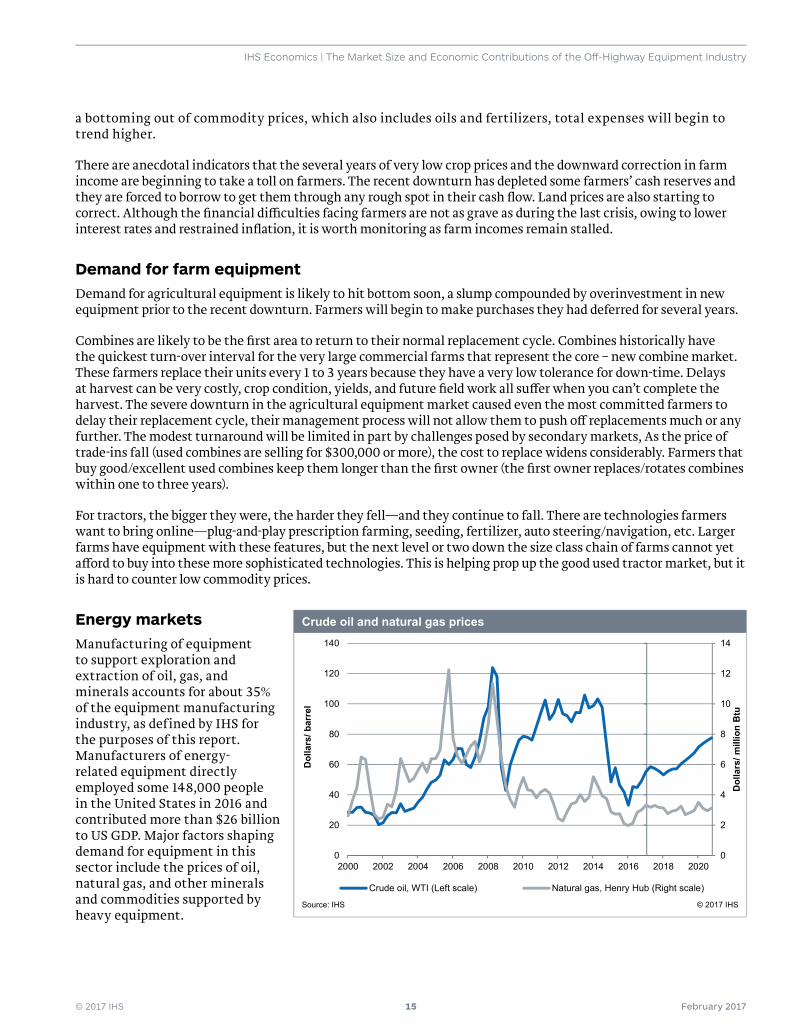
Energy marketsManufacturing of equipment to support exploration and extraction of oil, gas, and minerals accounts for about 35% of the equipment manufacturing industry, as defined by IHS for the purposes of this report. Manufacturers of energy-related equipment directly employed some 148,000 people in the United States in 2016 and contributed more than $26 billion to US GDP. Major factors shaping demand for equipment in this sector include the prices of oil, natural gas, and other minerals and commodities supported by heavy equipment.
0
2
4
6
8
10
12
14
0
20
40
60
80
100
120
140
2000 2002 2004 2006 2008 2010 2012 2014 2016 2018 2020
Dol
lars
/ mill
ion
Btu
Crude oil, WTI (Left scale) Natural gas, Henry Hub (Right scale)
Crude oil and natural gas prices
© 2017 IHS
Dol
lars
/ bar
rel
Source: IHS

February 2017 16 © 2017 IHS
IHS Economics | The Market Size and Economic Contributions of the Off -Highway Equipment Industry
Oil and gasThe oil and gas exploration and extraction industries have been a drag on equipment demand since late 2014, owing to declining prices. However, market fundamentals are improving. OPEC agreed to cut production by 1.2 million barrels per day (MMb/d) in the fi rst six months of 2017, and non-OPEC countries plan further cuts of more than 0.5 MMb/d. Although actual cuts will likely be smaller, they will be su� cient to drain excess supply and maintain prices above $50 per barrel. Indeed, with global spare production capacity at only 2 MMb/d, the risk is that any sustained supply disruption could lead to an oil-price spike. Importantly, US production will begin to recover in early 2017, led by increases in the Permian Basin. The Trump administration has already put major pipeline projects back on track; reduced regulation, fewer hurdles to further pipeline construction, and a possible opening of public lands to exploration and production would lead to additional long-run oil and gas supplies.
We expect the natural gas market to tighten throughout 2017 as growth in demand outpaces growth in production. A recovery in oil production will lead to associated gas supply increases. Combined with Appalachia pipeline expansions coming online in late 2017, this will bring the market back into balance in 2018. We do not expect natural gas prices to decline, though, because industrial gas demand will increase as new capacity at ammonia, methanol, and ethylene facilities come online. Rising electricity consumption, exports to Mexico, and liquefi ed natural gas (LNG) exports to other countries could spur further demand growth. The North American gas resource base is expanding, and costs are declining, owing to improved resource recovery and new discoveries.
MiningWith oil and natural gas prices expected to rise further during the forecast, we expect growth in spending on mining structures. The Baker Hughes rig count has rebounded from a 71-year low of 404 rigs in May 2016 to 658 rigs. The biggest challenge for manufacturers of mining equipment is that a large and relatively new inventory of equipment purchased before the 2014 crash has sat idle and can be put into service as commodity prices rebound. Thus, we expect increased demand in 2017 to largely absorb existing equipment, postponing any need for new equipment until 2018. However, we expect demand for new equipment to be strong when it does fi nally return, and we anticipate double-digit increases in mining equipment production in 2018, 2019, and potentially even 2020.
Interest and exchange rates and global tradeInterest rates are another key variable a� ecting the performance of the equipment manufacturing industry. These rates, in turn, a� ect exchange rates and global demand for equipment. These factors, combined with potential changes to trading rules sought by the Trump administration, are another signifi cant variable in forecasting the health of the equipment manufacturing industry.
Interest ratesImproving US economic growth increases the likelihood the US Federal Reserve (Fed) will further raise interest rates. The Fed raised rates 25 basis points in December and indicated it expects three more 25-basis-point hikes in 2017. We expect the Fed will raise interest rates 75 basis points
0.8
0.9
1.0
1.1
1.2
1.3
1.4
1.5
1.6
1980 1982 1985 1988 1991 1993 1996 1999 2002 2004 2007 2010 2013 2015 2018
Major trading partners Other important trading partners
US dollar exchange rate
© 2017 IHS
Inde
x 20
09 =
1
Source: IHS

© 2017 IHS 17 February 2017
IHS Economics | The Market Size and Economic Contributions of the Off -Highway Equipment Industry
annually during the next three years, bringing the policy interest rate to 3.0% by 2020. Increasing interest rates will eventually slow investment growth.
Exchange ratesEntering 2017, the US dollar’s strong position relative to other global currencies represents a headwind for manufacturers seeking to sell products overseas. The infl ation-adjusted, trade-weighted value of the dollar for the broad index of trading partners is expected to increase 3.2% between fourth-quarter 2016 and fourth-quarter 2017. We assume the dollar will reach its peak value in the fourth quarter of 2017, 5.5% above the 2015 average. We anticipate this steady increase in the dollar’s trading value versus other major currencies will give way to a steady decline from 2017 through the end of the forecast period, leading to a 14.8% decrease between 2017 and 2026.
Global tradeApproximately 30% of US agricultural equipment production is intended for export, and nearly 30% of US production of construction equipment is also for export. Slow international growth combined with uncertainty about trading rules under the Trump administration could act as a drag on the equipment manufacturing industry’s overall performance.
Although the United States has enjoyed improving growth, much of the world will continue to experience economic challenges. Economic growth in the Eurozone is projected to slow from 1.7% in 2016 to 1.4% in 2017, refl ecting increased political instability (France, Germany, and the Netherlands) and banking problems in key countries (Italy). Growth in the United Kingdom will slow as uncertainty surrounding the Brexit process leads to scaled-back investment and employment plans. Meanwhile, China’s economic growth will slow further because of imbalances in credit and housing and excess capacity in its industrial sector. The good news is that recessions in Russia and Brazil will end in 2017, although there is little chance of strong recoveries.
Any steps the Trump administration might take to revisit or exit existing trade agreements could further complicate the challenging economic environment outside the United States. It is di� cult to precisely forecast how the Trump administration might rewrite existing trading rules, but any steps that make it more di� cult for manufacturers to export their products could hinder growth in the industry.
Workforce developmentOne of the most signifi cant long-term issues facing the equipment manufacturing industry involves the availability of skilled labor to fi ll available positions in the manufacturing workforce. We expect manufacturers’ demand for skilled labor will continue to grow as the supply of qualifi ed labor continues to decline.
The issue is partly demographic—tradesmen tend to be older, on balance. The American education system has prioritized postsecondary education in recent decades at the expense of vocational training. As older skilled laborers leave the workforce, there are fewer skilled workers available to take their place. Additional economic factors have exacerbated this trend. The Great Recession prompted many skilled laborers to leave the construction trades for retirement or other occupations. The result is a shortage of qualifi ed workers as the construction industry rebounds. Indeed, a 2015 Associated General Contractors (AGC) national survey found that 86% of contractors had di� culty fi nding qualifi ed individuals for key construction skills.
Industrial production growth in key machinery categories2014 2015 2016 2017 2018 2019 2020
Construction machinery 5.4 2.3 -4.2 -12.6 4.1 3.6 2.4
Agricultural machinery -2.8 -10.5 -4.6 -8.7 1.1 3.9 3.4
Mining machinery 1.1 -13.1 -24.3 -7.9 16.0 18.3 10.0
Industrial machinery -1.3 8.7 2.5 7.3 5.3 5.1 2.5
Engine, turbine, power transmission 0.8 0.8 -12.7 1.2 3.9 3.7 2.4
Source: IHS © 2017 IHS

February 2017 18 © 2017 IHS
IHS Economics | The Market Size and Economic Contributions of the Off -Highway Equipment Industry
Equipment manufacturers face similar workforce challenges. A 2015 study by Deloitte and the Manufacturing Institute indicated 84% of manufacturing executives believed there was a skill shortage in their industry. The same study said that the US economy could generate the need for nearly 3.5 million skilled labor jobs in the next decade, but that 2.0 million of those jobs would go unfi lled because of a gap in skills and qualifi cation. As a result, 60% of skilled production workforce openings are vacant owing to skill sets. This a� ects not only production, but also the ability to implement new technologies.
It may take a comprehensive public policy strategy to address this persistent shortage in skilled labor. One key element of this strategy would reinforce the manufacturing base in the United States through a suite of tax reforms, trade agreements, regulatory relief, and education and workforce development policies.
Whereas much of the policy discussion regarding manufacturing has taken place at a national level, the most e� ective programs to address skilled labor and vocational training often occur at the state and local level. Many manufacturers are not waiting for government action and have created their own internal training and development programs. Many manufacturers also team with local secondary and vocational schools, as well as community colleges, to o� er internships, career days, and even specifi c training and certifi cation programs to encourage a future career with the company.
Technological developmentsCreative destruction can be a healthy, even if disruptive, force in any industry, and technology is a principal driver for change for both the equipment manufacturing industry as well as the customer industries this industry services.
Emerging technologies, for instance, are making construction projects more e� cient than ever. Building information modeling (BIM) changed how buildings are planned, but innovative technologies—big data, machine learning, drones, robotics, and 3-D printing will change the way they are built. Large-scale construction takes substantial investment and takes time to come to fruition. To the degree that new technologies can reduce the time and investment associated with large-scale construction projects, they will help investors, taxpayers and other benefi ciaries of new infrastructure realize their returns more quickly.
Likewise, innovative technologies integrated into farm equipment have helped increase agricultural productivity while making the industry more sustainable than ever. The proliferation of rural broadband technology helps sophisticated farm machinery communicate seamlessly with other farm technologies, and innovations in machinery itself, like precision agriculture technology, have revolutionized the way farmers, the customers of farm equipment, do their work.
Drones are also increasingly used across end-use sectors that utilize o� -highway equipment. Drones may be used to complete building inspections as construction is ongoing, for instance, or to inspect the health of a
Grote is a lighting and safety systems manufacturer based in Indiana. Its 1,200 employees are primarily within North America, with small facilities in Germany and China.
Its business is a 50-50 split between OEM and aftermarket. Within o� -highway, it leans toward OEM 80-20. LED lighting is its specialty.
“The number of regulations are high, but enforcement must also be consistent.” – John Grote, vice president, sales and marketing
“Infrastructure investment is critical. We need better access to the interstate, as roads support industry. Improved access to our own markets will allow us to compete with anyone coming from anywhere in the world. Infrastructure spending focused on the ports—that spending benefi ts importers. Keeping our roads well-maintained and easily used will have a big impact.”
Data ownership and monetization from telematics and the move toward higher voltage in the United States and Europe are key trends Grote is watching.
Grote is working with local vocation school students to identify and train students who can then transition to working in its facility.

© 2017 IHS 19 February 2017
IHS Economics | The Market Size and Economic Contributions of the Off -Highway Equipment Industry
crop by proxy. Manual inspections in both industries are time-consuming and even dangerous. The use of drones allows coverage of more details in less time, and they can record and send data in real time. Combined with big data, inspection information could be rapidly combined with specifi cations to help quickly develop plans to address any shortcomings. As Internet of Things (IOT) technology materializes, machine-to-machine (M2M) connectivity portends a new era for sectors deploying o� -highway equipment with more data informing equipment applications and new e� ciencies in the operation of ‘smart’ equipment to drive productivity gains.
The advent of 3-D printing is already revolutionizing manufacturing, as well. Manufacturers are increasingly experimenting with how they may use 3-D printing to produce specialty parts for a piece of equipment; some manufacturers have even printed entire functioning pieces of machinery. There are additional applications for the construction industry; 3-D printing could allow contractors to “print” concrete structures at a high speed, which would avoid transportation of large, bulky items, especially to a congested urban worksite.
Automation—i.e., robots—has been a mainstay of large-scale manufacturing for years. Manufacturers already employ robots and automated machinery to streamline production, and automation is itself becoming an increasing feature of machinery sold to end users. Construction equipment can already be programmed to accomplish repetitive tasks like bricklaying, excavation, and painting. With continued improvements to the technology, they will be able to take on more complex work in time. Similarly, agricultural machinery may employ automated planting, spraying, and harvesting technology that improves efficiencies for customers.
Manufacturers will need to continue to evolve to adapt to the new technological environment and their customers’ needs. Machinery must be able to interact with the robotics that will assemble components and even entire structures. It must be able to communicate with remote technicians that will run the job site or farm of the future. The machine must be smart enough to recognize mistakes and adapt to situations on the job site without an operator. The focus of machine technology today is to make equipment that is more environmentally friendly, conserves energy, and integrates technology such as the global positioning system (GPS) to improve operator e� ciency. The connected machine has already improved the maintenance and operation of equipment thereby improving the lifespan and economic value of equipment to the end-use customer. The next challenge will be to develop equipment that can be even more e� cient without the operator.
VSS Macropaver is a division of Reed International, and it produces the Macropaver, a production machine for slurry seal and microsurfacing. It is based in central California.
“Exchange rates haven’t been a problem, as we have always built a better machine.” – Je� Reed, president and CEO of VSS Macropaver
Regulations remain a primary concern. Specifi cally, the regulatory mismatch between California and the rest of the country has proven di� cult.
Skilled labor is a problem, both on the manufacturing side and on the sales side. “We’ve destroyed the trade school system in this country—particularly in attacking the for-profi t trade schools. When you fi nish at a trade school, you have marketable skills.”
“We support the community through pro bono construction work and supplying of building supplies. We’ve worked with the construction operation that built the local soccer fi elds and also donated concrete for special projects and road repairs (especially in the run-down part of town).”


© 2017 IHS 21 February 2017
IHS Economics | The Market Size and Economic Contributions of the Off -Highway Equipment Industry
3.0
Approach and methodology
February 2017 22 © 2017 IHS
IHS Economics | The Market Size and Economic Contributions of the Off -Highway Equipment Industry
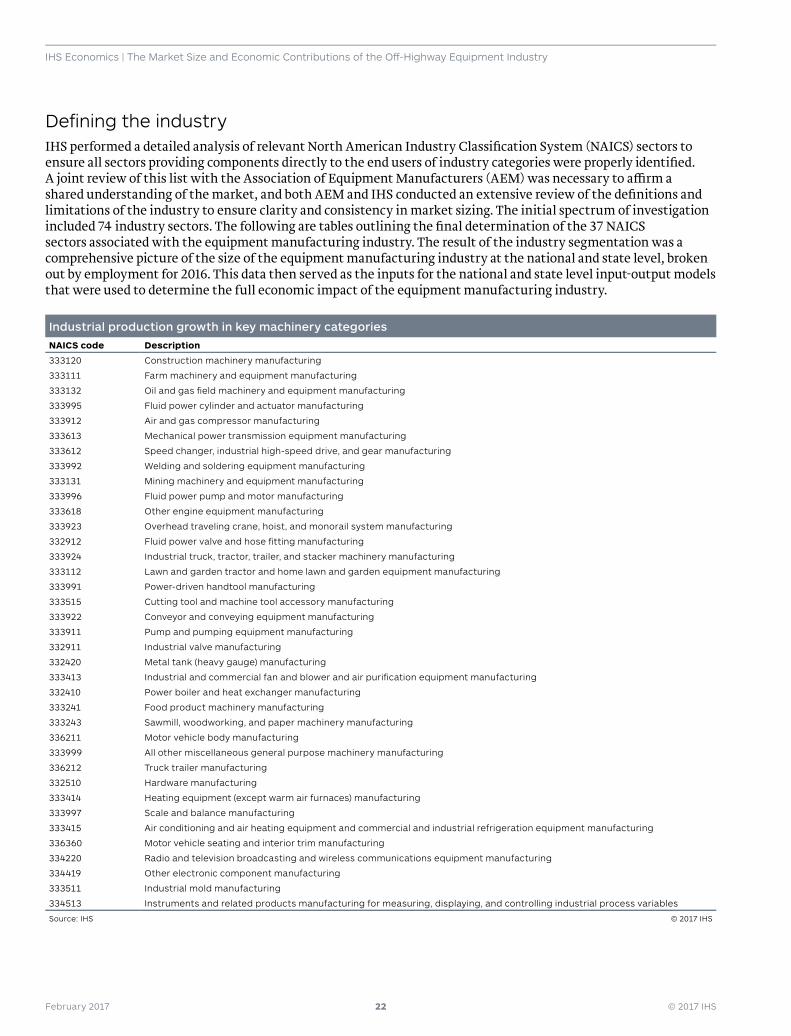
Defi ning the industryIHS performed a detailed analysis of relevant North American Industry Classifi cation System (NAICS) sectors to ensure all sectors providing components directly to the end users of industry categories were properly identifi ed. A joint review of this list with the Association of Equipment Manufacturers (AEM) was necessary to a� rm a shared understanding of the market, and both AEM and IHS conducted an extensive review of the defi nitions and limitations of the industry to ensure clarity and consistency in market sizing. The initial spectrum of investigation included 74 industry sectors. The following are tables outlining the fi nal determination of the 37 NAICS sectors associated with the equipment manufacturing industry. The result of the industry segmentation was a comprehensive picture of the size of the equipment manufacturing industry at the national and state level, broken out by employment for 2016. This data then served as the inputs for the national and state level input-output models that were used to determine the full economic impact of the equipment manufacturing industry.
Industrial production growth in key machinery categoriesNAICS code Description
333120 Construction machinery manufacturing
333111 Farm machinery and equipment manufacturing
333132 Oil and gas fi eld machinery and equipment manufacturing
333995 Fluid power cylinder and actuator manufacturing
333912 Air and gas compressor manufacturing
333613 Mechanical power transmission equipment manufacturing
333612 Speed changer, industrial high-speed drive, and gear manufacturing
333992 Welding and soldering equipment manufacturing
333131 Mining machinery and equipment manufacturing
333996 Fluid power pump and motor manufacturing
333618 Other engine equipment manufacturing
333923 Overhead traveling crane, hoist, and monorail system manufacturing
332912 Fluid power valve and hose fi tting manufacturing
333924 Industrial truck, tractor, trailer, and stacker machinery manufacturing
333112 Lawn and garden tractor and home lawn and garden equipment manufacturing
333991 Power-driven handtool manufacturing
333515 Cutting tool and machine tool accessory manufacturing
333922 Conveyor and conveying equipment manufacturing
333911 Pump and pumping equipment manufacturing
332911 Industrial valve manufacturing
332420 Metal tank (heavy gauge) manufacturing
333413 Industrial and commercial fan and blower and air purifi cation equipment manufacturing
332410 Power boiler and heat exchanger manufacturing
333241 Food product machinery manufacturing
333243 Sawmill, woodworking, and paper machinery manufacturing
336211 Motor vehicle body manufacturing
333999 All other miscellaneous general purpose machinery manufacturing
336212 Truck trailer manufacturing
332510 Hardware manufacturing
333414 Heating equipment (except warm air furnaces) manufacturing
333997 Scale and balance manufacturing
333415 Air conditioning and air heating equipment and commercial and industrial refrigeration equipment manufacturing
336360 Motor vehicle seating and interior trim manufacturing
334220 Radio and television broadcasting and wireless communications equipment manufacturing
334419 Other electronic component manufacturing
333511 Industrial mold manufacturing
334513 Instruments and related products manufacturing for measuring, displaying, and controlling industrial process variables
Source: IHS © 2017 IHS

© 2017 IHS 23 February 2017
IHS Economics | The Market Size and Economic Contributions of the Off -Highway Equipment Industry
The foundation of this data was the proprietary IHS Business Market Insights (BMI) service. This is a database (based o� the US Census, County Business Patterns data) of employment and output for all six-digit NAICS categories for the US down to the zip-code level that is modeled and maintained by IHS industry experts. This level of sector detail and geographic granularity was necessary to conduct this study while also having a sound estimate for 2016 employment. In order to derive an accurate depiction of the equipment manufacturing industry, it was important to have detailed economic data, not only about the a� liate businesses’ classifi cation, but also the location in which they operate.
The NAICS data, including what share of an industry’s data was determined to be relevant to the equipment manufacturing industry, were then used as the foundation for a similar analysis of the industry in Canada. In place of the US and state-based BMI data, StatCan data by industry and province was used as the starting point.
Extending the segmentation Once direct employment at the national level was established, we then used the same methodology to collect state data. Since the BMI database is based in NAICS codes, the error of attributing employment to a sector that does not exist in a given state was diminished. However, in some cases, we have more information than what is provided owing to lags in reporting or changes that occur in classifi cations. Any new information provided by AEM or IHS industry experts was layered into the analysis for a robust understanding of the sector composition in each state.
IHS also supplemented this top-down methodology with a bottom-up approach to truly understand the regional dynamics within the equipment manufacturing industries. This analysis leveraged AEM’s membership list and secondary research on employment and output by business location. Totaling up the employment fi gures for individual manufacturing plants allowed IHS to fully account for the total economic contributions of companies that cross state lines.
Measuring the contribution of the equipment manufacturing industryBusiness transactions with local suppliers and service providers serve as catalysts that trigger a fl urry of economic activity throughout the United States. For example, when a supplier sells a product or service to a producer of an end-use good or service, that supplier needs to hire employees (i.e., labor) to transform inputs (raw materials, energy, intellectual capital) into the fi nal product or service. The infl ation-adjusted ratio of sales to employees, which economists call output per employee, is a measure of productivity.
The models IHS developed to assess the economic footprint of the US equipment manufacturing industry contain productivity statistics for 440 industry sectors that are produced by IMPLAN, a software package that measures economic impacts. These sectors are aggregations of six-digit NAICS codes and are used to reduce any inconsistencies in state-level data. The IHS BMI employment data provided the starting point in assessing the industry’s direct impact. These data enabled an accurate assignment of jobs for each industry sector in the models. Industry-specifi c productivity data could then be applied to quantify the level of output supported by the business transactions within each industry sector. These contributions occur as a result of direct spending with a tier-1 supplier and are therefore classifi ed as a direct impact.
Sourcing the inputs a supplier requires to produce the product or service ordered by the producer of an end-use good or service invokes additional rounds of economic impact. Referring to the left side of the following fi gure, when a tier-1 supplier makes a sale, that supplier must then purchase the inputs (supplies and services) needed to produce the fi nal product. Some of these purchases will be imported from outside the US economy and were not included in this analysis. The remaining purchases, which represent sales for local businesses, remain within the US economy. Each supplier must, in turn, hire employees and source additional inputs from its suppliers. This e� ect occurs as a result of transactions between vendors and their supplier networks (interindustry), and is considered an indirect economic impact.

February 2017 24 © 2017 IHS
IHS Economics | The Market Size and Economic Contributions of the Off -Highway Equipment Industry
Sales(output)
Value added
Labor income(wages and benefits)
Profits Sales(output)
Industry productivity(output/worker )
Employment(jobs created or
sustained )Local intermediate
purchases
Supplies
Imported intermediate purchases
Services
Value added=
GDP contribution
Local purchasestimulate
multi-tieredlocal
supply chains
Further rounds of economic impact
Flow of US economic impacts from direct spending through income e� ect
Source: IHS © 2017 IHS
The di� erence between the value of a sale and the cost of its required nonlabor inputs is known as value added. As its name suggests, this represents how much more valuable a fi nal product or service is relative to its inputs. The sum of all of the value added by all industries within an economy is equivalent to GDP. Using value added guards against the double-counting that occurs when compiling output or revenue data by industry.
GDP is generally considered the broadest measure of the health of a national economy. The models developed by IHS for this study included value-added statistics for each of the 440 industry sectors, allowing IHS to assess the contribution of the equipment manufacturing industry to national GDP.
Finally, the direct and indirect employees spend a portion of their incomes in the regional economy on consumer goods and services. This stimulates yet another round of economic activity, which results in induced e� ects on employment, value added, and so on.
The results from the national model yielded employment, value added, labor income, and tax revenue generated by the equipment manufacturing industry. State-level models were primarily driven by the levels of direct employment determined in the data analysis and segment breakdown. However, states also experience signifi cant intermediate activities in support of direct economic activity in other states. These results are captured within the national model but can fall out of a state-specifi c analysis that is driven solely by in-state direct employment. IHS addressed this issue by allocating those remaining intermediate states through our proprietary regional economic models and BMI data. This process ensures our state-level analysis is in harmony with our national models and allocates all data based on existing industry supply capacity. The resulting levels of direct and intermediate impacts then determine the signifi cance of the spin-o� impacts for each state. The following graphic highlights the overall sequence of analysis.

© 2017 IHS 25 February 2017
IHS Economics | The Market Size and Economic Contributions of the Off -Highway Equipment Industry
Diagram of modeling process
Source: IHS © 2017 IHS
The results of this analysis provided industry-specifi c income, employment, and value-added data for each state. IHS maintains broad industry-level data, by state, for employment and gross state product through its US Regional Economics group. The results of our fi ndings not only capture the overall impact of the industry and by segment within the proper context of each state’s unique economy, but also highlight the signifi cance of the primary industries within the overall industry of each state—i.e., the equipment manufacturing industry provides X% of total manufacturing employment in state Y, while also supporting Z% of professional services employment. Federal and state tax generation by state was also determined from the economic impact analysis. IHS placed the state taxes generated into the context of the overall share of state government revenue and also determined the per household contribution to state taxes the equipment manufacturing industry provides in each state.
The overall process is similar for the analysis done on the Canadian market. There are fewer underlying industry sectors in the IMPLAN models for Canada and the provinces, but those limitations are primarily outside the key input manufacturing sectors needed for this analysis, so a similar level of industry detail was still available to ensure the industry’s impact was properly modeled.


© 2017 IHS 27 February 2017
IHS Economics | The Market Size and Economic Contributions of the Off -Highway Equipment Industry
4.0
Economic impact analysis results

February 2017 28 © 2017 IHS
IHS Economics | The Market Size and Economic Contributions of the Off -Highway Equipment Industry
The following tables and charts summarize the economic impact results for the US and Canadian o� -highway equipment manufacturing industry during 2016. The analysis starts with the industry’s direct (end-use) employment, which was determined to be 423,924 in the US and 64,324 in Canada in 2016.
The equipment manufacturing industry in the United States supports an additional 450,420 employees throughout the industry’s supply chain, which resulted in a total equipment manufacturing employment base of nearly 875,000 jobs. The equipment manufacturing industry also generated $267 billion in direct sales, which supported an additional $150 million in business activity across the United States. In sum, the equipment manufacturing industry supported $416 million of economic output in 2016.
Economic impact of o� -highway equipment manufacturing industryUnited States
Employment (number of workers) 1,273,396
Equipment manufacturing industry impact 874,344
End use 423,924
Supply chain 450,420
Induced 399,052
Contribution to GDP (millions of US dollars) 158,789
Equipment manufacturing industry impact 124,969
End-Use 77,722
Supply Chain 47,247
Induced 33,820
Labor income (millions of US dollars) 86,792
Equipment manufacturing industry impact 68,205
End use 38,279
Supply chain 29,927
Induced 18,587
Government revenues (millions of US dollars) 25,492
Federal tax 15,412
State and local 10,079
Canada
Employment (number of workers) 148,668
Equipment Manufacturing Industry Impact 103,893
End use 64,324
Supply chain 39,569
Induced 44,775
Contribution to GDP (millions of US dollars) 14,878
Equipment manufacturing industry impact 10,242
End use 6,066
Supply chain 4,177
Induced 4,636
Labor income (millions of US dollars) 9,663
Equipment manufacturing industry impact 7,364
End use 4,732
Supply chain 2,632
Induced 2,299
Source: IHS © 2017 IHS
Texas profi le: The o� -highway equipment industry in Texas covers global players like Kubota and Sandvik as well as many other more specialized fi rms. The bulk of the industry concentration is from oil and gas fi eld machinery equipment.
The equipment manufacturing industry in Texas directly employs 58,000 people, and an additional 148,000 jobs are supported by the industry’s supply chain and downstream e� ects.
Equipment manufacturers generate $18.7 billion in output within Texas each year, representing both the largest impact the industry has on any single state and 14.5% of the nation’s sales within the industry. Total tax revenue from the industry clocks in at $4.3 billion, with more than $1.6 billion of that being allocated to state and local governments.

© 2017 IHS 29 February 2017
IHS Economics | The Market Size and Economic Contributions of the Off -Highway Equipment Industry
The process for identifying the direct employment within the industry was reviewed within the Methodology section of this report. The following tables detail the industry-level employment levels. Within the United States, NAICS sector 3331 has been expanded to highlight the subsector details, since this industry makes up nearly one-half of all direct employment.
2016 US direct employment impact of o� -highway equipment manufacturing industryFour-digit NAICS code Total jobs
3331 Agriculture, construction, and mining machinery manufacturing 199,899
Construction machinery manufacturing 66,188
Farm machinery and equipment manufacturing 59,427
Lawn and garden tractor and home lawn and garden equipment manufacturing 7,352
Mining machinery and equipment manufacturing 13,064
Oil and gas fi eld machinery and equipment manufacturing 53,868
3339 Other general purpose machinery manufacturing 109,027
3336 Engine, turbine, and power transmission equipment manufacturing 64,817
3329 Other fabricated metal product manufacturing 20,895
3335 Metalworking machinery manufacturing 8,801
3324 Boiler, tank, and shipping container manufacturing 5,793
3334 HVAC and commercial refrigeration equipment manufacturing 4,119
3362 Motor vehicle body and trailer manufacturing 4,097
3332 Industrial machinery manufacturing 3,146
3325 Hardware manufacturing 1,267
3363 Motor vehicle parts manufacturing 624
3344 Semiconductor and other electronic component manufacturing 512
3342 Communications equipment manufacturing 523
3345 Navigational, measuring, and control instruments manufacturing 404
Grand Total 423,924
Source: IHS © 2017 IHS
2016 Canada direct employment impact of o� -highway equipment manufacturing industryFour-digit NAICS code Total jobs
3331 Agriculture, construction, and mining machinery manufacturing 30,236
3339 Other general purpose machinery manufacturing 15,001
3336 Engine, turbine, and power transmission equipment manufacturing 6,298
3329 Other fabricated metal product manufacturing 5,532
3335 Metalworking machinery manufacturing 2,350
3332 Industrial machinery manufacturing 1,309
3324 Boiler, tank, and shipping container manufacturing 1,164
3363 Motor vehicle parts manufacturing 685
3362 Motor vehicle body and trailer manufacturing 644
3334 HVAC and commercial refrigeration equipment manufacturing 443
3325 Hardware manufacturing 205
3345 Navigational, measuring, and control instruments manufacturing 193
3342 Communications equipment manufacturing 137
3344 Semiconductor and other electronic component manufacturing 127
Grand total 64,324
Source: IHS © 2017 IHS

February 2017 30 © 2017 IHS
IHS Economics | The Market Size and Economic Contributions of the Off -Highway Equipment Industry
Impact results: EmploymentThe equipment manufacturing industry in the United States supported 1.27 million jobs in 2016. This fi gure represents almost 1% of the 140 million nonfarm jobs in the United States. Firms producing end-user goods and services directly supported about 424,000 jobs, whereas 450,000 were within supply-chain businesses. An additional 399,000 jobs were the result of changes to income or induced jobs. The impact on employment at the state level was most pronounced in Texas, Illinois, and Wisconsin, which accounted for 29% of the direct employment impact within the equipment manufacturing industry.
Of the 1.3 million jobs supported nationally, about 500,000 can be characterized as manufacturing jobs, whereas information and professional services contribute approximately 200,000 jobs, many as an indirect result of the industry.
The industry’s indirect impacts are far-reaching and span a more diverse set of industries. However, there is still a small concentration of these jobs within the wholesale trade and manufacturing industries, which contribute 61,800 and 68,600 jobs, respectively. The supply-chain impacts are also strong in educational, health, and recreation services (41,900 jobs); transportation and warehousing (32,000 jobs); and retail trade (21,600 jobs).
The direct and indirect jobs supported by the industry provide a further round of economic stimulus as wages fl ow through unrelated sectors of the economy.
Wisconsin profi le: AEM’s membership is well-represented within Wisconsin, including manufacturers such as CNH, Chermack Machine, and Waikato Milking Systems. The equipment manufacturing sector in Wisconsin supported 1.3% of the total nonfarm jobs in the state during the last year, with more than 30,000 direct jobs within the industry.
Additionally, $728.0 million was added to state and local government co� ers through taxes on the economic activity induced by the equipment manufacturing industry, with an additional $1.1 billion fl owing to the federal government through tax revenues. The equipment manufacturing industry further enhanced the gross state product of Wisconsin by $4.8 billion within the industry—and more than $10.0 billion when supply chain and downstream e� ects are included in the analysis.
0
100,000
200,000
300,000
400,000
500,000
600,000
Induced Indirect Direct
Employment impact
© 2017 IHSSource: IHS

© 2017 IHS 31 February 2017
IHS Economics | The Market Size and Economic Contributions of the Off -Highway Equipment Industry
16%
9%
8%
6%
6%5%5%
45%
Texas
Illinois
Wisconsin
Ohio
Iowa
Indiana
California
Rest of states
Employment impact by top states
© 2017 IHSSource: IHS
40%
23%
19%
7%
6%5% 0%
Ontario
Alberta
Quebec
Manitoba
Saskatchewan
British Columbia
Other
Employment impact by province
© 2017 IHSSource: IHS
These induced impacts had the largest employment impact in the information and professional services, leisure, and wholesale and retail trade sectors. Many of these induced jobs are in the service sectors of the economy, which benefi t from higher levels of employment and therefore higher incomes. Similarly, retail stores and wholesale trade businesses are greatly a� ected by changes in disposable income that result from fl uctuations in employment due to hiring in the industry.
In Canada, the industry’s 64,300 direct jobs support nearly 40,000 additional supply-chain jobs, whereas nearly 45,000 jobs are induced by the income e� ect of the direct and indirect employment supported by the industry. The 149,000 total jobs supported by the equipment manufacturing industry in Canada made up 1% of the total Canadian workforce in 2016.
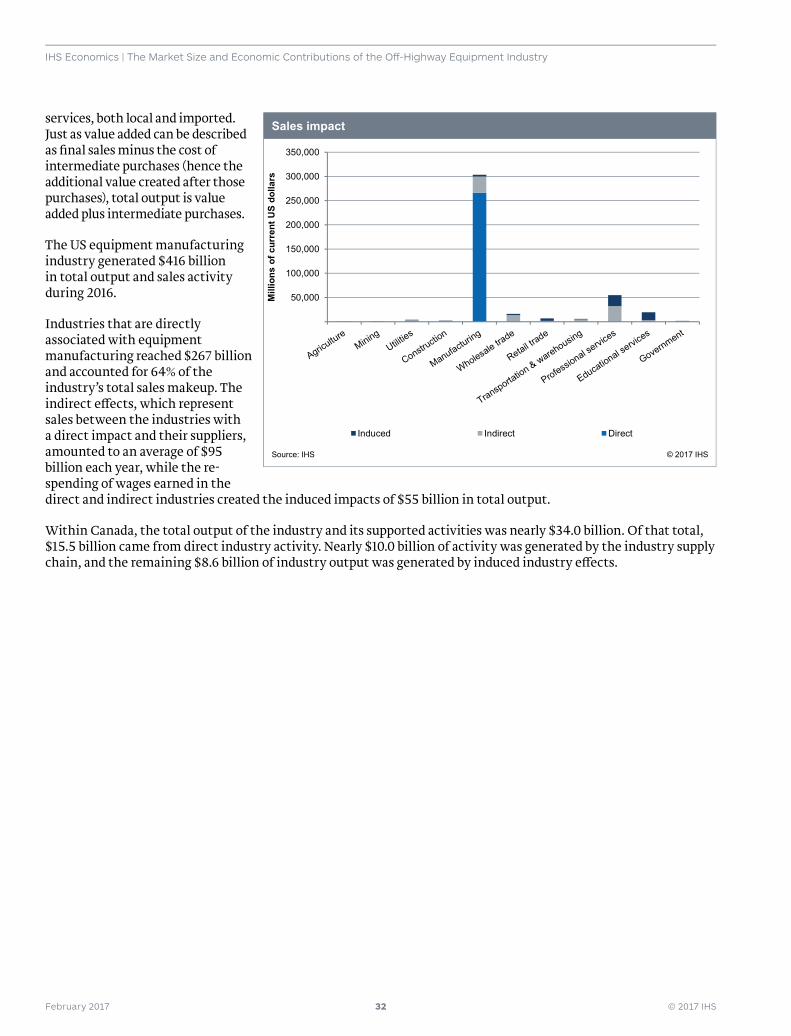
SalesThe broadest measure of economic activity generated by the equipment manufacturing industry can be measured in terms of fi nal sales, also known as output. This metric includes value added as well as the purchase of intermediate goods and
February 2017 32 © 2017 IHS
IHS Economics | The Market Size and Economic Contributions of the Off -Highway Equipment Industry
services, both local and imported. Just as value added can be described as fi nal sales minus the cost of intermediate purchases (hence the additional value created after those purchases), total output is value added plus intermediate purchases.
The US equipment manufacturing industry generated $416 billion in total output and sales activity during 2016.
Industries that are directly associated with equipment manufacturing reached $267 billion and accounted for 64% of the industry’s total sales makeup. The indirect e� ects, which represent sales between the industries with a direct impact and their suppliers, amounted to an average of $95 billion each year, while the re-spending of wages earned in the direct and indirect industries created the induced impacts of $55 billion in total output.
Within Canada, the total output of the industry and its supported activities was nearly $34.0 billion. Of that total, $15.5 billion came from direct industry activity. Nearly $10.0 billion of activity was generated by the industry supply chain, and the remaining $8.6 billion of industry output was generated by induced industry e� ects.
50,000
100,000
150,000
200,000
250,000
300,000
350,000
Mill
ions
of c
urre
nt U
S do
llars
Induced Indirect Direct
Sales impact
© 2017 IHSSource: IHS

© 2017 IHS 33 February 2017
IHS Economics | The Market Size and Economic Contributions of the Off -Highway Equipment Industry
Contribution to GDPThe equipment manufacturing industry added approximately $159 billion to US GDP in 2016—1.16% of US GDP. Domestic manufacturing companies directly contributed just under $78 billion to GDP. Industries that benefi t directly, such as construction and farm machinery manufacturers, also require supplies and services, creating value added in both upstream and downstream supplier industries. Suppliers to the equipment manufacturing industry had an indirect economic impact of $47 billion. The induced impact of the industry added an additional $34 billion to GDP in 2016.
The industry and its associated supply chain added nearly $15 billion to Canada’s GDP in 2016. This equates to 1% of total Canadian nominal GDP for the year. Direct industry activity generated $6.1 billion for the Canadian economy. The indirect impact of the industry was $4.1 billion, whereas the induced e� ect of the industry was $4.6 billion.
Labor incomeA large portion of each industry’s value added is contained in the wages and proprietor’s income paid out to individuals. The equipment manufacturing industry generated nearly $87 billion in wages and benefi ts in 2016. Direct compensation of labor income makes up the bulk of this ($38 billion), with indirect labor accounting for almost $30 billion; the remaining $18 billion is made up of downstream impacts. The $86 billion in labor income equates to an average annual salary of $78,000 per industry-supported employee.
In Canada, the industry generated total labor income of $9.7 billion. The industry directly generated $4.7 billion. The supply chain accounted for $2.6 billion, whereas the induced effect made up the remaining $2.3 billion. The average annual wage generated by this income effect is $65,000.
North Carolina profi le: The o� -highway equipment manufacturing sector supports a large swath of the economy in North Carolina. The industry directly employs more than 12,000 people, with an additional 25,000 jobs created within the state through supply-chain and downstream channels.
These AEM members further added $13.7 billion to the gross state product of North Carolina, which represented more than 1% of total state output in 2016.
10,000
20,000
30,000
40,000
50,000
60,000
70,000
80,000
90,000
100,000
Mill
ions
of c
urre
nt U
S do
llars
Induced Indirect Direct
Value-added impact
© 2017 IHSSource: IHS
5,000
10,000
15,000
20,000
25,000
30,000
35,000
40,000
45,000
50,000
Mill
ions
of c
urre
nt U
S do
llars
Induced Indirect Direct
Labor income impact
© 2017 IHSSource: IHS

February 2017 34 © 2017 IHS
IHS Economics | The Market Size and Economic Contributions of the Off -Highway Equipment Industry
TaxesFirms that operate within the equipment manufacturing industry contribute taxes at both the federal and state level. In the United States, these fi rms paid a total of $25.4 billion in federal and state taxes in 2016. Taxes paid at the federal level amounted to $15.4 billion, which accounts for more than 0.5% of total US federal tax collections in 2016. State and local governments also received an estimated $10.0 billion in 2016, which is larger than the combined state budgets of New Hampshire ($5.4 billion) and South Dakota ($4.3 billion).
2016 US Industry Tax ImpactMillions of dollars
Total 25,492
Federal tax 15,412
State and local tax 10,079
Source: IHS © 2017 IHS

© 2017 IHS 35 February 2017
IHS Economics | The Market Size and Economic Contributions of the Off -Highway Equipment Industry
5.0
Appendix

February 2017 36 © 2017 IHS
IHS Economics | The Market Size and Economic Contributions of the Off -Highway Equipment Industry
Appendix I: Segment, state, and provincial economic impact result tables
2016 US Sector Impact SummaryConstruction Agriculture Mining Total
Employment 500,143 320,726 452,525 1,273,393
Direct 162,678 113,672 147,572 423,922
Indirect 175,655 111,952 162,813 450,420
Induced 159,450 99,056 140,546 399,052
Output (millions of US dollars) 165,510 101,971 148,722 416,203
Direct 105,822 65,721 94,965 266,509
Indirect 37,593 22,895 34,164 94,652
Induced 21,995 13,663 19,386 55,043
Contribution to GDP (millions of US dollars) 62,850 39,942 55,996 158,789
Direct 30,641 20,692 26,389 77,722
Indirect 18,613 11,719 16,915 47,247
Induced 13,514 8,395 11,911 33,820
Labor income (millions of US dollars) 34,651 21,574 30,567 86,792
Direct 15,784 9,668 12,827 38,278
Indirect 11,769 7,393 10,765 29,927
Induced 7,427 4,614 6,546 18,587
Source: IHS © 2017 IHS

© 2017 IHS 37 February 2017
IHS Economics | The Market Size and Economic Contributions of the Off -Highway Equipment Industry
2016 US and State Employment Impact SummaryDirect
employmentIndirect
employmentInduced
employmentTotal
employment
United States US 423,922 450,420 399,052 1,273,393
Alabama AL 4,432 4,102 2,915 11,449
Alaska AK 76 49 33 158
Arizona AZ 3,468 3,894 3,506 10,868
Arizona AR 2,170 1,856 1,245 5,271
California CA 18,255 22,694 18,535 59,485
Colorado CO 1,792 1,960 1,818 5,570
Connecticut CT 3,054 2,227 2,108 7,389
Delaware DE 51 25 25 102
Florida FL 5,275 6,418 5,425 17,117
Georgia GA 5,582 6,489 5,340 17,410
Hawaii HI - 2 1 3
Idaho ID 1,346 1,226 884 3,456
Illinois IL 35,562 41,215 43,078 119,856
Indiana IN 20,904 21,791 19,331 62,026
Iowa IA 26,142 24,811 20,590 71,542
Kansas KS 7,889 6,706 5,184 19,779
Kentucky KY 8,752 7,412 5,971 22,136
Louisiana LA 8,188 7,373 6,724 22,286
Maine ME 837 658 521 2,016
Maryland MD 2,095 2,247 1,699 6,041
Massachusetts MA 1,491 920 1,135 3,547
Michigan MI 17,252 18,586 17,923 53,761
Minnesota MN 13,192 13,898 12,712 39,802
Mississippi MS 5,559 4,410 3,238 13,208
Missouri MO 6,095 6,128 5,352 17,575
Montana MT 177 202 130 508
Nebraska NE 7,188 6,048 4,847 18,083
Nevada NV 324 241 152 718
New Hampshire NH 1,515 929 1,035 3,479
New Jersey NJ 2,792 1,884 2,278 6,954
New Mexico NM 743 539 333 1,615
New York NY 14,386 10,059 10,007 34,453
North Carolina NC 12,374 14,386 11,589 38,349
North Dakota ND 4,607 3,873 2,392 10,872
Ohio OH 27,143 27,350 26,151 80,644
Oklahoma OK 11,914 12,239 9,417 33,569
Oregon OR 4,416 4,777 3,914 13,107
Pennsylvania PA 15,676 16,987 14,977 47,640
Rhode Island RI 145 59 70 274
South Carolina SC 6,802 5,568 5,184 17,554
South Dakota SD 5,043 4,211 3,006 12,259
Tennessee TN 5,324 5,687 4,694 15,705
Texas TX 58,260 78,648 70,915 207,823
Utah UT 2,843 3,443 2,791 9,077
Vermont VT 11 9 8 28
Virginia VA 5,537 4,675 3,820 14,031
Washington WA 4,652 3,977 3,486 12,116
Washington DC DC - - - -
West Virginia WV 1,423 1,025 850 3,298
Wisconsin WI 30,541 36,065 31,437 98,043
Wyoming WY 622 443 276 1,342
Source: IHS © 2017 IHS

February 2017 38 © 2017 IHS
IHS Economics | The Market Size and Economic Contributions of the Off -Highway Equipment Industry
2016 US and State Output Impact Summary(Millions of US dollars)
Direct Output Indirect Output Induced Output Total Output
United States US 266,509 94,652 55,043 416,203
Alabama AL 2,491 816 358 3,665
Alaska AK 43 9 5 57
Arizona AZ 1,925 696 475 3,096
Arizona AR 1,278 374 156 1,808
California CA 8,554 5,380 3,014 16,948
Colorado CO 988 414 252 1,654
Connecticut CT 1,368 493 319 2,180
Delaware DE 17 4 3 24
Florida FL 2,788 1,175 732 4,695
Georgia GA 4,026 1,307 711 6,045
Hawaii HI - 0 0 1
Idaho ID 832 186 104 1,122
Illinois IL 28,490 9,762 6,498 44,750
Indiana IN 15,026 4,873 2,505 22,404
Iowa IA 20,864 4,617 2,572 28,052
Kansas KS 4,962 1,170 662 6,794
Kentucky KY 5,325 1,328 743 7,396
Louisiana LA 5,014 1,333 850 7,197
Maine ME 426 98 63 588
Maryland MD 1,727 482 238 2,447
Massachusetts MA 574 193 166 934
Michigan MI 10,355 3,907 2,339 16,601
Minnesota MN 7,455 2,914 1,816 12,186
Mississippi MS 3,286 815 396 4,497
Missouri MO 3,471 1,140 683 5,295
Montana MT 127 30 15 172
Nebraska NE 4,270 1,033 602 5,905
Nevada NV 147 41 21 209
New Hampshire NH 524 172 136 832
New Jersey NJ 1,198 404 352 1,953
New Mexico NM 386 82 41 509
New York NY 6,748 2,407 1,585 10,740
North Carolina NC 9,289 2,951 1,519 13,758
North Dakota ND 3,843 671 301 4,815
Ohio OH 13,216 5,666 3,437 22,319
Oklahoma OK 7,518 2,311 1,211 11,040
Oregon OR 2,174 1,008 501 3,682
Pennsylvania PA 8,931 3,846 2,088 14,865
Rhode Island RI 38 11 9 58
South Carolina SC 3,840 1,029 581 5,450
South Dakota SD 3,139 688 371 4,198
Tennessee TN 3,816 1,111 628 5,555
Texas TX 38,429 17,536 10,288 66,253
Utah UT 1,440 716 359 2,514
Vermont VT 8 1 1 10
Virginia VA 3,398 944 532 4,874
Washington WA 2,761 854 537 4,152
Washington DC DC - - - -
West Virginia WV 818 183 101 1,102
Wisconsin WI 18,772 7,402 4,133 30,306
Source: IHS © 2017 IHS

© 2017 IHS 39 February 2017
IHS Economics | The Market Size and Economic Contributions of the Off -Highway Equipment Industry
2016 US and State Value Added Impact SummaryDirect value
addedIndirect value
addedInduced value
addedTotal value
added
United States US 77,722 47,247 33,820 158,789
Alabama AL 577 369 216 1,163
Alaska AK 10 5 3 18
Arizona AZ 404 369 298 1,071
Arizona AR 238 182 94 514
California CA 2,357 2,589 1,862 6,809
Colorado CO 270 211 156 637
Connecticut CT 462 294 217 972
Delaware DE 4 3 2 9
Florida FL 494 625 452 1,571
Georgia GA 1,018 687 440 2,145
Hawaii HI - 0 0 0
Idaho ID 143 96 60 299
Illinois IL 11,463 5,156 4,095 20,713
Indiana IN 4,499 2,179 1,525 8,203
Iowa IA 6,963 2,258 1,550 10,770
Kansas KS 1,111 626 404 2,142
Kentucky KY 1,234 660 443 2,337
Louisiana LA 1,411 696 512 2,620
Maine ME 71 54 39 164
Maryland MD 330 251 152 733
Massachusetts MA 205 115 107 427
Michigan MI 2,293 1,904 1,403 5,601
Minnesota MN 1,693 1,540 1,110 4,343
Mississippi MS 716 384 236 1,336
Missouri MO 781 592 413 1,785
Montana MT 7 15 9 31
Nebraska NE 1,356 545 364 2,265
Nevada NV 25 23 14 62
New Hampshire NH 167 94 87 349
New Jersey NJ 435 245 228 907
New Mexico NM 42 42 25 109
New York NY 1,979 1,418 1,057 4,454
North Carolina NC 2,821 1,454 941 5,217
North Dakota ND 1,062 382 186 1,631
Ohio OH 3,772 2,745 2,086 8,602
Oklahoma OK 1,926 1,115 726 3,768
Oregon OR 391 487 302 1,180
Pennsylvania PA 2,174 1,830 1,290 5,294
Rhode Island RI 13 6 6 25
South Carolina SC 1,184 492 351 2,027
South Dakota SD 762 368 222 1,352
Tennessee TN 933 566 391 1,890
Texas TX 12,512 8,711 6,279 27,503
Utah UT 265 364 209 838
Vermont VT 1 1 1 3
Virginia VA 1,092 521 342 1,956
Washington WA 1,001 459 337 1,797
Washington DC DC - - - -
West Virginia WV 149 82 62 292
Wisconsin WI 4,833 3,396 2,493 10,722
Wyoming WY 73 39 22 133
Source: IHS © 2017 IHS

February 2017 40 © 2017 IHS
IHS Economics | The Market Size and Economic Contributions of the Off -Highway Equipment Industry
2016 US and State Labor Income Impact SummaryDirect labor
incomeIndirect labor
incomeInduced labor
incomeTotal labor
income
United States US 38,278 29,927 18,587 86,792
Alabama AL 306 228 114 648
Alaska AK 5 3 2 10
Arizona AZ 299 232 165 696
Arizona AR 125 106 49 280
California CA 1,594 1,732 1,047 4,373
Colorado CO 157 144 90 391
Connecticut CT 275 196 122 593
Delaware DE 3 2 1 6
Florida FL 398 393 251 1,042
Georgia GA 400 428 241 1,069
Hawaii HI - 0 0 0
Idaho ID 84 61 33 178
Illinois IL 4,205 3,283 2,255 9,743
Indiana IN 1,985 1,308 804 4,097
Iowa IA 2,332 1,401 815 4,547
Kansas KS 564 390 217 1,171
Kentucky KY 659 405 241 1,305
Louisiana LA 767 419 278 1,464
Maine ME 45 36 21 102
Maryland MD 169 163 86 418
Massachusetts MA 141 81 66 288
Michigan MI 1,553 1,239 774 3,565
Minnesota MN 1,055 1,001 608 2,665
Mississippi MS 378 223 121 723
Missouri MO 466 394 238 1,098
Montana MT 10 10 5 25
Nebraska NE 505 351 200 1,056
Nevada NV 17 15 7 39
New Hampshire NH 119 63 49 231
New Jersey NJ 311 161 129 601
New Mexico NM 37 27 13 77
New York NY 1,372 954 607 2,933
North Carolina NC 994 891 494 2,379
North Dakota ND 322 228 97 647
Ohio OH 2,271 1,775 1,151 5,197
Oklahoma OK 996 688 401 2,084
Oregon OR 313 312 173 797
Pennsylvania PA 1,275 1,220 731 3,225
Rhode Island RI 9 4 3 16
South Carolina SC 519 307 191 1,017
South Dakota SD 332 221 117 670
Tennessee TN 398 358 222 978
Texas TX 6,603 5,314 3,477 15,393
Utah UT 213 191 115 519
Vermont VT 1 0 0 2
Virginia VA 416 340 181 937
Washington WA 383 284 178 845
Washington DC DC - - - -
West Virginia WV 122 53 33 208
Wisconsin WI 2,722 2,270 1,366 6,359
Wyoming WY 50 23 11 84
Source: IHS © 2017 IHS

© 2017 IHS 41 February 2017
IHS Economics | The Market Size and Economic Contributions of the Off -Highway Equipment Industry
2016 Canada Sector Impact SummaryConstruction Agriculture Mining Canada Total
Employment 51,440 44,397 52,831 148,668
Direct 22,290 19,199 22,836 64,324
Indirect 13,670 11,827 14,072 39,569
Induced 15,480 13,372 15,923 44,775
Output (millions of US dollars) 11,693 10,086 12,008 33,787
Direct 5,372 4,626 5,513 15,511
Indirect 3,355 2,899 3,445 9,699
Induced 2,966 2,562 3,050 8,577
Contribution to GDP (millions of US dollars) 5,144 4,443 5,291 14,878
Direct 2,098 1,810 2,158 6,066
Indirect 1,444 1,248 1,485 4,177
Induced 1,603 1,385 1,649 4,636
Labor income (millions of US dollars) 3,341 2,886 3,436 9,663
Direct 1,636 1,413 1,683 4,732
Indirect 910 787 936 2,632
Induced 795 686 817 2,299
Source: IHS © 2017 IHS
2016 Canada and Province Impact SummaryOntario Alberta Quebec Other
ProvincesCanada Total
Employment 62,770 28,117 29,672 28,109 148,668
Direct 25,474 15,116 12,021 11,714 64,324
Indirect 17,347 6,726 8,065 7,431 39,569
Induced 19,949 6,275 9,587 8,964 44,775
Output (millions of US dollars) 14,287 6,358 6,714 6,428 33,787
Direct 6,187 3,589 2,870 2,865 15,511
Indirect 4,241 1,539 2,086 1,833 9,699
Induced 3,860 1,229 1,759 1,730 8,577
Contribution to GDP (millions of US dollars) 6,312 2,785 2,932 2,850 14,878
Direct 2,414 1,402 1,125 1,124 6,066
Indirect 1,819 709 852 796 4,177
Induced 2,078 674 955 929 4,636
Labor income (millions of US dollars) 4,079 1,845 1,908 1,831 9,663
Direct 1,882 1,094 881 875 4,732
Indirect 1,157 439 541 495 2,632
Induced 1,040 312 486 461 2,299
Source: IHS © 2017 IHS

February 2017 42 © 2017 IHS
IHS Economics | The Market Size and Economic Contributions of the Off -Highway Equipment Industry
Appendix II: BMI and IMPLAN model
IHS Business Market InsightsBusiness Market Insights (BMI) is a robust database that provides market-leading forecast views of business employment and output at the state, metropolitan statistical area (MSA), and county level. Using advanced modeling techniques and a rich dataset from the US Census Bureau, our teams of economists and business specialists leverage the IHS internationally recognized US macroeconomic, industry, and regional forecasts to generate business activity indicators by county and detailed four-digit North American Industry Classifi cation System (NAICS) code. Private companies, fi nancial institutions, and government agencies use this one-of-a-kind database to get a deep look at US markets. It enables users to estimate the size and growth potential of a specifi c industry in a particular geography, even when regional data are limited. The database is designed to allow users to easily aggregate our historical data and forecasts by market area or industry.
Database coverage includes
• Employment
• The number of establishments
• Sales (output) in current and constant dollars
• Four-digit NAICS Code
• US states, MSAs, counties, and census regions
• Annual data, the 25-year forecast, and 15-plus years of history
• IMPLAN model
Impact Analysis for Planning (IMPLAN) is a widely used, commercially available model for input/output analysis. Minnesota IMPLAN Group, Inc., is responsible for the production of the IMPLAN data, model, and software. Using classic input/output analysis in combination with region-specifi c social accounting matrices and multiplier models, IMPLAN provides a highly accurate and adaptable model for its users. The IMPLAN database contains country, state, zip code, and federal economic statistics, which are specialized by region. IMPLAN accounts closely follow the accounting conventions used in the “Input-Output Study of the US Economy” by the US Bureau of Economic Analysis (BEA) and the rectangular format recommended by the United Nations. The IMPLAN system was designed to serve three functions:
• Data retrieval
• Data reduction and model development
• Impact analysis
Comprehensive and detailed data coverage of the entire United States by geography and the ability to incorporate user-supplied data at each stage of the model-building process provide a high degree of fl exibility both in terms of geographic coverage and model formulation. There are two components to the IMPLAN system, the software and databases. The databases provide all information to create regional IMPLAN models. The software performs the calculations and provides an interface for the user to make fi nal-demand changes.

© 2017 IHS 43 February 2017
IHS Economics | The Market Size and Economic Contributions of the Off -Highway Equipment Industry
The IMPLAN system consists of two major parts:
• A national-level technology matrix
• Estimates of sectoral activity for fi nal demand, fi nal payments, industry output, and employment for each detailed geography in the United States along with the aggregate region
Input-output accounting describes commodity fl ows from producers to intermediate and fi nal consumers. The total industry purchases of commodities, services, employment compensation, value added, and imports are equal to the value of the commodities produced.
Purchases for fi nal use (fi nal demand) drive the model. Industries produce goods and services for fi nal demand and purchase goods and services from other producers. These other producers, in turn, purchase goods and services. This buying of goods and services (indirect purchases) continues until leakages from the region (imports and value added) stop the cycle.
These indirect and induced e� ects (the e� ects of household spending) can be mathematically derived. The derivation is called the Leontief inverse. The resulting sets of multipliers describe the change of output for each and every regional industry caused by a one-dollar change in fi nal demand for any given industry.
Creating regional input-output models requires a tremendous amount of data. The costs of surveying industries within each region to derive a list of commodity purchases (production functions) are prohibitive. IMPLAN was developed as a cost-e� ective means to develop regional input-output models.
IMPLAN easily allows the user to
• Develop multiplier tables
• Develop a complete set of social accounting matrix (SAM) accounts
• Change any component of the system, production functions, trade fl ows, or database
• Generate type I, II, or any true SAM multiplier internalizing household, government, and/or investment activities
• Create custom impact analysis by entering fi nal-demand changes
• Obtain any report in the system to examine the model’s assumptions and calculations
IMPLAN softwareMinnesota IMPLAN Group developed the current version of IMPLAN Professional® version 3.0 in 2009. It is a Windows-based software package that performs the calculations necessary to create the predictive model. The software reads the database, creates the complete set of social accounting matrices (SAM), the input/output accounts, and integrates all user-defi ned inputs to produce an alternative scenario.
The IMPLAN Input/Output System derives the predictive multipliers. The software also enables the user to make changes to the data, trade fl ows, or technology. It also enables the user to make fi nal-demand changes, which result in the impact assessment.
February 2017 44 © 2017 IHS
IHS Economics | The Market Size and Economic Contributions of the Off -Highway Equipment Industry
Features of IMPLAN Professional® include:
• Windows fi le and printer management
• An economic database editor
• A complete social accounting matrix (SAM) structure
• A choice of trade-fl ow assumptions: supply-demand pooling, regional purchase coe� cients, location quotients
• A production function editor, i.e., the tools and opportunity necessary to modify the “absorption” and “byproducts” matrices
• Libraries for production functions and impact analysis expenditures
• Flexible model aggregation tools
• A report generator with many preset reports for all stages of model building and analysis
• An export feature to many major PC fi le formats
• Flexible assumptions for induced e� ects
• Type SAM – true SAM multipliers that allow internalizing any number of institutions
• Type II - Based on personal consumption expenditure (PCE) and SAM-based local income relationship
• Type II - Based on user-specifi ed disposable income rate
• Type III (CPMM) - Traditional Forest Service employment–based multipliers
• A menu structure for easy impact analysis
• Event-based impact databases
• Built-in and editable transaction margins
• Built-in and editable defl ators
• Technical support by MIG, Inc.
• Data in Access Database format
DatabaseEach database has information for these components for all 440 industrial sectors in the IMPLAN model. This 440-sector scheme was revised in 2007 and was originally the basis for the BEA’s Benchmark Input-Output Study. This scheme is nearly six-digit NAICS for manufacturing and more aggregate for service sectors. By necessity, IMPLAN’s sectoring is very similar. However, in some cases, six-digit NAICS code data have been aggregated for certain IMPLAN sectors. A full NAICS-to-IMPLAN mapping document can be downloaded from www.implan.com.
Employment is total wage and salary and self-employed jobs in a region. In the 1985 database, employment was measured as full-time equivalent jobs. This meant total employment in a region would generally be below most published estimates because these are generally full-time and part-time workers. In the 1990 and subsequent

© 2017 IHS 45 February 2017
IHS Economics | The Market Size and Economic Contributions of the Off -Highway Equipment Industry
databases, employment includes both full-time and part-time workers. Employment in the 1990 and subsequent databases are measured in total jobs.
There are four subcomponents for value added:
• Employee compensation
• Proprietary income
• Other property-type income
• Indirect business taxes
Employee compensation is wage and salary payments as well as benefits, including health and life insurance, retirement payments, and any other noncash compensation. This provides a measure of income to workers paid by employers.
Proprietary income consists of payments received by self-employed individuals as income. This would be recorded on Federal Tax Form 1040C. This includes income received by private business owners, doctors, lawyers, and so forth. Any income a person receives for payment of self-employed work is counted here.
Other property-type income consists of payments from rents, royalties, and dividends. This includes payments to individuals in the form of rents received on property, royalties from contracts, and dividends paid by corporations. This also includes corporate profi ts earned by corporations.
Indirect business taxes consist primarily of excise and sales taxes paid by individuals to businesses. These taxes are collected during the normal operation of these businesses but do not include taxes on profi t or income. Goods and services purchased for their ultimate use by an end user are called fi nal demands. For a region, this would include exports, since those are a fi nal use for that product. In an input-output framework, fi nal demands are allocated to producing industries with margins allocated to the service sectors (transportation, wholesale and retail trade, insurance) associated with providing that good to the fi nal user.
Thus, fi nal demands are in producer prices. There are 13 subcomponents for fi nal demands:
• Personal consumption expenditures (PCE)—nine income levels
• Federal government military purchases
• Federal government nonmilitary purchases
• Federal government capital formation purchases
• State and local government noneducation purchases
• State and local government education purchases
• State and local government capital formation purchases
• Inventory purchases
• Capital formation
• Foreign exports
• State and local government sales

February 2017 46 © 2017 IHS
IHS Economics | The Market Size and Economic Contributions of the Off -Highway Equipment Industry
• Federal government sales
• Inventory sales
All fi nal demands in the original data are on a commodity basis. The distinction between industries and commodities is as follows from the 1972 Input-Output Defi nitions and Conventions Manual:
• An input-output industry is a grouping of establishments, as classifi ed by Standard Industrial Classifi cation (SIC)3.
• An input-output commodity consists of the characteristic products of the corresponding input-output industry wherever made. There are several industries that have no commodities. This is a result of departures from the strict SIC. Also, some commodities have no associated industry. An example of this is noncomparable imports.
PCE consists of payments by individuals/households to industries for goods and services used for personal consumption. Individuals tend to buy little directly from industries other than retail trade. In an input-output table, though, purchases made by individuals for fi nal consumption are shown as payments made directly to the industry producing the good. PCE is the largest component of fi nal demand.
Federal government purchases are divided between military and nonmilitary uses and capital formation. Federal military purchases are those made to support national defense. Goods range from food for troops to missile launchers. Nonmilitary purchases are made to supply all other government functions. Payments made to other governmental units are transfers and are not included in federal government purchases.
State and local government purchases are divided between public education and noneducation and capital formation. Public education purchases are for elementary, high school, and higher education. Noneducation purchases are for all other government activities. These include state government operations and operations including police protection and sanitation. Private-sector education purchases are not counted here. Private education purchases show up in IMPLAN sectors 495 and 496.
Inventory purchases are made when industries do not sell all output created in one year. This is generally the case. Each year, a portion of output goes to inventory. Inventory sales occur when industries sell more than they produce and need to deplete inventory. Inventory purchases and sales generally involve goods-producing industries (e.g., agriculture, mining, and manufacturing).
Capital formation is private expenditures made to obtain capital equipment. The dollar values in the IMPLAN database are expenditures made to an industrial sector producing the capital equipment. The values are not expenditures by the industrial sector.
Foreign exports are demands made to industries for goods for export beyond national borders. These represent goods and services demanded by foreign parties. Domestic exports are calculated during the IMPLAN model creation and are not part of the database.
The national transactions matrix is based on the most current BEA National Benchmark Input-Output Model. It is resectored to IMPLAN industrial sectoring. We use our IMPLAN data for the current year to update the most recent National Benchmark study.
IMPLAN multipliersThe notion of a multiplier rests on the di� erence between the initial e� ect of a change in fi nal demand and the total e� ects of that change. Total e� ects can be calculated either as direct and indirect e� ects, or as direct, indirect, and induced e� ects. Direct e� ects are production changes associated with the immediate e� ects or fi nal-demand changes. Indirect e� ects are production changes in backward-linked industries caused by the changing input needs
3 The IMPLAN sector scheme is now currently based on NAICS defi nitions and is revised as necessary after each fi ve-year economic census is released.

© 2017 IHS 47 February 2017
IHS Economics | The Market Size and Economic Contributions of the Off -Highway Equipment Industry
of directly a� ected industries (for example, additional purchases to produce additional output). Induced e� ects are the changes in regional household spending patterns caused by changes in household income generated from the direct and indirect e� ects.
Five di� erent sets of multipliers are estimated by IMPLAN corresponding to fi ve measures of regional economic activity: total industry output, personal income, total income, value added, and employment. For each set of multipliers, four types of multipliers are generated: Type I, Type II, Type SAM, and Type III.
Type I multiplierA Type I multiplier is the direct e� ect produced by a change in fi nal demand, plus the indirect e� ect divided by the direct e� ect. Increased demands are assumed to lead to increased employment and population with the average income level remaining constant. The Leontief inverse (Type I multipliers matrix) is derived by inverting the direct coe� cients matrix. The result is a matrix of total requirement coe� cients, the amount each industry must produce for the purchasing industry to deliver one dollar’s worth of output to fi nal demand.
Type II multipliersType II multipliers incorporate induced e� ects resulting from household expenditures from new labor income. The linear relationship between labor income and household expenditure can be customized in the IMPLAN Professional® software. The default relationship is PCE and total household expenditures. Each dollar of workplace-based income is spent based on the SAM relationship generated by IMPLAN. The second possibility is a Regional Input-Output Modeling System (RIMS II) style of Type II multiplier, where PCE is adjusted to represent only the spending of the disposable income portion of labor income. In this way, there is a direct one-to-one relationship to labor income and PCE. Then, a ratio that the user can specify is applied to convert total income to disposable income before the rounds of induced e� ects are calculated.
Type SAMType SAM multipliers are the direct, indirect, and induced e� ects, where the induced e� ect is based on information in the social account matrix. This relationship accounts for social security and income tax leakage, institution savings, and commuting. It also accounts for interinstitutional transfers. This multiplier is fl exible, in that you can include any institutions you want. In other words, if you want to create a model closed to households and state and local government, you can. If you select this option, an additional dialog box with be displayed allowing you to select the institutions you want to include.
Output multipliersThis report shows the total industry output multipliers and per capita personal consumption expenditures. Output multipliers can be used to gauge the interdependence of sectors; the larger the output multiplier, the greater the interdependence of the sector on the rest of the regional economy. A Type I entry represents the value of production (from direct and indirect e� ects) required from all sectors by a particular sector to deliver one dollar’s worth of output. Type II, SAM, and III add in the induced requirements.
Example: If a Type I multiplier for the dairy farm industry is 1.0943, for each dollar of output produced by the dairy farm sector, 0.0943 dollar’s worth of indirect output is generated in other local industries. If the Type SAM dairy farm multiplier is 1.3140, 0.3140 dollar of indirect and induced output is generated in other local industries. The induced output would be 1.3140 minus 1.0943, or 0.2197 dollar for each dollar of output produced by the dairy farm sector.

February 2017 48 © 2017 IHS
IHS Economics | The Market Size and Economic Contributions of the Off -Highway Equipment Industry
Labor income multipliersThe labor income multiplier report shows the direct, indirect, and induced employee compensation plus proprietor income e� ects generated per dollar of output. The Type I personal income multiplier is the direct and indirect employee compensation plus proprietor income divided by the direct income. The Type II, Type SAM, and Type III multipliers add the induced e� ects component.
Example: If the Type I multiplier for the dairy farm sector is 1.4761 and the Type SAM multiplier is 2.7067, then for each dollar of direct income generated by this industry, 0.4761 dollar of indirect and 1.2306 dollars of induced income are generated.
Employee compensation multipliersEmployee compensation represents all payroll costs of wage and salary workers. The Type I, Type SAM, Type II, or Type III total income multipliers are listed in this report, along with the direct, indirect, and induced total income e� ects generated from the production of one dollar’s output.
Proprietor income multiplierProprietor income is the income earned by the owners of a private, nonincorporated business—i.e., the self-employed. The Type I, Type SAM, Type II, and Type III total income multipliers are listed in this report, along with the direct, indirect, and induced total income e� ects generated from the production of one dollar’s output.
Other property-type incomeOther property-type income represents corporate income, rental income, and interest. The Type I, Type II, Type SAM, and Type III total income multipliers are listed in this report, along with the direct, indirect, and induced total income e� ects generated from the production of one dollar’s output.
Value-added multipliers Type I, Type II, Type SAM, and Type III value-added multipliers are listed in this report, along with the direct, indirect, and induced value-added e� ects generated from the production of one dollar of output. Value-added includes employee compensation, proprietary income, other property-type income, and indirect business taxes.
Employment multipliersType I, Type II, Type SAM, and Type III employment multipliers are listed in this report along with the direct, indirect, and induced employment e� ects from the production of $1 million of output. Employment is in terms of full-time and part-time jobs.
Example: If a dairy farm Type I employment multiplier is 1.1158, for each job created directly by the dairy farm industry, 0.1158 job is created indirectly.


IHS Customer Care:[email protected]: +1 800 IHS CARE (+1 800 447 2273) Europe, Middle East, and Africa: +44 (0) 1344 328 300 Asia and the Pacific Rim: +604 291 3600