Embed Size (px)
Citation preview
Economic Project
Appraisal Manual for
Kenya
2021
By ICON and PIM Consulting Group
Final version
July 2021
Xxxx

1
ABBREVIATIONS/ ACRONYMS
ADSCR Annual Debt Service Coverage Ratio
ANPC Annualized Net Present Cost
ANPV Annualized Net Present Value
AR Accounts Receivable
AP Accounts Payable
BAC Budget at Completion
BAU Business-As-Usual
BCR Benefit–Cost Ratio
CAPEX Capital Expenditures
CBA Cost-Benefit Analysis
CEA Cost Effectiveness Analysis
CPB Cost Per Beneficiaries
CPM Critical Path Method
CSCF Commodity Specific Conversion Factor
EAC East African Community
Ee Economic Exchange Rate
EIA Environmental Impact Assessment
Em Market Exchange Rate
ENPV Economic Net Present Value
EOCK Economic Opportunity Cost of Capital
EXT Externalities
FEL Front End Loading
FEP Foreign Exchange Premium
FF Finish to Finish
FNPV Financial Net Present Value
FS Feasibility Studies
FtS Finish to Start
GDP Gross Domestic Product
GoK Government of Kenya
IRR Internal Rate of Return
KES Kenyan Shillings

2
KPI Key Performance Indicators
LFA Logical Framework Approach
LFM Logical Framework Matrix
LLCR Loan Life Coverage Ratio
MCA Multi-Criteria Analysis
MDA Line Ministries, Departments and Agencies
M&E Monitoring and Evaluation
NGOs Non-Government Organizations
NPC Net Present Costs
NPP National Priority Programs
NPV Net Present Value
NTP Premium on Non-tradable Outlays
OER Official Exchange Rate
OPEX Operational Expenditures
O&M Operating and Maintenance
PACM Project Alternatives Comparison Matrix
PAT Project Alternatives Table
PCN Project Concept Note
PEP Project Execution Plan
PFS Pre-Feasibility Studies
PIM Public Investment Management
PIP Public Investment Plan
PPP Public Private Partnership
PDM Precedence Diagramming Method
PtW Permits to Work
RBS Resource Breakdown Structure
ROI Return on Investment
SCF Standard/Generic Conversion Factor
SDR Social Discount Rate
SER Shadow Exchange Rate
SERCF Shadow Exchange Rate Conversion Factor
SF Start to Finish
SIA Social Impact Assessment
SMART Specific, Measurable, Achievable, Relevant, Time-bound

3
SOCC Social Opportunity Cost of Capital
SOE State Owned Enterprises
SPE Strategic Planning Exercise
SPNT Shadow Price for Non-Tradable
SPNTO Shadow Price for Non-Tradable Outlays
SRTP Social Rate of Time Preference
StS Start to Start
SWOT Strengths, Weaknesses, Opportunities and Threats
SWR Shadow Ware Rate
SWRCF Shadow Wage Rate Conversion Factor
UDR Utility Discount Rate
VAT Value Added Taxes
WACC Weighted Average Cost of Capital
WAM Weighted Average Method
WBS Work Breakdown Structure

4
TABLE OF CONTENTS
1 THE BENEFITS OF INVESTING IN THE INVESTMENT PROCESS ............ 12
2 THE KEY FEATURES FOR AN EFFECTIVE PIM SYSTEM .......................... 14
3 THE PROJECT LIFE CYCLE ......................................................................... 17
3.1 THE PLANNING AND PROJECT IDENTIFICATION PHASE ........................... 22
3.2 THE PRE-INVESTMENT PHASE ...................................................................... 23
3.3 THE INVESTMENT PHASE .............................................................................. 26
3.4 THE OPERATION AND EX POST EVALUATION PHASE ............................... 27
4 THE CONCEPTUAL FRAMEWORK .............................................................. 29
5 THE PROJECT APPRAISAL: A STEP-BY-STEP METHODOLOGY ........... 39
6 THE PROJECT CONCEPTUALISATION ...................................................... 42
6.1 THE ANALYSIS STAGE ................................................................................... 42
6.1.1 Stakeholder analysis ..................................................................................................... 43
6.1.2 How to Make a Stakeholder Management Plan ............................................................ 47
6.2 THE STRATEGIC PLANNING STAGE ............................................................. 48
6.2.1 The Strategic Plan ......................................................................................................... 49
6.2.2 Establishing a strategic planning process ..................................................................... 50
6.3 THE PROBLEM ANALYSIS .............................................................................. 54
6.3.1 Building the Problem Tree ............................................................................................. 57
6.3.2 Building the Solution Tree ............................................................................................. 66
6.3.3 Objective analysis .......................................................................................................... 71
6.3.4 Strategic option analysis (identify and choose project alternatives) ............................. 72
7 THE PROJECT PRELIMINARY SCREENING ............................................... 85
7.1 THE CONCEPTUAL APPROACH .................................................................... 87
7.2 PROFILING ....................................................................................................... 89

5
7.2.1 The general evaluation .................................................................................................. 90
7.2.2 The problem identification ............................................................................................. 90
7.2.3 The project justification and the strategic case ............................................................. 90
7.3 PRELIMINARY ANALYSIS ............................................................................... 91
7.3.1 Demand analysis ........................................................................................................... 91
7.3.2 Technical and engineering analysis .............................................................................. 91
7.3.3 Legal and institutional analysis ...................................................................................... 91
7.3.4 Implementation cost estimates ...................................................................................... 92
7.3.5 Benefits analysis ............................................................................................................ 92
7.3.6 Preliminary financial viability ......................................................................................... 92
7.3.7 Preliminary economic viability ....................................................................................... 93
7.3.8 Preliminary distributional impacts .................................................................................. 93
7.3.9 Preliminary PPP analysis .............................................................................................. 93
7.3.10 Preliminary environmental impacts ........................................................................... 93
7.3.11 Preliminary risk analysis ............................................................................................ 94
7.4 VIABILITY ......................................................................................................... 94
7.4.1 Budgetary impact ........................................................................................................... 94
7.4.2 Implementation needs analysis ..................................................................................... 94
7.4.3 Potential constraints ...................................................................................................... 94
7.4.4 Affordability considerations ........................................................................................... 95
7.4.5 Other/external impacts .................................................................................................. 95
7.5 THE APPRAISAL CRITERIA TOOL ................................................................. 95
8 THE INTEGRATED PROJECT APPRAISAL ............................................... 103
8.1 THE INTEGRATED ANALYSIS ...................................................................... 105
8.2 THE THEORETICAL PRINCIPLES ................................................................. 112
8.3 THE PROJECT OBJECTIVES AND SCOPE .................................................. 116
8.4 IdentifyING AND SELECTING PROJECT ALTERNATIVES .......................... 118
8.5 THE DEMAND ANALYSIS .............................................................................. 123
8.6 THE MODULE ANALYSIS .............................................................................. 130
8.7 CONDUCTING THE FINANCIAL ANALYSIS ................................................. 142
8.8 CONDUCTING THE ECONOMIC ANALYSIS ................................................. 178

6
8.9 THE ECONOMIC PRICES ............................................................................... 181
8.10 THE RISK ANALYSIS ..................................................................................... 206
8.11 ASSESSSING AFFORDABILITY AND SUSTAINABILITY ............................. 211
8.12 IDENTIFICATION OF PREFERRED PROJECT ALTERNATIVE AND
RECOMMENDATIONS TO DECISION-MAKERS...................................................... 221
9 THE PROJECT IMPLEMENTATION AND THE EX-POST PROJECT
EVALUATION ..................................................................................................... 223
9.1 THE PROJECT IMPLEMENTATION ............................................................... 223
9.2 THE SCOPE MANAGEMENT ......................................................................... 231
10 PROJECT DECISION CRITERIA ............................................................. 247
10.1 THE INFRASTRUCTURE SECTOR PROJECTS AND THE COST BENEFIT
ANALYSIS ................................................................................................................. 247
10.2 THE SOCIAL SECTOR PROJECTS AND THE COST EFFECTIVENESS
ANALYSIS ................................................................................................................. 250
10.3 THE REFERENCE ANALYSIS PERIODS ....................................................... 255
10.4 TIME DIMENSION OF A PROJECT ................................................................ 257
10.5 THE DISCOUNT RATE ................................................................................... 259
10.6 THE EVALUATION CRITERIA ........................................................................ 260
11 FINAL COMMENTS .................................................................................. 270
12 REFERENCES .......................................................................................... 272

7
BACKGROUND
A very important aspect of public investment is to determine its contribution to the society´s
welfare and several questions arise: How should public sector investment proposals be
analysed? What is the aim of the project? What are the expected results? What happens if
the project is implemented or not? What are the investment alternatives that are available?
Does the project have separable components? Are there economically suitable alternatives
in terms of growth and distribution? Who benefits and who pays the costs of the project?
Who are the stakeholders that may affect the investment decision or the performance of
the project? Should the analysis be done based on distributional considerations? Is it
appropriate to continue or discontinue ongoing projects? Which is the set of alternatives
that optimize the use of the projected budgetary constraints? Is the project financially
sustainable (feasible)? What is the environmental impact of the project? What are the
sources and magnitudes of the risks? And finally, the big question: is the project the most
desirable relative to others competing for the same budget? (Belli, P., et.al, 2001). This
document is an effort to answer those questions and to help technical units to provide the
authorities with sufficient good project proposals for them to select the most convenient.
In addition, many arguments for fiscal space are explicit about the need to boost public
investment management in physical assets such as public infrastructure and social sector
(i.e., Health, Education, Social Protection etc.) that contribute to improvements in human
capital. In this context, several core challenges arise: i) Weak project selection that does not
transform into productive assets; ii) Unrealistic time schedules in ex-ante appraisal and
consequent delays in completion resulting to cost overruns; iii) Chronic under-execution of
capital projects; iv) Confusion and duplication of roles, responsibilities and processes; v)
Lack of objective criteria for project selection; vi) Shortage of project appraisal, procurement
and management skills; vii) Incentives for project managers to underestimate risk, and viii)
potential difficulties on the coordination activities between different levels of government.
To estimate the contribution of the projects, it is then necessary identify, measure and assess
their costs and benefits. Identification of costs and benefits is to determine, qualitatively, the
positive and negative impacts generated by the project. Of course, there will be some benefits
and costs that can be identified but are unlikely to be quantified and valued. However, it
shall be the duty of the evaluator to rigorously conduct the process, to identify all the effects
and impacts of projects.

8
In this regard, Kenya is strengthening its framework for managing public investments to
improve the efficiency and the effectiveness of capital expenditures, following the expected
goals established on Vison 2030 regarding the needs to implement an holistic PIM System
in the country. Following this principle, standardization and systematization of public
investment processes have demonstrated important advantages in terms of increasing the
profitability and productivity of public investment. In a context where public investment
projects must contribute to economic and social development, the integrated project
appraisal is a key technical tool for decision making, helping to ensure the efficient allocation
of public resources when there is budget constraint. Then, evaluation tools are essential for
making decisions to ensure the highest social return. Comparing total project costs and
benefits allows measuring the project contribution to the country´s wealth. Thus, project
appraisal helps to: i) Identify those criteria for investment policies that maximize social
welfare; ii) Stop the "bad projects" and promote the "good" projects; iii) Decide if the project
is better implemented by public or private sector; iv) Estimate the project fiscal impact; v)
Establish agreements for desirable cost recovery; vi) Assess the project impact on the
environment, regional development and poverty, among other.
A formal system of project appraisal provides the basis and conditions for the government
to forward only those projects that demonstrate the most economical and attractive
initiatives for society. A formal system of project appraisal allows for the transformation of
"investment ideas" into "investment projects" and, afterwards, into "investment decisions".
This system should be designed to put projects through the Project Life Cycle; this means1:
i. Project identification and concept planning;
ii. Project Pre-feasibility and pre-appraisal;
iii. Project Feasibility and appraisal;
iv. Project selection for Budgeting;
v. Project implementation, monitoring, evaluation and reporting;
vi. Project closure, sustainability and ex-post evaluation.
The project development cycle is a continuous and dynamic process with a great deal of
overlap, interaction and feedback among its various phases. There is considerable
1 In accordance to the Circular 16/2019 on PIM Guidelines for National Government Entities.

9
interaction between the implementation phase and the evaluation phase as the ex-post
evaluation lessons are constantly used to suitably modify the Project's operations.
This manual is an effort to help technical teams to provide decision makers a sufficient
number of good projects, in order to select those with high economic and social returns.
From this perspective, the purpose of this Manual is to assist the GoK to prepare and
appraise investment projects, promoting economic and social well-being. In this regard, this
document is intended for different types of users. First, it serves as a guide to public sector
managers/authorities who are responsible for making public sector investment decisions.
This group includes independent project appraisers within the National Treasury and
Planning. Other users are all project analysts in Line Ministries, Departments and Agencies
(MDAs), who are involved in the project preparation, appraisal and implementation of
projects.
The manual´s structure takes into account the international best practices and the review of
textbooks and methodological guides from different countries and international
organizations. In addition, this manual is complementary to the Circular 16/2019 on PIM
Guidelines for National Government Entities2. Whereas this PIM Manual is a more technical
instrument to be used as a reference guide for project practitioners across government. A
Manual goes beyond a guideline explaining HOW to do the jobs and functions described in
the guideline. A PIM Manual provides general tools for project preparation, appraisal,
screening, selection, implementation, and ex-post evaluation for any public investment
project3. All these different types of documents complement and reinforce each other and,
together with training, help guide public servants in improving public sector investment
decisions.
2 The official document that describes the PIM framework regarding the different participating entities and their
roles and responsibilities; it describes the organizational structures, the processes and time frames; it explains
the various committees and their jobs and functions, etc., to provide guidance and enhance coordination and
compliance. Guidelines is an administrative and management documents that deal with procedures and explain
WHAT is to be done, WHEN and WHOM.
3 Project-specific methodologies are also technical documents that go beyond a manual explaining the
specificities of certain types of projects—for example, health infrastructure projects, or roads, or railway projects,
etc.

10
The manual is presented in 2 main parts: i) The Public Investment Management, and ii)
Project appraisal tool. Two case studies are also presented: one focused on the application
of a cost-benefit approach on an energy-generation infrastructure project, and one dedicated
to understating the application of a cost-effectiveness and a cost-efficiency approach in the
context of a social project case study.

11
PART I The Public Investment Management

12
1 THE BENEFITS OF INVESTING IN
THE INVESTMENT PROCESS
In public policy, governments face the problem of allocating scarce resources (natural,
human and capital) towards infinite uses to satisfy specific needs and obtain the maximum
social and economic benefit. To ensure that only those capital investments that make
efficient use of scarce economic resources are undertaken, it is necessary to adopt a set of
suitable criteria. The economic and social objectives of project appraisal are identifying
and promoting the approval of those capital investments that use resources efficiently,
promoting sustainable development. Project appraisal allows decision-makers to use a
comprehensive method with common patterns to compare projects that compete for
resource allocation in the context of society's preferences and with the premise of meeting
the objectives of economic growth and better distribution of national income.
In general terms, infrastructure is considered a subset of investment, encompassing the
physical assets required to deliver the services needed to support economic activity. As
such, Kim et al. (2020) identifies key characteristics that distinguish infrastructure from
other types of capital. First, infrastructure investments are often large, capital-intensive
projects. Second, they tend to have high up-front costs, but the benefits or returns accrue
over very long periods, often many decades. Third, infrastructure investments can
generate positive externalities so that the social return to a project can exceed the private
returns it can produce for the operator. For these reasons, infrastructure has historically
been provided by the public sector, or recently, by public-private partnerships agreements.
Ideally, government investment decisions should be in the public interest (effectiveness in
public choices). In the public sector, there is a vast number and diverse range of potential
uses of resources. The efficient use of resources has a significant impact on citizens'
welfare. As resources are finite, a decision to implement one proposal may preclude
implementing others. There are always alternatives that need comparison even if the
choice is between "doing something" and "doing nothing" or "doing the minimum". In
considering a spending proposal, decision-makers need to be assured that society's overall
welfare is raised as a result of the proposed action. This implies that resources should not
be reallocated from the private to the public sector unless it can be shown that some

13
projects that are likely to make residents better off are not being undertaken by the private
sector.
An effective appraisal can support appropriate choices of outputs and designs and reduce
the risk of high costs of construction and operation (The World Bank, 2013). Rigorous
project identification and selection systems act as screening mechanisms to prevent
inappropriate and inefficient projects from getting into the project cycle and gaining
political support and momentum, making them difficult to stop at later stages.
Improvements in the quality of public investment processes related to the design,
implementation and evaluation of public investment projects can generate substantial
benefits for the country. In this regard, the economic appraisal helps in the design and
selection of projects that contribute to a country's welfare. Economic analysis is most
useful when used earlier in the project cycle to discover bad projects and worthless project
components. Also, it provides public authorities with a large portfolio of good investment
projects so that they can choose those most likely to benefit society as a whole. Investment
projects must comply with quality standards in terms of formulation and evaluation.
Projects should be controlled and monitored according to uniform and transparent rules
and with adequate participation of all stakeholders. In this sense, the economic analysis
contributes to an increase in the general welfare of the community.
Any public investment allocation decision will necessarily involve making choices between
alternative approaches to achieving a specific policy objective and the ranking of priorities.
The public sector faces the decision to determine the set of projects that will optimise their
budget constraint. In seeking to solve these issues, the public sector must maximise
collective welfare, subject to the achievement of growth and equity goals. Efficiency
Approach and Cost-Benefit Analysis (CBA) are economic appraisal tools to compare costs
and benefits associated with alternative approaches. The Efficiency Approach provides the
technical framework, and CBA gives a valuable basis for decision-making and assists in
the systematic appraisal and management of projects. Both attempts to evaluate the
proposal from society's perspective by placing all the costs and benefits on a comparative
monetary scale.

14
2 THE KEY FEATURES FOR AN
EFFECTIVE PIM SYSTEM
The efficient implementation or execution of a project is critical to ensure that investment
flows become productive assets. In a guidance note on PIM issued by the World Bank,
Rajaram et al. (2014) describe the eight key "must-have" features of a well-functioning
PIM system.
1. Strategic investment guidance, Project concept development, and pre-
appraisal screening. Overall strategic direction to guide sector-level decision-
makers and preliminary screening to ensure that project concepts meet
minimum criteria of consistency with the government's strategic objectives and
economic classification.
2. A formal project appraisal process. A regulated set of project preparation
steps: pre-feasibility and feasibility studies, including preliminary design;
environmental and social impact assessments that must be completed before a
project can be approved for funding; and methods appropriate to the technical
capacities, scale and scope of the Project.
3. Independent review of the appraisal to counter optimism bias—
overestimation of demand and underestimation of costs
4. The final decision on project selection and budgeting using a well-
managed budget process, linking appraisal and selecting public investment
projects to the budget cycle, even if the project evaluation cycle is on a different
timetable; verification of project eligibility and priority; scrutiny of forwarding
costs and funding during budgeting.
5. Efficient project implementation. Scrutiny for implementation realism,
including organisational arrangements, procurement planning, a timetable;
adequate monitoring systems; and systems for managing total project costs.
6. Ability to make project adjustments. Flexibility to allow changes in the
disbursement profile to consider changes in project circumstances. Including
the discontinuation of non-performing projects.

15
7. Provision for sustainable operation of facilities. Processes to ensure
that a new facility is ready for operation and that the intended services can be
delivered on a sustainable basis; requires effective hand-over of management
responsibility for operation and maintenance and upkeep of robust and up-to-
date capital asset registers.
8. Basic completion review and ex-post evaluation. A systematic review
of all projects upon completion to assess whether a project was delivered as
specified, on time, and according to budget, and introducing a more
sophisticated ex-post evaluation to evaluate the Project's outputs and
outcomes against objectives established in the design.
Concerning the "8 must have" features, the emphasis is on the fundamental processes and
controls (linked at appropriate stages to broader budget processes) that are likely to yield
the utmost assurance of efficiency in public investment decisions. The approach does not
seek to identify best practice; instead, it aims to identify the bare-bones institutional
features that would minimise significant risks and provide an effective systemic process
for managing public investments.
Moreover, it is essential to note that any formal system of project appraisal should be
tailored to country circumstances. Even when it is convenient to learn from good foreign
experiences, the system should consider local and country characteristics.

16
Figure 1 - Diagram of the eight minimum features of a PIM
Source: based on Rajaram et al. (2010)
The PIM Manual goal shall tackle stages 1 to 3, referred to efficient project preparation,
appraisal, prioritisation, and selection.
A comprehensive and compulsory PIM System regulatory framework shall, on the one
hand, compel all stakeholders to follow the due process of the pre-investment stage,
namely the identification, preparation, appraisal, prioritisation and selection of their
investment projects.
1. Investment guidance,
project development &
preliminary screening 2. Formal
project appraisal
3. Independent
review
4. Project selection
and Budget integration
5. Project Implementation
6. Project adjustment
7. Facility operation
8. Basic completion review and evaluation
The eight must haves
of a public investment
management system

17
3 THE PROJECT LIFE CYCLE
Rigorous project identification and selection systems act as a screening mechanism to
prevent inappropriate and inefficient projects from getting into the project cycle, gaining
political support and momentum that make them difficult to stop at later stages. An
integrated project management system allows slowing down the investment decision
process by introducing gradualism through a mandatory project life cycle. This concept is
represented in Figure 1 - The PIM project cycle.
Figure 1 - The PIM project cycle
Source: based on international best practices
As the project moves through its lifecycle, managerial activities' focus shifts from planning
& preparation to executing & controlling activities. It should be emphasised that these
phases only represent a natural order in which projects are planned and carried out. Also,
none of these phases becomes final until the Project approaches its termination stage.
• Idea and profile
• Pre feasibility• Feasibility
Pre InvestmentPhase
• Detailed design
• Implementation
Investment Phase• Operation and
execution
Operation and Ex Post Phase
Ex Ante EvaluationMonitoring & Follow
UpEx Post Evaluation
• Public Investment Needs
• National Development Plan
Planning
Planning and Idetification Phase
Approval

18
In a complete formal PIM System, the selection framework for projects considers
the application of different sequential filters (or stage gates) at the pre-investment
phase:
+ The Project Concept Note (PCN) provides the qualitative validation and
classification of project ideas/proposals, to determine if the investment profiles are
consistent with the objectives stated in the NATIONAL DEVELOPMENT PRIORITIES
(this means, Medium Term Plans, Sector and Strategic Plans, MTP3, Vision 2030 and
the Big 4). The project sponsors must present the PCN before the First Stage Gate. If
the project is approved at this stage, this means that funds can be used to conduct a
Pre-Feasibility Study (PFS).
+ The Pre-Feasibility Step it involves the quantitative evaluation of the projects
through PFS. A PFS is a rigorous quantitative assessment, including technical, financial
and economic (costs and benefits) analysis of a project using secondary sources of
information. The project sponsors must present the project PFS before the Second
Stage Gate. If the project is approved at this stage, this means that funds can be used
to conduct a Feasibility Study (FS).
+ The Feasibility Step involves the quantitative evaluation of the projects through
FS. A FS is like a PFS, except that all the data and prices used in this appraisal are
primary sources, therefore the results are much more accurate. The project sponsors
must present the project FS before the Third Stage Gate. If the project is approved at
this stage, then the project is awarded a “Seal of Quality”. This means that it is fit to
compete for budget funds.
+ The Selection Stage – Budget Allocation for investment projects is a political
decision, but nonetheless it should be a well-informed one. As a part of the analysis, a
preliminary determination on the affordability of the project should be made. If
relevant and attainable, the analysis should present the expected implementation
options available, including potential risk allocation and public-private partnership
financing options.
Following approval of the project, the financing arrangements are finalized and the
project is included in the budget proposal. For international resource-funded projects,
this involves negotiating a financing agreement; for domestically financed projects, it
requires earmarking funding for the full investment cost over the lifetime of the project.
These previous filters – stage gates, acting sequentially, establish a Formal Framework
that contributes to the implementation of the NATIONAL DEVELOPMENT
PRIORITIES (the Medium Term Plans, Sector and Strategic Plans, MTP3, Vision 2030
and the Big 4). Figure 2 below shows the framework a schematic outline.
In this ideal framework, the ex-ante project evaluation based on CBA criterion is a
prerequisite to making sound investment decisions. Benefits and costs can be
quantified and measured by assigning adequate measures and units to benefits, after
which, ideally, they are given a monetary value. Project appraisal activities may be
outsourced, depending upon the capacity resident in any given line ministry or public
independent unit. In any case, these institutions must provide for project planning and
studies within their current budget baselines, including, as necessary, funding for
outsourced project appraisals.

19
Rigorous project identification and selection systems act as a screening mechanism to
prevent inappropriate and inefficient projects from getting into the project cycle,
gaining political support and momentum that make them difficult to stop at later
stages. As was mentioned, an integrated PIM System allows the investment decision
process to be slowed down, by introducing gradualism via a mandatory project lifecycle
that includes three stage gates.
Figure 2 - Stage Gates and the Project Cycle
Source: Based on international best practices.
The decision nodes
The PIM System have been designed to impose projects to go through the Project Life
Cycle, starting from the identification of a project idea/concept to the final operation and
ex-post evaluation stage. In this context, the project cycle can be seen as an assembly-line
production process but, there is a lot of interaction between project designers and project
evaluators and lots of feedback. This interrelationship should be particularly strong
among the phases preceding the implementation. There is a considerable interaction
between the implementation phase and the evaluation phase as the lessons of ex-post
evaluation are constantly used to suitably modify the operations of the project.
Figure 3 shows the interaction between project phases, stressing two ideas; i) the deeper
a project is allowed to go down the project-cycle; it will become increasingly more difficult
to stop if, indeed it happens to be a bad project. Even when the project idea stage is not
Project Identification and
Conceptual Planning
Project Pre-Feasibility & Pre-
Appraisal
Project Feasibility & Appraisal
Project Selection for Budgeting
Project Implementation,
Monitoring Evaluation and
Reporting
Hand-over, Operation
Initiation, Ex-post evaluation
Stage Gate
1
Stage Gate
2
Stage Gate
3
Proyect go/no-goConcept Note
Project go/no-goPre-Investment Decision
Authorization for Execution
Economic Decision Engineering / Technical Decision Operational Decision
Hand Over
Decision Stage Gates
Rejected / filed
Re-cycle
Continue
Authorization for Operation
Stage Gate
4
Budgetary Decision Project Management Decision
Project go/no-goInvestment Decision

20
formally part of the PIM process, obviously is the initial point for project preparation; the
project idea es entirely responsibility of MDAs.
Figure 3 - Interaction between Pre-investment, Investment and Operation
Phases
Source: international best practices.
Therefore, the traffic lights in the diagram become smaller, on purpose, the more a project
advances in the cycle there is less capacity to stop it; ii) it is important to effectively impose
these traffic lights as effective decision nodes. This means that there must be a decision to
reject the project at that stage, or a decision to invest more money in order to eliminate
more uncertainty, or a decision to postpone or wait.
Project Idea
Project Concept
Note
Pre-Feasibility
Feasibility
Detailed Design & Implementation / Construction
Operation
RejectWait
Reject
Reject
Wait
Wait
Implementation
Go deeper
Go deeper
Decision Nodes or
Toll Gates
Based on the MDAs
diagnosis

21
The Front End Loading
The Front-End Loading (FEL) concept is widely applied in investment projects all
over the world and it is also used in engineering design. The FEL states that the early
stages (or the front end) in a project cycle are the ones where the potential to add
value to the project design is at its maximum, whereas the corresponding cost is at
its minimum (Figure 5).
From the diagram it becomes clear that the early stages in a project are the ones were
the potential to add value to the project is at its maximum, whereas the cost to do it
is at its minimum. Because it is in the first phases of an industrial project when the
capacity to influence in its design is maximum and the costs to make any changes are
minimum. In the context of a PIM System, the FEL introduces decision nodes as
milestones within the project cycle; a formal decision has to be taken before the
project can move on to the next phase.
As it can see from the figure, at the early stages (or the front end) in a project cycle
are the ones where the potential to add value to the project design is at its maximum,
whereas the corresponding cost is at its minimum. Therefore, it is very efficient to
intervening the project design as early as possible before project execution and
operation.
Figure 4 - The FEL
Source: international best practices.
TimePFS FS Design Implementation Operation
Ability to influencethe project
Ability to influence
Cost of changingthe project

22
3.1 THE PLANNING AND PROJECT IDENTIFICATION PHASE
The Planning and Project Identification is the first step of the project cycle, and it is
concerned with identifying potential public sector project ideas and initiatives. The
purpose is to establish the fundamental desirability of a project and identify high-priority
projects that fall within the public sector's responsibility. Projects are a valuable tool for
directing investments into the priority sectors of an economy.
The process of project ideas identification is complex. Projects are brought forward, one
at a time, and are generally identified with their sponsors rather than part of a
comprehensive economic strategy. Over the years, however, many countries have
developed their planning capability, and the process of project ideas identification has
become more systematic.
In a Strategic Planning Exercise (SPE), the emphasis is on "investment efficacy" or
spending on the right public assets. Spending should promote achieving strategic
priorities, and resources should be allocated only to those best aligned with the
government's objectives. In this sense, the SPE performed at different levels are top-down
processes that produce crucial deliverables, buy-in and a given consensus on the National
and Sub-National Strategic Plans, Sector Development Plans and others. Therefore, the
strategic fit of projects ensures the strategic alignment of investment projects with
national, sub-national and sector strategies. The specific objectives of every investment
project should consequently be designed in such a way that they support the overall
national development agenda. The SPE and Economic Planning are both necessary and
complementary, and they should not be disconnected.
The Planning and Project Identification Step introduces the Project into the pre-
investment phase. As a result of this stage, the analyst should:
• Discard infeasible project alternatives
• Select the feasible project alternatives and possibly advance to the next step (i.e. the
pre-feasibility study)
• Or wait or postpone the solution to the problem while the authority makes a decision.
The project format is a kind of analytical tool in its own right that facilitates planning for
economic growth and development in the country or the region. The main advantage of

23
casting investment decisions into a project format is that it enables the planner to establish
a framework for analysing information in a more systematic procedure.
Log-Frame Approach (LFA) and Key Performance Indicators (KPIs). The
generation of project ideas is typically left to the sectors; this is the responsibility of
each line ministry and independent public units. Any project
formulating/sponsoring agency must first identify the problem that gives rise to a
given project idea. To do this, they must follow the LFA to include the overall
strategic objectives it is trying to accomplish. Then specify the Project's purpose
and expected results and propose a set of objectively verifiable KPIs that will
measure those impacts. Problem identification should conclude with a literal
definition of the problem under scrutiny.
The Project Concept Note (PCN) is an analytical tool that facilitates the task of
planning for economic growth and development. The main advantage of casting
investment decisions into a project format is that it enables the planner to establish a
framework for analysing information in a systematic procedure. The PCN assist economic
entities to prepare public investment proposals in a consistent and comprehensive
manner, and will enable economic entities, to prioritize competing projects, in the context
of the economic entity´s strategic planning and budget preparation process.
Based on the results of the PCN assessment, line ministries and other public agencies, may
include projects as new proposals in their draft strategic plans and in the reconciliation
process.
3.2 THE PRE-INVESTMENT PHASE
The Pre-investment phase includes the following steps the project idea and profile
definition, the pre-feasibility studies and, subsequently, the feasibility studies. The idea
and profile definition are the first steps of the pre-investment phase. It is concerned with
establishing a project's fundamental desirability and identifying high-priority projects that
fall within the public sector's responsibility. The type of projects that qualify for being
placed in this category will largely depend upon the economy's level of development.
The project idea and profile definition step should be followed by the PFS and, afterwards,
the FS. The PFS is the first of the two components of what has been traditionally known
as the project's appraisal phase. Pre-feasibility is the first attempt to examine the overall
potential or viability of the Project. All the data and information gathered previously

24
during the project formulation/preparation step will be used in this first appraisal step.
Therefore, the pre-feasibility study is the most critical step within the entire project cycle
because it culminates all the preparatory work. It provides a comprehensive review of all
aspects of the project before a final decision about its viability.
Having identified and thoroughly evaluated the alternatives that may provide a solution
to the identified need, it is important to quantify the cost of the shortlisted alternatives
that more likely will provide a complete or partial solution, in order to select a preferred
option for funding; i.e. the preferred alternative. The aim is to identify the best solution
that will meet the criteria given any constraints the institution may be facing. The result is
a clear reasoning as to why and how the preferred alternative was chosen. The preferred
alternative is the option that meets the project objectives most economically.
At this point the cost estimates should be known with a high level of accuracy, and the
sources and nature of financing identified. It is important that a conditional approval of
the project be given before the detailed design work is completed. The detailed design of
the project will involve substantial financial outlays. A preliminary design criterion
must be established when the project is identified and appraised but usually expenditures
on detailed technical specifications are not warranted at that time.
After all the pre-feasibility studies have been completed, the Project must be examined
through a FS to see if it promises to meet the financial and economic criteria that the
government has set for investment expenditures. The feasibility is the second and final
part of the appraisal of a project; its function is to improve the accuracy of crucial variables’
measures if the project shows potential for success. To improve the appraisal's accuracy,
more primary sources and research will have to be undertaken and perhaps a second
opinion sought on other variables. Since the estimates of costs and benefits may be subject
to substantial margins of error, an analysis should always be made about the sensitivity of
the Project's outcome to variations in the values of critical variables.
It is at the end of this stage that the most important decision has to be made, the decision
to approve the project or not: the final approval of the project should come after the
FS has been completed. It is much more difficult to stop a bad project after the detailed
and often expensive design work has been carried out at the next stage of project design.
Once sizable resources have been committed to prepare the detailed technical and
financial design of a project, it takes courage for public servants and politicians to admit
that it was a bad idea.

25
The pre-investment phase´s decision may be to provide funding, either through the
traditional fiscal budget, Public Private Partnership (PPP) or International Cooperation
(Grants and/or Loans), and to proceed to the execution of the project. The drafting and
negotiation of the legal documents are essential to ensure that the borrower and the
bankers are in agreement not only on the terms of financing but also on the broad
objectives of the project and the detailed schedule and specific activities necessary for
implementing it. Also, the formal approval will require the acceptance of funding
proposals and agreement on contract documents, including tenders and other contracts
requiring the commitment of resources.
The final approval of a project should come after the feasibility study has been
completed and if it has confirmed the project's economic attractiveness. At this point, the
cost estimates should be known with a high level of accuracy, and the sources and nature
of financing be identified. A conditional approval of the project must be given before the
detailed engineering design work is completed. The detailed engineering design of the
project will involve substantial financial outlays. Also, the formal approval will require the
acceptance of funding proposals and agreement on contract documents, including tenders
and other contracts requiring the commitment of resources.
The following results are expected at the end of the pre-investment phase:
• Preparation of detailed plans required to support the facility
• Indication of possible technical packages to be considered
• A more realistic appraisal of costs, schedule, and operational requirements
• Identification of areas where high risk and uncertainty exist, and further exploration
of those areas
• Determination of necessary support systems; and
• Identification and initial preparation of documents required to support the Project,
such as procedures, job descriptions, budget and funding papers
In this phase it is important to follow the proportionality criteria: resources spent on
appraising capital project proposals should be proportional to the likely project cost,
keeping in mind its nature and complexity.
The efficient implementation or execution of a project is obviously critical to ensure that
investment flows become productive assets for the country. The final investment decision
concludes the pre-investment phase.

26
s
The pre-investment phase
In summary, the following results are expected at the end of the pre-investment
phase: i) preparation of detailed plans required to support the project; ii) indication
of possible technical packages to be considered; iii) realistic assessment of costs,
time schedule, and operational requirements; iv) identification of areas where high
risk and uncertainty exist, and further exploration of those areas; v) identification
of human and other resources required for the project; vi) determination of
necessary support systems; and vii) identification and initial preparation of
documents required to support the project, such as procedures, job descriptions,
budget and funding papers.
It is important to mention that not all projects must go through all stages of the
pre-investment phase; it will depend on the degree of certainty that is reached in
each of these stages. As per requested by the PIM Regulation, all projects must start
with a PCN (however, small projects might not need pre-feasibility and feasibility
studies unless justified why). Obviously, in the case of complex projects (requiring
detailed engineering studies), it is necessary to go through all the phases and stages
of the project lifecycle.
3.3 THE INVESTMENT PHASE
Next in the Project's life cycle is the Project Investment Phase (project
implementation, execution and construction); during this stage, public investments take
place. The investment stage is the project-sponsoring agency's responsibility; the
concerned PIM Agency does not have a substantive role to play during this phase. The
purpose of project execution is to produce the Project expected deliverables and other
direct outputs. Typically, this is the phase where most of the budgetary resources are
disbursed.
During the project execution, the construction team utilises all the schedules, procedures,
and templates prepared and anticipated during previous steps and phases. Unanticipated
events and situations will inevitably be encountered, and the Project Manager and his
Project Construction Team will have to deal with them as they come up.
Once the project has been approved for implementation, the design task should be
completed in more detail. Project detailed design involves detailing the basic
programs; allocating tasks; determining resources and setting down in operational form
the functions to be carried out along with their priorities; the preparation of detailed
architectural design; engineering and/or specialties as deemed appropriate; and a
complete project execution plan. Technical requirements, such as manpower needs by skill

27
class should be finalized at this stage. Upon completion of the blueprints and specifications
for construction of facilities and equipment, operating plans and schedules, along with
contingency plans, must be prepared and brought together before the implementation
phase is entered.
Project implementation involves planning, procurement, fabrication, civil work
construction, installation, contract terms and conditions, to develop detailed schedules
and plans for making or implementing the product etc. During the project execution the
construction team utilizes all the schedules, procedures and templates that were prepared
and anticipated during prior phases. Unanticipated events will inevitably be encountered,
and the project manager will have to deal with them as they come up.
In addition, there is also another monitoring and control process in place that has to do
with budget execution. The Treasury ensures cash releases during the budget year
consistent with the efficient implementation of the capital investment budget and as well,
monitors the disbursement of project allocated funds and can also provide incentives and
penalties in order to avoid finishing the fiscal year having unused resources. At the end of
this phase, it is needed to apply performance tests, to hand in the as built drawings, to
proceed to close down, decommissioning and disposal, etc.
At the end of this construction phase, performance tests are needed, formal hand-over
procedures, as-built drawing, close down, decommissioning and disposal, etc.
3.4 THE OPERATION AND EX POST EVALUATION PHASE
The following and final phase in the project life cycle is the Operation and Ex-Post
Project Evaluation Phase. In this phase, the project evolves into its operational stage,
and it produces its final fully operational deliverables and economic benefits (e.g., services
of the new plant, product, system, etc.). The initial development period is when the
production capacity gradually builds up, and the final period is total operational capacity.
Implementation is a dynamic process in which everyone involved with the Project must
constantly respond to new problems or changing circumstances that may affect the
Project's outcome.
Once a project has been implemented (i.e., its construction phase has finished), the results
are revised, and cost deviations are analysed, assuming that the benefits are achieved. This

28
ex-post revision focuses on project management indicators like schedule, time of
construction, overall construction costs, quality, and technical specifications. Changes in
the expected economic criteria are explained according to higher investment costs, timing,
size, etc. This short-term ex-post evaluation focused solely on project costs, schedule
and checking the assumptions made during the project pre-investment stage.
After a reasonable period of operating the project, it is crucial to verify whether the
project's intervention solved the original problem. This process is known as mid-term
ex-post evaluation; this medium-term ex-post evaluation must not be confused with
the “mid-way” monitoring and evaluation process, which is done during the project
implementation as a part of the project monitoring and evaluation stage. This task is vital
because all projects face some implementation problems. The issues may arise either
because of some flaw or shortcoming in the project's planning or simply because of
changes in the economic and political environment. The holistic medium-term ex-post
evaluation or project impact appraisal determines if the Project has achieved its original
scope, goals, and purpose, as stated in its initial project Log Frame Matrix (LFM).
The objective of Ex-Post Evaluation is to determine the efficiency and efficacy of the
investment initiatives, through a feedback structure with management controls and
measurements of short, medium and long-term results of projects. summarize main steps
in the project life-cyle.
Figure 5 - Pre-investment, Investment and Operation Phases
Source: international best practices.
Pre-investment
Investment
Operation
Prepare, appraise and select projects from thefinancial ana economic point of view
Execute select and prioritised projects
Start-up and operate projects to generate outputs, outcomes and impacts (Project´s benefits)

29
4 THE CONCEPTUAL
FRAMEWORK
The economic analysis measures the changes in the wealth generated by a project.
However, economic analysis is concerned with society as a whole and not only with the
welfare of the owners of the project. Here, the starting point for economic analysis is the
incremental expected net cash flows to total capital from the financial analysis.
In the economic analysis the project is being examined from the entire economy's point of
view to determine whether or not its implementation will improve the economic welfare
of the country or of the province. In the economic appraisal benefits and costs are
measured from the point of view of the whole country or the entire region. Instead of
relying on market prices to measure the economic cost of expenditures, the economic
analysis estimates the economic prices of goods and services, foreign exchange, cost of
capital and labour.
The economic analysis
The economic analysis examines the project from the entire economy's point of view to
determine whether or not its implementation will improve the economic welfare of the
country. An economic appraisal is of exactly the same nature as financial analysis, except
that now the benefits and costs are measured in order to choose those projects that
maximize the welfare of the entire society. Therefore, another main difference should be
considered: the effects in a private (financial) evaluation do not take into account all the
relevant costs and benefits, such as externalities and intangible effects.
When markets for outputs and inputs are perfectly competitive and when there are no
other reasons for economic externalities to exist, market prices will measure economic
prices. Under these conditions, and where a project introduces only small changes in the
demand for its inputs and in the supply of its outputs, the financial analysis of a project
will serve as a good proxy for the economic analysis. Instead of relying on market prices
to measure expenditures and costs, as in the case of a financial appraisal, the economic
analysis requires the use of techniques to determine the economic prices of goods and
services, foreign exchange, cost of capital and labour. The true economic values of costs
and benefits are not reflected in market prices in the presence of various distortions such
as trade restrictions, price control, taxes, subsidies, and minimum wages.

30
Economic analysis requires some adjustments to estimate incremental economic benefits
from incremental cash receipts; and to estimate incremental economic costs from
incremental cash disbursements. These adjustments are based on the three basic
postulates of applied welfare economics (Harberger´s postulates).
The questions covering the economic appraisal of a project are as follows:
i. What are the magnitudes of the differences between the financial and economic
values of variables that are affected by government regulation and control or are
subject to taxes, tariffs, and subsidies?
ii. What are the magnitudes of the differences between the financial and economic
values of variables that are affected by other imperfections in the factor and
product markets (e.g., labour unions, lack of competition and restrictive trade
practices)?
iii. What relative degree of certainty can be placed in each of the above measurements
of economic externalities as compared to the estimates of financial expenditures
and revenues?
iv. When evaluated at a discount rate that reflects the relevant cost of capital to the
economy as a whole, does this project produce a positive economic net present
value?
v. In order for the appraisal to indicate that the project is economically viable, what
proportion of the more uncertain economic adjustments must be included?
To conduct the economic analysis, the opportunity cost of the resources must be known.
If a project does not have an economic return equal to the opportunity cost of public funds,
it usually should not be undertaken. In some circumstances, however, the project may also
lead to net social benefits which can be quantified (but not necessarily measured in
monetary terms) and which may be viewed by the decision-makers as being worth the
sacrifice of economic resource cost that the project entails. For example, the project might
distribute income to a group of people whom the government is very anxious to help. It is
in this context that an important factor must be noted. A project may distribute income to
a desired group and at the same time it may increase the incomes of those that are not
favoured. Therefore, both of these outcomes must be considered by the decision – makers
in determining the overall attractiveness of the project.

31
The postulates underlying the economic appraisal
The approach adopted in this Manual to evaluate the economic benefits and costs of
projects follows the efficiency approach. Harberger (1971) formalizes the underlying
model assumptions, establishing three basic postulates for applied analysis of welfare
economics. These postulates in turn are based on a number of concepts in welfare
economics.
i. The competitive, undistorted demand price for an incremental unit of a good or
service measures it is economic value to the demander and hence it is economic
benefit.
ii. The competitive, undistorted supply price for an incremental unit of a good or
service measures its economic resource cost.
iii. Costs and benefits are added up without regard to who the gainers and losers are.
In other words, a “Kenyan shilling” is valued at a “Kenyan shilling”, regardless of
whether the benefit of the dollar accrues to a high-income individual or a low-
income individual.
In other words, when a project produces a good or a service (output), the economic benefit
or the economic price of each incremental unit is measured by the demand price or the
consumer’s willingness to pay for that unit. On the other hand, the economic cost of a
resource (input) that goes into the production of the project’s output is measured by the
supply price of each incremental unit of that resource. Finally, the net economic benefit of
the project is measured by simply subtracting the total resource costs from the total
benefits from the project’s output. The implications of these three postulates are further
elaborated in the below box.
Harberger’s three postulates
The first postulate states that the demand curve represents the maximum
willingness to pay for successive units of a good. As such, the demand curve reflects
indifference on part of the consumer between having a particular unit of a good at
that price or spending the money on other goods and services.
The second postulate states that the supply curve represents the minimum prices
suppliers are willing to accept for successive units of a good or service. Then, these
minimum prices represent the opportunity cost of these goods. In other words,
suppliers will be indifferent between selling these particular units of the good at

32
their supply prices or using the inputs to produce these units for alternative
purposes.
Postulate three concerns the distributional aspects of a project and how they should
be incorporated in the economic analysis of projects. This third postulate indicates
that the costs and benefits of the project must be added, regardless of who wins and
who loses. Harberger (1996) also argues the general validity of the assumptions that
are not intended to indicate only those individuals seek to maximize their own
welfare, but also the society as a whole.
The framework for analysing the economic benefits and costs of projects producing or
using (as inputs) traded and non-traded goods and services are based on the three
postulates of Harberger.
In Figure 6 section (a) show the demand curve for a good in an undistorted market. The
demand curve of a good shows the maximum price that consumers are willing to pay for
successive units of the good given the prices of all other goods and services, and the income
of consumers. If the market-determined price of the good is Pm and the quantity
consumed at that price is Qm, then the economic benefit of the last (marginal) unit
consumed is Pm but the benefits of earlier (inframarginal) units will be greater than Pm.
Applying the first postulate, the benefits of the successive units consumed are determined
by the corresponding prices on the demand curve. Consequently, the economic benefit of
the output of this industry (the quantity Qm) is given by the area PmaxOQmC.
Figure 6 - Demand and Supply Curves and Benefits and Cost
(a) Total Economic Benefit (b) Total Economic Cost
Price/Unit
Units of Output
Pm
Qm 0
C
Supply
E
Price/Unit
Units of Output
Pm
0 Qm
C
Demand
Pmax

33
(c) Economic Benefits and Costs
Source: Jenkins G, Harberger A, Kuo Ch. (2013).
Section (b) on same figure presents the other side of the market, namely the supply side.
The supply curve or marginal cost curve reflects the resource cost for producing successive
units of the good. At the market-determined price Pm, the quantity Qm is produced.
While the resource cost of the marginal unit produced is Pm, that of each of the infra-
marginal units is less than Pm. Following the second postulate, the economic resource
cost of producing Qm is OECQm.
Section (c) combines the demand and supply curves for this market. Following the third
postulate, we add up the economic costs and benefits to determine the net gain or loss in
this industry. Since the benefits are represented by the area PmaxOQmC in Figure 6 (a)
and the costs are given by the area OECQm in Figure 6 (b), the net economic benefit – the
total surplus – is given by triangle PmaxEC in Figure 6 (c).
The surplus analysis helps to determine which group receives the net economic benefit,
PmaxEC. The only price observable in the market is Pm and all Qm units are bought and
sold at this price. Consumers value each unit they consume at its corresponding price as
given by the demand curve but they pay less than that price for all units consumed except
the last one. The difference between what consumers value the output at what they
actually pay is a net gain to consumers and is known as consumer surplus. Consumers pay
an amount equal to OPmCQm but enjoy a gross benefit of PmaxOQmC. The amount of
income saved by consumers because they are able to purchase all units at a price Pm is
equal to the triangle PmaxPmC in Figure 6 (c). This triangle is the consumer surplus.
Units of Output
Price/Unit
Pmax
Pm
C
0 Qm
Demand
Supply
E

34
The fact that all units are sold at a price Pm implies that industry revenues, OPmCQm are
larger than the economic costs, OECQm. The excess of revenues over resource cost, the
triangle EPmC in Figure 6 (c) represents a net profit to the owners of the factors of
production. The difference is known as the economic rent or producer surplus. It now
becomes evident that the net economic benefit in this industry as determined using the
three postulates is shared between the owners of the industry and its consumers.
Measuring economic benefits. Suppose a project that produces a non-tradable good, such
as cement. Figure 7 shows the supply and demand for this non-tradable good; the
industry demand and supply curves prior to the introduction of the new project are
denoted by D0 and S0, respectively. The new project produces a quantity Qp and results
in a shift in the industry supply curve from S0 to S0+P. The additional supply by the
project results in a drop in the market price from Pm0 to Pm1. As a result of the decrease
in price, consumers demand more and total consumption increases from Q0 to Qd1. Also
due to the decline in price, existing suppliers will cut back their production from Q0 to Qs1
as some of them can no longer supply the same amount of the good at the new (lower)
price Pm1. Qp, the quantity produced by the project, equals the sum of the two quantities
Q0-Qd1 and Q0-Qs1.
Figure 7 - Economic Benefits of a New Project in an Undistorted Market
Source: Jenkins G, Harberger A, Kuo Ch. (2013).
PM0
PM1
A
Price/Unit
Units
of of
0 Qs1 Q0 Qd1
B
C
D0
S0
S0+p
35
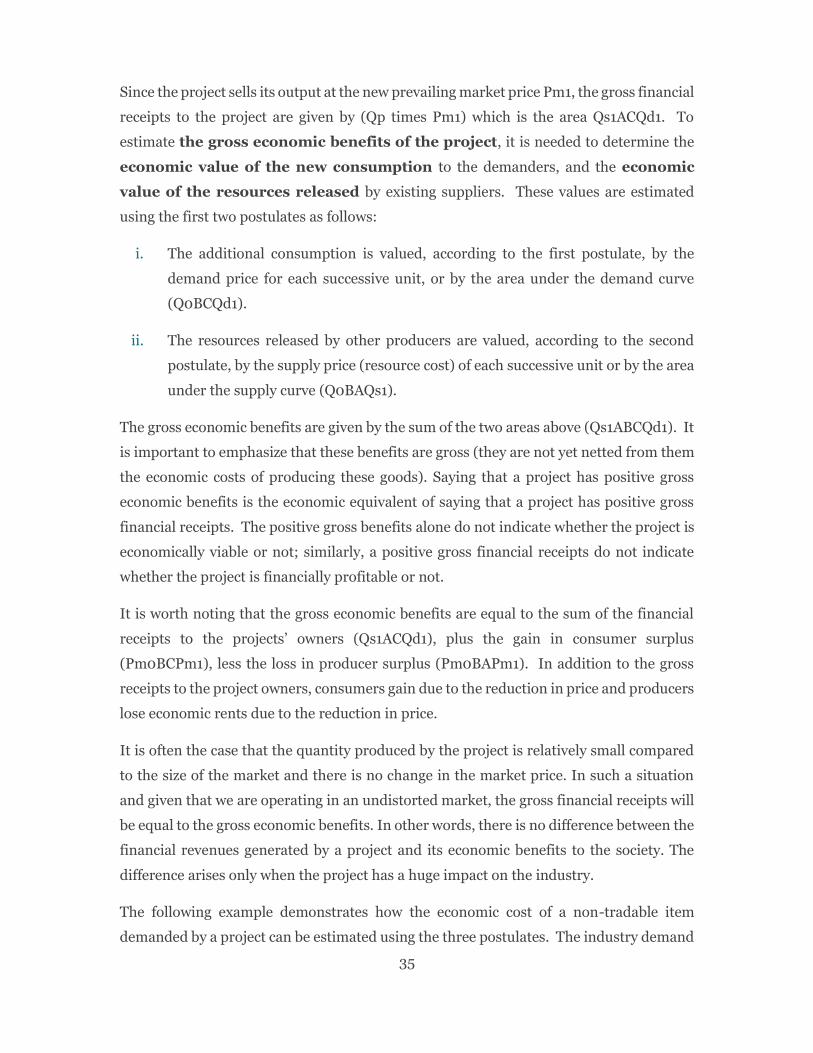
Since the project sells its output at the new prevailing market price Pm1, the gross financial
receipts to the project are given by (Qp times Pm1) which is the area Qs1ACQd1. To
estimate the gross economic benefits of the project, it is needed to determine the
economic value of the new consumption to the demanders, and the economic
value of the resources released by existing suppliers. These values are estimated
using the first two postulates as follows:
i. The additional consumption is valued, according to the first postulate, by the
demand price for each successive unit, or by the area under the demand curve
(Q0BCQd1).
ii. The resources released by other producers are valued, according to the second
postulate, by the supply price (resource cost) of each successive unit or by the area
under the supply curve (Q0BAQs1).
The gross economic benefits are given by the sum of the two areas above (Qs1ABCQd1). It
is important to emphasize that these benefits are gross (they are not yet netted from them
the economic costs of producing these goods). Saying that a project has positive gross
economic benefits is the economic equivalent of saying that a project has positive gross
financial receipts. The positive gross benefits alone do not indicate whether the project is
economically viable or not; similarly, a positive gross financial receipts do not indicate
whether the project is financially profitable or not.
It is worth noting that the gross economic benefits are equal to the sum of the financial
receipts to the projects’ owners (Qs1ACQd1), plus the gain in consumer surplus
(Pm0BCPm1), less the loss in producer surplus (Pm0BAPm1). In addition to the gross
receipts to the project owners, consumers gain due to the reduction in price and producers
lose economic rents due to the reduction in price.
It is often the case that the quantity produced by the project is relatively small compared
to the size of the market and there is no change in the market price. In such a situation
and given that we are operating in an undistorted market, the gross financial receipts will
be equal to the gross economic benefits. In other words, there is no difference between the
financial revenues generated by a project and its economic benefits to the society. The
difference arises only when the project has a huge impact on the industry.
The following example demonstrates how the economic cost of a non-tradable item
demanded by a project can be estimated using the three postulates. The industry demand

36
and supply curves without the additional demand by the new project are denoted by D0
and S0 respectively in Figure 9. The new project demands a quantity Qp and results in a
shift in the industry demand curve from D0 to D0 + P. The additional demand by the
project results in a rise in the market price from Pm0 to Pm1. As a result of the increase
in price, existing consumers will cut back their consumption from Q0 to Qd1 and
producers will increase their production from Q0 to Qs1 at the new (higher) price Pm1.
Qp, the quantity demanded by the project, equals the sum of the two quantities Q0-Qd1
and Q0-Qs1.
The project buy its requirement at the new prevailing market price Pm1, and incurs a gross
financial expenditure of (Qp*Pm1) which is the area Qd1CAQs1. To estimate the gross
economic costs of the input demanded by the project, we need to determine the economic
value of the consumption that is foregone by the existing consumers, and the value of the
additional resources utilized to accommodate the project’s demand. These values are
estimated using the first two postulates as follows:
iii. The cutback in consumption is valued, according to the first postulate, by the
demand price for each successive unit given up or by the area under the
demand curve (Q0BCQd1).
iv. The additional resources used to accommodate the expansion in output are
valued, according to the second postulate, by the supply price (resource cost)
of each successive unit or by the area under the supply curve (Q0BAQs1).
The gross economic cost for this input is given by the sum of the two areas above
(Qs1ABCQd1). By determining the economic cost of each input used by the project in a
similar way, and the economic benefit of its output as outlined above, we will be in a
position to determine the economic viability of the project by subtracting all economic
costs from the gross economic benefits.
In most of the cases, the markets for a project’s outputs or inputs are distorted. This is true
both for internationally traded and non-traded markets. In the presence of externalities,
the estimation of the economic costs and benefits, as well as the distributional impacts will
be slightly more involved. When dealing with undistorted markets in the examples above,
the difference between the financial receipts to the owners and the economic benefits was
the gain in consumer surplus minus the loss in producer surplus. Similarly, the difference
between the economic cost of the inputs used by the project, and the financial

37
expenditures borne by the project owners, is the gain in producer surplus minus the loss
in consumer surplus.
Figure 8 - Economic Cost of an Input Demanded by a Project in an
Undistorted Market
Source: Jenkins G, Harberger A, Kuo Ch. (2013).
With the introduction of distortions in the form of taxes, subsidies or externalities, another
stakeholder enters the picture in the form of the government. Again, when there are other
externalities like monopoly markets, price controls or pollution, the impact of the project
on the economy is not as straight forward as depicted before. Consequently, when
estimating the economic costs and benefits of goods and services in distorted markets, we
may expect additional benefits or costs and new players added to the list of beneficiaries
or losers affected by the project.
Regardless the kind of markets, under the framework of economic appraisal the benefits
of a project will be estimated in terms of greater consumption or release of resources; and
in the case of internationally traded goods markets, the benefits are associated with foreign
exchange generation and savings. With the same approach, the costs of a project will be
measured in terms of lower present consumption or a greater use of resources for domestic
goods; or greater use of foreign exchange for tradable goods.
S0
PM1
PM0
D0
D0+P
A
B
C
Qd1 QS1 Q0 Units
Price/Unit

38
PART II Project appraisal tool

39
5 THE PROJECT APPRAISAL:
A STEP-BY-STEP
METHODOLOGY
Project appraisal is recommended to be developed in steps. These steps cover the
sequenced analytical work leading to an informed decision on the financial and economic
worth of a capital investment project and its long-run sustainability. Balanced and
consistent decision-making depends on their systematic application in the project
appraisal process. The main technical output underpinning the appraisal process are the
PFS and FS and, although the detailed content and any supporting studies may be project
or sector specific, the overall analytical framework should reflect the outlined steps.
In defining the scope of a PFS or a FS and when reviewing it on completion, the responsible
economic entity should ensure that the steps are indeed reflected therein. The entity in
charge will also check that the PFS and/or FS reflect the appraisal steps when undertaking
its independent review. The project appraisal process can be divided into different steps,
as follows:

40
Figure 9 - Steps for Project Appraisal
Source: Own elaboration
While the aim in defining these steps is to ensure a systematic and sequential process,
some iteration between certain steps may be required. For example, some weaknesses
uncovered at different steps could lead to a review of project alternatives with a view to
PROJECT
CONCEPTUALI S
ATI ON
PROJECT
PRELI M I NARY
SCREENI NG
I NTEGRATED
PROJECT
APPRAI SAL
TH E PROJECT
I M PLEM ENTATI
ON AND TH E
EX -POST PROJECT
EVALUATI ON
TH E DECI SI ON
CRI TERI A
Analysis stage
1. Stakeholder analysis
2. Problem analysis 3. Objective
analysis 4. Strategic option
analysis
Planning stage
1. The strategic plan
2. Establishing a
strategic planning process
3. Developing Log Frame Matrix
The conceptual
approach
Profiling
Pre-appraisal
1. General evaluation
2. Problem identification
and description3. Project
justification, the strategic case for the Project
1. Effect on the demand analysis
2. Effect on the
supply analysis3. Legal and
institutional analysis
4. Implementation
cost estimates5. Benefits analysis6. Preliminary
economic viability
7. PPP preliminary analysis
Viability
1. Budgetary impact
2. Implementation
needs analysis3. Potential
constraints4. Affordability
considerations
5. Other/external impacts
The pre-selection tool
Integrated approach
1. The integrated analysis
2. The theoretical principles
underlying the economic analysis of projects
3. Defining the
project objectives and scope
4. Identifying and selecting project alternatives
5. Developing the demand analysis
6. Developing the study of the modules
7. Conducting the financial analysis
8. Conducting economic analysis
9. The economic prices
10. The risk analysis11. Assessing the
affordability and
sustainability
Project
implementation
Activity scheduling
Resource scheduling
Costing and budgeting
The cost-benefit analysis for
infrastructure sector
projects. The cost-effectiveness analysis
for social sector projects.
The project time dimension
The discount rate
The net present value
The annual net present value
The net present cost
The annual net present cost
1
2
1
2
1 1
3
4
5
1
2
3
4
5
6
7

41
reducing costs or increasing benefits. Then, some flexibility is therefore required in
applying the steps.

42
6 THE PROJECT
CONCEPTUALISATION
6.1 THE ANALYSIS STAGE
It should be evident that good project ideas must be elaborated in more detailed studies.
However, formulation of the detailed techno-economic feasibility study that enables a
definite investment decision to be made on the project is a costly and time-consuming
task. Therefore, before assigning significant funds for such a study, a preliminary
assessment of the project idea must be made in a pre-feasibility study. A pre-feasibility is
just seeing that whether:
• All possible project alternatives are examined
• The project concept justifies investing in a more detailed study
• All aspects are critical and need in-depth investigation
• The project idea is viable and attractive or not
The main stages of the pre-investment phase are as follows:
• Identification of investment opportunities (opportunity studies)
• Analysis of project alternatives and preliminary project selection
• Project preparation (pre-feasibility and feasibility studies) and Project appraisal
• Investment decision (appraisal report)
These stages assist a potential investor in the decision-making process and provide the
base for project decision and implementation.
Identifying investment opportunities is the starting point in a series of investment-related
activities when potential investors (private and public) are interested in obtaining
information on newly identified viable investment opportunities. The main instrument
used to quantify the parameters, information and data required to develop a project idea
into a proposal is the PCN. A PCN should identify investment opportunities or project
ideas by analysing the following factors in detail:
• Natural resources with high potential for processing and manufacture:
• The existing agricultural pattern that serves as a basis for agro-based industries:

43
• The future demand for certain consumer goods or newly developed goods
• Imports to identify areas for import substitution:
• Cost and availability of production factors:
• Possible expansion of existing industrial capacity to attain economies of scale and
• Export possibilities.
6.1.1 Stakeholder analysis
All projects exist within a ‘political’ environment, populated by all those with a particular
stake or interest in the project’s outcome. This political environment and the expectations
of stakeholders represent a significant risk to a project. It is unlikely that the requirements
of all stakeholders will coincide, and they will seek to influence the project to meet their
needs.
Pressure from stakeholders generates change, and change increases the complexity of the
management task, jeopardizing cost and programme certainty. However, if the views of
project stakeholders are not addressed and if stakeholders are not involved in developing
the project, then the project is unlikely to deliver optimum value for all involved. Project
managers must strike the right balance between stakeholder involvement and isolation
from external influence to achieve delivery on cost and time and maximize the benefit for
the client and his stakeholders.
Background and General Principles
Stakeholders have a stake or an interest in an investment project undertaken by a company
or a government. Stakeholders will be affected in some way by the project and so have an
interest in influencing it. They may benefit from the project and so will be supportive and
positive about it. Conversely, the project may impair their interests, or they may perceive
it will have a negative outcome for them, so they will seek to stop it or, at the very least, to
slow it down.
Stakeholder influence is often felt most keenly in the early stages of the project life cycle.
The project is flexible at this stage and can be changed, and stakeholders are generally
aware of this. Once it starts to progress, it takes on momentum and power of its own, and
the cost of stopping it or altering its direction becomes high. Stakeholder influence often
drops off markedly when construction starts but will increase again as handover nears.
Project managers should continue to manage stakeholder expectations to ensure that the

44
completed building meets the needs of stakeholders as well as possible and is favourably
accepted.
Stakeholder analysis, identification, and classification
Like any other member of the project team, a stakeholder is a person, and some will be
easier to manage than others. Project managers must learn to deal with various
personalities and make sure they are having a productive dialogue with stakeholders. It is
essential to understand who the stakeholders are, what their expectations are, and what
motivates them. This process is called stakeholder analysis.
Figure 10 - 4 steps to carry out a Stakeholder Analysis
Source: own elaboration based on international experiences
Stakeholder analysis identifies and prioritizes stakeholders before the project begins. It
organizes stakeholders into groups according to how much they participate in the project,
their interest level, and how much influence or power they have. Once these people are
identified and organized, a project manager must figure out the best way to involve each
stakeholder in the project, including the best channels for communication, based on their
needs. Communication is key to stakeholder analysis because stakeholders must buy into
and approve the project, and this can only be done with timely information and visibility
into the project. This stakeholder analysis template can help with this process
Who is involvedin the project?
Who is interested in this project or who is affected by it?
Which processes can be infuenced?
Identification
of Stakeholder
Step 1
Display the
relations
Step 2 Step 3
Interpretation
and analysis
Step 4
Conduction of
measures
Display all Stakeholderand their relationshipto the project
▪ Internal and externalStakeholder
▪ Intensity of the relation
▪ Meaning of theStakeholder
Comparison of the expectations andinterests of thedifferentStakeholder.
▪ Expectations on theproject
▪ Characterization
▪ Objectives and interestsof Stakeholder
▪ Amount
▪ Influence, Power and Attitute to the project(Positive / Negative)
Findings from theanalysis and possibilitiesof cooperation
Estimation of risks, threatsand opportunities
Development of an implementation strategy
▪ Measures and communication
▪ Participation on the project

45
Figure 11 - Stakeholder analysis template
Source: own elaboration based on international experiences
Wall St. Pedestrian Walkway Create street connecting office building Edith Miser
C - Current Level R - Required Level
Stakeholder Title Email Influence Priority SME? Decision-Maker Comm. Freq. Comm. Method Against Passive Neutral Help Notes
Don Lu Engineer donlu@email High High Yes Yes Weekly In Person C R
Ed Harris Finance ed@email Medium Medium Yes No Monthly Email C R
Jo Ann Design jo@email Low Low No No Weekly Phone C R
Stakeholder Analysis
Basics Project Information
Project Name Project Description Project Manager
Commitment Level

46
Part of identifying the different stakeholders is dividing and classifying them. As listing
stakeholders, keep in mind that they fall into two main categories: those affected by the
project and those who contribute to it. And there are internal stakeholders and external
stakeholders.
An internal stakeholder is someone whose interest in the project is directly related to being
a part of the organization managing that project. They can be team members, executives,
owners or even investors in the organization.
External stakeholders aren’t directly related to the organization, but the project impacts
them to some extent. These are usually suppliers, creditors, regulators, and public groups.
Stakeholder mapping
Project managers can map or classify stakeholders using an influence-interest matrix,
which is a box broken into four sections. Project managers should place the stakeholders
in one of the four boxes based on their interest and influence levels. Anyone placed to the
right of the box has more influence, while anyone placed near the top of the box has more
interest. If a stakeholder is placed in the top right, then they have a lot of interest and
influence, making them essential players in the project. See figure:
Figure 12 - Stakeholder influence-interest matrix
Source: own elaboration based on international experiences
Sector ALow self-interest in the project and therefore little influence.➔ Information with minimal effort.
Sector BGreat Interest in project‘s success , but hardly influence opportunities available. ➔ Involve by good flow of information and win over as an ally for certain decision situations.
Sector CPassive behavior with minor interest on the project. But is able to have major influence. ➔ Include in all the important decisions in your field of interest.
Sector DThe most important stakeholder group with high self-interest in the project and the outermost influence possibilities. ➔ Include in planning and important decisions.
Definitions / Explanation of the 4 Sectors
Stakeholder-Analysis ─ Influence-Interest-Matrix (2x2)
Influence P
ote
ntial
hig
hlo
w
highlowInterest and
Support
Keep Satisfied Key Players (Cooperation)
Keep InformedMinimal Effort

47
Consider that the status of your stakeholders is not static; they can change throughout the
project. Stakeholder analysis is not a one-time thing but is a process that should continue
throughout the project.
Finally, with the information created in your stakeholder map, project managers must
figure out how to engage stakeholders. Communication is the process of winning over
stakeholders, get their understanding and support to help fuel the project, putting it on
the right course. A communication plan outlines the channel and frequency of
communications between the project manager and each stakeholder.
6.1.2 How to Make a Stakeholder Management Plan
To summarize all lessons learned and put them into practice, follow these five steps to
ensure all bases in the stakeholder management plan are covered.
i. List the Stakeholders
The first step to any good stakeholder management plan is knowing your stakeholders.
ii. Prioritize the Stakeholders
Note which stakeholders will have a more significant influence over the project and at
which stage their impact becomes lesser or more powerful.
iii. Interview the Stakeholders
Working with new stakeholders can be complicated at the start—some are easier to
manage than others. There will be many voices from outside the company with different
personalities and demands and many voices inside the company with competing goals.
Here are some example stakeholder interview questions to ask to get sorted:
• Why are you interested in this project?
• What are your expectations for this project?
• If you have a team involved, what do you expect from them?
• Which deliverables are you most interested in?
• What inspired you to get involved in this project?
• What do you hope this project changes after launch?
• How quickly do you see this project rolling out?

48
• If you feel positive about this project, why?
• If you have worries about this project, why?
• Do you prefer in-person meetings, phone meetings or email?
iv. Develop the Influence – Interest Matrix
A quick simulation of a quadrant to sort your findings will help you easily distinguish those
with high interest and high priority versus those with low interest and low priority. It will
also help to sort all those in between.
v. Set & Manage Expectations
Identify which stages each key stakeholder will be involved in and timelines by which their
feedback is needed. Include a schedule of office hours for them to easily reach you so that
they can have time to provide feedback either in a private setting or in a group.
6.2 THE STRATEGIC PLANNING STAGE
Having a strategic plan is the best way to bring focus and direction to your organization.
What will your society and the government be like in ten years? Is there a roadmap to get
from today to your envisioned tomorrow? The environment is dynamic, therefore the
future is not one hundred percent predictable but, if we don’t change anything, the future
won’t be any different from the past. Governments must use their strategic plans to get
ahead of the game. A culture of strategic thinking must be created within government, so
that the strategic planning exercise doesn’t become just an annual retreat, but instead, a
part of daily decision making.
A strategic plan is a management tool that serves the purpose of helping an organization
do a better job, because a plan focuses the energy, resources, and time of everyone in the
organization in the same direction. The major assumption in strategic planning, however,
is that an organization must be responsive to a dynamic, changing environment.
Therefore, the emphasis in the strategic planning is on understanding how the
environment is changing and will change and on developing organizational decisions that
are responsive to these changes.
Any effective planning process must include certain basic elements, a good strategic plan
achieves the following, it:

49
• Reflects the values of the organization
• Inspires change and revision in products, services, and markets
• Clearly defines the criteria for achieving success
• Assists in daily decision making
A strategic plan should include these elements:
• A mission statement and a vision statement
• A description of the organization’s long-term goals and objectives
• Strategies the organization plans to use to achieve general goals and objectives
• Action plans to implement the goals and objectives
• A portfolio of possible investment projects
6.2.1 The Strategic Plan
Here’s an outline of a typical strategic plan:
• Mission statement: To define the organization’s core purpose. Why do we exist?
• Vision statement: To explain where you are headed, your future state. To formulate a
picture of what your organization’s future makeup will be and where the organization
is headed. What will our organization look like in 5 to 10 years from now?
• Values statement or guiding principles: To clarify what you stand for and believe in.
• Strengths, Weaknesses, Opportunities and Threats (SWOT): To assess the strengths,
weaknesses, opportunities, and threats that are strategically important to your
organization. (You may or may not choose to include your SWOT in your strategic
plan but as supporting documentation).
• Competitive advantage: To define what you are best at. What can your organization
potentially do better than any other organization?
• Strategic objectives: To connect your mission to your vision. Strategic objectives are
long-term, continuous strategic areas that get you moving from your mission to
achieving your vision. What are the key activities that you need to perform to achieve
your vision?
• Strategies: To establish a guide that matches your organization’s strengths with
market opportunities to position your organization in the mind of the customer. Does

50
your strategy match your strengths with how you will provide value and be perceived
by your customers?
• Short-term goals/priorities/initiatives: To set goals that converts the strategic
objectives into specific performance targets. Effective goals clearly state what, when,
how, who and are specifically measurable. What are the 1 to 3-year goals you are trying
to achieve to get to your strategic objectives?
• Action items/plans: To set specific actions plans that lead to implementing your goals.
Are your action items comprehensive enough to achieve your goals?
• Scorecard: To measure and manage your strategic plan. What are the key
performance measures you can track to monitor if you are achieving your goals?
• Financial assessment: To determine if your strategic plan makes financial sense. Do
the estimated revenue projections exceed your estimated expenses?
6.2.2 Establishing a strategic planning process
1. Get ready. Identify specific issues and choices the process needs to address; clarify roles,
create a planning committee, develop an organization profile, and identify the information
that must be collected to help make sound decisions.
2. Articulate the mission and vision. Reach a consensus on why the organization exists;
determine its primary business, identify your values, and create an image of what success
looks like.
3. Review your strategic position. Gather up-to-date information on internal strengths and
weaknesses and external opportunities and threats so you can develop an understanding
of critical issues. Use the SWOT tool to organize your information.
4. Agree on priorities. Identify the broad approaches (strategies) for addressing critical
issues and the results to be sought (long-term and short-term objectives and goals). Then
you and your team can agree on key priorities.
5. Organize the plan. Put the pieces together into one coherent document that is practical,
can be implemented, and easily managed and monitored.
6. Identify your next actions. After the plan is together in one cohesive document (Step 5),
determine what actions to take next for each team, individual, and department.

51
7. Roll-out the plan. Communicate the plan across the organization so everyone knows the
game plan.
8. Hold everyone accountable. Monitor your plan by reporting performance metrics at
monthly or quarterly strategy staff meetings. Keep track of all measures by regularly
updating the organization’s scorecard. Hold people accountable for making sure
organizational activities are happening. Link these processes to incentive compensation if
possible. Evaluate performance and what is happening. Make corrections based on key
measurements. Manage activities to drive future results.
Figure 13 - Strategic Planning cycle
Source: Olsen (2011).
Strategic Planning Pitfalls
Strategic planning can yield less than desirable results if it ends up in one of the possible
pitfalls. To prevent that from happening, here is a list of the most common traps to avoid:
• Relying on bad information or no information: Any plan is only as good as the
information on which it is based. Too often, teams rely on untested assumptions or
hunches, erecting their plans on an unsteady foundation.

52
• Being unrealistic about your organization’s ability to plan: It takes time and effort to
plan well. Some organizations want the results but aren’t willing or able to make the
investment. Being realistic about investments compatible with available resources,
which include time, energy, and money.
• Get your house in order first: Planning can reveal that your house isn’t in order. Make
sure that your organization is in order and that there are no major conflicts before
embarking on strategizing.
• All the best missions and strategies in the world are a waste of time if they aren’t
implemented.
Strategic Planning in Government
The strategic planning phase is concerned with the identification of potential public sector
projects. The purpose is to establish the basic desirability of a project and to identify high-
priority projects that fall within the responsibility of the public sector.
In the strategic planning phase, the emphasis is on “investment efficacy” or on spending
on the right public assets. Spending should promote achieving strategic priorities, and
resources should be allocated only to those areas that are best aligned with the
government’s objectives. The strategic fit of projects therefore ensures the strategic
alignment of investment projects with regional and sector strategies. The specific
objectives of every investment project should consequently be designed in such a way that
they support the overall national development agenda.
In that sense, the strategic planning exercises performed at different levels are in essence
a top-down, highly political process that ought to include a decision process on how to
apply, over time, the resources of a Nation across sectors. If this planning exercise is not
100% conclusive and if it does not define the portfolio of projects to be financed, it risks
becoming only a narrative wishful statement, void of practical application.
Whereas Economic Financial Planning, contrary to strategic planning, is a bottom-up,
essentially technical process. If these two planning exercises -strategic and economic
planning- are disconnected, if these two do not overlap and match, then there will be
severe inconsistencies in public policy priorities and the corresponding investment
decisions in the future.

53
Despite progress made in economic-financial theory, its capital market consistent models,
so far have had little impact in strategic planning practice. A division or gap remains
between strategic planners and economic-financial planners. Both views are not
reconciled even though they deal with the same project portfolios.
Therefore, when it happens during the government project portfolio ranking or priority
setting process, that some negligible Net Present Value (NPV) (or even negative NPV)
projects are chosen for funding based on “strategic reasons”, both planning exercises –
strategic vs economic- collide. And vice-versa, when some soaring NPV projects are turned
down because of incompatibility with some strategic line of a sector, the same collision
happens. To depart from economic theory correct procedures in project appraisal may risk
the long-term economic health of a Nation. But, on the other hand, it is no less true that a
simple portfolio or collection of positive NPV projects does not constitute a coherent
holistic strategic planning for a sector or a country. So, the two views should be
complementary, not substitute.
In every government there are groups of people that have been formed under the economic
theory, while there are others formed under the strategic planning language. These two
groups can be considered as two different cultures, two alternative points of view of
making an analysis but, the important fact is that both deal with the same problem. These
two views may seem incompatible, even though they are not in reality.
This strategic fit analysis introduces an investment project into the pre-investment phase.
As a result of this stage the analyst should:
• Discard all un-feasible alternatives
• Select the feasible alternatives and possibly advance to the next stage
• Wait or postpone the solution to the problem, while the authority decides
The PCN is an analytical tool that facilitates the task of planning for economic growth and
development. The main advantage of casting investment decisions into a project format is
that it enables the planner to establish a framework for analysing information in a
systematic procedure. The PCN assist economic entities to prepare public investment
proposals in a consistent and comprehensive manner, and will enable economic entities,
to prioritize competing projects, in the context of the economic entity´s strategic planning
and budget preparation process.

54
Based on the results of the PCN assessment, line ministries and other public agencies, may
include projects as new proposals in their draft strategic plans and in the reconciliation
process.
6.3 THE PROBLEM ANALYSIS
Much of the work involved in establishing the context for the project should have been
carried out when preparing the PCN for the Pre-Selection decision. The information and
analysis in the PCN should be reviewed, updated and deepened.
The problem identification is the first phase of the project life cycle and is concerned
with the identification of potential public sector projects, the public investment needs. The
purpose is to establish the basic desirability of a project and identify the high priority
projects that fall within the responsibility of the public sector.
The generation of ideas and proposals is left to the sectors; this is the responsibility of each
line ministry and independent public agencies. Any project sponsoring agency must first
clearly identify the problem that gives rise to the idea of a given project. Problem
identification should conclude with a literal definition of the problem under scrutiny.
The identification process implies undertaking the identification of gaps in the economy
and the definition of investment priorities for the public sector. The gaps could lie in one
or more sectors such as basic infrastructure, food and agriculture, heavy or basic industry,
or social sectors such as health and education. For example, a bad coverage of a service, a
bad service delivery, lack of assets, lost opportunities for improvement, among other
factors. The definition and evaluation of a range of alternatives that may provide solutions
to the problem must follow, ending with the selection of the alternative that maximizes
social welfare.
There are different types of problems4, and each requires differential treatment.
Therefore, the first challenge is to discover what kind of problem one is facing. There are
at least the following types of problems:
i. Simple problems are ones like baking a cake from a mix. For those, there is a
simple recipe.
4 Quote featured in a paper on reform in the healthcare industry by Brenda Zimmerman of York University and Sholom Glouberman of the University of Toronto

55
ii. Difficult or Complicated problems are ones like sending a rocket to the moon.
They can sometimes be broken down into a series of simple problems. But there is
no straightforward recipe. Success frequently requires multiple people, often
multiple teams, and specialized expertise. Unanticipated difficulties are frequent.
Timing and coordination become serious concerns.
iii. Complex or adaptive problems are ones like raising a child. Once you learn
how to send a rocket to the moon, you can repeat the process with other rockets
and perfect it. One rocket is like another rocket. But not so with raising a child, the
professors point out. Every child is unique. Although raising one child may provide
experience, it does not guarantee success with the next child. Expertise is valuable
but most certainly not sufficient. Indeed, the next child may require an entirely
different approach from the previous one. And this brings up another feature of
complex problems: their outcomes remain highly uncertain. Yet, we all know that
it is possible to raise a child well. It’s tough, that’s all.
Table 1 - Simple, complicated and complex problems
Source: own elaboration based on international experiences
The problem arises when an analyst implicitly describes a “complex or adaptive” problem
as a “difficult or complicated” one and employs solutions wedded to rational planning
approaches. These often lead to inappropriate solutions because they neglect many
aspects of complexity.
A project may be identified in a variety of sources of project identification:

56
• Existing agencies, independent units, line ministries and state-owned enterprises.
• It may emerge out of the process of formulation of the National Development Plan,
the National Priority Programs (NPP) and other plans at national and provincial
levels.
• Regional integration policy
• Political Manifestos
• It may be identified by the people’s representatives.
• It may arise as a demand from interest groups or beneficiaries.
• It may be brought forward by private sponsors and enterprises.
• It may be the product of a dialogue between the country on the one hand and bilateral
donors and international agencies on the other.
The problem to be addressed, the rationale behind the proposed project and the case of
public sector intervention will already have been presented in the PCN. This review will
involve:
• Verifying the description of the specific problem or opportunity that the project is
intended to address and ensuring that it is still accurate and that the problem is still
relevant and severe enough to warrant an urgent intervention.
• Confirming the broad explanation – cause and effect logic – of how the project is
expected to alleviate the identified problem or respond to the opportunity and further
deepening this explanation where necessary.
The strategic relevance of the project is a central component of the PCN and a core
criterion for the Pre-Selection decision. It will be important to verify the continued
strategic relevance of the project to take account of any changes of policy direction that
may have occurred at Government or Ministry level.
In any case, it is necessary to focus on the root problem, establishing the causes that
originate it and the effects that it produces.
• The sources of information that shed light on the problem should be identified;
through examples, through reviewing existing studies, using questionnaires and/or
interviews with the relevant authorities or stakeholders, through consulting experts,
etc.

57
• Problem identification should conclude with a literal definition of the problem. Along
with this, it is necessary to identify the variables contained in this definition,
specifying what is meant by each of them and what the related dimensions and
magnitudes are. This will allow the problem to be understood consistently by all
stakeholders.
• The analysis of causes and effects should be focused on a single problem; this allows
the analysis to be refined and to be more effective in shedding light on solutions.
• Do not confuse the problem with the “lack of solution”. Framing a problem in terms
such as "a new hospital building is lacking" is not the same as stating that "there is a
group in the population with high rates of morbidity, and it is not being served" (there
is a problem). To reduce the problem as “the absence of a given solution” seriously
limits the analysis of alternative solutions to the problem, which may lead to the
implementation of actions that do not necessarily solve the root problem.
To facilitate the problem identification, it is proposed the use of the LFA, including the
Problem Trees (Causes and Effects Trees) and Solution Trees (Means and Objectives
Tree). The LFA is based on a systematic analysis of the problem, and particularly key is
the analysis of the options for addressing those problems. It can be applied in a range of
circumstances and to a range of types of activities. The LFA is an analytical, presentational
and management tool which can help planners and managers to:
• Analyse the existing situation during activity preparation;
• Establish a logical hierarchy of means by which objectives will be reached;
• Identify the potential risks to achieving the objectives, and to sustainable outcomes;
• Establish how outputs and outcomes might best be monitored and evaluated;
• If desired, present a summary of the activity in a standard format, the LFM and;
• Monitor and review activities during implementation.
6.3.1 Building the Problem Tree
A graphical layout is ideal for developing a problem tree structure because it allows to
involve the project team and record their input visually and immediately, as you draw the
problem tree structure. Because it provides a clear pictorial layout of the main elements,
the graphical layout is best suited to a high-level problem tree of 2 to 3 levels. It can be
used for development, presentation, and summary purposes.

58
The identification of causes can be organized in two parts: causes generated from the
supply of the good or service and causes generated from its demand. For example,
suppose that a certain Municipality had received claims from a group of neighbours for
the high incidence rate of a disease in a given locality. Based on this, the neighbours
demand putting in place a health centre at the locality. Then, the problem can be defined
as “high incidence rate of diseases in a given locality”. As it was mentioned above, the
problem should not be stated as the lack of a solution, for example: "lack of a health
centre", because the analysis would be then restricted to a single solution, not always the
optimal solution to the root problem (“the high incidence rate of diseases”).
From the study of the current situation (conversations with neighbours, visitors to the area
with the problem, among others) and the brainstorming, the various causes of the problem
can be identified, in
Construction of theCauses Tree
Start from the definition of the central problem (trunk of the tree); then, identify the causes downwards (roots of the tree) that give rise to that central problem. It is important to reach the primary and independent causes, which are thought to be causing the central problem.For the identification of causes, always make brainstorm sessions with the key stakeholders involved in the problem, whether they caused it, or are affected by it, institutional managers, among others.

59
Figure 14.

60
Figure 14 - The Causes Tree
Source: based on Ortegón E, Pacheco J, Roura H. (2005).
As shown in the figure, there are different hierarchical levels of causes. At the first level
immediately under the root problem, there are the direct causes of the problem. These
causes are generated by various other causes (showed in the levels below). The number of
hierarchical levels will depend on the size and scope of the problem.
Identifying effects can clarify what will be the outputs and outcomes of the problem to be
solved. A distinction should be made between the different effects, since there are also
different hierarchical levels. The Effects Tree plots the chained effects of this problem.
The effects generated directly by the project are those effects of the first level, which in
turn generate the effects of second level and so on. The number of levels to be considered
in the design of the Effects Tree will depend on the expected scope of the project. For
example: a direct effect of the identified problem is the high number of diseased people,
which in turn has the effect of high health care costs and work absenteeism (Figure 15).
High incidence rate of a disease in a given locality
Poor access to
health centers
Water is
polluted
Contaminated
and unhealthy environment
Poor
hygienic habits
Routes to
neighboring areas are in poor condition
No care in the
locality
Lack of
sewerageLack of hygiene
education
Poor
management of solid waste
Buildingthe EffectsTree
Following the analysis, the project formulator must identify the effects (i.e. tree top and branches) generated by the central problem (i.e. tree trunk) on the target group.The same as in the case of the Causes Tree, these effects should be identified through a “brainstorming”, done with the main stakeholders involved in the problem and the project sponsors.

61
For example: a direct effect of the identified problem is the high number of diseased people, which
in turn has the effect of high health care costs and work absenteeism (Figure 15).
Figure 15 - The Effects Tree with a graphical layout
Source: based on Ortegón E, Pacheco J, Roura H. (2005).
However, with more detailed problem trees there is an alternative way to represent them,
this is the Outline layout. This layout shows the problem tree structure as a vertical list,
with each sub-level indented and a code. It provides an easy way to view and understand
the problem tree structure. The outline layout is convenient to use when developing and
fine-tuning the problem tree structure because you can easily make changes using features
such as auto-coding or numbering that are common to most word processing
programmes.
High incidence rate of a disease in a given locality
High rate of
mortalityGreater labor
absenteeism
Increased
absenteeism and
grade repetition
in schools
High costs of
health care
lower yield &
productivity
Poor job
qualificationPostponement of
other needs
Higher
production costs
Low quality of
life
Lower local
productive potential
Lower salaries

62
Figure 16 - The Effects Tree with Outline layout
Source: based on Ortegón E, Pacheco J, Roura H. (2005).
The identification of causes can be organized in two parts: causes generated from the
supply of the good or service and causes generated from its demand. For example,
suppose that a certain Municipality had received claims from a group of neighbours for
the high incidence rate of a disease in a given locality. Based on this, the neighbours
demand putting in place a health centre at the locality. Then, the problem can be defined
as “high incidence rate of diseases in a given locality”. As it was mentioned above, the
problem should not be stated as the lack of a solution, for example: "lack of a health
centre", because the analysis would be then restricted to a single solution, not always the
optimal solution to the root problem (“the high incidence rate of diseases”). From the
study of the current situation (conversations with neighbours, visits to the area with the
problem, among others) and the brainstorming, the various causes of a problem can be
identified.
Identifying effects can clarify what will be the outputs and outcomes of the problem to be
solved. A distinction should be made between the different effects, since there are also
different hierarchical levels. The Effects Tree plots the chained effects of this problem. The
1. High incidence rate of diseases in a given locality
1.1 High rate of mortality
1. 2 High costs of health care
1.2.1 Postponement of other needs
1.2.1.1 Low quality of life
1. 3 Greater labour absenteeism
1.3.1 Higher production costs
1.3.1.1 Lower local production potential
1.3.2 Lower yield and productivity
1.3.2.1 Lower local production potential
1.3.2.2 Lower salaries
1. 4 Increased absenteeism and grade repetition in schools
1.4.1 Poor job qualification
1.4.2 Lower salaries

63
effects generated directly by the project are those effects of the first level, which in turn
are generated by the effects of the second level and so on. The number of levels to be
considered in the design of the Effects Tree will depend on the expected scope of the
project. An example of this approach is presented as follows:
Africa’s rapid urbanization has occurred amidst stagnating economies and poor
governance, which have created massive and abject poverty in overcrowded slum
settlements across major cities in the region. Recent studies have highlighted huge
inequities in social indicators and in health and reproductive health outcomes between the
urban poor and other subgroups, including residents of rural areas, with the urban poor
recording the worst outcomes5.
Migration to urban areas has generally been thought of as a temporary phenomenon, with
migrants maintaining strong ties with their rural origins6. The assumption has also been
that they will return to their rural homes upon retirement. However, the presence and the
growing numbers of older people in urban areas call for a better understanding of the
context of aging in sub-Saharan Africa as well as the situation of older people living in
urban areas in the region. These urban areas are characterized by worsening economic
and social conditions, especially in the sprawling, informal settlements of cities across sub-
Saharan Africa. Little research has focused on older people in sub-Saharan Africa. The
limited work that has been done has focused mostly on rural areas, and attention to older
people living in urban areas is almost non-existent.
5 African Population and Health Research Center, 2002; Dodoo, Zulu, and Ezeh, forthcoming; Gulis, Mulumba, Juma, and Kakosova, 2003; Magadi, Zulu, and Brockerhoff, 2003; Zulu, Dodoo, and Ezeh, 2003)
6 (Grant, 1995; Gugler, 1991; Trager, 1998)
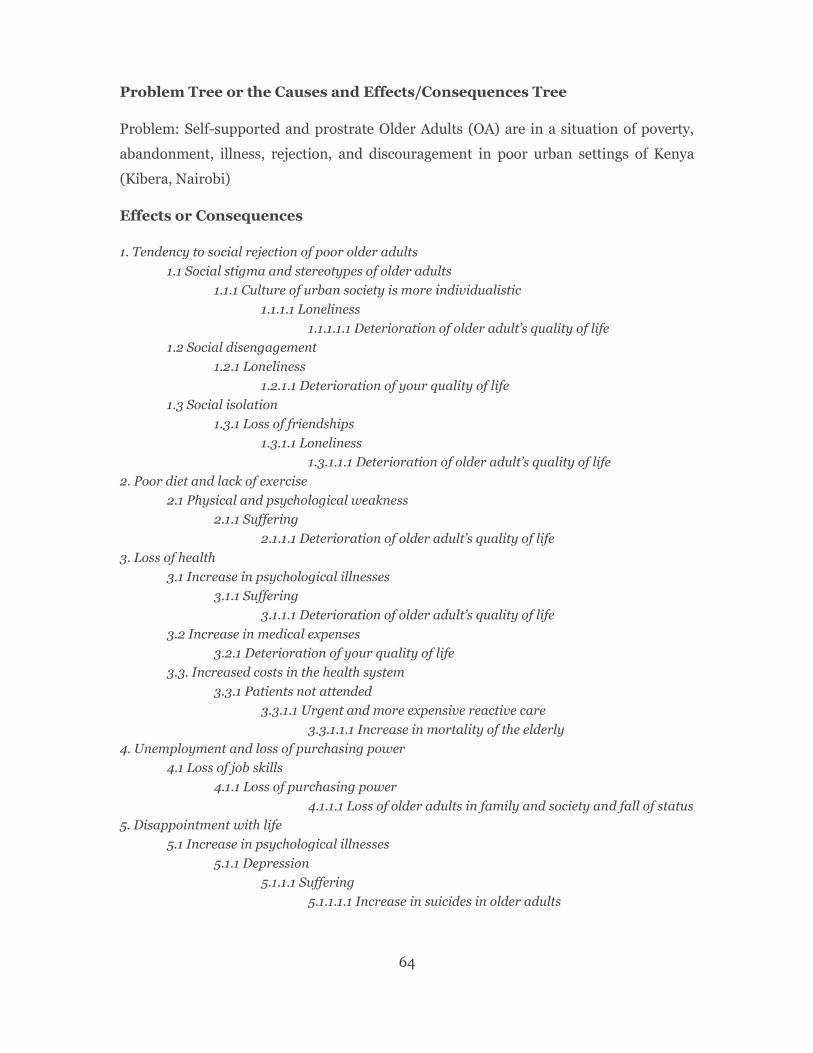
64
Problem Tree or the Causes and Effects/Consequences Tree
Problem: Self-supported and prostrate Older Adults (OA) are in a situation of poverty,
abandonment, illness, rejection, and discouragement in poor urban settings of Kenya
(Kibera, Nairobi)
Effects or Consequences
1. Tendency to social rejection of poor older adults
1.1 Social stigma and stereotypes of older adults
1.1.1 Culture of urban society is more individualistic
1.1.1.1 Loneliness
1.1.1.1.1 Deterioration of older adult’s quality of life
1.2 Social disengagement
1.2.1 Loneliness
1.2.1.1 Deterioration of your quality of life
1.3 Social isolation
1.3.1 Loss of friendships
1.3.1.1 Loneliness
1.3.1.1.1 Deterioration of older adult’s quality of life
2. Poor diet and lack of exercise
2.1 Physical and psychological weakness
2.1.1 Suffering
2.1.1.1 Deterioration of older adult’s quality of life
3. Loss of health
3.1 Increase in psychological illnesses
3.1.1 Suffering
3.1.1.1 Deterioration of older adult’s quality of life
3.2 Increase in medical expenses
3.2.1 Deterioration of your quality of life
3.3. Increased costs in the health system
3.3.1 Patients not attended
3.3.1.1 Urgent and more expensive reactive care
3.3.1.1.1 Increase in mortality of the elderly
4. Unemployment and loss of purchasing power
4.1 Loss of job skills
4.1.1 Loss of purchasing power
4.1.1.1 Loss of older adults in family and society and fall of status
5. Disappointment with life
5.1 Increase in psychological illnesses
5.1.1 Depression
5.1.1.1 Suffering
5.1.1.1.1 Increase in suicides in older adults

65
As shown in the outline, there are different hierarchical levels of effects or consequences.
At the first level, immediately after the root problem, there are the direct and immediate
effects or consequences of the problem (one-digit code). Then, there are the secondary
effects produced by the immediate effects (two-digit code), then there are the tertiary
effects (three-digit effects), etc.
Causes
1. Retirement and cessation of productive activity
1.1 Labour market rejects and does not hire older adults
1.1.1 Prejudice against older adults (The prevailing social culture that treats older adults as worthless people in the world of work)
1.1.1.1 They require special working conditions
1.2 They do not dare to undertake productive activities
1.2.1 Self-image of an older adult of which he is not capable
1.2.1.1 Older adult was not educated continuously
1.2.1.1.1 There are no self-employment programs for older adults
2. Weak family relationships
2.1 Absence of a family support network
2.1.1 Loss of family contact
2.1.1.1 Dispersion of children
2.1.1.1.1 Lack of communication with families
3. Psychological problems from discouragement due to the conditions in which they live
3.1 Lack of psychological care for the elderly
3.1.1 Lack of resources for psychological treatments, from the elderly and/or public resources
4. Poverty and illiteracy
4.1 Insufficient primary education, most cannot read or write
4.1.1 There are no literacy programs for older adults
5. Low-nutrient and low-nutrient diet
5.1 Lack of nutrition education for older adults
5.1.1 There are no nutritional and hygiene training programs for older adults
5.2 Older adults cannot go to buy food
5.1.1 Older adults do not know how to use technology to obtain their own food supplies
5.3 Older adults have lack of interest to prepare food for themselves
5.3.1 There are no courses for older adults to prepare food
6. High frequency of morbidity associated with their precarious conditions and age
6.1 Older adults have a sedentary lifestyle
6.1.1 There are no entertainment programs for older adults
6.2 There is no program of medical visits to homes for the elderly
6.2.1 There not enough medical staff for older adults
6.3 There are not enough gerontology doctors
6.3.1 Gerontology is not a popular specialty for medical doctors

66
7. Risks of loss of your scarce assets
7.1 Poor relatives take properties away from older adults
7.1.1 Older adults have no legal defence
8. Bad self-image
8.1 Lower self-valence, higher dependency
8.1.1 Older adults have a feeling of lack of dignity
As shown in the outline, there are also different hierarchical levels of causes. At the first
level immediately under the root problem, there are the direct and immediate causes of
the problem. But these causes are generated by various other sub-causes (showed in the
levels below). The number of hierarchical levels will depend on the size and scope of the
problem.
Choosing the right solution will allow remedying the effects identified in the Effects Tree.
6.3.2 Building the Solution Tree
To construct the Solution Tree, it is needed to change all the negative conditions of the
Problem Tree into positive conditions. Then, the Causes of the Problem Tree are
transformed into the Means/Resources of the Objectives/Solution Tree. Whereas the
Effects/Consequences of the Problem Tree are transformed into Purposes and Ends of the
Solution. What it was defined as the root problem, now becomes the central objective or
purpose that the project must accomplish.
Continuing with the development of the Case Study, the Solution Tree is presented:
The Solution Tree or the Means and Ends Tree
Solution: Poor, self-supporting and prostrate Older Adults (OA) in poor urban settings of
Kenya (Kibera, Nairobi) are assisted and cared for, preventing illnesses, being socially
accepted, and encouraged.
Integrating theProblem Tree
Integrating the analysis into the Problem Tree, by integrating the Causes Tree with the Effects Tree.

67
Ends
1. Tendency to social acceptance of poor older adults
1.1 Social relief, good image of older adult
1.1.1 Culture of an urban society is more generous and collectivist
1.1.1.1 Accompaniment
1.1.1.1.1 Improved quality of life
1.2 Social bonding
1.2.1 Accompaniment
1.2.1.1 Improved quality of life
1.3 Sociability and integration
1.3.1 Recovery of friendships
1.3.1.1 Accompaniment
1.3.1.1.1 Improved quality of life of older adults
2. Good nutrition and exercise
2.1 Physical and psychological strengthening
2.1.1 Satisfaction
2.1.1.1 Improved quality of life of older adults
3. Recovery of health
3.1 Decrease in psychological illnesses
3.1.1 Satisfaction
3.1.1.1 Improved quality of life of older adults
3.2 Decrease in medical expenses
3.2.1 Improved quality of life of older adults
3.3. Cost reduction in the health system
3.3.1 Patients seen and cared for
3.3.1.1 More and cheaper preventive care
3.3.1.1.1 Decrease in mortality of the elderly
4. Employment and maintenance of their purchasing power
4.1 Maintaining their job skills
4.1.1 Recovery of their purchasing power
4.1.1.1 Older adult’s role in family and society is recovered and status is maintained
5. Illusion for life
5.1 Decrease in psychological illnesses
5.1.1 Hope, animation
5.1.1.1 Satisfaction
5.1.1.1.1 Decrease in suicides in older adults
Means
1. Retirement and maintenance of productive activity
1.1 Labour market accepts and hires older adults
1.1.1 Favourable opinion towards older adults (Social culture that treats older adults as useful people in the world of work)
1.1.1.1 Older adults require special working conditions

68
1.2 Dare to undertake productive activities
1.2.1 Self-image of older adult of which he is capable
1.2.1.1 Older adults are continuously educated
1.2.1.1.1 There are self-employment programs for older adults
2. Strong family relationships
2.1 Existence of a family support network
2.1.1 Recovery of family contact
2.1.1.1 Reunion of the children
2.1.1.1.1 There is communication with families
3. There are no psychological problems from the mood for the support they receive
3.1 There is psychological care for the elderly
3.1.1 There are resources for psychological treatments, from the elderly and/or public resources
4. There is no poverty or illiteracy
4.1 Sufficient primary education, most can read and write
4.1.1 There are literacy programs for older adults
5. Food with a good level of nutrients and sufficient
5.1 There is nutrition education for older adults
5.1.1 There are nutritional and hygiene training programs for older adults
5.2 Older adults can go to buy food
5.2.1 Older adults know how to use technology to procure their own food
5.3 Older adults are encouraged to prepare food for themselves
5.3.1 There are courses for older adults to prepare food for themselves
6. Low frequency of morbidity associated with their precarious conditions and age
6.1 Older adults have an active life
6.1.1 There are entertainment programs for older adults
6.2 There is a program of medical visits to homes for the elderly
6.2.1 There is enough medical staff for older adults
6.3 There are enough gerontologists
6.3.1 Gerontology is a popular specialty for medical doctors
7. There is no risk of loss of your little equity
7.1 Poor relatives protect properties for older adults
7.1.1 Older adults have legal defence
8. Good self-image
8.1 Greater self-valence, less dependence
8.1.1 Feeling of dignity
Next step is to add to each final Means (i.e., the means with the largest code) of the
Solution tree a concrete action that helps to achieve the Means. For example, if we assume
that one of the final means is: “3.1.1.1 There is no contaminated drinking water” then, we
should add a concrete action that materializes that mean, for example: “To build a potable
water plant”.

69
Continuing with the development of the Case Study, the possible concrete actions for the
different means are presented:
Final Mean: 1.1.1.1 Older adults require special working conditions
Possible concrete action: Pass new regulation to provide tax deductible special working conditions for the elderly, subsidize a percentage of the salary of every hired older adult
Final Mean: 1.2.1.1.1 There are self-employment programs for older adults
Possible concrete action: Self-employment programs for older adults provided by NGOs and financed by the government and international cooperation partners, provide start-up loans for older adults’ new businesses
Final Mean: 2.1.1.1.1 There is communication with families
Possible concrete action: Establish a “connecting-elderly-with-their-families” Program and an elderly adoption Program financed by government and international cooperation partners
Final Mean: 3.1.1 There are resources for psychological treatments, from the elderly and/or public resources
Possible concrete action: Public hospital establishes an older adult psychological treatment Program financed by government and international cooperation partners
Final Mean: 4.1.1 There are literacy programs for older adults
Possible concrete action: Create a Municipal Literacy Program for older adults financed by government and international cooperation partners
Final Mean: 5.1.1 There are nutritional and hygiene training programs for older adults
Possible concrete action: Create a Municipal nutritional and hygiene training Program financed by government and international cooperation partners
Final Mean: 5.2.1 Older adults know how to use technology to procure their own food
Possible concrete action: Create a Municipal technology user training Program financed by government and international cooperation partners
Final Mean: 5.3.1 There are courses for older adults to prepare food for themselves
Possible concrete action: Create a Municipal nutritional and hygiene training Program financed by government and international cooperation partners
Final Mean: 6.1.1 There are entertainment programs for older adults
Possible concrete action: Create a Municipal Entertainment Program for older adults financed by government and international cooperation partners
Final Mean: 6.2.1 There is enough medical staff for older adults
Possible concrete action: Public hospital establishes an older adult Program financed by government and international cooperation partners
Final Mean: 6.3.1 Gerontology is a popular specialty for medical doctors
Possible concrete action: Ministry of Health establishes a gerontology scholarship for medical doctors
Final Mean: 7.1.1 Older adults have legal defence
Possible concrete action: Establish a governmental legal defence Program for older adults financed by government and international cooperation partners
Final Mean: 8.1.1 Feeling of dignity

70
Possible concrete action: Municipal Program to celebrate older adults’ birthdays financed by government and international cooperation partners
Next step is to screen all these possible actions, checking interdependencies and grouping
actions that are mutually complementary. Then, combining and bundling the actions, thus
defining different options or alternatives. These options or alternatives are then vetted and
prioritised considering different criteria, for example:
• Analysing their level of incidence in solving the problem
• Cost-efficiency feasibility of each alternative
• Technical feasibility of each alternative
• Social feasibility of each alternative
• Financial feasibility of each alternative
• Institutional feasibility of each alternative
• Political feasibility of each alternative
• Environmental feasibility of each alternative
To identify possible solutions, the first thing is to visualize the expected situation once the
central problem is solved; this provides strategies for action and, therefore, the set of
alternatives to be analysed. It is recommended that the analysis of alternatives be carried
out during the PFS. As the sponsoring agency get involved in the details of the studies, the
probability of choosing the best alternative for solving the problem increases.
The purpose of an options analysis is to undertake an analysis of all feasible options
that can achieve the identified output specifications. This will assist in identifying the
preferred solution to the problem. The following principles should guide the options
analysis:
• All feasible options should be evaluated
• The preferred option should be affordable
A first high-level analysis of these options should include a qualitative listing of the
advantages and disadvantages as well as preliminary quantification of the costs and
benefits of each option relative to the objectives of the project. This comparison should
allow for the development of a shortlist of 2 to 3 preferred options, which will be assessed
in detail. The processes described in the following stages will separately assess each of the

71
shortlisted options. This information needs to be assembled to enable the undertaking of
the financial and economic CBA of the project.
The alternatives identification is linked to the LFA.
The project appraisal involves comparing life-cycle costs and benefits of the reference
project and feasible project alternatives. Project promoters should refine the alternatives,
including technical variants of the reference project, which have been shortlisted in the
pre-selection stage and should consider introducing any realistic new alternatives that
may have been overlooked at Pre-Selection. This stage still should maintain a degree of
flexibility in terms of introducing alternative comparators against which to test the
preferred project.
6.3.3 Objective analysis
Defining the project goals, objectives and scope
Once the preferred alternative is chosen, its scope statement should be developed. The
project scope is foundational because it defines what work is part of the project and what
is not. It establishes the project's purpose, what it will accomplish, and how it will achieve
it. Effectively, the scope defines the project. Poorly defined project boundaries, or
boundaries that move throughout a project, can be the project and career killers.
The scope statements
The essential thing in a scope statement is to be specific. The more, the better. In a perfect
world, you could write out a list of all the work involved in a project, down to the last nail
and screw, and have all stakeholders approve of it. Unfortunately, it's not a perfect world,
so the scope statement must stop somewhere. However, every well-defined project
boundary represents a slightly more bulletproof project.
A good scope statement includes the following things:
• Overall description of the work
• Deliverables. What will be produced by the project, and what are its key features?
Also, what client need is the project satisfying?
• Justification for the project. To provide a complete understanding of the scope,
sometimes it is necessary to dive into the rationale of why the project was initiated in
the first place.
72
• Constraints. If the project faces certain physical boundaries, these can be a source of
risk and thus should be defined further.
• Assumptions. All projects have assumed certain conditions as part of their existence.
What are those assumptions, and what impact does their inaccuracy have on the
project?
• Inclusions/Exclusions. Many projects have uncertain items because projects of that
type/size sometimes do and sometimes don't include those things. They need to be
explicitly included or excluded from the project.
Project goals and objectives should be SMART:
• Specific. If your goal is simply "to improve," you probably won't
• Measurable. Many worthy goals are not easily measurable, and their success or
failure gets drowned out by the debate.
• Achievable. There's nothing more demoralising than being given goals that are
outside of someone's abilities.
• Relevant. It to say that it's easy to set goals for secondary things. Keep them focused
on the critical performance metrics.
• Time-bound. You can do everything else right, but you still need to have a time
frame to achieve the goal.
6.3.4 Strategic option analysis (identify and choose project alternatives)
Identifying and selecting project alternatives
A Project Alternative is another combination of the project's costs, schedules, resources,
and risks that allow the same results compared to the project baseline. It is another way
to produce the project and address the business need while using the same resource base
yet operating in a new project environment and facing new working conditions. Another
name of the Project Alternative is the Project Option.
Managing project alternatives means performing a complex activity dedicated mainly to
identifying alternative methods of achieving the same results. Project alternatives
management is closely linked to an idea generation process. Such a process assumes
selection and validation of the ideas that suggest an alternative and effective way to any
given approach of project management and delivery. The idea generation process admits

73
using such techniques and tools as brainstorming, lateral thinking, and pair-wise
comparisons. The same techniques & tools can be applied to identifying and managing
project alternatives.
Alternatives management results in developing a formal Project Alternatives Table (PAT)
that combines all the information about reasonable alternatives approved and their
unique and common features. The development of the document is critical because it
determines all available options for successful project implementation to achieve business
buy-in and ensure that the options are under consideration of the key stakeholders. The
identified and considered alternatives for the project become potential solutions to be
analysed later as a part of the FS.
Project alternatives
They may include measures other than expenditure on new public sector capital assets and
direct public provision of services, such as improved regulatory control or subsidies to
private sector service providers. Some examples of alternatives that may be considered
are:
• Using different technological approaches or different technologies
• Varying the timing, phasing and scale of a capital investment
• Renting, building or purchasing facilities
• Refurbishing existing public facilities instead of building new
• Changing the balance between capital and recurrent expenditure, such as by
choosing between more or less capital-intensive service provision
• Sharing facilities with other agencies
• Changing locations or sites; and
• Improved implementation of existing measures or initiatives instead of
investing.
When defining alternative interventions, a “Business-As-Usual (BAU)” or “with-out
project” alternative must always be defined, against which the reference project and the
short-listed alternatives will be compared. The BAU alternative should generally be
equated to doing nothing (the “do-nothing” alternative) unless this is extremely
unrealistic, in which case a “do-minimum” alternative may be defined.

74
Once the problem and rationale for government intervention are justified, it is important
to have a clear statement of the objectives of the project so that appropriate
alternatives for achieving these can be considered further. As well as assisting in defining
project alternatives a good specification of objectives is essential for monitoring the project
during implementation and for evaluating its performance on completion.
A key aspect of project appraisal is testing the “reference” project against alternative ways
of achieving the same objective. The hierarchy of objectives for the project should be
defined as follows:
• Overall Objective: General objectives such as income increases, standard of living
improvement, poverty reduction, natural resources protection etc. to which the
purpose is going to contribute
• Project Purpose: The project’s central objective expressed in terms of the achievement
of sustainable benefits for the target group
• Project Outcomes: Achievements created by the project, which produce the services
or facilities corresponding to the project purpose
• Project Outputs: These are the deliverables, products or services created by the
project
It is at the level of the project purpose that alternative approaches can be identified. For
example, the construction of a new road is not the only way of reducing travel costs and
improving safety. There are other ways of achieving the project’s purposes such as
improved traffic management procedures, increased police controls, congestion charging
and installation of speed cameras. Some of these alternatives will not need capital
investments.
The project outputs are the things that will need to be delivered to achieve the purpose.
For example, for the road construction project, it is expressed in terms of km o road
constructed. Alternatives to road construction would have different outputs. These might
be completely different outputs from the reference project for radical alternatives to road
construction or not dissimilar for alternative routes.
The scope of the project will have been defined in broad terms in the PCN. For
appraisal, the scope described in the PCN must be reviewed and given more detail. This
involves setting out all the project outputs, i.e., what will be delivered by the project upon
completion, and the main activities required to accomplish these outputs. The intention

75
should be to demonstrate that all the necessary activities have been captured and that the
planned outputs are sufficient to achieve the purpose of the project, i.e., sustainable
benefits for the target group.
For analytical purposes, the project boundary should extend to all activities and outputs
necessary to deliver the intended benefits, even if these come under the responsibility of
another economic entity. Access roads, utility connections or staff training provided by
another economic entity would be examples of project components that should be
included, even if the costs do not fall upon the economic entity promoting or sponsoring
the project.
Ultimately, the definition of the project scope should be sufficient to reach a conclusion
on whether the project represents a sufficiently comprehensive answer to the
issue/problem identified as requiring a solution.
The implementation of the alternative's development process includes the following steps:
i. Identification of alternatives
The project appraisal involves comparing life-cycle costs and benefits of the reference
project and feasible project alternatives. Project promoters should refine the alternatives,
including technical variants of the reference project, which have been shortlisted in the
pre-selection stage and should consider introducing any realistic new alternatives that
may have been overlooked at Pre-Selection. This stage still should maintain a degree of
flexibility in terms of introducing alternative comparators against which to test the
preferred project.
At this step of the process, a range of reasonable alternatives that address the business
need and meet the project purpose is to be identified. The key idea here is to define
possible yet practical options that are developed in response to critical business issues and
to fit the purpose while minimising environmental impacts. First, a set of potential project
alternatives will be proposed; then, employing analysis and forecast methods, the cost-
effectiveness of each alternative proposed will be measured, and thereby the reasonable
alternatives will be identified. Then a table of the alternatives will be created – this table
will include both unique and common features of each practical option. The PAT will be
used further for alternatives comparing.

76
ii. Comparison among alternatives
A review of identified alternatives should be conducted; both unique and common features
of the alternatives should be compared. A comparison matrix of identified alternatives will
be created using the information taken from the PAT. The matrix will include similarities,
differences, and how each of the alternatives meets the project evaluation criteria and the
business need. The Project Alternatives Comparison Matrix (PACM) is especially helpful
for complex projects with multiple alternatives.
After comparing and weighing all the benefits and impacts of all the reasonable
alternatives listed in the PACM, one or several alternatives showing the best compliance
with the business requirements will be selected and sorted out by relevance.
iii. Selection of preferred alternative
At this step, the rationale for identifying and selecting the preferred project alternative
should be established. Such an alternative should be analytical and address the specific
evaluation criteria regarding the business need. Then the preferred alternative will ensure
achievement of the project purpose and realisation of the business benefits. It will be
added to the final version of the project alternatives document.
Note: If two or more alternatives are equally suitable, they can be added to the document,
but this decision may require additional consideration. The range and number of preferred
project alternatives will depend upon such factors as scope, business need, resource base,
overall duration, others.
Developing Log Frame Matrix
Logical Framework Matrix. A useful tool to display and organize the project idea
resulting from the ex-ante evaluation is the LFM, which summarizes what the project
intends to do and how it will achieve it; what the key assumptions are, and how the inputs
and outputs of the project will be monitored and evaluated. It consists of a matrix with
four columns and four rows, which summarizes selected aspect of an activity design,
namely:

77
• What the activity will do, and what it will produce (Activity Description)
• The activity’s hierarchy of objectives and planned results (also Activity Description)
• The key assumptions that are being made (Assumptions), and
• How the activity’s achievements will be measured, monitored and evaluated
(Indicators and Means of Verification).

78
Table 2 shows the structure of the LFM. The vertical logic of the matrix represents the
project objectives: The first column of the LFM shows the End, Purpose, Components and
Activities of the project. The first row is the target level corresponding to the End, the Goal
or Impact of the project, it is a description of the solution to a long-term problem that the
project is expected to contribute (consistent with the purposes of the Objectives/ Solution
Tree). The second row develops Purpose level that corresponds to the central objective of
the project, or the direct results to be obtained on the beneficiaries, once the
implementation period is completed (coincides with the focus of the objective tree); the
third row shows the Components, which corresponds to the development of products or
services to be offered as a result of the project (matching media objectives tree). Finally,
the fourth row is the Outputs they specify the main tasks to be performed to produce the
components previously identified.

79
Table 2 - Logical Framework Matrix – Generic structure and content of LFM
ACTIVITY DESCRIPTION
INDICATORS MEANS OF VERIFICATION
ASSUMPTIONS
Goal or Impact – The long-term development impact (policy goal) that the activity contributes at a national or sectoral level
How the achievement will be measured – including appropriate targets (quantity, quality and time)
Sources of information on the Goal indicator(s) – including who will collect it and how often
Purpose or Outcome – The medium-term result(s) that the activity aims to achieve – in terms of benefits to target groups
How the achievement of the Purpose will be measured – including appropriate targets (quantity, quality and time)
Sources of information on the Purpose indicator(s) – including who will collect it and how often
Assumptions concerning the Purpose to Goal linkage
Component Objectives or Intermediate Results – This level in the objectives or results hierarchy can be used to provide a clear link between outputs and outcomes (particularly for larger multicomponent activities)
How the achievement of the Component Objectives will be measured – including appropriate targets (quantity, quality and time)
Sources of information on the Component Objectives indicator(s) – including who will collect it and how often
Assumptions concerning the Component Objective to Output linkage
Outputs – The tangible products or services that the activity will deliver
How the achievement of the Outputs will be measured – including appropriate targets (quantity, quality and time)
Sources of information on the Output indicator(s) – including who will collect it and how often
Assumptions concerning the Output to Component Objective linkage
Source: Australian Government (2005, pp. 3).
Assumptions refer to key factors outside the direct control of the project team, which
must hold true if the project is to achieve its results, purpose or goal. If the assumptions
do not hold true (certain events do not occur), then this may have a negative impact on the
project. Identifying assumptions (or risks) are critical as these may have a strong influence
on the project’s likelihood of success.
Means of verification specify where to gather the information needed to calculate the
indicators, so that you can perform the measurement. The assumptions consider those
risk factors in achieving different levels of objectives, which are outside the direct control
of project management, and that have a high probability of occurrence and impact on
outcomes. Sources of verification refer to:

80
• How the information for indicators should be collected (survey, document analysis,
measurements, etc.).
• Who should collect it.
• When it should be collected.
In determining sources of verification, the project team should consider whether
appropriate sources already exist. Where new sources are required, it is important to
consider the cost of data collection, as well as how valid and accurate the data collection
process is.
Where indicators relate to a specific change in a condition, baseline data (what is the
current state of things) may be required. This will mean that the source of verification
requires both baseline and post-project data and data sources. The indicators and sources
for the baseline and post project data may be the same, however you will obviously collect
the data at different times in the project.
Indicators include information necessary to track the project and assess the achievement
of the objectives at the level of goal, purpose, components and activities proposed in the
ex-ante evaluation. Indicators provide a means to assess the project’s success. This is
especially important for the purpose and goal; as various stakeholders may interpret these
differently. One way to think of indicators is to visualize what a successful project would
look like, that is, what conditions should be met. Indicators need to be closely linked to
what you are trying to measure, so that you are confident that what you undertook was an
important factor in the observed result.
In developing LFM, the following points need to be considered:
• The matrix should provide a summary of the project design, and its length will be
dictated by the project’s complexity.
• The matrix should only describe the main, or indicative, activities. The detailed
activities should be documented separately in an activity schedule.
“If you can still ask ‘how’ questions and not find the answer in the draft log frame (with
the accompanying draft work plan showing activities), then it is not complete.”
Once the LFM is considered sound, the structure can then be used as a framework for
preparing implementation, resource and cost schedules. These schedules should be clearly
and logically linked to log frame components and outputs through the use of appropriate

81
reference numbers. Activities leading to outputs can (as appropriate) be specified in more
detail and scheduled on a Gantt chart format (implementation schedule). The inputs
required for each set of activities and/or outputs can then be specified and also scheduled
over time. Finally, the cost of inputs can be determined, and an activity budget estimate
and cash flow calculated.
Coming back to the Case Study, the next step is to bring the information of the Solution
Tree and the selected alternatives to the Logical Framework Matrix. Let us assume that
the decision was to select three overall goals or ends:
1) Contribute to reducing the tendency to rejection of the elderly in the community
2) Contribute to improving the quality of life of older adults served by the program
3) Contribute to reducing the mortality of older adults served by the program
Then, the project’s purpose shall be: Older adults from the Kibera community in a
situation of helplessness, self-supporting and bedridden, are treated comprehensively in
health, nutrition, psychological orientation, legal support, employment, and literacy.
LFMNarrative summary of
objectivesKey performance indicators
Means of verification
Assumptions and risks
End
1) Contribute to reducing the tendency to rejection of the elderly in the community
1) 70% of those interviewed answered that they have improved their perspective towards older adults thanks to the Program
Results of the survey designed for this purpose The financing
entities continue to support the
Program with resources for
their. continuity
2) Contribute to improving the quality of life of older adults served by the program
2) 80% of those attended answered that they have improved their quality of life a. starting from. the benefits received by the Program
Results of the survey designed for this purpose
3) Contribute to reducing the mortality of older adults served by the program
3) The mortality of those assisted by the Program is reduced by 15%
Results of the survey designed for this purpose

82
Then, the components of the Project are selected:
1) Program to dignify the image of older adults implemented
2) Psychological care for older adults implemented
3) Employment and self-employment program for the elderly implemented
4) Literacy program implemented
5) Food and nutrition program implemented
6) Gerontological health program implemented
7) Legal advice and support program implemented
LFMNarrative summary of
objectivesKey performance indicators
Means of verification
Assumptions and risks
Purpose
Older adults from the Kibera community in a situation of helplessness, self-supporting and bedridden, are treated comprehensively in health, nutrition, psychological orientation, legal support, employment, and literacy
1) 80% of the older adults summoned are cared for comprehensively one year after having designed the Program
Administrative records of the follow-up and monitoring of the Program
Older adults regularly attend the services offered to them in the Program
2) Illnesses in older adults treated 1 year after designing the Program are reduced by 20%3) 30% improvement in the nutritional status of the elderly cared for4) The psychological problems of the elderly cared for are reduced by 40%5) 80% of the elderly cared for have legal support in the defense of their assets 6 months after starting the Program6) 50% of the elderly cared for have a fixed income7) 80% of the elderly cared for know how to read and write one year after starting the Program

83
And finally, the activities for each component are selected. Let us assume that these
activities are common for all components.
1) Preparation of the beneficiary selection list
2) Program Design
3) Consolidation of work teams
4) Obtaining resources and financing
5) Procurement of facilities and equipment
6) Operation and commissioning
7) Monitoring and evaluation
LFMNarrative summary of
objectivesKey performance indicators
Means of verification
Assumptions and risks
Components
1) Program to dignify the image of older adults implemented
1) Program to dignify the image of older adults implemented according to specifications 3 months after its design
Design documents of each validated Program
Students are willing to participate in the Program
2) Psychological care for older adults implemented
2) Psychological care for the elderly implemented according to specifications 3 months after its design
3) Employment and self-employment program for the elderly implemented
3) Employment and self-employment program for the elderly implemented according to specifications 6 months after its design
4) Literacy program implemented
4) Literacy program implemented according to specifications 6 months after its design
5) Food and nutrition program implemented
5) Food and nutrition program implemented according to specifications 6 months after its design
The companies contacted are willing to hire older adults
6) Gerontological health program implemented
6) Comprehensive gerontological health program implemented according to specifications 6 months after its design
7) Legal advice and support program implemented
7) Legal advice program implemented according to specifications 3 months after its design

84
LFMNarrative summary of
objectivesKey performance indicators
Means of verification
Assumptions and risks
Activities
NOTE: These activities are common for all components. 1) Preparation of the beneficiary selection list
Itemized budget
Administrative and accounting records of each Program
There are resources for the preparation of the list of beneficiaries
2) Program Design
3) Consolidation of work teams
4) Obtaining resources and financing
5) Procurement of facilities and equipment
Donors are willing to provide resources for the execution of the Programs
Operation and commissioning
7) Monitoring and evaluation

85
7 THE PROJECT PRELIMINARY
SCREENING
The pre-selection process is the decision point that involves a formal decision on whether
to proceed to more in-depth project planning and appraisal. Pre-selection prevents public
financial resources from being wasted on redundant feasibility studies and assists in
restraining expansionary pressures on the budget by containing the project pipeline. Pre-
selection also provides an important opportunity for the line ministries to: test the
robustness of a PCN in terms of logic, risk and sustainability; reject unsuitable project
alternatives; and identify those alternatives that are worthy of further appraisal alongside
the reference project. The approach to further studies is also outlined. Finally, the pre-
selection stage also offers an opportunity to feed lessons from the ex-post evaluation of
similar completed projects, where available, into the initial design of new projects7.
All projects, whether financially significant or non-financially significant, are
expected to follow the formal pre-selection process, although some lessening of the
intensity of research and analysis is acceptable for low cost, non-financially
significant projects with limited recurrent cost implications. A positive pre-
selection decision requires that the strategic policy relevance, rationale and realism
of the project idea has been demonstrated to the satisfaction of the relevant
decision-makers and a convincing case has been made to justify expenditure on
further planning and analysis.
A robust pre-selection/screening process provides the opportunity to halt weak
ideas/proposals before they advance too far in the planning process or before there is too
much political commitment behind them. Using a pre-selection tool, projects undergo a
preliminary screening and only those better assessed can proceed to further steps.
In addition, pre-selection introduces gradualism into the assessment process creating
space for reflection on the declared merits of the project, its logic and its coherence with
government and sector strategic policy priorities. So, pre-selection provides an
opportunity to make the PIM System more efficient, by producing a short-list of good
projects to go to more advanced steps into the project cycle.
7 The project preliminary screening is a tool that can be used for the selection of the PCN at the initial stage (PCN), at the Pre-feasibility Stage or at the Feasibility Stage.

86
This project pre-selection criteria tool should assist government officials involved in
capital budget preparation to manage efficiently, at a basic level, the use of project
selection criteria in the project cycle. In addition, this tool supplements all other budget
and investment manuals applicable for the relevant government administrative bodies at
central level. However, at the budgeting stage a complementary project selection
methodology could be developed in the future, based on this preliminary tool (adding
more complete or sophisticated criteria for a holistic final project selection).
In the context of this manual, this tool is proposed to be used during the capital budgeting
process. In this regard, the project portfolio at PCN, PFS and FS stages, might contain
projects with different levels of maturity. Some projects may be ready to be executed while
other can’t spend the assigned funds because they require some additional time to finish
their detailed design, or need to complete the expropriation process before they can
purchase the land, or they may require some additional permits, legal restrictions, etc. In
all those cases, the use of this guide could help to identify those projects that are tying up
resources and re-assign these funds to those “shovel ready” projects that can really
disburse.
Pre-selection involves a formal decision on whether to proceed to more in-depth project
planning and appraisal. The objective is to exclude from further development those
projects that:
• Are inconsistent with government or sector priorities;
• Are unlikely to be economically viable; and / or
• Have little chance of being affordable under foreseeable fiscal constraints.
In addition, pre-selection prevents public financial resources from being wasted on
redundant pre- feasibility and feasibility studies and assists in restraining expansionary
pressures on the budget by restricting the projects that are not viable.
Project selection involves the approval of a project for financing and its eventual inclusion
in the annual budget. Typically, approval must take place when a group of projects had
passed through the appraisal process and be prioritized to be considered for financing
against the available investment resource envelope. Then, the role of the selection process
is to endorse (or reject) the project appraisal and confirm that the project it is a good case
for investment.

87
7.1 THE CONCEPTUAL APPROACH
Multi Criteria Analysis (MCA)
It is based on the decision-making process and requires the application of comparison
methods to support the decisions: a decision process necessarily implies the comparison
between the alternatives. Then it is necessary to decouple a problem from the elements
that compose it; this allows for subsequent comparison establishing a hierarchy among
them.
Decomposing the problem between its parts allows one to include all its multidimensional
variables. Therefore, it should be recognized that different variables must be represented
by a common scale. Then, the application of MCA requires the following steps:
i. Criteria definition
ii. Definition of variables
iii. Model’s definition. deterministic or random.
iv. Aggregation methods definition
Between other advantages, MCA add flexibility to the decision process, since the tool can
be recalibrated to accommodate improved and new and available data. In addition, MCA
helps to support decision process under political pressure, relatively lack of information
and capacity limitations. In third place, MCA helps to deal with multiple priorities,
complex situations, criteria, scales and aspects, type of data and uncertainties. Fourth,
MCA is pragmatic, dealing with many dimensions simultaneously. Fifth, and very
important, it is easy to understand.
Regarding the limitations and weaknesses, the MCA is a second best compares to Cost
Benefit Analysis on the project selection; second, there also could be subjective
manipulation of weights and criteria to privilege certain projects over others. To avoid
these problems, it is needed to implement a transparent process to select, define and
implement the decision criteria, the criteria weighting and the source of data, among other
measures.
In summary, the selection of criteria is essential to capturing the most important costs and
expected impacts of a project, as well as performance with respect to prioritized
development goals for the sector and country as a whole. In this sense, the Multi‐criteria
88
decision approaches formalize the inclusion of non‐monetary and qualitative factors into
decision analysis and can be useful when information or analytical resources are limited
(Marcelo et al, 2016).
The pre-selection framework
The proposed pre-selection framework considers the application of three simultaneous
filters.
• The first criterion, Profiling analysis provides a project profiling; ergo, the
qualitative validation of project proposals, to determine if it is eligible to be part of the
GoK priorities. Also consider if the project is aligned to sector strategic priorities and
assess the consistency of project objectives to Medium Term Development Plans,
Sector Plans, Strategic Plans, policies and needs of project beneficiaries.
• The second criterion, Pre-appraisal provides a quantitative assessment,
including technical, costing and economic benefits impact analysis of the project.
• The third criterion, the Viability analysis provides a qualitative assessment of
the affordability of the proposed project, examining the risks of project outputs and
outcomes; also assesses the likely sustainability in terms of finance (budgetary
impact), management capacity, environment, security and society/community and
other external impacts.
These criteria, acting at the same time, establish a Pre-Selection Framework that
contributes to the implementation of the NATIONAL DEVELOPMENT PRIORITIES AND
PLANS. Figure N°18 below shows a schematic outline of the framework. The framework
provides a channel through which to implement the NATIONAL DEVELOPMENT
PRIORITIES AND PLANS in the short run, improving the efficiency of public investment
projects, in order to deliver a set of complete and profitable projects.

89
Figure 17 - Schematic Overview of the Pre-Selection Framework
Source: Own elaboration based on international best practices.
Together, these quality/quantity-in entry processes are a complete filtering system, by
which projects are passed through finer and finer sieves to arrive at a set a best project.
The following are the specific criteria, indicators and sub-indicators proposed as a
reference to pre-select projects in the local context. However, these indicators should be
validated and modified accordingly. This Technical Guide is based on an integrated project
selection analysis that is useful for performance measurement in terms of the development
performance of public investment programs and projects, through the linking between
project planning and budgetary allocation.
7.2 PROFILING
This criterion assesses the relevance and compatibility to NATIONAL DEVELOPMENT
PRIORITIES AND PLANS and other sector strategies; it refers to the assessment of
projects to measure design and time of evaluation in relation to the consistency of project
and program objectives against the beneficiaries’ requirements, the country’s needs, and
global priorities. In other words, it is a measure of the consistency of project objectives,
associated with the needs of project beneficiaries and the relevance of the project to the
policies and priorities of the sector and its alignment with the NATIONAL
DEVELOPMENT PRIORITIES AND PLANS.
ViabilityImplementation and sustainability
DECISIONProject pre-selection
Preliminary Analysis
Preliminary fin & econ analysis
Profiling
Intervention logic and strategic priorities

90
7.2.1 The general evaluation
The general evaluation refers to a first approach to the project, providing a general view of
the project. Any specific aspect of the project will be addressed in other indicators.
Among other, it is suggested to include a general project assessment, considering topics
as the information provided in the project is adequate to arrive at a pre-selection opinion;
and a general opinion on the project sponsor organization.
7.2.2 The problem identification
The starting point for a project solution should be a clear identification and
description of the problem.
Any project formulating/sponsoring agency must first clearly identify the problem that
gives rise to the idea of a given project. The identification process implies undertaking the
identification of gaps in the economy and the definition of investment priorities for the
public sector. The gaps in the economy could lie in one or more sectors; for example, basic
infrastructure, agriculture, heavy or basic industry, or social sectors such as health and
education.
A typical project background must consider a description of a the problem that requires a
solution, including: (1) the area of influence of the project; (2) the target and affected
population situation; (3) the present and projected demand, supply, and deficit of the
service to be provided by the project; (4) an indication of the severity of the problem
should be given and this should preferably be a quantitative measure; (5) the relevance of
project proposal; (6) the needs assessment. Project promoters are then required to explain
(briefly) how the project will address the cause(s) of the identified problem.
7.2.3 The project justification and the strategic case
In addition, it is required to identify different options to solve the problem, or alternative
projects. In examining solutions, and when rejecting or selecting alternatives for further
study, project promoters should take into account the relevant findings from project
completion reports and ex post evaluation studies from similar projects. Ideally, all PCNs
should consider filling out their log-frame matrix as evidence of project preparation.
The scope of the project should be sufficiently wide to capture all the expenditures needed
to deliver the project outputs and achieve the intended purpose. The proposal requires a
description of the project and its components, supported by an explanation of how these

91
represent a comprehensive solution. During identification, project promoters will need to
convince themselves that the scope of the project is appropriate and that critical
components or activities have not been omitted.
The strategic case for the project. This is a critical component of a core pre-selection
criterion: the project should demonstrate its relevance to the Government’s strategic
priorities and sector policies. This is a key requirement that must be fulfilled; because even
if the project demonstrates a logical case for intervention and adequate demand, it may
still not be a strategic priority.
7.3 PRELIMINARY ANALYSIS
The pre-appraisal refers to a preliminary impact analysis.
7.3.1 Demand analysis
The impact on demand analysis examines whether there is a demand for the
goods/services of a project both in the domestic market and abroad. Demand corresponds
to how much of a good or service to meet a populations’ need for it. The demand must be
measured in appropriate quantities, i.e. number of medical visits per year, litres of
drinking water per day, etc.
7.3.2 Technical and engineering analysis
The technical and engineering analysis is a key issue in the project process selection. It is
also concerned with issues such as the size of the project, the current supply of goods and
services, project components description and the technology to be adopted.
The final detailed engineering design could be a critical issue, regarding the project
implementation. In later stages of project investment decision, the project must address
matters as need for prototypes, solid modelling, drawings, blue prints and specifications.
Also, incorporating the analysis of the various technological alternatives allows decisions
about the optimal size and time to carry out the project.
7.3.3 Legal and institutional analysis
The legal and institutional analysis deals with the adequacy of the project with the legal
and institutional framework. Insufficient attention to the legal and institutional aspects
can lead to problems during the implementation and operation of the project.
92
7.3.4 Implementation cost estimates
The proposal should include indicative implementation cost estimates for the project itself
and its relevant alternatives. In principle, these estimations should include all
implementation expenditures required to create a fixed asset, capable of delivering the
anticipated benefits to end-users (detailed design, land acquisition, construction, plant
and equipment, and fixtures and fittings).
It is recognized that, at the project conception stage, there is no preliminary design, so
detailed item-by-item costing is not possible. However, even if notionally, estimations
should encompass all the elements of capital costs required to achieve the project’s
purpose. Estimated costs for project preparation (preliminary design, feasibility study,
impact studies, etc.) should also be indicated, but separately. Where available, the unit
cost of a similar completed project should be reported. In addition, verifying the
information sources on costing provides an important contribution regarding the project
implementation reliability (in terms of Capital Expenditures (CAPEX) and Operational
Expenditures (OPEX)).
7.3.5 Benefits analysis
The beneficiaries and benefits must be clearly identified and closely related to the problem
the project address to solve. Even when goods and services may not necessarily be paid
for, users may still receive benefits, e.g., time and vehicle operating cost savings for road
users, amenity benefits for users of parks, or increase in the level of services for public
building projects. External benefits and costs of the project should also be highlighted (for
example, increases or decreases in noise nuisance or air pollution from transport projects).
The estimated benefits also must be compared with similar projects or against related past
experiences.
7.3.6 Preliminary financial viability
The project should include a preliminary assessment of its financial viability, assessing the
integration of financial and technical variables from the demand, technical and
management analysis. As well, it is needed to explicit the cash flow-profile and identify
key variables to conduct the economic and social analysis.

93
7.3.7 Preliminary economic viability
The project should include a preliminary assessment of its economic viability, assessing
whether it is likely to be a worthwhile use of public money. It will not be possible to come
up with a definitive answer concerning the economic viability of a project before the
completion of a pre-feasibility or feasibility studies, those involves cost benefit analysis (or
cost-effective analysis in cases where benefits are difficult to quantify). Nevertheless, when
the project evaluation criteria are available, it should be highlighted.
7.3.8 Preliminary distributional impacts
The project could include a preliminary assessment of the distributional impacts,
assessing if economic externalities have been estimated and distributed among the
different stakeholders.
7.3.9 Preliminary PPP analysis
The projects should be considered to potentially be a PPP, only in the case of one or more
of the following possible drivers are met:
• More effective management under a PPP delivers the infrastructure asset quickly,
with higher quality, and with more cost-efficiently than the public alternative.
• A PPP whole-of-life costing approach is expected to be lower than the lifetime public
cost of the project
• PPP private management is expected to allow for innovation in infrastructure service
delivery, resulting in higher quality and lower cost.
• PPP contributes to reduced public liabilities and fiscal risk, compared to public
provision.
• PPPs may increase revenues available for funding infrastructure assets and services.
7.3.10 Preliminary environmental impacts
The project could include a preliminary assessment of the environmental impacts,
assessing the existence of environmental effects (positive or negative), the potential
implementation of addressing plans for environmental impacts (if relevant), or the
fulfilment of green standards and others (where applicable and relevant).

94
7.3.11 Preliminary risk analysis
The project could include a preliminary risk assessment to identify the key variables could
affect the project results and to stimulate the definition of potential scenarios, in order to
propose mitigation plans to reduce the project exposure to uncertainty.
7.4 VIABILITY
The implementation and sustainability refer to the assessment of the affordability of the
proposed project. This assessment examines the risks of program and project outputs and
outcomes, and assesses the likely sustainability in different aspects. Therefore, it is linked
to potential constraints and affordability considerations.
7.4.1 Budgetary impact
Setting out the budgetary impact of the referenced project in financial terms is a key
matter. Budgetary impact includes both CAPEX and OPEX. In addition, any revenues
earned directly from the project should also be reported. The project must contribute to
demonstrate the existence of adequate fiscal space for the entire implementation period,
by comparing implementation costs to medium-term allocations and trends, ongoing
commitments and projected spending on agreed new initiatives. Any funding gaps should
be identified and proposals for filling them should be outlined. Project promoters should
include relevant provisions in the budget.
7.4.2 Implementation needs analysis
The project should include an initial description of implementation arrangements and an
assessment of whether implementation could face any constraints or impact negatively on
other projects. At the implementation arrangements should be highlighted any
characteristic of the on-going projects that would suggest an immediate action. These
aspects can be related to procurement methods, adequacy of human resources, Permits to
Work (PtW), costs overrun, schedule slippage, legal aspects, needs for more studies, etc.
7.4.3 Potential constraints
The project should demonstrate concise evidence of resources availability and must
identify any other potential implementation constraints, including a proper procurement
analysis. An indicative timeframe for the project implementation is desirable.

95
7.4.4 Affordability considerations
Delivering sustainable benefits for end-users requires more than capital investment alone.
It also requires that the organization responsible for operating and maintaining the facility
has sufficient managerial and financial capacity to ensure the efficient utilization of the
capital asset created. The project should demonstrate initial plans for operational
sustainability, in particular in relation to affordable funding for sustainable operations
and maintenance. These considerations may include budget financing or user charges. If
users are to be charged for the provision of services, it is needed some preliminary
evidence showing that they will be willing and able to bear the charges and whether these
charges are likely to be sufficient to cover – at least – operating, maintenance and
depreciation costs. If funding from the public budget is expected, its affordability should
be considered in relation to trends and other competing claims.
7.4.5 Other/external impacts
Then, identification of external effects could be very helpful to warranty the project
sustainability. In addition, critical factors for effective project implementation must be
adequately identified and described.
7.5 THE APPRAISAL CRITERIA TOOL
The following table proposes an example for a set of criteria for the pre-selection of
investment projects. The table must be filled out with different scores (mainly related to
compliance – or not – with the sub-criteria).

96
Table 3 - Pre-selection criteria and indicators
Core Criteria Sub-Criteria / Indicators Pre-
Score Weight
Final-Score
PROFILING General evaluation. Ref.: it should be referred to the PCN.
(sum) 3
The information provided in the project is adequate to arrive at a pre-selection opinion.
0;1
The organization and implementing project framework is clear: who will be responsible for delivering the project on time and to budget is properly identified (yes/no).
0;1
Problem identification. The problem or opportunity to be addressed is clearly demonstrated and the way in which the project will help solve the problem or respond to the opportunity is explained and makes sense.
(sum) 5
• The project uses a log frame approach to present the solutions (yes/no)
0;1
• Project rationale and justification (yes/no)
0;1
• Consistency with national, sector and governorate-level development goals/strategies/territorial/sector master plans (yes/no)
0;1
Project justification. The description of the scope of the project is sufficiently detailed for pre-selection stage and there are no obvious omissions of major components that could potentially jeopardize the achievement of the project purpose (yes/no).
0;1 1
Strategic case for the project. To set the project in the broader context of government policy, the following must be demonstrated in the PCN:
(sum) 5
• Project is part of a National Priority Programs and/or if it is linked to the KENYAN NATIONAL PRIORITIES (the National Development Framework).
0;1
• Project is coordinated with current and relevant programs and projects.
0;1
• The infrastructure sharing is adequately identified and recognized.
0;1
• Alternative and other options analysis to address the problem is adequately described.
0;1

97
Core Criteria Sub-Criteria / Indicators Pre-
Score Weight
Final-Score
PRELIMINARY ANALYSIS Demand analysis (sum) 2
• Geographic Impact of Project adequately described.
0;1
• Specific target group intended to benefit from the project adequately described.
0;1
• Groups who may be negatively impacted from the project adequately identified.
0;1
• Demand the project will satisfy. Quantification of the people that will be supported by the project.
0;1
• Indicate the current demand for the output this project will address.
0;1
Technical and engineering analysis (sum) 2
• Current supply and/or conditions in area that this project will improve upon clearly identified.
0;1
• Outputs that will be produced by this project meet the identified demand adequately.
0;1
• Proposed technical solution is appropriate to the problem identified, i.e., the envisaged technology is neither too advanced nor over-specified (yes/no).
0;1
• Describe how the project and its components provide a comprehensive solution to needs of the target area.
0;1
Legal and institutional analysis: alignment with the legal and regulatory framework (yes/no).
0;1 3
Implementation costs estimates (sum) 3
• Estimated Cost of project implementation.
0;1
• Details on quantity: measure of the planned amount of goods or services to be generated by the project (yes/no).
0;1
• Source of information: none, secondary (conceptual design: averages, websites, expert opinion) sources or primary (detailed data: detailed design, well-defined specifications, final data, plans, actual quotes, final prices in contracts) sources.
0;1;2
• Expected project duration (years) for Construction.
0;1

98
• Expected Project duration (years) for Operation.
0;1
Benefits analysis (sum) 3
• The proposed project benefits are plausible and the target beneficiaries represent a priority for government (yes/no).
0;1
• Benefits to users are likely to be achievable at an acceptable cost, for example, approximate capital costs per user or per unit of output are in line with comparable projects and/or international experience (yes/no).
0;1
Financial viability (sum) 3
• Sources and costs of financing are clearly identified (yes/no)
0;1
• Minimum cash flow
requirements for stakeholders are clearly identified (yes/no).
0;1
• There is an estimation of the FNPV, FIRR o FPVC (yes/no).
0;1
Economic viability (evaluation criteria). (sum) 3
There is an estimation of the ENPV, EIRR o EPVC (yes/no).
0;1
The estimation of economic costs and benefits is realistic and adequate (yes/no).
0;1
Distributional impacts. There is an estimation of the economic externalities, distributed among the stakeholders (yes/no).
0;1 2
PPP potentiality (sum) 2
• PPP would result in more effective management: payments are linked to performance; the right risks can be transferred to the private party (yes/no).
0;1
• Lifetime cost. Sufficient private capital is involved to ensure the private party faces a strong incentive to perform over the long term (yes/no).
0;1
• Private management would allow for innovation: delivery service can result in higher quality and/or lower cost (yes/no).
0;1
• PPP would lead to a reduction in public liabilities and fiscal risk compared to public financing and provision (yes/no).
0;1
• PPP would increase revenues. Revenue risk (demand and payment risk) can be
0;1

99
transferred to the private sector (yes/no).
Environmental impacts 0;1 3
• There is an estimation of the environmental effects (positive or negative) (yes/no).
0;1
• There is an implementation plans for addressing environmental impacts (if relevant) (yes/no).
0;1
Risk analysis. There is a rigorous identification of key variables that could affect the project results in regards of uncertainty (yes/no).
0;1 3

100
Core Criteria Sub-Criteria / Indicators Pre-
Score Weight
Final-Score
VIABILITY Setting out the budgetary impact (sum) 3
• The medium- to long-term budgetary impact of the project is not inconsistent with budgetary projections and trends, considering the existing commitments of the economic entity proposing the project (yes/no).
0;1
• Existence of funding plan (yes/no)
0;1
• If the project is to be implemented and operated by a self-financing economic entity, its financial overall position - cash flow and solvency - is sound and likely to remain so (yes/no)
0;1
• Provision for financing of operation and maintenance, O&M (revenue or state budget) (yes/no)
0;1
Implementation needs analysis (sum) 3
• Identify the social risks associated with the project.
0;1
• Are they large enough that a social impact assessment should be conducted?
0;1
• Identify types of appraisals/studies needed for this projects.
0;1
• Identify estimated costs for necessary project appraisals ad studies.
0;1
• Describe any formal or informal consultations that will be required before an appraisal decision can be taken.
0;1
• Cost overruns: construction has started and earned value management demonstrates that there is a cost overrun (project is over-budget; project progress is not proportional to cost overrun) (no/yes).
No apply;0;1
• Schedule slippage: construction has started and schedule control demonstrates that there is a schedule slippage (project is delayed, behind schedule, schedule faces performance problems) (no/yes).
No apply;0;1

101
• Legal aspects: construction has started and lawsuits, legal disputes and conflicts can severely slow down or impede construction; legal issues with contractors or subcontractors over contract scope of work (no/yes).
No apply;0;1
• Track record and experience of the implementing agency: construction has started and project implementation is currently facing problems and performance of implementing agency is likely to deteriorate (no/yes).
No apply;0;1
Potential constraints. There is an identification of any potential sources of capital for the project and estimated amounts (yes/no).
0;1 2
Affordability considerations. (sum) 3
• Realism about implementation arrangements (yes/no).
0;1
• Plans for developing the necessary capacity for project management and operation (yes/no).
0;1
• Nature and extent of risks, resilience, and their mitigation measures (yes/no).
0;1
• Extent of capacity development (staff training, equipment, spare parts, etc.) (yes/no).
0;1
• Likelihood of continuity of outputs and outcomes (yes/no).
0;1
Other/External Impacts (sum) 3
• Externalities analysis adequately described.
0;1
• Other benefits of the project adequately identified and described.
0;1
• Alignment and consensus with security national priorities and developing strategies for public investment (yes/no).
0;1
• Critical factors for effective project implementation adequately identified and described.
0;1
Source: own elaboration based on international best practices.
The final score is a weighted average of different indicators, sub-criteria and criteria.
Each weight should be based in expert judgment and international best practices. An
example of the summarized final score formula is shown as follows:

102
𝑺𝒄𝒐𝒓𝒆 𝒊 = (𝟏
𝟑) ∗ 𝑷𝑹𝑶𝑭𝑰𝑳𝑰𝑵𝑮 𝒊𝒋𝒛 + (
𝟏
𝟑) ∗ 𝑷𝑹𝑬𝑳𝑰𝑴𝑰𝑵𝑨𝑹𝒀 𝑨𝑵𝑨𝑳𝒀𝑺𝑰𝑺 𝒊 𝒋𝒛 + (
𝟏
𝟑)
∗ 𝑽𝑰𝑨𝑩𝑰𝑳𝑰𝑻𝒀 𝒊 𝒋𝒛
Where:
i denotes the project
j denotes the sub-criteria (j = PROFILING, PRELIMINARY ANALYSIS, VIABILITY)
jz denotes the indicator z into the sub-criteria j.
Then, the PROFILING criteria score is equal to:
𝑷𝑹𝑶𝑭𝑰𝑳𝑰𝑵𝑮 𝒊 𝒋𝒛 = 𝟑 ∗ 𝑮𝒆𝒏. 𝒆𝒗𝒂𝒍. +𝟓 ∗ 𝑷𝒓𝒐𝒃. 𝒊𝒅𝒆𝒏𝒕. +𝟏 ∗ 𝑷𝒓𝒐𝒋. 𝒋𝒖𝒔𝒕. +𝟓 ∗ 𝑺𝒕𝒓𝒂𝒕𝒆𝒈𝒊𝒄 𝒄𝒂𝒔𝒆
The PRELIMINARY ANALYSIS criteria score is equal to:
𝑨𝑷𝑷𝑹𝑨𝑰𝑺𝑨𝑳 𝒊 𝒋𝒛
= 𝟐 ∗ 𝑫𝒆𝒎. +𝟐 ∗ 𝑻𝒆𝒄𝒉. +𝟐 ∗ 𝑳𝒆𝒈𝒂𝒍 + 𝟐 ∗ 𝑪𝒐𝒔𝒕𝒔 + 𝟑 ∗ 𝑩𝒆𝒏𝒆𝒇. +𝟑 ∗ 𝑭𝒊𝒏. + 𝟑∗ 𝑬𝒄𝒐𝒏. +𝟐 ∗ 𝑫𝒊𝒔𝒕. + 𝟏 ∗ 𝑷𝑷𝑷 + 𝟑 ∗ 𝑬𝒏𝒗. +𝟑 ∗ 𝑹𝒊𝒔𝒌
Finally, the VIABILITY criteria score is equal to:
𝑽𝑰𝑨𝑩𝑰𝑳𝑰𝑻𝒀 𝒊 𝒋𝒛 = 𝟑 ∗ 𝑩𝒖𝒅𝒈𝒆𝒕 𝒊𝒎𝒑𝒂𝒄𝒕 + 𝟑 ∗ 𝑰𝒎𝒑𝒍𝒆𝒎 + 𝟐 ∗ 𝑪𝒐𝒏𝒔𝒕. +𝟑 ∗ 𝑨𝒇𝒇𝒐𝒓𝒅 + 𝟑 ∗ 𝑶𝒕𝒉𝒆𝒓

103
8 THE INTEGRATED PROJECT
APPRAISAL
This guideline is intended for different types of user. First, it serves as a technical reference
for the National Treasury of Kenya, public sector managers and other relevant government
officials who are responsible for making public-sector investment decisions at central
level. It also serves to relevant technical staff in Line Ministries and Sub-National Level
involved in the formulation, selection, implementation and evaluation of public
investment projects. In other words, any government entity participating in the PIM
system could use this pre-selection methodology.
This technical document serves as a baseline tool to assist the GoK to implement necessary
fiscal management reforms. It was developed with the aim of serving both as a desk
reference for government officials already trained in PIM, at both central and
decentralized levels, and as a training tool for structured capacity-strengthening
programs.
FEASIBILITIES STUDIES
A Pre-feasibility study should be viewed as an intermediate stage between a PCN and a
detailed feasibility study and the intensity with which project alternatives are examined.
The structure of a pre-feasibility study should be the same as that of the detailed feasibility
study. These two studies compile the information on the justification of the project.
Intermediate level of detail based primarily on secondary data between PCN and a detailed
feasibility study. The difference being the degree of detail of the information obtained and
the intensity with which project alternatives are discussed. The structure of a pre-
feasibility study should be the same as that of a detailed feasibility study.
The Objectives of conducting a pre-feasibility study are:
• Conduct Preliminary project assessment
• Identify project alternatives
• Identify critical aspects that require special support studies such as project's design -
product, technology, marketing and distribution, capital structure.

104
In a practical sense, the main components of the project pre-feasibility report are:
• Executive summary
• Project background and history
• Market and plant capacity
• Location and site
• Project engineering works
• Factory, administrative and sale overheads
• Human resources
• Project implementation
• Financial analysis
• Economic and Distributional analysis and
• Project risk analysis
The economic analysis of projects involves estimating the costs and benefits of a project
from the whole society's point of view. The economic analysis should be fully integrated
with the financial analysis, and both must be expressed in the same units of account.
Comparing the economic and financial analysis gives essential information for structuring
project financing, including the proper design of user charges if the implementing agency
might want to impose user fees on consumers. The Manual will be based on Integrated
Cost-Benefit Analysis and Cost-Effectiveness Analysis, depending on the specific sector.
By estimating the economic value of consumers' benefits, which is measured by their
willingness to pay for goods and services provided by the Project, it is possible to
determine the values of the net benefits for different groups in society. In other words,
how much welfare each stakeholder will win or lose if the Project is to be implemented. To
convert the financial cash flows into the economic resources’ flows, it is required to
calculate a set of specific conversion factors for tradable and non-tradable goods and
economic prices for different categories of labour. The National Parameters and
Commodity Specific Conversion Factors can be accessed through the link
below: http://kenya.cri-world.com/

105
8.1 THE INTEGRATED ANALYSIS
Project evaluation is a tool for decision-making that allows the determination of the
suitability for society to invest in various initiatives when resources are scarce. Usually,
this "convenience" is understood from the financial and economic point of view as a
measurement of the costs and benefits of competing projects, leading to the prioritizing of
those projects whose expected benefits are the highest. However, there are other areas of
analysis that allow a broader view regarding the effect that a project may have on the
welfare of people. In that sense, the integrated project appraisal arises as a tool of analysis
that encompasses economic, financial, stakeholder distributional and risk analysis.
The integrated appraisal can anticipate future problems that may present a project-based
elements sometimes rejected, the pressures they may face the authorities to accept a draft
or the risks that a project is in terms of its long-term sustainability. The components of the
proposal to be developed and the depth with which they are addressed, integrated
assessment is specific to the project in question and the context in which it develops.
Comparing the total costs (investment and operation) of a project with its benefits allows
public authorities to decide if that project has the potential to make a real contribution to
the wealth of the country.
The assessment of benefits and costs involves transforming financial cash flows into
economic resource flows, using economic prices (efficiency or shadow prices) of goods and
services produced and resources used. Of course, there will be some costs and benefits that
can be identified but are unlikely to be quantified and valued. However, it shall be the duty
of the evaluator to conduct the process rigorously, to identify all the effects and impacts of
projects and to reasonably quantify and value as many of them as possible. The three types
of analysis that represent the pillars of integrated appraisal for determining the
sustainability of a project are shown in

106
Figure 18.¡Error! No se encuentra el origen de la referencia.

107
Figure 18 - The Integrated Approach
Source: Jenkins G, Harberger A, Kuo Ch. (2013).
The general relationship is the following:
PV + NPV = NPV SDRSDRSDR EXTFE
Where:
ENPVSDR is the Economic Net Present Value, discounted at the Social Discount Rate
(SDR);
FNPVSDR is the Financial Net Present Value, discounted at the SDR;
PVEXTSDR is the Sum of the Economic Externalities, discounted at the SDR.
These pillars are developed in detail in following chapters.
THE PROJECT APPRAISAL METHOD
The CBA is the default tool at the heart of the project appraisal methodology set out in this
manual. CBA consists of quantifying – as far as possible – in monetary terms all the costs
and benefits of a project and, by discounting, determining the net benefits (or costs) in
terms of a present value. Net benefits/costs so expressed, can be used to choose between
Financial Analysis
Economic (and Distributional)
Analysis
Risk Analysis
Accounting for external impacts toestimate the resource flow statement
Estimating the impact of the uncertainty on the financial and
economic results.

108
a given project proposal and alternatives, including the “with-out the project” alternative
or even, “the doing nothing alternative “.
While every reasonable effort should be made to apply CBA depending on the nature of
project benefits and costs, it may have to be supplemented or replaced by other tools. If it
is not feasible or too expensive to value project benefits at all, then Cost Effectiveness
Analysis (CEA), possibly supplemented by a MCA scoring system, should be used.
Although economic CBA is performed using monetary values it is not the same as a
financial CBA. Economic analysis looks at the project from the perspective of the welfare
of society as a whole and includes costs and benefits that do not involve market
transactions (for example, positive or negative externalities or public goods). Financial
cost-benefit analysis, in contrast, looks at the project from the narrower perspective of the
operating entity. This difference crucial, since public policy is concerned with aggregate
social welfare, not just narrow profitability.
Even when financial and economic appraisal shared the basic method – this is the
comparison between benefits and costs – they have differences in financial and economic
profiles: they use different relative prices and different flows and discount rates. While
financial analysis focuses on the financial attractiveness of the project from the private
investor’s point of view, the economic analysis measures the project´s impact on the entire
society. Then, the economic analysis helps to determine whether the project increases the
net Society´s wealth as a whole or not. Economic CBA is central to appraisal, but financial
analysis is also required to assess the financial sustainability and profitability of revenue-
generating public investment projects. A country’s methodological approach should cover
both types of analysis.

109
Table 4 summarises the differences between financial and economic analysis.

110
Table 4 - Major Differences between Financial and Economic CBA
PERSPECTIVE AGENCY/ORGANISATION/FIRM ECONOMY/SOCIETY
Objective Analysis of the net financial impact of the proposal on the agency
Maximising the social returns to the economy’s resources
Pricing Market prices Opportunity costs/shadow prices (to correct distortions)
Transfer payments (taxes & subsidies)
Included Excluded
Equity/distributional effects
Excluded Can be included, usually treated qualitatively
Externalities Excluded Included
Depreciation Excluded (from discounted cash flow analysis, but included in financial statements.
Excluded
Source: Republic of Cyprus (2016), Commonwealth of Australia (2006) and international best
practices.

111
Financial and Economic Analysis
The following example illustrates the differences between the financial and
economic analysis. The project sales certain goods and receives a subsidy from the
Government. In addition, the project pays taxes and produces a negative
externality to the environment. The table reproduces the CBA from different points
of view: the project´s owner, the Government and the entire Society.
Source: Jenkins G, Harberger A, Kuo Ch. (2013).
As it can be seen from the example, assuming all the values are expressed in real
and current terms, the project is recommendable from the financial point of view,
but not recommendable from the economic point of view. In addition, the net effect
for the Government is a positive increase in net taxes revenues.
In line with recommended good practice, an integrated approach to the treatment of
potential PPP projects has been adopted. This means that there is no parallel track for PPP
projects and they must follow the appraisal methodology (outlined below), as for any other
financially significant project. As with any public investment project, the financial and
economic worth of a potential PPP project must be demonstrated using economic CBA
and/or other appropriate tools as explained in the rest of the document. The investigation
of advantages/disadvantages of using PPP procurement can commence only after the
project has been appraised and its strategic importance, feasibility and sustainability been
confirmed.
Analysis ➔ Financial Economic
Viewpoints ➔ Owner’s (B)Government
Budget (D)Country (C)
Year 0 1 0 1 0 1
Receipts 400 400
Operating cost -140 -140
Equipment -1,000 950 -1,000 950
Operating Subsidy 50 -50
Taxes -100 100
Environmental
Externality-190
Opportunity cost of
land-30 -30 -30 -30
Net Resource Flow -1030 1,130 0 50 -1,130 990

112
8.2 THE THEORETICAL PRINCIPLES
The PIM Manual's proposed manual relies on principles of welfare economics and their
application on economic analysis of investment projects. A summary of the fundamental
components of integrated analysis is explained here. This approach has also been adopted
by Development Finance Institutions such as the World Bank, Asian Development Bank,
and the African Development Bank.
Ideally, government investment expenditures should be in the public interest. Such
spending can be in government investment. Traditional investment appraisal approaches
have tended to carry out a financial analysis of a project completely separate from its
economic evaluation. The integrated project analysis developed measures benefits and
costs in terms of domestic prices for both the financial and the economic appraisal.
Identification is then made of the stakeholder impacts among parties. Since project costs
and revenues are spread over time, uncertainty becomes an issue and is first dealt with in
the financial analysis. Its consequential effects are then assessed in the economic study.
Components of an integrated analysis include the following sections:
i. Financial analysis
ii. Economic and stakeholder’s impact
iii. Risk analysis and management
The result of financial analysis is a cash-flow statement that summarises the costs and
benefits from the owner's perspective and total investment over the entire life of a project.
Through an integrated analysis, one can develop the project's economic resource flow
statement based on the financial cash flow in most cases. The impact on the rest of the
stakeholders (all except the owner and financiers) is then summarised as externalities,
which is the difference between financial cash flow and economic resource flow.
The efficiency and the efficacy of public investments: All projects that are to be included
in the Public Investment Plan (PIP) need to fulfil two prerequisites:
• The strategic fit of each eligible project (i.e. the efficacy approach) has to be checked.
• Each project must have gone through an integrated economic evaluation that assures
the economic attractiveness and validates that each of the PIP included projects are
adding to the economic welfare of the Nation (i.e. the efficiency approach).

113
These two prerequisites should be mandatory in order to provide the final “Seal of
Approval” to supply budgetary or to allow for public private partnership funding. These
two planning exercises -strategic and economic planning- are both necessary and
complementary and they should not be disconnected. If these two do not overlap and
match, then there will be severe inconsistencies in public policy priorities and the
corresponding investment decisions for the future of the Nation.
The EFFICACY APPROACH
In a Strategic Planning Exercise, the emphasis is on "investment efficacy" or spending on
the right public assets. Spending should promote achieving strategic priorities, and
resources should be allocated only to those areas that are best aligned with the
government's strategic objectives. In this sense, the strategic planning exercises
performed at different levels are top-down processes that produce important deliverables.
Therefore, the strategic fit of projects ensures the strategic alignment of investment
projects with national, sector and program strategies. The specific objectives of every
investment project should consequently be designed in such a way that they support the
overall national development agenda.
If this planning exercise is not conclusive and does not define the portfolio of projects
financed, it risks becoming only a narrative wishful statement, void of practical
application. Therefore, considering national and sector strategies, criteria, priorities and
development objectives shall be essential for the final project selection phase. During this
process the eligible investment projects (i.e., those that have received the seal of approval
from the concerned PIM government agency) are selected for final yearly budget
allocation.
The EFFICIENCY APPROACH
The efficiency approach derives from an Economic/Financial Planning Exercise,
responsible for allocating one scarce national resource, the capital. Contrary to Strategic
Planning that is greatly influenced by public policies and politics, Economic Planning is a
highly technical process that must guarantee each public investment project's economic
profitability (or attractiveness). These two planning exercises – strategic and economic
planning – are both necessary and complementary, and they should not be disconnected.
If these two do not overlap and match, then there will be severe inconsistencies in public
policy priorities and the corresponding investment decisions for the Nation's future.

114
THE ECONOMIC ANALYSIS
While the financial analysis of a project focuses on matters of interest to investors,
bankers, public sector budgets, etc., an economic analysis deals with the project's impact
on the entire society. The primary difference between the economic and the financial
evaluation is that the former aggregates benefits and costs over all the country's residents
to determine whether the Project improves the country's economic welfare as a whole.
Simultaneously, the latter considers the Project from the point of view of the well-being of
a particular institution or subgroup of the population.
The measurement of economic benefits and costs is built on the information developed in
the financial appraisal. Still, it also makes important use of the economic principles
developed in applied welfare economics. In measuring economic values, we begin by
looking to the market for a specific good or service. The initial information for measuring
its economic costs and benefits is obtained from observing the actual choices of consumers
and producers in that market.
If no one else in the country gains or losses due to the Project, there would be almost no
difference between the financial and the economic analyses. Consequently, when
conducting economic analysis, it may help from a conceptual standpoint to determine
what groups and the project sponsors gain or lose as a result of the Project. For example,
if a project pays wages higher than the prevailing market wages, the excess constitutes a
benefit to workers. Thus, an adjustment to reflect their benefit would have to be included
in the economic analysis. If a project pays income tax, this represents a financial cost to
the project owners but a benefit to the government, and it would have to be estimated.
That type of transfers should be included in the integrated analysis.
The methodology adopted here to evaluate the economic benefits and costs of projects is
built on the three postulates of applied welfare economics as summarised by Harberger
(1971a, 1978, 1984, 1997). These postulates, in turn, are based on many fundamental
concepts of welfare economics.
i. The competitive demand price for an incremental unit of a good or service
measures its economic value to the demander and its economic benefit.
ii. The competitive supply price for an incremental unit of a good or service measures
its economic resource cost.

115
iii. Costs and benefits are added up without regard to who the gainers and losers are.
In other words, a dollar is valued at a dollar regardless of whether the benefit of
the dollar accrues to a demander or a supplier or a high-income or a low-income
individual.
When a project produces a good or service (output), the economic benefit or the
economic price of each incremental unit is measured by the demand price or the
consumer's willingness to pay for that unit. These postulates are firmly based on standard
economic theory, but they also involve certain subtleties and conditions. The demand
curve represents the maximum willingness to pay for successive units of a good. The
demand curve reflects indifference on the consumer's part between having a particular
unit of a good at that price and spending the money on other goods and services. As
adjustments occur due to a project or other underlying events, the base assumption is that
these are complete adjustments over the whole economy. Individual prices and quantities
may change in this and other markets, wages and incomes of different groups may rise or
fall. Still, the economy is thought of as being always in equilibrium, with all markets being
cleared.
The economic cost of a resource (input) that goes into the production of the Project's
output is measured by the supply price of each incremental unit of that resource. In other
words, the economic cost of each incremental unit of an input is the price at which the
supplier would just barely be willing to supply that unit. The supply curve is the locus of
the successive minimum prices that suppliers are willing to accept for successive units of
a good or service that they supply. These minimum prices represent the opportunity cost
of these goods. Suppliers will be indifferent between selling these particular units of the
good at their supply prices and using the inputs for alternative purposes. Again,
adjustments along a supply curve occur in the economy's context, staying within its
resource constraint, with equilibrium in all markets.
The third postulate concerns the distributional aspects of a project and how they
should be incorporated into the projects' economic analysis. By accepting each individual
supplier's and demander's valuations and then taking the difference between total benefits
and total costs, the basic methodology of applied welfare economics focuses on economic
efficiency.
In other words, when a project produces a good or a service (output), the economic benefit
or the economic price of each incremental unit is measured by the demand price or the
116
consumer’s willingness to pay for that unit. On the other hand, the economic cost of a
resource (input) that goes into the production of the project’s output is measured by the
supply price of each incremental unit of that resource. Finally, the net economic benefit of
the project is measured by simply subtracting the total resource costs from the total
benefits from the project’s output.
This manual's methodology measures the project's net economic benefit by subtracting
the total resource costs used to produce the project's output from the total benefits of the
output. In calculating the economic efficiency of projects, it adds up the dollar values of
the net economic benefits regardless of who the project's beneficiaries are.
8.3 THE PROJECT OBJECTIVES AND SCOPE
Project objectives and constraints
Once the problem and rationale for government intervention are justified, it is need to
clearly state the project objectives. The hierarchy of objectives for the project should be
defined as follows (linked to the logical framework matrix):
• General Objective: such as improve the current situation, solve a problem, income
increases, standard of living improvement, poverty reduction, natural resources
protection etc. to which the purpose is going to contribute.
• Project Purpose: the project’s central objective expressed in terms of the achievement
of sustainable benefits for the target group.
• Project Outputs: achievements created by the project, which produce the services or
facilities corresponding to the project purpose.
It is suggested that objectives should be described using SMART terminology8 so that they
are monitorable and it is possible to know when they have been achieved. Table 5 illustrate
an example for a road construction project.
8 Specific, Measureable, Achievable, Relevant, and Time-bound

117
Table 5 - Example of project objectives, purposes and results
DESCRIPTION INDICATOR
General objectives (in terms of project impacts)
Increased economic activities • Increased regional GDP per capita
• New jobs created • Poor reduction
Project purposes (in terms of sustainable benefits for the target group)
• Reduced travel time and transport costs
• Increased flows of goods and services and persons
• Increased safety
• Accessibility
• Time savings • Costs savings
• Number of accidents
Project results (in terms of project outputs)
• Construction of a road • Physical kilometres constructed
Source: Government of Cyprus (2016). Manual for Pre-Selection and Appraisal of Public
Investment Projects
Some comments are needed in order to clarify the project objective definition. In fisrt
place, in most of the cases, the precise contribution of the project to the overall objective
is difficult to gauge, because there will be many other influences. Second, project purposes
must be defined considering other alternatives, since same outcomes can be achieved with
different alternatives (for example, increased safety can be accomplishing with a traffic
education program or a reducing alcohol consumption program; even, some of these
alternatives will not need capital investment. Third, specific project outputs are related to
specific Project alternatives (these outputs might be completely different from the
reference project for dissimilar alternative projects). Fourth, a good specification of
objectives is essential for monitoring the project during implementation and for
evaluating its performance on completion. The indicators in Table 5 are the basis for
monitoring and evaluation of this particular project.
In addition, potential constraints which might affect implementation of the project and
achievement of its objectives, should be identified at this stage. These may be technical,
legal, financial or political in nature, or they may have to do with timing or location.
Project scope
The scope of the project must be clearly defined in the Project Concept Note. This involves
setting out all the Project inputs, activities, outputs, outcomes and impacts. The mandate
should be to demonstrate that all the necessary activities have been captured and that the
planned outputs are sufficient to achieve the Project purposes. The main outputs will be

118
fixed assets (tangible or intangible), but supporting outputs such as trained staff may also
be required to ensure that benefits can be achieved as planned. These outputs should also
be included in the project scope (Government of Cyprus, 2017).
For analytical purposes, the project boundary should extend to all activities and outputs
necessary to deliver the intended benefits, even if these come under the responsibility of
another economic entity. Access roads, utility connections or staff training provided by
another economic entity would be examples of project components that should be
included, even if the costs do not fall upon the economic entity promoting the project.
Finally, the definition of the project scope should be sufficient to reach a conclusion on
whether the project represents a sufficiently comprehensive answer to the issue/problem
identified as requiring a solution (Government of Cyprus, 2017).
Project purpose and justification
As a part of the analysis, the problem to be addressed, the rationale behind the proposed
project and the case of public sector intervention, should be presented in the PCN. The
project analysis must include:
• Verifying the problem or business opportunity that the project is intended to address
is still accurate and relevant and severe enough for a public intervention.
• Verifying the broad explanation of how the project is expected to alleviate the
identified problem or take advantages from the business opportunity (cause - effect
relation).
• Verifying the justification for government intervention, based on market failure or
equity concerns, remains valid.
8.4 IdentifyING AND SELECTING PROJECT ALTERNATIVES
Diagnosis
Once the problem, objectives and purposes has been clarified, it is necessary to make a
diagnosis of the current situation. The objective of this stage is to analyse the main
variables that identify, describe, explain and size the main problem detected and to
consider the processes that generated the situation and possible future trends. The
diagnosis also serves to corroborate the existence of the problem identified previously.

119
Within the relevant background set of diagnosis is essential in analysing the following
areas.
The Study Area is defined after the geographical analysis and gives a context to the
problem being studied. It also delivers the limits for analysis. When defining it, it is
recommended that the following variables be considered:
• Existing service network
• Relevant limits: geographical (i.e., lakes, rivers, hills) and administrative or policy (i.e.
target population defined services, such as hospitals, police headquarters, etc.).
• Accessibility conditions: depends on the existence of transport systems in general;
specifically, variables such as the existence and condition of roads, the capacity and
frequency of public transport, and weather conditions must be analysed, among other
variables.
The Influence Area corresponds to that area where the problem directly affects the
population and where the alternative solutions should be considered. Typically, the
influence area is a subset of the study area, but there are also situations for which the study
area and area of influence are equivalent. When defining it, it is recommended that the
following variables be considered:
• Geographical location of the population directly and indirectly affected by the
problem.
• Administrative characteristics.
• Physical aspects: geographic location, climate (temperature, precipitation, humidity),
geomorphology, topography.
• Main economic activities taking place in the areas.
• Analysis of socio-economic characterization; number and structure of the population
(quantification and classification of the population according to age and gender
characteristics).
• Institutional sector and local government (e.g., location of the municipality,
neighbourhood, police stations, etc.).
The recognition and description of the affected and target population is critical to
understand the current situation and to finding solutions to the problem. Figure 10 shows
the different segments that can be recognized in the analysis.
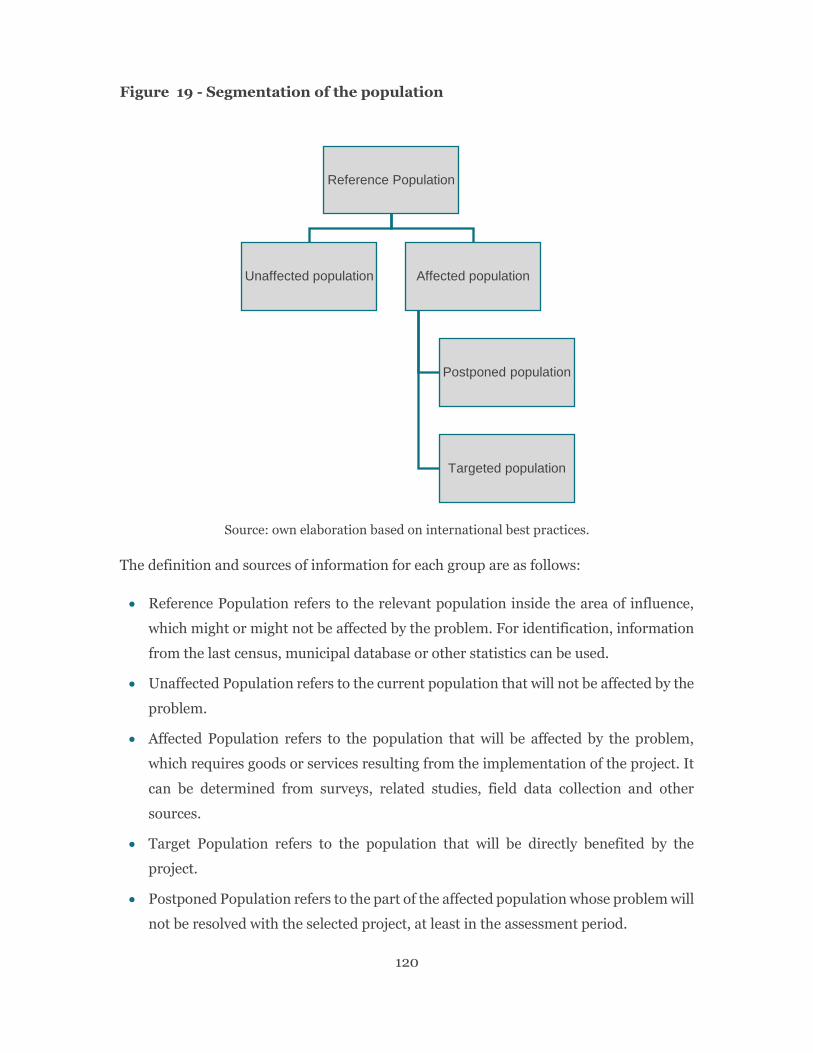
120
Figure 19 - Segmentation of the population
Source: own elaboration based on international best practices.
The definition and sources of information for each group are as follows:
• Reference Population refers to the relevant population inside the area of influence,
which might or might not be affected by the problem. For identification, information
from the last census, municipal database or other statistics can be used.
• Unaffected Population refers to the current population that will not be affected by the
problem.
• Affected Population refers to the population that will be affected by the problem,
which requires goods or services resulting from the implementation of the project. It
can be determined from surveys, related studies, field data collection and other
sources.
• Target Population refers to the population that will be directly benefited by the
project.
• Postponed Population refers to the part of the affected population whose problem will
not be resolved with the selected project, at least in the assessment period.
Reference Population
Unaffected population Affected population
Postponed population
Targeted population

121
For purposes of identification, it is recommended that efforts be concentrated on the
identification of the affected population.
Defining project alternatives
The project appraisal involves comparing life-cycle costs and benefits of the reference
project and feasible project alternatives. Project promoters should refine the alternatives,
including technical variants of the reference project, which have been shortlisted in the
pre-selection stage and should consider introducing any realistic new alternatives that
may have been overlooked at Pre-Selection.
Project alternatives may include measures other than expenditure on new public sector
capital assets and direct public provision of services, such as improved regulatory control
or subsidies to private sector service providers. Some examples of alternatives that may be
considered are (Government of Cyprus, 2017):
• Using different technological approaches or different technologies;
• Varying the timing, phasing and scale of a capital investment;
• Renting, building or purchasing facilities;
• Refurbishing existing public facilities instead of building new;
• Changing the balance between capital and recurrent expenditure, such as by choosing
between more or less capital-intensive service provision;
• Sharing facilities with other agencies;
• Changing locations or sites; and
• Improved implementation of existing measures or initiatives instead of investing.
When defining alternative interventions, a ‘business-as usual’ alternative must always be
defined, against which the reference project and the short-listed alternatives will be
compared. The business-as-usual alternative should generally be equated to doing nothing
(the ‘do-nothing’ alternative) unless this is extremely unrealistic, in which case a ‘do-
minimum’ alternative may be defined.

122
Optimizing the Base Case Situation and the concept of Incremental
Analysis
One of the important concepts when defining a brownfield project is to ensure that
the project’s benefits and costs must be measured on an incremental basis. Then,
one of the alternative solutions for all types of problems to be considered in the
evaluation of projects is what is known as the "optimization of the base case
situation”. The formulator must take into account in the comparison of the
alternatives.
An investment opportunity entails incremental net benefit flows that occur over
and above what would have been there in the absence of that investment. In
application to public investments, this means that one should carefully identify the
benefits and costs that are only associated with the project in question.
When conducting a project appraisal, one should conceptualize two states of
nature: one that includes the project (the With Project Scenario) and one that does
not include the project (the business as usual or the Without Project Scenario). The
costs and benefits of the “without” case scenario should then be subtracted from
the costs and benefits of the “with” project scenario to derive the incremental
resource flow statement.
In addition, one of the alternative solutions for all types of problem, to be
considered in project evaluation, is the "optimization of the base–case situation to
define the without project without scenario”. The Without Project Scenario is a
projection of how the relevant items would naturally evolve if the project did not go
ahead, but with the correct actions been taken on matters such as the maintenance
of the existing facilities. A simple before-and-after comparison is not appropriate
because circumstances can be expected to change, even if the project is not built.
The optimization of the without project scenario should always be
considered as an alternative solution. Optimization investments apply to all low-
cost measures that can improve the current situation, partially or completely
eliminating the problem. In this case, it allows for improvements without the need
for a full-fledged project, which involves many financial resources. Different actions
can be performed to optimize the base situation, among others, the following:
+ Low-cost investments
+ Management measures
+ Redeployment of staff
+ Recruitment of additional staff
+ Increased service hours
+ Changes in the use of infrastructure
+ Redistribution of equipment

123
+ Minor repairs to infrastructure
+ Repair of equipment
+ Education programs for users
+ Training of personnel
Analysis of the optimized background prevents the overestimation of benefits and
over-sizing of a project. Through such an analysis, it is possible to discover a
decrease in the estimated deficit and, therefore, the size and cost of the project may
be less than originally thought.
If, after the evaluation of the optimized base–case situation, the conclusion is that
there is no solution to the given problem, it will be necessary to evaluate other
alternative solutions, considering the “Without Project Scenario” as a base–case
situation. It is from this starting point that the promoter should measure the
incremental benefits and costs of each alternative and then choose the most
profitable. It should be remembered that the evaluation of projects is always a
comparison between different alternatives.
For different project alternatives, an analysis period must be decided upon, over which the
benefits and costs of the reference project and those of its alternatives will be assessed.
The analysis period should normally correspond to the useful life of the fixed asset created
and should be the same for all alternatives.
8.5 THE DEMAND ANALYSIS
This step examines whether there is a demand for the goods/services of a project both in
the domestic market and abroad. Demand corresponds to how much of a good or service
to meet a populations’ need for it. The demand must be measured in appropriate
quantities, i.e., number of medical visits per year, litres of drinking water per day, etc.
In the demand analysis, a distinction must first be made between the output of the project
to be used to meet local demand and the output to be sold internationally. For products
that are sold in the international market, usually a great deal of information is available
on market trends, new technologies, and the approximate cost of production of potential
competitors. The key question is: what are the advantages and disadvantages of the
proposed facility relative to other competitors, both domestically and internationally. For
some products, research on costs relative to those of other producers may suffice; for
others, research on likely price trends may be needed; and in some cases, research into the
likely demand for the output of the specific project under study may also be required. The

124
function of this module is not only to assess the current demand but also to undertake the
more difficult task of forecasting future demand.
In the case of sector monopolies, such as public utilities, the growth in demand may be
forecasted fairly accurately by studying the relationship over time of demand with respect
to variables such as population growth, disposable income, industrial output, household
formation and relative prices. The study of growth in demand experienced by utilities in
other countries with similar circumstances can also provide a good indication of what to
expect in the future.
Demand analysis objective
The general objective of this investigation is to verify the real possibility of product
penetration in targeted markets. The demand analysis (also called market analysis) is as
well useful to foresee an adequate pricing policy, study the best way to market the product
and answer the first important question of the study: is there a viable market for the
product to be manufactured? Is there a real potential demand (beneficiaries) that the
project will affect? If the answer is positive, the study continues. If the answer is negative,
the possibility of a new, more precise and reliable study is raised. For public projects that
will produce market products (such as those related to SOE) if the intention to invest is
inalienable and a clear potential unsatisfied demand for the product is not detected, the
way forward is to substantially increase spending on marketing and advertising to strongly
promote the acceptance of the new product by beneficiaries.
The PCN should identify the target beneficiaries and given indicative estimates of demand
for the services of the project. The latter will not, however, be adequate for project
appraisal, for which more reliable forecasts of demand must be developed. Rigorous
demand analysis is at the heart of a good project appraisal and it is essential for:
• Designing appropriately sized capital assets with the necessary capacity for current
and future users.
• Making reliable cost estimates;
• Estimating the benefits of the project accurately; and
• Arriving at a robust conclusion on the economic viability of the project.
As part of the project appraisal, project promoters must develop a quantified forecast of
the expected demand for the defined services of the project, including the expected growth

125
in this demand over the lifetime of the project. Depending on the nature of the project,
these forecasts may cover things such as school enrolment, hospital caseloads, road traffic,
water consumption and solid waste generation.
Demand drivers
Demand is a function of different factors, which, depending on their relevance, may need
to be taken into account when making forecasts. These include:
• Background economic growth;
• The real necessity for the good and services;
• Income changes among potential target users;
• Good and services prices;
• Demographic change - natural growth or decline in the population and of different
cohorts within it; migration into or out of the project area;
• New industrial, business or agricultural developments coming on stream in the
project area;
• The cost of the services provided - even if free, there may be costs involved in accessing
services;
• Long term technological change and changes in public preferences.
The information should take into account primary and secondary sources, econometric
indicators, and other. The research must have the following characteristics:
• The data collection must be systematic.
• The collection method must be objective and non-biased.
• The data collected should be useful.
• The object of the investigation must have as its final objective to serve as a basis for
decision-making.

126
Demand segmentation
The market segmentation is important to clearly define the potential beneficiaries. Among
other, following types can be useful:
• Geographical segmentation. Analyst can subdivide markets into segments by
location: countries, cities, towns or regions where potential beneficiaries (and
consumers) live and work.
• Demographic segmentation. Demographic data also provides a common basis for
segmenting beneficiaries and consumers. The most common characteristics taken
into account are: age, gender, stage of the family's life cycle, income and education.
• Segmentation by type of customers (industries). A project could sell to customers in
various industries and they would want to segment them by industry. The most
common characteristics taken into account are: size, organization structure,
purchasing criteria, industrial sector to which it belongs, among others.
• Psychographic or behavioural segmentation. This type of data is used to segment
markets because it is related to behaviour and because it is relatively easy to collect.
This segmentation consists of examining the way that people think, feel and behave.
Demand forecasting methods
The most widely used method for estimating demand is using the historic trend, to
estimate the individual consumption, i.e. per capita or family. To determine individual
consumption (or per capita), available historical records of the consumption of a
population with similar characteristics can be used, or specific information sources.
There are different methods to calculate the demand trend. The analyst can use the
following:
• Moving average method is recommended when the series is very irregular. The
method consists of smoothing out the trend irregularities by means of partial
averages. The disadvantage of using moving averages is that some terms of the series
are lost and it does not give an analytical expression of the phenomenon, so it is not
possible to make a projection of the data into the future, except for short periods
(mostly the next one).
• Linear equations using least squares method consists of calculating the equation of a
curve for a series of scattered points. The curve is considered the best fit when the

127
algebraic sum of deviations of individual values from the mean is zero, and when the
sum of the square of the deviations of the individual points from the mean is minimal.
• Non-linear equations are useful when the trend is clearly non-linear. In those cases,
to make forecasts with the equations the future values are simply assigned to the
independent variable X (for example, time), and the equation estimates the
corresponding value for the dependent variable Y (for example, demand, supply, or
prices).
The previous methods are intended to quantify the unsatisfied (unmet) demand.
The level of detail in demand forecasts may vary depending on the scale of the project and
the extent to which it is innovative. For major or highly innovative projects, demand
analysis is expected to be very detailed, involving collection of primary data through
surveys and the use of econometric analysis and, where applicable, modelling techniques.
For straightforward and lower value projects, the approach can be simpler, based on
intelligent trend analysis. Simply extrapolating current trends without question is not,
however, acceptable. Trends must be examined critically to ensure that there will be no
significant shifts in the underlying factors over the life of the project. Whatever approach
is used for projecting demand, it is important to present historical evidence of previous
trends, where this exists, to put forecast in context.
Sources of information
The purpose of the demand study is to quantify the number of beneficiaries and economic
entities that generate a demand that justify the implementation of a certain program or
project, with their corresponding specifications (quantities and prices, among other).
Some of the sources of specialized information are:
• Government agencies (as the National Statistic Authority).
• Public and Private specialized institutions.
• Business chambers and industrial associations linked to the project/sector.
• Management of business chambers and regional development.
However, the primary sources of information are the project user or consumer. To get
information from users and consumers can be done as follows:

128
i. Directly observe user´s behaviour. The observation method consists of going to
where the user is and observing his/her behaviour. t is not highly recommended as
a method, as it does not allow investigating the real reasons for the behaviour.
ii. Experimentation. The researcher obtains direct information from the user by
applying and observing behaviour changes. It is called an experimental method
because it tries to discover cause-effect relationships, by controlling and observing
specific variables.
iii. User survey. A questionnaire is a list of questions that allows to know what the user
would like to consume and what are the current problems in the supply. The survey
can be done by mail — which is very time consuming — by phone, or through
personal interviews. The last method is obviously the best, but it is also the most
expensive.
Supply analysis
The purpose of supply analysis is to determine the quantities and conditions regarding the
current situation. The supply is the quantity of goods or services that a certain number of
producers are willing to make available to the market at a certain price
The current and projected supply analysis estimates the amount of goods or services
currently available, which helps to solve the identified problem. For its estimation, it must
considerate aspects such as:
• The capacity of existing infrastructure and standards compliance.
• Compliance with quality standards.
The supply, like demand, is a function of a series of factors, such as prices in the product
market, government support for production, etc. The field research that is done should
take into account all these factors together with the economic environment in which the
project will be developed.
As far as project supply goes, it is needed to consider the expected evolution of the
provision of goods or services by existing providers and the entry of new suppliers. Along
with this, the medium and long term must be analysed, in which there might be an increase
or decrease in the supply of the goods or services.
Among other, essential data to make a good supply analysis are as follows:

129
• Number of producers.
• Location.
• Installed and used capacity.
• Quality and price of the products.
• Expansion plans.
• Fixed investment and number of workers.
As in the case of demand, it is necessary to make an adjustment with three variables for
the supply projection purposes; these variables are the Gross Domestic Product (GDP),
inflation or the price index.
Deficit estimation (unmet potential demand)
The current and projected deficit is estimated based on the comparison of the current and
projected demand and the current and projected supply in the influence area. The deficit
calculation allows the determination of the magnitude of the current and projected gap.
This can be expressed in qualitative terms (i.e. deficiencies in quality, regulatory
compliance) or in quantitative terms. However, it is necessary that current and projected
demand and current and projected supply be expressed in the same unit of measurement
and in the same time horizon.
The unmet potential demand is the quantity of goods or services that the market is likely
to consume in future years, over which it has been determined that no current producer
will be able to satisfy if the conditions under which the calculation was made prevail.
Due to differences in the underlying drivers of demand, more accurate forecasts will be
obtained by projecting demand for different groups of users separately (and then
combining them), rather than developing aggregate forecasts. Over-optimistic forecasts of
demand are a worldwide cause of poor public investment decisions. This systematic
phenomenon, referred to as optimism bias, should be guarded against wherever possible.
It is therefore advisable to subject demand forecasts to independent external scrutiny,
especially for major projects.
Once the future demand and supply are estimated over time, the potential unmet demand
is obtained with a simple difference, year after year, of the supply-demand balance in the
future (in Figure 20). ).

130
Figure 20 - Forecasted unmet demand
Source: based on Baca Urbina (2013) and international best practices.
8.6 THE MODULE ANALYSIS9
The technical analysis
The technical study seeks to answer the basic questions: how much, where, how and with
what resources the project will produce? As well, defines the optimal production function.
The technical analysis is concerned with the input parameters of the project, the quantities
and prices of inputs by type required for the construction of the project, the inputs
required for the operation of the project by year, and the appropriateness of the technology
adopted. It is also concerned with issues such as the size of the project, its design, location,
and the technology to be adopted, including the equipment to be used and the processes
to be employed. Assessment of the environmental impact caused by inputs, outputs or
technology should be a central component of this module.
A major task in technical analysis is to conduct a close scrutiny of the cost estimates of
construction along with the engineering data used to arrive at those estimates, provisions
for contingencies and expected price increases during the implementation phase, and cost
9 Based on Jenkins G, Harberger A, Kuo Ch. (2013) and on Baca Urbina (2013).
Demand
Supply
Time
Unmet
demand
Forecasted
Supply
Unmet
demand
Historical
demandand supply
Forecasted
demandand supply
Forecasted
Demand

131
estimates for operating the facilities. The procedures for procurement of materials and
provision of professional services are also reviewed at this stage.
For investment and implementation, it is essential to identify the inputs required by each
of the alternatives under study (machinery, equipment, materials and labour), quantity,
cost, and feasibility to access them either at the national or international markets,
technological advances and the possibility of their incorporation into the project.
Incorporating the analysis of the various technological alternatives also allows decisions
about the optimal size and time to carry out the project. Also, the information obtained in
this module allows for the estimation of entire costs of construction and operation during
the lifecycle of the project.
THE PROJECT SIZE
The size is the production capacity that the project has during the entire period of
operation. Production capacity is defined as the volume or number of units that can be
produced in a day, month or year, depending on the type of project being formulated.
The importance of defining the project size is regarding its impact on the level of
investments and costs and, therefore, on the estimation of project profitability. Likewise,
the decision made regarding size will determine the operation level. For example:
• In an education project, the size will be the number of students in each school year.
• In agricultural projects, the quantity of products obtained in each agricultural cycle
constitutes the size.
• The size of a hotel project is measured by the number of rooms built.
• In mining projects, the size will be the metric tons treated in the plant in a given
period.
• The number of kilos of meat obtained in the production cycle, will be the measure of
the size of a livestock project.
After defining the unit of measure for the size of the project, the quantity of production
per unit of time is established. For example, in a shirt factory it would be the number of
shirts produced in a month or a year; in a hotel it would be the number of beds available.

132
There are three types of capacity:
• Designed capacity, which corresponds to the maximum possible level of production
or service provision.
• Installed capacity, which corresponds to the maximum level of production or
provision of services that workers with the machinery, equipment and available
infrastructure can permanently generate.
• Real capacity, which is the percentage of installed capacity that is being used on
average, taking into account production and sales contingencies, during a specified
time.
For example, the designed capacity can be that of manufacturing 500 dozen weekly shirts
or 200 beds; the installed capacity of 480 weekly shirts or 180 beds and the real capacity
of 408 weekly shirts, which is equivalent to 85% of the installed capacity or 178 beds,
equivalent to 89% of the installed capacity.
PROJECT LOCATION
The project location is the analysis of the variables (factors) that determine the place where
the project achieves the maximum profit or the minimum cost. The choice of location is a
complex decision in most cases, both in itself and because of their interrelationships,
although it is true that for some projects it is determined by a dominant factor that restricts
the number of alternatives.
Factors influencing location. Different project location alternatives should be
compared based on the occasional forces typical of projects. A classification must include
at least the following global factors:
• Means and costs of transport.
• Availability and cost of labour.
• Availability and closeness of supply sources.
• Environmental factors.
• Closeness to the market.
• Cost and availability of land slots.
• Soil topography.
• Taxation and legal structure.

133
• Availability of public services as potable water, energy, telecommunications and other
supplies.
• Possibilities of discarding waste.
PROJECT ENGINEERING
The engineering study is the set of scientific and technical knowledge that allows
determining the production process for the rational use of available resources for the
manufacture of a unit of product. Then, project engineering is responsible for selecting the
production process of a project, leading to the adoption of a certain technology and the
installation of physical works or basic services in accordance with the chosen equipment
and machinery. It also deals with product storage and distribution, design methods,
laboratory work, product packaging, infrastructure works, and distribution systems.
As well, the engineering study determines the optimal production function for the efficient
and effective use of available resources for the production of goods or services. For this,
the different alternatives and the conditions in which the productive factors can be
combined must be analysed. The needs for plant space and physical works can be defined
from the project layout and operator’s requirements. The estimation of costs, labour,
various supplies, repairs and maintenance will be obtained directly from the study of the
selected production process.
Technology. The technology is regarding the relationships by which the transformation of
an input into a product occurs. The production function is chosen through the technical-
economic analysis of the existing technology.
Technology is a critical factor in projects for several reasons:
• First, because in general it constitutes the essence of the project to be carried out: the
introduction of a new, more modern technology is the means to increase the
production and productivity of some factor.
• Second, because part of the evaluation consists precisely in establishing what type of
technology is appropriate, not only in technical terms but also in economic and social
terms.
• Third, because the social and private costs and benefits of a certain technology do not
necessarily coincide; so the evaluation of the project must be done not only from the
134
perspective of the beneficiaries but also from the perspective of society as a whole
(and vice versa).
• Fourth, because the incorporation of new technology generates redistributive,
environmental and social impacts that must be identified and evaluated.
• Finally, because it is normally a “modern” technology that is introduced, the
absorption capacity by the beneficiaries cannot be taken for granted, so that a false
appreciation of it can make the project fail.
The technology selection process for an investment project consists of two steps: the
selection of the most efficient technology from the physical (technical) point of view and
the selection of the most economically efficient technology:
• Selection of the most efficient technology from the physical point of view. In this step,
within the universe of available technologies, those that are efficient from a physical
or technical point of view are chosen (that is, from the specific discipline to which the
technology is related), discarding those that are not.
• Selection of the most efficient alternative from the economic point of view.
The technical decision is only the first step. Among the technological alternatives
preselected as efficient from the physical point of view, the most economically efficient
alternative is chosen for its application in the project. Consequently, the type of technology
used in an investment project (simpler or more complex) depends on the following
variables:
• The cost of inputs involved in each technological alternative: salary, cost of capital,
cost of inputs.
• The price of the final good.
• The technical performance of each alternative.
For example, if the increase in performance caused by a more technologically advanced
option does not compensate for the higher costs of its acquisition and operation, then it
will be economically convenient to opt for the less technically advanced alternative.
The environmental factor and the technology. The inclusion of environmental
analysis in project preparation is related to the environmental sustainability of the selected
technology. There is a change in the appreciation of the role of environmental aspects in
project design and analysis. Indeed, the increased interest in environmental issues in
developed countries, the creation of a significant number of environmental organizations

135
and the development of a theoretical body for the analysis of environmental problems by
academia have led to the international financial organizations incorporate environmental
impact analysis into projects financed or supported by them.
Selection of machinery and equipment. On the basis of the capacity of the plant to
be installed and the selected technological process, the requirements for machinery and
productive and auxiliary equipment, their technical characteristics, useful life, unit price
and installation costs are established; in addition, the availability of maintenance services
should be analysed and the ease of purchasing spare parts.
The machinery and equipment comprise all those elements or material items that are
required to develop the production process or provision of the service and their selection
must be made taking into account aspects such as:
• Technical characteristics: conditioning, drive, capacity, speed, operation,
simultaneity, reliability, modularity and spatial features.
• Costs: acquisition, personnel, materials, installation, extension and operation.
• Provider service: training, maintenance, simulation, demonstration, testing, delivery
and warranty
• Behaviour: useful life, workload, installed capacity and special requirements.
The quality of the machinery and equipment must be measured under parameters that
allow satisfying the production needs.
Raw material selection. A detailed description of the main and secondary inputs must
be made, indicating: name, unit of measure, necessary quantity, minimum required
quality, suppliers, prices and availability, taking into account the quality of the products
to be manufactured, the technology that will be used and the type of machinery.
The volumes must be quantified and characteristics of the raw materials and inputs
required annually must be specified, in consideration of the technical specifications of the
product to be elaborated and the planned production program, and with the respective
technical coefficients that support these figures.
Selection of personnel and human resources. The production staff is directly
related to the type of technology to be used in the process, as well as the type of machinery:
the more mechanized the process, the less labour requirements will be.

136
This item must indicate the labour required to operate the new plant, discriminated in
direct and indirect labour and administrative personnel, and present the salary and salary
scale for the personnel. The selection of the workforce is also based on the quality of the
products to be offered.
Production process description. The description of the production process defines
the way in which inputs are transformed into products and services, since the use of a
certain technology that combines labour, machinery, methods and operating procedures.
Economic effects of engineering. Certainly, the chosen technology and production
process will directly influence the number of investments, costs and benefits generated
from the project. The quantity and quality of machinery, equipment, tools, plant furniture,
vehicles and other investments will normally be characterized by the production process
that has been chosen.
Aspects related to technology are those that use to have the greatest impact on costs
magnitude and on the operating investments that must be made if the project is
implemented. Hence, it is crucial to analyse with special emphasis the economic valuation
of all the technical variables of the project.
The legal and regulatory analysis
The legal and regulatory analysis deals with the adequacy of the institution responsible for
managing the different stages or phases of the project, the project sponsor entity.
Experience shows that insufficient attention to the institutional aspects creates serious
problems during the implementation and operation phases of the project.
The legal and regulatory analysis should address the following issues.
• Which are institutions related to the project? Which is the institution that should lead
the project? Does this institution have enough resources to run and monitor the
project properly?
• Is the local entity that is supposed to manage the project properly organized and its
management adequately equipped to handle the project?
• Are the local capabilities and facilities being properly utilized?
• Is there a need for changes in the policy and institutional set up outside these local
entities? These changes may be warranted in policies of the local, regional or federal
governments? Is it necessary to take legal action to carry out the project?

137
• Which are the current regulations? Changes to policy and institutional or creating new
agreements or commitments are needed? And, what changes are needed at local,
regional and political centres?
The analysis must include the entire management that goes into the project, along with its
policies and procedures. In a broad sense, the institutional setup also incorporates the
whole range of government policies and procedures.
The human resources analysis
The organization seeks to group the functions to achieve the proposed objectives,
assigning activities to different levels and defining coordination mechanisms.
Organizations are composed by:
• Human factors: they contribute by ideas to improve technical processes and alter
stability because they propose changes, trying to modify the development of the work
to better achieve the objectives.
• Technical factors: provide stability to the organization. They are the tangible reference
points that help in the sense of giving continuity in the work.
The Human Resources Analysis goes into the manpower requirements both for the
construction and operation phases of the project. It reconciles the technical and
administrative requirements of the project with the supply constraint on manpower. If
those two cannot be reconciled, the project should not be undertaken. A careful study of
the labour markets should be made in order to ensure that the estimates of wage rates to
be paid are accurate and that the planned source of manpower is reasonable in the light of
labour market conditions. In general, manpower requirements should be broken down
into occupational and skill categories and these needs should be evaluated in terms of the
possible sources from which they would be met.
It would be a mistake to confine project appraisal to the analysis of financial and economic
costs and benefits under the assumption that the project can be built and ready for
operation on time. This assumes a degree of administrative support and project
management capacity for implementation of projects that in many countries (and sub-
national levels) does not exist. Many projects have failed because they were undertaken
without the administrative and project management expertise necessary to complete the
project as specified. The prospect of future financial and economic benefits materializing

138
is only as good as is the administrative/project management capability of the agency in
charge of putting the project in place.
The environmental resources analysis
The appraisal of projects is not limited only to a quantified financial and economic CBA.
There may be benefits and costs that cannot be readily valued. Often these will relate to
environmental impacts. Decision-makers are also interested in where in society the
benefits and costs fall and whether this is fair. Environmental assessments may be
required alongside economic studies.
Environmental assessment is a formal process used to predict the environmental
consequences of a project implementation. It is a systematic process of evaluating the
potential environmental consequences of project proposal initiatives for decision makers
to consider them as early as possible in the design, in conjunction with socioeconomic
considerations, in order to ensure the project´s environmental sustainability.
Several projects have a negative impact on the environment that may affect a group of
people in the society adversely. This is an externality generated by the project and is not
reflected in the private costs of the project. Failure to consider these actions in the ex-ante
evaluation may lead to the selection of an alternative that is not necessarily the most
profitable in terms of economic terms.
THE ENVIRONMENTAL ASSESSMENT PURPOSE
The environmental analysis has the purpose to identify, quantify and assess the impacts
of a project on the environment and the possible effects of the environment on the project,
an important aspect to be incorporated in its formulation. The environmental impact of
the project constitutes an aspect of the first order and should include:
• Scope (basins, cities, areas, etc.) with the name of the specific location.
• Duration in time and spatial scope of the project's influence.
• Resources that are considered.
• Nature of the effects, that is, if it is “recoverable”, “difficult to recover” or “not
recoverable”.
• Alternatives to mitigate its impacts

139
The environmental assessment helps to assure the options under consideration are
environmentally acceptable, viable, adequate and sustainable with environmental
measures whose costs are not greater than the expected benefits, considering cost
alternatives.
The environmental analysis
The importance of this module lies in environmental sustainability and the rules
regarding it, which may prevent or hinder the implementation of the project.
Therefore, it is essential to identify how project alternatives behave in relation to
environmental conditions and the effects they may generate. Also, this analysis
must be taken into account throughout the project lifecycle, from the choice of size,
technology, materiality, and location, among others.
The environmental evaluation seeks to identify, predict, quantify, and describe the
negative and beneficial effects of a proposed project, assess the impacts of a project
on the environment and the possible effects of the environment on the project, an
important aspect to incorporate in the formulation thereof.
Whenever the project has an impact on the environment, all the costs of pollution
control equipment and facilities used for mitigation should be included in the
project cost. Whatever residual pollution and environmental impacts remain after
the pollution control equipment is in place should be estimated and their economic
value assessed. Finally, these values should be included as a cost in the cash flow of
the project.
ENVIRONMENTAL IMPACTS
a) The environmental impact constitutes a significant alteration of human actions; its
significance derives from territorial vulnerability. An environmental alteration,
corresponding to any of these facets of the vulnerability or fragility of the territory,
can be individualized by a series of characteristics; Among them are, for example:
b) The nature of the impact that refers to its positive or negative consideration
regarding the state prior to the action.
c) The magnitude of the impact informs its extension and represents the "quantity
and intensity of the impact": how many hectares are affected? What number of
species are threatened? What are the volumes of pollutants, or percentage of
exceedance? of a norm?
d) The meaning of the impact refers to its relative importance (it is assimilated to the
“quality of the impact”). For example: ecological importance of the species

140
eliminated, or intensity of the toxicity of the spill, or the environmental value of a
territory.
e) The type of impact describes the way in which it occurs; for example, the impact is
direct, indirect or synergistic (it accumulates with others and increases since the
joint presence of several of them exceeds the sums of the individual values).
f) The duration of the impact refers to the anticipated environmental impacts
behaviour in time: if it is short-term and then ceases, if it appears quickly, if its
culmination is long-term, if it is intermittent, etc.
g) The reversibility of the impact takes into account the possibility, difficulty or
impossibility of returning to the situation prior to the action.
h) The risk of the impact estimates its probability of occurrence.
i) The spatial or influence area is the territory that contains the environmental impact
and that does not necessarily coincide with the location of the proposed action.
METHODS FOR THE ASSESSMENT OF ENVIRONMENTAL IMPACTS
Some methods for helping on the assessing the environmental analysis are as follows:
j) Experts opinion. Only to be considered when it comes to studying a very specific
and circumscribed impact. If this is not the case, neither speed nor completeness
can be claimed because of interdisciplinary crossovers. The Delphi method has
been very useful in these cases.
k) The “check lists”. They are exhaustive lists that allow analysts to quickly identify
impacts. There are purely “indicative” and “quantitative” ones, which use
standards to define the main impacts (for example, air pollution according to the
number of dwellings).
l) Simple cause-effect matrices. They are matrices limited to relating the affected
environmental variable and the human action that causes it.
m) Environmental cartography or map superposition (overlay). A series of maps are
constructed representing the environmental characteristics that are considered
influential.

141
n) Geographic Information Systems. They are very elaborate computational
packages, which are based on the definition of systems. They do not allow the
identification of impacts, which must necessarily be integrated into the model, but
rather try to assess their importance.
o) Matrices. These methods consist of double entry tables, with the characteristics
and environmental elements and with the planned actions of the project. At the
intersection of each row with each column, the corresponding impacts are
identified. In more complex matrices, the linkages between primary and secondary
effects can be deduced, for example.
MITIGATION AND COMPENSATION OF THE ENVIRONMENTAL IMPACTS
Mitigation is the design and execution of works, activities or measures aimed at
moderating, mitigating, minimizing, or reducing the negative impacts that a project may
generate on the human and natural environment. If this is not possible, at least the initial
basic properties are re-established.
The environmental management plan, among other issues, identifies all the measures
considered to mitigate and compensate for significant environmental impacts. For this, it
includes: i) a mitigation program, with mechanisms and actions aimed at minimizing
negative environmental impacts and enhancing positive ones during the construction,
operation and abandonment of the projects; and ii) a program of compensatory measures
that includes the design of activities aimed at restoring the environment.
In general, most technical and marketing problems have been faced and solved
before by others; therefore, a great deal of information can be obtained quickly and
cheaply if the existing sources are utilized efficiently. Secondary research is
probably most useful in the technical analysis and less valuable in the demand and
human resources analysis. Demand and human resources analysis generally
require information that is specific to the project and may require some primary
data.
Even when the environmental, human resources and legal analysis are not directly
related to project evaluation, they should be considered into the project design and
preparation, because they are related to sustainability and viability of the project in
the medium and long term. Furthermore, the conclusions derived from the analysis
of these modules should be incorporated into the project evaluation, when they
affect the benefits and costs of the project. For example, environmental mitigation
measures may generate higher investment costs (CAPEX); or attracting more and
better human resources to ensure the proper functioning of the project can generate

142
higher operating costs (OPEX). Finally, all aspects of the project should be subject
to compliance with the law, even when it is not related to economic efficiency.
The necessary studies for project preparation reduce the degree of uncertainty
about the investment decisions, thus allocating fiscal resources efficiently. Given
the importance of these studies, a series of recommendations and obligations to
ensure that the project is formulated correctly is listed below:
• The problem definition is essential in determining possible alternative solutions.
Framing the problem as lack of a given solution, good or service leads invariably
to a unique and single solution and prevents the analysis of more than one
alternative to the root problem.
• It is necessary to understand that a problem in itself is not a project. A project
comprises courses of action that arise from a given problem and provides a
rational response to the problem. To facilitate the definition and understanding
of a problem, it is recommended to construct a Problem Tree.
• When doing the diagnostic of the current situation, it is helpful to set a baseline
for comparisons and benchmarking. This is essential for the ex-post evaluation of
the project, which aims to verify whether the project has been a real solution to
the problem.
• In most of the projects, the optimization of the base case (or business as usual or
the without the project scenario) should always be considered as one of the
alternative solutions to the problem.
• Always more than one alternative should be analysed as a solution to the problem.
It is recommended that the analysis of project alternatives be performed at the Pre-
Feasibility study, as this involves looking at each alternative in greater detail and,
therefore, increases the probability of choosing the best alternative to solve the
problem. A modular analysis for each alternative is recommended.
8.7 CONDUCTING THE FINANCIAL ANALYSIS10
The financial analysis assesses the impact of a project on the financial costs and funding
of the organization that decides to carry it out. This type of analysis requires the
construction of cash flows based on different points of view. For example, suppose the
project does not yield an attractive return to private investors. In that case, a related
function of financial analysis is to calculate the minimum amount of income to induce
these investors to undertake the investment (for example, to define subsidies or transfers
from government to the private sector). Or, if the lenders (i.e., the banks) feel that the
project is not bankable then, the project analysts must explore different alternatives of
10 Based on Jenkins G, Harberger A, Kuo Ch. (2013).

143
subsidies, grants, equity and debt and financial engineering until the lenders feel they can
participate in the project’s leveraging.
The financial analysis of a project helps determine the project’s financial sustainability and
its overall success. But an important question arises immediately: “why a financial
appraisal for a public sector project?”. It may appear that the financial appraisal of a
project is only of interest to a private investor who wishes to determine the net financial
gain (or loss) resulting from an investment project. From a country’s point of view, a
project will increase the country’s net wealth if it yields net positive economic returns.
Conversely, a project that produces negative economic returns should not be undertaken
as it would lower the net wealth of society.
However, there are other reasons to conduct a financial appraisal for a government-
funded project. One is to ensure funds to finance the project through its investment and
operating stages (financial sustainability). In other words, a project that has high
economic returns may very often fail if there are not enough funds to finance the
operations (liquidity and working capital) of the project11. Therefore, one of the main
objectives of a financial appraisal for a government project is to determine if a project has
sufficient liquidity “to pay its bills” throughout its entire life, and if not, how those
shortfalls can be met. An excellent public investment project (i.e., with a positive
Economic Net Present Value) can go bankrupt if it is not financially viable, in other words,
if it fails to pay the day-to-day bills.
The second reason for conducting a financial appraisal of public-sector projects is directly
related to understanding the distributional impacts of the project. For example, the
difference between the financial price an individual pay for a litre of water (found in the
financial cash flow statement) and the gross economic benefit he derives from consuming
that litre of water (found in the economic resource flow statement) reflects a net gain to
the consumer. Similarly, the difference between the financial price (inclusive of tax) that
a project faces and the economic cost of an input required by the project measures the tax
11 For instance, often water or electricity supply projects are mentioned as typical examples of projects that
have large economic benefits due to the large value attached to water, and low financial receipts due to low
water tariffs. If the project is undertaken solely on the basis of a favourable economic analysis with no
consideration to financial sustainability, the project may very well fail due to lack of funds to maintain the
system and/or service the debt.

144
gain to the government. Gains and losses of this nature will be more difficult to establish
based on economic analysis only.
In the third place, in some instances, the government approaches a project like a private
sector investor to determine the financial profitability of the project. This approach is
necessary if privatization of the project is considered (also, for the PPP financial value for
money model). Determining the profitability of a project is essential to estimate the value
that a private investor would be willing to pay for it. Ascertaining financial profitability is
also necessary when government policies are designed to encourage small investors and
specific groups to undertake projects by providing grants or loans.
The financial appraisal also helps determine the level and structure of prices or user fees
to be charged to the beneficiaries to ensure the project’s financial viability. Sometimes
governments decide to subsidize specific services to consumers as a matter of policy or
pure expediency. The recovery of user charges must consider the income position of the
beneficiaries and the practical problems of administering a particular system. The degree
of the fiscal impact of such government policies on the budget has a strong bearing on the
viability and sustainability of the project. In such cases, not only should the level and
structure of prices be defined, but the procedure for making future adjustments in prices
and government subsidy should be laid down.
The result of the financial analysis is to build Pro-forma (i.e., a projected) cash flow of
benefits (inflows) and costs (outflows). To do this, the following steps are proposed:
i. Identify all relevant benefits and costs (i.e., revenues, expenses, or investments to
be done)
ii. Measure those benefits and costs in specific measurement units (these units may
be physical)
iii. Value them into money (i.e., transform those units into monetary units)
iv. Sort them in time (i.e., establish at what point into the future each will happen)
v. Compare them to determine the net expense or net income
vi. The construction and result of the cash flow depends on the type of financing that
the project under study develops and whether it is appraised from the financial
(private) or economic (social) perspective

145
The Investment Plan
The Investment Plan deals with the means and schedules of financing the investment
expenditures. The sources of finance used, whether equity or grants, domestic short-term
and long-term loans, foreign loans, suppliers’ credit, concessional loans, and other forms
of foreign aid, should be identified and the disbursement schedules formulated.
The investment plan combines information from the market and technical analyses to
establish a detailed plan for annual incremental expected capital expenditures during a
project’s investment phase12. Also, the investment plan should provide estimates of the
liquidation or scrap value of all significant fixed assets and the value of net working-capital
at the end of a project’s life. In addition, it should disaggregate expenditures on machinery,
equipment, and building materials into tradable and non-tradable commodities. It should
also indicate the breakdown of workers by skills and likely source of availability.
The investment plan deals with the expenditure on new acquisitions and the opportunity
cost of existing assets. If there are different scales and locations under consideration,
corresponding investment plans for each scale and location should be formulated. Once
time schedules and deadlines are developed, expenditures should be broken down by year
of expected outlays. Each expenditure item should be broken down into its detailed
components, whenever possible and appropriate. Civil works and building construction
should be broken down into raw material, and the different types of labour. These
breakdowns are necessary to conduct the economic analysis of the project and are also
crucial in providing a clear understanding of its cost structure. Investment credits or other
forms of subsidies should be explicitly presented.
12 Capital expenditures include expenditures on land, buildings, machinery, equipment, building materials,
and construction and management labour.

146
Table 6 illustrates sections of an investment plan for a project. All data in the investment
plan regarding the expenditures on new acquisitions, and the opportunity cost of existing
assets, if applicable, are included in the cash flow statement. Financing data is contained
in some statements but not others, depending on the point of view, as explained below.

147
Table 6 - List of cost items and investments in the expenditure statement
INVESTMENT EXPENDITURE
Preliminary Expenditure
• Initial research and investigation
• Research and technical studies (nature of the ground, raw materials’ analysis, water availability and quality, working out the manufacturing processes, etc.)
• Economic, Marketing, Profitability, Design, Financial and Legal studies
Equipment and Materials
• Machinery
• Foundations for machinery
• Machinery installation costs
• Testing and start-up
• Electricity and telephone
• Equipment
• Vehicles
• Office equipment and supplies
Incorporated Fixed Assets
• Patents
• Licenses
• Reproduction rights
• Permits
Costs of Establishment
• Costs of forming the company
• Costs of issuing shares
• Setting up a sales network
• Recruitment personnel
• Personnel training (wages and salaries, teaching, travelling expenses)
Working Capital
• Stocks of raw materials and requisites, inventories of intermediate products, and finished products
• The average period for payment allowed to customers
• Cash requirements
Construction
• Foundations
• Buildings
• Water pipes and connection to electricity mains, telephone system and, gas supply
• Reservoirs and tanks
• Wastewater disposal
• Roads and paths
The Site and its preparation
• Cost of land
• Registration duties and fees
• Drainage
• Access roads
TECHNICAL OPERATING EXPENDITURE
Taxes and duties
• Direct duties and taxes: Land tax; Municipal and regional taxes and duties
• Indirect duties and taxes: Value added tax; Tax on services rendered
• Registration taxes, duties, and fees: Registration fees for deeds and contracts; Stamp duties
• Customs duties
• Trade taxes
Works, supplies and external services
• Rents
• Maintenance and repairs
• Works by outside firms on a contract basis
• Water, gas, and electricity supplies
• Fees for patents, licenses, brand marks, etc.
Miscellaneous management expenses
• Office supplies
• Telephone
• Legal documents and litigation
• Grants and contributions
Personnel expenses
• Wages and salaries
• Allowances
• Commissions Purchases

148
• Duties levied by international bodies
• Initial investigations
• Materials
• Fuels
• Maintenance materials
• Office supplies
• Packaging materials
• Social security commitments
Transport and travelling
• Personnel transport
• Travel and removal expenses
• Freight and transport for purchases
• Freight and transport for sales
Source: Jenkins G, Harberger A, Kuo Ch. (2013).
¡Error! No se encuentra el origen de la referencia. shows an example of the
investment plan for a dam project.

149
Table 7 - Example of Investment Plan for a Dam Project (investment expenditure)
Year 1 Year 2 Year … Year t
Local Foreign Total Local Foreign Total Local Foreign Total Local Foreign Total
a. Water reservoirs/pumping stations
Civil works
Equipment and materials
b. Transmission mains
Civil works
Equipment and materials
c. Secondary/tertiary networks
Civil works
Equipment and materials
d. Service connections
Civil works
Equipment and materials
e. Office buildings
g. Consulting services
h. Land cost
i. In-house engineering services
j. Taxes and duties
Total
Summary of investments
Civil works
Equipment and materials
Office buildings
Consulting services
Land cost
In-house engineering services
Taxes and duties
Total
Source: Jenkins G, Harberger A, Kuo Ch. (2013).

150
The Financing Plan
The Financing Plan deals with the means and schedules of financing the investment
expenditures. The sources of finance used, whether equity or grants, domestic short term
and long-term loans, foreign loans, suppliers’ credit, concessional loans, and other forms
of foreign aid, should be identified, and the disbursement schedules should be formulated.
The financing plan should provide details about how any anticipated negative net cash
flows will be financed during both the investment and operating phases of a project. Also,
equity investors should be identified, and the expected timing of their contributions
specified. In addition, debtholders should be identified, and the anticipated timing of their
contributions established (interest payments and amortization schedules should also be
stated). Financing data is included in some statements but not others, depending on the
point of view, as explained below13. Table 8 shows an example of the financing plan.
Table 8 - Example on the financing plan (financing sources)
YEAR 1 YEAR 2 YEAR … YEAR N
Foreign Loans
Domestic Equity
Source: Jenkins G, Herberger A, Kuo Ch. (2013).
For most projects that are directly undertaken by the government or involve some
government intervention in the form of grants, loans or subsidies, there are several
stakeholders that would like to determine the impact of the project on them. Stakeholders
are defined broadly to include all those affected by the project. For example, the
stakeholders of a project may consist of the owners, participating banks, any (other)
government department providing loans or grants or collecting taxes, competitors,
workers, etc. It is, therefore, necessary to conduct the analyses from the points of view of
the different essential stakeholders to ensure the project’s sustainability and success. Even
13 The sales revenues and cash expenditures in a project will occur almost on a continuous basis. However,
these inflows and outflows must be lumped together for each period that may be a year, a quarter, or a month.
In this manual, as a matter of convention, all inflows and out flows are supposed to occur at the end of the
corresponding period. One could very well assume that they all occur at the beginning of the period. The
important thing is to adopt any one of these conventions and then be consistent.

151
one influential stakeholder who is adversely affected by the project may derail the entire
project.
Whether the data in the financing section of the investment plan is included in the cash
flow statement or not depends on the point of view considered. When appraising the
project from an owner’s point of view, the loan disbursement is an inflow. The repayment
is an outflow, as the owner is looking to the net receipts after paying any debtors other
shareholders. The analysis of the financial performance of the total invested capital,
however, is not concerned with the financing but is looking to determine the financial
viability of the project to all investors irrespective of the sources and terms of financing.
The most undertaken financial analyses for government and government-related projects
are from the following viewpoints: i) point of view of the owner; ii) point of view of all
investors combined (banker’s point of view or total investment point of view); iii) point of
view of the fiscal budget.
The different points of view
The Owner’s Point of View. Whether it is a private investor receiving some form of
support from the government or a government department undertaking a project, the
owner of a project includes all receipts and expenditures related to the project in the cash
flow statement to determine whether it is made better off or not. Consequently, the project
sponsors receive the net cash flow after paying off all other involved parties. From an
owner’s point of view, its cash flow statement will include the disbursement of the loan as
an inflow and all subsequent repayments of loan and interest as expenditures or cash
outflows. If the project receives any grants or subsidies, these should be included as
receipts (inflows) in the cash flow statement; and if the project pays taxes, these should be
included as cash outflows. Suppose the project sponsor is going to give up an existing
source of income to undertake a project; in that case, these forgone earnings (i.e.,
opportunity cost) should be included as an expenditure in the cash flow statement.

152
The Total Investment (Banker’s) Point of View. This point of view examines the
returns to the total invested capital. In other words, this analysis disregards any
distinctions in the sources of finance. It asks the question whether the financial receipts
generated from the operations of this project are sufficient to cover the investment and
operations expenditures and provide a sufficient return or not. This point of view is also
known as the “total investment or banker’s point of view” because a bank will be interested
in examining the expected receipts and expenditures to determine if the net cash flow is
sufficient to cover a given loan repayment and its interests. The banker typically has a first
claim to the project’s assets and net cash flow, and so the banker’s net cash flow is the
projects gross receipts net of operating and investment expenditures.
The only difference between the analysis from the owner’s point of view and that from the
banker’s point of view is the financing. Specifically, the cash flow statement from the total
investment point of view will include all items included from the owner’s perspective
except the loan and the loan repayments. The Bank will want to retain the first payment
priority with respect to other financial players through mortgages, warranties, guarantees,
pledges, co-debtors, etc. Then, the Bank must calculate the profitability of total capital,
i.e., the Return on Investment (ROI); (i.e., before funding to decide whether it is feasible
to offer the project developers and sponsors financial leverage or not).
The Debt Service Coverage of Project. The Annual Debt Service Coverage Ratio (ADSCR)
is a criterion for evaluating the financial viability of a project, from the banker’s point of
view, on a year-to-year basis. A viable project must repay the principal and interest on the
loan and bring a positive return on equity to the project owners. Another criterion, a
summary ratio, is called Loan Life Coverage Ratio (LLCR), and it is calculated as the
present value of net cash flows divided by the present value of loan repayments from the
current period to the end period of loan repayment. The discount rate used for this
calculation must be the loan’s rate of interest. The LLCR tells the banker if there is enough
cash from the project’s cash flow to offer a bridge-financing, even when some years have
inadequate cash flows to serve the debt. The criteria are estimated as follows:
Re__
___ =
t
tt
paymentDebtAnnual
FlowCashNetAnnualADSCR

153
Re__
___
=
=
=
n
ti
i
n
ti
i
t
paymentDebtPV
FlowCashNetPV
LLCR
The Annual Net Cash Flow of the project is calculated before financing. The Annual Debt
Repayment includes the interest expenses and principal repayment due in the specific year
t of the loan repayment period. The last year of debt repayment is denoted as n.
Budgetary Point of View. The purpose of the analysis from the budgetary point of view
is to ensure that the relevant ministry or department has enough resources to finance its
obligations to the project. Suppose a government’s department is the project owner; in
that case, the only distinction between the cash flow statement from the owner’s point of
view and the budget point of view is that opportunity costs must not be considered in the
latter statement. If, on the other hand, the government’s involvement is in the form of
providing some cheap credit, subsidies, or grants, then the cash flow statement will only
reflect these transactions.
Finally, it is important to realize that an analysis that includes the costs and benefits to all
involved parties constitutes the first step in the economic analysis of the project. Indeed,
this point is used as a starting point for the discussions of the economic analysis. A
summary of how different financial items should be included in the cash flow statement
from alternative points of view is given in Table 9.

154
Table 9 - Summary of cash flows statement from different points of views
POINT OF VIEW OF OWNERS
POINT OF VIEW OF ALL INVESTORS (BANKER’S OR TOTAL
INVESTMENT POINT OF
VIEW)
POINT OF VIEW OF BUDGET
OTHER PERSPECTIVE
(A) (B) (C) (D)
Include all receipts in
Inflows and all expenditure
related to the project in Outflows
= (A) – Loan and loan and interest
repayments
Include all subsidies/grants to the project in
Outflows and taxes from the
project in Inflows
Include the financial impacts of the projects on
any affected group
Grant/Subsidy Positive Positive Negative Not included
Loan Positive Not included Not included Not included
Investment costs Negative Negative Not included Not included
Operating costs Negative Negative Not included Not included
Loan repayment Negative Not included Not included Not included
Interest payment Negative Not Included Not included Not included
Foregone earnings
Negative Negative Not included Not included
Taxes Negative Negative Positive Not included
Positive Externalities
Not included Not included Not included Positive
Negative Externalities
Not included Not included Not included Negative
Source: Jenkins G, Harberger A, Kuo Ch. (2013).
The Operating Plan
The Operating Plan combines information from the market and technical analyses to
establish a detailed plan for the operational phase of a project. Also, it should provide
projections of expected sales revenues and expected operating and maintenance costs for
each year during the operating phase14 and should forecast annual net working capital
requirements. In addition, it should specify the management and operating human
14 Operating costs include operating material inputs and operating labour.

155
resources requirements by skill and source of availability for each year of the operating
phase. It should also disaggregate material inputs into tradable and non-tradable
commodities.
The operating plan is developed based on the data formulated and organized in the
technical, demand (market), human resources modules. It includes all cash receipts
generated from the operations of the business and all operating expenditures.
Expenditures and corresponding receipts should be projected by year of operation.
Like investment expenditures, detailed data breakdowns are necessary. Operating
expenses should be broken down into internationally traded and internationally non-
traded items, and each expenditure item should be further broken down into its
components, whenever possible. Expenditures on different types of labour (skilled,
unskilled, etc.) should be identified and recorded separately. Any taxes or subsidies
associated with operating expenditures should also be determined and recorded
independently whenever possible. These breakdowns are necessary for conducting the
economic analysis of the project and for providing a better understanding of the cost
structure of the operating expenditures15. Table 10 shows an example of an operating plan
for a potable water project.
15 Direct data requirements for a cash flow statement are slightly different from, and may not be as readily
available as, data requirements for income statements and balance sheets. For example, an income statement
includes sales and purchases, while a cash flow statement includes receipts and expenditures. Sales and
purchases include credit as well as cash transactions, while receipts and expenditures are cash only.

156
Table 10 - Example of Operating Plan for a Potable Water Project
Operations and maintenance Year 2 Year 3 Year... Year... Year... Year... Year... Year t Personnel
Connections/employee Total employees Unit salary/mo. (JD)
Total personnel cost Power/fuel (JD /cum.) Chemicals Maintenance
Total Production schedule Connections
Beginning New Ending Cumulative new connections
No. of persons/connection Average consumption/person (liters/day)
Total consumption (cum./day) Incremental consumption (cum./day)
Working capital Number of months accounts receivable
Accounts receivables Change in accounts receivable
Cash balance Change in the cash balance
Accounts payable Change in accounts payable
Source: Jenkins G, Harberger A, Kuo Ch. (2013).

157
The opportunity cost of existing assets
The concept of opportunity cost is widely applicable in both the financial and economic
appraisal of projects. For example, it is common for a government department to assess
rehabilitation projects where some of the project’s existing assets might be kept and
utilized with some newly acquired assets (i.e., brownfield projects). The opportunity cost
of the existing assets should be included in the cash flow statement, together with the
expenditures on the newly acquired assets. In other instances, a government may wish to
assess an on-going concern to determine whether operations should be continued or cease
or determine how much the project (and its assets) could be commercially sold. Here
again, the opportunity cost of the existing assets should be included in the cash flow
statement. Other applications have to do with the land; a government department
considering undertaking a project on a plot of land that it already owns should include the
opportunity cost of land in the cash flow statement even though there will be no cash
outlay for the land the project is undertaken.
Greenfield and brownfield projects
There are greenfield and brownfield projects. A greenfield project is an investment
where the construction and operation of the new production facilities start from
scratch, including all the necessary offices, living quarters and distribution hubs. A
Greenfield project is different from the brownfield investment in that the
operations are completely customized from the beginning. Note: The name
“greenfield” comes from building in a pristine literally green new land, often
covered with vegetation prior to the construction and that has never been used for
production.
Another example of a different type of asset would be a worker’s time. Suppose a farmer
or a small investor is going to undertake a project and manage it; in that case, it is essential
to include the opportunity cost of the worker’s own time (i.e., his foregone earnings) on
the expenditure side of the cash flow statement. This procedure is equivalent to paying
the sponsor a wage for his work in the project. If the project sponsor is paid a salary from
the project and that wage is included in the cash flow statement then, no opportunity cost
should be recorded.
Also, it is necessary to distinguish the “opportunity cost” of an asset from the “sunk cost”
of an asset. The opportunity cost of using an asset in a specific project is the benefit
foregone by not putting the asset to its best alternative use. To measure the opportunity
cost of an asset, a monetary value must be assigned to it that should be equal to what has

158
been sacrificed by using it in the project rather than in its next best use. On the other hand,
the value of an asset is treated as a sunk cost if the asset has no alternative use. The
opportunity cost of such an asset is zero. For illustration purposes, take an asset that a
firm has purchased, and it can be used to make only one product and nothing else. Also, it
cannot be leased to any other firm, and its scrap value is negligible. In other words, the
asset has no alternative value except in its current operations. Clearly, its opportunity cost
for that asset must be zero.
Sunk costs are defined as the net book values of an existing asset minus the greater of the
liquidation or in-use values. If sunk costs are negative, it implies that there has been a
financial capital gain. Sunk costs in general should not enter the decision of whether to
improve or discontinue the existing facility. Even if the existing assets may now be sunk
costs, there may be financial obligations such as bank loans or debt that cannot be ignored
if the existing assets serve as its collateral. If the same legal entity continues to be the
owner or sponsor of the incremental project, such debt may affect the cash flow of an
“improved” project and may indirectly alter the economic returns from incremental
investments.
Sunk cost involves neither current nor future opportunity cost and should have no
influence in deciding what will be the most profitable thing to do. It should, however, be
noted that while the sunk cost of an asset should not be counted as a cost to a new project
in examining its feasibility, any outstanding liabilities due to that asset may become the
liability of the new project if the ownership is the same. In other words, expenditures
already incurred are sunk costs and should not be considered in the analysis. Only future
benefits and costs should be considered.
The opportunity cost of the existing assets is generally included in the first year of the
project’s cash flow profile because the assets could be sold at that time if the project is not
feasible. The financial opportunity cost of an existing asset is the highest financial price
that it could be sold for. The highest financial price is typically the higher of the asset's in-
use value and liquidation value. The in-use value of the asset is what it would sell for if it
were to be used as an on-going concern. The liquidation value is what the asset would sell
for separately as scrap.
Suppose an asset is broken into its different components and sold in parts. In that case,
the costs of installing machine and equipment and their liquidation cost are further
deducted to derive the net liquidation value of the assets. When considering the

159
opportunity cost of any production plant, one should consider the in-use value of the plant
if it continues to be operated as it is.
Finally, it should be highlighted that the opportunity cost of an asset should be included
in the cash flow statement if the financial profitability of the project is being assessed (i.e.,
if financial returns to the project are going to be estimated). The opportunity cost will also
be a cash flow item in the economic analysis as it is a real resource cost.
Why a non-cash item should be included in the cash flow statement?
Suppose a neighbour gave us a gift in the form of an old machine that produces
nails. This machine has an operating life of one year, after which it has a scrap value
of zero. The market value of the nails that the machine can produce during this year
is 500,000 $. Expenditures on raw materials, labour and other operating
expenditures during the year are 300,000 $. Should we make nails or not? The
situation is summarized below:
Receipts from nail sales: + 500,000
Operating expenditures: - 300,000
A superficial analysis may lead us to undertake this project because we generate net
receipts of 200,000 $. To understand why this decision may be wrong, suppose
that the market value of this machine is 250,000 $. In this case, if we produce the
nails, we earn 200,000 $, but we forgo 250,000 $ resulting in a net loss of 50,000
$. In other words, we should not decide whether to produce the nails or not until
we find out what the opportunity cost of the machine is. With this additional piece
of information, the situation can be summarized as follows:
Receipts from nail sales: + 500,000
Opportunity cost of machine: - 250,000
Operating expenditures: - 300,000
Net Cash flow: - 50,000
It becomes clear in this case that we should not produce nails. Instead, we would
be better off selling the machine. To arrive at this correct decision, we should
include the opportunity cost of the asset in the cash flow statement even though no
cash outlay is incurred in acquiring the machine.
Treatment of assets depreciation
Depreciation expense or capital cost allowances are an accounting device to spread the
cost of capital assets over the length of life of these investments. In that way, net income
in any given year will reflect all the expenses required to produce the output. However,
depreciation expense is not a cash outflow and should not be included in the financial cash
160
flow profile of the project. The entire capital costs of an investment are accounted for in
the financial cash flow profile since the investment expenditures are deducted in the year
they occur.
The depreciation rates could be obtained from plant manufacturers; technical journals
may contain information on depreciation patterns; also, insurance companies (that insure
a plant’s assets) have some estimates for the plant’s rate of financial depreciation. If any
further capital charge, such as depreciation expense, were deducted from the cash flow
profile, it would result in double-counting of the investment opportunity cost of existing
assets.
The residual value
When a new project acquires an asset, the entire expenditure on the asset is accounted for
in the cash flow statement at the time that the expenditure occurs. However, it is quite
possible that the life of the project will not coincide with the life of all its assets or that the
span of the analysis will not extend as far in the future as the project may be expected to
operate (for example, railway projects). If either of the two conditions exists, then the
asset's residual value (i.e., the value of the part of the asset that has not been used) should
be included in the cash flow statement.
As a matter of convention, residual values are recorded in the cash flow statement in the
year following the cessation of operations. The underlying assumption is that liquidating
assets may require a few months. When determining the residual value of the assets at the
end of the project, it is preferable to break down all the assets into different categories:
land, building, equipment, vehicles, etc. The residual value is taken as the higher of the in-
use or liquidation value. The in-use value of the plant is the value of the plant under the
assumption that it will continue to operate as an on-going concern. The liquidation value
is the value of the assets if all components of the project are sold separately, and perhaps
even the plant is taken apart and liquidated.
This approach is like that taken when estimating the opportunity cost of existing assets.
However, it is more difficult to estimate the in-use and liquidation values since we are
dealing with a situation in the future. General guidelines could be utilized to determine
the residual values for these assets based on published economic depreciation rates that
specify how much of the value of a particular type of asset is lost as a function of time and
use. The depreciation rates could be obtained from plant manufacturers; technical

161
journals may contain information on depreciation patterns; also, insurance companies
(that insure a plant’s assets) have some estimates for the plant’s economic depreciation
rate.
The in-use liquidation value
The most appropriate way to determine in-use and liquidation values is through
reliable market assessors. When estimating in-use values using assessors, the
assessor’s and sales agency’s fees should be subtracted from the quoted value to
obtain the net in-use value. As well, when assessors give a liquidation value for a
project’s assets, the assessors’ and sales agency’s fees as well as the expenditures
incurred in dismantling the assets should be netted from the quoted price to obtain
a net liquidation value.
Another approach to preparing an estimate of the in-use value of a set of assets is
to consider their net replacement costs. The net replacement cost is the amount of
expenditures that would have made today to build a facility that would provide the
same amount of services in the future as would the assets that are now being
evaluated. To estimate the net replacement value of an asset, two adjustments must
be made to the historical purchase cost of assets. The first adjustment is for the
change in the nominal prices of new assets or the same type of the asset can perform
the same function as the asset being evaluated. This change in price is measured as
the ratio of the current price or price index for this asset to the price or Price index
of the evaluated asset in the year when purchased.

162
The financial opportunity cost of an existing asset is the highest financial price that it could
be sold for. The highest financial price is typically the higher of the asset's in-use value and
liquidation value. The in-use value of the asset is what it would sell for if it were to be used
as an ongoing concern.
The land is a unique asset in that it generally does not depreciate. The residual value of
land recorded in the cash flow statement should be equal to the market value of the land
recorded at the beginning of the project unless the project results in some improvement
or deterioration to the land. Situations where the project may enhance land value should
be regarded with caution and treated as the exception rather than the rule. In many cases,
expectations may indicate that land values are likely to rise faster than the general rate of
inflation, but the increase is unrelated to the project16. Project analysts mustn't include
any increase beyond the general rate of inflation in the residual value of the land.
Increase in land values
Land has an opportunity cost like every other asset when it is used by a project.
Even if the land is donated to the project by the government, it should be included
as part of the investment cost at a value that reflects the market value of land in the
project area.
However, land is a very special asset because it does not depreciate under most
situations. Due to improvements in infrastructure, the value of land being used by
a project may increase much faster than inflation during the life of the project. In
most cases the increase in the liquidation value of land (particularly in urban areas)
has nothing to do with the project under evaluation.
It is important not to attribute the increase in the real value of land to any particular
project to avoid introducing a bias toward land intensive projects. The only
exception to this rule occurs when the project either improves or causes damage to
the land. In such cases the amount of the land improvement or deterioration should
be added to or subtracted from the real value of the land measured at the beginning
of the project to determine the liquidation value of the land at the end of the project.
The increase in land values will occur whether the project under consideration is
undertaken or not, and the project sponsors will benefit from this increase
irrespective of undertaking the project.
16 For example, real increases in land value usually come about because of investment being made in public
sector infrastructure. Or the value of land may be expected to increase due to a change in zoning laws or due
to the anticipated construction of some large infrastructure project or simply because of increasing demand
and fixed supply of land.

163
There are two ways in which the cost of land may be included in the cash flow of a project.
The first one is straightforward: any appreciation (depreciation) that cannot be attributed
to the project is simply ignored. The capital cost is included as investment cost at the
beginning of the project, and the exact value is included as liquidation value at the end of
the project life. In the case of inflation, the final value should take the inflation into account
so that the real value remains unchanged.
An alternative approach is to levy an implicit rental charge as a cost in each period even
when no actual rental is paid. The opportunity cost of land can be reflected in the cash flow
profile of the project by an annual rental charge. This rental charge can be estimated using
the rental rate value of the land times the real value of the land for each period of the
project’s life. If the annual rental charge approach is used, then neither the initial cost of
the land nor its final market value should enter the cash flow profile of the project. Suppose
there is an annual appreciation (depreciation) in rent. In that case, the appreciated
(depreciated) rental value is the annual cost. Still, in this approach, the value of land
improvement or damage should be included in the final year of the cash flow.
Adjustment of sales, purchases, and cash balance
A project’s viability is determined by the sales it generates and also by the timing of the
cash receipts from those sales. A cash flow statement records sales transaction only when
the cash from the transaction is received. Typically, projects forecast their sales as a single
line item which comprises both credit and cash transactions. Only cash sales must be
included in a cash flow statement. Many government projects and firms provide their
goods and services to their customers without receiving immediate cash payments.
A distinction must be made between sales and cash receipts. When a project makes a sale,
the good or service may be delivered to the customer, but no money transferred from the
customer to the project. At this point, the project’s accountants will record that the project
has an asset called Accounts Receivable (AR) equal to the amount of the sale, or the
proportion of it that was not in cash. Until the buyer has paid for what he has received, the
transaction will have no impact on the cash flow statement. When the buyer pays for the
items that he previously bought from the project, the project’s accountants will record a
decrease in accounts receivable by the amount that the buyer has paid and an increase in
cash receipts. Only then are these cash receipts included in the cash flow statement as
inflows.

164
The cash receipts for any period will be determined as the sales during the period plus the
accounts receivable at the beginning of the period less the accounts receivable at the end
of the period:
Cash receipts for the period = Sales for the period + AR beginning of period - AR end of period
The maximum amount of cash a project can receive during a period would be equal to the
new sales and the outstanding receivables, if any. See Figure 21.
Figure 21 - Schematic representation of the relationship between sales and
cash receipts
Source: Jenkins G, Harberger A, Kuo Ch. (2013).
AR are typically measured as a percentage of sales. To determine the appropriate
percentage of accounts receivable that a project will maintain, one can examine the current
performance of the government department or corporation if the project is similar. If such
information is not available, one should look at the industry standards or ranges. It is
crucial to ensure that the accounts receivable selected for the project are consistent with
the current performance of the department or industry standards. If not, a plausible
explanation should be given for why the proposed accounts receivable are different.
Also, when dealing with accounts receivable, it is important to assess the likelihood of bad
debts and make allowances. Bad debts occur when a project’s customers default on their
payments. Bad debts would lower the cash inflows to the project and need to be accounted
for so that the cash flow statement is as realistic as possible. If accounts receivable at the

165
end of the project operations are generally harder to collect, this should also be reflected
in the cash flow statement.
Adjustment of purchases
Like the distinction between sales and receipts, a distinction is necessary between
purchases and cash expenditures. The transaction will be recorded in the cash flow
statement only when the cash from the transaction is paid. When the project makes a
purchase, the good or service may be delivered to the project, but no money transferred
from the project to its vendor. At this point, the project’s accountants will record that the
project has a liability called Accounts Payable (AP), equal to the amount of the purchase
or the proportion of it that was not in cash. In other words, the project owes the seller for
the goods or services that it has purchased. Until the project has paid for what it has
received, the transaction will have no impact on the cash flow statement. When the project
pays the vendors for the items it has bought from them, the project’s accountants will
record a decrease in accounts payable by the amount that the project has paid and an
increase in cash expenditures. These cash expenditures will be included in the cash flow
statement as an outflow.
The cash expenditures for any period will be determined as the purchases during the
period plus the accounts payable at the beginning of the period less the accounts payable
at the end of the period:
Cash expenditures for the period = Purchases for the period + APbeginning of period - APend of period
The maximum cash expenditures that the project could make during a period is for new
purchases during the period plus the settlement of any outstanding accounts payable.
However, suppose the project still maintains a balance of accounts payable at the end of
that period. In that case, the expenditures for the period will be determined by subtracting
the ending balance of the accounts payable from the maximum that the project could have
paid. This case is illustrated in Figure 22.
Figure 22 - Schematic representation of the relationship between purchases
and cash expenditures

166
Source: Jenkins G, Harberger A, Kuo Ch. (2013).
The AP is typically measured as a percentage of total purchases or that of a major input.
The appropriate amount of accounts payable that a project will maintain can be
determined based on the current performance of the government department if the project
is similar. If such information is not available, one should examine the industry standards
or ranges. It is essential to ensure that the accounts payable on which the cash flows will
be based are consistent with the industry standards.
Adjustment for changes in cash balance
Increases and decreases in cash balances owned by the project can take place even when
no change occurs in sales, accounts receivable, purchases or accounts payable. For
example, when cash is set aside for the transactions of the business, it is a use of cash
which is represented as an outflow in the cash flow statement. Similarly, a decrease in
cash held by the project is a source of cash for the project and its sponsors and is a cash
inflow.
The amount of cash to be held for facilitating the transactions of the business is typically
a percentage of the project’s expenditures, sales, or major purchases, and it can be
determined by examining the performance of similar projects in the same sector or
industry.
Working capital
The working capital of a project is generally defined as the project’s current assets net of
its current liabilities. Current assets typically include cash and marketable securities,

167
accounts receivable, inventories and prepaid expenses. Current liabilities include accounts
payable and any other form of debt due within a year or so.
Accounting for working capital in the cash flow statement. The impacts of changes in AR
and in AP on the cash flow statement have been explained before. Changes in cash
balances are directly recorded in the cash flow statement as explained above. Changes in
prepaid expenses should not be included in the cash flow statement. An expenditure is
registered as a cash outflow once an actual outlay takes place. Whether the expenditure is
to pay for past rent or future rent is irrelevant when constructing a cash flow statement.
Changes in inventories should not be included in the cash flow statement. When a project
purchases a certain amount of raw material, inventories will increase. These inventories
are financed through a cash outflow and an increase in accounts payable. If the inventories
have been paid for in cash, then a cash outlay has been recorded in the cash flow statement.
If they have been acquired on credit terms, then they will be recorded in the cash flow
statement only when they are paid for. The situation is similar when dealing with changes
in the inventories of the final product. For example, a decrease in final good inventories
implies an increase in sales. This increase in sales, in turn, implies an increase in cash
receipts or accounts receivable.
Since the components of working capital are developed independently in different plans17,
it is necessary to check for the overall consistency of working capital. This can be done by
comparing the working capital implicitly estimated for the project to industry averages or
to similar projects operated by the same department if available. Specific liquidity ratios
such as the current ratio and quick ratio can be estimated and compared to industry
averages or similar projects.
Estimation of working capital requirements. Ensuring a project’s access to sufficient
working capital is crucial for the project’s success. When a project starts its operations, it
will typically incur expenditures without generating receipts. During this period and until
the project starts generating sufficient receipts, it is important to carefully estimate the
working capital requirements for a project and determine how they will be met.
17 For example, accounts receivable is identified as a percentage of sales in the demand or market plan;
accounts payable is estimated as a percentage of purchases in the technical plan; sources of finance are
identified in the project’s financing plan, etc.
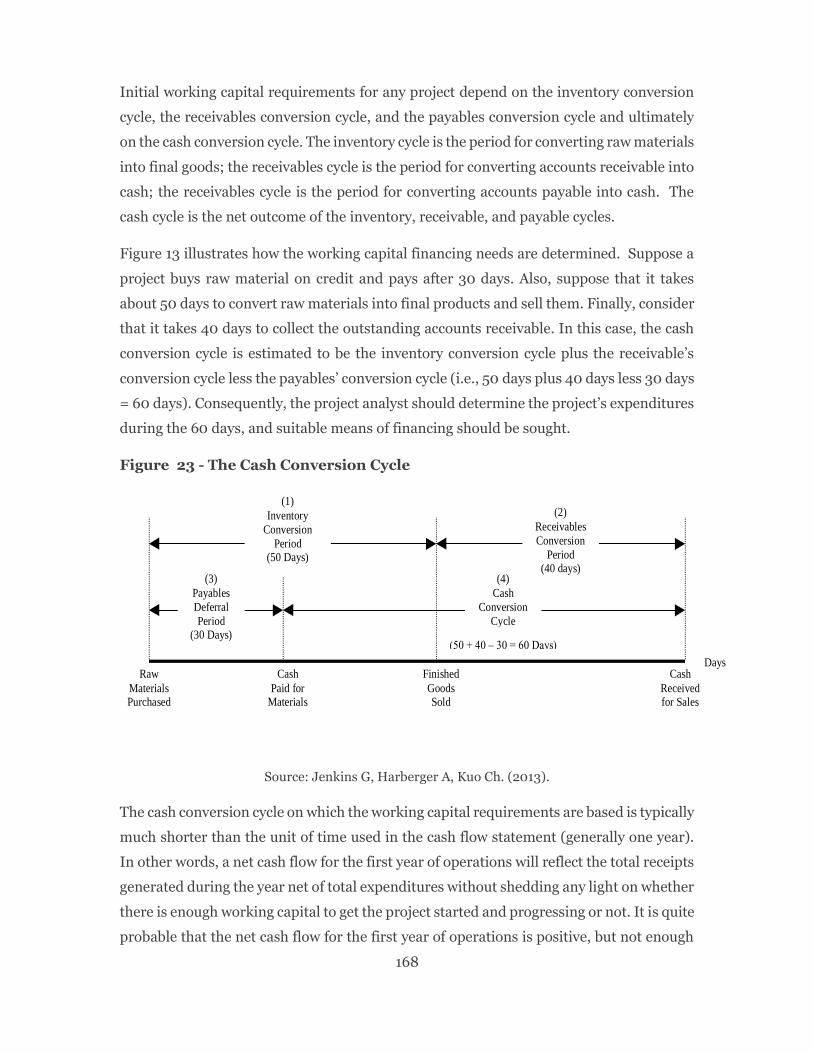
168
Initial working capital requirements for any project depend on the inventory conversion
cycle, the receivables conversion cycle, and the payables conversion cycle and ultimately
on the cash conversion cycle. The inventory cycle is the period for converting raw materials
into final goods; the receivables cycle is the period for converting accounts receivable into
cash; the receivables cycle is the period for converting accounts payable into cash. The
cash cycle is the net outcome of the inventory, receivable, and payable cycles.
Figure 13 illustrates how the working capital financing needs are determined. Suppose a
project buys raw material on credit and pays after 30 days. Also, suppose that it takes
about 50 days to convert raw materials into final products and sell them. Finally, consider
that it takes 40 days to collect the outstanding accounts receivable. In this case, the cash
conversion cycle is estimated to be the inventory conversion cycle plus the receivable’s
conversion cycle less the payables’ conversion cycle (i.e., 50 days plus 40 days less 30 days
= 60 days). Consequently, the project analyst should determine the project’s expenditures
during the 60 days, and suitable means of financing should be sought.
Figure 23 - The Cash Conversion Cycle
Source: Jenkins G, Harberger A, Kuo Ch. (2013).
The cash conversion cycle on which the working capital requirements are based is typically
much shorter than the unit of time used in the cash flow statement (generally one year).
In other words, a net cash flow for the first year of operations will reflect the total receipts
generated during the year net of total expenditures without shedding any light on whether
there is enough working capital to get the project started and progressing or not. It is quite
probable that the net cash flow for the first year of operations is positive, but not enough
(50 + 40 – 30 = 60 Days)
(4)
Cash
Conversion
Cycle
Cash
Receivedfor Sales
Finished
GoodsSold
Cash
Paid forMaterials
Raw
MaterialsPurchased
Days
(3)
Payables
Deferral
Period(30 Days)
(1)
Inventory
Conversion
Period(50 Days)
(2)
Receivables
Conversion
Period(40 days)

169
working capital has been secured to ensure that the project continues to function
smoothly. Consequently, it is necessary that working capital requirements for a project are
explicitly worked out and the appropriate means of financing identified.
Treatment of taxes
Income taxes paid by the project should be included as an outflow in the cash flow
statement. The income tax liability is estimated based on the project’s income statement
following the accounting and tax rules of the country concerned. Year by year forecast, the
cost of goods sold, interest expense, tax depreciation expenses, and overheads are all
subtracted from the project’s revenues to estimate the project’s earnings before taxes.
While estimating the income tax liability, loss provisions carry backwards and forward, if
applicable, should be considered.
Value Added Tax Liabilities. Most countries levy value added taxes on the goods and
services sold domestically, but zero rate sales made to customers living outside of the
country. For a taxable firm, the value of sales will include the value-added taxes collected
by the project on behalf of the government.
The cost of taxed inputs will include the Value Added Taxes (VAT) paid on these
purchases. If the firm is taxable, the payment made to the government is the difference
between the value-added taxes collected on the sales and the value added taxes paid on
the purchase of inputs. These payments of VAT to the government are reported in the cash
flow statement as an outflow. The net effect of this tax treatment is to essentially eliminate
the VAT from being a financial burden on the project.
When a project produces an output that is exempt from VAT, it will not be charging VAT
when it sells its output. On the other hand, it will continue to pay VAT on its purchases of
inputs in most circumstances. In this case, there will not be an additional line item
reporting the VAT payment to the government. The net effect of the VAT is to increase the
cost of the inputs and hence the financial cash outflow of the project.
The third possible situation occurs when the project's output is expected with a rate of zero
imposed on the export sales. In this case, no tax is included in the sales revenues or cash
inflows. The VAT will be levied and included in the inputs purchased by the project. The
difference between the taxes collected on sales of zero and the taxes paid as part of the
input purchases now becomes a negative tax payment or a refund of taxes. This should be
reported as a negative cost or a cash inflow to the project.

170
The inflation in the financial analysis
Experience with projects suffering from financial liquidity and solvency problems has
demonstrated that inflation can be a critical factor in the success or failure of projects.
Correctly designing a project to accommodate both changes in relative prices and changes
in inflation rate may be crucial for its ultimate survival.
Improper accounting for the impacts of inflation when conducting the financial analysis
could have detrimental effects on the financial sustainability of a project and its economic
viability. Inflation assumptions will directly impact the financial analysis of the project
and may require adjustments in operating or investment policies. Since an inadequate
treatment of inflation may adversely affect the project's financial sustainability,
ultimately, the project's economic viability may be compromised if inflation is not
accounted for properly and the necessary adjustments made.
It is essential to realize that the ultimate analysis of the financial cash flows should always
be carried out on a statement prepared in real terms (i.e., net of inflation). The correct
treatment of inflation requires that preparatory tables be made first using nominal prices.
At the very end, cash flow statements prepared in nominal prices must be deflated to
obtain the cash flow statements in real prices.
When the sponsoring agency prepares the cash flow statement, certain variables such as
tax liabilities, cash requirements, interests and debt repayments need to be estimated in
the nominal or current prices of the years they are to be incurred. Other variables making
up the cash flow statement are also presented in nominal or current prices; therefore,
initially, cash flows in nominal or current prices must be developed. These cash flows are
later deflated and delivered in real prices. By constructing the financial analysis in this
manner, we ensure that all the effects of inflation are consistently reflected in the projected
variables. Second, all variables are deflated by the projected increase in the general level
of prices.
The steps required to carry out the inflation analysis are as follows:
i. Estimate the future changes in the relative prices for each input and output
variable. This estimate will involve examining the present and future demand and
supply forces that are expected to prevail in the market for the item. For example,
real wages tend to increase over time as the economy grows.

171
ii. Estimate or develop a set of assumptions concerning the expected annual changes
in inflation over the project's life.
iii. Determine what the nominal rate of interest will likely be over the project's
lifetime, given the expected changes in the price level estimated above.
iv. Combine the expected change in relative prices with the expected change in
inflation rate to give the anticipated change in the nominal price of an item.
v. Multiply the nominal prices for each item by the projections of quantities of inputs
and outputs through time to express these variables in the current year’s prices of
the period in which they are expected to occur.
vi. Begin the construction of a cash flow statement using the current (nominal) values
for the inputs and outputs.
vii. Construct a profit and loss statement for each year of the project’s life to determine
income tax liabilities with all variables expressed in their nominal values.
Depreciation expenses, cost of goods sold, and interest expenses and income tax
liabilities are estimated according to taxation laws of the pertinent country. The
estimated income tax liabilities are included in the cash flow statement.
viii. Estimate cash requirements and any changes in the stock of cash that are reflected
in the cash flow statement
ix. Determine financing requirements along with the interest payments and principal
repayments and include these items in the cash flow statement. This completes the
construction of the projected variables in terms of their current (inclusive of
inflation) values. Now we have a cash flow statement in current prices from the
owner’s point of view.
x. Deflate all items in the owner’s cash flow statement by the inflation price index to
arrive at real values for the cash flow statement. Note that loans, interest payments,
and loan payments are included at their deflated values in the determination of
cash flow in real prices.
xi. Calculate the net financial cash flow from different points of view.
When the financial analysis is carried out in terms of real prices, the private opportunity
costs of capital or the target financial rates of return used as discount rates must be

172
expressed net of any compensation for the expected rate of inflation. In other words, these
discount rates must be real, not nominal variables.
It should be noted that the real financial prices for the input and output variables
developed above are used as the base on which to estimate the economic values for the
benefits and costs of the project. Once these economic costs and benefits are estimated, an
economic resource flow statement is constructed. The structure of the economic resources
flow statement should be like that of the financial cash flow statement.
Financial Cash Flows
The financial cash flow statement of a project is a profile of the project’s receipts (inflows)
and expenditures (outflows) over time. Direct data requirements for a cash flow statement
are slightly different from, and may not be as readily available as, data requirements for
income statements and balance sheets18. For example, an income statement includes
sales and purchases, while a cash flow statement includes receipts and expenditures. Sales
and purchases include credit as well as cash transactions, while receipts and expenditures
are cash only. Even though direct data requirements for cash flow statements may not
exist, a cash flow statement can be constructed from the information in a set of balance
sheets and income statements. A few important distinctions between variables included
in a cash flow statement and variables in other financial statements are discussed below.
The distinction generally stems from the fact that non-cash impacts (except for
opportunity costs) are not included in the cash flow statement.
The cash flow statement is organized in two main sections; the first section typically
contains the expected financial receipts generated by the project. The second one includes
the expected financial expenditures incurred to create the receipts of the project. The
project’s total expenditures, also known as total outflows, are subtracted from its receipts
(inflows) to provide its net cash flow. Table 11 illustrates some of the line items that may
appear in the financial cash flow statement of a project.
Also, Figure 14 illustrates four of the different profiles that a net cash flow can take. Each
profile is a plot of a project’s receipts net of expenditures (net cash flows) against the
sequence of years that make up the project’s life. Typically, a project’s net cash flow is
18 One of the main reasons for more readily available information for balance sheets and income statements is
that these statements are often required by law for disclosure and tax purposes.

173
negative in the early part of its life (the investment stage, CAPEX) when the initial
investment is being undertaken. The project is not generating any receipts. Once the initial
investment is completed and the project starts operating (OPEX), the net cash flow is likely
to be positive (Case A). Case B presents an alternative situation where a period of
reinvestment or plant retooling is planned during the life of the project. This case may
result in negative net cash flows during the operating life of the project. Case C presents a
profile for a class of projects that require a significant expenditure at the end of the project.
The expenditure could be, for example, attributed to clean-up and landscaping costs
associated with a mining project, or the decommissioning of a power plant. The profile of
the net cash flow in Case D represents projects that do not generate any financial receipts.
Such as road projects that charge no tolls or projects that create low receipts that are
insufficient to cover operating expenditures, like water and wastewater projects. In such
cases, the project will have a large initial outlay during the investment stage and will
continue to show negative net cash flows during the operating stage.
The construction of the cash flow statement in Table 11 is generally preceded by the
chronological organization of variables and data into three stages: an investment stage,
and an operating stage, and a cessation-of-operations stage. Each of these stages
corresponds to a plan. Most of the data required for these three plans should be already
organized in the technical, demand, human resources, and financing analysis discussed
previously. Rules for including variables and data in the cash flow statement are presented
and discussed for each of the three plans. However, a straightforward guideline can be
mentioned here: “Only cash impacts are included in the cash flow statement, with two
exceptions. These exceptions are the opportunity cost of existing assets and the residual
values of the assets remaining at the end of the project”.
This manual is applicable to the construction of the cash flow statement as a whole and
can help the analyst when in doubt whether a variable should be included in the cash flow
statement or not. Most of the data required should already be organized in the modules
discussed before.

174
Table 11 - Variables in a Financial Cash flow Statement
Financial Receipts: 1. Sales 2. Changes in Accounts Receivable 3. Residual Values
(a) Land (b) Equipment (c) Buildings
4. Total Inflows
Financial Expenditures: (i) Investment Expenditures/Opportunity Costs 5. New Investment
(a) Land (b) Type 1 Equipment (c) Type 2 Equipment
6. Buildings 7. Existing Assets (if any) (a) Land (b) Equipment 8. Buildings (ii) Operating Expenditures 9. Raw material (1) 10. Raw material (2) 11. Raw material (n) 12. Management 13. Skilled Labour 14. Unskilled Labour 15. Maintenance 16. Changes in Accounts Payable 17. Changes in Cash Balance
18. Total Outflows 19. Net Cash Flow
Source: Jenkins G, Harberger A, Kuo Ch. (2013).
The essential items related to financial receipts to consider inside cash flow
depend on each project's nature. However, the most critical items are related to fees
charged to users and state grants. In the last case, the government can provide a subsidy,
per capita, for care or global, which is a cash inflow to the institution responsible for the
operation. Table 12 shows an example of the financial cash flow, including the debt service
coverage ratios.

175
0 1 2 3 4 5 6 7 8 9 10 11 12 13 14 15 16 17 18 19 20 21 22 23 24 25 26
Initial Investment
Year of project
life
Operating Stage Case A
0 1 2 3 4 5 6 7 8 9 10 11 12 13 14 15 16 17 18 19 20 21 22 23 24 25 26
Initial Investment
Year of project
Operating Stage Case B
0 1 2 3 4 5 6 7 8 9 10 11 12 13 14 15 16 17 18 19 20 21 22 23 24 25 26
Initial Investment
Year of project
life
Operating Stage Case C
0 1 2 3 4 5 6 7 8 9 10 11 12 13 14 15 16 17 18 19 20 21 22 23 24 25 26
Initial Investment
Year of project
life
Operating Stage
Case D
Figure 24 - Different Financial Profiles
Source: Jenkins G, Harberger A, Kuo Ch. (2013).

176
Table 12 - Financial Cash Flow Example
2006 2007 2008 2009 2010 2011 2012 2013 2014 2015 2016 2017 2018 INFLOWS Gold Sales 0,0 0,0 81,8 95,4 109,0 109,0 109,0 109,0 109,0 109,0 109,0 109,0 0,0 Silver Sales 0,0 0,0 9,7 11,3 13,0 13,0 13,0 13,0 13,0 13,0 13,0 13,0 0,0
Change in A/R 0,0 0,0 -13,7 -2,3 -2,3 0,0 0,0 0,0 0,0 0,0 0,0 0,0 18,3 Salvage Value 0,0 0,0 0,0 0,0 0,0 0,0 0,0 0,0 0,0 0,0 0,0 0,0 13,6 Land Grant 25,0
TOTAL INFLOWS 25,0 0,0 77,8 104,5 119,7 122,0 122,0 122,0 122,0 122,0 122,0 122,0 31,9 OUTFLOWS Investment Costs Land 25,0 Infrastructure 4,0 4,0 0,4 0,4 0,4 0,4 0,4 0,4 0,4 0,4 0,4 0,4 0,0 Machinery & Equipment 0,0 136,0 6,8 6,8 6,8 6,8 6,8 6,8 6,8 6,8 6,8 6,8 0,0 Installation Cost 0,0 16,0 0,8 0,8 0,8 0,8 0,8 0,8 0,8 0,8 0,8 0,8 0,0 Mine Reserve Development 10,0 Site Restoration 0 0 0 0 0 0 0 0 0 0 0 0 6,0 Operating Costs
Labour 0,0 0,0 8,0 9,3 10,6 10,6 10,6 10,6 10,6 10,6 10,6 10,6 0,0 Imported Materials 0,0 0,0 6,3 7,4 8,4 8,4 8,4 8,4 8,4 8,4 8,4 8,4 0,0 Timber 0,0 0,0 5,4 6,3 7,2 7,2 7,2 7,2 7,2 7,2 7,2 7,2 0,0
Fuel 0,0 0,0 10,5 12,3 14,0 14,0 14,0 14,0 14,0 14,0 14,0 14,0 0,0 Domestic Transport & Handling 0,0 0,0 0,9 1,1 1,2 1,2 1,2 1,2 1,2 1,2 1,2 1,2 0,0
Miscellaneous 0,0 0,0 2,7 3,2 3,6 3,6 3,6 3,6 3,6 3,6 3,6 3,6 0,0 Cash Balance
Change in A/P 0,0 0,0 -2,6 -0,4 -0,4 0,0 0,0 0,0 0,0 0,0 0,0 0,0 3,4 Change in C/B 0,0 0,0 1,7 0,3 0,3 0,0 0,0 0,0 0,0 0,0 0,0 0,0 -2,3
Taxes statement Income Tax 0,0 0,0 10,7 13,8 17,4 17,8 18,3 18,8 19,2 19,2 19,2 19,2 0,0 Royalty 0,0 0,0 4,6 5,3 6,1 6,1 6,1 6,1 6,1 6,1 6,1 6,1 0,0
TOTAL OUTFLOWS 39,0 156,0 56,2 66,4 76,3 76,9 77,4 77,9 78,3 78,3 78,3 78,3 7,2 NET CASH FLOW BEFORE FINANCING
-14,0 -156,0 21,6 38,1 43,4 45,1 44,6 44,1 43,7 43,7 43,7 43,7 24,7

177
2006 2007 2008 2009 2010 2011 2012 2013 2014 2015 2016 2017 2018 PV Net Cash Flow 197,4 188,1 160,5 125,3 85,9 44,1 PV Debt Repayment 100,2 100,2 80,1 60,1 40,1 20,0 ADSCR 3,30 1,51 1,81 1,99 2,09 2,20 DSCR 1,97 1,88 2,00 2,09 2,14 2,20
Source: Jenkins G, Harberger A, Kuo Ch. (2013).

178
8.8 CONDUCTING THE ECONOMIC ANALYSIS
As in the case of financial analysis, economic analysis strongly depends on the proper
construction of an economic resources statement. The steps to conducting an economic
analysis are the following.
Describe the situation with the project
For each selected alternative it must be estimated the baseline scenario. The objective at
this point is to determine how the new situation would look like assuming that the project
gets implemented, thus the description must include its location, the technical
specificities, what the supply will be, how the demand should look like and what is
foreseeably to be the interaction between the two. All in all, at this stage the analyst should
be able to answer the following questions:
• How much does the project reduce the deficit identified in the baseline situation?
Does the project generate new customers – more products and services will be
consumed?
• Does the project reduce costs and if so, how much?
• How much does the project increase socio-economic surpluses?
In short, the description must answer the question of how and to what extent the
implementation of the project will solve the problem throughout its lifespan. This forecast
will be compared to the baseline scenario and the relative socio-economic profitability of
the project will be derived from its marginal effects over such baseline.
Identification of Economic Costs and Benefits
All the benefits generated by the project to society are recognized. The sponsoring agency
should consider not only those benefits that are generated in the same market services or
products (direct benefits) but the benefits generated in a related market (secondary and
indirect benefits and positive externalities). Similarly, all the costs should be recognized,
considering the direct costs plus the costs imposed on the rest of society (secondary and
indirect costs and negative externalities).

179
Quantification and Valuation of Economic Costs and Benefits
This step requires the appropriate allocation of benefits and costs in measurement units.
Quantification of direct costs is generally the easiest task at this stage, as it only requires
adequately estimating the physical requirements of each type of input used in the
implementation of the project (investment) as well as the operational and maintenance
cost. The valuation of these costs does not present major difficulties, since for most of the
resources used in the project there are clearly defined markets with prices that can be used.
The quantification of economic benefits, particularly positive externalities, is a complex
task that requires different studies, establishing numerical relationships between resource
availability and consumption of goods. This also applies to the quantification and
valuation of indirect, incidental costs and externalities, which must be analysed case by
case depending on the available information.
Economic (Shadow Prices) and Conversion Factors
For the purposes of economic analysis, costs and benefits are estimated using the three
postulates of efficiency approach. The economic prices of goods and services used for
economic analysis are derived by adjusting the market or financial prices for distortions.
Financial prices are used to construct financial cash flows and are essentially the starting
point for conducting the appraisal of any project. Thus, it is imperative to develop a strong
financial analysis before proceeding to undertake the economic appraisal. From the third
postulate the net economic benefit of the project is measured simply by subtracting the
total resource costs from the total benefits of the project’s output.
In order to get these true economic values, the project formulator needs to know:
i. Whether the goods are tradable or non-tradable.
ii. How distortions such as tariffs, taxes, and subsidies create a wedge between the
market and the economic exchange rates and how these distortions also create a
divergence between the economic and financial values of both the tradable and
non-tradable inputs and outputs of the project.
iii. How the transportation and handling costs of inputs and outputs affect the true
economic values of goods and services used and produced by a project.

180
Tradable and Non-Tradable Goods
A good or service is considered tradable when an increase in demand (supply) by a
project does not affect the amount demanded (supplied) by domestic consumers
(producers). The increase in demand (supply) by a project is eventually reflected as
an increase/decrease in imports or a decrease/increase in exports, depending on
whether the project is demanding or supplying the importable or exportable
commodity. An increase in demand for an importable commodity as a result of a
project results in an increase in demand for imports. An increase in demand for an
exportable commodity as a result of a project results in a reduction in exports.
A commodity or service is non-tradable from a country’s point of view if its
domestic price lies above its FOB export price or below its CIF import price. The
international transportation cost may be very high compared to the value of the
product so that no profitable trade is feasible. Alternatively, an importable good
will become non-tradable if it receives such a high level of protection in the form of
trade quotas or prohibitive tariffs that no import transactions will take place.
The concept of a conversion factor, defined as the ratio of the economic price to the
financial price, plays an important role in looking at the financial and economic costs or
benefits of a project. If the conversion factor specific to the project’s inputs and outputs
and the economic costs of capital and foreign exchange are known, it is easy to translate
the financial appraisal of a project into its economic valuation. For a given good or service,
the term Commodity Specific Conversion Factor (CSCF) is used. While commodity specific
conversion factor values may be different when calculated at project sites, economic
parameters such as economic cost of capital and foreign exchange are national parameters
that remain constant, at a given time, across projects in the overall economy.
If there are no distortions in the supply and demand market of a commodity, the CSCF
will simply be 1 because the economic and financial prices are the same. If the market for
foreign exchange is distorted, the Market Exchange Rate (Em) or the Official Exchange
Rate (OER) will not accurately reflect the economic value of a unit of foreign exchange in
relation to the domestic currency. Thus, it is essential to make an adjustment for the
divergence between the market or official price of foreign exchange and its economic price,
also referred to as the Economic Exchange Rate (Ee) or sometimes as the Shadow
Exchange Rate (SER).
Summarizing, the steps required to carry out an economic analysis are as follows:
i. Estimate the CSFC for all the prices of inputs and outputs involved in the
evaluation.
181
ii. Estimate the future changes in the relative prices for each input and output
variable. This will involve the examination of the present and future demand and
supply forces that are expected to prevail in the market for the item.
iii. Multiply the economic prices for each item by the projections of quantities of
inputs and outputs through time to express these variables in the current year's
prices for the period in which they are expected to occur.
iv. Begin the construction of a resources flow statement using the current values for
the inputs and outputs.
v. Discount the net economic resource by the social discount rate.
8.9 THE ECONOMIC PRICES
As a contribution, key economic prices and national parameters were estimated – based
on secondary sources information – to assess the social and economic returns to
investments. In most cases, several national parameters are required to conduct the
economic analysis of investment projects. These parameters are specific to the entire
country and not to a particular project. Once calculated, they can be used in projects across
the economy while being centrally maintained to reflect economic conditions changes.
The Social Discount Rate
An investment project usually lasts for many years; hence, its appraisal requires
comparing the costs and benefits over its entire life. For acceptance, the present value of
the Project's expected benefits should exceed the present value of its expected costs.
Among a set of mutually exclusive projects, the one with the highest Net Present Value
(NPV) should be chosen. This criterion requires the use of a discount rate to compare the
benefits and costs that are distributed over the life of the investment.
If the economic NPV is more significant than zero, it is potentially worthwhile to
implement the Project. A positive NPV implies that the Project would generate more net
economic benefits than the same resources would have developed if used elsewhere in the
economy. On the other hand, if the economic NPV is less than zero, the project should be
rejected because the resources invested would have yielded a higher economic return if
left for the capital market to allocate to other uses.

182
KEY CONCEPTS
Given the different time profiles of costs and benefits in public (and private) investment
projects, a comparable measure is needed by policy makers in order to choose between
different options. Therefore, a discount rate is used to express the current and future costs
and benefits of a project in terms of their present values. For public investment projects,
this parameter is the Social Discount Rate (SDR). The choice of an appropriate SDR is at
the core of Cost Benefit Analysis and has important implications for the allocation of
resources.
Indeed, as long as the SDR reflects the marginal social opportunity cost of the funds
allocated to a public investment project, the resource allocation is efficient. In a perfectly
competitive market for investible funds the equilibrium interest rate is the appropriate
SDR; in a market with distortions, where which is the most common example in financial
markets around the word, it is not. These distortions are mainly caused by taxes on
individual interests’ earning and corporate income, information asymmetries, and other
economic externalities.
In order to estimate the SDR for a given country or region there are two main dimensions
of the analysis to consider, one from the investors’ perspective (demand price) and the
other from the savers’ perspective (supply price).
From the investors’ perspective, since the funds used by public projects can also be
allocated in the private sector, there is an underlying opportunity cost. In order to pursue
the most efficient use of resources, the public project should only be considered if its rate
of return is at least the return of the next best alternative use of the capital in the private
sector. When there are no distortions, this leads to the SDR to be equivalent to the
marginal rate of return on private investment, also known as the marginal Social
Opportunity Cost of Capital (SOCC).
On the other side, from the consumers’ point of view, savers prefer to consume goods and
services in the present or sooner, rather than later in the future. One of the reasons behind
this idea is that individuals expect to consume more in the future, leading to a lower
marginal utility of consumption. The other reason suggests that even when individuals
expect or value the future consumption equal to the current one, they are prone to be
impatient and given the risk of not being alive in the future (Asian Development Bank,
2017). According to these arguments, the SDR should be equal to the marginal Social Rate

183
of Time Preference (SRTP), the rate at which society is willing to postpone a marginal unit
of current consumption in exchange for increased consumption in the future. In other
words, under this interpretation, the SRTP measures how much the society should be paid
in the future for every unit of reduction of consumption in the present.
For the empirical estimation of the SRTP there are two main approaches generally used.
One considers the after-tax rate of return on government bonds, as a proxy for a low-risk
investment. Though its simplicity, there is a concern that this interest rate may not capture
properly the society’s time preferences. Another strategy to estimate the SRTP is the
Ramsey method, also known as the Ramsey formula or the “optimal growth rate method”.
This approach does not rely on market interest rates data for its estimation and considers
instead that as part of an optimal inter-temporal allocation of resources, the SRTP is “the
sum of the rate of pure time preference (describing impatience) and the product of the
consumption elasticity of marginal utility (describing how fast marginal utility decreases
with consumption) and growth rate of per capita real consumption (describing how fast
consumption increases)” (Asian Development Bank, 2017).
Regarding the estimation of the SOC, as it will be seen below, national accounts data can
be used as a source for an estimation of economy wide profits. The ratio of this measure
of profits to the estimated national capital stock gives an estimate of the SOC.
Alternatively, Weiss (2015) state that sector data can also be used to compute a return in
financial prices, that would need to be converted to economic prices. Finally, a third
method also mentioned by Weiss (2015) consists of identifying the minimum rate of return
that seems acceptable to the government, based on data of recently accepted and rejected
projects.
When there are no distortions and there is perfect competition in the investible funds
market, the SRTP and the SOC are equal, since the price of the demand and supply of
funds is cleared by the market interest rate, that will be equal to the SDR. However,
different distortions, such as taxes, externalities, information asymmetries or risks,
creates a wedge between the SRTP and the SOC, lowering the first and pushing up the
latter further from the market interest rate.
Taken into consideration the previous, both approaches can be followed to estimate the
SDR. For example, in some developed countries (mainly in Europe) the SDR is estimated
based on the SRTP, while in other developed (such as Canada, New Zealand and Australia)
and some developing countries, the preferences for public investment are mainly focused

184
related to the SOC. Even though the definition of TSD is a public policy decision, the
approach mostly used in developing countries is presented below, which is also
recommended by different multilateral credit organizations such as the World Bank and
the Asian Development Bank, among other.
Since this, the third alternative for estimating the SDR is known as the Weighted Average
Method (WAM)19. Given the funds used in a public project come from different sources,
namely displaced private investment, foregone consumption today, or borrowing from
international capital markets, this method proposes the use of a weighted average between
the SOC, the SRTP and the marginal cost of international borrowing for the given country
or region. When the public sector has no access to the international financial markets (in
a closed economy), the method uses a weighted average between the SOC and the SRTP.
The downside of this approach is that it requires information on a number of variables
that may not be easily available; in those cases, it may be necessary to introduce
assumptions that would critically affect the SDR estimates. In particular, the weights are
determined by the magnitude in which savings and investment respond to a small change
in the interest rate, i.e., the respective elasticity of savings and investment to the interest
rate. Usually, investment has a larger elasticity to the interest rate than savings and
therefore there is more weight put on the SOC than on the STRP.
Thus, taking under consideration the limitations of the STRP and SOC methods, according
to the Asian Development Bank (2017), the WAM has been the norm for the empirical
estimation of the SDR as it considers market imperfections and credit constraints20.
19 This method is related to the efficiency approach, since it applies the Harberger´s three postulates. When
the WAM is applied to estimate the SDR, frequently this parameter is named the Economic Opportunity Cost
of Capital (EOCK).
20 According to the Asian Development Bank (2017) a limitation of the WAM is that it ignores that “while costs of a public project can displace private investment, its benefits can be reinvested in the private sector”. The Shadow Price of Capital (SPC) approach overcomes this limitation by considering not only the displacement costs of investments in terms of consumption but also the consumption benefits from reinvestment, while reconciling the STRP and SOC approaches. However, although its elegance, the SPC approach is very difficult to implement at an aggregate level as it is very sensitive to parameters.

185
ESTIMATIONS OF THE SDR FOR KENYA
This section discusses the main papers related to the estimation of SDRs for Kenya. Since
these previous works focus on different methods of calculation, they are grouped in SRTP
estimations, SOC estimations, and weighted average methods found in the relevant
literature. Table 13 below summarizes the studies revised and its results.
Table 13 - Review of SDR estimation methods and results for Kenya
REFERENCE YEAR
SDR ESTIMATION APPROACH
SRTP Weighted Average Method
SOC Unknown
Debebe 1977 10-15-20%
- -
Valentim and Prado 2008 6.3% - -
Ghanbariamin 2015 10.1% 12.8% 14.2%
Fenichel, Kotchen and Adiccott 2017 6.5% - -
Japan Int. Coop. Agency 1991 - - 10%
ISRIC 2011 - - 10-12-14%
Atampugre 2014 - - 8.5%
CIAT CGIAR 2017 - - 9%
Jenkins 2020 - - 10.7- 15.1%
Government of Kenya 2010 5%
FAO 2020 5%
Source: Own elaboration based on a literature review
In what follows we discuss the main results found in the literature grouped by estimation
method.
Estimations using the SRTP. In one of the first efforts to calculate the key components
for the cost-benefit analysis in Kenya, Debebe (1977) estimated the consumption discount
rate, the social price of investment and the shadow wage rate of unskilled labour. However,
the study was unable to calculate directly the SDR, and due to data limitations, it could
not determine a unique value for the discount rate, providing instead a range of values of
10%, 15% and 20% per year for the consumption discount rate.

186
Valentim and Prado (2008) apply a methodology derived by Feldstein (1965)21 to estimate
the SDR for 167 countries using data for 2006. According to their approach, the SDR
equals the intertemporal marginal rate of substitution of income, which in turn depends
on marginal social utility, in the micro founded model they present. The authors estimate
an SDR for Kenya of 6.3% in a range between 4.9 and 7.6%.
In a more recent study focused on the Kenyan economy, Ghanbariamin (2015) estimates
the SDR following the weighted average approach. As part of the implementation of the
methodology, the study estimated the SRTP as it is one of the three main components
considered using the mentioned method. The author follows the view that the SRTP
represents the real return on capital and therefore calibrates it using observed interest and
saving rates. Indeed, the author estimates the social cost of new domestic savings through
their real return as the measure of the forgone or postponed consumption, considering the
income of individuals, reproducible capital stock, taxes and financial intermediation costs.
The results of the study showed an average real rate of return for domestic savings of
10,14% for the period of 1990-2011.
Finally, Fenichel, Kotchen and Adiccott (2017) present a model in which they consider a
version of the Ramsey model where individuals care about their future as long as they are
alive. As a result, people discount the future according to their mortality risk, and the pure
Utility Discount Rate (UDR) depends on the age structure of the population and life
expectancy at each age. As a result, a younger age structure and longer life expectancy has
a negative impact on the SRTP. Given that countries with a young population have a
shorter life expectancy than countries with an older population, there can be countries
with completely different demographic structures having similar SRTP. The estimates for
Kenya using data for a large set of countries for 2012, give a mean UDR of 1.56% and a
SRTP of 6.52% obtained using the standard Ramsey formula. This value not only
represents the most recent serious estimation of the SRTP but also it turns out to be similar
to the one obtained by Valentim and Prado (2008).
21 The model by Feldstein (1965) develops a micro founded model of the SRTP. The model assumes aggregate
output depends on the size of the population, a utility function with relative risk aversion, an aggregate utility
function, and discounting. The SRTP is then derived from the solution of the maximization of the discounted
sum of future social utilities problem.
187
Estimations using the SOC. The revised studies use different values for the SOC. The
Japan International Cooperation Agency (1991) uses a 10% SDR in an evaluation of a
hydropower project in Kenya; but unfortunately, there are no details on how they get to
such rate. More recently, in a cost-benefit analysis of land management options in the
Upper Tana, the Onduru and Muchena (2011) uses discount rates of 10, 12 and 14%. This
study takes as a reference the interest rates offered by financial institutions for loans to
smallholders, as a proxy of the opportunity cost of capital. Similarly, in a cost-benefit
analysis of the adoption of soil and water conservation methods in Kenya, Atampugre
(2014) consider the value of the discount rate based on the interest rates payable by
farmers on loans from financial institutions net of inflation. In this case he uses a real SDR
of 8.5%.
Ghanbariamin (2015) estimates the SOC as an input for implementing a weighted average
approach. The real rate of return to domestic investment for Kenya is calculated from
national accounts data and estimates of the stock of capital, at an average level of 14.21%
for the period 1990-2011. This rate of return is net of the appropriate taxes, subsidies, and
capital depreciation. Ng'ang'a et al (2017) use a 9% SOC in a cost-benefit analysis for
climate-smart soil practices in Western Kenya, considering it as “the opportunity cost of
money for capital by banks and saving and credit organization” based on households’
survey data.
However, the more appropriate and recent estimation of the SOC was computed by
Othman and Jenkins (2020). They estimate the rate of return to reproducible and
remunerative capital in the East African Community (EAC) countries over the period
1999-2016. For the case of Kenya, the estimated real rate of return to reproducible capital
and the marginal rate of return to remunerative capital are on average 10.7% and 15.1%,
respectively, for the period under analysis. Both rates display a relatively small variation
over the analysed years. Reproducible capital includes capital owned by the public and
private sectors but excludes land and natural resources. The economic rate of return to
capital is defined as the contribution of reproducible capital to the economy. The capital
contribution to growth is equal to the net investment to GDP ratio multiplied by the sum
of the net rate of return to investment and the depreciation rate. The remunerative capital
is a subset of the reproducible capital including private investments in reproducible
capital, public investments of the same type, such as SOE, and public-private partnerships.
The distinction is made to consider that although much of the public capital stock is
reproducible, a smaller fraction is also remunerative. This is relevant because, following

188
the rationale of the weighted average method, when either a private firm or a public
institution borrows funds in the capital market, those funds are taken from three different
sources, the displacement of reproducible remunerative capital investments, domestic
savings and/or international savings. This is the reason why the gross of tax return to
investment is a measure of the economic opportunity cost of the displaced funds22.
Estimations using the Weighted average. The paper by Ghanbariamin (2015) is the
only one that estimates the economic opportunity cost of capital for Kenya, the SDR, by
means of the weighted average approach. According to this method the SDR can be
expressed as
𝑺𝑫𝑹 = 𝜶 ∗ 𝑺𝑶𝑪 + 𝜷 ∗ 𝑺𝑹𝑻𝑷 + (𝟏 − 𝜶 − 𝜷) ∗ 𝒊𝒇 ,
Where 𝛼 is the proportion of funds for public investment displaced from private
investment; 𝛽 is the fraction of funds obtained from current consumption (increase in
savings); (1 − 𝛼 − 𝛽) is the corresponding proportion of funds obtained from
international borrowing, and 𝑖𝑓 is the government’s real long-term foreign borrowing rate,
which is equivalent to the international interest rate plus the country risk on sovereign
bonds and the expected depreciation of the exchange rate. These weights depend on the
ratio of private investment, domestic savings and the external savings to the GDP. A
standard practice in the literature is to adjust the weights of the different sources of funds
with the elasticities of private investment, savings and supply of foreign capital, with
respect to changes in the interest rates.
The same study of Ghanbariamin (2015) gets the following estimates for the parameters
of the above equation
22 According to same authors, there are two main approaches for measuring the return to capital. Both of them
are based on national accounts data. The first one computes the income to capital by adding up interest
income, dividend income, rent, profit income, and both the direct and indirect taxed generated by capital.
Then the total income to capital is divided by the stock of reproducible capital. By the second approach, the
income to capital is estimated by deducting from the GDP the “contributions made by labour, land, natural
resources, associated sales and excise taxes and the gross consumption of fixed capital”. Othman and Jenkins
(2020) follow this second approach mainly due to data availability reasons

189
𝑺𝑫𝑹𝑲𝒆𝒏𝒚𝒂 = 𝟎. 𝟓𝟐 ∗ 𝟏𝟒. 𝟐𝟏% + 𝟎. 𝟐𝟓 ∗ 𝟏𝟎. 𝟏𝟒% + 𝟎. 𝟐𝟑 ∗ 𝟏𝟐. 𝟒𝟑% = 𝟏𝟐. 𝟕𝟕%.
As can be noticed in the above equation the SOCC and SRTP values are the ones described
before.
CURRENT ESTIMATION FOR KENYA
As it is stated at the National Parameters and Commodity Specific Conversion Factors
website, the SDR, using the Economic Opportunity Cost of Capital (EOCK) Approach, is
estimated in 11,5% (national parameters can be accessed through the link
below: http://kenya.cri-world.com/).
The Shadow Wage Rate
The concept of economic opportunity cost is derived from the recognition that when
resources are used for one Project, opportunities to use these resources elsewhere are
sacrificed. The Shadow Ware Rate (SWR) is the economic opportunity cost; then, the
economic price must consider the economic value sacrificed using an additional worker in
a project.
The supply price of labour can be estimated, departing from the minimum wage that the
Project must pay to get an adequate number of applicants. Once this supply price of labour
has been determined, the SWR is calculated by adjusting that value to account for
distortions that may affect the market wage rate, such as income unemployment, taxes or
subsidies. To simplify the analysis, it is recommended to estimate the SWR for three
categories of labour: skilled, semi-skilled and non-skilled workers.
To estimate the SWR, it is needed to know the condition and market source where the
workers come from to satisfy the project's demand: employed, unemployed or inactive
workers23. The source will depend on the characteristics of the labour market and the
specific project requirements. In the case of previously employed workers, the SWR is the
marginal product displaced in the formerly performed activity, corresponding – in general
– to the market wage, adjusted for existing distortions (taxes). For unemployed and
23 An unemployed person is an individual who has actively sought work, while an inactive person is an
individual who wishes to work but did not made efforts to find a job.

190
inactive workers, the opportunity cost corresponds to their reserve salary (in these cases,
workers are willing to accept a wage below the market wage).
KEY CONCEPTS
While in the financial analysis wages are measured at their market values, in economic
analysis of projects the labour input is measured at its social opportunity cost. Indeed, the
SWR, also known as the economic price of labour, should measure the opportunity cost
for the economy of employing an additional worker in an investment project.
In this regard, the distinction between market and shadow wages is relevant because, in
the presence of macroeconomic imbalances and imperfections in the labour market, wages
do not represent the opportunity cost of labour (European Commission, 2014; Asian
Development Bank, 2017). Those imbalances can be reflected by high unemployment rates
and segmentation by formality status in the labour market. In other words, while in a
perfectly competitive market, the wage is equal to the marginal productivity of labour, in
an imperfect labour market that is not true anymore.
Therefore, observed market wages should be corrected, usually downwards, considering
that the impact of market distortions and imperfections might be heterogeneous among
workers of different skills. For that purpose, the common practice is to distinguish three
groups of workers: skilled, semi-skilled and unskilled. Skilled workers are usually scarce
and therefore it is normally assumed that the market wage of workers previously employed
in similar activities represents the economic cost of labour. Semi-skilled workers instead
are expected to be on excess supply and may experience longer involuntary unemployment
spells. In such a case, if a project hires a worker from the pool of unemployed, the
economic cost should be the reservation wage24, , that would be given by the
unemployment benefit plus any non-market income received by the worker. Finally, the
unskilled worker’s category is particularly relevant for countries with an important rural
sector, high informality rates and limited welfare state systems (Asian Development Bank,
2017). In such a case, a project might hire workers previously employed in informal jobs,
24 The reservation wage is the minimum acceptable wage for the worker to take the job.

191
and therefore the informal sector wage or the forgone output of informal sector activities
(for the self-employed) could be appropriate measures of the opportunity cost of labour25.
Based on appropriate estimations of the SWR, the Shadow Wage Rate Conversion Factor
(SWRCF) is defined as the ratio between the SWR and the market wage.
Considering the international literature on the estimation of SWR for developed and
developing countries (European Commission, 2014), it is normally 1 for skilled labour. Dal
Bo, Fiorio and Florio (2011) estimate the SWR for different regions in the European Union
considering the different characteristics of their labour markets, in terms of
unemployment, size of the agricultural sector, migration, and informality, among others.
The estimated conversion factors vary in the range of 0.54 to 0.99, where the lower values
are present in regions with higher “Keynesian unemployment” and labour market
dualism.
There are two main methodological strategies for the estimation of SWR in the literature,
the efficiency approach (Harberger, 1971a, 1971b, 2008) and the distributive approach
(Little and Mirrlees, 1969, 1974, 1991; Squire and van der Tak, 1975; Lal and Squire, 1980).
The two approaches have different views on the employment impact of investment
projects, as discussed in the sequel.
The Little/Mirrlees approach. According to the distributive approach, the shadow wage
should measure not only the opportunity cost of labour but also the indirect consumption
effects. The impact of consumption effects of a project on the SWR is ambiguous. On the
one hand, the additional consumption caused by an increase in employment due to a
project would be desirable because it would lead to improvements in the income
distribution; on the other hand, the increase in consumption would divert resources from
savings and investment. In this context, Little and Mirrlees (1974) consider that if a project
hires unemployed or informal workers and if reducing poverty is a policy goal, this should
be reflected in a downward adjustment of the SWR. At the same time, focusing on this
policy objective would sacrifice economic growth, as increased consumption means
reduced investment and capital accumulation, and therefore this would require an upward
25 For projects where labour is an important component of the costs or in the case where labour is an important
beneficiary, the Asian Development Bank (2017) recommends a detailed analysis of the local labour market
conditions to estimate the project-specific opportunity cost of labour. For the other cases and as a general rule,
using national estimations of the SWR would be enough.
192
adjustment to the SWR. Summarizing, both the economic growth and the poverty
reduction goals should be weighted based on the policy maker objective function to
determine the SWR.
Based on the above considerations, Squire and van der Tak (1975) include three main
components in the SWR estimation. The first one is related to the efficiency approach and
considers the forgone marginal product of the displaced workers who are hired by the
project; the second component measures the disutility of the increased efforts and hours
of work due to the project; the third component considers the welfare effect of the
increased consumption (net of the appropriate social cost of the related imports).
Regarding the first component, it would be the case that the workers hired by the project
were previously unemployed or employed in jobs paying lower wages, who which drive
down the SWR. But moving from unemployment or a low paid job to a better paid and
demanding job, would require workers to increase their effort and dedication (the second
component). One way to measure this disutility is by income differential between the new
labour market status and the source one. But considering that market wages usually
exceed reservation wages, this would not be an appropriate approach. Finally, the
consumption impact of a project can also be measured by the before and after income
differential, adjusted by the marginal propensity to consume.
Despite it is a comprehensive approach, an important inconvenience to use the
distributive approach is that it is not only hard to implement but also very sensitive to
measurement error. For this reason, the usual practice is to estimate the SWR following
the efficiency approach. On the other hand, Squire and von der Tak (1975) appoint that
efficiency method does not include any social preference (in the margin) of investment
over consumption and ignores any social value attributed to improving the income
distribution and preferences for work and leisure.
The Harberger´s Approach. Under the efficiency method, the welfare effects of
employment are not a matter of discussion. The labour is a production input, as capital,
materials, and any other production factor; them, it should it should be treated as a project
cost (Harberger, 2008).
The traditional efficiency approach suggests that the SWR is a weighted average between
the demand and the supply price of labour. The demand price of labour is the value of the
marginal product of labour, while the supply price is the willingness to accept by workers

193
to be employed. In a perfect competitive market, the demand and the supply prices are
equal. Instead, in a distorted marked (by taxes and other labour market imperfections),
the marginal product of labour, measured by the labour cost paid by the employer, is
greater than the wage received by workers. Thus, the SWR is a weighted average of both
prices, and usually the weights depend on the wage elasticities of the demand and supply
for labour.
However, since in most of the cases projects are not big enough to change the wage market
equilibrium, it can be assumed an inelastic supply for labour, without seriously violating
reality (Guillermo-Peon and Harberger, 2012). The intuition is that a new project is
assumed to draw its labour from alternative employments; then, the analysis assumes that
no any (significant) part of the project’s new demand is met by people entering the labour
force.
Following this assumption, under the efficiency approach the SWR has two main
components: i) the marginal cost of attracting a worker to the project, and ii) the
externality effects associated to perturbing markets related to the project (Guillermo-Peon
and Harberger, 2012, Jenkins, Bahramain and Miklyaev, 2019).
Based on the above, the usual practice is to consider the market wage and then to add the
effect of distortions, such as income taxes, and contributions to social security and to
health insurance, among others. Based on this the simplest version of the SWR is such that
𝑆𝑊𝑅 = 𝑊(1 − 𝑡), where W is the market gross wage, and t is the income tax rate. Denoting
by 𝐷 = 𝑊𝑡 the economic distortions caused by hiring an additional unit of labour, we have
𝑆𝑊𝑅 = 𝑊 − 𝐷.
In labour markets with significant informality and no social protection for the
unemployed, such as Kenya, it would be expected that the wage received by a worker hired
on the project is higher than the income earned in informality or unemployment.
Moreover, given that informal sector workers do not pay taxes, gross and net wages are
the same in the informal market. Therefore, there is a positive externality, denoted by 𝐸
associated by hiring a worker who was previously in the informal sector. From the worker’s
point of view, the value of the externality is 𝐸 = 𝑊 − 𝐼𝑊 + 𝐻 and corresponds to the wage
differential between the Formal Wage, W, and the Informal Wage IW, plus the value of the
benefits for having access to higher quality Health services, H.

194
As a result, given that a project can hire workers from the formal or the informal sector,
the corrected formula for the SWR becomes
𝑺𝑾𝑹 = (𝑾 − 𝑫) − (𝟏 − 𝝓)𝑬
Where 𝜙 represents the fraction of formal sector workers over total employment. Note
that in the extreme case that 𝜙 = 0, i.e., full informality, we have that the SWR reduces to
𝐼𝑊 − 𝐷 − 𝐻.
If we now assume that the formal sector fraction of workers was already paying taxes
before joining the project, the SWR is
𝑺𝑾𝑹 = (𝑾 − (𝟏 − 𝝓)𝑫) − (𝟏 − 𝝓)𝑬
The reason for adding 𝜙𝐷 to the SWR is that those are taxes that are not being paid any
more in the source jobs because of the displaced employment towards the project.
Moreover, later in this section we will extend the formula to a case where labour is hired
not only from its location market but also from other source labour markets, thus
considering the potential impact of internal migration, an issue that would be also relevant
for the case of Kenya.
Following the main principles of the efficiency approach described before, and taking the
peculiarities of the Kenyan labour market into account, in particular the high informality
rate, the SWR for skill or occupation group j in location s is
𝑺𝑾𝑹𝒋𝒔 = 𝑾𝒋
𝒔 − 𝑫𝒋𝒔(𝟏 − 𝝓𝒋
𝒔) − (𝟏 − 𝝓𝒋𝒔)𝑬𝒋
𝒔
where
𝑊𝑗𝑠 is the gross formal wage for occupation j;
𝐷𝑗𝑠 are the labor market distortions for occupation j;
𝜙𝑗𝑠 is the proportion of workers in the occupation j in the formal sector; and therefore,
(1 − 𝜙𝑗𝑠) is the proportion of informal sector workers in occupation j;

195
𝐸𝑗𝑠 is the externality caused from transiting from the informal to the formal sector.
In the proposed specification the distortion terms consider the impact of taxes and
unemployment.
The proposed formula assumes that all the workers hired in a project come from the
project location. If instead we consider the internal migration effects of a project, that is,
that workers attracted to the project can come for different locations, the SWR for
occupation j in location k becomes
𝑺𝑾𝑹𝒋𝒌 = 𝑾𝒋
𝒌 − (𝑫𝒋𝒌 − ∑ 𝒂𝒋
𝒔𝒌𝒏𝒔=𝟏 ∗ 𝝓𝒋
𝒔 ∗ 𝑫𝒋𝒔) − ∑ 𝒂𝒋
𝒔𝒌𝒏𝒔=𝟏 ∗ (𝟏 − 𝝓𝒋
𝒔) ∗ 𝑬𝒋𝒔 ,
where
𝑊𝑗𝑘 is the gross formal wage for occupation j in location k;
𝑎𝑗𝑠𝑘 represents the fraction of the labor force in location k that coming from s and other
locations. That is, there are n locations from which workers could be attracted to the
project including s.
𝐷𝑗𝑘 are the labor market distortions for occupation j in location k, and 𝐷𝑗
𝑠 are the distortions
corresponding to the different employment sources for the project 𝑎𝑗𝑠𝑘;
𝜙𝑗𝑠 is the proportion of workers in the occupation j in the formal sector located in s; and
therefore, (1 − 𝜙𝑗𝑠) is the proportion of informal sector workers in occupation j and
location s;
𝐸𝑗𝑠 is the externality caused from transiting from the informal to the formal sector.
Following the proposed method, the aggregate SWR for Kenya will be
𝑺𝑾𝑹𝑲𝒆𝒏𝒚𝒂 = ∑ ∑ 𝒈𝒋𝒌𝑺𝑾𝑹𝒋
𝒌𝒎𝒌=𝟏
𝒏𝒋=𝟏 ,
where 𝑔𝑗𝑘 is the employment share of each skill group j and location k.

196
The model can be extended or simplified in different ways, in order to account for the
effect of unemployment, internal and external migration, and other features of the labour
market. For instance, in countries with no unemployment benefits, the income from
unemployment would be equal to zero, and therefore the SWR should be adjusted
downwards by the fraction of the labour force who are employed (1 − 𝑢), where 𝑢 is the
unemployment rate.
ESTIMATIONS OF THE SWR FOR KENYA
The empirical literature on estimations of the SWRCF is very limited and out of date. Stern
(1972) estimates the Little/Mirless shadow wage for a tea development project in Kenya.
The shadow wage is assumed to be equal to c–(c-m)/s where c is the market wage, which
is assumed to be totally consumed, m is the marginal product of labour and s is the value
of savings in terms of forgone consumption, which depends on a social utility function. He
estimates a SWR for urban workers at 63% of the market wage.
Debebe (1977) estimates a national SWR for unskilled labour in Kenya following the
Little/Mirrlees method and obtains SWR factors of 0.23, 0.4 and 0.99 which are
decreasing on the social price of investment.
On the other hand, Japan International Cooperation Agency (1991) on an evaluation of a
hydropower project in Kenya used a SWRCF for unskilled labour of 0.6. For skilled labour
in scarce supply the study uses a factor of 1, and for workers with secondary education
between 20 and 50 years of age, who can be considered semi-skilled, the estimated
SWRCF is 0.8. No details are provided on the estimation methodology.
More recently, using micro data from a rural survey in Kenya, Kamau, Burger and Giller
(2007) estimate shadow wages using, as an indirect approach, an optimal labour supply
model; among other results they find a SWRF of 0.46 for farms hiring out labour.
In a cost-benefit analysis of the adoption of soil and water conservation methods in Kenya,
Atampugre (2014) uses a SWRF of 1 for skilled and semi-skilled labour, and 0.8 for
unskilled farm labour. The author argues that “farmers and their families work often at
opportunity costs below market wages” but no details on the estimation method are
provided.
Summarizing, unfortunately and to the best of our knowledge, there is not any appropriate
recent estimation of the social opportunity cost of labour in Kenya available.

197
A PROPOSED SWRCF´S ESTIMATION FOR KENYA
Given the relevance of the SWR for the social evaluation of projects, international
organizations such as the European Commission (2014) recommend their member states
to develop their own national estimates of the shadow wage conversion factors with
analytical rigor. As a second-best approach, in the absence of such valuable inputs and
information for applying the previous models, a simplified approach to estimate the SWR
for the whole economy or by skill is the following:
𝑺𝑾𝑹 = 𝑾(𝟏 − 𝒕)(𝟏 − 𝒖)
Where W is the market wage, t is the income tax rate and u denotes the unemployment
rate. The unemployment rate adjustment in this case implicitly assumes that the
opportunity cost of employing a previously unemployed worker is zero.
Considering that in the third quarter of 2020, the national labour under utilization rate,
which comprises unemployment and underemployment, was 8.5%26 and also that the
income tax rate for the first 288,000 Kenyan Shillings (KES) is 10%27 the estimated back
of the envelope SWRCF proposed for Kenya is:
𝑺𝑾𝑹𝑪𝑭𝑲𝒆𝒏𝒚𝒂 (𝒑𝒓𝒐𝒑𝒐𝒔𝒆𝒅) = (𝟏 − 𝟎. 𝟏)(𝟏 − 𝟎. 𝟎𝟖𝟓) = 𝟎. 𝟖𝟐𝟑𝟓.
The official statistics show that by 2019 a total of 18,1 million people was employed in
Kenya. The informal sector represents a significant part of economic activity; in terms of
employment, 15.1 million workers were employed in the informal sector by 2019, and 65%
26 See https://www.knbs.or.ke/?wpdmpro=quarterly-labour-force-report-quarter-3. Considering instead the
national unemployment rate of 7.2% in the same period only, the SWR for Kenya would be 0.8352.
27 For a reference, see https://taxsummaries.pwc.com/kenya/individual/taxes-on-personal-income. It is not
considered the tax relief introduced by the government effective April 2020 for persons earning a gross
monthly income of up to KES 24,000 per month, which continues to apply.

198
of them were in the rural sector28. As a result, the informality rate stood at 83.4% of total
employment.
Earnings inequality seems also high in Kenya. The average monthly wage in the formal
sector was Kenyan Shillings (KES) 64,854 by 2019, with almost no differences between
the public and the private sector. The average minimum wage for agricultural workers was
KES 9,014 in 2019. In the urban areas of Nairobi, Mombasa and Kisumu the minimum
wage was KES 21,311.
Finally, since the limited scope of the present analysis, based on international best
practices and experiences, it is proposed to use a SWRCF of 0.8235 for Non-skilled and
Semi-skilled labour categories and a SRWCF of 1.0 for Skilled labour category. Of course,
given the high informality rate and earning differentials it is quite likely that appropriate
SWRCF for Kenya should be smaller than the one presented here, which is only presented
for exposition purposes and should be considered with caution.
The Shadow Exchange Rate
The procedure leading to the economic opportunity cost of foreign exchange captures
those cost distortions triggered each time money is sourced in the capital market and spent
on tradable commodities.
To conduct this analysis, a detailed study is required on the derivation of the market
exchange rate. Once all the distortions are identified in the foreign exchange market, it can
be calculated the opportunity cost of foreign exchange in a partial or full equilibrium
model. With the complete model in hand, it is a simple task to update the model with new
economic conditions and calculate an updated economic opportunity cost of capital.
KEY CONCEPTS
In any kind of project there are both nontraded inputs and outputs, which are valued at
local prices, and traded inputs and outputs, valued at international prices in a foreign
currency. In order to compare costs and benefits of both kinds of goods and services, an
exchange rate is used to express all prices in the domestic or foreign currency of choice.
28 The official employment data can be accessed at https://www.knbs.or.ke/?wpdmpro=economic-survey-
2020.

199
Nevertheless, even when the exchange rate is defined by the market in a floating exchange
system, transaction costs and distortions, such as trade protection, usually make
international prices higher than domestic ones.
To take this under consideration in the economic analysis of a project, the Shadow
Exchange Rate (SER)29 is used to transform international prices to domestic currency,
and vice versa, as it functions as the economic price of foreign currency. When the SER is
used to convert output and input values measured at world prices to domestic currency, it
expresses the value of all goods and services of the project in a common base of
measurement.
The SER should measure the welfare change created by the availability or by the use of an
additional unit of foreign currency. The Shadow Exchange Rate Conversion Factor
(SERCF), is the ratio between the SER to the market or official exchange rate.
According to the Asian Development Bank (2017), the SER can be defined as the ratio of
the value of all traded goods and services in an economy at domestic prices in local
currency to the value of all traded goods and services in an economy at world prices in
foreign currency, expressed in the number of local currency units per unit of foreign
currency. Thus, the SER formula is
𝑺𝑬𝑹 = 𝑶𝑬𝑹[𝜮 𝒘𝒎(𝟏 + 𝒕𝒎 − 𝒔𝒎) + 𝜮 𝒘𝒙(𝟏 − 𝒕𝒙 + 𝒔𝒙)]
Where 𝑂𝐸𝑅 refers to the Official Exchange Rate, expressed as units of local currency per
unit of foreign currency; 𝑡𝑚 and 𝑡𝑥 are the tax rates on imports (𝑚) and exports (𝑥),
respectively; 𝑠𝑚 and 𝑠𝑥 are the subsidies on international commerce; and 𝑤𝑚 and 𝑤𝑥 are
the weights of the different imported and exported goods and services. Based on the SER
specification, it follows that the SER premium has two components, one related to the
deviation of the long-run exchange rate from its current value and the other related to the
distortions cause by trade policy. For a proper consideration of the SER over the duration
of the project, both components should be considered (Asian Development Bank, 2013).
29 Also known as the Economic Price of Foreign Exchange.

200
Since import taxes and exports subsidies raise domestic prices above world levels, they
increase the SER over the OER. Opposed to this effect, import subsidies and exports taxes
decrease local prices, therefore, they reduce the SER below the given OER.
Taxes and subsidies are not the only distortions on international commerce, since quotas
and other restrictions can exist in the region of analysis as a form of trade protection. To
consider their effect, this method requires the tariff equivalent price effect of the
restrictions that are in place. However, this kind of restrictions are rare, so this component
is usually ignored on the assumption that it is not significant (Asian Development Bank,
2017).
Technically, the size of the project can be large enough as to have an impact on the market
exchange rate, in which case the effects on quantities traded depend on the elasticities of
imports demand and exports supply to the exchange rate. Nevertheless, since most
projects are not large enough as to affect the exchange rate and trade elasticities are often
unavailable, a common simplifying assumption is that all elasticities are equal to 1, so that
existing average shares in foreign trade equal marginal shares in new trade created by a
project (Asian Development Bank, 2017). When this is the case, the weights of the shadow
exchange rate formula can be expressed as the ratios of the total imports and exports in
terms of the total trade:
𝒘𝒎 =𝑴
(𝑴 + 𝑿)
𝒘𝒙 =𝑿
(𝑴 + 𝑿)
Where 𝑀 refers to the total value of imports and 𝑋 to the total exports.
Replacing the weights in the shadow exchange rate formula and expressing it in terms of
the official exchange rate under this simplification leads to the formula of the SERCF:
𝑺𝑬𝑹𝑪𝑭 =((𝑴 + 𝑻𝒎 − 𝑺𝒎) + (𝑿 − 𝑻𝒙 + 𝑺𝒙))
(𝑴 + 𝑿)

201
Where 𝑀 and 𝑋 are the total value of imports and exports expressed in domestic currency
converted at the official exchange rate; 𝑇𝑚 and 𝑆𝑚 are the levied taxes and subsidies on
imports; and 𝑇𝑥 and 𝑆𝑥 are the total taxes and subsidies on exports.
By adjusting the official exchange rate on the overall level of trade protection of the region
of analysis; the SERCF is usually greater than 1 when there are restrictions on
international trade.
Since the exchange rate plays a key role when estimating the costs and benefits of a project,
when the real exchange rate deviates from the equilibrium exchange rate, it should be
considered at the estimation of input and output values.
Following Asian Development Bank (2017), if the OER is overvalued (so the price of a unit
of local currency relative to foreign currency is above its long-run equilibrium level), then
projects producing non-tradable are favoured relative to projects producing tradable. On
the other hand, if the OER is undervalued (so the price of local currency is too low),
projects producing tradable are favoured relative to projects producing non-tradable.
When there is available an estimation of the equilibrium exchange rate, a correction factor
𝑝 is added to the SER and SERCF formulas:
𝒑 =𝑬𝑬𝑹
𝑶𝑬𝑹
Where 𝐸𝐸𝑅 represents the equilibrium exchange rate and 𝑂𝐸𝑅 is the prevailing official
exchange rate, as it was appointed previously.
Despite what it was mentioned above, estimating the equilibrium exchange rate can be
difficult. The equilibrium exchange rate can be defined as the exchange rate that achieves
external balance, which refers to a sustainable level for the current account balance, or as
the rate that achieves both internal as well as external balance (Asian Development Bank,
2017). Thus, in practice, and especially in countries with floating exchange rate systems,
unless there is an important external imbalance, it is often assumed that the exchange rate
is not misaligned with the underlying economic fundamentals.

202
Even though the SER may not necessarily be equal to the official exchange rate, in
countries with low barriers to trade and floating exchange rate systems, the SERCF is set
equal to, or close to, 1.
ESTIMATIONS OF THE SER FOR KENYA
As in the case of the other national parameters, the literature estimating the SER for Kenya
is very limited. Japan International Cooperation Agency (1991) estimated the SER using
the formula presented above, assuming the OER is the EER and obtaining a SERCF of 1.1.
Kuo, Salci and Jenkins (2015) develop a three-sector model, with exportable, importable
and non-tradable goods, to estimate the SER. Their framework is suitable to capture the
impact of sourcing funds, either domestically or in external financial markets, and their
expenditure on tradable and non-tradable goods and services of investment projects. They
found a SERCF of 1.0821 for Kenya, using data for the period 2007-2011. Finally, a cost-
benefit analysis for a land project in Kenya (Food and Agriculture Organization, 2020)
considers a 12% average protection rate for maize at the farm gate.
CURRENT ESTIMATION FOR KENYA
As it is stated at the National Parameters and Commodity Specific Conversion Factors
website, the Foreign Exchange Premium (FEP) is estimated in 5% (national parameters
can be accessed through the link below: http://kenya.cri-world.com/).
A Standard/Generic Conversion Factor
As it is mentioned in HM Treasury-Greenbook (2020), "the adjustment of market prices
for taxes in appraisal is appropriate where it may make a material difference to the
decision…. where the tax regimes applying to different options vary substantially, this
should not be allowed to distort option choice. In such cases, it is important to adjust for
any differences between options…". The Standard/Generic Conversion Factor (SCF) is
used to correct generic inputs financial prices to estimate the project economic CAPEX
and OPEX. Ideally, it is needed a complete break-down for both variables and the specific
conversion factor for each input. However, to simplify the estimation, the correction can
be done by just breaking-down the CAPEX and OPEX into two general categories: labour
and inputs. The labour must be corrected using the SWR, shown below; the information
must be corrected using the SCF.

203
KEY CONCEPTS
According to Jenkins, Kuo and Harberger (2018) non-tradable items are those which are
not traded internationally, generally including services for which both the consumer and
the producer are in the same location. Non-tradable include electricity, water supply,
public services, hotel accommodation, real estate, construction and local transportation.
As for other types of inputs and outputs, conversion factors for nontraded inputs and
outputs are used to transform their market prices into economic values in Cost-Benefit
Analysis. Since non-tradable items are valued at local prices and tradable ones are valued
at international prices in a foreign currency, adjusting prices through the exchange rate is
needed to compare costs and benefits of both kinds of goods and services in the domestic
or foreign currency of choice.
As it was mentioned before, traded inputs and outputs could be expressed in domestic
currency units using the SER. This allows to express all the project components in the local
currency, a method known as the domestic price numeraire (Asian Development Bank,
2017). When this approach is followed, since nontraded goods and services are already
valued at domestic prices, it is implicitly assumed a conversion factor for non-tradable
equal to 1, therefore making their financial and economic price equivalent (Asian
Development Bank, 2013).
An inverse approach to the domestic price numeraire is measuring all the costs and
benefits of the project at world prices. In that case, traded goods and services are valued
at international prices, and therefore their implicit conversion factor is equal to 1.
However, this procedure, known as the world price numeraire, requires to estimate a
conversion factor to measure the value of nontraded inputs and outputs at international
prices.
Estimating the shadow price of the nontraded inputs and outputs of a project requires
considering the differences between domestic and international prices, thus taking
distortions like trade protection into account for the calculation. Following the European
Commission (2014), the Standard Conversion Factor (SCF) of the nontraded goods and
services of a project can be approximated by the following formula:
𝑺𝑪𝑭 =(𝑴 + 𝑿)
((𝑴 + 𝑻𝒎 − 𝑺𝒎) + (𝑿 − 𝑻𝒙 + 𝑺𝒙))

204
Where 𝑀 and 𝑋 are the total value of imports and exports expressed in domestic currency
converted at the official exchange rate; 𝑇𝑚 and 𝑆𝑚 are the levied taxes and subsidies on
imports; and 𝑇𝑥 and 𝑆𝑥 are the total taxes and subsidies on exports.
As it can be noted, the formula of the SCF is equivalent to the inverse of the SERCF, defined
on the previous section.
𝑺𝑪𝑭 =𝟏
𝑺𝑬𝑹𝑪𝑭
A more refined approach for the SCF estimation is the Shadow Price for Non-Tradable
(SPNT) method, that takes into consideration goods and services from a general
equilibrium framework, where the sources of the funds of the project (either from the
domestic market or from abroad) and their destination (both on traded and nontraded
items) play a key role to estimate the Shadow Price for Non-Tradable Outlays (SPNTO), a
more comprehensive and complex proxy for the SCF.
Following Kuo, Salci and Jenkins (2015) and Jenkins, Kuo and Harberger (2018), when
the sourcing of funds to acquire inputs for the project is done through the domestic
market, it reduces domestic consumption and investment and drives to an excess supply
of goods and services in the economy, when sourcing abroad would not have this effect.
Secondly, if the funds are spent on nontraded items, the economic welfare effects caused
by the market distortions interacting with the movements in demands and supplies of the
traded and nontraded sectors should be considered.
The SPNTO estimation then requires information of the proportions of the funds sourced
domestically and abroad, the economic welfare impacts of spending the funds on traded
and nontraded goods and services, and quantifying the market distortions on the regions
of interest through the existing tax structure to assess the impact of the movement on the
demand and supply of both traded and nontraded items.
ESTIMATIONS OF THE SCF FOR KENYA
Like the SWR and the SER, there are only a few studies analysing the shadow price of
nontraded goods and services for Kenya.
The Japan International Cooperation Agency (1991) led one of the first estimations of the
SCF for Kenya, where they estimated the SCF at 0.92 of the financial cost of nontraded

205
goods. Onduru and Muchena (2011) performed a more recent calculation, where they use
a 2.47 conversion factor, without specifications about how they arrived to this value.
Finally, in a Cost-Benefit Analysis of a land project for Kenya, Food and Agriculture
Organization (2020) adjusted the prices of the project by removing the VAT, rated at 16%,
and considering a 12% average protection rate for maize at the farm gate, but without
specifying the final value used as the standard conversion factor.
Even though the literature on the estimation of correction factors for non-tradable
restricts to a few papers, Kuo, Salci and Jenkins (2015) are an excellent reference for an
appropriate estimation of the SPNT for Kenya, using a general equilibrium model. Based
on data for the 2007-2011 period, the authors arrive at an estimated SPNT factor of
1.0084.
A PROPOSED SCF´S ESTIMATION FOR KENYA
Given there the existing estimations of the standard conversion factor are either outdated
or vague, a current SCF estimation is proposed using the most recent data available, using
the traditional approach (European Commission, 2014).
As it was stated before, under this approach the SCF is equivalent to the inverse of the
SERCF actor. Using as an input the shadow exchange rate factor calculated for 2019 in the
previous section, the standard conversion factor for Kenya is estimated at 0.955, as it is
showed below:
𝑺𝑪𝑭𝑲𝒆𝒏𝒚𝒂 (𝒑𝒓𝒐𝒑𝒐𝒔𝒆𝒅) = 𝟏
𝑺𝑬𝑹𝑪𝑭 =
𝟏
𝟏. 𝟎𝟒𝟕 = 𝟎. 𝟗𝟓𝟓
Despite the proposed SCF, it would be desirable to update the SPNTO following a
methodology similar to Kuo, Salci and Jenkins (2015). This would require using up-to-
date data on funds sourcing for investment projects in Kenya, key information on the
market distortions derived from the tax structure and other inputs like the imports and
exports elasticities.

206
NTP CURRENT ESTIMATION FOR KENYA
As it is stated at the National Parameters and Commodity Specific Conversion Factors
website, the Premium on Non-tradable Outlays (NTP) is estimated in 1% (national
parameters can be accessed through the link below: http://kenya.cri-world.com/).
8.10 THE RISK ANALYSIS
Generally, when evaluating investment projects, it is assumed that the variables used have
a deterministic character. However, there are variables whose value cannot be accurately
predicted, but there is some uncertainty in their estimation. Systematic errors may also
have been introduced as a result of planners’ natural responses to the incentive
environment that they are facing.
The benefits and costs of the projects are not immediate but are distributed over time. This
causes each variable related to the calculation of profitability of a project should be
estimated by models, which leads to uncertainty in its estimation. Add to that the fact that
they must incur higher costs to obtain information to make reliable estimates adds.
A traditional cash flow analysis assumes single (deterministic) values for all of the
variables. The outcome of that analysis is a point-estimate of a project’s indicators, as NPV
or its Internal Rate of Return (IRR), and a decision whether to accept a project is made on
that basis. More realistically, however, we know that values for most project variables are
subject to change and are difficult to predict. While the past values of a particular variable
are known with certainty, predicting future values is a different matter. It is more likely to
forecast the correct range of future values for a variable rather than its exact value. Given
that there are probabilities attached to the possible values of a variable in a given range,
there is a good chance that the value that occurs will be other than the one we have chosen.
The uncertainty may come from different sources. The first source of uncertainty is the
fact that there are contingencies whose occurrence will affect the project, both internally
and externally. The second source of uncertainty is in the process of evaluating the project
itself (the uncertainty arises either because the available information about variables, such
as prices, demand elasticity and other factors, or the methodologies to estimate them, is
not able to reflect perfectly the preferences of people). Another source of uncertainty arises
from the existence of human factors in the project design or economic project modelling.

207
Each of these sources of uncertainty has a different impact on the possible final values of
the evaluation criteria. Risks for administrative public buildings projects can be
categorised as follows:
• Construction risk: buildings are not completed on time, to budget or to specification
• Demand risk: demand for services does not meet forecasts.
• Design risk: design cannot deliver services at the required performance or quality
standards.
• Economic risk: project costs or benefits affected by economic influences, e.g., inflation
or exchange rate movements.
• Funding risk: availability of funding delays project or changes scope.
• Legal and regulatory risk: difficulties to solve in time and budget legal requirements
related to land-use.
• Operation & maintenance risk: costs of operating and maintaining new facility differ
from planned budget.
• Procurement risk: shortfall in capacities of contractors or contractual disputes.
• Technological risk: Services provided using non-optimal technology because of rapid
technological change.
Risk analysis is important for a number of reasons. Among others, reduce the likelihood
of undertaking a “bad” project while not failing to accept a “good” project. It would be easy
to avoid “bad” projects simply by making very conservative assumptions about the values
of the key variables and then accepting only those projects that still have a positive NPV.
In second place, one of the ways to reduce uncertainty is to gather more data and
information, to the extent feasible, about the key project variables in order to narrow their
likely range and to determine more precisely the appropriate probability distribution.
To face the problem of the uncertainty inherent in the relevant variables in the calculation
of the profitability of a project, the sponsoring agency can use three main methods:
Sensitivity Analysis, Scenario Analysis and Monte Carlo Analysis.
Sensitivity Analysis
The Sensitivity Analysis test how sensitive a project’s outcomes are to changes in one
parameter at a time. Sensitivity analysis is often referred to as “what if” analysis, such as,

208
“What would happen to evaluation criteria if some variable changes by a certain amount
or percentage?”. Sensitivity analysis is conducted as follows:
• Step 1: Based on expectations of future values, or the deterministic analysis, estimate
the resource flows and evaluation criteria of a project. This is called the base-case
analysis.
• Step 2: Sensitivity analysis can be conducted on either the values of the variables or
on the assumptions that underpin the values that were estimated. The variables could
be specific to the project or broader macroeconomic variables.
• Step 3: While holding other values constant, let the base-case value of each of the
variables change by (for example) 10 per cent, and calculate the percentage change in
the evaluation criteria. The resulting number measures the degree of sensitivity of the
evaluation criteria to changes in each variable, while holding other variables constant.
• Step 4: The results can be recorded in a table or graph where it is relatively easy to
spot the key risk variables.
The variables that are an important source of risk are generally those that satisfy two
criteria:
i. They represent a large share of cash receipts (benefits) or cash disbursements
(costs).
ii. The range of their possible values is quite wide.
However, sensitivity analysis has a number of limitations:
• Although Step 3 above took some account of the likely range of values for a variable,
there are no probabilities attached to the values in a range. As a result, sensitivity
analysis does not recognize that some values are more likely to occur than others.
• Sensitivity analysis alters the variables one at a time without taking into account any
relationship (correlation) between variables. This shortcoming can be rectified by
conducting the scenario analysis on revenues rather than selling prices, or by directly
taking any correlation with units sold into account, or by using Monte Carlo analysis,
properly adjusted to make allowances for the correlation.
• Third, how the results of a sensitivity analysis are viewed depends on the risk
preferences of investors or analysts. For these reasons, it is difficult to derive a general
decision rule about whether to accept or reject a project based on sensitivity analysis.

209
The quantitative economic analysis will initially have been performed using the best
estimates of costs and benefits and the underlying parameters (demand forecasts, for
example). This is usually known as the base case.
Scenario Analysis
In practice, values for input parameters for economic analysis may be interdependent or
subject to systemic estimation biases. For this reason, it is sensible to conduct scenario
analyses whereby the quantified economic analysis is subjected to simultaneous changes
in key input parameters to test the sensitivity of the results.
The scenario analysis deals with a major limitation of the sensitivity analysis, that is, the
variation of the variables individually. This tool recognizes that one-at-a-time testing of
variables is not realistic on account of the interrelation between variables, so it provides
consistent scenarios in variations of a group of variables together. Scenario analysis then
solves this interrelation by allowing a number of variables to be altered in a consistent
manner at the same time.
The main limitation of this method is that it does not allow the representation of the
probability of occurrence of each of the proposed scenarios, so that while it delivers as
much information as the sensitivity analysis (considering the correlation between
different variables) it is not enough, since the number of variables and values for each
variable that can be tested is limited. Given this limitation of the scenario analysis, this
proposed user guideline will explicitly model the sensitivity analysis and the Monte Carlo
simulation.
Monte Carlo simulation analysis
The Monte Carlo Simulation recognizes the impossibility of predicting the behaviour of
relevant variables of the project, especially in the medium and long term. The Monte Carlo
method is a natural extension of sensitivity and scenario analysis, estimating probability
distributions for those relevant variables and considering the correlation between them.
Subsequently, a series of simulations are performed in which, in each one, these variables
take a value following the chosen distribution. When there are a significant number of
simulations, an evaluation criteria probability distribution is estimated. Monte Carlo
simulation analysis is conducted as follows:

210
• Step 1: define the probability distribution for the critical variables identified carrying
out the sensitivity analysis. The probability distribution election for each variable is
not a trivial matter. In many cases a simplification can be used, especially when
insufficient information is available to estimate a complex probability function.
Uniform or triangular distributions are recommended to perform simplified Monte
Carlo Simulations; other distributions, as normal or binomial, require more
parameters and information for its specification.
• Step 2: once the random variables have been defined and a distribution for each one
has been estimated, the simulation program (running in MS Excel) estimate the
evaluation criteria of the project. Doing this by a large number of times, a distribution
probability for the evaluation criteria will be obtained.
Three cases can be identified as a result of the simulations; if the evaluation criteria are
acceptable (for example, the NPV is greater than 0) and the probability is 1, the project
must be chosen; if the evaluation criteria is no acceptable (for example, the NPV is lower
than 0) and the probability is 1, the project must be rejected; when intermediate cases are
faced, the criterion is not unique and the decision must be carefully taken by the project
sponsor.
Risk analysis provides additional information that facilitates the decision-making process.
In addition, it allows identifying the areas or variables most relevant to the final outcome
of the project, indicating where the research should be deepened and the information
gathered.
The previous methods are presented in an orderly manner according to their complexity.
The choice of method to use will depend on the size of the project in question and the
uncertainty in its variables, recommending Monte Carlo method for large projects.
Finally, a risk management plan sets out the most important risks and their likelihood,
assigns responsibility for managing them, describes how they will be monitored and sets
out the planned responses should the risks materialise.
211
8.11 ASSESSSING AFFORDABILITY AND SUSTAINABILITY30
The project appraisal provides a recommendation on the project worth and wealth
creation, but also regarding the implementing and operating capacities. Since this, is
needed to assess and examine the adequacy of resources and capacities for future
operation and maintenance. In this regard, the appraisal must identify sustainability
issues to ensure that appropriate strengthening measures are taken later on project
implementation. Because of that, the feasibility study should be seen as an input into the
appraisal process, resulting in a decision on the social worth and sustainability of a project
(Kim et al 2020).
Project promoters should verify that projects are financially sustainable and affordable,
both during implementation and during operation. In addition, managerial sustainability
of the project it is needed to be assessed, together with social and environmental
sustainability. This analysis should be taken as applying to the reference project and to
project alternatives; however, analysts are therefore required to use discretion and to
apply the assessment of affordability and sustainability flexibly so as to highlight
difference between alternatives, rather than to confirm similarities. Finally, by analysing
the project’s financial performance is feasible to identify whether the project will make
a positive contribution to the financial objectives of the operating entity and whether it is
sustainable over the longer term.
Carry out project financial analysis to determine financial
sustainability and profitability
Financial analysis is applicable to revenue-earning projects—for example, capital
expenditures in energy, water utilities or public transport. Meaningful financial analysis
may not be feasible for nonrevenue-earning projects—for example, in health, education, or
justice—but financial issues, such as adequacy of recurrent financing and financial
management capacities, should be investigated for nonrevenue projects. These projects
are generally the focus of a separate budgetary analysis (Kim et al, 2020).
30 Based on Republic of Cyprus (2016).

212
Financial sustainability means that a project’s revenues cover its costs and that it will not
run out of cash. Financial sustainability is not the same as financial profitability, which is
a more demanding standard. A financial analysis should be performed to estimate
profitability and financial sustainability. Project promoters should verify that projects are
financially affordable and sustainable, both during implementation and during operation
(Kim et al, 2020).
Financial analysis of a public capital investment project is carried out for several reasons:
• To verify that a revenue earning project is financially sustainable and will have
sufficient funds to meet its commitments at each stage of its life.
• In the case where a project is not financially sustainable, to identify any changes to
tariff regimes or provision of budget subsidies that may be necessary.
• For commercially-oriented public operating entities, to ascertain whether an
investment is profitable and thus contributes to improving overall profitability (or
reducing losses in the case of entities subsidised from the national budget).
• In the case where a project is potentially profitable, to point towards possible
financing modalities, including PPP.
Financial analysis is applicable to revenue earning projects; for example, investment by
public sector energy and water utilities or by public transport operators. Also, some
important financial issues should be investigated for non-revenue projects, such as
adequacy of recurrent financing during operation and financial management capacities,
as well as affordability of capital costs. These are generally the focus of separate budgetary
analysis.
Financial analysis looking at the financial performance of the project on its own
determines whether the project will contribute to the financial objectives of the operating
entity, and whether it is sustainable in its own right over the longer term. Estimating the
financial profitability of an individual project involves looking at the net cash flows and
using discounted cash flow analysis.
If the project’s Financial IRR exceeds the operating entity’s Weighted Average Cost of
Capital (WACC), the project is considered to be financially viable. The weighted average
cost of capital represents the cost (in real terms) to the entity of raising capital for the
investment and, since this may come from several sources with different costs (for

213
example a blend of loans from different international financial institutions). If the entity
receives all its investment capital via the State budget, then the cost of capital is equivalent
to the central government’s cost of borrowing (expressed in real terms). Where the
Financial IRR falls below the WACC (and the project has been shown to be economically
viable) some form of government subsidy is indicated. This may come in the form of State
budget funding of a portion of investment costs or equity participation of the State in a
commercial entity. Raising user charges may also be considered.
Carry out operating entity financial analysis to assess their financial
sustainability
Financial analysis of the operating entity looks at its financial strength as a whole and at
its capacity to meet negative cash flow requirements of the project, if any, and, by
inference, the extent and timing of any requirements for subsidies from the State budget.
Usually, a capital investment project will be carried out by an existing entity, which will be
performing other on-going operations. In these cases, the financial analysis of the entity
as a whole will be relevant to assessing financial sustainability: a profitable project
undertaken by a financially weak or failing entity is unlikely to be sustainable. Sometimes
a project is carried out in isolation and a new entity created to operate it: in these cases,
the two dimensions of financial analysis effectively merge into one (Kim et al, 2020).
Financial statements are usually produced in current prices rather than constant prices.
Assumptions about inflation should be clearly stated so the statements can be reconciled
against the discounted cash flow analysis of the project, which is in constant prices. The
statements should also be forward-looking, capturing forecasts of the future financial
position of the operating entity including forecast impact of the proposed project on
revenues and costs should be produced. For further explanation, please refer to UK HM
Treasury (2020).
Carry Out Budgetary Analysis as an Input to Assessing Affordability
Budgetary analysis must be performed for all projects to determine the net impact on the
national budget during implementation and operation, and to assist in establishing
whether an investment is affordable from the fiscal perspective. It enables affordability to
be assessed in relation to projections of expenditure ceilings and available fiscal space
during budget preparation Republic of Cyprus (2016).

214
The minimum requirements for demonstrating the budgetary impact are shown in Table
15, which identifies total budgetary costs, projected revenues (if any) and the net impact.
Costs for budgetary impact analysis must be in current prices, i.e., adjusted for inflation.
Economic Entities promoting projects must consult with the MOF to obtain forward
estimates of inflation. If annual operating and maintenance costs are expected to be very
similar the post-implementation analysis period can be truncated and estimated annual
averages presented post-Year n. For projects expected to be financed from diverse outside
of national budgetary funding, Table 15 should be completed to supplement Table 14.
Table 14 - Summary of budgetary analysis
Year 1 Year 2 Year 2 Year… Year n
Budgetary Costs
Capital Costs
Net Recurrent Costs
Operation
Maintenance
TOTAL COSTS
Project Budgetary Revenues (if any)
NET BUDGETARY IMPACT
Source: Republic of Cyprus (2016).
Table 15 - Expected sources of funding for project implementation
Year 1 Year 2 Year 2 Year… Year n
Donor 1 financing
Donor 1 financing
Donor 1 financing
Budgetary funding
National private capital
Other Loans
TOTAL SOURCES EXPECTED FUNDING FROM ALL SOURCES OF FINANCE
Source: based on Republic of Cyprus (2016).
A full budgetary analysis can be employed to estimate the total budgetary impact in
present value terms, to establish whether it is overall positive. This is wider in its
perspective than the financial analysis (but not as wide as economic analysis) because it

215
takes account of all direct and indirect financial flows that impact on the public finances
and not just those that affect the projects operating entity. A full budgetary impact analysis
should only be prepared for major projects with significant direct revenue earning
potential or substantial tax effects.
Table 17 is an example of the kind of information that should be included in the full
budgetary analysis of a major project. The analysis period should normally extend to the
useful life of the project. On the basis of the analysis of the information and analysis in
Table 17 it can be established whether or not the project has a positive or negative net
impact on the public sector finances in present value terms. The net fiscal impacts in each
year are expressed in present value terms using a discount factor and are summed to arrive
at the net present value of the project for the budget. It should be noted that Table 16
includes estimates of the taxes that will be generated by the project. These can be direct or
indirect tax effects, but it can be difficult to estimate the latter, so a cautious approach is
recommended and only incremental tax revenues that would not have occurred without
the project should be considered.

216
Table 16 - Format for public sector budgetary analysis – Net Cash Flow
Analysis
Year 1 Year 2 Year 2 Year… Year n
Revenues from charges
Residual values
TOTAL INFLOWS
Budget subsidies/grants
Operating costs
Investment costs
Decommissioning costs
TOTAL OUTFOWS
Indirect taxes (e.g. vehicle registration, custom & excise)
Direct taxes (e.g. personal income tax, corporation tax)
TOTAL TAX IMPACT
TOTAL OTHR FLOWS
NET CASH FLOW FOR PUBLIC FINANCE
DISCOUNTED NET CASH FLOW
Source: based on Republic of Cyprus (2016).
Assess institutional/managerial sustainability of the project
Appraisal requires an assessment of the adequacy and sustainability of the proposed
implementation and operational arrangements. Efficient project implementation requires
there to be a capable organisation, with adequate internal arrangements, that is
responsible for:
• Managing the different phases of the proposed project, identifying issues that need to
be resolved and ensuring their resolution;
• Ensuring that the required approvals and direction are obtained at each stage;
• Ensuring a proper flow of information between stakeholders; and
• Making sure necessary policies and procedures are followed.
The project appraisal should include an assessment of the adequacy and sustainability of
proposed implementation and operational arrangements for the proposed project. This

217
should include an assessment of the capacities of the organisation(s) responsible for
implementing and operating the project, indicating any strengthening measures which
will be required before construction or operation commence. The project appraisal
therefore needs to include the following elements:
An assessment of the capabilities of the organisation(s) responsible for implementing
and/or operating the project, especially the adequacy of human resources to meet the
estimated needs during implementation and operation, identifying any constraints and
proposing capacity building measures, where required.
• Development of an outline plan and timetable for implementing the project,
indicating key milestones in detailed planning, approval and construction. This
should include the steps from approval of the FS to commencement of construction,
i.e., detailed design, preparation of tender documents, procurement arrangements,
environmental and spatial planning approvals, and land acquisition.
• Planning for the project management arrangements, including the organisational
arrangements and the allocation of responsibilities between the different parties
involved. If any part of project management is to be handled externally to the
organisation promoting the project this should be indicated.
• Assessment of the outline organisational arrangements and of the allocation of
responsibilities for operating and maintaining the project once completed, including
an assessment of the capabilities of the responsible organisation.
Assess environmental and social sustainability of the project
The notion of sustainability extends beyond financial and budgetary sustainability. Project
appraisal should verify that projects are environmentally sustainable and that they do not
have unduly unbalanced impacts on different groups in society that could jeopardize their
social sustainability (Kim et al, 2020). In addition, the determination of the economic
viability of a project should consider intangible benefits and costs that cannot be
monetized. The environmental and social impacts of the project need to be considered.
Different perspectives of project sustainability during implementation and operation also
need to be confirmed.
A two-stage appraisal process is recommended for projects, for which NPV has been
calculated (Kim et al, 2020):

218
i. Stage 1. Analyse the economic viability of the project, according to quantified
economic analysis.
ii. Stage 2. Adjust the recommendation according to the sustainability factors:
financial, fiscal, environmental, and social—and taking into account the importance
of costs and benefits that may not have been captured in monetary terms but have
been analysed qualitatively at other steps.
Infrastructure projects frequently have environmental and social impacts arising from
construction and operation which, if significant enough, could threaten long-run
sustainability. Beyond financial, budgetary and managerial sustainability, decision-
makers therefore need to be provided with adequate evidence on the environmental and
social sustainability of a project and made aware of any significant risks which could
threaten sustainability.
Environmental and social costs and benefits should, to the extent possible, already be
accounted for in monetary terms, economic analysis, and included in the aggregate
measure of economic viability. Where this is not the case, non-monetised costs and
benefits should nevertheless be identified and their relative importance assessed at project
appraisal. Environmental and social impacts, on the other hand, are effects of the project,
usually negative but sometimes positive, that have a significance beyond that which can
be captured in aggregate measures of economic viability. Because of political, social or
legal constraints or long-term environmental concerns, certain effects will put into
question long-run sustainability if they exceed, or risk exceeding, explicitly defined limits
or implicit tolerances, even if a project is shown to be economically viable overall.
Decision-makers must then balance these broader sustainability issues against economic
viability considerations.
Preliminary environmental and social impact assessments will need to be conducted early
in the appraisal stage, prior to completion of the feasibility study, so that findings can be
incorporated in the economic analysis and broader feasibility assessment. Significant
environmental and social benefits and costs should be accounted for in monetary terms in
the economic cost-benefit analysis where feasible. they should at least be identified in
quantitative or qualitative terms and their relative importance compared to monetized
benefits and costs assessed (Kim et al, 2020).

219
THE ENVIRONMENTAL IMPACT ASSESSMENT
The distribution of environmental impacts across society is also important, as is their
scale. There may also be negative environmental impacts that do not necessarily affect
humans but are particularly sensitive and thus represent potential “no-go” areas or
require mitigation measures. These impacts too should be presented separately to decision
makers at appraisal (Kim et al, 2020).
Where valuation in monetary terms is not possible, costs and benefits should at least be
identified in quantitative or qualitative terms and their relative importance compared to
monetized benefits and costs assessed. In this case, ‘quantitative’ means a numerical
indication of the scale of environmental and social benefits and costs, such as quantified
levels of CO2, pollution in terms of PPM, number of households affected by increased
noise and by how much (decibels), etc.
Depending on the scale and nature of the project, and the likely importance of these
effects, a formal environmental impact assessment and/or social impact assessment may
be necessary. Environmental and social impacts should be explored in depth in the FS and
summarised for decision-makers, adjusted as appropriate for sector specificities.
Any licenses and permits required by the project in relation to environmental issues
should be identified, along with the procedures and timetable for obtaining these. This
process must be factored into the project implementation plan. If environmental
monitoring is a requirement on project completion, the arrangements for doing this must
also be described.
The following are the main steps in performing an Environmental Impact Assessment
(EIA) (Kim et al, 2020):
• Determine if a project requires an environmental impact assessment;
• Identify potential impacts and legal requirements, identify alternative solutions, and
prepare terms of reference;
• Assessment and evaluation of impacts and development of alternatives;
• Design of monitoring, compliance, enforcement, and auditing arrangements;
• Report on the environmental impact statement, including a nontechnical summary
for a general audience
• Review of the environmental impact statement, including public consultation

220
• Decisions on issuing authorizations concerning the acceptability of the environmental
impacts.
THE SOCIAL IMPACT ASSESSMENT
A Social Impact Assessment (SIA) is an assessment of a project’s potential social
consequences. A SIA will therefore focus on the impacts on income distribution— both
between income levels and between geographic areas—on poverty, on unemployment, on
gender equality, and on minorities. An SIA looks at impacts on the communities affected
by the project. These impacts could include requirements for resettlement and the
associated impact on quality of life and livelihoods (Kim et al, 2020).
The distributional impacts of the project, which are not the same than distributional
analysis, are also examined to see how direct and indirect costs and benefits arising from
the project will be distributed among different income groups or social categories. Social
impact assessments usually involve affected stakeholders in consultations and in the
design of mitigation measures (Kim et al, 2020).
Bearing in mind the limitations of economic analysis, project appraisal also requires a
wider perspective which examines the implications of unbalanced impacts for the
sustainability of the project. If, for example, a certain group(s) of stakeholders (e.g., a
region or an income group) is negatively affected disproportionately and cannot be
compensated commensurately, this could damage the acceptability of the project from a
social perspective, which would not be picked up in the economic CBA. SIA therefore
involves identifying stakeholder groups that are likely to experience major welfare losses
(or gains) due to the project. Similarly, localized environmental impacts may exceed
statutory limits or acceptable tolerances for specific eco-systems or certain stakeholders,
and EIA involves identifying these cases.
Finally, recommendations should be based on findings with respect to economic viability
and include findings on risk, affordability, sustainability, and non-monetized effects.
When recommendations from the economic analysis (stage 1) and recommendations from
affordability, sustainability, and other intangibles analysis (stage 2) point in the same
direction, the aggregated recommendation can be considered to be reliable. If both
findings are in a different direction, the decision maker must take care on the final
decision; a full explanation of the reasoning and the relative importance assigned to
different factors must be given to justify the final judgement.

221
8.12 IDENTIFICATION OF PREFERRED PROJECT ALTERNATIVE AND RECOMMENDATIONS TO DECISION-MAKERS31
The final step involves identifying the preferred alternative on the basis of a
comprehensive appraisal of all factors and arriving at a decision on whether or not to
proceed with a project proposal. All relevant project impacts and records quantitative
and/or qualitative findings must be informed. The recommendation should be made
based upon the findings with respect to economic viability combined with the findings on
sustainability and non-monetised effects. The social impact of the project, i.e., where the
costs and benefits fall, also needs to be considered. The sustainability of the project from
a number of different perspectives, both during implementation and during operation,
also needs to be confirmed.
Project promoters should decide, on the basis of the quantitative economic analysis,
whether the project as conceived is preferred over the alternatives considered including
doing nothing. In making this decision, the robustness of the quantitative economic
analysis should be taken into account. The decision on financial and economic viability
should be made on the basis of the expected NPV determined through a probabilistic
analysis. Where this cannot be done, either because of absence of data (or valid
approximations) on the probabilities of key outcomes or because the research effort is not
justified, the findings of sensitivity analysis should be taken into consideration when
confirming that the economic case remains robust.
Other things being equal, this would indicate that the project is not economically viable;
however, if non-monetary benefits are significant this finding may be overturned,
provided there is strong and well-argued justification. A qualitative assessment of the
importance of these benefits is therefore required as a basis for reaching a decision.
Equally, a positive economic case for a project based on quantitative economic analysis
may still be overturned if non-monetised costs (negative externalities) are demonstrated
to be unacceptable or if there are unacceptable concerns about a project’s environmental
or social sustainability.
The comprehensive appraisal performed involves taking into account the affordability and
sustainability factors and assessing the importance of any significant intangible benefits
31 Based on Republic of Cyprus (2016).

222
and costs which it was not feasible to monetise. If the affordability and sustainability
analyses and economic analysis point in different directions, then the final
recommendation must be carefully presented giving a full explanation of the reasoning
and the relative weights given to the different factors in arriving at the final conclusion. If
the quantitative economic analysis indicates that one of the project alternatives is more
attractive than the reference project, then project promoters should consider investigating
this alternative in more depth. This may require further studies to be carried out and a
new project appraisal. A PFS or FS is the core analytical document for project appraisal.
This must be supported by technical studies. A FS is too detailed a document for decision-
makers. The Project Appraisal Report must contain a clear and recommendation on
whether to proceed, justified on the basis of the FS findings.
If the project is revealed to be financially unsustainable or unaffordable within current
budgetary allocations, then it may not proceed in the form foreseen. Either further
development of the project should be halted, or ways of reducing costs, such as phasing or
reducing the specification, must be considered. Project promoters should be ready to
perform a number of iterations of the project appraisal process, including introducing new
project alternatives/variants, to find an affordable solution if this is necessary.

223
9 THE PROJECT
IMPLEMENTATION AND THE EX-
POST PROJECT EVALUATION
9.1 THE PROJECT IMPLEMENTATION
The need for effective implementation, monitoring and evaluation system emanates from
a continuous review of the three critical areas in project implementation: time, cost and
performance. These get translated into schedule control, cost control and technical
performance. These three aspects are interrelated, and the various monitoring
instruments are used to examine their status and relationships by the management
throughout the life of the Project.
One of the main objectives of practical implementation, monitoring, and evaluation is to
enable management to conduct an ongoing assessment of the Project during its
implementation phase. It provides timely feedback and acts as an early warning signal for
the identification of areas of both internal and external problems. The internal issues may
arise from faulty planning, defective project design or unrealistic project goals. On the
other hand, the external difficulties may occur primarily due to alterations in the project's
external environment. These external problems may be due to some fundamental shift in
the political, legal or institutional arrangements or may result from routine changes.
The Monitoring and Evaluation (M&E) is an ongoing process by which stakeholders
receives regular feedback on the progress being made towards achieving the goals and
objectives. Briefly, monitoring is the collection and analysis of information about a project
or programme undertaken while the project/programme is ongoing. At the same time,
evaluation is the periodic, retrospective assessment of an organisation, Project or
programme that might be conducted internally or by external independent evaluators.
224
The project management
Looking for a way to stay ahead of the pack in today’s competitive and chaotic global
economy, governments and companies are turning to project management to consistently
deliver business results. Disciplined project management starts at the portfolio level,
where the strategic vision drives initial investments and where value measures are
established. A fully aligned project, program and portfolio management strategy
encompasses the entire organization, dictating project execution at every level and aiming
to deliver value at each step along the way. Project management is, in fact, shorthand for
project, program and portfolio management. And more companies and governments are
clearly seeing the payoff from investing time, money, and resources to build organizational
project management expertise: lower costs, greater efficiencies, improved customer and
stakeholder satisfaction, and greater competitive advantage. And the economic downturn
only heightened that value.
THE PROJECT DEFINITION32
A capital project is a long-term, capital-intensive investment project with a purpose to
build upon, add to, or improve a capital asset. Capital projects are defined by their large
scale and large cost relative to other investments that involve less planning and resources.
Capital projects often refer to infrastructure, like roads, or railways or other public works.
Whereas social sector infrastructure projects refer to schools, training centres or
universities in the education sector, primary health care centres, clinics, and hospitals in
the health sector, and public buildings, courthouses in the justice sector, etc.
Many social sector projects, that are outcome-based projects, can be designed with clear
deliverables, well-defined boundaries and outputs can be measured with reasonable
accuracy. The conventional project management practices, with some modifications, can
be tried to a major part of such social projects and help in improving the delivery timeline
and reduce cost and manpower requirements. Some additional features which can be
added to the conventional project management approach are training requirement of the
manpower, quantification of on-going indicators, quality parameters which can define
completion of a particular stage of the project.
32 For detailed description, see: A Guide to the Project Management Body of Knowledge PMBOK(R) Guide
Sixth Edition, Part 1, page 4. Projects

225
A project consists of a set of coordinated and controlled activities, each of them with a
starting and finishing date, undertaken to achieve an objective conforming to specific
requirements, including the constraints of time and resources. Simply put, a project is a
series of tasks that need to be completed to reach a specific outcome. A project can also be
defined as a set of inputs and outputs required to achieve a particular goal. Projects can
range from simple to complex and can be managed by one person or a hundred.
A project can be any series of activities and tasks:
• That have specific objectives to be completed within individual specifications
• That have funding and time limits (if applicable)
• That has a defined start and end date
• That is multifunctional (i.e., cut across several functional lines)
• That consume resources (human and non-human, i.e., money, equipment, facilities,
materials, information technology, etc.
THE OPERATIONS DEFINITION
The operations are organizational functions developed by the ongoing implementation of
activities that produce the same product or service delivered repetitively. Operations are
continuing or endless. Therefore, they consist of repetitive functional work that creates
the same service or product repeatedly. Whereas the projects are finite, they have a
starting date and a finishing date, and they make every time a unique product or service.
For example:
• Production operations
• Manufacturing operations
• Administrative operations
• Accounting operations
• Budgeting operations, etc.

226
Table 17 shows a comparison between project and operational activities.

227
Table 17 - Comparison Operations vs Projects
OPERATIONAL ACTIVITY PROJECT ACTIVITY
• Always delivers the same product.
• It is continuous over time.
• Requires mostly specific expertise.
• Stable organization.
• Repetitive and well understood.
• Works within an annual budget.
• Continued existence is almost assured.
• Annual expenses calculated based on experience and time series.
• It produces a specific and new product.
• It has a defined beginning and end dates.
• Multidisciplinary team.
• Temporary team & organization.
• The project is unique, not 100% clear.
• Work with a defined plan and costs.
• It is cancelled if targets are not reached.
• Completion date and cost are more challenging to predict and manage.
Source: Project Management Institute (PMI ®), PMBOK GUIDE ® 6th Edition, 2017.
PROJECT MANAGEMENT DEFINITION33
Project management is applying knowledge, skills, tools, and techniques to project
activities to meet or exceed stakeholder needs and project requirements. Project
management is accomplished through the appropriate application and integration of
project management. Processes identified for the project. Project management enables
organizations to execute projects effectively and efficiently. The advantages of using
Project Management are:
• Better control of financial, physical, and human
• Better customer relationships
• Shorter development
• Lower costs
• Higher quality and increased reliability
• Margins higher profits
• Increased productivity
• Better internal coordination
• Higher worker morale
33 For detailed description, see: A Guide to the Project Management Body of Knowledge PMBOK(R) Guide
Sixth Edition, Part 1, page 10. Projects

228
Dividing project management efforts into five process groups help give efforts structure
and simplify them into a series of logical and manageable steps. These five process groups
are the chronological phases that the project goes through. According to international best
practices, project management involves five process groups34.
Figure 25 - Framework of five process groups interacting in a project
Source: Project Management Body of Knowledge, PMBOK®, version 06.
The Project Management Process Groups includes the following process:
a) Project initiation
• Those processes performed to define a new project (or a new phase of an existing
project) by obtaining authorisation to start the project or phase.
• Preparation of the documents to sanction the project.
• Assigning the project manager.
b) Project planning
• Definition of the work requirements.
• Definition of the quality and quantity of work.
• Definition of the resources needed.
34 Based on Project Management Body of Knowledge, PMBOK®, version 06.
Level of processinteraction
FinishTIMEStart
Initiatingprocess group
Planningprocess group
Executingprocess group
Monitoringprocess group
Closing processgroup

229
• Scheduling of activities.
• Evaluation of various risks.
c) Project execution
• Negotiating for the project team members.
• Directing and managing the work.
• Working with the team members to help them improve
d) Project monitoring and control
• Tracking progress
• Comparing actual outcome to predicted outcome
• Analysing variances and impacts
• Adjusting
e) Project closure
• Verifying that all the work has been accomplished
• Contractual closure of contracts
• Financial closure of the charge numbers
• Administrative closure of the paperwork
Project Management Process Groups are linked by the outputs which are produced. The
Process groups are seldom either discrete or one-time events; they are overlapping
activities that occur throughout the project. The above figure 4 illustrates how the process
groups interact and shows the level of overlap at various times.
THE INTEGRATION MANAGEMENT
A project manager’s prominent role is to perform integration management, i.e., to pull all
the pieces of a project together into a cohesive whole. Integration is balancing all the
processes in the ten knowledge areas (scope, time, cost, quality, human resources,
communications, risk, procurement, and stakeholder management) with each other.
Project management processes do not happen independently. Project integration
management is a way of making various processes work together. Meaning, it takes the
numerous processes that are being used in a project and ensuring that they are

230
coordinated. For example, to complete a cost estimate, the project's number of resources,
the scope being estimated, the risk reserves, etc. should be considered.
Project integration management accomplishes this by making trade-offs. That means that
a project manager can’t have everything, if he wants to get the project completed on time
and within budget. The project management triangle is a model of the constraints of
project management. It contends that: The quality of work is constrained by the project’s
budget, deadlines, and scope. The project manager must trade between constraints.
Figure 26 - Project Management Triangle
Source: PMBOK GUIDE® Sixth Edition – PMI® Global Standard.
THE PROJECT EXECUTION PLAN
A Project Execution Plan (PEP) or Project Management Plan is one of the most important
project baselines documents and it is the governing document for the project execution
and management that establishes in detail and appropriate terms what will be done to
meet the project scope and contractual requirements.
The PEP documents the strategy for managing the project and the processes related to all
knowledge areas except, integration management. To have a complete PEP means that
there should be a management plan for each knowledge area. These plans are, in essence,
a set of documents with processes, procedures, practices, standards, and metrics that
stakeholders should follow to ensure consistent results.
Quality
Time (Schedule)
Cost(Resources, budget)
Scope(Features, functionality)

231
The PEP is developed by the project key participants led by the project manager. The PEP
should be approved by company management before publishing or applying. The PEP is a
live document and should be updated with current and future project plans and
procedures.
9.2 THE SCOPE MANAGEMENT
Scope management is the process whereby the outputs, outcomes and benefits are
identified, defined and controlled. ‘Scope’ is the term used in the management of projects
to refer to the totality of the outputs, outcomes and benefits and the work required to
produce them. Scope management is the process of defining what work is needed and
making certain all that work -and only that work- is done.
It is vital to be clear about the boundaries and interfaces with adjacent projects in defining
project scope. How scope is managed depends upon the project life cycle. The high-level
scope is typically recorded in the business case supporting the chosen option and its
investment appraisal. Clearly defining what is included and what is excluded of scope
prevents the risk of misunderstanding at a later point in the project, leading to emerging
issues and change requests. During the scoping process, assumptions are documented to
clarify the work that is part of the scope. And the detailed scope of work emerges from the
decomposition of the chosen option to meet the sponsors' requirements.
The project scope statement
The project scope statement provides the documented basis for making all project
decisions. It is used to direct the project effort and communicate the project scope to the
project team and other project stakeholders. Projects that do not have a Project Scope
Statement are plagued with scope creep issues. When a project team creates a Project
Scope Statement early in the project lifecycle, they define the project's boundaries. Then
the project team can understand the business need and the expected outcome of the
project. The team recognizes constraints that will limit their options for developing a
solution; they are aware of assumptions regarding decisions outside their control. In this
way, the team gains alignment on high-level requirements, understands the processes they
are affecting, and recognises entities the project solution will interface with. These tools
allow the project manager, project team and stakeholders to make informed decisions on
what is included in the project's scope. It also recognises when all the project requirements
have been identified and appropriate solutions defined.

232
Project scope management includes the processes involved in defining and controlling
what is or what is not included in a project. Scope refers to all the work involved in creating
the project's products and the processes used to create them. There are two types of scope:
product scope and project scope:
i. Product scope: The features and functions that characterize a product, service, or
result.
ii. Project scope: The work that needs to be accomplished to deliver a product, service,
or result.
The activities scheduling
In projects with a linear life cycle, the baseline scope of work is defined through a Work
Breakdown Structure (WBS) to determine the activities scheduled and resourced to meet
all the requirements and benefits. Scope definition is assumed to be fixed35.
Breaking work into smaller tasks is a common productivity technique used to make the
job more manageable and approachable. For projects, the WBS is the tool that utilizes this
technique and is one of the essential project management documents. It singlehandedly
integrates scope, cost, and schedule baselines, ensuring that project plans are in
alignment. A good WBS is created using an iterative process by following these steps and
meeting these guidelines:
• Gather critical documents: Identify content containing project deliverables, such as
the Project Charter, Scope Statement and PEP subsidiary plans
• Identify key team members: Identify the appropriate project team members. Analyse
the documents and identify the deliverables
• Define level 1 elements: Level 1 elements are summary deliverable descriptions that
must capture 100% of the project scope. Verify 100% of scope is captured. This
requirement is commonly referred to as the 100% Rule
35 The Project Management Institute (PMI) Project Management Book of Knowledge (PMBOK) defines the
Work Breakdown Structure as a "deliverable oriented hierarchical decomposition of the work to be executed
by the project team." The WBS is a foundational document in project management because it provides the
basis for planning and managing project schedules, costs, and changes.

233
• Decompose (Breakdown) elements: Begin the process of breaking the Level 1
deliverables into unique Lower-Level deliverables. This "breaking down" technique is
called decomposition. Continue breaking down the work until a single individual or
organization can manage the work covered in each element. Ensure that all parts are
mutually exclusive. Ask the question, would any further decomposition make the
project more manageable? If the answer is "no", the WBS is done
• Create a WBS dictionary: Define the content of the WBS dictionary. The WBS
dictionary is a narrative description of the work covered in each element in the WBS.
The lowest level elements in the WBS are called work packages. Create the WBS
dictionary descriptions at the Work Package level with detail to ensure that 100% of
the project scope is covered. The descriptions should include information such as
boundaries, milestones, risks, owner, costs, etc.
• Create the Gantt chart schedule: Decompose the Work Packages to activities as
appropriate
• Export or enter the Work Breakdown Structure into a Gantt chart for further
scheduling and project tracking
It is possible to break the work down too much. Since cost and schedule data collection,
analysis and reporting are connected to the WBS, a very detailed WBS could require a
significant amount of unnecessary effort to manage.
Time management
Time management is important in any construction project. Without proper time
management, many problems will occur such as extension of time, time overrun or delays.
Time overrun become the most general problem in construction industry worldwide.
Project time management is an act of exercising or planning conscious control on time
spent on specific tasks or activities. Time Management increases the effectiveness,
efficiency or productivity of a person, organization, or a project. Time management in
project management includes the processes required to manage the timely completion of
the project. Project schedules grow out of the primary documents that initiate a project:
• Project charter includes high-level start and end dates and budget information
• Scope statement and WBS help define what will be done
An overview of the Project Time Management processes are as follows:

234
• Define Activities
• Sequence Activities
• Estimate Activity Resources
• Estimate Activity Durations
• Develop Schedule
• Control Schedule
ACTIVITY DEFINITION
The definition involves identifying and documenting the specific activities that must be
performed to produce the deliverables and sub-deliverables of each work package
specified in the WBS. This process's key benefit is to break down work packages into
activities that provide a basis for estimating, scheduling, executing, monitoring, and
controlling the project work. Define Activities in project time management has three
outputs:
• Activity list: This output should contain all the scheduled activities that will be
performed for the project; each activity with a scope of work description and an
identifier (such as a code or number). In this way, team members understand what
the work is and how it is to be completed.
• Activity attributes: This output describes the activities' characteristics and is an
extension of the activity list. Activity attributes will change over the life of the project
as more information is known. In the early stages of the project, activity attributes
might include the activity ID, the WBS identification code it's associated with, and the
activity name. As you progress through the project and complete other Planning
processes, you might add predecessor and successor activities, logical relationships,
leads and lags, resource requirements, and constraints and assumptions associated
with the activity.
• Milestone list: Milestones are typically significant accomplishments of the project and
mark the completion of essential deliverables or other critical events in the project.
For example, approval and sign-off on project charter might be considered a
milestone. The milestone list records these accomplishments and documents whether
the milestone is mandatory or optional. Milestones are like regularly scheduled
activities, with the same structure and attributes, but they have zero duration because
milestones represent a moment in time.

235
SEQUENCING ACTIVITIES
Sequence activities in project time management have three tools and techniques:
• Dependency determination
• Precedence Diagramming Method (PDM) or Critical Path Method (CPM)
• Applying leads and lags
Dependencies are relationships between the activities in which one activity is dependent
on another to complete an action, or perhaps an activity is dependent on another to start
an action before it can proceed.
Once project analyst has identified the dependencies and assembled all the other inputs
for the Sequence Activities process in project time management, you’ll take this
information and produce a diagram—or schematic display—of the project activities. The
project schedule network diagram shows the dependencies—or logical relationships—that
exist among the activities. You can use one of the other tools and techniques of this process
to produce this output.
ESTIMATING ACTIVITIES RESOURCES
Once the activities have been sequenced, the type and quantity of needed resources need
to be established. Resources include equipment, materials as well as people. The project
manager must plan and coordinate resources to avoid common problems such as lack of
resources and resources being taken away from the project. This process defines activity
resources requirements and a Resource Breakdown Structure (RBS), which shows the
resources to be used, organized by category and type.
ESTIMATING ACTIVITIES DURATIONS
The activity duration estimation should be done, and if possible, by those who will be doing
the work, therefore the estimators are the project team members. To develop realistic time
estimates, these estimators need to have access to the activity list and attributes, activity
resource requirements, resource calendars, and the resource breakdown structure.
Estimators must also consider the organizational process assets (i.e., historical data and
lessons learned about activity durations, past project calendars, and the defined
scheduling methodology). And the enterprise environmental factors (i.e., the company
culture and existing systems that the project will have to deal with or can make use of such
as estimating software and productivity metrics).

236
DEVELOPING THE SCHEDULE
A Gantt chart/Bar chart is a scheduling tool commonly used in project management, and
it is one of the most popular and useful ways of showing activities (tasks or events)
displayed against time. On the left of a Gantt chart is a list of the activities and along the
top is a suitable time scale. Each activity is then represented by a bar; the bar's position
and length reflect the start date, duration, and end date of the activity. This chart allows
you to see at a glance:
• What the various activities are.
• When each activity begins and ends.
• How long is each activity scheduled to last?
• Where activities overlap with other activities, and by how much.
• The start and end date of the whole project.
Gantt charts are usually created by computer applications, such as Microsoft® Project,
Primavera Project Planner®, etc.
CONTROLING THE SCHEDULE
There are four possible relationships (dependencies) between tasks:
• Finish to Start (FtS) - the default: The task cannot start before its predecessor ends,
although it may begin later. This FS is the most common type of relationship and is
described above.
• Start to Start (StS): The task cannot start until the predecessor starts, although it may
begin later. This relationship can be useful if you have a task whose start date depends
on another task's start date.
• Finish to Finish (FF): The task cannot end before the predecessor ends, although it
may end later.
• Start to Finish (SF): The task cannot end before the predecessor starts, although it
may end later. This task relationship is rarely used.
By default, tasks are usually linked in a 'Finish to Start' relationship (dependency), which
means that the first task you select (the predecessor task) must end before the next task
you choose (the successor task) can start, and so on. This relationship is typically

237
represented on the Gantt chart by lines with arrowheads joining each task's successor. The
arrowhead indicates the direction of the link: it goes from the predecessor to the successor.
Figure 27 - Gantt Chart Predecessors and Logical Relationships
Source: PMBOK 7th edition and international best practices.
The Critical Path. The critical path is the longest duration path through a Gantt chart
and a network diagram, and the shortest possible time it could take to complete the
project. The way to identify the critical path is to identify all paths through the network
and add the activity durations along each path. The path with the most prolonged duration
is the critical path.
Fast-tracking. Fast-tracking is one schedule compression technique involving taking
critical path activities initially planned to do in a series and doing them instead in parallel
for some or all their duration. Fast-tracking often results in rework; it usually increases
risk and requires more attention to communication.
The time baselines. The schedule baseline is the version of the schedule model used to
manage the project and that the project team's performance is measured against. All three
project baselines are used for monitoring, evaluation, and control purposes, and they can
only be changed because of formally approved changes.
Resources management
A project resource may be defined as the machine, a piece of equipment or any person who
will perform the work scope. Therefore, resource planning is forecasting the resources
required to achieve the scope of work within the time plan. The resource constraints or
resources optimization should be considered after the network diagram, schedule bar
chart and procurement schedule have been developed, but before the cash-flow statement.

238
RESOURCE ESTIMATING
This estimate is linked directly to the scope of work and bill of materials (BOM). The work
scope may be expressed in tons of steel, square meters of wall to be painted, etc. The
estimator can convert the scope of work into person-hours per unit “X” from this
description. The next step is to consider the direct trade-off between the resource
requirement and the activity’s duration. By varying the resource availability, the duration
of the activity will change.
RESOURCE FORECASTING
The next step is to forecast the total resource requirement by discipline or interchangeable
resource. An interchangeable resource is when you have a pool of workers, and any one of
them could perform the work. Forecasting is done by compiling all the resource estimates
and presenting them in a structured resource table.
RESOURCE AVAILABILITY
The next step is to quantify the resources available inside and outside the company. The
following points should be considered:
• Other resource commitments - if your company is involved in several projects which
all draw from a shared labour pool, the other projects’ requirements must also be
considered.
• The anticipated sickness and absenteeism rate.
• Keeping the above points in mind, the resource availability table can be developed.
THE RESOURCES HISTOGRAM AND S CURVES
A Resource Histogram is a popular planning tool because it gives an excellent visual
presentation which is easy to assimilate and understand. The prerequisites for drawing
the resource histogram are:
• Early-start bar chart (after considering the procurement requirements).
• Resource forecast per activity.
Using the early-start bar chart, it is assumed that the planner wishes to start all activities
as soon as possible and keep the activity float for flexibility. Once the resource
requirements have been added to the early start bar chart, the daily necessities are

239
summed by moving forward through the bar chart one day at a time to give the total
resource required per day/week/month. The total daily resource requirements are then
plotted vertically to provide resource histogram. It is important to note that separate
resource histograms are required for different trades.
In project management terms, an S-curve is a mathematical graph that depicts relevant
cumulative data for a project—such as any resource, the cost or person-hours—plotted
against time. The reason it’s called an s-curve is that the shape of the graph typically forms
a loose, shallow “S.” (The shape depends on the type of project, though, so other
formations are possible.) An S-curve in project management is typically used to track the
progress of a project.
The s-curve often forms the shape of an “s” because the project's growth in the beginning
stages is usually slow. The wheels are just beginning to turn; team members are either
researching the industry or just starting to engage in the first phase of execution, which
can take longer before they get the hang of it or before there are kinks to work out.
Then, as more progress is made, the growth accelerates rapidly, creating an upward slope
that forms the middle part of the “S”. This point of maximum growth is called the point of
inflexion. During that period, project team members are working heavily on the project,
and many of the high costs of the project are incurred. After the inflexion point, the growth
begins to plateau, forming the upper part of the “S” known as the upper asymptote—and
the “mature” phase of the project. This shape happens because the project is mostly
finished at this point and is winding down: Typically, only tasks such as finishing touches
and final approvals are left. Some of the most common uses for s-curves are to measure
progress, evaluate performance and make cash-flow forecasts.
An S-Curve helps monitor a project's success because actual, real-time cumulative data of
various elements of the project—such as cost—can be compared with projected data. The
degree of alignment between the two graphs reveals the progress—or lack thereof—of
whichever element is being studied. If corrections need to be made to get back on track,
the s-curve can help identify them.
How to draw a Resource Histogram and S-Curve:
• Step 1. Draw the bar chart
• Step 2. Transfer the resource per day/week etc. from resource table to the bar chart

240
• Step 3. Add the resource per day vertically to give a total daily requirement
• Step 4. Plot the resource histogram
• Step 5. Add the cumulative resource per day vertically to get the cumulative
requirement for each day
• Step 6. Plot the resource S curve
Figure 28 - Resource histogram and S curve
Source: PMBOK 7th edition and international best practices.
Costs management
Cost management is the process of estimating, allocating, and controlling the costs in a
project. It allows a business to predict future expenses to reduce the chances of it going
over budget. Projected costs are calculated during the planning phase of a project and must
be approved before work begins. As the project plan is executed, expenses are documented
and tracked, so things stay within the cost management plan. Once the project is
completed, predicted costs vs actual costs are compared, providing benchmarks for future
cost management plans and project budgets.
PLAN DEFINITION
A cost management plan is a method of strategizing the planning and execution of a
project’s budget. Of course, this is done to complete your project on time and budget.
However, without a proper cost management plan in place, both things will falter—costing
the project manager and his organization immensely. What’s more, project success hinges
on cost management, as the cost is the primary determining factor for the success or

241
failure of the venture overall. The Cost Management Plan is important because the project
manager’s ability to influence project costs starts high and decreases as the project goes
on.
The Cost Management Plan may include:
1. Specifications for how estimates should be stated (in what currency)
2. The level of accuracy needed for estimates
3. Reporting formats to be used
4. Rules for measuring cost performance
5. Whether cost will include direct costs (those costs directly attributable to the
project) and indirect costs (normally overhead costs)
6. Guidelines for the establishment of a cost baseline for measuring against as
part of project monitoring and controlling
7. Control thresholds
8. Cost change control procedure
9. Information on control accounts
10. Information on how the different cost processes will be conducted
11. Funding decisions
12. Methods for documenting costs
13. Guidelines for dealing with potential fluctuations in resource costs and
exchange rates
14. Roles and responsibilities for various cost activities

242
RESOURCE PLANNING
Starting with the resource plan, project managers will typically use a work breakdown
structure to show the project and its deliverables in a hierarchy from most important to
least. This piece helps project managers to understand where the bulk of the costs will
funnel towards, and which components of the project will require the least expenditure.
COST ESTIMATION
This stage uses many different estimation techniques determined by conceptual goals,
historical knowledge, expert judgement, determinative techniques, or a component-by-
component basis. Historically speaking, determinative methods have been shown to be
the most accurate. However, this process only makes sense to use once every project detail
has been mapped out—including the scope and deliverables. For projects lacking fine
print, less accurate cost estimation techniques will still be valuable during this stage.
Before the estimate stage, the project has been divided into work packages in a WBS. The
WBS is simply a subdivision of the project into tasks. Each item in the WBS is estimated.
The hours, tools, equipment costs, and subcontractors are calculated to produce a final
task estimate for each task. For many projects, activities are used to create cost estimates.
However, on some large project, it might be more practical to estimate and control costs
at a different level. This level is called a control account. It is higher than a work package
level in the WBS.
A cost estimate is a prediction of probable cost. Estimates come first and are the basis for
the budget. An assessment may have to be refined many times before it becomes a budget.
Once an estimate is approved, it becomes a budget. Organizations and work units are then
committed to performing work according to the budget.
Critical aspects of cost management:
• It is a non-delegable responsibility of the project manager
• Usually, this requires the full-time dedication of a manager in charge
• It must always be integrated with other areas of project management, especially the
project time management
• The quality of the source data is critical
• It requires experience

243
• Choose the level of detail required to make decisions: i.e., balance cost v/s benefits of
that information
• Must incorporate changes (inevitable)
MAIN CONSIDERATIONS FOR COST MANAGEMENT
A cost management plan must consider the variables that impact the budget, whether
materials or people. There are also fixed costs, such as economic cost of teams. All these
must be calculated to know what your financial commitment to the project will be.
Finally, it is the stakeholders, who have a vested interest in keeping costs down. Cost
overrun is a problem many projects experience, but not one that stakeholders are going to
be very tolerant of. Keep the stakeholder in mind when formulating your cost management
plan. They need to stay in the loop and get reports throughout the project.
BUDGETING
The cost estimation phase might have felt like you mapped out your budget already, but
you just mapped out the blueprints for your budget. Your project budget will be a little
more precise by this measure and will enable the project to succeed truly. Budgets are
formed and approved after the estimation phase, and they are typically released in a series
of steps depending on the project's progress. These phases will help the project reach its
milestones within each budgetary step, rather than match an overall project budget.
Budgeting is forecasting using the actual results produced to predict the project's final cost
(i.e. the Budget at Completion, BAC).
CONTINGENCIES
Amounts placed within individual task estimates to account for "known unknowns" are
called Contingencies. These are used to account for things that are known to be uncertain.
For example, in a bridge-building project, the potential rise in streamflow due to climate
change could represent a good reason to increase estimates. You don't know if it will
happen, but it might.
MANAGEMENT RESERVES
Amounts placed for "unknown unknowns" (unexpected issues) are called Management
Reserves. These are often placed on the entire project rather than individual tasks because
it is difficult to assess and manage how many unexpected issues could occur on tasks.

244
Many organisations track the cost escalation on past projects and allocate this to each
future project as a Management Reserve. This allocation can be either a percentage or a
fixed fee. For the overall budgeting phase, the Cost Management Plan should contain the
following items:
• How much contingency to include in each task
• Quantity of Management Reserve to include in the entire project
• Methodology, assumptions, and background information
COST CONTROL
Cost controlling measuring the project's dollar value performance against its total cost and
timeline. This process will help provide a benchmark throughout the project. First, project
cost requirements are established well in advance during the project planning phase.
Then, they are used as a method to challenge reasons for changes in cost. This process will
help to course-correct should a cost increase out of budgetary range and keep the project
from ballooning out of control. Ultimately, the cost management plan will help the project
manager plan the project cost and manage project cost throughout the project's life cycle.
As the project is underway, its project expenses will be thoroughly documented
throughout the project so that the project can stay within budget.
Most projects have cost accounts into which each cost is placed for tracking purposes.
These cost accounts are correlated to the task list, the Work Breakdown Structure (WBS).
To create a robust control on the project budget during project execution, the project
manager uses Earned Value Management. This tool's use means that at specified
intervals, usually one week, the following variables are measured from actual project
performance.

245
Figure 29 - Project Cost Baseline (actual expense and financing
requirements)
Source: International best practices and Project Management Master’s Program, Universidad
Adolfo Ibáñez-Chile
BEST PRACTICES FOR MANAGING PROJECT COST
The following are some tips to keep in mind as working on managing project costs.
• Plan for Inflation: Pricing is not set in stone, and any good budget is going to take this
into account by allowing for a range of costs
• Account for Natural Disasters or Potential Events: Expect the unexpected, a project
manager must allow room in your budget for a weather event, personal issue or some
other unknown that will delay the project
• Other Unexpected Costs: Not all unexpected costs are random. There can be legal
issues, penalties associated with the project or unexpected labour costs, all of which a
project manager cannot budget for, but he/she can prepare the budget for
• Track in Real-Time: Having specialized software to monitor the budget as the project
is being executed, this is key for managing costs. However, if the project manager is
looking at data that is not current, he/she won’t be able to act swiftly enough to resolve
issues
• Respond Promptly: Regardless of how the project manager discovers a discrepancy in
the project cost, he/she must act immediately. The longer he/she waits, the more
money is wasted
Cost base line, actual expenses and financing
requirements
Cost
baseline
Actual
expensesFinancing
requirements
management contingency reservesBAC
Time line
Cu
mu
lati
ve v
alu
es

246
• Size Accordingly: Some people think smaller projects don’t need project cost
management. But small or large, the project manager needs to manage costs
To best manage project costs, a project manager must know his/her project inside and out.
The best way to do that is at the start of the project by creating a thorough project charter.

247
10 PROJECT DECISION CRITERIA
The financial and economic attractiveness of a project is determined by the net present
value of its incremental net cash or resource flows. The net present value criterion is widely
accepted by accountants, financial analysts, and economists as the only one that yields
correct project choices in almost all circumstances. However, some investors have
frequently relied upon other criteria such as a project’s internal rate of return and the
benefit-cost ratio.
The main goal of project evaluation is to ensure that a project makes efficient use of a
country’s scarce resources. The economic analysis provides a methodological framework
for estimating economic benefits and costs. Appraisal of Public Investment Portfolio using
either CBA or the CEA approaches will allow to allocate scarce economic resources toward
most productive investments, contributing to the sustainable long-run economic growth
in Kenya.
10.1 THE INFRASTRUCTURE SECTOR PROJECTS AND THE COST BENEFIT ANALYSIS
Infrastructure sector project typologies
In most of the cases, infrastructure sector projects are related to following typologies:
i. Projects that increase the facilities capacity
ii. Projects that improve the facilities quality of services
iii. Projects that provide new facilities
For example, in the inter-urban road sector, projects that increase the facilities capacity
are investments that increase the vehicle capacity of a highway; among other:
• Construction of third lanes.
• Construction of secondary roads-trucks.
For example, in the inter-urban road sector, projects that improve the road quality are
projects that improve the quality of existing service through changes in the road geometry;
among other:

248
• Reduction of the curvature of the path.
• Decreased slopes of the road.
• Construction of an alternative way.
• Construction of a tunnel that avoids a slope.
For example, in the inter-urban road sector, projects that improve the quality of existing
service are investments that changes the road texture/surface (better quality); for
example:
• Paving of a gravel road.
• Improve of a dirt road.
Also, it includes that projects that partially or completely renovate the road
texture/surface; for example:
• Resetting concrete texture/surface.
• Recoating with asphalt mix.
• Resetting the texture/surface on a gravel road.
For example, in the inter-urban road sector, projects that provide new facilities are
investments that solve accessibility problems; for example:
• Construction of access roads.
• Construction of border crossings.
Normally, conservation activities do not require an economic evaluation, because
these activities were planned and considered in the original project appraisal. However,
this methodology can support the analysis of conservation policies and works.
Conservation activities consider all those actions that are intended to prevent the rapid
deterioration of the project, deferring their replacement.
For example, in the electricity sector, these activities are related to:
• Substation improvements
• Replacement of sub-transmission lines
• Replacement of distribution lines

249
• Capacitor maintenance
• Secondary network improvements
• Conservation and improvement of voltage regulators
• Conservation and improvement of metering equipment
• Conservation and improvement of vehicles and equipment
The Cost Benefit Analysis
The project benefits must be measured in terms of additional consumption or release of
resources. Similarly, projects costs will be related to increase in the uses of resources or in
terms of lesser present consumption. For example, main economic benefits of electricity
projects correspond to:
• A higher consumption of energy and/or lower acquisition costs for users.
• Release of resources. For example, implementation of rural electricity projects allows
people to reduce consumption of candles, paraffin, gas and batteries, while reducing
the time associated with their purchase.
• In both cases, the benefits affecting all sectors where the project has influence should
be considered, i.e. residential, public, commercial sector, etc.
The first step in making an economic appraisal is to convert all financial expenditures into
their corresponding economic costs. Usually, economic values for costs and benefits are
not accurately reflected in market prices because the presence of market distortions such
as import tariffs, taxes, subsidies, minimum wages, non-perfect markets (monopolies,
oligopolies), environmental impacts (such as pollution or congestion) and price controls,
among other. Then, all taxes, subsidies, market imperfections, impact from foreign
exchange premium, and labour market distortions must be removed from financial
expenditures.
Also, it is necessary to take into account externalities in the price of capital (discount rate),
in the price of foreign exchange (because of trade distortions and controls in the foreign
exchange markets), and in the labour market (where the financial wage rate may be
different from the economic price of labour). Benefit items must be estimated in terms of
their magnitude and timing over the duration of the project. These include maintenance-
cost savings, vehicle operating-cost savings, and time savings.

250
A simple decision rule must be followed when applying the CBA:
• Adopt only projects and policies with a positive net benefits.
By choosing policies with positive net benefits, society maximizes aggregate wealth. This
indirectly helps those who are worse off because richer societies have greater capability
for helping their poorest members and, if redistribution is a normal good (that is, other
things being equal, people want more of it as their wealth increases), members of society
have a greater willingness to help. In addition, if a more equal distribution of wealth or
income is an important goal, then it is possible to address it directly through transfers after
a large number of efficiency-enhancing policies have been adopted. In other words,
redistribution, at least in theory, can be done “wholesale” with a single redistribution
program rather than “retail” in each particular program (Boardman et al, 2018).
Different criteria van be used by applying the CBA. Among other, the NPV, the IRR and
the Benefit-Cost Ratio (BCR). These indicators are shown below.
10.2 THE SOCIAL SECTOR PROJECTS AND THE COST EFFECTIVENESS ANALYSIS
Social sector project typologies
Overall, the implementation of investment projects in social sectors (i.e. education, health,
housing, among other) is aimed at contributing to the improvement of the physical
infrastructure of each system, adapting its facilities to improved standards. Investment in
physical capital (building infrastructure and purchasing equipment) is complemented,
among other things, with the implementation of soft innovation initiatives (training and
supervision, for example). The implementation of those initiatives, along with government
subsidies that finance the operation of the social institutions and other sector programs,
aims to increase the efficiency of the social systems (i.e. education, health, housing).
In general, public projects done by the government in matters of social sectors are targeted
to increases in coverage, increased capacity, improved social services, among others
things; i.e. with project implementation, a new or better service is provided, services
whose social profitability is guaranteed and supported by existing sector policies or
through previous studies.
In most of the cases, social sector projects are related to following typologies:

251
• Scenario 1: when there is an existing facility in the area where the problem was
detected.
• Scenario 2: when there is no facilities in the area.
For example, in the case of educational projects Scenario 1 means that there is an existing
school or educational establishment, but the service that it provides does not achieve the
goals and objectives set by the national educational system. In other words, it delivers
educational services but not in optimal conditions, either because there is a deficit in the
quality of its services or a lack of capacity of the existing facility to meet current enrolment
and/or future potential demand, or insufficient training of teachers, or existing
infrastructure in poor condition, or a combination of many of these factors, etc. Therefore,
it implies the improvement of the existing facilities.
In the same example, Scenario 2 is one where a school or educational establishment does
not exist in the area; in that case, the requirements that the national educational system
demands will not be satisfied. In other words, there is a geographic area or segment of the
population that is not being serviced or attended; this area does not have access to
education according to the goals set for the national education sector. Thus, there is a
deficit of coverage or capacity to provide educational services, which may be associated
with lack of infrastructure. Therefore, it implies building new facilities.
Evaluating investment projects in social sectors is a technical exercise that is conceptually
no different from evaluating any other investment initiative; identical aspects in matters
of projection of future flows of costs and benefits and discounted cash-flow analysis have
to be made. However, in this particular case, the monetary valuation of the future benefits
derived from a social project are normally difficult to elaborate. Therefore, it is
recommended to use the CEA criterion for making investment decisions in these sectors.
The Cost Effectiveness Analysis
The benefits generated by social sector projects are many and varied. However, they are
usually difficult to quantify, and only in very special cases is it possible to value them in
monetary terms. Many times, the practical result is that the cost and effort required to
obtain a good estimate of the benefits becomes higher than the cost and effort required for
implementing the project.

252
Even though we can’t assess easily the benefits of social sector projects, it is important to
identify and quantify who receives them. For example, the benefits of an education project
generally are:
• To increase the level of productivity of the beneficiaries and therefore their own
income and the income of the employers who hire them.
• Increased personal satisfaction and self-esteem for the knowledge acquired.
• To improve the integration of the beneficiaries into society by allowing them to access
new services and to reduce some anti-social behaviour.
As it was already said, unfortunately it is not easy to quantify these benefits although they
are real. Therefore, it is necessary to use some parameters; even though they are not
benefits per se, they do have a direct relationship with a benefit. In other words, since it is
difficult to measure the benefit by itself, we measure one or more variables (called "proxy"
variables) and we anticipate them to have a direct relationship with the real benefits of the
project.
It is assumed (although it does not always happen) that if these variables occur in the
project, then the expected benefits shall materialize (this will only be known if good project
monitoring is carried out and then an ex-post evaluation). For example, consider the
following use of a proxy variable. A project aims to improve the management of
educational institutions in a region through the provision of training for the school
principals or directors in modern management techniques. This is expected to generate a
better use of available resources and allows the delivery of better-quality education to
students. In this case, it is not possible to estimate what positive impact this project will
have on the future conditions of the lives of students, nor how much this project will
increase the level of personal satisfaction of the trained principals and those working with
them.
A special case is those projects that do not affect the quantity or the quality of social
infrastructure services, but reduce the costs of delivering those very same services. In this
case, the benefits of the project are clearly identifiable, measurable and assessable. The
benefits can be easily determined as the difference between the costs associated with the
optimized base case and the corresponding costs of the alternative project.

253
Cost-Effectiveness Analysis (CEA) is similar to cost-benefit analysis but it does not involve
placing money values on the major benefits of a project. Instead of this, benefits are
expressed in physical units rather than in monetary terms.
CEA provides a measure of the relative effectiveness of alternative projects in achieving a
given objective. It is applied in situations where it is easier to identify benefits than to value
them, thus it is more widely used in the areas of health, education and defence, where
there are some difficulties in putting money values on benefits like improvements in life
expectancy, reductions in illness and raised educational quality. CEA compares the cost of
alternative ways of producing the same or very similar outputs or outcomes. The results
can be expressed either as a cost per unit output/outcome or as outputs/outcomes per.
Just as for cost-benefit analysis, costs over the life-cycle of a project are discounted to
arrive at present values and a net present cost for the project.
The limitation of CEA is that it does not provide a criterion for accepting or rejecting a
project, because costs and benefits are not directly comparable. If a political decision has
been made to undertake certain expenditure, for instance on pure public goods, cost-
effectiveness analysis can be applied to ensure that services are provided in the most
efficient way possible. In this example, the value of benefits no longer matters because a
political decision has been made to provide them anyway.
The CEA is often used to find from a range of alternatives the one that meets a
predefined objective at minimum cost. It can also be a useful tool as part of an initial
analysis of alternatives prior to a cost-benefit analysis to identify a short-list of
project alternatives to take forward for more in-depth cost-benefit analysis.
In applying the Cost CEA, the Net Present Costs or the Annualized Net Present Cost
have to be computed. While using the CEA, it is important to correctly estimate the
salvage values at the end of the projects and to choose the discount rate carefully.
The preferred outcome may clearly change with a change in discount rate. The rate
at which the two alternatives are the same is referred to as the “cross over discount
rate”.
It should be noted that CEA, contrary to a CBA, does not provide enough information about the convenience of implementing a particular project by itself. As mentioned, an intervention must always be compared to other alternatives in order to assess its cost-effectiveness. This requires that the formulator establishes a range of alternative programs addressing the same policy goal, and conveys, through a cost-effectiveness analysis, the relative impacts and costs of these programs in an easily understandable and intuitive way.
CEA may be carried at 2 different moments in time: Prospective analysis (ex ante evaluation) takes place prior to the start of a pilot or at-scale program, while

254
Retrospective analysis (ex post evaluation) takes place after an evaluation of the program is completed.
In the academic literature, CEA is almost exclusively ex post. Ex post CEA in education and health evaluations has, however, grown in the last decade, but is rarely carried by policymakers themselves. Most likely, this is due to the fact that serious cost-effectiveness analysis is commonly resolved by the academia due to its complexity. Therefore, policy-makers usually engage in decision-making based on cost-effectiveness analysis carried by someone else. In applied decision settings, such as a government or International organization, the CEA is often ex ante It is used to judge whether a hypothetical intervention, Z, should receive investments instead of other candidates such as X or Y. While a variant of Z might have been implemented and evaluated, it is possible that it only exists on the planner’s drawing board. Here lies the importance of looking for evidence with external validity: An estimate of effectiveness is externally valid when it can be generalized to modified versions of the intervention, to different samples of subjects, and to different policy contexts. In general, ex ante CEA in education and health projects is rare and, when applied, is often misconstrued as a simple cost analysis (excluding consideration of effects), or as a CBA-type method capable of judging the potential worth of a single intervention (McEwan, P. J., 2012).
Cost-effectiveness analysis are performed following 7 distinct steps (McEwan, P. J., 2012):
1) Identify competing alternatives (include but are not necessarily limited to X or Y. Ideally these should include popular or widely implemented interventions in similar contexts, and interventions with good impact evaluations)
2) Locate estimates of effectiveness for interventions (interval validity)
3) Ensure effect estimates are in comparable units (it could involve transforming an intermediate outcome measure into a final outcome measure using auxiliary assumptions or data)36.
4) Locate incremental cost estimates of each intervention. Options: either (1) reconstruct an ingredients-based estimate using documents, interviews, and secondary data analysis, or (2) use a cost estimate of a comparable intervention from another setting
5) Ensure that incremental costs from different studies are in comparable units, appropriately adjusting them for inflation, time value, and currency.
6) Calculate CERs using the preferred estimates of incremental effects and costs, and also conduct sensitivity analysis of CERs using a range of plausible assumptions about effects and costs
7) Judge the potential cost-effectiveness of Z, by conducting a simple bounding exercise.
In CEA, incremental effects are expressed in non-monetary units. In education, the
effects may include quantity measures such as school enrolment, attendance,
completion, or overall years or degrees attained; and quality measures such as
36 As McEwan, P. J. (2012) states, “Health economics has a far more comprehensive methodological toolkit to
inform such judgments when they concern transforming measured health outcomes into QALYs gained or
DALYs averted. In education economics, techniques are quite variable across studies. Whatever the method,
it should be explained in sufficient detail so that readers can replicate it”

255
cognitive development, academic achievement, or non-cognitive skills. In health,
the outcomes may include clinic enrolment or attendance, health incidents averted
(e.g., respiratory or diarrheal illness), life years saved, or improved quality-offline.
As it was mentioned, in the particular case of social sector projects the monetary valuation
of the future benefits derived from a social project are normally difficult to elaborate.
Therefore, it is recommended to use a CEA criterion for making investment decisions in
these sectors; CEA helps achieve the objectives of cost minimization or benefit
maximization, but also taking into account the anticipated effects of different project
alternatives. As data on effectiveness are usually lacking, it is seldom possible to apply
CEA, which then would be reduced to least-cost analysis.
This cost-effectiveness decision rule is based on the assumption that the benefits of
investments in social infrastructure are evident and need not be calculated. The criterion
is therefore to choose the project alternative that achieves those same benefits at minimum
cost. This assumption is backed by public policies that allocate resources to investments
in social infrastructure considering it socially convenient and profitable, because they
increase the human capital stock in the economy.
In those cases, where it is not possible to express the benefits of a project in monetary
terms, or the effort to do so is too great or complicated to justify (as usually happens in
health, housing and education projects), the second best alternative is to use cost-
effectiveness methods. The purpose of these is to determine which alternative design
achieves the desired objectives at minimum cost (i.e. which of the project alternatives is
the most efficient).
Different criteria van be used by applying the CEA. Among other, the Net Present Cost and
the Cost Per Beneficiaries Ratio. These indicators are shown below.
10.3 THE REFERENCE ANALYSIS PERIODS
In reality some major infrastructure assets have almost indefinite lives, providing a
programme of planned routine and periodic maintenance is pursued. It has been common
practice internationally to curtail the analysis period and include a residual value45 as a
benefit in the final year of the chosen analysis; however, this can potentially be a crude
approach, depending on the extent to which future values are discounted.

256
The evaluation horizon corresponds to the period of time for which the project evaluation
will be done. An analysis period must be decided upon, over which the benefits and costs
of the reference project and those of its alternatives will be assessed. The analysis period
should normally correspond to the useful life of the fixed asset created and should be the
same for all alternatives. In reality some major infrastructure assets have almost indefinite
lives, providing a programme of planned routine and periodic maintenance is pursued. It
has been common practice internationally to curtail the analysis period and include a
residual value as a benefit in the final year of the chosen analysis; however, this can
potentially be a crude approach, depending on the extent to which future values are
discounted.
It is assumed that in this period there will be no major changes that affect the assumptions
made at the time of evaluating the project. It should be noted that if the evaluation horizon
is less than the economic useful life of the project, then its residual value must be
estimated. Table 18 presents the reference analysis periods by sector recommended by the
European Commission.
Table 18 - Reference periods for project appraisal by sector
SECTOR YEARS
Railways 30
Roads 25-30
Ports and Airports 25
Urban transport 25-30
Water supply and sanitation 30
Waste management 25-30
Energy 5-25
Broadband 5-20
Business Infrastructure 10-15
Other sectors 10-15
Source: European Commission (2014).
In keeping with the approach adopted in a number of good practice countries, the
recommended approach in this manual is to place less weight on residual values and use

257
an analysis period more closely reflecting the useful life of a long-lived asset. The analysis
period for major infrastructure projects involving a large share of civil works (roads and
airports for example), may therefore be extended beyond 30 years to as much as 60 years.
Projects with significant environmental benefits and costs which extend across
generations may have even longer analysis periods.
10.4 TIME DIMENSION OF A PROJECT
Investment decisions are fundamentally different from consumption decisions because
the former have a time dimension. For example, land and capital equipment are purchased
at one point in time, and they are expected to generate net cash flows, or net economic
benefits, over a number of subsequent years. To determine whether the investment is
worthwhile, it is necessary to compare the benefits and costs, which occur in different time
periods.
The time dimension of a project’s net cash flows and net economic benefits can be captured
by expressing the values in terms of either future or present values. When moving forward
in time to compute future values, analysts must allow for the compounding of interest
rates. On the other hand, when bringing future values back to the present for comparison
purposes, it is necessary to discount them. Discounting is just the inverse of
compounding.
Because individuals consider waiting to be a cost, it is necessary to compensate them for
forgoing their consumption today and instead lending their funds to a bank or a borrower.
Thus, banks and other financial institutions have to offer lenders interest in order to
induce them to part temporarily with their funds.
The discount factor allows us to compute the present value of a Kenyan Shillings received
or paid in the future. Since we are moving backward, rather than forward in time, the
discount factor is the inverse of the compound interest factor. At a 10% annual discount
rate the discount factors are as follows in

258
Table 19.
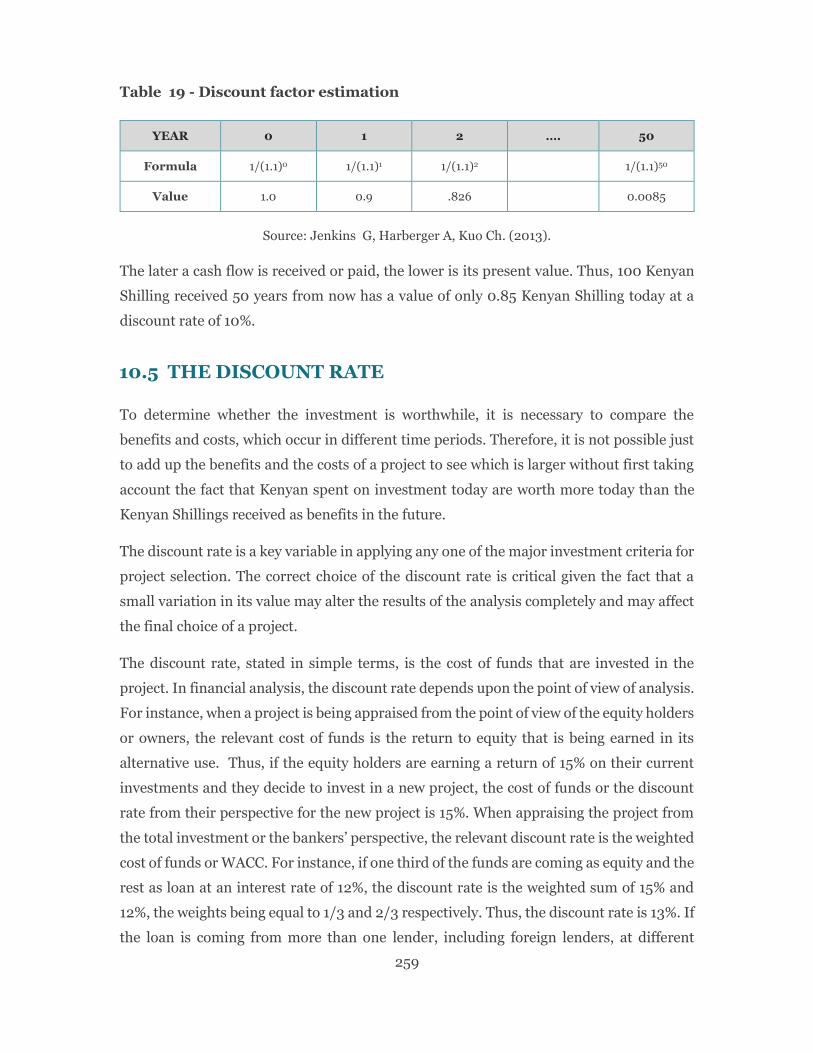
259
Table 19 - Discount factor estimation
YEAR 0 1 2 …. 50
Formula 1/(1.1)0 1/(1.1)1 1/(1.1)2 1/(1.1)50
Value 1.0 0.9 .826 0.0085
Source: Jenkins G, Harberger A, Kuo Ch. (2013).
The later a cash flow is received or paid, the lower is its present value. Thus, 100 Kenyan
Shilling received 50 years from now has a value of only 0.85 Kenyan Shilling today at a
discount rate of 10%.
10.5 THE DISCOUNT RATE
To determine whether the investment is worthwhile, it is necessary to compare the
benefits and costs, which occur in different time periods. Therefore, it is not possible just
to add up the benefits and the costs of a project to see which is larger without first taking
account the fact that Kenyan spent on investment today are worth more today than the
Kenyan Shillings received as benefits in the future.
The discount rate is a key variable in applying any one of the major investment criteria for
project selection. The correct choice of the discount rate is critical given the fact that a
small variation in its value may alter the results of the analysis completely and may affect
the final choice of a project.
The discount rate, stated in simple terms, is the cost of funds that are invested in the
project. In financial analysis, the discount rate depends upon the point of view of analysis.
For instance, when a project is being appraised from the point of view of the equity holders
or owners, the relevant cost of funds is the return to equity that is being earned in its
alternative use. Thus, if the equity holders are earning a return of 15% on their current
investments and they decide to invest in a new project, the cost of funds or the discount
rate from their perspective for the new project is 15%. When appraising the project from
the total investment or the bankers’ perspective, the relevant discount rate is the weighted
cost of funds or WACC. For instance, if one third of the funds are coming as equity and the
rest as loan at an interest rate of 12%, the discount rate is the weighted sum of 15% and
12%, the weights being equal to 1/3 and 2/3 respectively. Thus, the discount rate is 13%. If
the loan is coming from more than one lender, including foreign lenders, at different

260
interest rates then the discount rate is the weighted average of the return on equity and
the different interest rates. If in the above example, half the loan is at 12% and the
remaining half at 6%, the discount rate is a weighted average of 15%, 12%, and 6% with
equal weights. Thus, the rate is 11%.
On the financial analysis, besides the timing of the cash flow, the other factor that
determines the discount rate is the level of market interest rates. This is why it is critical
to pay careful attention to the estimation of the private and economic discount rates in the
financial and economic analyses.
In the economic analysis of a project, the relevant is the SDR. The SDR is the rate used as
a basis for converting future values into present value equivalents. The SDR specified for
calculating present values is also a real rate.
For the purposes of this manual, is proposed to use the SDR estimated in the previous
section, as well as the other national parameters, in order to conduct the economic analysis
of projects.
10.6 THE EVALUATION CRITERIA
The Net Present Value
The Net Present Value (NPV) is the algebraic sum of the present values of the incremental
expected positive and negative net cash flows over a project’s anticipated lifetime. If this
sum is equal to zero, investors can expect to recover their incremental investment and to
earn a rate of return on their capital equal to the private discount rate used to compute the
present values37.
A NPV greater than zero means that investors can expect not only to recover their capital
investment and to earn a rate of return equal to the discount rate, but also to receive an
addition to their real net worth equal to the positive amount of the NPV. Only projects
with positive NPVs are going to be beneficial and hence attractive to private investors.
They are unlikely to pursue a project with a negative NPV unless there are strategic
reasons.
37 The recovery of the invested capital is anticipated when NPV >=0 because the incremental capital
expenditures are included in the initial negative net cash flows.

261
The formula for computing the NPV of expected incremental net cash flows over n time
periods with annual discounting is:
)r + (1
C = NPV
0 =
n
t t
F t
Where:
The incremental net cash flows (CFt) could be negative, zero, or positive.
r is the discount rate equal to the cost of capital
Sigma sign ( ) is symbol for summation.
The NPV formula can be written out in its component present values of the annual net
cash flows, as follows:
)1(
C ... +
)2r + (1
C 2 + r + 1
C 1 + C0 = NPVnr
nFFF
++
The net present value criterion can be stated in the form of a set of decision rules.
Decision Rule 1: Do not accept any project unless it generates a positive NPV when
discounted by a discount rate equal to the opportunity cost of the funds.
Decision Rule 2: To maximize net wealth, choose among the various projects, or scenarios
of projects, the one with the highest NPV. If investment is subject to a budget constraint,
choose the package of projects that maximizes the NPV of the fixed budget.
Decision Rule 3: When there is no budget constraint and when a choice must be made
between two or more mutually exclusive projects, e.g. projects being considered for the
same building site, investors who seek to maximize net worth should select the project
with the highest NPV.

262
These rules follow from the definition of the NPV, namely the algebraic sum of the present
values of the incremental expected positive and negative net cash flows over a project’s
anticipated lifetime.
The Internal Rate of Return
By definition, the Internal Rate of Return (IRR) is the discount rate ( ) that sets the NPV
= 0 in the following equation:
0 = - ) + (1
CF
j 0
jn
1j=
I
Where:
CFj is the incremental net cash flow in year j to total, or equity, capital,
I0 is the initial investment,
is the IRR. We have to solve for .
This definition is consistent with the meaning of a zero NPV as explained in the previous
section, namely that investors recover their invested capital and earn a rate of return equal
to the discount rate, which is the IRR. The IRR criterion can be stated in the form of a set
of decision rules.
• Decision Rule 1: Do not accept any project unless its IRR is greater than the
opportunity cost of the funds (accept project if > r, the opportunity cost of capital;
otherwise, reject). The opportunity cost of capital is measured by the cost of funds or
the expected rate of return offered by other assets equivalent in risk to the project
being evaluated.
• Decision Rule 2: When a choice must be made between two or more mutually
exclusive projects, investors should select the project with the higher, or highest, IRR.

263
Weakness in IRR
However, even when both NPV and IRR criteria use the same formula, there are
profound differences between them. Some of the problems of the IRR are the
followings:
The IRR may not be unique, there could be multiple IRRs, or the IRR may not even
exist. The IRR is, strictly speaking, the root of a mathematical equation. The
equation is based on the time profile of the incremental net cash flows. If the time
profile crosses the horizontal axis from negative to positive only once, the root, or
IRR, will exist, but it may not be positive. However, if the time profile crosses the
axis more than once, there may be more than one root, or there may be no real
roots, only imaginary roots. Although this may sound like more of theoretical
concern, it is certainly disconcerting to know that an investment decision criterion
may not have a solution.
Wrong ordering of mutually exclusive projects, e.g. projects of different scale. The
problem of having to choose between two or more mutually exclusive projects arises
quite frequently. Examples would include two alternative buildings being
considered for the same building site, or a new highway that could run down two
alternative rights of way. Whereas the NPV takes explicit account of the scale of the
project by means of the investment that is required and the initially negative net
cash flows that accompany it, the IRR ignores the differences in scale. The IRR is
expressed as a rate per Kenyan Shillings of investment but does not indicate how
many Kenyan Shillings that rate can earn.
IRRs are not additive. Larger projects will frequently have a number of separable
components. Each of these components should be analysed on its own merits and
then assessed in conjunction with the other components. Since some of the possible
components may be mutually exclusive, those separate combinations have to be
examined as well.
The reason for the problem is that whereas NPVs are additive, IRRs are not. When
the separate projects were analysed, they all had the same scale of investment, but
the combinations increase the scale of investment and, therefore, should not be
ordered according to the IRR criterion. In this case, the larger scale of investment
lowers the IRRs of the combinations and makes them appear less attractive.

264
The Cost Benefit Ratio
As its name indicates, the Benefit–Cost Ratio (BCR), sometimes referred to as the
profitability index, is the ratio of the NPV of the net cash inflows (or economic benefits) to
the NPV of the net cash outflows (or economic costs):
_cos/_
_/_inf =
tseconomicoutflowsNPV
benefitseconomiclowsNPVBCR
The benefit-cost ratio criterion can be stated in the form of a set of decision rules.
• Decision Rule 1: Do not accept any project unless its BCR is greater than one. (Accept
project if BCR > 1; otherwise, reject.) The NPVs in both the numerator and the
denominator of the ratio should be discounted by the opportunity cost of the funds.
The opportunity cost of capital is measured by the cost of funds or the expected rate
of return offered by other assets equivalent in risk to the project being evaluated.
• Decision Rule 2: When a choice must be made between two or more mutually
exclusive projects, investors should select the project with the higher, or highest, BCR.
By using the BCR as a measure of economic desirability, the risk is run of screening out
possible candidate projects according to a faulty criterion. In some instances, worthy
candidates could be eliminated from consideration early on based on their BCRs, and in
so doing the overall NPV could be lowered unnecessarily. Furthermore, as illustrated
below, the NPV criterion and the BCR criterion can often draw the opposite conclusion;
using the two criteria together then becomes a source of confusion, and possibly of
mistakes.
As well, IRR and BCR criteria have weaknesses relative to the NPV criterion that is
recommended by this manual and most textbooks in corporate finance theory.
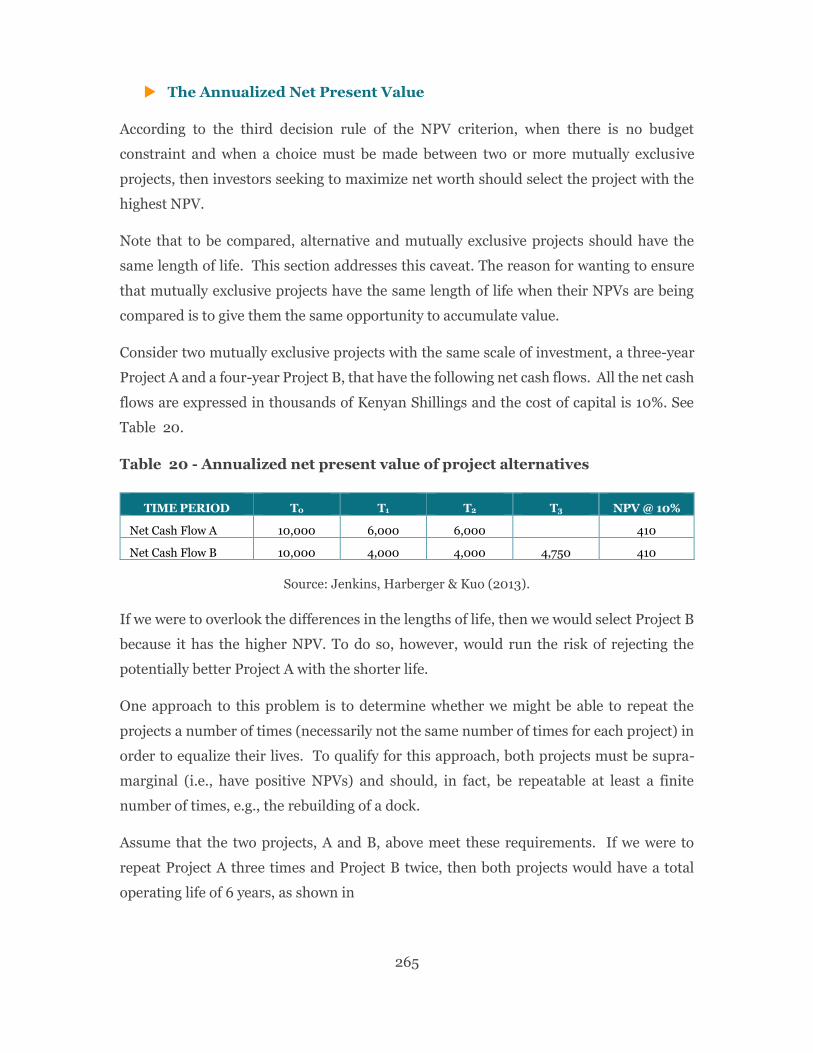
265
The Annualized Net Present Value
According to the third decision rule of the NPV criterion, when there is no budget
constraint and when a choice must be made between two or more mutually exclusive
projects, then investors seeking to maximize net worth should select the project with the
highest NPV.
Note that to be compared, alternative and mutually exclusive projects should have the
same length of life. This section addresses this caveat. The reason for wanting to ensure
that mutually exclusive projects have the same length of life when their NPVs are being
compared is to give them the same opportunity to accumulate value.
Consider two mutually exclusive projects with the same scale of investment, a three-year
Project A and a four-year Project B, that have the following net cash flows. All the net cash
flows are expressed in thousands of Kenyan Shillings and the cost of capital is 10%. See
Table 20.
Table 20 - Annualized net present value of project alternatives
TIME PERIOD T0 T1 T2 T3 NPV @ 10%
Net Cash Flow A 10,000 6,000 6,000 410
Net Cash Flow B 10,000 4,000 4,000 4,750 410
Source: Jenkins, Harberger & Kuo (2013).
If we were to overlook the differences in the lengths of life, then we would select Project B
because it has the higher NPV. To do so, however, would run the risk of rejecting the
potentially better Project A with the shorter life.
One approach to this problem is to determine whether we might be able to repeat the
projects a number of times (necessarily not the same number of times for each project) in
order to equalize their lives. To qualify for this approach, both projects must be supra-
marginal (i.e., have positive NPVs) and should, in fact, be repeatable at least a finite
number of times, e.g., the rebuilding of a dock.
Assume that the two projects, A and B, above meet these requirements. If we were to
repeat Project A three times and Project B twice, then both projects would have a total
operating life of 6 years, as shown in

266
Table 21.

267
Table 21 - Net Present Value for project alternatives - repetitions
TIME PERIOD T0 T1 T2 T3 T4 T5 T6
Project A’s NPV for each repeat
410 410 410 410
Project B’s NPV for each repeat
500 500 500
Source: Jenkins, Harberger & Kuo (2013).
In year t6 both projects can start up again, but there is no need to repeat this procedure.
Given the equal lengths of life for the repeated projects, they can now be compared on the
basis of Decision Rule 3:
𝑵𝑷𝑽 𝒐𝒇 𝑨′𝒔 𝒓𝒆𝒑𝒆𝒂𝒕𝒔 = 𝟒𝟏𝟎 +𝟒𝟏𝟎
(𝟏. 𝟏)𝟐+
𝟒𝟏𝟎
(𝟏. 𝟏)𝟒 = 𝟏, 𝟎𝟐𝟗
Given an equal opportunity to earn economic rents, Project A has a higher overall NPV
and should be considered the more attractive project.
𝑵𝑷𝑽 𝒐𝒇 𝑩′𝒔 𝒓𝒆𝒑𝒆𝒂𝒕𝒔 = 𝟓𝟎𝟎 +𝟓𝟎𝟎
(𝟏. 𝟏)𝟑= 𝟖𝟕𝟔
The approach to rank mutually exclusive projects, with different lives, can be generalized.
The Annualized Net Present Value Criterion (ANPV) is the indicator to be used when the
analysed alternatives produce the same benefits, but have a different useful life, according
to the following equation:
1)r + (1
*)r + (1* =
−t
rtNPVANPV
Where:
NPV is the Net Present Value.
r is the discount rate.

268
t is the evaluation horizon.
The decision rule is to select the alternative that has the highest ANPV.
Using this formula for a reasonable number of repetitions is acceptable.
The Net Present Costs
As it was discussed previously, in some cases he CBA cannot be applied; for example, for
projects where the benefits are difficult to be estimated in monetary terms, or in cases with
different alternatives provides the same (or equal) level of services. In those cases, the Net
Present Costs Criterion (NPC) is the indicator to be used when comparing project
alternatives that have the same benefits and useful life, according to the following
equation:
)r + (1
C =
0 =
n
t ttNPC
Where:
Ct is the economic cost of the project for each period;
r is the discount rate equal to the SDR.
t is the evaluation horizon.
The decision rule is to select the alternative that has the lowest NPC (assuming that
benefits from different alternatives are exactly the same).
The Annualized Net Present Cost
The Annualized Net Present Cost Criterion (ANPC) is the indicator to be used when the
analysed alternatives produce the same benefits, but have a different useful life, according
to the following equation:

269
1)r + (1
*)r + (1* =
−t
rtNPCANPC
Where:
NPC is the present value of costs.
r is the discount rate equal to the SDR.
t is the evaluation horizon.
The decision rule is to select the alternative that has the lowest ANPC.
Cost Per Beneficiaries Criterion
The NPC is applicable in cases where the benefits of the various alternative projects are
equal. However, it often happens that different alternative projects generate unequal
benefits. When this is the case, but the alternatives differ basically in the "amount of
benefits" generated (measured this through a "proxy" variable of benefits), the cost per
beneficiary can be used as a valid criterion for selection of alternative projects. Or, in more
general terms, the cost per "unit of benefit " produced can be used to this end; it means,
the Cost Per Beneficiaries (CPB) Criterion.
To do this, the analyst must calculate the NPC for each project alternative and divide it by
the "benefit " it produces, as measured by a "proxy" variable. Generally, that proxy variable
is the number of beneficiaries.
= sneficiarieNumberofbe
NPCCPB

270
11 FINAL COMMENTS
Standardization and systematization of public investment processes had demonstrated
important advantages in terms of increasing the profitability and productivity of public
investment. Project appraisal allows the identification of policies that maximize social
welfare, the rejection of bad projects and the promotion of those that are good.
In order to ensure that only those capital investments that make efficient use of the scarce
economic resources are undertaken, it is necessary to adopt a set of suitable criteria. A
project appraisal is a key technical tool for decision-making, helping to ensure the efficient
allocation of public resources. In the case of public investment, this aspect is much more
important because its effects in the medium and long term are higher than in the case of
current expenditure. Also, because the rigidities that characterize irreversible decisions,
affecting also successive generations welfare of society.
Economic evaluation tools are essential for making decisions related to the project
selection (to ensure the highest return). Comparing the total costs of a project with its
benefits, using the CBA (or the CEA as a second best), allows deciding if there is a true
contribution of that project to the wealth of the country. The main purpose of CBA/CEA
is to improve decision making—to enable those responsible for decisions to choose
projects with higher net benefits over those with lower net benefits and thereby maximize
the effectiveness of investment.
The existence of a formal set of tools for project appraisal provides a framework to guide
the efforts of government systems (which tend to run projects, which is good!), preventing
the society as a whole from being harmed (which is bad!). The investment appraisal phase
must ensure projects’ economic feasibility and sustainability over time. The utilitarian
approach and applied welfare economics provide a conceptual framework to estimate the
goodness of public policies in terms of social welfare, thus answering the above questions.
To estimate the contribution of the projects, it is then necessary to identify, measure and
assess their costs and benefits. To identify costs and benefits is to determine, qualitatively,
the positive and negative impacts generated by the project.
This manual is a tool to technically guide the process of project formulation and project
evaluation. The project appraisal is a tool for decision-making that allows determining
the suitability for society to invest in different projects when resources are scarce. Usually,

271
this “goodness” is understood from the economic point of view, leading to the prioritizing
of those projects whose expected economic benefits are the highest. In this context,
evaluation tools are essential for making decisions related to the selection of projects to
ensure the highest return. Therefore, and because it is a technical document, the
methodology does not describe the roles and administrative responsibilities for the public
investment process. This description must be part of the rules and procedures of the PIM
System.
In addition, the financial analysis could be decomposed into two parts: (i) carry out
financial analysis to assess financial viability; and (ii) carry out budget/resource analysis
to assess financial affordability and sustainability. The financial analysis from the financial
viability point of view, is important particularly when the decision involves the alternative
to finance the project through a mechanism with the private sector participation (therefore
financial analysis with a perspective of ‘a project’ or ‘a project entity’). On the other side,
the financial analysis from the financial affordability and sustainability´s point of view, is
important to ensure the sufficient resources for the correct operation of the project
(therefore, from budget/resource analysis with a perspective of ‘a government’).
In many cases it is important to develop the financial analysis to derive the economic
(efficiency) prices to conduct the economic analysis. For this reason, it is recommended to
perform both analyses (financial and economic) to provide good information to decision-
making in terms of public investment projects. Finally, it should be noted that the
financial and economic analyses represent a guide for decision makers and
do not represent a decision itself.

272
12 REFERENCES
The structure of these guidelines and the issues addressed in them is influenced by the
review of textbooks and methodological guides from different countries and international
organizations.
• Abdul Latif Jameel Poverty Action Lab (J-PAL) (2018). "Reducing costs to increase
school participation." J-PAL Policy Insights. Last modified February
2019. https://doi.org/10.31485/pi.2264.2018
• Asian Development Bank (2002). Handbook for integrating risk analysis in the
economic analysis of projects.
• Asian Development Bank (2013). Cost-Benefit Analysis for Development. A Practical
Guide. Mandaluyong City, Philippines: Asian Development Bank.
• Asian Development Bank (2017). Guidelines for the economic analysis of projects.
Mandaluyong City, Philippines: Asian Development Bank.
• Atampugre, G. (2014). Cost Benefit Analysis of the adoption of Soil and Water
Conservation methods, Kenya. International Journal of Scientific and Research
Publications, 4(8).
• Australian Governenmet (2005) AusGuideline Activity design. The Logical
Framework Approach.
• Baca Urbina (2013). Evaluación de Proyectos. Séptima edición. McGraw Hill.
• Baum, Warren, C. (1982). The Project Cycle. The World Bank. Washington.
• Baumol, W. (1968). “On the Social Rate of Discount.” American Economic Review
58:788–802.
• Belli, P., Anderson, J., Barnum, H., Dixon, J., Tan, J. (2001). Economic Analysis of
Investment Operations: Analytical Tools and Practical Applications. The World
Bank, Washington D.C.;
• Boardman, A., Greenberg, D., Vining, A., Weimer, D. (2018). Cost Benefit Analysis.
Concepts and Practice. Prentice Hall, Fifth Edition.
• Bonner, R., Das, P. K., Kalra, R., Leathes, B., & Wakeham, N. (2012). Delivering cost
effective and sustainable school infrastructure. TI-UP. org.
• Commonwealth of Australia, Department of Finance and Administration (2006).
Handbook of Cost-Benefit Analysis.

273
• Córdoba, Marcial (2011). Formulación y evaluación de proyectos. Bogotá: Ecoe
Ediciones, 2011.
• Del Bo, C.F., Fiorio, C. V. and Florio, M. (2011) “Shadow wages for the EU regions”,
Fiscal Studies, Vol 32(1), pp. 109-143.
• Dasgupta, P., Sen, A., Marglin, S. – UNIDO (1972). Guidelines for Project Evaluation.
United Nations, New York.
• Debebe, B. (1977). Estimation of the social price of investment and the shadow wage
rate of unskilled labour for the Kenyan economy. Nairobi, Kenya: University of
Nairobi.
• De Rus, G. (2012). Introduction to Cost–Benefit Analysis; Looking for Reasonable
Shortcuts. Edward Elgar Publishing.
• Dhaliwal, I., Duflo, E., Glennerster, R., & Tulloch, C. (2013). Comparative cost-
effectiveness analysis to inform policy in developing countries: a general framework
with applications for education. Education policy in developing countries, 17, 285-
338.
• Diamond, P., and J. Mirrlees (1971a). “Optimal Taxation and Public Production I:
Production Efficiency.” American Economic Review 61:8–27.
• European Community (2008). The CBA Guide.
• European Commission (2014). Guide to Cost Benefit Analysis of Investment
Projects, Directorate General for Regional Policy.
• European Commission (2014). Guide to Cost-Benefit Analysis of Investment
Projects. Economic appraisal tool for Cohesion Policy 2014-2020.
• European Commission Civil Society Fund for Ethiopia (2017). Introduction to
Monitoring and Evaluation Using the Logical Framework Approach.
• Feldstein (1965). The derivation of social time preference rates. Kyklos 18, 277-287.
• Feldstein, Martin (1974). Incidence of a Capital Income Tax in a Growing Economy
with Variable Savings Rates. The Review of Economic Studies. Vol. 41, No. 4 (Oct.,
1974), pp. 505-513.
• Fenichel, E. P., Kotchen, M. J., & Addicott, E. T. (2017). Even the Representative
Agent Must Die: Using Demographics to Inform Long-Term Social Discount Rates.
National Bureau of Economic Research.
• Fong, Monica; Bhushan, Anjana (1996). Toolkit on Gender in Agriculture.
Washington, D.C.: The World Bank, 1996.
• Food and Agriculture Organization (2020). Assessing agroforestry practices and soil
and water conservation for climate change adaptation in Kenya: A cost-benefit
analysis. Rome, Italy: FAO, the United Nations and United Nations Development
Programme.

274
• Gelli, A., Al-Shaiba, N., & Espejo, F. (2009). The costs and cost-efficiency of
providing food through schools in areas of high food insecurity. Food and Nutrition
Bulletin, 30(1), 68-76.
• Ghanbariamin, R. (2015). Estimating the Economic Opportunity Cost of Capital for
Kenya. Gazimağusa, Cyprus: Eastern Mediterranean University.
• Government of Kenya. (2010). Agricultural Sector Development Strategy.
• Guillermo-Peon, S. y Harberger, A. (2012). Measuring The Social Opportunity Cost
of Labor In Mexico. Journal of Benefit-Cost Analysis, Volume 3, Issue 2 2012 Article
1.
• Group 5 Consulting Engineers (2006). “Country Report: Burkina Faso.” In School
Construction Study: A Comparative Analysis of Primary School Construction in
Burkina Faso, Ghana, Mozambique, Uganda, Zambia. Rotterdam, Netherlands:
Group 5 Consulting Engineers.
• Harberger, Arnold (1968). “On Measuring the Social Opportunity Cost of Public
Funds”, in The Discount Rate in Public Investment Evaluation, Report No.17,
Conference Proceedings from the Committee on the Economics of Water Resources
Development of the Western Agricultural Economics Research Council, Denver,
Colorado (December), 1–24.
• Harberger A. (1971a). Three Basic Postulates for Applied Welfare Economics: An
Interpretive Essay. Journal of Economic Literature, 9(3): 785-797. American
Economic Association.
• Harberger, Arnold C. (1971b). “On Measuring the Social Opportunity Cost of Labor”.
International Labor Review, Vol. 103, No. 6. Reprinted in Employment Creation in
Emerging Societies, ed. by Karl Wohlmuth. New York: Praeger Publishers, 1975.
• Harberger, Arnold (1978). On the Use of Distributional Weights in Social Cost-
Benefit Analysis. The Journal of Political Economy. Vol. 86, Issue 2, Part 2: Research
in taxation. The University of Chicago Press.
• Harberger, Arnold (1984). Basic Needs versus Distributional Weights in Social Cost-
Benefit Analysis. Economic Development and Cultural Change. Vol. 32, No. 3 (Apr.,
1984), pp. 455-474. The University of Chicago Press.
• Harberger, A. (1996). The Economic Evaluation of Projects, Papers from a
Curriculum Development Workshop. Economic Development Institute of the World
Bank, The World Bank, Washington, D. C.
• Harberger, Arnold y Glenn Jenkins (1997). Cost-Benefit Analysis. The international
library of critical writings in economics. An Elgar Reference Collection.
Massachusetts.
• Harberger, Arnold C. (2008). “Introduction to Cost-Benefit Analysis, Part II: Labor
Market Issues.” Los Angeles, CA: University of California, December, 2008.

275
• Hirshleifer, J., J.C. DeHaven, and J.W. Milliman (1960). Water Supply: Economics,
Technology, and Policy. Chicago: University of Chicago Press.
• International Monetary Fund (IMF) (2011) “Investing in Public Investment: And
Index of Public Investment Efficiency” WP/11/37 IMF: Washington D.C.
• International Monetary Fund (2015). Making Public Investment more Efficient.
Policy paper. June 2015.
• International Monetary Fund Report (2017). World Economic Outlook. Washington,
DC: IMF.
• Japan International Cooperation Agency. (1991). Feasibility Study on Magwagwa
Hydroelectric Power Development Project. Nairobi, Kenya.
• Jenkins G, Harberger A, Kuo Ch. (2013). Cost-benefit analysis for investment
decisions, the integrated analysis of investment projects. Queen’s University,
Kingston, Canada.
• Jenkins; Glenn; Bahramain, Pejman; Miklyaev, Mikhail (2019). Estimation of the
Economic Opportunity Cost of Labor: An Operational Guide for Mozambique.
Development Discussion Paper: 2019-04.
• Kamau, M., Burger, K. and Giller, K. (2007) “Labour Allocative Efficiency and
Factors Influencing Farm Households Interaction with the Labour Market”, 106th
Seminar, European Association of Agricultural Economists.
• Kim, J.; Fallov, J.; Groom, S. (2020). Public Investment Management Reference
Guide. International Bank for Reconstruction and Development / The World Bank
(www.worldbank.org).
• Kristjansson, E. A., Gelli, A., Welch, V., Greenhalgh, T., Liberato, S., Francis, D., &
Espejo, F. (2016). Costs, and cost-outcome of school feeding programmes and
feeding programmes for young children. Evidence and
recommendations. International Journal of Educational Development, 48, 79-83.
• Kuo, C.Y, Salci, S. & Jenkins G. (2015). Measuring the Foreign Exchange Premium
and the Premium for Non-Tradable Outlays for 20 Countries in Africa, South African
Journal of Economics, Vol. 83:2 June.
• K&M Advisors (2018). Feasibility Study for the Seven Forks 40 MW Solar Power
Plant. Draft final report.
• Lal¸ Deepak and Squire, Lyn (1980). The Little-Mirrlees Shadow Wage Rate: A
Comment on Sjaastad and Wisecarver Source: Journal of Political Economy, Dec.,
1980, Vol. 88, No. 6 (Dec., 1980), pp. 1237- 1241.
• Levin, H. M. (1995). Cost-effectiveness analysis. International encyclopedia of
economics of education, 2, 381-386.

276
• Little, I. M. D., and James A. Mirrlees. 1969. Manual of Industrial Project Analysis,
vol. 11. Paris: OECD Development Centre.
• Little, I. M. D., and James A. Mirrlees (1974). Project Appraisal and Planning.
London: Heinemann.
• Little, I. M. D. and Mirrlees, J. A. (1991). Project Appraisal and Planning Twenty
Years On. In Proceedings of the world bank annual conference on development
economics 1990.
• Mabea, Geoffrey (2014). Forecasting Electricity Demand for Kenya using ECM.
Research Journal of Economic.
• McEwan, P. J. (2012). Cost-effectiveness analysis of education and health
interventions in developing countries. Journal of Development Effectiveness, 4(2),
189-213.
• Marcelo, D. et al (2016). Prioritizing Infrastructure Investment. A Framework for
Government Decision Making.
• Marmot, M., Friel, S., Bell, R., Houweling, T. A., Taylor, S., & Commission on Social
Determinants of Health. (2008). Closing the gap in a generation: health equity
through action on the social determinants of health. The lancet, 372(9650), 1661-
1669.
• Ministry of Agriculture, Livestock and Fisheries (2013). Strategic Plan 2013-2017
(Revised 2015)
• Ministry of Education, Ministry of Health & Ministry of Agriculture, Livestock and
Fisheries (2017). National school meals and nutrition strategy 2017–2022
• Ministry of Education (2018). National education sector strategic plan 2018-2022.
Republic of Kenya
• Mishan, E. (1967). “Criteria for Public Investment: Some Simplifying Suggestions.”
Journal of Political Economy 75:139–46.
• Ng'ang'a, S. K., Notenbaert, A., Mwungu, C. M., Mwongera, C., & Girvetz, E. (2017).
Cost and Benefit Analysis for Climate-Smart Soil practices in Western Kenya.
Kampala, Uganda: International Center for Tropical Agriculture.
• New Zealand Treasury (2005). The Cost Benefit Analysis Primer.
• Olsen, Erica (2011). Strategic Planning. Wiley, ISBN 9781118050569
• Onduru, N. N., & Muchena, F. N. (2011). Cost Benefit Analysis of Land Management
Options in the Upper Tana, Kenya. Wageningen, Netherlands: ISRIC - World Soil
Information.
• Ortegón E, Pacheco J, Roura H. (2005). Metodología general de identificación,
preparación y evaluación de proyectos de inversión pública. Serie de manuales 39.
CEPAL.

277
• Othman, A., & Jenkins, G. P. (2020). Estimation of the rate of return to capital in the
East African Community (EAC) Countries. Applied Economics, 3257-3273.
• Project Management Institute. A Guide to the Project Management Body of
Knowledge (PMBOK Guide) 6th Edition, Newtown Square, PA.
• Project Management Institute “A guide to the Project Management Body of
Knowledge” PMBOK Guide, 6th Edition, (chapter 9 ).
• Project Management Institute “A guide to the Project Management Body of
Knowledge” PMBOK Guide, 6th Edition, (chapter 7).
• Rajaram, A., T. M. Le, N. Biletska, and J. Brumby (2010). “A Diagnostic Framework
for Assessing Public Investment Management.” Policy Research Working Paper
5397, World Bank, Washington, DC.
• Rajaram, A., Le, T. M., Kaiser, K., Kim, J.H., and Frank, J (Eds) (2014). “The Power
of Public Investment Management: Transforming Resources into Assets for
Growth”. World Bank http://dx.doi.org/10.1596/978-1-4648-0316-1.
• Republic of Cyprus (2016). Manual for Pre-Selection and Appraisal of Public
Investment Projects.
• Republic of Ireland, Central Expenditure and Evaluation Unit, Department of Public
Expenditure and Reform (2013). Guide to Economic Appraisal: Carrying Out a Cost
Benefit Analysis, Part D.03 of Public Spending Code.
• Sandmo, A. and J.H. Dreze (1971). “Discount Rates for Public Investment in Closed
and Open Economies”, Economica 38 (November), 395–412.
• Squire, Lyn y Herman G. van der Tak (1975). Economic Analysis of Projects.
Published for the World Bank and The Johns Hopkins University Press.
• Stern N. (1972). Experience with the Use of the Little/Mirrlees Method for an
Appraisal of Small-holder Tea in Kenya. Oxford bulletin of economics and statistics
(0305-9049), 34 (1), pp. 93.
• The Constitution of Kenya, 2010.
• Theunynck, S. (2009). School construction strategies for universal primary
education in Africa: should communities be empowered to build their schools?.
World Bank Publications.
• Theunynck, S. & Rabakoson, H. (2017). Burundi: School construction for Basic
Education. In the context of the Education and Training Sector Plan /
• Plan Sectoriel de Développement de l'Education et la Formation (PSDEF).
Constraints and opportunities - Challenges and options for future. The World Bank
• The United Nations Development Programme (UNDP, 2009). Handbook on
planning, monitoring and evaluating for development results.

278
• UK HM Treasury (2020). The Green Book, Appraisal and Evaluation in Central
Government.
• UK HM Treasury (2020). Public Sector Business Cases Using the Five Case Model:
Green Book Supplementary Guidance.
• UNICEF (2017). Improving Education Participation. Policy and Practice Pointers for
Enrolling All Children and Adolescents in School and Preventing Dropout. UNICEF
Series on Education Participation and Dropout Prevention, Volume 2. Geneva:
UNICEF Regional Office for Central and Eastern Europe and the Commonwealth of
Independent States.
• Valentim, J., & Prado, J. M. (2008). Social Discount Rates.
• Weiss (2015) Notes on the Discount Rate, November 2015, University of Bradford.
• World Bank (2013). Investing to Invest: Strengthening Public Investment
Management. PREM Public Sector Governance Country Clearance Version.
• World Bank (2013). MPI Workshop: Session 1 Methodology for Selecting and
Prioritizing Critical Infrastructure Investments.
• World Bank (2014). TA 7725–VIE: Support for the Preparation and Implementation
of the Results-Based Socioeconomic Development Plan, 2011–2015. Evaluation
Criteria for Public Investment Projects/Programs. Technical Paper, V.5. TA Project
Office, Hanoi.