Embed Size (px)
Citation preview

ECONOMIC PROFILE OF THE LOWERMISSISSIPPI RIVER REGION
INDUSTRIAL ECONOMICS, INCORPORATED2067 MASSACHUSETTS AVENUECAMBRIDGE, MA 02140
January 2004

ACKNOWLEDGEMENTS
This report was prepared by Robert Black, Stephanie Hutchison, and Chris Warshaw ofIndustrial Economics, Incorporated. The research was directed by James Caudill of the U.S.Fish and Wildlife Service’s Division of Economics, Robert Delaney of the U.S. GeologicalSurvey's National Wetlands Research Center, and Ron Nassar, Coordinator of the LowerMississippi River Conservation Committee.1
The following individuals and organizations provided valuable review and comment onthe draft study: Bruce Reid (Audubon Mississippi); Doug Daigle (Mississippi River BasinAlliance); James Wanamaker (Mississippi Levee Commissioners); Rayford Wilbanks (U.S. ArmyCorps of Engineers); Erwin Roemer (U.S. Army Corps of Engineers); Roy Crabtree (NationalMarine Fisheries Service); Barbara Keeler (U.S. Environmental Protection Agency); DavidWalther (U.S. Fish and Wildlife Service); Donald McCrory (Memphis Shelby County PortCommission); George Grugett (Mississippi Valley Flood Control Association); Bob Gramling(University of Lousiana); R. Glenn Thomas (Louisiana Department of Wildlife and Fisheries);Ken Wells (The American Waterways Operators); and Gary Christoff (Missouri Department ofConservation).
Finally, we wish to thank the individuals who provided data for this study. A completelisting of these individuals and their organizations can be found in Appendix C to this report.
1 The Lower Mississippi River Conservation Committee is comprised of two Governor-
appointed representatives from the natural resource management agencies in the states ofArkansas, Kentucky, Louisiana, Mississippi, Missouri, and Tennessee.

Table of Contents
EXECUTIVE SUMMARY
INTRODUCTION AND SUMMARY OF RESULTS...........................................CHAPTER 1
Purpose............................................................................................................................. 1-1LMR Study Area.............................................................................................................. 1-1LMR Economic Sectors................................................................................................... 1-2Methodology and Data Sources ....................................................................................... 1-6Summary Economic Profile............................................................................................. 1-7Report Structure ............................................................................................................... 1-9
COMMERCIAL HARVEST OF NATURAL RESOURCES ..............................CHAPTER 2
Data Sources and Methodology....................................................................................... 2-1Forest Harvest .................................................................................................................. 2-2
Annual Timber Harvest........................................................................................ 2-3Forestry Revenue and Employment..................................................................... 2-6Trends .................................................................................................................. 2-6
Commercial Fishing......................................................................................................... 2-7Saltwater Commercial Fish Harvest .................................................................... 2-7Freshwater Commercial Fish Harvest.................................................................. 2-9Commercial Fishing Employment in the LMR Corridor................................... 2-10Trends ................................................................................................................ 2-10
Trapping and Alligator Hunting..................................................................................... 2-11Number of Animals Trapped and Economic Value........................................... 2-12
Summary ........................................................................................................................ 2-14
OUTDOOR RECREATION AND ITS ROLEIN THE REGIONAL ECONOMY..........................................................................CHAPTER 3
Data Sources and Methodology....................................................................................... 3-1Overview of Recreation in the Lower Mississippi River Corridor.................................. 3-2
Outdoor Recreational Activities .......................................................................... 3-2Recreational Resources........................................................................................ 3-4
Recreational Expenditures in theLower Mississippi River Corridor ................................................................................... 3-6
Levels of Recreational Activity ........................................................................... 3-6Estimation of Expenditures and Associated Employment................................... 3-8Support of Recreational Activity Beyond the Corridor ..................................... 3-10Caveats and Uncertainties.................................................................................. 3-11
Trends in Recreational Activity ..................................................................................... 3-12

2
Table of Contents (continued)
TOURISM AND CULTURAL/HISTORICAL RESOURCES ............................CHAPTER 4
Data Sources and Methodology....................................................................................... 4-1Tourism in the Lower Mississippi River Corridor........................................................... 4-2
Brief History of the Lower Mississippi River Corridor....................................... 4-2Cultural Resources of the Lower Mississippi River Corridor ............................. 4-6National Natural Landmarks.............................................................................. 4-10
Travel Expenditures andTravel-Generated Employment in the LMR Corridor ................................................... 4-11Trends ............................................................................................................................ 4-13
WATER SUPPLY.....................................................................................................CHAPTER 5
Data Sources and Methodology....................................................................................... 5-1Overview of Water Supply and Water Users................................................................... 5-2
Public Surface Water Supply System .................................................................. 5-2Self-Supplied Surface Water................................................................................ 5-4
Revenues and Employment in the Water Supply Sector ................................................. 5-5
AGRICULTURE.......................................................................................................CHAPTER 6
Data Sources and Methodology....................................................................................... 6-2Overview of the LMR Corridor’s Agricultural Sector .................................................... 6-3
Soybeans .............................................................................................................. 6-4Cotton................................................................................................................... 6-5
Revenue and Employment in the Agricultural Sector ..................................................... 6-6Aquaculture...................................................................................................................... 6-9Trends ............................................................................................................................ 6-11
Soybeans ............................................................................................................ 6-12Cotton................................................................................................................. 6-14
MINERAL RESOURCES........................................................................................CHAPTER 7
Data Sources and Methodology....................................................................................... 7-1Overview of Major Mineral Resource Industries ............................................................ 7-2
Oil and Gas .......................................................................................................... 7-2Salt ....................................................................................................................... 7-3Other Minerals ..................................................................................................... 7-6
Mineral Resource Revenues and Employment ................................................................ 7-8Oil and Gas Industry ............................................................................................ 7-8Remaining Minerals Industry .............................................................................. 7-8
Trends ............................................................................................................................ 7-10

3
Table of Contents (continued)
ENERGY PRODUCTION .......................................................................................CHAPTER 8
Data Sources and Methodology....................................................................................... 8-2Overview of Power Plants ............................................................................................... 8-2Power Generation and Capacity....................................................................................... 8-4Revenue and Employment ............................................................................................... 8-7Trends .............................................................................................................................. 8-7
COMMERCIAL NAVIGATION............................................................................CHAPTER 9
Data Sources and Methodology....................................................................................... 9-1Development of the LMR for Commercial Navigation................................................... 9-2
Evolution of the LMR as a Navigable Waterway................................................ 9-2Current State of Commercial Navigation on the LMR........................................ 9-3
Shipments on the Mississippi River System.................................................................... 9-4LMR Waterway Transportation Industry:Revenue and Employment ............................................................................................... 9-6Trends .............................................................................................................................. 9-7
MANUFACTURING..............................................................................................CHAPTER 10
Data Sources and Methodology..................................................................................... 10-1Manufacturing Revenue and Employment .................................................................... 10-2Major Manufacturing Activities in the LMR Corridor .................................................. 10-2
Chemicals and Allied Products.......................................................................... 10-2Food and Kindred Products ............................................................................... 10-5Petroleum Refining and Related Industries ....................................................... 10-5Other Significant Manufacturers........................................................................ 10-6
Manufacturers’ Use of the LMR.................................................................................... 10-7Trends ............................................................................................................................ 10-8
NATURAL RESOURCE SERVICES NOTDIRECTLY REFLECTED IN THE COMMERCIAL ECONOMY.................CHAPTER 11
Wastewater Treatment ................................................................................................... 11-1Wetland Services ........................................................................................................... 11-2Wildlife Habitat ............................................................................................................. 11-5
Fish Species and Habitat.................................................................................... 11-6Bird Species and Habitat.................................................................................... 11-7Habitat Protection Efforts .................................................................................. 11-8

4
Table of Contents (continued)
APPENDIX A: COUNTIES IN THE LMR CORRIDORAPPENDIX B: IMPLAN MODEL AND DATAAPPENDIX C: INDIVIDUALS AND ORGANIZATIONS CONTACTED FOR
INFORMATIONAPPENDIX D: REFERENCESAPPENDIX E: DRAFT REPORT CIRCULATION LISTAPPENDIX F: COMBINED ECONOMIC ACTIVITY IN UPPER AND LOWER
MISSISSIPPI RIVER REGIONS

ES-1
EXECUTIVE SUMMARY
Throughout U.S. history, the Mississippi River has occupied a central place in commerce.In the 18th and 19th centuries, agriculture flourished in the Mississippi Delta and New Orleanswas established as a hub of international trade. Today, the river continues to serve as a pillar inthe U.S. economy. Individuals and businesses have come to rely on the Mississippi fortransportation, water, food, recreation, and a variety of other goods and services. As a result, theregional economies surrounding the river, as well as the national economy, benefit from carefulconservation and management of the Mississippi.
The purpose of this study is to develop a profile of the regional economic activitydependent upon the Lower Mississippi River (LMR), the portion of the Mississippi flowing fromsouthern Illinois to the Gulf of Mexico. The study area is roughly defined to include theMississippi River Valley and Deltaic Plain. The profile provides a “snapshot” of economicactivity in the LMR region today, and discusses past and future trends. The ultimate objective ofthis report is to help government agencies, legislative bodies, private organizations, andindividual citizens understand the overall economic significance of the LMR and the relativesignificance of key economic sectors, providing an information source for future rivermanagement decisions.
The profile focuses oneconomic activity in the 113-county corridor surrounding theLMR, organizing the discussionbased on ten key economicsectors:
• Commercial Harvest ofNatural Resources
• Outdoor Recreation• Tourism and Cultural/
Historical Resources• Water Supply• Agriculture and
Aquaculture• Mineral Resources• Energy Production• Commercial Navigation• Manufacturing• Natural Resource Services
not Reflected in theCommercial Economy
COUNTIES INCLUDED IN THELMR ECONOMIC PROFILE

ES-2
These sectors are connected with the river in a variety of ways. For instance, some sectorsharvest natural resources (e.g., fish) from the river while others use LMR water for irrigation,cooling, or manufacturing. Many sectors rely on the river for transport of goods (e.g., oil, grain).In addition, sectors such as tourism and outdoor recreation benefit from the aesthetic beauty ofthe river and the habitat it provides for sportfish, waterfowl, and wildlife.
When possible, each sector is characterized in terms of revenue (or expenditures in thecase of recreation and tourism) and employment.1 While these measures are imperfect indicatorsof the significance of a given industry or activity, they do provide common metrics by which thesectors can be compared. Considered together, the ten economic sectors account for about $128billion in revenue to corridor businesses. Approximately 770,000 jobs are associated with thiseconomic output. This revenue and employment reflects direct output from corridor businessesand does not include multiplier effects.
Key findings for individual economic sectors include the following:
• Commercial Harvest of Natural Resources: Resources harvested in and aroundthe LMR include timber, finfish, shellfish, pelts, and alligator hides. Availabledata suggest revenues of roughly $436 million each year, with saltwater fishlandings and forestry each accounting for over $150 million.
• Outdoor Recreation: Anglers, hunters, and wildlife viewers take over 30 milliontrips in the LMR region each year, spending approximately $790 million andsupporting thousands of jobs. State parks and National Wildlife Refuges are keyrecreational resources, although many hunters and other recreationalists leaseprivate land. The effects of resource management in the LMR corridor are feltnationwide; for instance, habitat management to meet the needs of winteringwaterfowl populations breeding in a large part of the mid-continent contribute tohunting opportunities in the northern portions of the Mississippi flyway.
• Tourism and Cultural/Historical Resources: Tourism is the largest non-manufacturing sector examined in this economic profile. Tourists visiting theLMR corridor spend over $13 billion each year, supporting over 180,000 jobs inthe regional economy. Major attractions include cultural and historical sites,riverboat tours and gaming, and riverfront festivals.
• Water Supply: Water users in the corridor use nearly 11 billion gallons of surfacewater each day, with energy and manufacturing operations accounting for thegreatest withdrawals. Although some cities rely on surface water for domesticuse, most household water is supplied from subsurface withdrawals. Revenue and
1 Note that this study examines the economic significance of different sectors, and
therefore focuses on revenue, employment, and other practical measures of significance. We donot address issues of net economic value or changes in social welfare, i.e., measures of economicbenefits minus the cost of producing those benefits.

ES-3
employment in the public water supply sector is a minor component of thecorridor economy.
• Agriculture and Aquaculture: Agriculture dominates land use in the corridor,with soybeans, cotton, rice, sugar cane, catfish, and livestock representing majorproducts. In total, agriculture produces revenues of over $6.8 billion each year,employing over 100,000 individuals.
• Mineral Resources: Extraction of fuel and non-fuel minerals generates nearly $9billion in revenues annually and employs approximately 41,000 people. Most ofthis economic activity is concentrated in Louisiana’s oil and natural gasindustries.
• Energy Production: Over 100 power plants in the corridor supply electricity toindustrial, commercial and residential users. Fossil fuels such as natural gas andcoal are the dominant power sources in the region. The sector has annualrevenues of over $4.7 billion and employs over 11,000 individuals.
• Commercial Navigation: The waterway transport industry provides a cost-effective means of transporting goods to and from a variety of other sectors. Inall, over 470 million tons of commodities were shipped on the LMR in 2001,generating approximately $6 billion in revenue and 29,000 jobs. Food andpetroleum products account for the largest share of good shipped.
• Manufacturing: Major manufacturing industries in the LMR corridor includechemical manufacturing, petroleum refining, and food processing. Overall, thesector generates about $87 billion in output and employs roughly 383,000individuals.
• Natural Resource Services not Reflected in the Commercial Economy: The riverprovides many services that may not be directly reflected in the commercialeconomy, including the following.
♦ Wastewater Treatment: Roughly 1,800 facilities discharge wastewater to theLMR and its tributaries in the corridor. These facilities include manufacturingoperations as well as municipal sewage treatment plants.
♦ Wetland Services: Millions of acres of wetlands in the corridor providenatural and cost-effective flood control, water quality protection, and otherservices. Major wetland resources include forested wetlands in theMississippi River Alluvial Plain and coastal wetlands in Louisiana.

ES-4
♦ Wildlife Habitat: Distinct from their human-centered uses, wetlands, forests,and other environments in the corridor support a diverse array of wildlife.Abundant, as well as endangered species of fish, birds, waterfowl, andmammals rely on these resources. The value of these species is reflected inthe numerous ongoing efforts to protect and restore wildlife habitat in theLMR region.

ES-5
SUMMARY OF ECONOMIC SIGNIFICANCE OF LMR SECTORSBASED ON ACTIVITY IN THE LMR CORRIDOR COUNTIES
SectorRevenue
(millions $2001)Employment
(number of jobs) Key Features and TrendsHarvest of NaturalResources
$436 6,500 • Primary products harvested include finfish, shellfish, timber, and animal hides.• Recent growth in forestry with long-term declines in finfish harvest and trapping.
Outdoor Recreation $791 9,000 - 18,000 • Analyzed expenditures include fishing, hunting, and wildlife viewing; other activities may besignificant as well.
• LMR affects recreational activity beyond its banks (e.g., waterfowl hunting); expenditures outsideof the corridor are significant.
Tourism $13,500 183,000 • Rich historical, musical, and ethnic heritage attracts visitors.• Riverboat tours and gaming are major attractions; gaming is major growth area.• Traveler expenditures influence numerous businesses such as hotels, restaurants, and car rentals.
Water Supply $51 470 • Some cities rely on surface water supplies, including New Orleans.• Extensive use of self-supplied surface water in utilities and manufacturing.
Agriculture andAquaculture
$6,800 103,000 • Agriculture is dominant land use in study area.• Major products include soybeans, cotton, rice, sugarcane, farm-raised catfish, and livestock.
Mineral Resources $9,000 41,000 • Dominated by oil and gas production, centered in Louisiana.• Other products include salt, sand, and gravel.• Long-term oil production declines; anticipated growth in natural gas production.
Energy $4,700 11,200 • Power plants (primarily fossil fuel) in corridor supply 15,100 megawatts of power annually.• Extensive use of LMR water for cooling.
Navigation $6,000 29,000 • Agriculture, manufacturing, and other sectors depend on navigation for cost-effective transport ofgoods.
• In total, roughly 473 million tons of cargo shipped on the LMR each year.Manufacturing $87,000 383,000 • Largest single sector, although actually composed of numerous diverse industries; the largest of
these include chemicals, petroleum refining, and food processing.• Slow growth in chemicals and refining; greater growth in food and beverage industries.
Natural ResourceServices
N/A N/A • Economic services not reflected in the commercial economy include treatment of wastewater,wetland services, and provision of wildlife habitat.
• Forested and coastal wetland resources are of national significance.TOTAL ~$128,000 ~771,000

1-1
INTRODUCTION AND SUMMARY OF RESULTS CHAPTER 1______________________________________________________________________________
PURPOSE
Throughout U.S. history, the Mississippi River has occupied a central place in commerce.In the 18th and 19th centuries, agriculture flourished in the Mississippi Delta and New Orleanswas established as a hub of international trade. Today, the river continues to serve as a pillar inthe U.S. economy. Individuals and businesses have come to rely on the Mississippi fortransportation, water, food, recreation, and a variety of other goods and services. As a result, theregional economies surrounding the river, as well as the national economy, benefit from carefulconservation and management of the Mississippi.
The purpose of this study is to develop a profile of the regional economic activitydependent upon the Lower Mississippi River (LMR), the portion of the Mississippi flowing fromsouthern Illinois to the Gulf of Mexico. The profile provides a “snapshot” of economic activityin the LMR region today, and discusses past and future trends. The ultimate objective of thisreport is to help government agencies, legislative bodies, private organizations, and individualcitizens understand the overall economic significance of the LMR and the relative significanceof key economic sectors, providing an information source for future river managementdecisions.1
LMR STUDY AREA
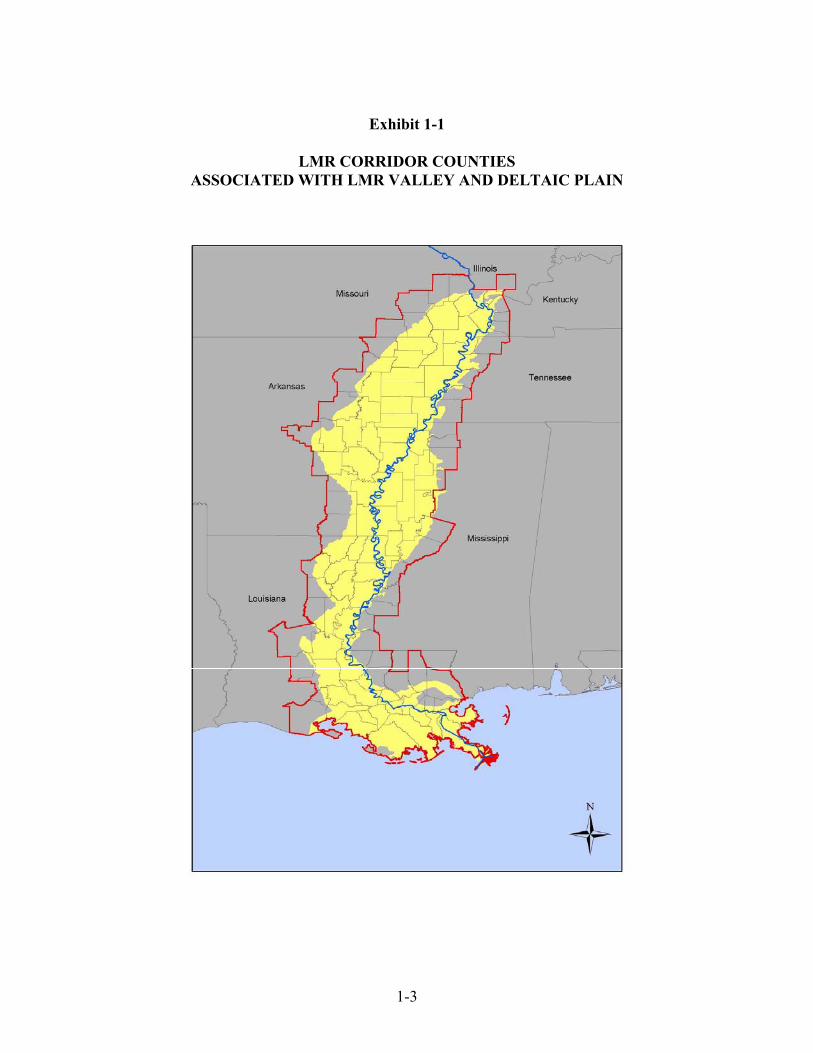
For the purposes of this study, the LMR is defined as the main stem of the Mississippi,extending from its confluence with the Ohio River (river mile 954 at Cairo, Illinois) to the Gulfof Mexico. This stretch of the river borders on seven states: Illinois, Missouri, Kentucky,Tennessee, Arkansas, Mississippi, and Louisiana. The analysis focuses on economic activity in113 counties and parishes associated with the LMR Valley, Floodplain, and Deltaic Plain; forsimplicity, this report refers to the region as the LMR “corridor.”2 Exhibit 1-1 presents a map of
1 The general method and structure of this study are modeled upon the 1999 reportentitled Economic Profile of the Upper Mississippi River Region, prepared by IndustrialEconomics, Incorporated for the U.S. Fish and Wildlife Service Division of Economics.
2 The study area boundaries were established in coordination with staff at the U.S.Geological Survey and the U.S. Fish and Wildlife Service.

1-2
the corridor counties. As shown, counties in Arkansas, Mississippi, and Louisiana dominate thestudy area, while relatively small portions of Illinois, Kentucky, Tennessee, and Missouri areincluded. In total, the corridor is approximately 71,000 square miles with a population ofroughly 6.5 million people. Appendix A to this report lists the 113 corridor counties.
The majority of the land in the LMR corridor is used for agriculture. The Delta region isa major producer of soybeans, cotton, grains, sugarcane, and catfish. Much of the present-dayagricultural land was created by clearing forests and draining wetlands throughout the Delta. Aswe discuss later in this report, conservation and reforestation efforts introduced in recent yearsseek to return less productive agricultural land to its original ecological condition. Most of theremainder of the corridor is forested, while portions, particularly in southern Louisiana, areurbanized (e.g., Baton Rouge, New Orleans). Urbanized areas reflect the increasingdiversification and modernization of the corridor, where oil and gas extraction and associatedmanufacturing industries have grown in the post-war era.
LMR ECONOMIC SECTORS
We develop an economic profile of the region by characterizing individual economicsectors that rely on the river. Exhibit 1-2 summarizes the rationale for the sectors included in theeconomic profile. As shown, each of the ten sectors either relies on the river for transportation,water, other natural resources, or socioeconomic services such as support of recreational activity.
It is noteworthy that these sectors vary in terms of the intensity of the economicrelationship to, or level of dependence on, the river. For example, harvesting of naturalresources represents a sector directly and explicitly dependent upon the river (e.g., without theriver, some commercial fishing would not exist). Other sectors have a more indirect connectionto the river. For example, while agricultural producers depend on the river for transport ofproducts, agriculture would likely exist without the river, although other (probably more costly)modes of transport would be needed to bring goods to market. As we examine the economicsignificance of the various sectors, it is important to bear in mind how the river influences andsupports the economic activity in question.
Looking beyond these general categories of reliance, the interactions between theeconomic sectors are diverse and complex. The sectors interact in the commercial economy,purchasing inputs and services from one another. Exhibit 1-3 illustrates this set of linkages,highlighting some of the major points of interaction. For example, a large share of the cropsgrown in the agricultural sector are shipped through the commercial navigation system, often tofood processors and other manufacturers in the region. Overall, because river-based shipping iscost-effective relative to other transportation alternatives, it lowers the cost of production formany industries and allows them to thrive in the region.
1-3
Exhibit 1-1
LMR CORRIDOR COUNTIESASSOCIATED WITH LMR VALLEY AND DELTAIC PLAIN

1-4
Exhibit 1-2
ECONOMIC SECTORS AND THEIR RELIANCE ON THE LMR
Sector Definition
Rely on LMR forTransportation of
Inputs and ProductsUse Water from
the LMR
Harvest GoodsDirectly from
LMR
SocioeconomicReliance on
LMR ServicesHarvest of NaturalResources
Commercial harvest of fish, timber, andanimals
Outdoor Recreation Outdoor recreational activity pursued in theLMR region (e.g., hunting, fishing)
Tourism and CulturalResources
Sightseeing, gaming, travel, and otherenjoyment of cultural and historical sites
Water Supply Facilities supplying water for domestic,commercial, and industrial use
Agriculture Crop, livestock, and aquaculture operations inthe LMR study area
Mineral Resources Oil and gas extraction; mining of salt, stone,etc.
Energy Electrical power generation facilitiesCommercial Navigation Inland waterway towing industryManufacturing Manufacturing of primary and finished goodsNatural ResourceServices
Other river-related services not reflected inthe commercial economy, including wetlandservices (e.g., flood control), wastewatertreatment, and wildlife habitat.

1-5
Exhibit 1-3
MAJOR INTERACTIONS BETWEEN LMR SECTORS
OutdoorRecreation Tourism
WaterSupply Agriculture
MineralResources Energy Navigation
Manu-facturing
NaturalResourceServices
Harvest ofNaturalResources
Reforestationof marginalagriculturalland
Timber wastefires biomassenergyfacilities
Barge-basedtimbershipments
Processing oftimber andseafood
Habitat for fishand furbearers
OutdoorRecreation
Visitors mayenjoy bothculturalattractions andoutdoorrecreation
Hotels andrestaurantsare majorwater users
Hunting onagriculturallands
Habitat forrecreationalspecies
Tourism Riverboatcasinos
Natural/outdoortourist attractions
WaterSupply
Irrigationwater
Cooling waterfor powerplants
Process water formanufacturingfacilities
Agriculture Crop wastefires biomassenergyfacilities
Shipment ofagriculturalproducts
Processing ofsoybeans andother crops
Production anduse ofagriculturalchemicals
Historicaldeforestation toclear farm land
Recent wetlandconservation andreforestation onfarm land
MineralResources
Natural gas-fired energyfacilities
Shipment ofoil and othermineralproducts
Petroleumrefining
Use of mineralsin chemicalmanufacturing
Energy Shipment ofcoal to powerplants
Power supply tomanufacturingfacilities
Navigation Ship intermediateand finishedgoods
Navigationimprovements canharm wetlands
Manu-facturing
Wastewaterdischarge to LMR

1-6
Likewise, the linkages between commercial activity, recreational activity, and ecologicalquality are significant. The sectors addressed in this report not only derive value from the river,but in turn influence the quality of the river. For example, pollution from agricultural runoffaffects the quality of water in the LMR. Often, the sectors compete for the river and itsresources. For example, navigation improvements may affect the quality of fish and wildlifehabitat, in turn affecting recreational and commercial fishing activity. Information on theeconomic significance of key sectors can support river management decisions, facilitatingbalanced and economically beneficial treatment of the different sectors.
METHODOLOGY AND DATA SOURCES
The economic profile presents a snapshot of current economic activity in the LMR studyarea. For each sector, we present unique, sector-specific indicators of activity, such as oilproduction, crop harvests, and fish landings. When feasible, we also present standardizedmeasures of economic activity common to all sectors, including revenue, employment, and wateruse. Note that this study examines the economic significance of different sectors as measured bytangible, practical indicators such as revenue and employment. While these measures allow arelative comparison of how different sectors influence the commercial economy, they do notreflect economic value, as it is typically defined by economists. A study of net economic valuewould entail estimating consumer and producer surplus associated with each industry, whereconsumer surplus is the utility that consumers enjoy net of the price they pay for a good andproducer surplus is the net income that producers realize beyond their production costs. Such astudy would entail significantly more complex and costly methods than those applied here.
As directed, this study relies exclusively on existing reports and data bases to develop theeconomic profile. First, for output and employment figures in several sectors, we rely oncounty-level economic databases. Most significantly, we draw data from the IMPLAN regionaleconomic modeling system. IMPLAN is a modeling program that public and private-sectorplanners use to estimate how changes in specific industries affect regional economies. One ofthe components of the model is a county-level database that includes industry output (the valueof production), employment, and other economic data. The data are drawn or estimated fromdata gathered in surveys conducted by the U.S. Census Bureau and Bureau of Labor Statistics.We compile the output and employment data for relevant economic sectors; however, we do notuse the IMPLAN model to estimate indirect effects on related sectors in the region. Appendix Bof this report reviews the IMPLAN model and the county-level database in more detail.
Other components of this analysis are based on regional economic data sets and otherdatabases relevant to specific economic sectors and geographic regions. In some instances, wedraw LMR-specific data from national data sets. For example, agriculture revenue andemployment estimates are derived from the U.S. Department of Agriculture’s Census ofAgriculture. Other key data are taken from state reports and data sets, including tourismexpenditures, outdoor recreation licenses, and oil and gas production.

1-7
In addition, existing reports by government agencies and conservation organizationsprovided a qualitative foundation for discussing the history, culture, and natural resources of theLMR region. For instance, the National Park Service’s Draft Heritage Study and EnvironmentalAssessment – Lower Mississippi River Region, provided a broad perspective on the economy andecology of the area.
Finally, we gathered much of the information for this report from experts in stategovernment, federal agencies, and non-profit research organizations. Appendix C provides alisting of all individuals contacted.
The Methodology and Data Sources section at the beginning of each chapter reviewssources important to each sector.
SUMMARY ECONOMIC PROFILE
We focus on revenue and employment as the primary indicators of economic activityacross the sectors. Considered together, the river-related sectors examined here account forabout $128 billion in revenue to businesses in the 113-county LMR corridor.3 Approximately771,000 jobs are associated with this economic activity. This economic output represents about54 percent of the total output in the corridor counties.
Comparison of the importance of different sectors requires a close look at the availabledata as well as the nature of the sectors and their reliance on the LMR. Exhibit 1-4 shows thatmanufacturing is by far the largest sector, with about $87 billion in revenues and 383,000 jobs.Manufacturing is, however, a highly diverse sector, ranging from food processing to chemicalproduction, making it somewhat less comparable to the other sectors that generally focus on oneactivity or industry.
Because manufacturing accounts for so much revenue and employment in the region, aclearer comparison of the remaining sectors is possible when manufacturing is temporarilyremoved from consideration. Exhibit 1-5 shows the relative importance of the remaining sectorsbased on revenue and employment. As shown, expenditure data suggest that the tourism sectoris a major component of economic activity in the region. Agriculture, mineral resources(primarily oil and gas), power generation, and water-based navigation represent other majorcontributors to the economy. The comparison is similar when we consider employment patterns,although labor-intensive sectors such as tourism increase in significance while capital-intensivesectors such as mineral resources decrease in significance.
3 To adjust for inflation and allow consistent comparison, revenue and other dollar
figures in this report have been converted to 2001 dollars using the Gross Domestic Product(GDP) deflator as reported in the 2002 Economic Report of the President.

1-8
Exhibit 1-4
SUMMARY OF ECONOMIC SIGNIFICANCE OF LMR SECTORSBASED ON ACTIVITY IN THE LMR CORRIDOR COUNTIES
SectorRevenue
(millions $2001)Employment
(number of jobs) Key Features and TrendsHarvest of NaturalResources
$436 6,500 • Primary products harvested include finfish, shellfish, timber, and animal hides.• Recent growth in forestry with long-term declines in finfish harvest and trapping.
Outdoor Recreation $791 9,000 - 18,000 • Analyzed expenditures include fishing, hunting, and wildlife viewing; other activities may besignificant as well.
• LMR affects recreational activity beyond its banks (e.g., waterfowl hunting); expenditures outsideof the corridor are significant.
Tourism $13,500 183,000 • Rich historical, musical, and ethnic heritage attracts visitors.• Riverboat tours and gaming are major attractions; gaming is major growth area.• Traveler expenditures influence numerous businesses such as hotels, restaurants, and car rentals.
Water Supply $51 470 • Some cities rely on surface water supplies, including New Orleans.• Extensive use of self-supplied surface water in utilities and manufacturing.
Agriculture andAquaculture
$6,800 103,000 • Agriculture is dominant land use in study area.• Major products include soybeans, cotton, rice, sugarcane, farm-raised catfish, and livestock.
Mineral Resources $9,000 41,000 • Dominated by oil and gas production, centered in Louisiana.• Other products include salt, sand, and gravel.• Long-term oil production declines; anticipated growth in natural gas production.
Energy $4,700 11,200 • Power plants (primarily fossil fuel) in corridor supply 15,100 megawatts of power annually.• Extensive use of LMR water for cooling.
Navigation $6,000 29,000 • Agriculture, manufacturing, and other sectors depend on navigation for cost-effective transport ofgoods.
• In total, roughly 473 million tons of cargo shipped on the LMR each year.Manufacturing $87,000 383,000 • Largest single sector, although actually composed of numerous diverse industries; the largest of
these include chemicals, petroleum refining, and food processing.• Slow growth in chemicals and refining; greater growth in food and beverage industries.
Natural ResourceServices
N/A N/A • Economic services not reflected in the commercial economy include treatment of wastewater,wetland services, and provision of wildlife habitat.
• Forested and coastal wetland resources are of national significance.TOTAL ~$128,000 ~771,000

1-9
Exhibit 1-5
RELATIVE ECONOMIC SIGNIFICANCE OF SECTORS (EXCLUDES MANUFACTURING)
REVENUE EMPLOYMENT
The remaining sectors -- recreation, water supply, and harvest of natural resources -- areless significant from the standpoint of revenue and employment. However, it is important tonote that these sectors are more directly dependent on the water and ecological quality of theLMR. For example, recreational anglers and boaters may be discouraged from participating inthese activities if water quality is poor. Likewise, withdrawal of water and harvest of otherresources (e.g., fish) are possible only if water quality and general ecological quality aremaintained. Because these sectors are highly sensitive to the quality of the LMR ecosystem,they warrant close consideration when weighing management options that affect the quality andphysical structure of the LMR.
REPORT STRUCTURE
The remainder of this report consists of individual chapters for each of the economicsectors under consideration. Each chapter begins with a summary of major findings regardingthe economic significance of the sector. We then describe data sources used to develop the
Outdoor Recreation
2%
Harvest of Natural Resources
1%
Tourism33%
Water Supply<1%
Energy11%
Navigation15%
Mineral Resources22% Agriculture and
Aquaculture16%
Outdoor Recreation
3%
Harvest of Natural Resources
2%
Tourism47%
Water Supply<1%
Energy3%
Navigation7%
Mineral Resources11%
Agriculture and Aquaculture
27%

1-10
economic profile, present the profile information, and discuss past and expected future trends inthe sector. We present the sectors in the following order:
• Chapter 2 – Commercial Harvest of Natural Resources
• Chapter 3 – Outdoor Recreation
• Chapter 4 – Tourism and Cultural/Historical Resources
• Chapter 5 – Water Supply
• Chapter 6 – Agriculture and Aquaculture
• Chapter 7 – Mineral Resources
• Chapter 8 – Energy Production
• Chapter 9 – Commercial Navigation
• Chapter 10 – Manufacturing
• Chapter 11 – Natural Resource Services not Directly Reflected in theCommercial Economy

2-1
COMMERCIAL HARVEST OF NATURAL RESOURCES CHAPTER 2_____________________________________________________________________________________________
The LMR corridor’s diverse ecological environments support a variety of naturalresources that are harvested for commercial purposes. The three primary commercial harvestactivities in the corridor are timber harvesting, commercial fishing, and trapping:1
• More than 520 million cubic feet of timber were harvested in the corridorin 2002.
• Freshwater and marine fisheries in the corridor support one of the largestcommercial fishing industries in the country. Louisiana leads the nation inshrimp landings, with more than 62 million pounds of landings. Overall,more than 517 million pounds of fish were landed in the corridor in 2002.
• LMR wildlife provide a variety of fur and other products. In 2002, morethan 40,500 fur pelts and 185,000 alligator skins were harvested in thecorridor.
This chapter profiles each of these activities, providing information on harvest size,economic value, and likely future trends. In all, these activities had a total economic value ofapproximately $436 million in 2002.
DATA SOURCES AND METHODOLOGY
Data on commercial harvests were provided by the National Marine Fisheries Service,the U.S. Forest Service, the U.S. Fish and Wildlife Service, and state agencies. Key data sourcesinclude:
• Commercial Forest Harvest Data: We obtained information on timberharvesting from the U.S. Forest Service and state agencies. Additionalqualitative information on historical trends was obtained from a variety ofInternet sources, including the Delta Land Trust and the National ParkService’s Draft Heritage Study. Revenue and employment data are basedon state severance tax data and IMPLAN.
1 Information on mineral resources, agriculture, and non-commercial services provided
by natural resources is presented in other chapters.

2-2
• Commercial Fishing Data: We obtained data on saltwater commercialfishing from the National Marine Fisheries Service and the LouisianaAgricultural Center. Data on freshwater commercial fishing wereobtained from state agencies.
• Trapping Data: We obtained quantitative trapping data from stateagencies and the Louisiana Agricultural Center. Additional qualitativeinformation was obtained from a variety of Internet sources.
FOREST HARVEST
Forests in the LMR corridor have been heavily harvested since the early 19th century. Avariety of factors have contributed to the rapid development of forest industries in the corridor,including the accessibility of forestlands, the availability of local markets, and the presence of awell-developed transportation system.2 The rapid development of the timber industry led to agradual decline in forest acreage as thousands of acres of swamplands and bottomland hardwoodforests in the corridor were cleared and drained to make way for agricultural production. Overtime, much of this land became severely degraded due to over-planting and flooding.3 By theGreat Depression, there was widespread soil degradation, which caused wholesale landabandonment as agricultural production shifted to more fertile areas.
In the wake of the Depression however, a 40-year period of re-growth ensued, whichfacilitated a gradual expansion of timberland in the corridor.4 This expansion temporarily haltedin the 1960s and early 70s, when large areas of timberland were converted to soybean productionto take advantage of the boom in soy prices.5 More recently, conservation policies and otherfactors have led to the reconversion of large areas of marginal agricultural land back totimberland.6
2 U.S. Army Corps of Engineers, Mississippi River Mainline Levees Enlargement and
Seepage Control, 1998.
3 Wainger, Lisa A and Dennis M. King, The Benefits and Costs of ReforestingEconomically Marginal Cropland in the Mississippi Delta, Delta Land Trust, 2000,http://www.deltalandtrust.org/King_Report_Cover_Page.pdf.
4 Wear, David N. and John G. Greis, The Southern Forest Resource Assessment:Summary Report, U.S. Forest Service, 2002.
5 Zepp, Laura and Leonard Shabman, Land Clearing in the Arkansas-Louisiana-Mississippi Delta, Delta Land Trust, 2000, http://www.deltalandtrust.org/Land_Clearing%20_Report%20_Version%20_1.0.pdf
6 Wainger, Lisa A and Dennis M. King, The Benefits and Costs of ReforestingEconomically Marginal Cropland in the Mississippi Delta, Delta Land Trust, 2000,http://www.deltalandtrust.org/King_Report_Cover_Page.pdf.

2-3
Today, the corridor's forests supply pulpwood for paper products and saw timber forlumber, as well as chip board, telephone poles, construction pilings, and veneer logs forfurniture, cabinets, and other home furnishings.7 The bulk of the timberland in the corridor isowned by private, non-industrial landowners.8 As a result, forestry activities have a directimpact on local communities in the LMR region.9
Annual Timber Harvest
The most recent Forest Service data indicate that roughly 520 million cubic feet of timberare harvested in the LMR corridor each year (Exhibits 2-1, 2-2).10 The heaviest activity is inLouisiana, where about 250 million cubic feet of timber are harvested. The bulk of the harvest inLouisiana consists of loblolly-shortleaf pine, cottonwood, soft maple, and oaks. Mississippi andArkansas also have large timber harvests, with 121 and 110 million cubic feet of timberharvested annually, respectively. The bulk of the harvest in both of these states consists ofloblolly-shortleaf pine, sweetgum, and oaks.
Timber harvesting is somewhat less concentrated in the LMR corridor than in the overallseven-state region. Approximately 15 percent of the total timber harvest in the seven-stateregion originates in the LMR corridor, while the corridor makes up about 20 percent of theregion’s total land area (see Exhibit 2-2). The limited concentration of forest activity is primarilythe result of the high value of agricultural land in the corridor.11 The soils along the river arenaturally fertile, and in many areas, periodic flooding transfers sediment to the topsoil.Likewise, the climate is warm, which contributes to a long growing season.
7 National Park Service, Draft Heritage Study and Environmental Assessment – Lower
Mississippi Delta Region, no date.
8 U.S. Forest Service Timber Products Output data; David N. Wear and John G. Greis,The Southern Forest Resource Assessment: Summary Report, Southern Research Station, US.Forest Service, 2002.
9 Daniels, Bob, The importance of forest management and timber harvests in localeconomies: A Mississippi example, Southern Perspectives, 3 (2), Summer 1999,http://srdc.msstate.edu/publications/summersp99.htm
10 U.S. Forest Service, 2002 Timber Products Output data. This is the most recent yearfor which data is publicly available.
11 Personal communication with John Vissage North Central Research Station, U.S.Forest Service, November 19, 2003.

2-4
Exhibit 2-1
TIMBER HARVEST IN THE LMR CORRIDOR

2-5
Exhibit 2-2
TIMBER HARVEST IN LMR CORRIDOR
State Name
2002 RoundwoodTimber Harvest in
LMR Corridor(Thousands of
Cubic Feet)
Timberland inLMR Corridor
(Acres)
Percent of StateTimber Harvest in
LMR Corridor
Percent of StateTimberland inLMR Corridor
Percent of StateLand Area in LMR
Corridor
Major Tree TypesHarvested in LMR
CorridorLouisiana 249,809 6,019,704 30.2% 43.7% 58.0% Loblolly-Shortleaf
pine, Cottonwood,Soft Maple, and
OaksMississippi 120,643 3,020,721 11.9% 16.3% 26.3% Loblolly-Shortleaf
pine, Oaks, andSweetgum
Arkansas 109,792 3,971,751 15.2% 20.9% 37.4% Loblolly-Shortleafpine, Sweetgum,
and OaksMissouri 24,692 1,177,953 13.7% 8.4% 9.7% Oaks, Hickory, and
ElmTennessee 5,621 451,016 1.6% 3.2% 7.2% Oaks and SweetgumKentucky 4,518 142,908 2.0% 1.2% 2.4% Sweetgum, Oaks,
and Hard MapleIllinois 5,068 174,092 5.0% 4.3% 1.4% Cottonwood and
OaksTotal 520,144 14,958,145 15.2% 15.6% 20.0%Sources: U.S. Forest Service Timber Product Output Database, U.S. Forest Service Forest Inventory Mapmaker, and ESRI GIS Data.

2-6
Forestry Revenue and Employment
We use a combination of state severance tax data and 1998 IMPLAN data to estimateforestry output in the corridor. We use taxable gross value data to estimate output in the largestLMR states, including Louisiana and Mississippi. For the other five LMR states, we useIMPLAN data to estimate output.
In all, the timber and forestry services industry in the LMR corridor generatesapproximately $249 million in annual output and employs more than 1,600 people. Asdiscussed, a large share of the timber harvest is concentrated in Mississippi and Arkansas.However, IMPLAN and state tax data indicate that the bulk of the forestry sector’s output isconcentrated in Louisiana (Exhibit 2-3). Much of Mississippi and Arkansas’ timber harvest isexported to Louisiana for processing. Since output data is generally recorded based on wheretimber is processed, the concentration of processing facilities in Louisiana leads to the bulk ofthe output being classified there.12
Exhibit 2-3
FORESTRY OUTPUT AND EMPLOYMENT IN THE LMRCORRIDOR
State Output (millions $2001) EmploymentArkansas $30.4 156Illinois $0.8 5Kentucky $1.1 17Louisiana $177.2 1,303Mississippi $34.2 107Missouri $4.2 62Tennessee $1.6 16Total $249.5 1,666Sources: State table gross value data and IMPLAN 1998 model data.
Forestry Trends
Forestry production in the corridor is likely to increase in the coming years. On aregional basis, the demand for timber products is growing at approximately two percent peryear.13 This growth in demand is likely to lead to an increase in real prices for hardwood andsoftwood products, which will increase the profitability of timberland. At the same time,
12 Personal communication with Tony Johnson, Southern Research Station, U.S. Forest
Service, June 19, 2003.
13 U.S. Forest Service Timber Products Output data; David N. Wear and John G. Greis,The Southern Forest Resource Assessment: Summary Report, Southern Research Station, US.Forest Service, 2002.

2-7
agricultural output is expected to decrease in some marginally productive areas.14 Thecombination of increased timber prices and decreasing agricultural profitability will likely lead togrowth in total timberland area and forestry production in the coming years.15 This trend isreinforced by the increasing recognition of the diverse set of environmental and recreationalservices provided by forests in the corridor.16
COMMERCIAL FISHING
The commercial fishing industry in the LMR corridor includes both marine andfreshwater fisheries. Saltwater fishing in the corridor is dominated by shrimp, menhaden, crab,and other finfish harvests in the Gulf of Mexico.17 Some of the most important freshwaterspecies in the corridor are crayfish, catfish, buffalo, and garfish.18
Saltwater Commercial Fish Harvest
Each year, millions of pounds of fish are harvested off-shore from the LMR corridor,providing thousands of jobs to corridor residents. Although the fishery is focused in off-shoreareas, its existence is heavily dependent on the Mississippi River system. 19 Most of the speciessought by commercial fishers depend on estuaries and wetlands during much of their life cycle;for example many fish and crustaceans utilize the coastal marshes as a nursery.20
14 Personal communication with John Vissage North Central Research Station, U.S.
Forest Service, November 19, 2003.
15 Note that changes in government agricultural subsidy policies could substantiallyinfluence these trends.
16 Wainger, Lisa A and Dennis M. King, The Benefits and Costs of ReforestingEconomically Marginal Cropland in the Mississippi Delta, Delta Land Trust, 2000,http://www.deltalandtrust.org/King_Report_Cover_Page.pdf.
17 2002 Louisiana Agricultural Summary, Louisiana State University Agricultural Center,http://www.agctr. lsu.edu/Communications/agsum/2002agsum.htm.
18 National Park Service, Draft Heritage Study and Environmental Assessment – LowerMississippi Delta Region, no date.
19 NOAA, Gulf of Mexico Ecosystems and Hypoxia Assessment,http://www.cop.noaa.gov/Fact_Sheets/NGOMEX.html.
20 National Marine Fisheries Service, No Time to Lose: The Future of Louisiana, 1997,http://www.crcl.org/no_time_to_lose.pdf. Because of the narrow tidal range (roughly a footbetween low and high tide), fish and crustaceans using the open water areas are seldom forced toleave them at low tide

2-8
There are also significant economic connections between the off-shore fishery and theLMR corridor. Louisiana has the second largest commercial fishing sector of all U.S states(second only to Alaska).21 The shrimp fishery in Louisiana is the largest in the nation, while themenhaden fishery is the second largest by volume. In addition, some of the largest ports in thecountry are located in the corridor, including Empire-Venice, Dulac-Chauvin, and GoldenMeadow-Leeville. Empire-Venice was the nation’s third largest port in 2001, with about 370million pounds in landings with a total ex-vessel value of $59 million.22
We use data from the Louisiana Agricultural Center to estimate total saltwatercommercial fishing landings in the corridor.23 The Louisiana Agricultural Center data indicatesthat saltwater landings fluctuated within a narrow range between 1998 and 2002, with totallandings ranging between 350 million pounds and 495 million pounds and the total ex-vesselvalue ranging from $135 million to $205 million. However, shrimp prices declined dramaticallyin 2002, which lead to a 22 percent decline in shrimp landings between 2001 and 2002 and a 36percent decline in the shrimp harvest’s total ex-vessel value.
Because year-to-year price fluctuations lead to significant variation in the commercialfish harvest’s total value, we estimate the total value of the saltwater commercial fishing harvestbased on average annual landings and value over the past five years. Landings averaged 432million pounds between 1998 and 2002, while total ex-vessel value averaged $173 million (seeExhibit 2-4). With an average of approximately $120 million in landings, shrimp make up thebulk of the saltwater harvest in the corridor. Other significant species include crab ($21 million)and menhaden ($18 million).
Exhibit 2-4
AVERAGE SALTWATER COMMERCIAL FISHING HARVEST INTHE LMR CORRIDOR 1998-2002
Type Pounds Ex-Vessel Value ($2001)Crabs 30,774,000 $21,017,000Shrimp 72,525,000 $120,239,000Finfish 7,688,000 $13,417,000Menhaden 321,068,000 $17,938,000Total 432,054,000 $172,611,000Source: Louisiana Agricultural Summary, Louisiana State University Agricultural Center.
21 National Marine Fisheries Service, Fisheries of the United States 2000, 2001.
22 Ex-vessel value is defined as the quantity of fish landed by commercial fishermenmultiplied by the average price received by them at the first point of sale. NOAA, Appendix 4,http://spo.nwr.noaa.gov/app4.pdf
23 The Louisiana Agricultural Center reports data for the state of Louisiana at the parishlevel. The data are based on information from the Louisiana Department of Wildlife andFisheries.

2-9
Freshwater Commercial Fish Harvest
The freshwater commercial fishing industry operates throughout the LMR corridor. Insome areas, species such as catfish are caught in the main stem of the Mississippi.24 In general,however, a number of factors limit commercial fishing activity on the Mississippi. Mostimportantly, the river’s fast moving current and abundant commercial traffic pose significanthazards for fishing vessels.25 As a result, much of the commercial fishing in the corridor isconducted on tributaries to the Mississippi.26
The largest freshwater fishing harvest is in Louisiana, where about 22 million pounds offish are harvested each year in the LMR corridor (Exhibit 2-5). Crayfish (14 million pounds) andcatfish (6 million pounds) are the two most prominent species in Louisiana. The total economicvalue of the freshwater harvest in Louisiana is approximately $10.3 million.
Exhibit 2-5
2002 FRESHWATER COMMERCIAL FISHING HARVEST IN LOUISIANAType Pounds Ex-Vessel Value
($2001)Crayfish 13,952,000 $7,141,000Catfish 5,856,000 $2,247,000Buffalo 1,350,000 $318,000Gar 393,000 $427,000Other 671,000 $155,000Total 22,222,000 $10,288,000Source: Louisiana Agricultural Summary, Louisiana State University AgriculturalCenter.
Freshwater fishing data for other LMR states are scattered and inconsistent.27 Availabledata indicate that buffalo and catfish dominate the freshwater commercial harvest. In Illinois,these two species make up about two thirds of the harvest. In Kentucky they make up about 78
24 Comments provided by Glenn Thomas, Inland Fisheries Research Programs Manager,
Louisiana Department of Wildlife and Fisheries.
25 Personal communication with Joe Jewell, Mississippi Department of MarineResources, January 21, 2003.
26 Personal communication with Bill Posey, Arkansas Department of Game and Fish,January 16, 2003.
27 Illinois, Kentucky, Tennessee, and Arkansas report the total freshwater catch on theMississippi River broken down by species, while Missouri reports the total catch on theMississippi River but does not break it down by species. Mississippi does not report data onfreshwater commercial fishing.

2-10
percent of the harvest and in Tennessee and Arkansas they make up more than 90 percent of thetotal harvest.28 Data are not available on the value of the freshwater catch in these states.
Commercial Fishing Employment in the LMR Corridor
Throughout the LMR corridor, more than 4,850 people are employed in the commercialfishing sector. Approximately 4,500 people are employed in Louisiana, while about 350 peopleare employed in Mississippi. Employment in other LMR states is minor.
In addition to direct employment in fish harvesting, commercial fishing fuels relatedsectors in the corridor. For example, the seafood-processing sector in the corridor employs about5,800 individuals and generates $853 million in output each year. This sector processescommercially landed fish and shellfish as well as farm-raised catfish.
Commercial Fishing Trends
National Marine Fisheries Service data indicate that commercial fishing activity in theLMR region is gradually trending downward (Exhibit 2-6). After peaking in 1984 at close to 2million pounds, the saltwater commercial fishing harvest in Louisiana has declined almost 50percent to about 1.1 million pounds in 2001. The largest portion of the decline has occurred inthe finfish harvest, which has fallen from about 1.8 million pounds to 1.0 million pounds. Incontrast, the shellfish harvest has stayed fairly constant over the past two decades. Indeed,shrimp landings have actually risen about 35 percent since 1980.29 Because the bulk of theeconomic value of the fishing harvest in the LMR corridor is associated with shellfish, the ex-vessel value of landings in the corridor has stayed relatively constant.
The long-term decline in saltwater fishing harvests is primarily due to the correspondingdecline in wetland habitat.30 The loss of wetlands has severely degraded the habitat available tosaltwater fish species that use the coastal wetlands as a nursery. If current trends continue and
28 Personal communications with Doug Henley, Kentucky Department of Natural
Resources, May 11, 2003; Jeff Farwick, Arkansas Department of Game and Fish, May 20, 2003;Rob Mayer, Illinois Department of Natural Resources, May 22, 2003; Vince Travnachek,Missouri Department of Natural Resources, May 20, 2003; Rob Todd, Tennessee WildlifeResources Agency, May 20, 2003; Bill Posey, Arkansas Department of Game and Fish, January16, 2003.
29 National Marine Fisheries Service (NMFS) Landings Database, http://www.st.nmfs.gov/st1/commercial/
30 Another possible cause of the long-term decline is the state of Louisiana’s ban oncommercial gill nets in 1995. However, the bulk of the decline occurred prior to 1995, whichimplies that the gill net ban was only a minor contributor to the overall decline.

2-11
coastal wetlands are further degraded, some experts worry that Louisiana’s fragile coastalecosystem will be permanently damaged, eventually leading to a crash in fish production.31
Despite these long-term trends, the overall harvest in Louisiana has stayed relativelyconstant over the past five years. Moreover, the harvest landed in LMR corridor counties hasactually increased slightly, rising from 350 million pounds in 1998 to 495 million pounds in2002. However, it is not clear whether continued wetlands degradation will halt the recentupward trend.
Although long-term trend data on freshwater fishing are not available, the freshwatercatch appears to have also trended downward in recent years, falling almost 60 percent inLouisiana between 1998 and 2002. Loss of wetland habitat, environmental contamination,increased competition from aquaculture, and conflicts with navigation have all played a role inthe decline in freshwater harvests.32 These factors may lead to a continued decline in fishingactivity in the coming years.
TRAPPING AND ALLIGATOR HUNTING
The LMR corridor’s diverse habitats support a wide range of furbearing animals.Louisiana alone produces at least 11 different species of furbearers. The bulk of the trappingharvest in the corridor is made up of raccoons, muskrat, and nutria.
31 National Marine Fisheries Service, No Time to Lose: The Future of Louisiana, 1997,
http://www.crcl.org/no_time_to_lose.pdf
32 National Park Service, Draft Heritage Study and Environmental Assessment – LowerMississippi Delta Region, no date.
Exhibit 2-6SALTWATER COMMERCIAL FISHING HARVEST
IN LOUISIANA (POUNDS)
0
500,000,000
1,000,000,000
1,500,000,000
2,000,000,000
1980 1985 1990 1995 2000
Total HarvestFinfish HarvestShellfish Harvest

2-12
There is also a large alligator hunting industry in the corridor. In fact, Louisiana leads thenation in the production of alligator skins.33 Between 1850 and 1960, over-hunting nearlyextinguished the state’s alligator population and by 1960 the alligator population had reached anall-time low. However, the threat of extinction prompted the state to dramatically increase itsprotection efforts and, starting in 1962, the state made alligator hunting illegal. It also initiatednew research and management efforts. As a result, the state’s alligator population graduallybegan to increase again and limited hunting was legalized in 1972.34 Today, alligator huntinghas become an important part of the economy. Much of the state’s alligator harvest goes toforeign markets, with the largest markets in Southern Europe and Japan.35
In contrast to the Upper Mississippi River region, most of the trapping activity in thecorridor takes place on private land. Only about 100 trapping licenses were sold at NationalWildlife Refuges in the corridor.36 In many areas, trapping and alligator hunting plays animportant role in conserving wetlands and vulnerable wildlife habitats. Income from hunting andtrapping leases provides an economic incentive to encourage landowners to take steps to slowwetland loss and maintain habitats. Trapping also helps maintain wildlife populations atsustainable levels. For instance, in the late 1950s and early 1960s, rising nutria populations ledto widespread damage to sugarcane and rice fields in southern Louisiana. However, growth innutria trapping in the 1960s and 1970s helped reduce the population to sustainable levels, whilealso providing an important income source for trappers and coastal landowners.
Number of Animals Trapped and Economic Value
Available data vary widely between the LMR states. Some states do not collect data onthe number of animals trapped, focusing instead on license sales. Other states collect detailedharvest data, including breakdowns by county. The best available data indicate that at least40,500 pelts were harvested in the LMR corridor in 2002. The largest share of the corridor’strapping harvest took place in Louisiana, where trappers harvested approximately 32,500 pelts in2002.37 These pelts had an economic value of about $175,000. There were also more than185,000 alligator skins harvested in Louisiana in 2002, with a total economic value of about $4.1
33 Louisiana Fur and Alligator Advisory Council, obtained from
http://www.alligatorfur.com/ annualreport/allind.html on 06/10/03.
34 Super Gator Tours, obtained from http://www.pnx.com/gator/gatrFAQ.htm on6/10/03.
35 Louisiana Fur and Alligator Advisory Council, obtained fromhttp://www.alligatorfur.com/ annualreport/problems.html on 6/10/03.
36 Personal communications with U.S. Fish and Wildlife Service staff.
37 2002 Louisiana Agricultural Summary

2-13
million. In addition, trappers in Mississippi harvested at least 8,000 pelts.38 Although data onthe economic value of these pelts are not available, based on pelt prices in Louisiana we estimatethat the total value of pelts harvested in Mississippi was about $44,000 in 2001-2002.
No comprehensive data exist on trends in trapping activity in the LMR corridor.However, available data indicate that trapping activity is likely to increase somewhat in thecoming years. After its collapse in the late 1980s, the U.S. trapping industry has been slowlyrebounding, with pelt prices gradually trending upward. Despite slow economic growth, thistrend is expected to continue for the foreseeable future.39
These nationwide trends are largely echoed in LMR corridor harvests.40 In Kentucky,trapping license sales fell nearly 90 percent between the mid-1980s and 2002, while in Louisianatrapping license sales fell about 80 percent. However, due to the increase in pelt prices in recentyears, the fur industry in the corridor has begun to exhibit modest growth again. Indeed, licensesales in Louisiana increased about 50 percent between 2001 and 2002 (Exhibit 2-7).
38 Mississippi data are based on information from 46 out of the 75 licensed trappers in
these counties for the 2001-02 trapping season (November-February). Thus, estimates are onlygeneralizable to licensed trappers, not all trappers (licensed and unlicensed). No information oneconomic value is available. Personal communication with Dr. Kevin M. Hunt, AssistantProfessor & Director, Human Dimensions & Conservation Law Enforcement Laboratory,Mississippi State University, 6-17-03.
39 Fur Commission USA, http://www.furcommission.com/news/newsE96.htm andpersonal communications with Dave Hamilton, Missouri Department of Natural Resources, May20, 2003 and Jim Lane, Kentucky Department of Natural Resources, May 15, 2003.
40 Personal communications with Dave Hamilton, Missouri Department of NaturalResources, May 20, 2003 and Jim Lane, Kentucky Department of Natural Resources, May 15,2003.
Exhibit 2-7
LOUISIANA TRAPPING LICENSE SALES
0
2,000
4,000
6,000
8,000
10,000
FY86FY88
FY90FY92
FY94FY96
FY98FY00
FY02
Number of Licences

2-14
SUMMARY
In 2002, there was a total of about $436 million in economic output associated with thecommercial harvest of natural resources in the LMR corridor (Exhibit 2-8). With about $249million in output, the forestry sector accounted for the largest portion of the natural resourcesharvest in the corridor. The saltwater fishing sector was the next largest sector, accounting forapproximately $173 million in output. In addition, freshwater fishing landings totaled about $10million, while commercial hunting/trapping revenues totaled roughly $4.3 million.
Exhibit 2-8 ECONOMIC VALUE OF NATURAL RESOURCES
HARVESTED IN THE LMR CORRIDOR
0
50
100
150
200
250
Forestry Saltwater Fishing FreshwaterFishing
Trapping andAlligator Hunting
Mill
ions
$20
01

3-1
OUTDOOR RECREATION AND ITS ROLEIN THE REGIONAL ECONOMY CHAPTER 3______________________________________________________________________________
The natural beauty and abundant wildlife of the Lower Mississippi River attract millionsof anglers, hunters, and other outdoor recreationalists each year. With habitats ranging frombottomland hardwood to cypress swamps to open wetlands, the LMR region supports diverseduck species, deer, and other wildlife sought by hunters. Anglers enjoy abundant sportfishingopportunities, focusing on species such as catfish, bream, bass, red snapper, and grouper.1 Inaddition, numerous public recreational resources exist throughout the study area, including stateparks, state forests, wildlife refuges, and recreational centers.
This chapter summarizes recreational activity in the corridor and describes the effect ofthis activity on the regional economy. Each year, over a million people visit National WildlifeRefuges in the corridor and millions more visit state and local parks or recreate on private land.In total, outdoor recreationalists take approximately 36 million recreational trips in the corridorand spend over $791 million on lodging, food, fishing bait, and other trip-related recreationalgoods and services. This spending fuels the local economy, providing thousands of jobs to LMRresidents.
DATA SOURCES AND METHODOLOGY
It is difficult to precisely quantify the economic impact of outdoor recreation. Unlikesectors such as manufacturing and energy, revenue and employment information cannot becollected by surveying facilities in a specific industry category. Instead, the recreational sectorgenerates revenue in a number of industries, including lodging, restaurants, sporting goodsstores, and boat dealers.
We use a variety of different sources to characterize recreational resources, activities, andexpenditures in the corridor, including:
• The Fish and Wildlife Service’s survey of fishing, hunting, and wildlifeviewing for data on recreational activity and expenditures in the corridor.
1 National Park Service, Draft Heritage Study and Environmental Assessment – Lower
Mississippi Delta Region, no date.

3-2
• U.S. Fish and Wildlife Service information on visitation to NationalWildlife Refuges in the corridor.
• Various state-level data sources, including State Comprehensive OutdoorRecreation Plans (SCORPs) and personal communications withindividuals at state fish and game departments.
• The U.S. National Park Service’s Draft Heritage Study and EnvironmentalAssessment – Lower Mississippi Delta Region.
OVERVIEW OF RECREATION IN THE LOWER MISSISSIPPI RIVER CORRIDOR
Outdoor Recreational Activities
Recreationalists visit the LMR corridor to engage in a wide range of possible outdooractivities. In this section, we describe some of the most popular activities, including freshwaterfishing, hunting, and wildlife viewing. We also describe some of the opportunities for otherrecreational activities in the corridor, such as hiking and swimming.
Freshwater anglers visit the corridor for its abundant supply of catfish, bass, bluegill,crappie, freshwater drum, sunfish, and warmouth. Native fish stocks in the corridor areaugmented by hatchery programs run by state fisheries management offices.2 Due to the fastmoving current and prevalence of commercial boat traffic, fishing is relatively rare on theMississippi River itself. Instead, most anglers take advantage of the large number of oxbowlakes, river cutoffs, water control reservoirs, and hundreds of miles of LMR tributariesthroughout the corridor.3
Hunting is another popular activity in the LMR corridor. Each year, millions of huntersvisit the corridor to take advantage of the abundant game in the region. With thousands of acresof fertile marshes and swamps, the corridor provides one of the best regions for waterfowlhunting in the world. Every fall, millions of teal, mallard, pintail, widgeon, and other waterfowlspecies migrate south along the Mississippi Flyway and spend the winter months in the corridor's
2 National Park Service, Ibid.3 Personal communications with Chris Horton, Arkansas Game and Fish Commission,
January 16, 2003 and Joe Jewell, Mississippi Department of Marine Resources, January 21,2003.

3-3
wetlands.4 As a result, more than 47percent of the total duck harvest in theUnited States occurs in the MississippiFlyway. 5
Deer, wild turkey, doves, andsmall game, such as rabbits andsquirrels, are also prevalent in thecorridor. Due to the wide array ofhunting opportunities in the region,LMR residents tend to hunt at ratessignificantly higher than the nationalaverage. For instance, Arkansasresidents are three times more likely tohunt than the average American.6 Inaddition, thousands of individualsfrom other parts of the county visit theregion to take advantage of huntingopportunities in the corridor.
Wildlife viewing is anotherpopular activity in the corridor.Wildlife viewers enjoy the region’sabundant wildlife and diverseecological environments. Visitors towildlife refuges and parks in thenorthern part of the corridor can see avariety of waterfowl and bird species,including bald eagles, Mississippi kites, wild turkey, and neotropical songbirds, as well asnumerous mammals, reptiles, amphibians, fish, birds, and insects. Visitors to refuges in thesouthern LMR corridor can view resident fauna such as American Alligators, and endangeredLouisiana Black Bear, waterfowl, bobcat, and otter.7
4 Ducks Unlimited, “Arkansas Duck Season Gets Mixed Reviews,”
http://www.ducks.org.5 Elwood M. Martin and Paul I. Padding. Preliminary Estimates of Waterfowl Harvest
and Hunter in the United States during the 2001 Hunting Season. U.S. Fish and WildlifeService; Personal Communication with Scott Yaich at Ducks Unlimited, April 24, 2003.
6 National Park Service, Draft Heritage Study and Environmental Assessment – LowerMississippi Delta Region, no date.
7 U.S. Fish and Wildlife Service Website, obtained from http://refuges.fws.gov/profiles/index.cfm?id=42527 and http://refuges.fws.gov/profiles/index.cfm?id=43682 on04/07/03.
CATFISH AND RECREATIONAL ANGLING ONTHE LOWER MISSISSIPPI
Catfish are popular with recreational anglers in the LMR region.Unlike many other sportfish species, catfish can tolerate warm,muddy water and are frequently found in or near larger rivers withstrong current. As a result, catfish are among the fish commonlycaught in the main stem of the Lower Mississippi River.
The waters of the LMR region hold three different species of catfish:flathead catfish, blue catfish, and channel catfish. Flathead and bluecatfish commonly exceed 50 pounds and can even top 100 poundswhile channel catfish generally weigh under 20 pounds. They arecaught using either live baitfish (e.g., sunfish) or any of a variety ofhomemade or commercial “stinkbaits” designed to appeal to thecatfish’s keen sense of smell.
While not the focus of a large tournament circuit like that associatedwith bass, a number of events in the LMR are organized aroundcatfish angling. For instance, the U.S. Catfish Anglers TournamentSeries features an annual tournament in Memphis while the ReelfootTourism Council (Tennessee) sponsors an annual catfish tournamenteach July.
Sources: Sorenson, Eric L., The Angler’s Guide to Freshwater Fishof North America, 2000; The Art of Freshwater Fishing, CreativePublishing International, 1997; and www.uscats.org.

3-4
The corridor also offers opportunities for many other outdoor recreational pursuits.Hiking, picnicking, swimming, and recreational boating are particularly popular in the corridor.For instance, more than 78 percent of Kentucky residents go hiking at least once a year, whilemore than 77 percent picnic and 53 percent swim at least once a year.8 Other states show similarparticipation rates.9
Recreational Resources
Dozens of recreational resources exist throughout the LMR corridor, including more than50 state and local parks, 34 National Wildlife Refuges, and hundreds of state conservation areas(Exhibit 3-1). Because they account for much of the corridor’s land area, Louisiana, Arkansas,and Mississippi contain the largest concentration of recreational resources in the region.
Exhibit 3-1
EXAMPLES OF RECREATIONAL RESOURCES IN THE LMR CORRIDORState Recreational Resources
Louisiana • Audubon Park• Grand Isle State Park• Lake Bruin State Park• Pass a Loutre Wildlife Management Area• 16 National Wildlife Refuges
Mississippi • Leroy Percy State Park• Winterville State Park• 7 National Wildlife Refuges
Arkansas • Lake Chicot State Park• Village Creek State Park• 6 National Wildlife Refuges
Missouri • Trails of Tears State Park• Mount Tabor Park• Big Oak Tree Park• Ten Mile Pond
Tennessee • Reelfoot Lake State Park• Meeman Shelby Forest State Park• 4 National Wildlife Refuges
Kentucky • Columbus-Belmont State ParkIllinois • Fort Defiance State Park
• 1 National Wildlife Refuge• Giant City State Park
Source: GIS data from ESRI; Personal Communications with the U.S. Fish and Wildlife Service; the U.S.National Park Service, Mississippi River Corridor Study, Vol.2: Inventory of Resources and Significance, 1996.
The corridor’s many state parks are popular destinations. In fiscal year 2002,Mississippi’s four state parks in the corridor hosted more than 200,000 visitors, while
8 Kentucky's Comprehensive Outdoor Recreation Plan (SCORP).9 State Comprehensive Outdoor Recreational Plans (SCORPs).

3-5
Louisiana’s nine state parks hosted over 400,000 visitors.10 Grand Isle State Park is one of themost prominent state parks in the corridor. Located in Louisiana, it is the breakwater betweenthe Gulf of Mexico and the network of inland channels that connect to the bayou tributaries ofthe Mississippi River. The park received approximately 105,000 visitors in fiscal year 2001-2002. Anglers visit the park to enjoy the 280 species of fish that have been identified in thewaters off the coast of Grand Isle, while families visit the park to take advantage of the multitudeof swimming and picnicking opportunities.11
The 34 National Wildlife Refuges (NWRs) in the corridor are another popularrecreational resource. The refuges offer opportunities for hunting, fishing, hiking, camping,boating, picnicking, and wildlife viewing. Anglers and hunters at the refuges play an importantrole in maintaining the delicate equilibrium between population levels and habitat preservation atNWRs. For example, deer populations often grow too large for refuge habitat to support. Ifsome of the deer are not harvested, they destroy habitat for themselves and other animals and diefrom starvation and disease. Each year, millions of outdoor recreationalists visit the NWRsystem. In 2002, refuges in the corridor hosted almost 1.3 million visitors (Exhibit 3-2). Themost popular refuge in the corridor is Reelfoot NWR. Located in northwestern Tennessee, therefuge received more than 350,000 visitors in 2002.12
Exhibit 3-2
VISITATION TO NATIONAL WILDLIFE REFUGESState NWR Visitation
Louisiana 329,200Mississippi 136,200Arkansas 217,500Missouri -Tennessee 561,300Kentucky -Illinois 24,000Total 1,268,200Source: Personal communications with the U.S. Fish and Wildlife Service
A large amount of recreational activity also takes place on private land in the corridor.According to the U.S. Fish and Wildlife Service's (FWS)’s 2001 survey of nationwide hunting,fishing, and wildlife viewing activity, approximately 57 percent of hunters used privately ownedland exclusively. This share is even higher in the seven-state LMR region. Complete state-leveldata are not yet available for the 2001 survey. However, according to the 1996 survey,approximately 65 percent of hunters in LMR states used privately owned land.
10 Mississippi. 2002 Economic Impact Report for Tourism and Recreation. p. 22;
Personal communication with Judy Pevey, Louisiana Department of Culture, Recreation, andTourism, April 22, 2003.
11 Louisiana State Parks website, obtained from http://www.lastateparks.com/ on 2/14/03.12 Personal communication with Gary Krauss, U.S. Fish and Wildlife Service, April 4,
2003.

3-6
Many hunters use land that is leased from private landowners by hunting organizations orindividual hunters. These lease payments can represent a valuable source of income for rurallandowners that complements conservation easement payments from sources such as theWetland Reserve Program. For example, in Louisiana, a recent survey showed that landownersreceived an average of $5.32 per acre of land leased for hunting, with some waterfowl areas inthe Delta regions receiving as much as $60 to $70 per acre.13 In 2002, Louisiana landowners inthe corridor received about $14.4 million in lease revenues.14 In Mississippi, a recent studyfound that landowners receive an average of $4.59 per acre, with wetland areas that are wellsuited for waterfowl receiving an average of $4.91 an acre.15
RECREATIONAL EXPENDITURES IN THE LOWER MISSISSIPPI RIVERCORRIDOR
To estimate total outdoor recreational activity and expenditures in the LMR corridor, weuse the U.S. Fish and Wildlife Service's (FWS) survey of outdoor recreational activity toestimate the total number of fishing, hunting and wildlife viewing trips in the corridor. Then,we apply expenditure data from the survey to estimate total expenditures for these activities.Note that this approach likely understates total recreational expenditures because it does notinclude expenditures on hiking, biking, camping, and other pursuits that are not included in theFish and Wildlife Service’s survey. In general, quantitative data are not readily available forthese activities.
Levels of Recreational Activity
The most comprehensive source of information on outdoor recreational activity in thecorridor is the FWS’s survey of hunting, fishing, and wildlife viewing activity. Every five years,the Service conducts the survey of outdoor recreationalists nationwide. The survey includesinformation on recreational activity on both public and private land. Specifically, it includesinformation on the number of fishing, hunting, and wildlife viewing trips in each state. It alsoincludes detailed state-level expenditure profiles for recreationalists in all three categories.
Since the FWS does not collect data below the state level, we use a scaling method toconvert the survey’s results to the county level. For hunters and fishers, we use information on
13 Reed, Don, Hunting Lease Enterprises and Louisiana Landowners, Louisiana
Agriculture, Spring 2002, 45(2), p. 18, http://www.lsuagcenter.com/Communications/LouisianaAgriculture/agmag/pdf/45_2.pdf.
14 2002 Louisiana Agricultural Summary.
15 Jones, W. Daryl, Ian A. Munn, Jeanne C. Jones, and Stephen C. Grado, Fee Hunting:An Income Source for Mississippi's Non-Industrial, Private Landowners, FWRC ResourceBulletin, February 2001, http://www.cfr.msstate.edu/fwrc/feehunting.pdf.

3-7
license sales in each county to estimate the number of recreational trips in the corridor. In orderto hunt or fish in the corridor, recreationalists must obtain a license from the relevant stateagency. Residents generally buy hunting or fishing licenses near their place of residence. Non-residents, however, often buy licenses near their ultimate recreational destination.16 Therefore,we characterize the level of recreational activity in a county based on the proportion of thestate’s total non-resident license sales in that county.17 Then, we use these data to scale the state-level information in the FWS survey to the county level. Unlike hunting and fishing, wildlifeviewing does not require a license. As a result, rather than using license sales as a scalar, we usethe proportion of the state’s population in each county to scale the FWS's survey down to thecounty level.
Our analysis indicates that outdoor recreationalists (excluding saltwater anglers) makeapproximately 32 million trips in the LMR corridor each year (Exhibit 3-3). Approximately 18percent of the total freshwater fishing trips in the seven-state region take place in the corridor,along with almost 25 percent of the total hunting trips. The majority of activity in the corridortakes place in Louisiana, Arkansas, Mississippi and Tennessee, with approximately 12 millionoutdoor recreational trips occurring in Louisiana alone each year. But there are also millions ofrecreational trips in other LMR states, including roughly 10 million trips in Arkansas, 5 millionin Mississippi, and 3 million in Tennessee.
Exhibit 3-3
RECREATIONAL ACTIVITY IN THE LMR REGION(thousands of trips)
LMR Corridor LMR Seven-State Region
StateFreshwater
Fishing TripsHunting
Trips
WildlifeViewing
TripsFreshwater
Fishing TripsHunting
Trips
WildlifeViewing
TripsLouisiana 6,310 3,684 1,841 8,419 6,442 2,432Mississippi 2,228 2,232 687 8,466 8,481 3,288Arkansas 5,087 3,831 668 13,006 8,411 1,562Missouri 525 622 672 13,279 6,606 12,448Tennessee 1,447 610 1,136 15,035 6,651 6,144Kentucky 230 276 39 12,394 4,664 5,689Illinois 198 90 15 16,133 4,522 7,656Total 16,026 11,344 5,060 86,732 45,777 39,219Sources: U.S. Fish and Wildlife Service, 2001 National Survey of Fishing, Hunting, and Wildlife-AssociatedRecreation and State license sales data.
In addition to the activities described above, many corridor residents and visitors alsoenjoy saltwater fishing opportunities in the Gulf of Mexico. Although this activity does not
16 Personal communication with Greg Jones, Fiscal Services, Missouri Department ofConservation, April 2, 2003.
17 We were unable to obtain license sales data for Mississippi. As a result, we use theproportion of the state’s area in each county to scale the FWS's survey down to the county level.

3-8
directly take place in the corridor, saltwater anglers visit LMR corridor businesses for many oftheir supplies, making saltwater fishing a potentially important part of the corridor's economy.
Both Louisiana and Mississippi border the Gulf of Mexico. However, because theportion of Mississippi in the LMR corridor does not border the Gulf, we focus on saltwaterfishing activity in Louisiana for our analysis. According to the FWS survey, more than 4.6million saltwater fishing trip-days take place in Louisiana each year. To scale these data to thecounty level, we use data on non-resident saltwater fishing license sales in each parish. Thisanalysis indicates that approximately 84 percent of saltwater fishing trips in Louisiana take placein the corridor, which is equivalent to approximately 3.9 million saltwater fishing trips each year.
Outdoor recreationalists also engage in a variety of other recreational activities, such aswalking, hiking, swimming, and recreational boating. However, no studies have been conductedthat characterize these activities quantitatively. Therefore, the activity figures presented abovelikely understate total recreational activity in the corridor and can be interpreted as lowerbounds.
Estimation of Expenditures and Associated Employment
The FWS survey estimates average per-trip expenditures for fishing, hunting, andwildlife viewing trips. For freshwater fishing trips, expenditures range from $12 per day inMississippi to $32 per day in Louisiana, with the bulk of these expenditures on food, lodging,and transportation, and the remainder on equipment rental, bait, and fuel (Exhibit 3-4). Huntingexpenditures range from $13 per day in Kentucky to $25 in Arkansas. The bulk of theseexpenditures were also on food, lodging, and transportation, with the rest on equipment rentaland other miscellaneous trip costs. Finally, wildlife viewing expenditures in the corridor rangefrom $9 per day in Kentucky to $34 in Tennessee.
We apply these expenditure data to the activity estimates shown in Exhibit 3-4 toestimate total outdoor recreational expenditures in the corridor. This approach yieldsapproximately $605 million in trip-related expenditures by LMR corridor recreationalists eachyear (Exhibit 3-5). With $243 and $175 million in expenditures, respectively, more than half ofthe total expenditures are concentrated in Louisiana and Arkansas alone.
These expenditures fuel retail and service businesses that employ thousands of corridorresidents. The FWS’s survey does not gather information on the effect of recreationalexpenditures on regional employment. Therefore, to estimate the impact of recreationalexpenditures on regional employment, we compile information on the effect of similarrecreational expenditures in other regions.18 Based on these studies, we estimate that every
18 Markowski et al., Economic Assessment of Bristol Bay Area National Wildlife Refuges,U.S. Fish and Wildlife Service, December 3, 1998; Malloy et al., Economic Assessment of theNECEDAH National Wildlife Refuge Comprehensive Conservation Plan, U.S. Fish and WildlifeService, March 1998; Unsworth and Paterson., Economic Assessment of the Proposed AldoLeopold National Wildlife Refuge, U.S. Fish and Wildlife Service, August 1999; Unsworth etal., Economic Assessment of the Nantucket and Monomoy National Wildlife Refuges, U.S. Fish

3-9
million dollars of outdoor recreational expenditures creates between 15 and 30 jobs. Using thisrange, we estimate that between 9,000 and 18,000 jobs are associated with recreationalexpenditures in the corridor. The largest concentration is in Louisiana, where there are between3,650 and 7,300 jobs associated with recreational expenditures.
Exhibit 3-4
PER TRIP EXPENDITURES IN THE LMR REGION($2001)
State Category Food/Lodging Transportation Other TotalFreshwater $8 $5 $8 $21
Hunting $10 $6 $3 $19LouisianaViewing $12 $8 $3 $23
Freshwater $4 $3 $4 $12Hunting $9 $5 $2 $16MississippiViewing $6 $4 $1 $11
Freshwater $6 $4 $4 $14Hunting $9 $11 $5 $25ArkansasViewing $6 $6 $1 $13
Freshwater $12 $7 $5 $24Hunting $10 $6 $1 $16MissouriViewing $7 $5 $0 $13
Freshwater $8 $3 $7 $18Hunting $10 $6 $2 $18TennesseeViewing $24 $9 $0 $34
Freshwater $8 $4 $6 $18Hunting $8 $5 $1 $13KentuckyViewing $5 $4 $0 $13
Freshwater $5 $4 $4 $13Hunting $9 $6 $9 $23IllinoisViewing $7 $4 $1 $11
Source: U.S. Fish and Wildlife Service, 2001 National Survey of Fishing, Hunting, and Wildlife-Associated Recreation.
and Wildlife Service, May 2000; Black et al., Economic Profile of the Upper Mississippi RiverRegion, U.S. Fish and Wildlife Service, March 1999.

3-10
Exhibit 3-5
RECREATIONAL EXPENDITURES AND EMPLOYMENT IN THE LMR CORRIDOR(thousands $2001)
State
FreshwaterFishing
ExpendituresHunting
Expenditures
WildlifeViewing
Expenditures
TotalRecreationalExpenditures
Total EmploymentAssociated with
RecreationalExpenditures
Louisiana $132,399 $69,010 $41,956 $243,365 3,650- 7,301Mississippi $26,223 $34,773 $7,547 $68,542 1,028 – 2,056Arkansas $71,864 $94,479 $8,579 $174,922 2,624 – 5,248Missouri $12,587 $10,058 $8,477 $31,122 467 - 934
Tennessee $25,497 $10,846 $38,245 $74,588 1,119 - 2,238Kentucky $4,107 $3,713 $348 $8,168 123 - 245
Illinois $2,536 $2,077 $171 $4,784 72 - 144Total $275,212 $224,955 $105,323 $605,491 9,082 – 18,165
Source: U.S. Fish and Wildlife Service, 2001 National Survey of Fishing, Hunting, and Wildlife-AssociatedRecreation and State license sales data. Totals may not sum due to rounding.
Saltwater anglers also have a substantial impact on the LMR corridor's economy. In2001, the average Louisiana angler spent about $48 per trip-day, including $16 for food andlodging, $8 for transportation, and $23 for trip-related expenses. We apply these expendituredata to the activity estimates described in the past section to estimate total saltwater fishingexpenditures in the corridor (Exhibit 3-6). This analysis indicates that saltwater anglers spent atotal of $186 million in the LMR corridor in 2001. The combined expenditures of corridorrecreationalists (freshwater fishing, hunting, and wildlife viewing) and saltwater anglers areapproximately $791 million.
Exhibit 3-6
SALTWATER FISHING ACTIVITY AND EXPENDITURES IN LOUISIANA($2001)
Total Number of Trips State-wide 4,673,000Total Number of Trips in the LMR Corridor 3,913,000Expenditures per Trip-Day $48Total Expenditures in the LMR Corridor $186,001,000Source: U.S. Fish and Wildlife Service, 2001 Survey of Fishing, Hunting, and Wildlife-Associated Recreation in Louisiana and Louisiana State license sales data.
Support of Recreational Activity beyond the Corridor
A major natural resource like the LMR affects ecological conditions and human uses ofnatural resources well beyond its immediate boundaries. Taking these broader ecologicallinkages into account suggests that only considering the recreational activity directly occurringin the LMR corridor may understate the actual significance of the river for recreation.

3-11
Hunting, fishing, and wildlife viewing provide good examples of the broader reliance onthe LMR ecosystem. The analysis above examined hunting, fishing, and viewing activityconducted or initiated at developed recreational areas on the LMR. However, the LMR supportshunting, fishing, and wildlife viewing activity well beyond its banks. For instance, more than 20percent of the nation's duck population relies on the Mississippi Flyway as a migration routethrough the central portion of the continent.19 Therefore, waterfowl hunting and viewing activitythroughout the central parts of the U.S. and Canada depend indirectly on the ability of the LMRto provide food and shelter to migrating populations as well as nesting habitat for some species.
As a result of these ecological connections, it is useful to consider hunting and viewingactivity in a broader geographic area, rather than focusing solely on activity in the LMR corridor.A study completed for the FWS highlights the economic importance of waterfowl hunting andviewing activity nationwide. As shown in Exhibit 3-7, the economic impact of waterfowlhunting and viewing in the 10-state Mississippi River flyway is large. Direct retail salesassociated with hunting and viewing expenditures are over $856 million. Including multipliereffects, the total regional impact of waterfowl-related recreation in the region is well over $1.7billion, which helps support almost 24,000 jobs in businesses such as sporting goods retail,restaurants, and lodging.
Exhibit 3-7
ECONOMIC IMPACT OF WATERFOWL-RELATED RECREATIONIN THE 10-STATE MISSISSIPPI RIVER FLYWAY
(millions $2001)Hunting Viewing Total
Direct Retail Sales $180.0 $676.5 $856.5Total Effect on Output (direct sales andmultiplier effects)
$357.5 $1,431.3 $1,788.8
Jobs 4,500 19,370 23,870Source: Southwick Associates, The Economic Contribution of Bird and Waterfowl Recreation in the United StatesDuring 1991, prepared for International Association of Fish and Wildlife Agencies and the U.S. FWS NorthAmerican Waterfowl and Wetlands Office, March 1995.
Caveats and Uncertainties
A number of issues and uncertainties should be considered when interpreting the aboveinformation on the economic impact of outdoor recreation:
• First, the study is survey-based and therefore subject to uncertaintiesinherent in these types of data. For example, responses given in thesurvey year may have been affected by weather, water levels, and otherfactors, limiting the degree to which they are representative of recreationalactivity in other years.
19 National Park Service, Draft Heritage Study and Environmental Assessment – Lower
Mississippi Delta Region, no date.

3-12
• Second, our scaling methodology assumes that non-resident license salesand population are good indicators of how recreational activity isdistributed geographically. To the extent that this assumption is incorrect,our estimates may not accurately characterize total recreational activity inthe corridor.
• Third, the survey only includes fishers, hunters, and wildlife viewingparticipants. Because it does not incorporate data on other types ofoutdoor recreation, it understates total outdoor recreational activity andexpenditures.
• Fourth, we do not estimate total expenditures on durable goods byrecreationalists in the corridor. According to the Fish and Wildlife Servicesurvey, total durable goods expenditures are generally the same or greaterthan trip-related expenditures. For instance, in Mississippi, hunters spend$166 million on durable goods, compared with $132 million in trip-relatedexpenditures. Unfortunately, it is difficult to establish the relationshipbetween durable goods expenditures and recreational activity in thecorridor. Many LMR recreationalists may purchase durable goods outsidethe LMR region. Likewise, LMR residents may purchase durable goods atretail outlets in the corridor for recreational trips they plan to conductoutside the corridor. Because we do not estimate durable goodsexpenditures associated with LMR-based recreation, our expenditureestimates understate total recreational expenditures in the corridor.
• Finally, some of the expenditures attributable to outdoor recreation arelikely to continue even if individuals were not able to pursue recreationalactivities in the corridor. For instance, individuals would still purchasefood from stores if they were unable to fish. Therefore, the economicimpacts attributed to recreational activity in the LMR may be overstated.
TRENDS IN RECREATIONAL ACTIVITY
No comprehensive data exist for assessing trends in recreational activity in the LMRcorridor. Available data suggest that consumptive outdoor recreational activity has decreasedover the past decade. The FWS survey results indicate that the total number of fishing andhunting trips in the corridor decreased by ten percent between 1991 and 2001, with the bulk ofthe decline in most states occurring since 1996.20
20 Note that according to Appendix B of the 2001 Survey, “the 1991, 1996, and 2001
Surveys used similar methodologies, therefore all published information for the three surveys isdirectly comparable.”

3-13
The most dramatic decline in activity has occurred in freshwater fishing (see Exhibit 3-8). The FWS survey results indicate that the number of fishing trips in the corridor has declined19 percent since 1991. Other evidence also indicates that fishing activity in the corridor hasdeclined over the past decade. For instance, seasonal fishing license sales in Louisiana havedeclined more than eight percent since 1990.21 One explanation for these declines may be thatnative fish stocks in the region are slowly declining. Indeed, biological studies indicate thatmany native fish stocks in the corridor are declining in number, with approximately six percentof the native fish in the Mississippi Delta found on endangered, threatened, or special concernlists of the FWS.22 The decline in native fish is primarily driven by the reduced quality andavailability of habitat in the corridor. Native fish stocks have also been impacted by dammingand channelization of the Mississippi and its tributaries, deforestation, erosion, pollution, andintroduced species. The decline in fishing also may be due to decreased interest in the sportamong human populations. Indeed, the increasing urbanization of the region, and the resultingshift in recreational focus may be at least as important as biological factors.
However, while native fish populations have declined, introduced and hatchery-supported sportfish are abundant in the corridor. As a result, fishing has actually increased insome areas. For instance, the number of fishing trips in Kentucky increased 25 percent between1991 and 2001.
Unlike fishing, there is no clear trend across the LMR corridor for hunting activity. TheFWS survey results indicate that hunting activity in the LMR corridor has increased over the pastdecade, with the total number of hunting trips rising by approximately nine percent between1991 and 2001. However, the FWS survey also indicates that hunting activity declined in the
21 Louisiana Department of Wildlife and Fisheries, Number of Recreational LicensesSold, 2002.
22 National Park Service, Draft Heritage Study and Environmental Assessment – LowerMississippi Delta Region, no date.
Exhibit 3-8FISHING TRIPS IN THE LMR CORRIDOR
05,000,000
10,000,00015,000,00020,000,00025,000,00030,000,000
1991 1996 2001
Year
Num
ber o
f Trip
s

3-14
latter half of the 1990s, with the total number of hunting trips decreasing by five percent between1996 and 2001.23 Even this trend masks significant state-level variation. Activity declined inLouisiana, Missouri, Tennessee, Kentucky, and Illinois, but increased in Mississippi andArkansas.
Data from the National Survey on Recreation and the Environment (NSRE) indicate thatlevels of non-consumptive recreation have stayed relatively constant over the past decade. TheNSRE also indicates that birding has become a more popular recreational pursuit, with 33percent of Americans over 16 years old reporting some participation in bird watching in the2001-2002 survey, up from 12 percent in a 1982-1983 survey.24
Overall, available data suggest that some consumptive outdoor recreational activities inthe LMR corridor may have decreased over the past decade. There are fewer readily availablesources of data on non-consumptive outdoor recreational activity, but national trends indicatethat non-consumptive outdoor activity has remained stable or grown. Therefore, it is notpossible to evaluate recreation trends generally. However, recreation clearly is and will continueto be a major source of economic activity in the LMR region.
23 Other data show a similar trend; sales of resident hunting licenses in Louisiana
declined 15 percent between 1995 and 2001. Louisiana Department of Wildlife and Fisheries,Number of Recreational Licenses Sold, 2002.
24 Personal communication with Bruce Reid, Deputy State Director, AudubonMississippi, September 24, 2003.

4-1
TOURISM AND CULTURAL/HISTORICAL RESOURCES CHAPTER 4______________________________________________________________________________
The history, scenic beauty, and tourist attractions of the Lower Mississippi River drawmillions of visitors to the LMR corridor each year. Tourists come for the corridor’s cultural andhistorical resources, riverfront festivals, and riverboat tours and gaming, as well as for recreationsuch as fishing, boating, and camping. This chapter focuses on the importance of tourism and thecultural/historical resources in the LMR’s regional economy; the role of outdoor recreation in theregional economy is addressed in Chapter 3.
Travelers to the LMR corridor spend approximately $13.5 billion annually and theseexpenditures support roughly 183,000 jobs. In this chapter, we first describe attractions that fuelthe bustling tourism industry. Then, we present travel expenditure and employment informationfor the corridor counties and discuss the future of tourism in the area.
DATA SOURCES AND METHODOLOGY
As an economic sector, it is difficult to define “tourism” precisely. Unlike sectors suchas mineral resource extraction and manufacturing, revenue and employment information for thetourism sector cannot be collected by surveying facilities in a specific industry category. Thetourism sector generates revenue and creates jobs in a variety of industries, such as lodging,restaurants, retail, and car rental. Typically, the revenue and employment of these businesses isonly partly dependent on tourism.
To estimate tourism-related expenditures and employment, state tourism departments andeconomic development departments survey travelers, as well as major industries serving tourists(e.g., hotels). For this chapter, we rely on county-level travel expenditure data provided by statetourism and economic development departments.
To characterize the cultural and historic significance of attractions along the LMRcorridor, we use information from the U.S. National Park Service and the National Register ofHistoric Places. These sources provide an inventory of national landmarks, national historicplaces, and other historic sites located in the corridor. In addition, we rely on casino corporationwebsites, state tourism directories, and county information bureaus for information on other keycorridor resources, such as festivals, riverboat tours, riverboat casinos, and cultural activities.

4-2
TOURISM IN THE LOWER MISSISSIPPI RIVER CORRIDOR
Several key aspects of the LMR corridor make it a popular tourist destination. Below,we describe three elements: (1) the region’s history; (2) the region’s unique culture andattractions; and (3) the region’s natural landmarks.
Brief History of the Lower Mississippi River Corridor
The Lower Mississippi River corridor could be considered the cradle of Americancivilization. In the 12th century B.C., mound-building societies emerged in the area, of which thePoverty Point community was one of the most important. Creating a fairly sophisticated tradenetwork to import the raw materials needed to support their activities, these societies spread theirculture across the United States, influencing the Native American communities that succeededthem in the LMR in the first centuries A.D. Formed from small roving bands of hunter-gatherers, the Choctaw, Houma, Cherokee, and Quapaw tribes, among others, settled in the LMRcorridor, bringing with them a mixture of cultural influences. Although they finally settled infarming communities, these Native Americans used the Mississippi River extensively tomaintain previous levels of trade.
By the mid-1500s European explorer Hernando de Soto discovered the Mississippi River.After his death in 1542, the French explored and eventually began to colonize the area. Controlin the region changed hands several times between de Soto’s discovery and the LouisianaPurchase in 1803 when it came to rest permanently in American hands. When the French soldthe area to the United States, it was a well-developed agricultural region with large plantationsusing slave labor to produce cotton and sugarcane.
With the advent of the steamboat in 1811, exploration and use of the Mississippi Riverincreased and became more important to the wealth of plantation owners. Large-scaleagriculture became more lucrative and the plantation system more entrenched just as slavery wasbecoming a national issue. The debate over slavery came to an impasse and the Civil Warerupted in 1861, shifting the region’s focus from the River to the battlefield. The LMR corridorplayed host to several key Civil War battles for a number of reasons, not the least of which werethe extensive use of slaves in the region and the strategic importance of the River. At the War’sconclusion, however, the area reasserted itself as an agricultural and cultural power, attractingimmigrants from Europe, Scandinavia, the British Empire, the Caribbean, and Asia who soughtto capture a piece of its vast potential.1
1 U.S. National Park Service, Mississippi River Corridor Study, Volume 2 Inventory of
Resources and Significance, Mississippi River Corridor Study Commission, 1996.

4-3
National Historic Landmarks
The numerous National Historic Landmarks in the LMR corridor highlight the region’shistorical significance. The Secretary of the Interior (through the National Park Service)designates certain buildings, structures, sites, and objects to be nationally significant pieces ofAmerican history and culture, important to all Americans regardless of location. Thisdesignation is the principal means for the Federal government to recognize the nationalsignificance of properties associated with important people, events, ideals, architectural style, orhistorical periods. Nationwide, there are less than 2,500 national historic landmarks, of which 82are located in the LMR corridor (see Exhibit 4-1). These landmarks are not only historicallysignificant, but also economically important as they encourage tourism in these areas.
Below, we describe a representative subset of National Historic Landmarks along theLMR in greater detail:
• Delta Queen – Orleans Parish, LA: The riverboat is an importantsymbol of the role that steam power played in opening up the MississippiRiver Valley. Today, the Delta Queen serves as a cruise ship, takingtourists on overnight passages throughout the rivers east of theMississippi, as far as Pittsburgh, Pennsylvania.2
• Jaketown Site – Humphreys County, MS: This site hosts the remains ofa sophisticated prehistoric community that boasted an intricate tradenetwork as early as 2000 and 600 B.C. Established during the PovertyPoint era, this settlement influenced the Native American tribes that laterinhabited the area, as their use of burial mounds and extensive tradenetworks indicates.3
• Fort Pillow – Lauderdale County, TN: Fort Pillow was built by theConfederacy and occupied by Confederate troops until Union soldierscaptured it in 1862. The Confederacy took it back in 1864, killing 229 ofthe 262 Black Union soldiers. As the Civil War raged on, this battlebecame a rallying cry for Black soldiers.4
2 U.S. National Park Service, Delta Queen, National Historic Landmark Program
Database, 2003.
3 U.S. National Park Service, Jaketown Site, National Historic Landmark ProgramDatabase, 2003.
4 U.S. National Park Service, Fort Pillow, National Historic Landmark ProgramDatabase, 2003.

4-4
Exhibit 4-1
NATIONAL HISTORIC LANDMARKS IN THE LMR CORRIDORArkansas Louisiana (continued)
• Arkansas Post • Parlange Plantation House• Bates (Daisy) House • Pontalba Buildings• Beginning Point of the Louisiana Purchase Survey • Port Hudson• Camden Expedition Sites • Presbytere• Centennial Baptist Church • Poverty Point• Eaker Site • San Francisco Plantation House• Little Rock Central High School • Shadows-on-the-Teche• Menard-Hodges Site • Saint Alphonsus Church• Nodena Site • St. Mary’s Assumption Church• Old State House • St. Patrick’s Church• Parkin Indian Mound • United States Custom House• Robinson House • United States Mint, New Orleans Branch• Rohwer Relocation Center Cemetary • Ursuline Convent• Toltec Mounds Site • Vieux Carre Historic District
Louisiana • White (Edward Douglass) House• Acadian House Mississippi• Cabildo • Anna Site• Cable (George Washington) House • Arlington• Court House and Lawyers’ Row • Auburn• Delta Queen • Commercial Bank and Banker’s House• Deluge • Dunleith• Dillard (James H.) Home • Emerald Mound Site• Evergreen Plantation • Fort St. Pierre Site• Fort De La Boulaye • Grand Village of the Natchez• Fort Jackson • Holly Bluff Site• Fort St. Philip • House on Ellicott’s Hill• Gallier Hall • Jaketown Site• Gallier House • Longwood• Garden District • Melrose• Hermann-Grima House • Monmouth• Homeplace Plantation House • Montgomery (I.T.) House• Jackson Square • Oakland Memorial Chapel• KIDD • Pemberton’s Headquarters• Lafitte’s Blacksmith Shop • Rosalie• Louisiana State Bank Building • Stanton Hall• Louisiana State Capitol • Warren County Court House• Madame John’s Legacy • Winterville Site• Madewood Plantation House Tennessee• Marksville Prehistoric Indian Site • Beale Street Historic District• Mayor Girod House • Chucalissa Site• New Orleans Cotton Exchange Building • Fort Pillow• Oak Alley Plantation• Old Louisiana State CapitolSource: U.S. National Park Service, "National Historic Landmarks -- Search NHLs by State," obtained from"http://www.cr.nps.gov/nhl" on 1/2003.

4-5
• Arkansas Post – Arkansas County, AR: France established this tradingpost in 1686, the first French settlement along the Lower MississippiRiver. The strategic location of the Post made it a critical area for thosewho wanted to lay claim to the interior United States. As a result, it wasoften the subject of struggles between European powers. In fact, it wasthe site of a battle between the Spanish and British during theRevolutionary War. This land was sold to the United States in 1803 aspart of the Louisiana Purchase.5
• Vieux Carre Historic District – Orleans Parish, LA: New Orleansembodies the diversity and spirit of the LMR corridor, offering glimpsesinto the cultural heritage of those early settlers that colonized the area. Inthe early 1700s, several French engineers and a French explorerestablished New Orleans, building the very first planned city in America.The Spanish gained control of this area in the mid-1700s, however. Whileits development progressed under Spanish rule, New Orleans suffered adevastating fire which destroyed much of what New Orleans’ Frenchfounders had created. In rebuilding the city, the Spanish introduced itsown style to the city. Although the area was devastated by fire once morebefore being transferred to U.S. hands, the legacy of the French andSpanish architectural styles endured. The Vieux Carre marks the city’soriginal footprint as established by the Frenchmen in the 1720s.6
• Montgomery (I.T.) House – Bolivar, MS: Isaiah Thornton Montgomeryand his cousin, Benjamin Green, founded Mound Bayou in 1887. MoundBayou was one of a number of towns established after Reconstruction byformer slaves seeking a community in which they could practice self-government. Montgomery’s leadership and his decision to locate the townon a fertile strip of Mississippi Delta land along the railroad are theprimary reasons behind the town’s success.7
5 U.S. National Park Service, Arkansas Post, National Historic Landmark Program
Database, 2003.
6 U.S. National Park Service, Vieux Carre Historic District, National Historic LandmarkProgram Database, 2003.
7 U.S. National Park Service, Montgomery (I.T.) House, National Historic LandmarkProgram Database, 2003.

4-6
National Register of Historic Places
In addition to the 82 nationalhistoric landmarks, more than 2,745properties in the LMR Corridor arelisted in the National Register ofHistoric Places as cultural resourcesworthy of preservation. 8 Propertiesmay be culturally significant for avariety of reasons, including theirarchitecture; relationship to historicpeople or events; contribution tomusic, art, or literature; role ineducation, transportation, business, orthe military; and religioussignificance. Exhibit 4-2 illustratesthe diversity of LMR properties listedin the National Register of HistoricPlaces and reflects the cultural andhistorical significance of the LMR tothe nation.
Cultural Resources of the LowerMississippi River Corridor
The Lower Mississippi Rivercorridor presents visitors with aconfluence of cultures. The culturaldiversity of the region is as significanta draw for tourists as the physicallandmarks that reflect the River’sheritage. The region was inhabited bymound building societies as early asthe 12th century B.C. and later
resettled by various Indian tribes between 500 and 700 A.D. The remains of these moundconstructs as well as the preserved ceramic artifacts from this time period offer enduringevidence of the sophistication and rich cultural heritage of these prehistoric societies.
8 This estimate was developed from: National Park Service, “National Register
Information System data,” obtained from http://www.nr.nps.gov on 1/31/03. Nationwide, therewere more than one million listings on the national register in early 2003.
Exhibit 4-2
EXAMPLES OF LMR PROPERTIES LISTED IN THENATIONAL REGISTER OF HISTORIC PLACES
Arkansas• Monticello Confederate Monument (Drew)• Louisiana Purchase Survey Marker (Lee)• Cherry Street Historic District (Phillips)Illinois• Dogtooth Bend Mounds and Village Site (Alexander)• Old Customhouse (Alexander)• Ware Mounds and Village Site (Union)Kentucky• Dr. David Polk Juett, Farmstead (Ballard)• Carnegie Library (Fulton)• Columbus-Belmont Civil War State Park (Hickman)Louisiana• Louisiana Railway and Navigation Company Depot
(Avoyelles)• Vieux Carre Historic District (Orleans)• Spanish Town (East Baton Rouge)• New Orleans Jazz National Historical Park (Orleans)Mississippi• Grand Village of the Natchez Indians (Adams)• Miller Plantation House (De Soto)• Bethel African Methodist Episcopal Church (Warren)Missouri• Marquette Hotel (Cape Girardeau)• Crosno Fortified Village Archeological Site (Mississippi)• Portwood Village and Mound (New Madrid)Tennessee• Memphis Merchants Exchange (Shelby)• Peabody Hotel (Shelby)• South Main Street Historic District (Shelby)Source: U.S. National Park Service, “National RegisterInformation System data,” obtained from “http://www.nr.nps.gov” on 1/2003

4-7
Although the LMR region came to be dominated by Europeans, who expelled the NativeAmerican settlers, American Indians had an important cultural influence in the region. Theycontinued the mound building traditions of their predecessors and began to develop richagricultural traditions. Descendants of the tribes that settled along the Mississippi River have, inrecent years, returned to the area to ensure that the cultural practices of their ancestors endure.
As development took place and agricultural plantations were established, the demand forlabor grew. Forced to cross the ocean to become laborers in the United States, Africans rootedthemselves and their rich heritage in the LMR corridor. Not only did they contribute their music,religion, cuisine, and folk tales, but they also inspired American writers and composers.9 BealeStreet in Memphis, for example, has become one of the biggest tourist attractions in Tennessee.In 1909, W.C. Handy wrote the very first blues song on Beale Street. In the 1920s, this area wasa reflection of the wild times, with nightclubs, theaters, and restaurants lining the streets. W.C.Handy’s blues had sparked a music revolution, defining the first American genre of music andestablishing a major influence for the soul, pop, and rock n’ roll genres yet to come. Handy wasjust one of a number of famous musicians to start his career in Memphis. Others include ElvisPresley, Jerry Lee Lewis, and Johnny Cash, all of whom launched their careers from SunStudios.
In addition to music, voodoo, gambling, and drinking were ever-present on Beale Street,especially during the roaring twenties. Although this area fell into disrepair in the mid-1900s, ithas since been revived and plays an important role in attracting tourists to Memphis. Memphishosts a number of music festivals throughout the year in addition to offering year-roundopportunities to tour Sun Studios, visit the National Civil Rights Museum, and enjoy MudIsland, a recreational area that pays tribute to the River.
River Towns and Festivals
A popular way to visit the Mississippi River towns is via The Great River Road, anetwork of federal, state, and county roads covering 3,000 miles that parallel the river on bothsides. It is the nation’s longest scenic byway. Marked with roadside signs depicting a steamboatpilot’s wheel, the Great River Road provides access to roadside parks, points of historicalinterest, scenic overlooks, and other river-oriented amenities. The cultural representation alongthe Great River Road is highlighted by the names of the river towns as well as the historical,architectural, and cultural sites these towns have maintained and developed for tourists.10
Today, tourists are drawn to river towns by their rich history and well-preservedarchitecture, as well as other attractions such as river festivals and casinos. Festivals generally
9 National Park Service, Mississippi River Corridor Study Volume 2: Inventory ofResources and Significance. “Mississippi River History and Culture,” 1996.
10 Mississippi River Parkway Commission, The Great River Road, obtained fromhttp://www.mississippiriverinfo.com on 2/25/03.

4-8
celebrate the river’s history with food, music, and entertainment. For instance, Union County,Mississippi hosts the Tallahatchie River Festival annually in late September; HumphreysCounty, Mississippi hosts the World Catfish Festival in April; and Mardis Gras is celebratedannually in New Orleans to pay homage to the region’s French roots.
Exhibit 4-3
RIVER TOWNS ALONG THE LMR:EXAMPLES OF ATTRACTIONS
New Orleans, LA – New Orleans attracts visitors as much for the European charm of its attractions as for theexcitement of its nightlife. Tourists visit the French Farmer’s Market, Bourbon Street, and St. Anthony’s Garden inthe French Quarter. They flock to New Orleans during Mardi Gras to experience this unique celebration of NewOrleans’ French roots.
Tunica, MS – In addition to the charm of the River, Tunica offers a number of casinos. Dubbed the “South’s casinocapital,” Tunica also offers opportunities to learn of the South’s historic ties. It has, among other sites, two museumsthat pay tribute to the River Corridor’s development and the blues music it inspired.
Vicksburg, MS – Vicksburg offers visitors a glimpse into Civil War history as well as a look at the variousarchitectural influences of the mid-1800s. This town is also home to the Mississippi River Commission HistoryCenter and the Vicksburg National Military Park.
Memphis, TN – The “Birthplace of Rock n’ Roll” lures music enthusiasts and Elvis fans to Sun Studio andGraceland. These visitors also are surrounded by the legacy of Native Americans, European immigrants, thesteamboat era, and the Civil Rights Movement. Attractions include the National Civil Rights Museum, the MemphisQueen Line steamboat, the Alex Haley House, and the Chucalissa Museum.
Cape Girardeau, MO – Of strategic importance to River trade and a stronghold of the Union forces during the CivilWar, this town offers a glimpse of the evolution of the Mississippi Corridor itself. Originally established by theFrench, inhabited by several Indian tribes, and taken over by the Spanish, the town was sold to the U.S. for two centsper acre as part of the Louisiana Purchase in 1803. With the introduction of the steamboat in 1811, it became athriving trading post. Today, it celebrates its past at its many Civil War sites and historic landmarks.
Sources: 1) Mississippi River Parkway Commission The Great River Road, obtained fromhttp://www.mississippiriverinfo.com on 2/25/03. 2) NewOrleans.com, Attractions and Landmarks, obtained fromwww.neworleans.com on 2/25/03. 3) The Tunica Convention & Visitors Bureau, Activities, obtained fromwww.tunicamiss.org on 2/25/03. 4) Vicksburg Convention and Visitors Bureau, obtained fromwww.vickburgcvb.org on 2/25/03. 5) Memphis Convention and Visitors Bureau, obtained from mephistravel.com,on 2/25/03. 6) Cape Girardeau Convention and Visitors Bureau, obtained from Capegirardeaucvb.org on 2/25/03.

4-9
Riverboat Tours and Gaming
Many tourists visit the LMR corridor to take riverboat tours and/or gamble at riverboatcasinos. More than 21 riverboats operate tours and cruises on the LMR, many of which evokethe heyday of the Mississippi River. For example:
• The Memphis Queen tours downtown Memphis and has a capacity of morethan 300.11
• The Delta Queen is the only fully restored over-night steamboat in theworld.
• The Mississippi Queen is the largest paddlewheel boat on the River.12
Riverboats offer sightseeing cruises, luncheon and dinner cruises, and overnight luxury cruises.While the majority of riverboats are smaller craft providing shorter excursions, some riverboats,such as the Mississippi Queen, Delta Queen, and American Queen, offer 3- to 12-night cruisesand have the capacity to accommodate over 400 passengers.
As shown in Exhibit 4-4, there are 21 land-based and riverboat casinos operating in theLMR corridor. Of these casinos, five operate out of Louisiana, one out of Missouri, and 17 outof Mississippi. Riverboat and land-based casinos operating out of Louisiana earned $720 millionin revenue in 2001, employing more than 7,200 people and attracting 8 million visitors.13 InMississippi, riverboat and land-based casinos generated $2 billion in 2002, supporting more than18,000 employees. There were roughly 10 million visitors to these casinos in 2002.14
Visitors attracted to the river for gaming often tour historic, scenic, or recreation sites aswell. Tour operators frequently package a number of river attractions and/or festivals into a tripthat includes riverboat gambling.
11 Memphis Queen Line, obtained from http://www.memphisqueen.com/fleet.php on
2/27/03.
12 Delta Queen Steamboat Company, Inc., obtained from http://www.deltaqueen.com/index.asp on 2/27/03.
13 Louisiana Gaming Control Board, Revenue Reports, obtained from http://www.dps.state.la.us/lgcb/ on 2/26/03.
14 Mississippi Gaming Commission, Reports, obtained from http://www.mgc. state.ms.uson 02/26/03.

4-10
Exhibit 4-4
GAMING IN THE LMR CORRIDOR
State County/Parish Riverboat/Casino
Corridor Revenuesby State
(millions $2001)Corridor Employment
by StateBally’sBoomtown
Orleans
Treasure ChestArgosy
Louisiana
East Baton RougeCasino Rouge
$720 7,267
Adams, Coahoma,Tunica, Warren
Isle of Capri
Bally’s Saloon/GamblingHallHorseshoe CasinoFitzgerald’s CasinoGold Strike Casino ResortGrand CasinoHollywood CasinoSam’s TownHotel/Gambling Hall
Tunica
Sheraton CasinoTunica andWarren
Horizon’s Casino & Hotel
Ameristar CasinoWarrenRainbow Casino
Mississippi
Washington Lighthouse Point Casino
$1,550 18,369
Missouri Pemiscot Aztar Casino $230 346Sources: (1) Louisiana Gaming Control Board, Revenue Reports, obtained online http://www.dps.state.la.us/lgcb/on 2/26/03; (2) Mississippi Gaming Commission, Reports, obtained online from http://www.mgc.state.ms.us/ on2/26/03; (3) Missouri Riverboat Gaming Association, Casino Locations, obtained online fromhttp://www.mrga.org/ on 2/26/03; (4) Missouri Gaming Commission, Riverboat Gaming Financial Reports,obtained online from http://www.mgc.state.mo.us/ on 2/26/03; and (5) Various casino websites.
National Natural Landmarks
National natural landmarks are geological and ecological features that have beenidentified as significant examples of the nation’s natural heritage. They are designated by theSecretary of the Interior under the authority of the Historic Sites Act of 1935. Of the close to600 national natural landmarks in the U.S., nine are located within the LMR corridor. Exhibit 4-5 lists these landmarks and provides a brief description of their geological and ecologicalfeatures. Although visitation records are not kept for many of the corridor’s landmarks,available data suggest that hundreds of thousands of people visit the landmarks each year. Forexample, the Horseshoe Lake Nature Preserve alone received over 150,000 visitors in 1995.Other unique ecological features and key wildlife habitat are discussed later in Chapter 11.

4-11
Exhibit 4-5
NATIONAL NATURAL LANDMARKS IN THE LMR CORRIDORName of National
Natural Landmark County/State DescriptionBig Lake Natural Area Mississippi
County,Arkansas
Contains a significant amount of virgin timber and a mix ofsouthern, mid-western, and Ozark flora, and supports severalendangered bird species.
White River SugarberryNatural Area
DeshaCounty,Arkansas
Partially virgin forest containing excellent examples of threebottomland hardwood forest types and a wildlife populationtypical of the forest types present.
Heron Pond - Little BlackSlough Natural Area
JohnsonCounty,Illinois
The largest remaining cypress-tupelo swamp in Illinois, thislandmark includes a heron rookery and a valley system, withalluvial, colluvial, and lacustrine sedimentation.
Horseshoe Lake NaturalPreserve
AlexanderCounty,Illinois
Contains diverse aquatic and terrestrial flora and fauna andmature stands of bald cypress. It is also a major migrationcorridor for many waterfowl in addition to being anoverwintering area for thousands of Canada geese.
Lower Cache RiverSwamp
JohnsonCounty,Illinois
Remaining portion of the flood plain forest and open swampthat formerly extended across a vast area at the junction of theMississippi and Ohio river valleys. Three of the largest treesof their species grow on this land.
Green Ash Overcup OakSweetgum ResearchNatural Area (in DeltaNational Forest)
SharkeyCounty,Mississippi
Contains three very rare remnants of virgin bottomlandhardwood forest in the Mississippi River Delta Region. Someof the oldest sweetgum stands are 250-300 years old.
Big Oak Tree (in Big OakTree State Park)
MississippiCounty,Missouri
The only sizable tract of essentially virgin wet-mesicbottomland habitat.
Cupola Pond RipleyCounty,Missouri
An ancient sinkhole pond in the Ozark Plateaus, whichincludes a stand of disjunct water tupelo.
Reelfoot Lake Lake County,Tennessee
Contains water lily glades, cypress swamps, sawgrass jungles,and scattered bodies of open water formed in the winter of1811-12 as a result of the New Madrid earthquake. The sitecontains domes, sunken lands, fissures, sinks, sand blows, andextensive landslides.
Source: U.S. National Park Service, Mississippi River Corridor Study, Volume 2: Inventory of Resourcesand Significance, 1996; U.S. National Park Service, National Natural Landmarks Guide, obtained onlinefrom http://www.nature.nps.gov/nnl/ on 11/17/03.
TRAVEL EXPENDITURES ANDTRAVEL-GENERATED EMPLOYMENT IN THE LMR CORRIDOR
Tourists visiting the corridor’s cultural/historical resources and other attractions spendmoney on goods and services, such as lodging, food, transportation, souvenirs, andentertainment. Based on data provided by state tourism agencies, traveler expenditures in the

4-12
LMR corridor are close to $13.5 billion a year. These expenditures generated employmentopportunities for 183,000 people (see Exhibit 4-6).
It should be noted that travel expenditures typically include leisure, personal, andbusiness travel. Although the latter categories may be perceived as unrelated to historical andcultural resources, they encourage traffic in and around key tourist areas. While the motivationfor a particular trip may be business or personal, these visitors will share resources with andengage in some of the same activities that vacationers do. Thus, all travel expenditures areconsidered relevant to this assessment of tourism. It should be noted that corridor travelexpenditures include money spent on outdoor recreation (e.g., fishing, boating). This activity isdiscussed in more detail in Chapter 3, but the expenditures described here may partially overlapwith those reported for outdoor recreation.
As shown in Exhibit 4-6, the majority of travel expenditures occur in the Louisiana,Mississippi, and Tennessee portions of the corridor. These areas account for approximately$11.6 billion in travel expenditures, or about 86 percent of all travel expenditures. AlthoughTennessee has only six counties in the study area, it generates more tourism revenue than thecounties of Illinois, Kentucky, Missouri, and Arkansas combined because of the strength of thissector in Memphis. Mississippi’s tourism industry has grown rapidly in the past few years,thanks in large part to its gambling operations.
After Orleans Parish in Louisiana, Shelby County, which includes Memphis, and TunicaCounty, Mississippi, which is home to most of Mississippi’s gaming operations, generate themost travel dollars of all the corridor counties. Orleans Parish, which includes New Orleans,contributes almost $4 billion in total travel dollars. In Shelby County, approximately $2 billionis generated from travel. In Tunica County, Mississippi’s tourism operations yield more than $1billion in revenue.15
As is the case with revenues, Louisiana and Tennessee tourism account for the mosttravel-related employment in the LMR Corridor. In fact, close to 51 percent of all travel-relatedemployment is located in Orleans Parish, Louisiana and Shelby County, Tennessee.
15 It should be noted that due to 2001 data limitations, Mississippi revenue and
employment figures represent 2002 data.

4-13
Exhibit 4-6
TRAVEL EXPENDITURES IN THE LMR CORRIDOR, 2001
StateTravel Expenditures
($ Millions)Travel RelatedEmployment
Illinois $23.5 150Kentucky $8.3 170Missouri $275.7 9,390Arkansas $1,601.3 22,560Mississippi $2,210.7 29,300Tennessee $2,340.0 30,390Louisiana $7,048.4 91,030LMR Corridor Total $13,507.9 182,990Sources: (1) Arkansas Department of Parks and Tourism, Economic Impact of Travel inArkansas, 2002; (2) Illinois Tourism Network, Illinois Tourism Industry Stats, 2002,obtained online from http://www.tourism.uiuc.edu/itn/industrystats/ on 11/17/2003; (3)Kentucky Department of Tourism, Personal Communication with Barbara Atwood, February2003; (4) Louisiana Department of Tourism, The Economic Impact of Travel on LouisianaParishes, 2002, Travel Industry Association of America, August 2002; (5) MississippiDevelopment Authority, Fiscal Year 2002 Economic Impact for Tourism and Recreation inMississippi, February 2003, Division of Tourism Development Research Unit; (6) MissouriDivision of Tourism, Personal Email Communication with Bob Hain and Dee AnnMckinney, 2003. (7) Tennessee Department of Tourist Development, The Economic Impactof Travel on Tennessee Counties 2001, Travel Industry Association of America, June 2002.
TRENDS
Travel and tourism expenditures have decreased nationwide, and tourism in the LMRcorridor has not been immune to this trend. However, while certain counties suffered, othersenjoyed sizeable increases in revenues and a corresponding increase in job opportunities. Belowwe discuss trends in the three LMR states with the greatest tourist activity.
• Mississippi: Tourism is on the rise in Mississippi. Among the forcesdriving this increase is casino gaming. Gross gaming revenues increasedby more than seven percent in the LMR region, with Adams, Warren, andWashington counties among the most substantial contributors. TheMississippi Development Authority’s 2002 Economic Impact Report forTourism and Recreation reports that casino gaming was the “primary trippurpose” for visitors in 2002. Gaming dollars increase demand for othertravel-related services. Demand for lodging and restaurant meals is on therise in the LMR corridor and Mississippi as a whole. The number of hotelrooms grew by roughly 4 percent in 2002, to just under 54,000. Thefigure is slated to grow by roughly 1,300 in 2003 according to theMississippi Development Authority. The Mississippi DevelopmentAuthority highlights the importance of the gaming industry and continued

4-14
development of heritage, business, and recreational tourism to futuregrowth in Mississippi.16
• Louisiana: New Orleans traditionally attracts tourists interested in itsfamous blues and Jazz music, Cajun cuisine, and Mardis Gras festivals.However, rural villages and towns also have a rich history of similarinterest to tourists. With its emphasis on rural tourism, the LouisianaDepartment of Culture, Recreation, and Tourism, in coordination withseveral other state organizations, is working to generate awareness amongtravelers about these “off the beaten path” opportunities. The strategyaims to bring the historic elements of remote areas to the surface, tointegrate them with those that are better known, and in the end, to offertourists a complete view of Louisiana history, culture, and tradition.17
• Tennessee: Although tourism in Tennessee is strong, the TennesseeDepartment of Tourist Development (TDTD) is committed to maximizingthis industry’s potential. Individual attractions are well developed, but theTDTD seeks to integrate attractions and create a statewide tourismnetwork.18 This initiative focuses on Heritage and Community Tourism.Heritage Trails, including the History, Music, and Arts and Crafts Trails,integrate tourism in the eastern, middle, and western sections of the state.Not only is this effort intended to bolster tourism, but also to encourageeconomic development in small rural communities.
16 Mississippi Development Authority, 2002 Economic Impact Report for Tourism and
Recreation, Division of Tourism Development, February 2003.
17 Louisiana Department of Culture, Recreation, and Tourism, Success Stories 2001:Building Tourism by Reconnecting with Your Community’s Heritage, Eleventh Louisiana RuralTourism Development Conference, November 2001; Louisiana Department of Culture,Recreation, and Tourism, Louisiana Folklife Program, obtained fromhttp://www.crt.state.la.us/folklife/main_reg_folk_program.html on 3/28/03.
18 Tennessee Department of Tourist Development, 2002-2003 Marketing Plan, obtainedfrom http://www.state.tn.us/tourdev on 3/25/03.

5-1
WATER SUPPLY CHAPTER 5
Water from the Lower Mississippi River is an essential input to industrial andagricultural production. To a lesser extent, residents of the corridor also depend on LMR surfacewater for domestic use. Overall, the corridor supplies almost 11 billion gallons of surface watereach day. The majority of the surface water withdrawals go to industrial users andthermoelectric power plants, which supply themselves with surface water. Indeed, 96 percent ofthe surface water used in the LMR corridor is self-supplied.
Domestic customers (i.e., households) in the LMR region use only a fraction of the totalsurface water withdrawn, relying instead upon groundwater to meet their needs. However,public water supply systems drawing on surface water have annual revenues of roughly $51million and employ over 470 individuals.
The discussion below is divided into several sections. First, we review the data sourcesand methods used to estimate key figures. We then provide an overview of the water supplysector in the region, summarizing total quantities supplied and major users. Finally, we discussrevenue and employment estimates.
DATA SOURCES AND METHODOLOGY
Water supply data provided in this chapter are based on the U.S. Geological Survey’s(USGS) Water Use in the United States county estimates for 1995.1 In the USGS data, publicsupply estimates include all public and private water systems that supply water to at least 25people, or have a minimum of 15 connections. In this chapter, we report all surface waterwithdrawals in the 113-county study area.
For water use in the public supply system, USGS estimates deliveries to specific sectorsby gathering information from water supply authorities and through per-capita estimates (in thecase of domestic users). These estimates, however, do not indicate whether these deliveries aregroundwater or surface water. Our estimates therefore assume that the public supply mimics thebreakdown between groundwater and surface water of total withdrawals and deliveries. Basedon the overall split of surface water and groundwater use in the corridor, this analysis assumes40 percent of the water used by each category of user is from surface water supplies.
1 The 1995 data are the most recent data available from USGS.

5-2
Almost all of the surface water used in the LMR corridor is self-supplied surface water.For industrial and commercial businesses, USGS obtains its data on self-supplied withdrawalsfrom state agencies that permit withdrawals or require permits to operate drinking watersupplies. For example, self-supplied water use estimates for the industrial sector are generatedusing state permit programs that require industrial users to report withdrawals and returns. Insome cases, USGS bases the total amount of self-supplied withdrawals on the population offacilities (i.e., workers in an office building, average occupancy of a hotel, or the number ofstudents at a university).
Employment and revenue figures for the public water supply sector come from theIMPLAN model. These data are described in greater detail in the revenue and employmentsection at the end of the chapter.
OVERVIEW OF WATER SUPPLY AND WATER USERS
Water users in the LMR region draw water from ground and surface water sources. Eachof these major categories of water is broken down into water that is self-supplied and water thatcomes from a public supply system. This analysis focuses on estimated surface waterwithdrawals, both public and self-supplied, because surface water is tied most directly to waterbodies such as the LMR and its tributaries.
Public Surface Water Supply System
Public supply systems furnish 975 million gallons of water per day in the 113-countyLMR corridor. However, only 40 percent or 390 million gallons of this water is withdrawn fromsurface water sources (see Exhibit 5-1), with the remainder drawn from groundwater resources.This quantity represents only four percent of the total surface water used in the region. Domesticconsumers (i.e., households) use about 63 percent of the publicly supplied surface water;industrial, commercial, or public users consume the remainder.
Surface water is subjected to a rigorous treatment process. After water is withdrawn, it isgenerally transported to publicly-owned treatment facilities, which filter, disinfect, and removeorganic and inorganic contaminants from the water. To ensure that a water supply meetsregulations, water is tested at various stages of the treatment process for contaminants. Aftertreatment, the water is delivered to domestic, commercial, and industrial water users throughtransmission pipes.

5-3
Exhibit 5-1
LMR CORRIDOR SURFACE WATER USE, 1995(millions of gallons per day)
User Category
Public WaterDeliveries fromSurface Water
Self-SuppliedSurface Water
Total SurfaceWater Use
Thermoelectric Power 0.5 6,866.9 6,867.4Industrial 27.8 2,105.7 2,133.5Domestic 246.8 0.03 246.8Commercial 56.9 22.1 79.0Mining - 2.1 2.1Agriculture - 248.0 248.0Irrigation - 1,207.9 1,207.9Public Use and Water Losses 58.2 - 58.2Total 390.2 10,452.7 10,842.9Source: U.S. Geological Survey, Water Use in the United States, 1995, obtained from“http://water.usgs. gov/watuse/” on 4/21/2003.
Domestic Surface Water Users
Domestic water use includes water for normal household purposes such as drinking, foodpreparation, bathing, flushing toilets, washing clothes and dishes, and watering lawns andgardens. Domestic users are the largest recipients of public surface water supply in the LMRcorridor, accounting for approximately 63 percent of all deliveries.2 Total surface waterdeliveries to domestic water supply systems in the LMR corridor were 247 million gallons perday during 1995. Louisiana uses the majority of surface water supplied to the domestic market.Most significantly, New Orleans draws water directly from the Mississippi River. In 2001, twoplants provided more than 125 million gallons of drinking water per day to an estimated 480,000people in the New Orleans area.3
Groundwater dominates domestic public supplies in most parts of the LMR corridor.Memphis Light, Gas, and Water (MLGW) uses 175 artesian wells to supply water to anestimated 250,000 commercial, industrial, and residential customers in Shelby county.According to the MLGW, Memphis is the largest city to rely on aquifer supplied water alone.4
2 As noted, to estimate surface water deliveries to specific user categories, we use the
40/60 percent split of surface water to groundwater withdrawals in the total public supply toweight the deliveries to each sector.
3 Sewage and Water Board of New Orleans, Quality Water 2001: A Report on the State ofTap Water in New Orleans, obtained from http://www.swbnola.org on 5/21/03.
4 Memphis Light, Gas, and Water, Water Quality Report 2001, obtained fromhttp://www.mlgw.com on 5/21/03.

5-4
Mississippi’s LMR counties also draw water predominantly from subterranean aquifers. Of the1,535 public water systems in the Mississippi counties along the corridor, only three providesurface water to their users.5 Parishes in the vicinity of Baton Rouge, Louisiana, including thecity itself, also draw water from subterranean aquifers. However, concerns over depletion ofaquifers suggest that more counties may be using surface water in the next century. In thevicinity of Baton Rouge, water levels declined by one to three feet per year in the 1990s.6
Commercial Surface Water Users
Commercial water use includes water for hotels, motels, restaurants, office buildings andcivilian and military institutions. Deliveries to golf courses are also included in commercialwater use. Commercial users receive approximately 15 percent of all public supply surfacewater deliveries in the LMR corridor. Total surface water deliveries to commercial water users inthe LMR were 57 million gallons per day during 1995. These facilities used an additional 22million gallons per day of self-supplied surface water. Louisiana and Tennessee are the largestcommercial water users. The large tourism sectors in these states (and associated establishmentssuch as hotels and restaurants) likely drive this use.
Public Use and Water Losses of Surface Water
Public use accounts for approximately 15 percent of all surface water deliveries from thepublic supply in the LMR corridor. Public water use includes water used for firefighting, streetwashing, municipal office buildings, parks and swimming pools, and water used to flush outfilters at water treatment facilities. This category also includes water that is lost in thedistribution system.
Self-Supplied Surface Water
In addition to deliveries from the public supply, many sectors also use self-suppliedsurface water. During 1995, the total amount of self-supplied surface water withdrawals in theLMR corridor was ten billion gallons per day. Generally, self-supplied surface water is morecommon in industrial sectors that use the water for cooling or other purposes that require little orno purification of the water. Three sectors are most significant:
• Thermoelectric Power: As shown in Exhibit 5-1, thermoelectric powergenerators used roughly 66 percent of self-supplied surface water in 1995.The thermoelectric power category includes the generation of power withfossil fuel and nuclear energy. In total, there are 109 power plants in the
5 Groundwater Protection Council, Mississippi Groundwater Resources, obtained from
http://www.gwpc.org on 6/05/03.
6 Lovelace, John, The Chicot and Southeast Louisiana Aquifer Systems, Louisiana WaterSummit, USGS, 2001, obtained from http://www.agctr.lsu.edu/lawater/lovelace.asp on 5/21/03.

5-5
LMR corridor. The majority (92) of these plants are fossil fuel plants, ofwhich more than half are located in Louisiana. This state accounts for 5.4billion of the 6.9 billion gallons of surface water withdrawn per day bypower plants in the LMR.
• Industrial Users: Industrial facilities used an additional 20 percent oftotal self-supplied surface water. Industrial water use includes processing,washing, and cooling water used in facilities that manufacture products.Industrial water users account for only seven percent of all public supplysurface water deliveries in the LMR corridor, but they are heavy users ofself-supplied water. Industrial facilities used about two billion gallons perday of self-supplied surface water in 1995. Louisiana is the largestindustrial consumer of surface water, accounting for 95 percent of thetotal.
• Irrigation Users: Self-supplied surface water is also used to irrigatecropland in the LMR corridor. Arkansas uses 75 percent of the 1.2 billiongallons withdrawn per day for irrigation. Rice production requiresparticularly large amounts of water, driving Arkansas’ demand forirrigation water.
REVENUE AND EMPLOYMENT IN THE WATER SUPPLY SECTOR
The water supply and sewerage sector in the LMR corridor employs roughly 1,180people and generates an estimated $126 million in revenue according to the IMPLAN model.However, because a portion of the supply activity reflected in these figures is based ongroundwater supply, we scale the figures to estimate the portion of employment and revenueassociated with surface water withdrawals. Our estimates therefore assume that the portion of therevenue and employment generated by publicly supplied surface water mimics the breakdownbetween groundwater and surface water withdrawals and deliveries (i.e., 40 percent of the watersupply and sewerage sector revenue and employment is generated by activities related to surfacewater supply).7 The resulting employment and revenue estimates are presented in Exhibit 5-2.As shown, roughly 472 people are employed at relevant water supply facilities, which generatean estimated $51 million in output. Louisiana is both the largest employer and revenue generatorin this sector, reflecting its relatively heavy use of the publicly supplied water in the corridor.
7 IMPLAN data for this sector include operation of sewerage systems as well as water
supply systems. As a result, we likely overstate revenue and employment in the water supplysector.

5-6
Exhibit 5-2
EMPLOYMENT AND REVENUE ASSOCIATED WITH LMR CORRIDORSURFACE WATER SUPPLY
EmploymentEstimated Revenue
(millions $2001)Arkansas 102 $10.9Illinois 5 $0.9Kentucky - -Louisiana 270 $30.8Mississippi 90 $7.1Missouri 4 $0.8Tennessee 1 $0.1Total 472 $50.6Source: IMPLAN, 1998.

6-1
AGRICULTURE CHAPTER 6
Agriculture plays a major role in the economy of the Lower Mississippi River corridor.The agricultural sector in the LMR corridor employed more than 103,000 people and generatedmore than $6.8 billion in total revenue in 1997 – 84 percent or $5.7 billion from the productionof crops and over $1.1 billion from livestock and livestock products.1 Soybeans and cotton arethe dominant crops in this region, representing 28 percent and 27 percent respectively of thedollar value of total crops cultivated in the LMR area. Approximately 22 million acres in thecorridor are used for agricultural purposes, with an estimated 53,000 farms. Although these53,000 farms represent only 11 percent of farms operating in the seven-state region, they arelarge and produce 21 percent of total agricultural output in dollar terms.
While LMR agriculture clearly makes a substantial contribution to the local economy, itis also important to the national economy. The counties in the LMR region produce 25 percent oftotal U.S. ginned cotton and eight percent of the national soybean harvest. The Mississippi Riverhas been instrumental in making this area an important agricultural region since the birth of thenation. Farmers along the LMR and in the seven-state LMR region depend on the river to shipfarm products throughout the Mississippi River system and outside of it. Farm productsaccounted for close to 35 percent of all goods shipped on the LMR in 2001, or about 164 milliontons. With agricultural inputs also arriving via the River, it is clearly a critical component of theagricultural supply chain. Access to the River as a means of transportation improves theefficiency of regional agricultural activity.
The River also provides water for crops and livestock. Farmers along the LMR useroughly 248 million gallons of fresh surface water per day for livestock watering, feed lots, dairyoperations, and other farm needs. In addition, the River supports irrigated agriculture with 1.2billion gallons of fresh surface water per day delivered to six million acres of farmland, or about27 percent of the total acres farmed in the corridor. Irrigation rates tend to vary from year to yeardepending on annual rainfall, farm commodity prices, application technologies, and conservationpractices; however, the River’s close proximity to agricultural lands ensures farms an adequatesupply of water and thus more reliable harvests.2
1 The estimate of employment in the agricultural sector reflects full-time and part-time
employees.
2 U.S. Geological Survey, Water Use in the United States, 1995, obtained fromhttp://water.usgs.gov/watuse/ on 1/02/03.

6-2
This chapter provides an overview of the LMR corridor’s agricultural sector, includinginformation on the major crops and livestock produced; number of farms and acres harvested;revenues and employment in agriculture; and future trends. In addition, this chapter discussesaquaculture in the LMR corridor and its growing contribution to the region’s economy.
DATA SOURCES AND METHODOLOGY
We define the agriculture sector using the activities described in the U.S. AgriculturalCensus, which include crop and livestock production. Our data analysis focuses on the marketvalue of major crops in the region as a whole. Total crop value, however, reflects both majorand minor crops.
Livestock production refers to the keeping, grazing or feeding of livestock for the sale oflivestock or livestock products. Livestock includes cattle, hogs, sheep, goats, and poultry of allkinds. In addition, it includes “animal specialties” -- the production of more specialized animalssuch as horses, and fur-bearing animals. Establishments primarily engaged in the production ofdairy products such as milk and eggs are also captured in these data. The market value oflivestock and livestock products was taken from the 1997 U.S. Agricultural Census.3
Aquaculture refers to on-farm aquaculture practices that result in the harvest of aquaticproducts for sale or domestic consumption, including finfish, shellfish, and crustaceans. StateAgricultural Statistical Services collect information annually on aquaculture output and revenue.We draw upon the 2001 estimates published by each of the LMR state agencies.
Employment information for livestock production, crop production, and agriculturalservices comes from the IMPLAN county database and reflects 1998 totals. Agriculturalservices include activities such as crop services performed to prepare crops for market or furtherprocessing, and farm labor and management services. It is important to note that IMPLAN doesnot make a distinction between full-time and part-time employment. Given the large demand forpart-time and seasonal workers in agriculture, the IMPLAN employment estimate is likely to besignificantly higher than the estimate of full-time equivalent employees for the sector.
Revenue and employment associated with food processing and preparation activities(e.g., milling grain) are not included in this chapter; they are discussed under Manufacturing (seeChapter 10).
3 U.S. Department of Agriculture, National Agricultural Statistics Service, 1997
Agricultural Census, obtained from http://www.nass.usda.gov/census/ on 2/03. At the time thisreport was developed, the 1997 Census data were the most recent data available.

6-3
OVERVIEW OF THE LMR CORRIDOR’S AGRICULTURAL SECTOR
For over 200 years, the Mississippi Delta has been a major agricultural region. Overtime, forested wetlands have been cleared for agriculture and today, roughly 48 percent of theLMR corridor is classified as agricultural land. The soils are naturally fertile, and in many areas,periodic flooding transfers sediment to the topsoil. Likewise, the climate is warm, whichcontributes to a long growing season.
Roughly 22 million acres were used for agricultural activities in the LMR corridor in1997 (see Exhibit 6-1). State agricultural acreage in the corridor ranges from roughly 260,000acres in the three Illinois counties to approximately 8,100,000 acres in the 27 Arkansas counties.The average value per acre in the LMR seven-state area ranges from $1,134 in Missouri to$2,258 in Illinois. Based on state-specific estimates for the average value per acre and the censusestimates for total acreage farmed, the total value of all farmland in the corridor approached $30billion in 1997.
As shown in Exhibit 6-1, the major agricultural commodities produced in the LMRcorridor are diverse, and include cotton, soybeans, grains such as rice and corn, livestock, andsugarcane. Agricultural production fuels a great deal of other economic activity in the regionand outside of it. Farmers must purchase seed, fertilizer, and farm equipment to generate theirproduct. Once harvested, crops are sold to food processors that add value by transforming theraw material into soybean oil, flour, corn oil, cheese, butter, processed milk, and textiles. Inaddition to off-farm activities, agricultural production fuels additional on-farm production; cropssuch as soybeans and corn are often processed and used to feed livestock.
As we will discuss, cotton and soybeans dominate crop revenue in the LMR region.Therefore, the discussion below highlights the uses of these commodities and how they affect thelarger regional economy.

6-4
Exhibit 6-1
OVERVIEW OF AGRICULTURE IN LMR CORRIDORTotal Agricultural
Land in Acres(1997)
Average Value ofLand Per Acre
($2001)
Total AgricultureLand Value
(millions $2001) Major ProductsArkansas 8,081,589 $1,219 $9,853.9 Rice, Poultry, Soybeans,
Wheat, CottonKentucky 417,130 $1,537 $641.3 Tobacco, Live
Animals/Meat, FeedGrains, Soybeans
Louisiana 5,015,018 $1,283 $6,433.9 Sugarcane, Cotton, Rice,Soybean
Mississippi 4,272,465 $1,771 $7,565.1 Broilers, Cotton,Soybean, Cattle
Tennessee 1,055,997 $1,919 $2,026.6 Cattle, Broilers, DairyProducts, Cotton,Greenhouse/nursery
Illinois 258,728 $2,258 $584.3 Hogs, Cattle, Dairyproducts, Corn,Soybeans
Missouri 2,770,516 $1,134 $3,143.1 Soybeans, Feed Grains,Wheat, Poultry, LiveAnimals/Meat
Total 21,871,443 $30,248.2Sources: (1) U.S. Department of Agriculture, National Agricultural Statistics Service, Agricultural Census 1997,obtained online.
Soybeans
Soybean growers in the LMR counties harvested over 243 million bushels of soybeans in1997, representing more than nine percent of all U.S. production. While soybean productionexists throughout the corridor, it is especially concentrated in Arkansas, Cross, Mississippi, andPhilips Counties in Arkansas and Bolivar and Washington Counties in Mississippi.4
Innovative processing efforts have identified a wide range of uses for soybeans. Duringprocessing, soybean oil is extracted from the bean. Soybean oil and the lecithin it contains act asboth an emulsifier and a lubricant, making this oil appropriate for use by cooks, pharmaceuticalcompanies, and manufacturers alike. The oil extraction process leaves a flaky substance, whichcan be manufactured into soy protein and soybean meal. These soy products are an importantsource of protein for humans and livestock. Soy protein contains eight amino acids essential forhumans, and according to the American Soybean Association, approximately one million bushels
4 U.S. Department of Agriculture, National Agricultural Statistics Service, 1997
Agricultural Census, obtained from http://www.nass.usda.gov/census/ on 2/03.

6-5
of soybeans are used in animal feed annually.5 More recently, soybeans are being marketed asthe answer to U.S. fuel supply and pollution issues, providing an alternative to diesel fuel.Biodiesel is being test-marketed in several LMR states.6
The soybean supply chain has a resounding effect on the LMR corridor. Starting withagricultural inputs for soybean production and finishing with products like soybean oil, this cropfuels a diverse array of agricultural and industrial sectors. As a result, its contribution to theLMR economy is larger than the $1.6 billion directly generated from its harvest. For example,soybean meal feeds chickens that support the $750 million poultry market in Missouri. Indeed,poultry consume more than half of the soybean meal produced in the U.S.7
Cotton
More than 4.8 million bales of cotton were produced in the LMR corridor in 1997,representing 26 percent of the total U.S. cotton production. Mississippi produced 31 percent andArkansas roughly 33 percent of the LMR corridor total. While a number of Mississippi countiescombine to produce this substantial amount of cotton, Mississippi County, Arkansas dominatesproduction in that state. 8
Used primarily to manufacture textiles and paper products, cotton contributessignificantly to the off-farm economy. Cotton production directly employed more than 8,300people in 1998 and generated more than $1.5 billion in revenue in 1997. However, mill productsand fabric based goods generated $2.4 billion in revenue and employed 21,000 people in 1998 inthe corridor according to IMPLAN data. 9
The apparel industry uses the most cotton, followed by the home fabrics market. In 1999,11 million bales of cotton were sold to U.S. textile mills of which 6.5 million and 4 million baleswere processed into apparel and home fabrics respectively. Further, a number of countries
5 American Soybean Association, Communication the Importance of Domestic Swine and
Poultry Production, 2003, obtained from http://www.amsoy.org on 4/02/03.
6 American Soybean Association, Biodesiel Backgrounder, Oct 25, 2002, obtained fromhttp://www.amsoy.org on 4/04/03.
7 American Soybean Association, Communication the Importance of Domestic Swine andPoultry Production, 2003, obtained from http://www.amsoy.org on 4/02/03.
8 U.S. Department of Agriculture, National Agricultural Statistics Service, 1997Agricultural Census, obtained from http://www.nass.usda.gov/census/ on 2/03.
9 IMPLAN, 1998 and U.S. Department of Agriculture, National Agricultural StatisticsService, 1997 Agricultural Census, obtained from http://www.nass.usda.gov/census/ on 2/03.

6-6
import significant quantities of U.S. cotton, including Mexico and El Salvador. U.S. cottonrepresents approximately 75 percent of total cotton imports to these countries.10
REVENUE AND EMPLOYMENT IN THE AGRICULTURAL SECTOR
As shown in Exhibit 6-2, LMR crop and livestock production generated $6.8 billion inrevenues in 1997 -- $5.7 billion in crop revenues and over $1.1 million in livestock revenues.These industries employ more than 103,000 people. Cotton, soybeans, rice and corn dominatecrop production in the LMR region in dollar terms. Farmers in the corridor produced $1.6 billionworth of soybeans, $1.5 billion worth of cotton, and $474 million worth of corn in 1997.11
Arkansas and Mississippi are the dominant producers of cotton and soybeans. Missouri andLouisiana, however, generate the most revenue from corn.
Livestock production is a small market compared to the value of all crops produced andsold in the LMR region. While crops represent 84 percent of total agricultural dollars, livestockand livestock products generate only 16 percent of total agricultural income. Cattle are thelargest single livestock product broken out in the Agricultural Census data, but the category of“other livestock” generates the most revenue for the LMR corridor. This category includessheep, lambs, wool, poultry, and poultry products, as well as the Census catch-all “otherlivestock and livestock products.” Missouri and Tennesse have the highest pig and hog sales,while Arkansas and Louisiana dominate both the dairy and cattle markets. Tangipohoa Parish,Louisiana, represents more than half of the dairy market along the corridor.
Exhibit 6-3 highlights key counties where agricultural production is concentrated, basedon crop and livestock revenues.
10 Cotton Board, How U.S. Cotton Finds Its Way into the U.S. Consumer Market,
obtained from http://www.cottonboard.org on 4/04/03.
11 The Agricultural Census statistics group rice with other grains, preventing individualreporting of rice revenues.

6-7
Exhibit 6-2
AGRICULTURAL REVENUE BY ACTIVITY IN THE LMR CORRIDOR IN 1997(thousands $2001)
Soybeans Cotton Corn Wheat
OtherGrains
(includingrice)
Other Crops(includingsugarcane)
DairyProducts Hogs Cattle
OtherLivestock
All Cropsand
LivestockArkansas $648,054 $520,082 $52,039 $121,310 $820,071 $72,238 $8,695 $1,266 $69,820 $303,993 $2,617,568Missouri $220,151 $187,486 $140,815 $44,369 $75,191 $28,148 $6,701 $9,557 $40,795 $71,415 $824,628Tennessee $111,294 $60,358 $37,088 $14,875 $995 $26,098 - $6,591 $12,940 $6,388 $276,627Illinois $19,047 - $9,130 $2,035 $541 $3,159 $107 $1,884 $5,240 $996 $42,139Kentucky $39,551 - $32,174 $6,389 $4,719 $9,245 $3,387 $4,977 $4,571 $31,154 $136,167Mississippi $327,520 $440,682 $81,996 $18,669 $172,339 $60,039 $5,723 $1,391 $33,255 $271,071 $1,412,685Louisiana $197,005 $332,890 $120,644 $6,848 $197,803 $414,670 $47,031 $781 $78,311 $127,953 $1,523,936LMRCorridor
$1,562,622 $1,541,498 $473,888 $214,495 $1,271,659 $613,597 $71,644 $26,447 $244,932 $812,970 $6,833,750
Note: The total crops and livestock estimate for the LMR corridor does not reflect minor crops produced because data on crops produced in smaller quantities are notavailable at the county level. Totals may not sum due to rounding.Source: U.S. Department of Agriculture, National Agricultural Statistics Service, Agricultural Census, 1997.

6-8
Exhibit 6-3
AGRICULTURAL REVENUES BY COUNTY, 1997

6-9
The agriculture sector employed more than 103,000 people in the LMR corridor in 1998(see Exhibit 6-4). While oil-bearing crops (primarily soybeans) employed 18 percent, wheat andrice employed 20 percent of the total agricultural workforce. Cotton occupied only 8 percent ofthe agricultural workforce, reflecting the capital-intensive nature of modern cotton production.The production of livestock and livestock products employed approximately 15 percent of allfarm workers in the LMR corridor. Most of the remaining workers were employed inagricultural services, including establishments primarily engaged in soil preparation services,veterinary services, and farm labor and management services.
AQUACULTURE
The LMR corridor has an active and growing aquaculture industry, due in part toresource advantages unique to the region. For aquaculture, it is important not only to have asufficient supply of water, but also to have water of a certain quality and temperature on aconsistent basis. Pumping water from the Mississippi River Delta aquifers helps the industryaddress these needs. The majority of fish are grown in man-made ponds. The cost of acquiringappropriate land in addition to the cost of constructing fish ponds creates a significant barrier to
Exhibit 6-4
EMPLOYMENT IN THE LMR CORRIDOR’S AGRICULTURAL SECTOR, 1998
Source: IMPLAN model data, 1998.
0
5000
10000
15000
20000
25000
Oil BearingCrops,
includingSoybeans
Cotton Livestockand Other
AnimalProducts
Wheat andRice
Sugar Crops Corn andOther Field
Crops
Agricultural,Forestry,FisheryServices
Other
Agricultural Activity
Employment

6-10
entry.12 In addition, feed costs are estimated to contribute 50 percent to the total operatingexpenses of a 10-acre pond.13 Any variability in feed prices can have a substantial impact on theprofitability of aquaculture investments. The availability of water, therefore, does not alleviateall market challenges.
Aquaculture in the LMR corridor has grown substantially in recent years. Catfishrevenues alone have grown by roughly 31 percent in the past four years.14 Catfish productiondominates the aquaculture sector in the LMR region, representing close to 99 percent of allidentified aquaculture revenues. Although most of the LMR states engage in aquaculture, onlyArkansas, Louisiana, and Mississippi generate substantial output. Indeed, 95 percent of U.S.catfish is harvested in four states, Alabama, Arkansas, Louisiana, and Mississippi, withMississippi representing 70 percent of the total.15
Total LMR corridor catfish revenues were about $297 million in 2001 (see Exhibit 6-5).Mississippi counties harvested 70 percent of this total, while Arkansas counties contributed 22percent. Louisiana devotes six times as many acres to the harvest of crayfish than catfish;however, catfish generates roughly eight percent more revenue for the local economy than thecrayfish haul. Because of the small size of this industry in Louisiana, parish estimates of annualcatfish revenues are not disclosed. However, regional estimates indicate that several parishes,including Catahoula and East Carroll, are important contributors.16
12 Southern Regional Aquaculture Center, Species Profile: Bigmouth Buffalo, June 2000,
Conrad W. Kleinholz.
13 Louisiana State University Agricultural Center, Projected Costs and Returns forCrawfish and Catfish Production in Louisiana, 2002, Boucher and Gillespie, January 2002.
14 This figure represents a rough estimate of catfish market growth in the LMR corridorbased on 1997 county data and 2001 district level data. Due to data limitations, a county-to-county comparison cannot be made. This figure, therefore, may slightly overestimate growth.
15 Thad Cochran, National Warmwater Aquaculture Center, Delta Branch ExperimentStation, Farm-raised Catfish, Fact Sheet, June 2000, obtained from http://www.msstate.com on3/21/03.
16 Louisiana State University Agricultural Center, Aquaculture Factsheet, February 2001.

6-11
Exhibit 6-5
LMR CATFISH REVENUES, 2001State Revenue (millions $2001) Percent of Total
Arkansas $64.7 22%Mississippi $207.5 70%Louisiana* $24.4 8%Total** $296.6 100%* The Louisiana State University Agricultural Center reported catfish revenue of close to $40 million in 2001, whilethe Louisiana Agricultural Statistical Service reported it to be considerably smaller, $26.2 million. We use the latterfigure; therefore, we may underestimate Louisiana’s regional catfish revenues.**This figure may overestimate the total due to the statistical reporting method used by the three state agriculturalstatistical offices. Markets are reported by region and in some cases these regions include counties outside the LMRcorridor. Available data do not allow us to separate each county’s contribution to regional catfish production. ForArkansas and Mississippi, the regions closely correspond to the LMR region. In Louisiana, however, there are anumber of counties included in the regions that are outside the LMR corridor.Source: Arkansas Agricultural Statistical Services; Mississippi Agricultural Statistical Services; LouisianaAgricultural Statistical Services; obtained online March 2003.
Catfish from the LMR support both the seafood and the sport fishing industries.Approximately 60 percent of catfish are sold to processing plants where the live fish are cut intofillets and steaks or left whole. Processors sell these catfish products to markets either frozen oron ice. The remaining 40 percent of the catfish harvest is sold to individuals or companiesinvolved in sport fishing.17
As it has in the past, the aquaculture industry in the United States will face significantchallenges going forward. According to Aquaculture Magazine, almost 89 percent of globalaquaculture production is located in Asia. With inexpensive sources of labor, more abundantacreage at their disposal, and fewer regulations constraining them, farmers in Asia face lowerproduction costs and enjoy a competitive edge in global markets.18
TRENDS
Agricultural trends in the LMR region reflect nationwide trends toward fewer, largerfarms. The total number of farms in the LMR study area has decreased by more than 7,700 or 13percent since 1987. Louisiana, Mississippi, and Missouri experienced declines equal to or largerthan the region as a whole. Exhibit 6-6 shows the decrease in farms over time in the LMRcorridor.
17 “Catfish – Channel (Ictalurus punctatus),” Aquaculture.com, obtained from
http://www.aquaculture.com on 3/17/03.
18 Acquaculture Magazine, Difficult Issues for Aquaculturists in the US and Around theWorld, May/June 2002, Brenda Jo Narog.

6-12
In general, family-owned farms with relatively little acreage are being consolidated intolarger, more mechanized farms. As evidence, consider that the total number of farms hasdecreased, while the total acreage under cultivation has remained unchanged. For the most part,the average number of acres per farm has increased in LMR states by three to fourteen percent.In Illinois and Tennessee, however, the average number of acres per farm decreased. (see Exhibit6-7).
Soybeans
Fueled by strong demand from the livestock market for feed, domestic soybeanconsumption has risen in recent years, climbing from roughly one billion bushels in 1980 toroughly 1.8 billion bushels in 2000. Exports have increased during this period, but this markethas been volatile and remained below one billion bushels since 1980.19
19 Economic Research Service, Agricultural Baseline Projections: U.S. Crops, 2003 –
2012,USDA, February 13, 2003, obtained from http://www.ers.usda.gov on 3/10/03.
Exhibit 6-6
NUMBER OF FARMS IN LMR AREA, 1987 TO 1997
0
2000
4000
6000
8000
10000
12000
14000
16000
18000
1987 1992 1997
Year
Num
ber
of F
arm
s IllinoisKentuckyTennesseeMississippiMissouriLouisianaArkansas
Source: U.S. Department of Agriculture, National Agricultural Statistics Service, Agricultural Census, 1997.

6-13
Although domestic demand for soy products is expected to remain strong and fuel theLMR’s harvest of soybeans, low-cost alternative suppliers are affecting demand for domesticproduction. Weather patterns in Brazil have cooperated to provide the nation with a bountifulharvest. Lower prices and exchange rate advantages make the Brazilian crop attractive tobuyers. U.S. farmers, however, are working hard to cultivate export markets. Key U.S. marketsare the EU, China, and Mexico.20 To maintain these markets, producers are identifying new usesfor soybeans and learning how to tailor their product to different types of soybean use. Marketingorganizations are working to identify niche segments of the soybean market to which U.S.growers can customize their output. For example, a particular customer set is interested inbiotech-free, edible soybeans. This type and other types of “identity-preserved” soybeans areaimed not only at maintaining U.S. dominance in this sector, but also at transforming the
20 Economic Research Service, Agricultural Baseline Projections: U.S. Crops, 2003 –
2012,USDA, February 13, 2003, obtained from http://www.ers.usda.gov on 3/10/03.
Exhibit 6-7
AVERAGE NUMBER OF ACRES PER FARMIN THE LMR SEVEN-STATE AREA
Source: U.S. Department of Agriculture, National Agricultural Statistics Service, Agricultural Census, 1997.
0
100
200
300
400
500
600
700
800
900
1000
Illino
is
Mississ
ippi
Kentuc
ky
Tenne
ssee
Missou
ri
Louisi
ana
Arkansa
s
State
Average A
cres per Farm
19921997

6-14
soybean from a commodity to a specialized product that commands higher values on worldmarkets.21
Cotton
Domestic cotton demand from mills reached a peak in the late 1990s and fell sharplyafter 1999. In the new millennium, this decline stopped and demand has flattened. Exportdemand reached its peak several years after domestic demand, but did not face the same steepdecline in the years that followed. 22
Even greater than its local impact, LMR corridor cotton has a significant impact onemployment and export revenues around the world. Taking advantage of low wages in foreigncountries, clothing companies have moved a substantial amount of garment production overseasto countries like Bangladesh, India, Malaysia, and more recently to African nations, like Kenyaand Madagascar.
Although the global connection is beneficial to LMR cotton growers, reliance on foreignmanufacturing to produce end products reduces the overall contribution that cotton makes to theLMR economy. Furthermore, growing foreign competition in cotton production from India,Pakistan, Turkey, and China, as well as falling prices, challenge U.S. cotton production goingforward.
The Economic Research Service of the United States Department of Agriculture expectstotal cotton production to remain flat through the end of the decade. Domestic mill use dippedbelow cotton exports early in the decade and is expected to remain more than three million baleslower than total exports. When import quotas end in 2004, domestically produced cotton willface competition from less expensive imports, placing additional pressure on this fragilemarket.23
21 Missouri Soybean Farmer Online, various articles, March 2001, obtained from
http://www.mosoy.org on 3/6/03.
22 Economic Research Service, Agricultural Baseline Projections: U.S. Crops, 2003 –2012,USDA, February 13, 2003, obtained from http://www.ers.usda.gov on 3/10/03.
23 Economic Research Service, Agricultural Baseline Projections: U.S. Crops, 2003 –2012,USDA, February 13, 2003, obtained from http://www.ers.usda.gov on 3/10/03.

7-1
MINERAL RESOURCES CHAPTER 7______________________________________________________________________________
Extraction of fuel and non-fuel minerals represents a major component of the LMRcorridor’s regional economy. These operations generate nearly $9 billion in revenues andemploy approximately 41,000 people. Most of this economic activity is concentrated in the oiland gas industries prevalent in Louisiana. Much of the corridor’s mineral resource sectordepends on the river as a cost-effective means of transporting raw materials and products.Furthermore, the mineral resource sector is a major supplier to a variety of manufacturingindustries, including petroleum refining and petrochemical production, located primarily inLouisiana.
In this chapter we provide an overview of the LMR corridor’s primary mineral extractionactivities. We also present information on revenues and employment for the LMR’s mineralresources sector and discuss likely future trends.
DATA SOURCES AND METHODOLOGY
This chapter examines the mineral extraction and processing activities defined as“Mining” under Standard Industrial Classification (SIC) codes 1000-1499. We focus primarilyon oil and gas extraction (SIC 1300), a major industry in the study area. In addition, non-fuelmining activities prevalent in the LMR corridor include crushed stone (SIC 1420), sand andgravel (SIC 1440), salt (SIC 1479), and clay (SIC 1455, 1459).1 While processing sectors suchas petroleum refining are major components of the LMR regional economy, they are examined inthe manufacturing chapter later in this report.
We relied on several data sources for information on mineral resource operations in theLMR corridor:
• IMPLAN model data, 1998.
• County Business Patterns data, 2000.
1 Corresponding NAICS codes include 212312-212319 (crushed stone), 212321-212322
(sand and gravel), 212393 (salt), and 212324-212325 (clay). For the oil and gas sector,corresponding NAICS codes include 211111, 211112, 213111, 54136, and 213112.

7-2
• U.S. Geological Survey, “The Mineral Industry of [Louisiana, Mississippi,Arkansas, Tennessee, Kentucky, Missouri, Illinois],” obtained from“http://minerals.er.usgs.gov/minerals/” January 2003.
• Personal communication with officials at state Departments of NaturalResources, state geological surveys, and state oil and gas regulatoryboards (Louisiana Mid-Continent Oil and Gas Association and MississippiOil and Gas Board).
• Louisiana Department of Natural Resources, Strategic On-Line NaturalResources Information System (SONRIS), “Yearly Production by Parish,”obtained on-line January 2003.
Due to confidential business information restrictions, county-level data on non-fuelmineral operations and quantities of non-fuel minerals extracted in the LMR corridor are notavailable. IMPLAN model data (1998) were used to estimate the LMR mining sector’s revenueand employment.
OVERVIEW OF MAJOR MINERAL RESOURCE INDUSTRIES
The oil and gas industry, concentrated in Louisiana, is by far the most economicallysignificant component of the LMR corridor mineral resource sector. Other minerals mined in theregion include salt, crushed stone, clay, and sand and gravel. In this section, we provide a briefprofile of each mineral extraction activity, discussing the number of operations and where theactivity is concentrated in the LMR study area.2
Oil and Gas
Oil and gas exploration and extraction are among the largest commercial activities in theentire LMR corridor. The industry is concentrated in Louisiana, with significant activity inMississippi as well.3 In 2001, Louisiana accounted for roughly five percent of U.S. crude oilproduction and 27 percent of marketed U.S. natural gas production.4
2 In addition to sources noted in the “Data Sources and Methodology” section, profileinformation was drawn from: (1) U.S. Environmental Protection Agency, Profile of the Non-Fuel, Non-Metal Mining Industry, EPA Office of Compliance Sector Notebook Project,September 1995.
3 Arkansas also produces significant quantities of crude oil. However, data from theArkansas Oil and Gas Commission indicate that most of the production is concentrated in thesouthwest portion of the state, outside of the LMR study area. Crude oil production in otherLMR states is minor.
4 Energy Information Administration, Petroleum Supply Annual 2001, Table 14, andNatural Gas Monthly, Table 7, November 2002.

7-3
ECOLOGICAL CONSEQUENCES OFCOASTAL OIL AND GAS EXTRACTION
In Louisiana, research suggests that oil and gasexploration and extraction have contributed to thedegradation of coastal wetlands. A network ofnavigation canals has evolved, linking drilling sitesto larger navigation systems in the region. Thesecanals drain water from natural channels and allowsaltwater to flow into freshwater and brackishmarshes. In addition, the canals prevent lateralwater flow and the associated delivery of sedimentand nutrients to marsh areas.
Source: USGS, Status and Trends of the Nation’sBiological Resources, Volume 1, 1998.
Exhibit 7-1 summarizes 2001 oil and gas production in corridor counties in Louisianaand Mississippi. The 80 million barrels of oil produced in the Louisiana corridor parishesrepresents about three-quarters of the state’s total production. Likewise, the roughly 950 billioncubic feet of natural gas production in the parishes represents over 60 percent of total stateproduction.
Louisiana’s crude oil production is the cornerstone of extensive refining activities whereoil is processed into gasoline, fuel oil, paving materials, petrochemicals, lubricants, and otherproducts. The manufacturing chapter discusses these industries in greater detail. Natural gas istransported to processing plants, purified, and distributed to a variety of end users, includingpower plants, large industrial users, and local distribution companies that supply residential andother small users.
Salt
Salt (sodium chloride) is a commonmineral with a wide variety of uses. Salt isused extensively in chemical production,food production, ice control, and agriculturalapplications. In the chemical industry, salt isused as a raw material in chlorine and causticsoda manufacture, which are in turn used inthe production of numerous chemicals andplastic resins.
Louisiana leads all U.S. states in saltproduction, with 13 million metric tons sold or used in 2001.5 This represents roughly 30percent of all U.S. salt production. In all, 21 LMR parishes produce salt from approximately 70active salt domes.6 Additional salt mining occurs in offshore regions in the Gulf of Mexico. Saltproduction in other parts of the LMR corridor is negligible.
5 Kostick, Dennis S., Salt – 2001, bulletin prepared for U.S. Geological Survey for 2001
Minerals Yearbook.
6 “Louisiana Salt Domes,” from Petroleum Industry Facts, January 2000, LouisianaGeological Survey.

7-4
Exhibit 7-1
LMR CORRIDOR OIL AND GAS PRODUCTION, BY COUNTY (2001)
State Parish/County Total WellsCrude Oil(barrels)
Natural Gas(thousands of cubic feet)
Ascension 384 137,690 55,195Assumption 846 856,163 24,690,124Avoyelles 903 154,676 281,331Caldwell 521 133 2,689,656Catahoula 1,839 348,119 78,035Concordia 2,453 526,607 1,384,074E. Baton Rouge 742 2,604,566 26,861,000East Feliciana 175 100,131 1,303,620Evangeline 1,842 499,789 5,264,096Franklin 155 28,429 3,159Iberia 3,603 6,054,165 38,037,742Iberville 1,878 1,261,438 3,429,127Jefferson 2,729 2,448,105 22,915,793Lafayette 1,045 1,587,618 40,556,723Lafourche 7,291 8,337,430 35,623,338La Salle 20,110 2,912,665 2,715,107Livingston 274 216,766 1,690,872Morehouse 14,332 0 1,075,670Orleans 24 - 536,535Ouachita 21,302 69,234 6,918,030Plaquemines 23,305 21,283,021 146,243,761Pointe Coupee 1,426 735,585 83,474,833Rapides 1,017 1,549,280 7,572,514Richland 790 68,102 62,674St. Bernard 1,385 1,276,044 11,213,332St. Charles 2,101 1,168,322 5,167,137St. James 534 105,616 1,098,139St. John 72 68,473 72,324St. Landry 1,875 554,168 5,872,236St. Martin 2,175 1,800,269 13,690,268St. Mary 6,992 4,782,650 94,153,609St. Tammany 13 0 7,383Tangipahoa 20 5,120 0Tensas 1,225 234,958 803,526Terrebonne 11,975 12,285,536 180,606,883Vermillion 6,147 5,848,168 186,713,927W. Feliciana 88 191,174 60,986W.Baton Rouge 226 149,956 1,057,372W. Carroll 432 0 0
Louisiana
TOTAL INCORRIDOR 144,246 80,250,166 953,980,131

7-5
Exhibit 7-1
LMR CORRIDOR OIL AND GAS PRODUCTION, BY COUNTY (2001)
State Parish/County Total WellsCrude Oil(barrels)
Natural Gas(thousands of cubic feet)
Adams 318 726,373 1,539,396Claiborne 1 - 124,745Holmes 1 - -Jefferson 56 58,999 34,605Warren 17 200,837 3,384,728Wilkinson 114 228,713 443,085Yazoo 180 838,195 986,361
Mississippi
TOTAL INCORRIDOR 687 2,053,117 6,512,920
Sources: SONRIS, 2000 (based on Louisiana Mid-Continent Oil and Gas Association data); and Mississippi Oil andGas Board, 2001 Annual.

7-6
IN-STREAM SAND AND GRAVELEXTRACTION
Since most sand and gravel resources weredeposited by rivers, sand and gravel operationsare commonly located in former or current rivervalleys. Sand and gravel materials excavated bydredge and dragline operations from a river bedare typically more cost-effective than operationsmining sand and gravel from a former streamvalley. River-bed sand and gravel tends to occuras finely grained, nearly uniform-sized particlesthat are suitable for concrete aggregate.However, in-stream extraction and streamsidemining of sand and gravel can cause significantenvironmental damage. First, extraction from ariver bed or banks removes river-bottom plantsand riparian vegetation, which damages habitatfor fish and wildlife and leaves the river bedprone to further erosion. Mining-inducederosion has been known to result in propertydamages, reduced fish and wildlife resources,and the extirpation and extinction of streamfauna. Second, suspended sediments increaseturbidity (i.e., water cloudiness) and reduce lightpenetration, harming aquatic habitat. Similarly,stockpiled sand and gravel on the floodplain mayproduce turbid discharges during storm events.
Sources: Timothy Kemmis and Deborah Quade,“Sand and Gravel Resources of Iowa,” IowaDNR; and Paul Hartfield, “The Consequences ofSand and Gravel Mining Within and Adjacent toRiver and Stream Channels in Mississippi inMississippi and Louisiana,” 1997, abstractprovided on-line by Southern Division of theAmerican Fisheries Society.
Other Minerals
In addition to fuels and salt, a variety of other minerals are mined in the LMR corridor,including the following:
• Crushed Stone: Crushed stone is the most common mineral commodity mined inthe U.S. Crushed stone is usually mined from deposits of relatively solid rocksuch as limestone and dolomite.Stone that breaks into cubicalfragments and is free of both surfacealteration from weathering andimpurities is preferred for crushedstone. Crushed stone is mostcommonly used as aggregate in theconstruction industry, with themajority being applied in roadconstruction and maintenance. Inaddition, crushed stone may be usedin chemical and metallurgicalprocesses, including cement andlime manufacturing, for agriculturalpurposes, and in water and sewerfiltration systems.
• Sand and Gravel: Sand and gravelare the granular materials resultingfrom the natural disintegration ofrock or stone. Deposits of sand andgravel are commonly found adjacentto or within rivers, or in areas withglaciated or weathered rock (see textbox). There are two main types ofsand and gravel materials --construction and industrial.Construction sand and gravel areused primarily by the constructionindustry for aggregate to be mixedinto concrete, asphalt aggregate androadbase materials, and constructionfill. About 97 percent of the sandand gravel mined in the U.S. in1996 was construction sand and gravel. Industrial sand and gravel, which ismainly used in manufacturing glass, ceramics, and chemicals, must meet strictchemical and physical criteria; it is therefore a higher-value product thanconstruction sand and gravel.

7-7
• Clay: Several clay mining operations are located in the LMR corridor, althoughthese operations account for a relatively small portion of the 40 million metrictons sold in the U.S. in 2001. Clay mining operations are concentrated inLouisiana and Missouri and produce primarily common clay. Common clay isused in the manufacture of brick, cement, clay pipe, drain tile, lightweightaggregates, and sewer pipe.7
• Other Minerals: Otherminerals mined in theLMR corridor includecoal, metals, and tripoli.However, theseoperations representonly a small fraction ofmining activity andrevenue in the region.In addition, Louisiana isa major producer ofsulfur. However, sulfuris either generated as aby-product of petroleumrefining or extractedfrom offshore minesoutside the boundariesof the LMR study area;hence, we do notaddress sulfur explicitlyin this analysis.
7 Robert L. Virta, “Clay and Shale,” bulletin prepared for U.S. Geological Survey for
2001 Minerals Yearbook
ECONOMIC IMPACTS OFNATURAL GAS PRODUCTION AND USE
Among the LMR corridor states, Louisiana is the largestproducer of natural gas, supplying almost a quarter of theUnited States’ total natural gas output. The extraction,processing, and delivery of natural gas to consumers feedsthe LMR economy, providing employment and income toresidents. The gas must be extracted from the earth, thentransported in low-pressure, low-diameter pipelines toprocessing plants, where, various hydrocarbons and fluids areseparated from the pure natural gas to produce "pipeline gas."This dry natural gas is refined to meet the quality standards ofmajor interstate transportation pipelines so that it can betransported across the country in large, high-pressurepipelines. While some large industrial, commercial, andutility customers receive natural gas directly from theinterstate pipelines, most consumers buy their gas from alocal distribution company (LDC). These companiestransport gas to consumers, including businesses andhomeowners, using extensive networks of small-diameterpipelines. These are often expensive to build and maintain,but vital to the natural gas supply chain. It is this final step inthe distribution process that costs consumers the most, oftenrepresenting as much as 47 percent of the natural gas bill fortypical, residential consumers. However, it is also this stepthat generates employment opportunities and income forcommunities nationwide. In this way, activities in the LMRcorridor extend beyond the regional economy, influencing thenational economy.
Sources: Louisiana Department of Natural Resources,Naturalgas.org, and U.S. Minerals Management Service.

7-8
MINERAL RESOURCE REVENUES AND EMPLOYMENT
Oil and Gas Industry
The oil and gas industry represents a major segment of Louisiana’s economy. Takinginto account exploration, production, refining, and the full suite of goods and services used inthose sectors, one study estimates that the oil and gas industry accounts for $93 billion inrevenue and employs over 62,000 individuals in Louisiana.8
Focusing exclusively on the LMR corridor’s share of the oil and gas extraction sector,Exhibit 7-2 shows that the sector generates approximately $8.4 billion of revenue each year, andemploys over 38,000 people. The vast majority of this economic activity is concentrated in theLouisiana corridor parishes.9
Exhibit 7-2SUMMARY OF REVENUE AND EMPLOYMENT ASSOCIATED
WITH OIL AND GAS EXTRACTION INDUSTRY IN LMR CORRIDORRevenue
(millions $2001) EmploymentLouisiana $8,072 36,360All Other States $339 2,127TOTAL $8,411 38,487Source: IMPLAN, 1998.
Remaining Minerals Industry
The revenue and employment associated with minerals extraction outside the oil and gassector is minor by comparison. The annual revenues generated by salt, stone, sand and gravel,clay, and other mined products total roughly $389 million. As shown in Exhibit 7-3, this total isdominated by salt production, accounting for nearly $180 million in annual revenues.
8 Louisiana Mid-Continent Oil and Gas Association, The ‘Energy’ Sector: Still a Giant
Economic Engine for the Louisiana Economy, April 2002.
9 It is noteworthy that Louisiana Mid-Continent Oil and Gas Association data (availablethrough the Louisiana DNR SONRIS system) suggest significantly higher employment inLouisiana’s oil and gas sector (approximately 63,000 employees).

7-9
Similar patterns are evident in mining employment (Exhibit 7-4). Roughly 3,000 jobs areassociated with non-fuel mining in the LMR corridor, the majority of which are concentrated inLouisiana’s salt mining industry and in sand and gravel operations scattered throughout the studyarea.
Exhibit 7-3MINING REVENUES IN THE LMR CORRIDOR
0306090
120150180
Crushed Stone Sand and Gravel Salt Clay Other Minerals
Mining Activity
Rev
enue
($m
illio
ns)
Exhibit 7-4MINING EMPLOYMENT IN THE LMR CORRIDOR
0250500750
100012501500
CrushedStone
Sand andGravel
Salt Clay OtherMinerals
Mining Activity
Em
ploy
men
t

7-10
TRENDS
Although energy trends are highly cyclical, production of crude oil in the LMR regiongenerally has declined in the last decade (see Exhibit 7-5). This trend is expected to continue inthe future as stocks are depleted, oil imports increase, and prices soften. Energy InformationAdministration forecasts show Gulf Coast region crude oil production decreasing from 0.6million gallons per day in 2002 to 0.3 million gallons per day in 2012.
Although Louisiana’s natural gas production fell slightly between 1991 and 2001, thelong-range forecast for the Gulf Coast region as a whole suggests a different future pattern.Specifically, Energy Information Administration forecasts predict a modest increase in GulfCoast region production from 4.97 trillion cubic feet in 2001 to 5.23 trillion cubic feet in 2012.While it is unclear whether production will increase in the LMR corridor proper, natural gasmarket projections suggest strong demand from the utility sector, as well as growth fromresidential, commercial, and industrial users. This demand is likely to affect natural gassuppliers in all production regions. Suppliers are attempting to meet this demand throughincreased production as well as through construction of new liquefied natural gas (LNG)terminals. These terminals generally are intended to handle and distribute imported LNG.Recent decisions by the Federal Energy Regulatory Commission have relaxed regulations
Exhibit 7-5
OIL PRODUCTION TRENDS IN LOUISIANA AND MISSISSIPPI
0
20,000,000
40,000,000
60,000,000
80,000,000
100,000,000
120,000,000
1991 1992 1993 1994 1995 1996 1997 1998 1999 2000
Bar
rels
LouisianaMississippi

7-11
governing the introduction of LNG terminals. Applications to build LNG terminals haveincreased, and include approved and proposed projects along the Louisiana Gulf coast.10
The most significant non-fuel mineral mined in the LMR region is salt, producedprimarily in Louisiana. Recent production trends show no clear increasing or decreasingproduction pattern (see Exhibit 7-6). Salt production generally rises and falls with fluctuationsin major salt-using sectors, most notably the chemicals industry.
The primary factor driving trends in the stone and sand/gravel sectors is changes indemand for construction materials. In recent years the construction industry’s strong demand foraggregate and cement has resulted in increased mining output. Sand and gravel operations alongthe LMR are expected to continue to benefit from strong residential construction and ready mixconcrete markets.
10 Weems, Philip, Lisa Tonery, and Kevin Keenan, “U.S. LNG Terminals: A More
Friendly Regulatory Environment,” LNG Journal, July/August 2003.
Exhibit 7-6
LOUISIANA SALT PRODUCTION
-
5,000
10,000
15,000
20,000
1993 1994 1995 1996 1997 1998 1999 2000 2001
Thousand Metric Tons

8-1
ENERGY PRODUCTION CHAPTER 8
In 2000, the 102 power plants located in the LMR corridor generated approximately 21percent of the total power generated in the LMR’s seven-state region. The generating capacity ofthe corridor’s plants ranges from small generators with capacities of less than one megawatt(MW) to larger generators with capacities close to 2,100 MW. Many of the larger plants arelocated near significant power-consuming areas, such as Baton Rouge, Memphis, and NewOrleans.
Energy production in the LMR corridor depends on the Mississippi River in severalways. First, the river supports waterway transportation, an important means of shipping coal andother materials to power plants. About 26.1 million tons of coal were shipped on the LMR in2000, much of it destined for power plants in the corridor.1 Second, the river provides a source ofcooling water for fossil fuel and nuclear power plants. Cooling water is drawn from the LMR,used to dissipate heat created in the process of generating energy, and discharged back to theriver. Power plants also use LMR water in the generation process to create steam that turnspower-generating turbines. According to the U.S. Geological Survey, power plants in the LMRcorridor used 6.8 billion gallons of surface water per day in 1995, making them by far the biggestsingle class of water users (see Chapter 9).2 Finally, the Mississippi River serves as a direct fuelsource for hydroelectric power generation, with hydroelectric plants in the LMR corridorgenerating approximately 105 megawatts (MW) of power annually.
The remainder of this chapter provides an overview of the different types of power plantsalong the LMR, presents facility generation and capacity data, examines revenue andemployment associated with power generation, and discusses potential trends for the industry.
1 U.S. Army Corps of Engineers, Waterborne Commerce of the United States, Calendar
Year 2000, Waterborne Commerce Statistics Center, 2002, http://www.iwr.usace.army.mil/ndc/wcsc/pdf/wcusmvgc00.pdf
2 U.S. Geological Survey, Water Use in the United States, 1995, obtained from http://water.usgs.gov/watuse/ on 1-19-03.

8-2
DATA SOURCES AND METHODOLOGY
We defined the energy sector as industries in Standard Industrial Classification (SIC)code 4910 — establishments engaged in the generation, transmission, and/or distribution ofelectric energy for sale — and SIC code 4930—establishments providing electric or gas servicesin combination with other services.3 We relied on several sources for information on the LMRcorridor’s energy sector:
• Generation and capacity estimates were developed using data from theEPA's Emissions & Generation Resource Integrated Database (E-GRID)and the U.S. Department of Energy’s Energy Information Administration(http://www. eia.doe.gov).
• Estimates of surface water used as cooling water by the energy sector wereobtained from the 1995 U.S. Geological Survey, Water Use in the UnitedStates (http://water.usgs.gov/watuse).
• Revenue and employment estimates were developed based on IMPLANmodel data, 1998.
Generation estimates reflect net generation, which is gross generation minus electricityused by the plant. All generation data provided in megawatt hours were converted to megawattsby dividing megawatt hours by 8,760 hours (i.e., the number of hours per year).
OVERVIEW OF POWER PLANTS
Four types of power plants generate energy in the LMR corridor: fossil fuel plants,nuclear facilities, biomass/wood facilities, and hydroelectric dams. The most dominant type ofpower production facility in the LMR corridor is fossil fuel generation (92 plants), followed bynuclear power (three plants), and wood/biomass (14 plants).4 Exhibit 8-1 shows the number ofpower plants in the LMR corridor, by state. Each type of power production is described in moredetail below.
• Fossil Fuel Plants: Fossil fuel plants produce energy by burning coal, gas,or petroleum to power steam turbines, gas turbines, or internal combustionengines. Coal and natural gas plants are the leading energy sources forfossil fuel plants in the LMR region, fueling approximately 49 and 47
3 These industries correspond to code 221 (utilities) established under the 1997 North
American Industry Classification System (NAICS).
4 E-Grids Database, 2000 data. Some power plants use multiple fuels and are countedunder more than one category. Unless otherwise data, all subsequent information on powergeneration and capacity are from the E-Grids Database.

8-3
percent of the electricity generation in the corridor, respectively. Oil-firedplants supply the remaining four percent of fossil fuel plant generation.Fossil fuel plants in the LMR corridor used approximately 5.8 billiongallons of surface water per day in 1995.5
E x hib it 8 -1 N U M B E R O F E L E C T R IC P O W E R
P L A N T S IN T H E L M R C O R R ID O R , 2000
0
10
20
30
40
50
60
Arkansa
s
Louisi
ana
Mississ
ippi
Missou
ri
Tenne
sseeN
umbe
r of
Pow
er P
lant
s
Fossil FuelN uclearB iom ass
• Nuclear Power: Nuclear power plants operate by initiating a controlledreaction of fissionable materials to produce heat that is used to driveturbines and generate power. As with fossil fuel plants, nuclear facilitiesuse a large amount of cooling water. The corridor’s three nuclear plantsused roughly one billion gallons of cooling water per day in 1995.6
• Biomass/Wood Power: Biomass power is produced by burning plantmatter, such as trees, grasses, agricultural crops or other biologicalmaterial, in a generator to produce high pressure steam. This steam isintroduced into a steam turbine, where it flows over a series ofaerodynamic turbine blades, causing the turbine to rotate and generatepower.7 Most biomass plants in the LMR corridor are located adjacent to
5 U.S. Geological Survey data, Ibid.
6 U.S. Geological Survey data, Ibid.
7 U.S. Department of Energy, Biopower, obtained from http://www.eren.doe.gov/biopower/basics/ba_efb.htm on 1/28/03.

8-4
pulp mills. These plants use black liquor, a by-product of the pulpingoperation, to produce steam and generate electricity.8
• Hydroelectric Power: Along with biomass, water is the most commonrenewable energy source in the LMR corridor. While the construction andoperation of hydroelectric dams may significantly impact a river’s ecologyand surrounding wildlife habitat, hydroelectric power takes advantage ofan inexpensive and “clean” energy source, in that it does not require fuelcombustion. The largest hydroelectric facility in the LMR corridor, theSydney A. Murray Jr. Hydroelectric Station produced approximately 61MW of power in 2000. The plant utilizes the difference in head betweenthe Mississippi and Atchafalaya rivers to produce electricity.9
POWER GENERATION AND CAPACITY
Power plants in the LMR corridor generated close to 15,100 MW of electricity in 2000and had the capacity to generate over 33,000 MW.10 Capacity refers to the amount of electricpower a generator is capable of producing according to the manufacturer’s specifications for thegeneration equipment being used, while generation reflects the actual power produced. Capacityestimates are important to a region because they indicate the amount of power that could bemade available during peak periods of energy demand.
8 E-Grids Database, 2000. Information on black liquor obtained from http://bioproducts-
bioenergy.gov/pdfs/bcota/abstracts/28/z271.pdf on 02/02/03.
9 U.S. Army Corps of Engineers, obtained from http://www.mvn.usace.army.mil/pao/oldriver/ hydroelectric.htm on 2/02/03.
10 E-Grids Database, 2000.
Exhibit 8-2ELECTRICITY GENERATION IN THE LMR
CORRIDOR (MW)
02,0004,0006,0008,000
10,00012,00014,000
Fossil Fuel Nuclear Biomass Hydro

8-5
Fossil fuel plants are the dominant source of power in the LMR region. As shown inExhibit 8-2, fossil fuel plants generated approximately 11,500 MW of power in 2000, or about76 percent of the LMR corridor’s total power production. With more than 1,300 MW ofelectricity generated in 2000, NRG Energy’s Big Cajun 2 facility is the largest power plant in theLMR corridor. The plant consists of three coal-fueled steam units and went into operationbetween 1981-83.11 It is fueled with low-sulfur coal from Wyoming and supplies power to thesurrounding Pointe Coupee Parish.12
Nuclear power plants are the second leading source of power in the LMR region. In2000, they generated a total of 3,000 MW of electricity. The largest nuclear power plant in thecorridor is Entergy Inc.'s Grand Gulf Nuclear Station, located near Vicksburg.13 Biomass poweris the third largest energy source in the corridor, with 247 MW of electricity production in 2000.
Power plants in the LMRcorridor account for about 21 percentof the energy generation in the seven-state region and 23 percent of theregion's capacity (see Exhibit 8-3).The bulk of the power production inthe corridor is concentrated inLouisiana, near the New Orleans andBaton Rouge metropolitan areas.
Exhibit 8-4 shows thedistribution of power consumption in the LMR seven-state region based on revenue generated byresidential, commercial, industrial, and other users. Residential users account for the largestshare of revenue (44 percent). Commercial sector consumers represent 23 percent of revenues,using electricity for the lighting, heating, and cooling of commercial buildings (e.g., offices).Finally, the industrial sector represents 30 percent of revenues, with chemicals and alliedproducts, petroleum refining, and food and kindred products among the largest industrial users inthe corridor.
11 NRG Energy, Inc, obtained from http://www.nrgenergy.com/ on 2/05/03.
12 U.S. Department of Energy, Energy Information Administration, State Coal Profile:Louisiana, obtained from http://www.eia.doe.gov/cneaf/coal/st_coal_pdf/0576o.pdf on 1/28/03.
13 U.S. Department of Energy, Energy Information Administration, obtained from http://www.eia.doe.gov/cneaf/nuclear/page/at_a_glance/reactors/grand_gulf.html on 1/31/03.
POLLUTION FROM LMR POWER PLANTS
Electric power plants are one of the largest industrial sources ofair pollution in the LMR corridor. In 2000, they produced219,000 tons of sulfur dioxide and 213,000 tons of nitrogenoxide. These emissions contribute to chronic bronchitis and otherrespiratory diseases. In 2000, LMR power plants also releasedapproximately 97.8 million tons of carbon dioxide, a major causeof global climate change.
Source: E-Grids database, 2000 data.

8-6
Exhibit 8-3
GENERATION AND CAPACITY IN LMR CORRIDOR AND LMR’S SEVEN-STATE REGIONGeneration (MW) Capacity (MW)
LMRCorridor
LMR Seven-State Region
LMRCorridor
Generation asa % of State
TotalLMR
Corridor
LMRSeven-State
Region
LMRCorridor
Capacity as a% of Seven-State Region
Arkansas 2,666.8 5,041 53% 5,242 10,143 52%Illinois 0 20,257 0% 0 39,411 0%Kentucky 0 10,629 0% 0 18,646 0%Louisiana 8,476.6 10,635 80% 19,208 23,409 82%Mississippi 2,172 4,295 51% 4,972 9,630 52%Missouri 1,143.1 8,695 13% 1,999 18,394 11%Tennessee 634.1 10,940 6% 1,667 21,977 8%Total 15,093.0 70,491 21% 33,088 141,611 23%Source: E-Grids Database, 2000 data.
Exhibit 8-4
POWER CONSUMERS BY SECTOR(LMR SEVEN-STATE REGION)
Residential44%
Industrial30%
Commercial23%
Other3%
ResidentialIndustrialCommercialOther

8-7
REVENUE AND EMPLOYMENT
Power facilities in the LMR corridor employ approximately 11,200 workers and generateabout $4.7 billion in revenues (see Exhibit 8-5).14 It should be noted that these estimates reflectrevenue and employment from the generation, transmission, and distribution of electricity.Revenue and employment from transmission and distribution activities tend to be higher inpopulous areas, such as Memphis, New Orleans and Baton Rouge, which helps to explain whythe bulk of the energy sector revenue and employment in the corridor is concentrated inLouisiana, and to a lesser extent Tennessee.
Exhibit 8-5
REVENUE AND EMPLOYMENT IN THE LMR CORRIDOR ENERGY SECTORRevenue (millions $2001) Employment
Arkansas $873 2,085Illinois $3 6Kentucky $25 67Louisiana $2,497 6,038Mississippi $509 1,287Missouri $241 626Tennessee $596 1,100Total $4,743 11,209Source: IMPLAN, 1998 model data.
TRENDS
The majority of the LMR corridor lies in the Southeastern Electric Reliability Council(SERC) Region.15 The SERC Region covers an area of about 464,000 square miles and includesall or part of 13 southeastern and south central states.16 The Energy Information Administration(EIA) predicts that total electricity demand in the Region will increase at an annual rate of twopercent between 2000 and 2025, from 111,400 MW to 135,500 MW. This rise in demand willspur continued growth in generation and capacity in the Region, with generation increasing at a1.9 percent annual rate and capacity growing at a 1.6 percent annual rate.17
14 IMPLAN, 1998 model data.
15 Energy Information Administration, Map of North American Electric ReliabilityCouncil (NERC) Regions and Subregions, obtained from http://www.eia.doe.gov/cneaf/electricity/chg_str_fuel/html/fig02.html on 1/28/03.
16 North American Electric Reliability Council (NERC), Description of the SoutheasternElectric Reliability Council, obtained from http://www.nerc.com/regional/serc.html on 1/28/03.
17 Supplement Tables to the Annual Energy Outlook 2003, Table 60, Electric PowerProjections for EMM Region, obtained from http://www.eia.doe.gov/oiaf/aeo/supplement/sup_elec.pdf on 2/2/03.

8-8
The EIA predicts that the fastest growth will come in the commercial sector, withdemand in this sector growing by 2.5 percent a year between 2000 and 2025, increasing from36,600 MW to 48,500 MW. The EIA predicts that demand in the residential and industrialsectors will grow at a somewhat slower rate, with the residential sector increasing by 1.7 percentper year and the industrial sector growing 1.6 percent per year.
To meet this growing demand, the EIA predicts that total electricity generation in theRegion will increase from 114,500 MW to 144,700 MW by 2025. The EIA expects coal tocontinue to be the largest source of power in the SERC Region, constituting almost two-thirds oftotal generation in 2025. The biggest increase, however, is expected to come from natural gasgeneration (3.8 percent annually). Other fossil fuel sources are expected to show slower growth,with coal generation increasing by 2.2 percent annually and petroleum generation actuallydeclining by 7.1 percent. The EIA expects nuclear power generation to remain fairly constant,growing at only a 0.5 percent annual rate.

9-1
COMMERCIAL NAVIGATION CHAPTER 9______________________________________________________________________________
The LMR’s waterway transportation industry provides an outlet for and an inlet to a widerange of economic sectors operating in the nation’s interior, including agriculture, energy,mining, and manufacturing. These sectors depend on LMR commercial navigation as a means ofshipping and receiving millions of tons of farm products, coal, minerals, and other commodities.Overall, the waterway transportation industry shipped close to 473 million tons of commoditieson the LMR in 2001. This volume represents more than 60 percent of total shipments on theMississippi River System and 20 percent of waterborne commerce nationwide.
In addition to providing bulk cargo transport, the waterway transportation industrysupports a network of businesses and more than 20 ports that store, load, unload, and transportcargo to land-based modes of transportation such as rail and trucking. In 1998, waterwaytransportation generated approximately $6 billion in revenues and employed roughly 29,000people.
In this chapter we present an overview of LMR navigation and a snapshot of the watertransportation industry today, including information on commodity shipments, revenues andemployment, and future trends.
DATA SOURCES AND METHODOLOGY
For information on the waterway transportation industry in the LMR corridor, we reliedprimarily on the following sources:
• U.S. Army Corps of Engineers, Waterborne Commerce of the United States,Calendar Year 2001, Waterborne Commerce Statistics Center, 2003.
• Personal Communication with Amy Tujague at U.S. Army Corps ofEngineers, May 21, 2003.
• IMPLAN model data, 1998.
The revenue and employment estimates are based on estimates from the IMPLAN model.IMPLAN data reflect the economic activity of the waterway transportation industry in the 113-county LMR corridor. IMPLAN data are based on Standard Industrial Classification code 4400,which includes water transportation as well as all associated support services.

9-2
Estimates of commodity shipments on the LMR are based on data developed by the U.S.Army Corps of Engineers. The data are published in segments in the Army Corps of Engineers’Waterborne Commerce Report, with data reflecting shipments from the Ohio River to BatonRouge and from Baton Rouge to the Mouth of Passes. However, it is not possible to add thesegments to calculate total cargo on the LMR because shipments traveling the full stretch or onany portion of both stretches would be counted twice. Therefore, the Army Corps of Engineerscompiled and provided Industrial Economics unpublished data that reflect shipments on theLMR (the Ohio River to the Mouth of Passes) as a unit.
DEVELOPMENT OF THE LMR FOR COMMERCIAL NAVIGATION
The following sections discuss the historical development of the LMR navigation systemand the state of the system in the 21st century.
Evolution of the LMR as a Navigable Waterway
The U.S. awakened to the importance of navigation along the LMR during the SteamboatEra of the early 1800s. The extensive trade occurring along the banks of the LMR changed theregion’s economic landscape, ushering in an era of prosperity.1 As River traffic increased afterthe Civil War, so too did the pressure on the government to address navigation difficulties. In1879, the Mississippi River Commission (MRC) was established to oversee River navigation andin 1896 Congress authorized the creation of a nine-foot channel from Cairo, Illinois to the Gulfof Mexico. With expansion of railroad service, however, River use faltered despite theimprovements. To stimulate and encourage traffic, the government created a state-owned bargecompany, called the Inland Waterways Corporation (IWC). Over the course of 15 years, thisentity researched, developed, and refined the mechanics of navigation on the LMR.
While the IWC focused on improving watercraft, building port facilities, and movingcommodities, the Army Corps of Engineers focused on improving the navigability of the River.Until 1928, dredging and bank revetment were used to keep cargo moving smoothly along theLMR. The 1927 flood, however, highlighted the need for the Corps to address flood control, aswell as navigation issues along the Mississippi River. The 1928 Flood Control Act mobilizedsubstantial resources for improvements to the entire Mississippi River System. Theseimprovements and the profitability of the IWC inspired the private sector to reinvest in shippingoperations.
The Mississippi River proved critical to the movement of petroleum as well as militaryvessels during U.S. involvement in World War II. Although River traffic stalled after the War,the exploration of new markets reinvigorated the industry and led to a sharp increase in Rivertraffic in the 1950s. When the government committed to the creation of a 12-foot channel from
1 Clay, Floyd. History of Navigation on the Lower Mississippi. A National Waterways
Study, U.S. Army Engineer Water Resources Support Center, Institute for Water Resources,January 1983.

9-3
Cairo to Baton Rouge, industrialists poured money into port facilities.2 Since then, committingpublic funds to the maintenance and improvement of navigation on the Mississippi has been thesubject of intense debate (see text box).
Current State of CommercialNavigation on the LMR
Today, vast quantities ofgoods travel along the MississippiRiver, carried aboard large bargespushed by towboats from port toport. Individual barges, carryingup to 1,500 tons, are considered tobe far more efficient than trains ortrucks for transportingcommodities. It would requireroughly 15 large train cars and 50trucks to ship the volume of cargocarried by one barge.3
River navigationfacilitates a wide array ofeconomic activity. Agricultural,mining, and processing facilitiesalong the Mississippi rely on theshipping industry to provide aneconomical means of transportingproducts domestically andinternationally. Barges pay feesat their ports of call for the use ofport facilities, fleeting (parking),and the loading and unloading ofcargo. In addition, ports offerservices such as barge cleaning,repairing, boat refueling, and security services.
2 Robinson, Michael. Mobilizing the Waterways: The Mississippi River Navigation
System, Builders and Fighters: U.S. Army Engineers in World War II, U.S. Army Corps ofEngineers, December 1992.
3 U.S. Army Corps of Engineers, Inland River Navigation, Navigation InformationCenter, obtained from http://www.iwr.usace.army.mil/navdata/nav-prim.htm on 6/12/03.
ENVIRONMENTAL IMPACT OF MISSISSIPPI RIVERDEVELOPMENT
To keep pace with growth in the commercial navigation sector anddemand for year-round passage of cargo, the Army Corps of Engineershas undertaken a number of projects to maintain and improve trafficflow along the Mississippi River. These projects have included effortsto widen and deepen channels and build levees to prevent flooding.While these initiatives have been beneficial for those individuals,companies, and organizations dependent upon commercial navigationand river containment, the environmental consequences have beensignificant. According to the Environmental Defense Fund, drainageand navigation projects have reduced the wetlands of the LMR by 95percent. The loss of the wetlands has affected the diversity of thewildlife and plant life in the area.
Many observers contend that current projects under consideration willharm additional critical habitats, including those areas with rich musselbeds and bottomland hardwood forests. Special interest groups on bothsides of the issue are involved in the debate over proposed projects onthe White, Big Sunflower, and Yazoo Rivers, tributaries of the LMR.Commercial interests, including agriculture and shipping, are lobbyingfor these projects, which will protect cultivated fields from flood watersand ensure year-long passage along sections of the White River.
Sources: Environmental Defense Fund, Environmentalists Oppose OtherProposed Projects in the Mississippi River Valley, obtained online atwww.environmentaldefense.org on May 13, 2003. Taxpayers forCommon Sense and National Wildlife Federation, Troubled Waters:Congress, The Corps of Engineers, and Wasteful Water Projects, March2000. USGS, Status and Trends of the Nation’s Biological Resources,Department of Interior, 1998.

9-4
According to the U.S. Port Ranking by Cargo Volume compiled by the Army Corps ofEngineers, several of the nation’s busiest ports lie on the banks of the LMR.4
• Port of Baton Rouge: The Port of Baton Rouge is the key link between theGulf Intercoastal Waterway and the Mississippi River, making it a criticalgateway into the Mississippi from ports in Florida, Texas, and Latin America.With a 45-foot deep channel and 3,000 feet of deep-water berthing space, thePort of Baton Rouge can accommodate the largest barges. Its oil, molasses,grain, and general cargo facilities enable it to handle any manner of goods.The grain elevator at the port serves 31 parishes, receiving 25 percent ofLouisiana’s corn and soybean crops.5
• Port of New Orleans: The Port of New Orleans plays host to more than6,000 vessels annually, handling an average of 11 million tons of cargo eachyear. It runs 22 miles along the Mississippi River (including the IndustrialCanal) and has docking space for 15 ships, supported by 22 million squarefeet of cargo area. Steel, rubber, and coffee are the Port’s most importantcommodities.6
• Port of South Louisiana: Ranked the largest port in the world in 2001, thePort of South Louisiana assumes a 54-mile stretch along the MississippiRiver. Annually, more than 50,000 barges visit the Port of South Louisiana,carrying soybeans, maize, wheat, crude oil, steel, coal, petrochemicals, andanimal feed. Petrochemicals and grain are the most important domesticcommodities to the Port’s operations, while grain and crude oil are a criticalpart of the Port’s foreign trade. 7
SHIPMENTS ON THE MISSISSIPPI RIVER SYSTEM
The nation’s inland waterway system extends over 25,000 miles, of which about 11,000miles are generally considered to be significant for domestic commerce. The nation’s navigableinland waterways includes the Mississippi River System -- defined by the Corps to include themain channels and all major tributaries of the Mississippi, Illinois, Missouri, and Ohio Rivers --as well as other rivers such as the Columbia/Snake River in the Pacific Northwest (see Exhibit 9-
4 U.S. Army Corps of Engineers, U.S. Port Ranking by Cargo Volume 2001, Navigation
Data Center, http://www.iwr.usace.army.mil/ndc/wcsc
5 Port of Greater Baton Rouge, Overview and Facilities, obtained fromhttp://www.portgbr.com on 6/12/2003.
6 Port of New Orleans, Port Facts, November 14, 2001, obtained fromhttp://www.portno.com on 6/12/2003.
7 Port of South Louisiana, Facts, 2002 Tonnage Statistics, and On the River March 2003,obtained from http://www.portsl.com on 6/13/2003.

9-5
1). According to the Corps, more than 2 billion short tons of commodities were shipped on U.S.waterways in 2001. Of this total, about 715 million short tons, or 30 percent, were shipped onthe Mississippi River System and 504 million short tons, or 20 percent, on the Mississippi MainStem.8
Shipments on the LMR proper account for a significant share of the nation’s total inlandwaterway shipments. In 2001, close to 473 million tons of commodities were shipped on theLMR, which represented about 20 percent of total waterborne commerce and 66 percent of allMississippi River System cargo.9As shown in Exhibit 9-2, farmproducts accounted for about 35percent of the LMR’s totalshipments (167 million tons),followed by petroleum andpetroleum products (133 milliontons or 28 percent) and non-metallic minerals (44 million tonsor 9 percent). Other majorcategories of commoditiesshipped on the LMR include coal,metals (primarily iron and steelproducts), and industrial andagricultural chemicals.
In addition to beingclassified by commodity,shipments are characterized by thedirection in which they areshipped (downbound versusupbound) and their destination (domestic versus foreign). About 60 percent of the LMR’scommodity shipments are moving from one domestic port to another. Of total LMR shipments,39 percent are domestic downbound shipments and 21 percent are domestic upbound shipments.An additional 18 percent of LMR commodity shipments are imported goods destined for U.S.ports of call along the Lower Mississippi. The remaining 21 percent of LMR commodityshipments represent exports from LMR ports, more than 80 percent of which were farmproducts.10
8 U.S. Army Corps of Engineers, Waterborne Commerce of the United States, Calendar
Year 2001, Waterborne Commerce Statistics Center, 2003.9 This estimate reflects shipments that originate from, or are destined for, a LMR port, as
well as shipments that pass through the LMR without loading or unloading cargo at a port. U.S.Army Corps of Engineers, Waterborne Commerce of the United States, op cit.
10 U.S. Army Corps of Engineers, Ibid.
Exhibit 9-1
INLAND RIVERS - NAVIGABLE WATERWAYS
Source: U.S. Army Corps of Engineers, obtained from“http://www.mvr.usace.army.mil/navdata/ww.gif” on 12/14/98.

9-6
REVENUE AND EMPLOYMENT IN LMR WATERWAY TRANSPORTATIONINDUSTRY
The waterway transportation industry generated $6 billion in revenue in the LMRcorridor in 1998, according to IMPLAN model data (see Exhibit 9-3). This revenue supportedmore than 29,000 employees.11 These estimates are conservative because they only reflect theeconomic activity of the waterway transportation industry in the 113-county LMR corridor; it ispossible that some towing companies operating on the LMR are based outside of the corridor.12
As with the shipment information, the revenue and employment data highlight theimportance of Louisiana’s ports to the water transportation industry in the LMR. Louisiana’s
11 Other data suggest that this total may underestimate the number of employees involvedin commercial navigation. The Port of South Louisiana reported that its operations employed70,000 workers in 2001. However, it is unclear whether the port estimates define the waterwaytransportation sector more broadly than it is defined in the IMPLAN model. See Port of SouthLouisiana, Facts, 2002 Tonnage Statistics, and On the River March 2003, obtained fromhttp://www.portsl.com on 6/13/2003.
12 IMPLAN model data, 1998.
Exhibit 9-2
SHIPMENTS ON THE LMR BY WEIGHT, 2001
Source: U.S. Army Corps of Engineers, Waterborne Commerce of the United States, Calendar Year 2001, WaterborneCommerce Statistics Center, 2003.
Coal8%
AgriculturalChemicals
4%
Industrial Chemicals6%
Metals and PrimaryMetal Products
9%
Non-metallicMinerals and Primary
Mineral Products9% Petroleum and
Petroleum Products28%
Food and FarmProducts
36%

9-7
share of the industry’s activities in the LMR represent roughly 88 percent of the total revenueand employment.
Exhibit 9-3
REVENUE AND EMPLOYMENT OF LMR’S WATERWAYTRANSPORTATION INDUSTRY
StateRevenue
(millions $2001) EmploymentArkansas $74.5 411Illinois $15.5 83Kentucky $37.7 211Louisiana $5,243.8 25,796Missouri $95.7 492Mississippi $295.0 1,491Tennessee $202.1 889Total LMR Corridor $5,964.3 29,373Source: IMPLAN Model, 1998
When examining the economic influence of water-based navigation in the LMR region, itis important to look beyond direct revenue and employment associated with the waterwaytransportation sector. Most significantly, the LMR provides a low-cost shipping option for bulkcargo equal to the difference between barge shipping rates and the next cheapest alternative(generally rail). These transportation savings lower operating costs for users of agricultureproducts, coal, and other raw materials, thereby encouraging manufacturing, energy, and othertypes of facilities to locate in the region. Likewise, the availability of water-based transport mayincrease competition in the overall transportation sector, lowering rail and trucking rates, andfurther attracting certain businesses (and their associated jobs) to the LMR region. Finally, thecost advantage created by barge transport may make it possible for Delta agricultural interests tocompete in increasingly demanding international markets. For instance, the cost of shippingsoybeans on the Mississippi was found to be lower than the cost of shipping on the AmazonRiver, allowing U.S. soybean growers to compete with Brazilian growers in internationalmarkets.13
TRENDS
Over the course of the past five years, shipments on the LMR have fluctuated modestlyfrom year to year, but have not changed dramatically. The compound annual growth rate ofshort ton shipments was -.3 percent between 1997 and 2001. On an annual basis, the change intotal shipments was never larger than +/- 2 percent.
13 Based on report comments provided by Ken Wells, The American Waterway
Operators, September 24, 2003; and McVey, Marty, Phil Baumel, and BobWisner, “BrazilianSoybeans – Transportation Problems,” AgDM Newsletter, November 2000.

9-8
However, the relative stability of shipments masks trends in the shipment of specificcommodities (see Exhibit 9-4). Shipments of food and farm products and non-metallic mineraland mineral products increased by nine percent in 1999, with growth in food and farm productsleveling off and those of non-metallic minerals dipping during 2000 and 2001. Balancing outthese increases, coal shipments declined in 1998 and 1999 by seven and 17 percent respectively.Shipments of metal and primary metal products also declined, falling more than 17 percent in2001.
The Ports of Baton Rouge, New Orleans, Plaquemines, St. Bernard, and South Louisianarecently entered into a partnership with the University of New Orleans College of Urban Affairsto market, promote, and develop new business areas for these facilities.14 These marketingefforts are designed to spark growth in the commercial navigation sector, yielding financialbenefits for the ports along the LMR.
14 Port of Greater Baton Rouge, "Port Key Player in New Mississippi River Corridor
Initiative," 12/4/2002, obtained from http://www.portgbr.com on 6/13/2003.

9-9
Exhibit 9-4
LMR SHIPMENTS 1997 TO 2001 BY COMMODITY TYPE
-
20,000
40,000
60,000
80,000
100,000
120,000
140,000
160,000
180,000
Year
Thousands of Short Tons
Food and Farm Products 153,073 152,015 166,231 164,976 167,484
Petroleum and Petroleum Products 132,332 122,874 124,682 131,206 132,873
Non-metallic Minerals and MineralProducts
48,623 51,306 55,924 49,016 43,914
Metal and Primary Metal Products 41,422 51,891 47,552 50,693 41,841
Coal 48,914 45,495 37,601 36,722 37,648
Industrial Chemicals 32,584 29,635 30,012 32,144 28,502
Agricultural Chemicals 13,627 14,716 13,655 15,011 18,477
Manufactured Equipment,Machinery, and Products
2,180 2,302 1,574 1,671 1,670
Other 256 254 171 300 321
1997 1998 1999 2000 2001
Source: U.S. Army Corps of Engineers, Waterborne Commerce of the United States, Calendar Year 2001, WaterborneCommerce Statistics Center, 2003.

10-1
MANUFACTURING CHAPTER 10
The LMR corridor’s manufacturing sector encompasses operations ranging from foodprocessing to chemical manufacturing. In 1998, manufacturers generated $87 billion in revenueand employed roughly 383,000 people, with most of the activity concentrated in the Memphis,Baton Rouge and New Orleans metropolitan areas.
The LMR serves the manufacturing sector in three main ways. First, the river provides ameans of transporting raw materials to processing facilities. In turn, these manufacturers shipprimary and finished products from production sites to distributors. Second, manufacturers drawwater directly from the river for use in production processing, washing, and cooling. Corridormanufacturers withdraw about two billion gallons of surface water per day.1 Some water-intensive industries along the LMR include chemical and allied products, paper and alliedproducts, and petroleum refining. Finally, several manufacturers discharge wastewater fromproduction processes into the LMR. Properly treated effluent can be assimilated and treated bythe river more safely and at a lower cost than if it were disposed of by other means.
This chapter presents an overview of the LMR corridor’s major manufacturing activities,provides revenue and employment estimates, and discusses potential future trends.
DATA SOURCES AND METHODOLOGY
We define the manufacturing sector as those operations that fall within StandardIndustrial Classification (SIC) codes 2000 through 3999.2 Generically, manufacturing refers tothe transformation of materials into new products. This process can occur at a variety of levels,from turning raw materials into intermediate products, to creating finished products. As a result,we include activities in the manufacturing sector that span from primary processing, such asmixing fertilizer, to high technology manufacturing, such as building computers.3
1 U.S. Geological Survey, Water Use in the United States, 1995, obtained from http://
water.usgs.gov/watuse/ on 3/12/03.
2 These SIC codes correspond to NAICS codes 31-33.
3 Office of Management and Budget, Standard Industrial Classification Manual,Executive Office of the President, 1987.

10-2
We rely on a variety of information sources to characterize manufacturing in the LMRcorridor, including: (1) Census and government materials; (2) Company websites; (3)Industrial Outlook 2000; and (4) Value Line Reports. To develop revenue and employmentestimates, we use: (1) IMPLAN model data, 1998; (2) 2000 County Business Patterns; and (3)Dun & Bradstreet reports.
MANUFACTURING REVENUE AND EMPLOYMENT
As shown in Exhibit 10-1, a variety of manufacturers contribute to the LMR corridor’seconomy. As a whole, the manufacturing sector generated $87 billion in revenue and employedabout 383,000 people in 1998, led by three industrial sectors: (1) chemicals and allied products;(2) food and kindred products; and (3) petroleum refining and related industries. Corridormanufacturing is centered around the Memphis, Baton Rouge and New Orleans metropolitanareas, with these areas accounting for about 44 percent of the corridor’s total manufacturingoutput ($38.5 billion).4
MAJOR MANUFACTURING ACTIVITIES IN THE LMR CORRIDOR
Below we describe the corridor’s major manufacturing categories (i.e., chemicals,petroleum refining, and food processing) in more detail and discuss their role in the LMRcorridor. For each category, we examine significant subsectors and provide examples of firmsoperating in the corridor.
Chemicals and Allied Products
Chemical manufacturers in the corridor primarily produce finished chemical products,ranging from organic dyes to fertilizers. These products are used by numerous other industries,helping to fuel the Corridor's economy.
4 Metropolitan Areas defined by Office of Management and Budget, June 30, 1999,
obtained from http://www.census.gov/population/estimates/metro-city/99mfips.txt on 2/3/03.

10-3
Exhibit 10-1
REVENUE AND EMPLOYMENT OF MANUFACTURING SECTORS IN THE LMR CORRIDOR
SIC Code Industrial CategoryIndustry Revenue(millions $2001) Employment
28 Chemicals and allied products 16,587 38,00620 Food and kindred products 13,259 41,64529 Petroleum refining and related industries 9,253 7,66026 Paper and allied products 7,099 25,25035 Industrial and commercial machinery and computer equipment 6,042 37,29237 Transportation equipment 5,807 37,12834 Fabricated metal products, except machinery and transportation
equipment5,234 33,346
36 Electronic and other electrical equipment and components, exceptcomputer equipment
3,855 22,865
33 Primary metal industries 3,779 13,174
30 Rubber and miscellaneous plastics products 3,272 19,23727 Printing, publishing, and allied industries 3,095 28,340
24 Lumber and wood products, except furniture 2,911 22,53432 Stone, clay, glass, and concrete products 1,565 10,59923 Apparel and other finished products made from fabrics and
similar materials1,371 14,132
38 Measuring, analyzing, and controlling instruments; photographic,medical, and optical goods; watches and clocks
1,065 6,947
22 Textile mill products 1,030 7,01525 Furniture and fixtures 963 8,022
39 Miscellaneous manufacturing industries 695 7,35631 Leather and leather products 120 1,947
TOTAL $86,999 382,495Source: IMPLAN model data, 1998.Note: Totals may not sum due to rounding.

10-4
• Cyclic Crudes, Intermediate & Industrial Organic Chemicals:Concentrated around Baton Rouge and New Orleans, this sectormanufactures cyclic organic crudes and intermediates, and organic dyesand pigments. Some of the industry's products include: (1) aromaticchemicals, such as benzene, toluene, mixed xylenes naphthalene; (2)synthetic organic dyes; and (3) synthetic organic pigments.
• Plastics Materials and Resins: This industry, primarily located inLouisiana, produces synthetic resins, plastics materials, andnonvulcanizable elastomers, such as cellulose plastic materials andpetroleum polymer resins.
• Inorganic Chemicals: Companies in this sector manufacture aluminumcompounds, potassium, and sodium compounds from earth materials suchas minerals and the atmosphere. Key end markets for the sector includethe water treatment, pulp and paper, fertilizer, and soap and detergentindustries.5
• Nitrogenous and Phosphatic Fertilizers: This industry, concentratedprimarily around Baton Rouge, manufactures fertilizer compounds,nitrogen solutions, and natural organic fertilizers (except compost) andmixtures.
Exhibit 10-2
MAJOR MANUFACTURING ACTIVITIES: CHEMICALS AND ALLIED PRODUCTSSignificant
ManufacturingActivities
Number ofEstablishments Examples of Major Firms Operating in the Corridor
Crudes,Intermediate &
Industrial OrganicChemicals
13 • Rubicon, Inc.• Flint Ink Corporation• Ciba Specialty Chemicals Corporation
Plastics Materialsand Resins
61 • Albemarle Corporation• Exxon Mobile Chemical Company• Burden Chemicals and Plastics Limited Partnership
InorganicChemicals, N.E.C.
86 • Buckman Laboratories, Inc.• Bulab Holdings, Inc.• Polymer Additives Company
Nitrogenous andPhosphaticFertilizers
53 • Misschem Nitrogen, LLC• Mississippi Chemical Corporation• Georgia Gulf Corporation
Sources: (1) IMPLAN model data, 1998; (2) 2000 County Business Patterns; (3) Dun & Bradstreet reports.
5 U.S. Industry and Trade Outlook 2000.

10-5
Food and Kindred Products
Manufacturers of food and kindred products process food and beverages for human andanimal consumption. Food manufacturers in the corridor take advantage of the region's vibrantsoybean and aquaculture industries. Key subsectors include:
• Soybean Oil Mills: Concentrated in the northern half of the corridor,soybean oil mills manufacture soybean oil, cake, and meal, and soybeanprotein isolates and concentrates.
• Beverages: The beverage industry, located primarily around Memphis,Baton Rouge, and New Orleans, is dominated by bottled soft drinkmanufacturers.
• Prepared Fresh or Frozen Fish and Seafood: Concentrated in Mississippiand Louisiana, this industry processes commercially-landed fish andshellfish as well as farm-raised catfish, producing frozen and fresh seafoodfor consumption within the corridor and for export.
Exhibit 10-4
MAJOR MANUFACTURING ACTIVITIES: FOOD AND KINDRED PRODUCTSSignificant
ManufacturingActivities
Number ofEstablishments Examples of Major Firms Operating in the Corridor
Soybean Oil Mills 9 • DuPont Protein Technologies• Bunge North America, Inc.• Riceland Foods, Inc.
Beverages 95 • Delta Beverage Group Inc.• The Louisiana Coca-Cola Bottling Company Limited• The Coca-Cola Bottling Company of Memphis Tennessee
Fresh and FrozenSeafood
75 • TT&W Farm Products, Inc.• Consolidated Catfish Companies LLC• Southern Farm Fish Processors, Inc.
Sources: (1) IMPLAN model data, 1998; (2) 2000 County Business Patterns; (3) Dun & Bradstreet reports.
Petroleum Refining and Related Industries
Manufacturers of petroleum products in the LMR Corridor use crude oil from Louisianaand the Gulf of Mexico to create gasoline and other liquid fuels, lubricating products, andadditional petroleum and coal products such as packaged and powdered fuel. Key subsectorsinclude:
• Petroleum Refining: Concentrated in the southern part of the Corridor,near the Louisiana and Gulf of Mexico oil fields, the petroleum refining

10-6
industry processes crude oil and natural gas into gasoline for cars andother energy products.
• Lubricating Oils and Greases: This sector manufactures lubricating oilsand greases from purchased mineral, animal, and vegetable materials.
• Petroleum and Coal Products: Located primarily around Baton Rouge andNew Orleans, this sector manufactures packaged fuel, powdered fuel, andother products of petroleum and coal.
Exhibit 10-3
MAJOR MANUFACTURING ACTIVITIES: PETROLEUM REFINING ANDRELATED INDUSTRIES
SignificantManufacturing
ActivitiesNumber of
Establishments Examples of Major Firms Operating in the CorridorPetroleum Refining 67 • Orion Refining Corporation
• Williams Refining and Marketing LLC• Phillips Petroleum Company
Lubricating Oilsand Greases
26 • Coastal Unilube, Inc.• Ashland, Inc.• Exxon Mobil Corporation
Petroleum and CoalProducts, N.E.C.
9 • Great Lakes Carbon Corporation• CII Carbon, LLC• Betty Fields
Sources: (1) IMPLAN model data, 1998; (2) 2000 County Business Patterns; (3) Dun & Bradstreet reports.
Other Significant Manufacturers
In addition to the three largest manufacturing sectors, several other manufacturingindustries play a significant role in the LMR corridor’s economy. The following industries eachhave at least $5 billion in revenues and employ more than 25,000 workers.
• Paper and Allied Products: Concentrated around Memphis and BatonRouge, this industry manufactures paperboard from wood pulp and otherfiber pulp. Some of the by-products of the manufacturing process are usedfor energy in biomass plants.
• Industrial and Commercial Machinery and Computer Equipment: Thisindustry's two largest sub-sectors in the LMR corridor are the refrigerationand heating equipment and oil machinery industries.
• Transportation Equipment: Establishments in this sector manufactureequipment for the transportation of passengers and cargo by land, air, andwater. Shipbuilding, concentrated primarily in Louisiana, and motor

10-7
vehicle assembly, concentrated primarily in Mississippi, are the twolargest sub-sectors in the corridor.
• Fabricated Metal Products: This sector includes establishments engagedin fabricating ferrous and nonferrous metal products, such as metal cans,tinware, handtools, cutlery, general hardware, non-electric heatingapparatus, fabricated structural metal products, metal forgings, metalstampings, ordnance (except vehicles and guided missiles), and a varietyof metal and wire products not elsewhere classified.
Exhibit 10-5
MAJOR MANUFACTURING ACTIVITIES: OTHER SIGNIFICANT MANUFACTURERSSignificant
ManufacturingActivities
Number ofEstablishments Examples of Major Firms Operating in the Corridor
Paper and AlliedProducts
232 • American Tissue Mills of Tennessee• Buckeye Technologies, Inc.• Cleo Inc.
IndustrialMachinery and
ComputerEquipment
1617 • Allied Uniking Corporation• Brother Industries, Inc.• Recon Distribution Center
TransportationEquipment
553 • Transcraft Corporation• Conrad Shipyard LLC• McClendon Resources, Inc.
Fabricated MetalProducts
1121 • Aluma-Form, Inc.• Sfi of Tennessee LLC• Evans Harvey Corp. LLC
Sources: (1) IMPLAN model data, 1998; (2) 2000 County Business Patterns; (3) Dun & Bradstreet reports.
MANUFACTURERS’ USE OF THE LMR
Manufacturing enterprises rely on the LMR for a variety of services. Specifically,manufacturers use water from the LMR in production processing, for transportation of goods,and as a sink for discharge of wastewater.
• Processing: A variety of industries use river water as a key part of themanufacturing process. Collectively, LMR manufacturers used 2.04billion gallons of surface water per day in 1995, up nine percent from1990.6
• Transportation: Many manufacturers ship their products to distributionpoints along the river. For instance, Bunge North America uses the river
6 U.S. Geological Survey, op cit.

10-8
to transport soybeans to its processing facility near Memphis and thenships finished soy products on the river to end-customers.7
• Discharge: The LMR also receives discharges from manufacturerslocated along the river. Approximately 1,192 industrial facilities arepermitted to discharge wastewater to rivers in the LMR corridor (SeeChapter 11).8
In addition, manufacturers are also interested in the quality of the LMR water. Waterthat is too turbid can impair the efficiency of industrial processes such as heat exchange andfiltration. Poor water quality may force manufacturers to perform expensive treatment on waterbefore it can be used. Degraded water quality limits the river’s ability to absorb and treatadditional wastewater discharged from factories. As a result, business interruptions andincreased costs can result from unreliable water supplies or degraded water quality.9
TRENDS
It is difficult to predict broad future trends in manufacturing in the LMR corridor giventhe large variety of goods produced in the region. Nationwide, due to continued economicweakness in the U.S. and its major trading partners, the manufacturing industry is likely to showonly modest growth over the coming years.
Rather than describe the entire manufacturing sector in the Corridor, we focus on theCorridor's three key industries:
• Chemicals and Allied Products: Due to the slow overall growth in themanufacturing sector, which purchases the bulk of the inorganic chemicalindustry's output, the chemical industry is unlikely to see significantgrowth over the next three to five years. As the economic climateimproves, however, the chemical industry may experience a modestannual growth rate of two percent.10
• Food and Kindred Products: The food and beverage industries are likelyto grow in the coming years. Due to the growing use of soybean oil forindustrial and energy uses, the soybean-processing sector is likely to
7 Personal communication with B. Harper, Bunge North American, February 13, 2003.
8 EPA/OW Industrial Facilities Discharge Database, 1997.
9 The McKnight Foundation , The Mississippi River in the Upper Midwest: It’s Economy,Ecology, and Management, 1996.
10 U.S. Industry and Trade Outlook 2000.

10-9
continue recent growth patterns. Although it is difficult to project trends inthe beverage industry, the continued growth in non-cola soft drinkconsumption is likely to lead to steady growth.11
• Petroleum Refining and Related Industries: Over the past decade,Louisiana refinery production has grown approximately 20 percent. Since1998, however, the industry's growth has slowed significantly, with outputdeclining somewhat between 2001 and 2002.12 The Energy InformationAdministration projects continued modest growth in refinery capacity inthe region over the next decade.13
11 Value Line report on the Soft Drink Industry, January 7, 2003.
12 "Louisiana Refinery Statistics,” obtained from http://www.dnr.state.la.us/SEC/EXECDIV/TECHASMT/data/facts_figures/Others/OthRefi.htm on 2/13/03.
13 Supplement Tables to the Annual Energy Outlook 2003, Table 90, http://www.eia.doe.gov/oiaf/aeo/supplement/pdf/supplement_tables(2003).pdf. The projection includes allstates in Petroleum Administration for Defense Districts II, III, and IV. These districts includemost of the mid-western portion of the county.

11-1
NATURAL RESOURCE SERVICES NOTDIRECTLY REFLECTED IN THE COMMERCIAL ECONOMY CHAPTER 11______________________________________________________________________________
Other chapters in this report characterize how the LMR contributes to commercialactivity such as navigation, recreational spending, or energy production. However, naturalresources such as the LMR frequently provide services not directly reflected in the commercialeconomy but which are nonetheless valuable to society. In the sections below, we consider thefollowing:
• Use of the river as a site for discharging wastewater;
• Services provided by wetlands in the LMR study area; and
• The LMR as habitat for wildlife, irrespective of human use of the wildlife.
WASTEWATER TREATMENT
Major waterbodies such as the LMR commonly serve as “sinks” for receiving andtreating wastewater from factories, municipal sewage treatment plants, and other sources such asagricultural operations. Environmental regulations require that concentrations of harmfulpollutants be reduced before wastewater is discharged to surface waters such as the LMR.However, residual amounts of bacteria, nutrients, metals, and other pollutants typically remain inthe effluent that facilities discharge. Natural biological processes in the river help break someresidual pollutants down while more persistent pollutants settle to sediments or are carrieddownstream.
The LMR’s ability to treat and store wastewater represents a key service that is notdirectly reflected in the commercial economy. While no one “buys” the service, precludingwastewater discharges would require that facilities find other ways to treat and dispose ofwastewater. These alternative methods would likely be costly. Therefore, the cost savingsassociated with being able to discharge wastewater can be thought of as a benefit provided by theLMR.1
1 It is noteworthy that discharges to rivers like the LMR have negative economic
consequences as well (e.g., reduced recreational use in areas of poor water quality). While thisstudy focuses on commercial economic activity, a more comprehensive study of the societalcosts and benefits associated with river management would incorporate such deleteriousdownstream impacts.

11-2
As shown in Exhibit 11-1, numerous operations discharge wastewater to the LMR. Inall, approximately 1,800 facilities hold permits to discharge wastewater. Concentrations ofpermitted dischargers coincide with population centers such as Memphis and New Orleans. Inthese areas, municipal sewage treatment plants receive and treat sewage from homes andbusinesses, discharging the treated wastewater. Likewise, numerous manufacturing operationsin these areas have their own permits to treat and discharge wastewater. Exhibit 11-2 shows thelocation of permitted dischargers throughout the study area.
Exhibit 11-1
PERMITTED WASTEWATER DISCHARGERS IN THE LMR CORRIDOR
StateMunicipal
Treatment Plants Industrial FacilitiesTotal Permitted
DischargersIllinois 9 17 26Missouri 46 20 66Kentucky 10 8 18Tennessee 46 84 130Arkansas 190 155 345Mississippi 18 79 97Louisiana 309 829 1,138TOTAL 628 1,192 1,820Source: U.S. EPA, Permit Compliance System data; Better Assessment Science Integrating Point and NonpointSources, Volume 2, January 1999.
WETLAND SERVICES
Wetlands are essential to ecological quality in many areas, providing habitat, floodcontrol and other services (see below). The LMR region features what are arguably the mostextensive, unique, and threatened wetland resources in the U.S.2 First, the bottomland hardwoodforested wetlands of the Mississippi Delta include diverse ecosystems such as cedar bogs, redmaple swamps, and cypress swamps. In the last century, vast portions of these wetlands werecleared, drained, and converted to agricultural land. Available data suggest that of the original21 million acres of forested wetlands in the Mississippi River Alluvial Plain, only 4.9 millionacres remain.3
2 Because data on wetland acreage by county are not readily available, we were unable to
develop detailed estimates of wetland acreage in the LMR corridor. Personal communicationwith Tom Dahl, U.S. Fish and Wildlife Service, May 9, 2003.
3 National Biological Service, Our Living Resources: A Report to the Nation on theDistribution, Abundance, and Health of U.S. Plants, Animals, and Ecosystems, 1995; and USGS,National Water Summary on Wetland Resources, 1996.

11-3
Exhibit 11-2
PERMITTED WASTEWATER DISCHARGERS IN LMR CORRIDOR

11-4
In addition, the coastal plain of Louisiana represents a critical wetland resource. Thesecoastal wetlands provide essential fish and waterfowl habitat, flood protection, and numerousother services. Overall, the coastal marshes of Louisiana represent 35 to 40 percent of thecoastal marsh area in the continental U.S. However, erosion, subsidence, and reduced sedimentloads associated with modification of Mississippi River flows cause roughly 25 to 30 squaremiles of wetland loss each year in Louisiana. Coastal wetland loss on this scale can impose avariety of economic costs. For example, experts believe that much of the decline in commercialfish landings in Louisiana is associated with wetland loss.4
While development of wetlands benefits agriculture and other forms of economicdevelopment, such development has its costs as well. Wetlands provide a number of crucialecological services that must be replaced or forsaken when wetlands are lost. Examples includethe following:
• Flood Control: Wetlands provide a variety of flood protection services.They store runoff during precipitation events, avoiding rapid releases torivers and streams and the flooding that occurs when the carrying capacityof the river is exceeded. Similarly, coastal wetlands like those inLouisiana are critical in reducing the severity of hurricane storm surges.
• Protection of Water Quality: Plants growing in wetlands absorbdissolved nutrients, such as nitrogen and phosphorus. Particulate matter,toxic pollutants, and heavy metals present in wastewater settle to thebottom of wetland areas. Because of these functions, wetlands can play animportant role in treating municipal and industrial wastewater dischargedto rivers and streamside areas.
• Water Supply: Some types of wetlands supplement groundwater throughpercolation of surface water to groundwater aquifers. These aquifers maybe used for drinking water, irrigation water, or other applications.
Wetland services are not traded in markets, so placing a value on them can be difficult.One way that economists estimate the value of wetlands is to consider the cost of constructingman-made alternatives. For example, we can consider the cost of constructing a wastewatertreatment plant that filters wastewater in a manner similar to wetlands. Likewise, the value ofwetlands is reflected in the cost of building flood control structures such as levees. Some or allof these costs could be avoided if wetland areas were preserved or restored. Although the resultsare highly site-specific, estimates of the annual per-acre value of wetlands ranges from about
4 Coast 2050: Toward a Sustainable Coastal Louisiana, an Executive Summary,
Louisiana Coastal Wetlands Conservation and Restoration Task Force and the WetlandsConservation and Restoration Authority, 1998; and USGS, National Water Summary on WetlandResources, 1996.

11-5
$100 to over $1,000, based on the avoided cost of providing lost services through engineeredmeans.5
Wetlands also play a critical role as habitat for wildlife and thereby support wildlife-associated recreation such as fishing and hunting. The importance of recreation to thecommercial economy is discussed elsewhere in this report, as is commercial fishing andtrapping. Below, we discuss the intrinsic value of wildlife habitat.
WILDLIFE HABITAT
The wetlands and other natural resources of the LMR region offer essential habitat forbirds, fish, and other wildlife. As we note elsewhere in this report, the fish and wildliferesources supported by the LMR ecosystem are the foundation for diverse economic activitysuch as recreation and commercial harvests.
Separate from these human-centered considerations, however, it is useful to highlight theintrinsic importance of the LMR as habitat for wildlife species. Economists have conductednumerous studies of individuals' willingness to pay for environmental amenities such asprotection of endangered species, maintenance of river ecosystems, and protection of wetlandhabitat. These studies generally estimate the amount of money an average household would bewilling to pay each year for protection or maintenance of the environmental amenity. While thesurvey-based methodologies used in these studies are subject to a variety of uncertainties,economists generally accept the notion that the public intrinsically values environmental qualitywhen unique or regionally distinct resources are at issue, even when the survey respondents haveno intention of directly using the resource. Therefore, while the value of wildlife habitat in theLMR region may be indirectly reflected in the commercial economy (e.g., in recreation andcommercial fishing impacts), surveys have shown that people intrinsically value environmentalquality and the health of habitat and species that they do not directly use.6
Below, we examine common and threatened species and the ecosystem components onwhich they rely. We then review a variety of on-going efforts that seek to conserve or restorewildlife habitat in the LMR region.
5 Barataria-Terrebonne National Estuary Program, Economic Value Assessment for the
Barataria-Terrebonne Estuarine System, prepared by Industrial Economics, Incorporated, March1996.
6 Walsh, R.G., et al., “Estimating the Public Benefits of Protecting Forest Quality,”Journal of Environmental Management, Volume 30, 1990; Boyle, K.J., and R.C. Bishop,“Valuing Wildlife in Benefit-Cost Analyses: A Case Study Involving Endangered Species,”Water Resources Research, Vol. 23, No. 5, 1991; and Brookshire, David S., et al., “ExistenceValues and Normative Economics: Implications for Valuing Water Resources,” Water ResourcesResearch, Vol. 22, No. 11, 1986.

11-6
Fish Species and Habitat
Researchers estimate that the LMR supports 91 species of freshwater fish, as well asmore than 30 other species that use the river at various points in their life cycle. Among themost common species are darter, freshwater drum, sturgeon, bass, bluegill, catfish, andpaddlefish. The richness of fish species is attributable to the diverse habitat features of the river.First, the physical structure of the LMR and its tributaries provides an array of habitats,including dike fields and backwater lakes, where species can thrive. Many species forage andspawn in the floodplain during high-water periods. Still other fish inhabit the swift-current areasof the main LMR channel, although most occupy the channel bottom where flows are not asextreme as the upper portions of the water column.
The LMR is also critical to the maintenance of key marine fish species. The delta areasin coastal Louisiana provide habitat for white shrimp, brown shrimp, blue crab, red drum, blackdrum, southern flounder, and spotted sea trout. Areas in Plaquemines Parish (Louisiana) aredesignated by the Gulf of Mexico Fishery Management Council as Essential Fish Habitat (EFH)for brown shrimp, white shrimp, and red drum.7
Trends in the abundance of fish in the LMR are difficult to characterize. On the onehand, many species have declined. Roughly six percent of the fish species native to theMississippi Delta are listed as threatened, endangered, or of special concern. Species that preferslow current and gravel flats probably have decreased in abundance because of navigation andflood control structures that channelize the river and increase flows. Water quality issuesassociated with agriculture, urbanization, and industrial pollution also contribute to reducedabundance. However, other species, such as the blue sucker and blue catfish, have fared well inthe swift currents of the LMR. Fish habitat has also been lost in the coastal areas of Louisiana.Decreased delivery of sediment from the LMR has limited key nursery habitat, and structures toprevent loss of coastal wetlands have impeded the migration of some fish species.8
7 Report comments provided by Roy E. Crabtree, PhD., Regional Administrator,
Southeast Regional Office, National Marine Fisheries Service, September 17, 2003.
8 USGS, Status and Trends of the Nation’s Biological Resources, Volume 1, 1998; andNational Park Service, Draft Heritage Study and Environmental Assessment – Lower MississippiDelta Region, no date.

11-7
THE PALLID STURGEON
The pallid sturgeon is a prominent example of the endangered fish species found in the LMR. It is readilyidentifiable by its flat snout, bony body plates, and large size (up to 80 pounds). This prehistoric fish favors large,swift flowing rivers with silty bottom habitat, and also requires gravel flats for spawning. Researchers believe thatpallid sturgeon populations have declined as a result of various physical alterations in the Missouri and MississippiRivers, including dams, navigational lock systems, and other structures that impede natural river flows. Today, theonly significant remaining populations reside in the Upper Missouri, Lower Mississippi, and Atchafalaya Rivers.Researchers from the U.S. Fish and Wildlife Service, Army Corps of Engineers, and state agencies are collaboratingon studies to better understand the movement and habitat demands of the pallid sturgeon.
Source: Lower Mississippi River Conservation Committee, The River Packet, Spring 2002; “Pallid Sturgeon: ALouisiana Living Fossil,” Louisiana Agricultural Experiment Station, obtained on-line.
Bird Species and Habitat
The LMR corridor is part of the Mississippi Flyway, one of four major migration routesfor birds in North America. The north-to-south orientation of the river offers a long expanse ofuninterrupted habitat for migratory birds. Perhaps most notably, the wetlands of the LMRcorridor provide feeding, resting, and breeding opportunities for waterfowl. For example, asmuch as 40 percent of the continental U.S. mallard duck population winters in the MississippiDelta region. Overall, waterfowl species reliant upon Delta resources include geese (Canadageese, snow geese, and lesser white-fronted geese) and diverse duck species, including gadwall,mallard, green-winged teal, American wigeon, American black duck, and northern pintail. Othermigratory birds benefit from forested areas of the LMR corridor. Cypress, gum, elm, and oaktrees provide breeding and wintering habitat for songbirds, osprey, herons, and egrets.Threatened and endangered bird species that inhabit the LMR region include bald eagles andperegrine falcons.9
9 USGS, Status and Trends of the Nation’s Biological Resources, Volume 1, 1998; and
National Park Service, Mississippi River Corridor Study, Volume 2, Inventory of Resources andSignificance, 1996; and National Park Service, Draft Heritage Study and EnvironmentalAssessment – Lower Mississippi Delta Region, no date.

11-8
The coastal Louisiana portions of the LMR study area also offer unique habitat for a vastarray of bird species. Bird species commonly found in coastal areas include, but are not limitedto American coot, clapper rail, king rail, common moorhen, gallinule, American woodcock,common snipe, wood stork, American white pelican, pied-billed grebe, magnificent frigatebird,black-necked stilt, American avocet, killdeer, black-bellied plover, willet, and varioussandpipers, gulls, and terns. The barrier islands of coastal Louisiana are especially critical forvarious seabirds and wading birds. Likewise, coastal marsh areas host large waterfowlpopulations, supporting over half of the wintering U.S. populations of species such as mottledduck, gadwall, and blue-winged teal.10
Habitat Protection Efforts
The value that the public places on the maintenance of wildlife habitat and species ispartly reflected in past and ongoing conservation efforts. Below, we examine a sample of theconservation and restoration efforts underway in the LMR region.
National Wildlife Refuge System
Federal and state resource management agencies have established a vast network ofhabitat conservation areas. Most notably, the U.S. Fish and Wildlife Service maintains 34National Wildlife Refuge (NWR) units in the LMR region, with a focus on migratory birdhabitat. Two of these refuges, White River NWR and Catahoula NWR, are designated by theRAMSAR Convention as "Wetlands of International Importance".11 In all, more than 700,000acres of NWR land are located in the LMR corridor, the largest of which include White RiverNWR (Arkansas), Cache River NWR (Arkansas), Tensas River NWR (Lousiana), and the DeltaNWR located at the mouth of the Mississippi on the Louisiana Gulf Coast. Exhibit 11-3 showsthe total acreage for major national wildlife refuges in the study area.
10 USGS, Status and Trends of the Nation’s Biological Resources, Volume 1, 1998.
11 The RAMSAR Convention on Wetlands, A Directory of Wetlands of InternationalImportance, August 2003, http://www.wetlands.org/RDB/Directory.html.

11-9
Exhibit 11-3
NATIONAL WILDLIFE REFUGES IN THE LMR CORRIDORRefuge State Acreage
Bald Knob NWR AR 14,800Big Lake NWR AR 11,038Cache River NWR AR 55,000Overflow NWR AR 12,247Wapanocca NWR AR 5,885White River NWR AR 145,000Cypress Creek NWR IL 14,000Atchafalaya NWR LA 15,220Bayou Cocodrie NWR LA 11,255Bayou Sauvage NWR LA 23,000Bayou Teche NWR LA 9,028Big Branch Marsh NWR LA 12,000Black Bayou Lake NWR LA 4,500Bogue Chitto NWR LA 40,000Cat Island NWR LA 36,500Catahoula NWR LA 25,043Delta NWR LA 48,000Grand Cote NWR LA 6,000Handy Brake NWR LA 20,000Lacassine NWR LA 35,000Lake Ophelia NWR LA 18,000Mandalay NWR LA 4,212Tensas River NWR LA 64,012Dahomey NWR MS 9,691Hillside NWR MS 15,500Mathews Brake NWR MS 2,418Morgan Brake NWR MS 7,381Panther Swamp NWR MS 38,500St. Catherine Creek NWR MS 13,478Yazoo NWR MS 12,470Chicksaw NWR TN 24,096Lake Isom NWR TN 1,846Lower Hatchie NWR TN 7,394Reelfoot NWR TN 10,428Sources: U.S. Fish and Wildlife Service, Refuge Centennial Homepage (http://refuges.fws.gov/centennial/); U.S. NationalPark Service, Mississippi River Corridor Study, Vol. 2, Inventory of Resources and Significance, 1996.

11-10
Wetland Reserve Program
A variety of efforts are underway to stem the loss of wetlands in the LMR region andthroughout the U.S. In the LMR region, one especially noteworthy program is the WetlandReserve Program (WRP). Under the 1990 Farm Bill, the U.S. Department of Agricultureintroduced the WRP to allow owners of marginally-productive farmland to receive payments inreturn for establishing permanent or long-term conservation easements. The purpose of theprogram is to restore hydrology and vegetation on wetlands, providing habitat for wildlife aswell as other natural resource benefits. In the Delta, the program is especially useful forproviding habitat to waterfowl and other migratory birds using the Mississippi flyway. WRPeasements often allow other compatible uses of the land such as leasing of hunting rights, timberproduction, and flood water retention.12
In total, landowners in the LMR corridor counties have enrolled over 349,000 acres ofland in the WRP, representing over 27 percent of WRP land nationally. As shown in Exhibits11-4 and 11-5, the greatest concentrations of WRP lands are found in northeast Louisiana, withsignificant acreage in Mississippi and Arkansas counties as well.
Exhibit 11-4
ENROLLED WETLAND RESERVE PROGRAMLAND IN LMR CORRIDOR COUNTIESState Enrolled Acres
Missouri 9,682Illinois 6,569
Kentucky 2,484Tennessee 10,436Arkansas 81,741
Mississippi 98,215Louisiana 140,120TOTAL 349,247
Source: Data provided by state NRCS representatives, including Jody Pagan(Arkansas); David Hiatt (Illinois); Jeffrey Combs (Louisiana); Gil Ray (Mississippi);Doug Helmers (Missouri); Mike Zeman (Tennessee); and Jack Kuhn (Kentucky).
12 North Carolina State University, “Restoration of Wetlands Under the Wetlands
Reserve Program,” Woodland Owner Note No. 24, February, 1994, obtained fromhttp://www.ces.ncsu.edu; and “Farm Bill 2002: Wetland Reserve Program,” NRCS Fact Sheet,05/03.

11-11
Exhibit 11-5
WETLAND RESERVE PROGRAM ACREAGE IN LMR CORRIDOR

11-12
Coast 2050
In 1998, the state of Louisiana and a variety of federal partners established a plan forprotecting and restoring the coastal wetlands of Louisiana. As noted, problems such as erosion,subsidence, and loss of sediment flows have resulted in major losses of coastal wetlands in theregion. The stated goals of the Coast 2050 program include the following:
• To create and sustain coastal marsh areas by accumulating sediment andorganic matter; and
• To maintain habitat diversity by regulating salinity levels and protectingkey land forms such as barrier islands.
Strategies for pursuing these goals include river diversions to restore natural hydrology to keyareas, closure of problematic navigation channels, structural repairs to barrier islands, andsediment flow management to rebuild depleted marsh areas.13
Coastal Wetlands Planning, Protection, and Restoration Act
The Coastal Wetlands Planning, Protection, and Restoration Act (CWPPRA) of 1990funds projects to create, protect, restore and enhance wetlands, with a focus on wetlands incoastal Louisiana. The CWPPRA Task Force includes the U.S. Fish and Wildlife Service;Natural Resources Conservation Service; Corps of Engineers; National Marine Fisheries Service;U.S. Environmental Protection Agency; and the state of Louisiana. Louisiana receivesapproximately $50 million in funding annually under CWPPRA.
The Task Force is responsible for establishing a list of individual wetlands projects to bepursued, identifying the costs, benefits, and timetable associated with each project. Data madeavailable by the U.S. Geological Survey indicate that a total of 162 individual wetlandsimprovement projects currently exist or have been completed in the parishes of the LMR studyarea.14 The projects vary greatly in terms of scale and type. For example, one project isdesigned to prevent breaching of the Plaquemines Barrier Island system in order to protect dune,swale, and marsh habitats; the total project cost is predicted to be approximately $54 million. Incontrast, another shoreline maintenance project along Lake Barre (Terrebonne Parish) isdesigned to reduce salt water intrusion and loss of saline marsh; the project is projected to costabout $2.6 million.15
13 Coast 2050: Toward a Sustainable Coastal Louisiana, an Executive Summary,
Louisiana Coastal Wetlands Conservation and Restoration Task Force and the WetlandsConservation and Restoration Authority, 1998.
14 “CWPPRA Projects by Parish,” provided by David Guilbeau, Johnson Controls,National Wetlands Research Center, November 3, 2003.
15 CWPPRA project descriptions obtained on-line at www.lacoast.gov.

11-13
Other Conservation Initiatives
The natural resources of the LMR region are the focus of several other conservation andrestoration initiatives. While these efforts are too numerous to review comprehensively, arepresentative subset includes the following:
• Wildlife Habitat Incentives Program (WHIP): Administered by theU.S. Department of Agriculture’s Natural Resources ConservationService, WHIP provides technical and financial assistance to landownersto develop or improve wildlife habitat on private land. In Mississippi, forexample, 284 applications were funded in 2001, covering nearly 15,000acres.16
• Ducks Unlimited (DU): DU conducts waterfowl habitat conservationefforts throughout the U.S. In the LMR region, the RiverCARE programrestores wetland hydrology through agricultural management andreforestation; the program is expected to benefit over 150,000 acres in theLower Mississippi Alluvial Valley. Other DU initiatives focus on GulfCoast wetlands and Arkansas rice growers.17
• North American Wetlands Conservation Council: Operating under theauthority of the North American Wetlands Conservation Act, the Councilidentifies wetland conservation projects to enhance migratory bird habitat.The funded projects have included conservation efforts throughout theLMR region. In 2000/2001, the projects restored or enhanced nearly120,000 acres in the Delta and Louisiana coastal areas.18
• Continuing Authorities Program: The Corps of Engineers is authorizedto plan, design, and construct certain types of water resourceimprovements to address urgent flood control, navigation, or erosionproblems. Under the Continuing Authorities Program, the Corpsimplements projects for the restoration of fish and wildlife habitats if thedegradation originates with a federal water resource project. Under thisprogram, the Corps has implemented side channel improvements,modifications in batture land, and weirs in river tributaries to create fishhabitat in the LMR region.
16 NRCS, “2001 Wildlife Habitat Incentives Program, Mississippi Summary,” December
2001.
17 Ducks Unlimited, Southeastern Region major initiatives, obtained fromhttp://www.ducks.org on 01/15/03.
18 North American Wetlands Conservation Council, North American WetlandsConservation Act Progress Report 2000-2001, January 2002.

11-14
• Conservation Reserve Program (CRP) and Environmental QualityImprovement Program (EQIP): Operated by the Natural ResourcesConservation Service (Department of Agriculture), the CRP and EQIPprograms encourage farmers to implement environmental enhancements.The programs seek to reduce sedimentation in rivers and lakes, andimprove wildlife habitat through enhancement of forest and wetlandresources. Under the CRP, farmers receive annual rental payments onimproved land while EQIP offers fixed-term cost-sharing and incentivepayments.
• Barataria-Terrebonne National Estuary Program (BTNEP): TheBTNEP is one of 28 National Estuary Program units establishedthroughout the U.S. The National Estuary program was introduced byCongress in 1987 to improve the quality of nationally important estuaries.The Barataria-Terrebonne estuarine complex is located in south Louisianabetween the Atchafalya and Mississippi Rivers. The BTNEP is composedof a variety of stakeholder organizations and manages a diverse array ofresearch, conservation, and restoration activities through the region.

APPENDIX A:
COUNTIES IN THE LMR CORRIDOR

Appendix A
LMR CORRIDORCOUNTIES LISTED BY STATE
ArkansasArkansasAshleyChicotClayCraigheadCrittendenCrossDeshaDrewGreeneIndependenceJacksonJeffersonLawrenceLeeLincolnLonokeMississippiMonroePhillipsPoinsettPrairiePulaskiRandolphSt. FrancisWhiteWoodruff
IllinoisAlexanderJohnsonPulaski
KentuckyBallardCarlisleFultonHickman
LouisianaAscensionAssumptionAvoyellesCaldwellCatahoulaConcordiaEast Baton RougeEast CarrollEast FelicianaEvangelineFranklinIberiaIbervilleJeffersonLa SalleLafayetteLafourcheLivingstonMadisonMorehouseOrleansOuachitaPlaqueminesPointe CoupeeRapidesRichlandSt. BernardSt. CharlesSt. JamesSt. John the BaptistSt. LandrySt. MartinSt. MarySt. TammanyTangipahoaTensasTerrebonneVermilionWest Baton RougeWest CarrollWest Feliciana
MississippiAdamsBolivarClaiborneCoahomaDeSotoHolmesHumphreysIssaquenaJeffersonLeflorePanolaQuitmanSharkeySunflowerTallahatchieTateTunicaWarrenWashingtonWilkinsonYazoo
MissouriBollingerButlerCape GirardeauDunklinMississippiNew MadridPemiscotRipleyScottStoddardWayne
TennesseeDyerLakeLauderdaleObionShelbyTipton

APPENDIX B:
IMPLAN MODEL AND DATA

Appendix B
IMPLAN MODEL AND DATA
Portions of our analysis rely on data from MicroIMPLAN (IMpact Analysis forPLANning), an input/output model originally designed by the U.S. Forest Service.1 Many stateand federal planning agencies use IMPLAN to evaluate the economic impact of policy choices.Like other regional economic models, IMPLAN allows the user to specify changes in output inkey industries and examine how these changes affect the larger regional economy. The primarycomponent of the model is an input/output matrix that describes how much of each sector's inputneeds are met by the outputs of all other sectors in the specified geographic area. To groupindustries for purposes of developing the input-output matrix, IMPLAN uses the categoriesdefined by the U.S. Office of Management and Budget's Standard Industrial Classification (SIC)code.
While this report does not rely on IMPLAN modeling, it does use the underlying datafrom the IMPLAN input/output matrix. Specifically, we rely on the County-level Databasecomponent of the IMPLAN model. For our purposes, the advantage of this data base is that itincludes county-level estimates of revenues of key industries. While other regional economicdata sources (e.g., the Census Department's County Business Patterns) provide county-levelestimates of employment and salaries, none provide revenue estimates at this geographic level.The data reflect economic activity in 1998, the most recent year for which data are available.
IMPLAN's County-level Database estimates employment using data from the Departmentof Labor's ES202 employment security data, supplemented by County Business Patterns data anddata from the Bureau of Economic Analysis's Regional Economic Information System (REIS).Employment figures include all employees of an industry, regardless of function (e.g.,administrative staff at a steel plant are counted the same way as production floor workers). Thedata include both full- and part-time workers, so that the number of full-time equivalent jobs isless than the total employment reported.
IMPLAN's County-level Database also provides estimates of output (i.e., revenue) indifferent industries. This output is simply the value of production by the industry for a givenyear. County-level output is based on county-level employment information. The data base usesstate-level estimates of revenue per worker (based on Bureau of Census economic census dataand other federal industry surveys) in combination with the employment data to arrive at county-level revenue for each industry. It is important to recognize, therefore, that the county-levelrevenue figures are estimates, and are not reported as part of economic censuses. As such, theyare subject to a moderate degree of uncertainty.
All IMPLAN data used in this report were obtained from the U.S. Fish and WildlifeService's Division of Economics, a licensed owner of the data.
1 The IMPLAN model is now owned and maintained by the Minnesota IMPLAN Group,
Inc. (MIG), in Stillwater, Minnesota. Information in this appendix is taken from IMPLANProfessional: User's Guide, Analysis Guide, and Data Guide, February 1997.

APPENDIX C:
INDIVIDUALS AND ORGANIZATIONSCONTACTED FOR INFORMATION

Appendix C
Exhibit C-1
INDIVIDUALS AND ORGANIZATIONSCONTACTED FOR INFORMATION
Person OrganizationMichael Armstrong Arkansas Department of Game and FishGabrielle Boudreaux Bodin U.S. Geological SurveyAlice Browning Arkansas Department of Game and FishSylvia Cabrera U.S. Fish and Wildlife ServiceJeffrey Combs Natural Resource Conservation ServiceTom Dahl U.S. Fish and Wildlife ServiceJeff Farwick Arkansas Department of Game and FishKaren Foote Louisiana Department of Wildlife and FisheriesDave Hamilton Missouri Department of Natural ResourcesB. Harper Bunge North AmericanJuanita Harper Mississippi Oil and Gas BoardKathy Harris Mississippi Department of Wildlife, Fisheries, and ParksDoug Helmers Natural Resource Conservation ServiceDoug Henley Kentucky Department of Natural ResourcesDavid Hiatt Natural Resource Conservation ServiceHerb Holloway Louisiana Department of Wildlife and FisheriesChris Horton Arkansas Game and Fish CommissionBubba Hubbard Mississippi Department. of Wildlife, Fisheries, and ParksDr. Kevin M. Hunt Mississippi State UniversityJoe Jewell Mississippi Department of Marine ResourcesTony Johnson U.S. Forest ServiceGreg Jones Missouri Department of ConservationGary Krauss U.S. Fish and Wildlife ServiceJack Kuhn Natural Resource Conservation ServiceJim Lane Kentucky Department of Natural ResourcesTrevor Lawrence Illinois Department of Natural ResourcesJoseph Mann U.S. Army Corps of EngineersRob Mayer Illinois Department of Natural ResourcesDee Ann McKinney Missouri Division of TourismJack Moody Mississippi Department of Environmental QualityJody Pagan Natural Resource Conservation ServiceJudy Pevey Louisiana Department of Culture, Recreation, and TourismBill Posey Arkansas Department of Game and FishGil Ray Natural Resource Conservation ServiceBruce Reid Audobon MississippiDoyle Shook Arkansas Department of Game and FishJudy Spears Arkansas Oil and Gas CommissionArnold Tanner U.S. Geological SurveyGlenn Thomas Louisiana Department of Wildlife and FisheriesRob Todd Tennessee Wildlife Resources AgencyVince Travnachek Missouri Department of Natural ResourcesAmy Tujague Waterborne Commerce Statistics CenterJohn Vissage U.S. Forest ServiceShirley Wilkes Louisiana Office of ConservationLeigh Ann Wilkins Mississippi Gaming CommissionScott Yaich Ducks UnlimitedMike Zeman Natural Resource Conservation Service

APPENDIX D:
REFERENCES

Appendix D
LMR REFERENCES
American Soybean Association. Biodiesel Backgrounder. Oct 25, 2002. Obtained fromhttp://www.amsoy.org on 4/4/2003.
American Soybean Association. Communication the Importance of Domestic Swine and PoultryProduction. 2003. Obtained from http://www.amsoy.org on 4/2/2003.
Aquaculture.com. “Catfish – Channel (Ictalurus punctatus).” Obtained fromhttp://www.aquaculture.com on 3/17/2003.
Arkansas Department of Parks and Tourism. Arkansas Statewide Comprehensive OutdoorRecreation Plan (SCORP). 1995.
Barataria-Terrebonne National Estuary Program. Economic Value Assessment for the Barataria-Terrebonne Estuarine System. Prepared by Industrial Economics, Incorporated. March1996.
Boyle, K.J., and R.C. Bishop. “Valuing Wildlife in Benefit-Cost Analyses: A Case StudyInvolving Endangered Species.” Water Resources Research. Vol. 23, No. 5. 1991. pp.943-950.
Brookshire, David S., et al. “Existence Values and Normative Economics: Implications forValuing Water Resources.” Water Resources Research. Vol. 22, No. 11. 1986. pp. 1509-1518.
Clay, Floyd. History of Navigation on the Lower Mississippi. A National Waterways Study, U.S.Army Engineer Water Resources Support Center, Institute for Water Resources, January1983.
Cochran, Thad. Farm-raised Catfish, Fact Sheet. National Warmwater Aquaculture Center.Delta Branch Experiment Station. June 2000. Obtained from http://www.msstate.com on3/21/2003.
Cotton Board. How U.S. Cotton Finds Its Way into the U.S. Consumer Market. Obtained fromhttp://www.cottonboard.org on 4/4/2003.
Council of Economic Advisors, Executive Office of the President. Economic Report of thePresident. 2002
Daniels, Bob. “The importance of forest management and timber harvests in local economies: AMississippi example.” Southern Perspectives. 3 (2). Summer 1999.http://srdc.msstate.edu/publications/summersp99.htm
Delta Queen Steamboat Company, Inc. Obtained from http://www.deltaqueen.com/index.asp on2/27/03.

Appendix D
Ducks Unlimited. “Arkansas Duck Season Gets Mixed Reviews.” Obtained fromhttp://www.ducks.org on 1/03
Ducks Unlimited. Southeastern Region major initiatives. Obtained from http://www.ducks.orgon 1/03
Economic Research Service. Agricultural Baseline Projections: U.S. Crops, 2003 – 2012.USDA.February 13, 2003. Obtained from http://www.ers.usda.gov on 3/10/2003.
Energy Information Administration. Map of North American Electric Reliability Council(NERC) Regions and Subregions. Obtained from http://www.eia.doe.gov/cneaf/electricity/ chg_str_fuel/html/fig02.html on 1/28/03.
Fur Commission USA. Obtained from http://www.furcommission.com/news/newsE96.htm on6/9/03.
Groundwater Protection Council. Mississippi Groundwater Resources. Obtained fromhttp://www.gwpc.org on 6/5/03.
Illinois Department of Natural Resources. Illinois Statewide Comprehensive Outdoor RecreationPlan (SCORP). 1999.
Industrial Economics, Incorporated. Economic Profile of the Upper Mississippi River Region.Prepared for the U.S. Fish and Wildlife Service. March 1999
Industrial Economics, Inc. Economic Assessment of the NECEDAH National Wildlife RefugeComprehensive Conservation Plan. Prepared for the U.S. Fish and Wildlife Service.March 1998.
Industrial Economics, Inc. Economic Assessment of Bristol Bay Area National Wildlife Refuges.U.S. Fish and Wildlife Service. Prepared for the U.S. Fish and Wildlife Service.December 1998.
Industrial Economics, Inc. Economic Assessment of the Proposed Aldo Leopold NationalWildlife Refuge. Prepared for the U.S. Fish and Wildlife Service. August 1999.
Industrial Economics, Inc. Economic Assessment of the Nantucket and Monomoy NationalWildlife Refuges. Prepared for the U.S. Fish and Wildlife Service. May 2000.
Jones, W. Daryl, Ian A. Munn, Jeanne C. Jones, and Stephen C. Grado. Fee Hunting: An IncomeSource for Mississippi's Non-Industrial, Private Landowners. FWRC Resource Bulletin.February 2001. http://www.cfr.msstate.edu/fwrc/feehunting.pdf.
Kentucky. Outdoor Recreation in Kentucky (SCORP). 1999.
Kleinholz, Conrad W. Southern Regional Aquaculture Center. Species Profile: BigmouthBuffalo. June 2000.

Appendix D
Kostick, Dennis S. Salt – 2001. Bulletin prepared for U.S. Geological Survey for 2001 MineralsYearbook.
Louisiana Coastal Wetlands Conservation and Restoration Task Force and the WetlandsConservation and Restoration Authority. Coast 2050: Toward a Sustainable CoastalLouisiana, an Executive Summary. 1998.
Louisiana Department of Culture, Recreation, and Tourism. Louisiana Folklife Program.Obtained from http://www.crt.state.la.us/folklife/main_reg_folk_program.html on3/28/03.
Louisiana Department of Culture, Recreation, and Tourism. Success Stories 2001: BuildingTourism by Reconnecting with Your Community’s Heritage. Eleventh Louisiana RuralTourism Development Conference. November 2001
Louisiana Department of Natural Resources, Strategic On-Line Natural Resources InformationSystem (SONRIS). Yearly Production by Parish. Obtained on 01/03.
Louisiana Department of Wildlife and Fisheries. Number of Recreational Licenses Sold. 2002.
Louisiana Fur and Alligator Advisory Council. Obtained from http://www.alligatorfur.com/annualreport/allind.html on 6/10/03.
Louisiana Fur and Alligator Advisory Council. Obtained from http://www.alligatorfur.com/annualreport/problems.html. on 6/10/03.
Louisiana Gaming Control Board. Revenue Reports. Obtained fromhttp://www.dps.state.la.us/lgcb/ on 2/26/03.
Louisiana Geological Survey. “Louisiana Salt Domes.” Petroleum Industry Facts. January 2000.
Louisiana Mid-Continent Oil and Gas Association. The ‘Energy’ Sector: Still a Giant EconomicEngine for the Louisiana Economy. April 2002.
“Louisiana Refinery Statistics.” Obtained from http://www.dnr.state.la.us/SEC/EXECDIV/TECHASMT/data/facts_figures/Others/OthRefi.htm on 2/13/03.
Louisiana State Parks Website. Obtained from http://www.lastateparks.com/ on 2/14/03.
Louisiana State University Agricultural Center. Louisiana Agricultural Summary. 2002.http://www.agctr. lsu.edu/Communications/agsum/2002agsum.htm.
Louisiana State University Agricultural Center. Aquaculture Factsheet. February 2001.
Louisiana State University Agricultural Center. Projected Costs and Returns for Crawfish andCatfish Production in Louisiana, 2002. Boucher and Gillespie. January 2002.
Lovelace, John. The Chicot and Southeast Louisiana Aquifer Systems. Louisiana Water Summit.USGS, 2001. Obtained from http://www.agctr.lsu.edu/lawater/lovelace.asp on 5/21/03.

Appendix D
Lower Mississippi River Conservation Committee. The River Packet. Spring 2002; “PallidSturgeon: A Louisiana Living Fossil.” Louisiana Agricultural Experiment Station.
McVey, Marty, Phil Baumel, and BobWisner, “Brazilian Soybeans – Transportation Problems,”AgDM Newsletter, November 2000.
Martin, Elwood M. and Paul I. Padding. Preliminary Estimates of Waterfowl Harvest andHunter in the United States during the 2001 Hunting Season. U.S. Fish and WildlifeService. July 2002.
Memphis Light, Gas, and Water. Water Quality Report 2001. Obtained fromhttp://www.mlgw.com on 5/21/03.
Memphis Queen Line. Obtained from http://www.memphisqueen.com/fleet.php on 2/27/03.
Metropolitan Areas defined by Office of Management and Budget. 6/30/99. Obtained fromhttp://www.census.gov/population/estimates/metro-city/99mfips.txt on 2/3/03.
Mississippi Development Authority. 2002 Economic Impact Report for Tourism and Recreation.Division of Tourism Development. February 2003.
Mississippi Gaming Commission. Reports. Obtained from http://www.mgc.state.ms.us/ on2/26/03.
Mississippi River Parkway Commission. The Great River Road. Obtained fromhttp://www.mississippiriverinfo.com on 2/25/03.
Mississippi Department of Wildlife, Fisheries and Parks. Mississippi Statewide ComprehensiveOutdoor Recreation Plan (SCORP). 1995.
Missouri Soybean Farmer . Various articles. March 2001. Obtained from http://www.mosoy.orgon 3/6/03.
Narog, Brenda Jo. “Difficult Issues for Aquaculturists in the U.S. and Around the World.”Acquaculture Magazine. May/June 2002.
National Biological Service. Our Living Resources: A Report to the Nation on the Distribution,Abundance, and Health of U.S. Plants, Animals, and Ecosystems. 1995.
National Marine Fisheries Service, Fisheries of the United States 2000, 2001.
National Marine Fisheries Service, No Time to Lose: The Future of Louisiana, 1997,http://www.crcl.org/no_time_to_lose.pdf.
National Oceanic and Atmospheric Administration (NOAA), Gulf of Mexico Ecosystems andHypoxia Assessment, http://www.cop.noaa.gov/Fact_Sheets/NGOMEX.html
NOAA, Appendix 4, http://spo.nwr.noaa.gov/app4.pdf

Appendix D
National Park Service. National Register Information System data. Obtained fromhttp://www.nr.nps.gov on 1/31/03.
National Park Service. Draft Heritage Study and Environmental Assessment – Lower MississippiDelta Region. No date.
Natural Resources Conservation Service (NRCS). 2001 Wildlife Habitat Incentives Program,Mississippi Summary. December 2001.
North American Electric Reliability Council (NERC). Description of the Southeastern ElectricReliability Council. Obtained from http://www.nerc.com/regional/serc.html on 1/28/03.
North American Wetlands Conservation Council. North American Wetlands Conservation ActProgress Report 2000-2001. January 2002.
North Carolina State University. “Restoration of Wetlands Under the Wetlands ReserveProgram.” Woodland Owner Note No. 24. February, 1994. Obtained fromhttp://www.ces.ncsu.edu;
NRCS Fact Sheet. Farm Bill 2002: Wetland Reserve Program. May 2002.
NRG Energy, Inc. Obtained from http://www.nrgenergy.com/ on 2/5/03.
Office of Management and Budget. Standard Industrial Classification Manual. Executive Officeof the President. 1987.
Port of Greater Baton Rouge. Overview and Facilities. Obtained from www.portgbr.com on6/12/2003.
Port of New Orleans. Port Facts, 11/14/2001. Obtained from http://www.portno.com on6/12/2003.
Port of South Louisiana. Facts, 2002 Tonnage Statistics, and On the River March 2003.Obtained from http://www.portsl.com on 6/13/2003.
RAMSAR Convention on Wetlands, A Directory of Wetlands of International Importance,August 2003. Obtained from http://www.wetlands.org/RDB/Directory.html on1/14/2004.
Reed, Don. “Hunting Lease Enterprises and Louisiana Landowners.” Louisiana Agriculture.45(2). Spring 2002.
Robinson, Michael. Mobilizing the Waterways: The Mississippi River Navigation System.“Builders and Fighters: U.S. Army Engineers in World War II.” U.S. Army Corps ofEngineers, December 1992.
Sewage and Water Board of New Orleans. Quality Water 2001: A Report on the State of TapWater in New Orleans. Obtained from http://www.swbnola.org on 5/21/03.

Appendix D
Super Gator Tours. Obtained from http://www.pnx.com/gator/gatrFAQ.htm on 6/10/03.
Tennessee Department of Environment and Conservation. Tennessee Statewide ComprehensiveOutdoor Recreation Plan(SCORP). 1999.
Tennessee Department of Tourist Development. 2002-2003 Marketing Plan. Obtained fromhttp://www.state.tn.us/tourdev/ on 3/25/03.
U.S. Army Corps of Engineers. Obtained from http://www.mvn.usace. army.mil/pao/oldriver/hydroelectric.htm on 2/2/03.
U.S. Army Corps of Engineers. Inland River Navigation. Navigation Information Center.Obtained from www.iwr.usace.army.mil/navdata/nav-prim.htm on 6/12/03.
U.S. Army Corps of Engineers. Mississippi River Mainline Levees Enlargement and SeepageControl. 1998.
U.S. Army Corps of Engineers. U.S. Port Ranking by Cargo Volume 2001. Navigation DataCenter. Obtained from http://www.iwr.usace.army.mil/ndc/wcsc on 6/11/03.
U.S. Army Corps of Engineers, Waterborne Commerce of the United States, Calendar Year2001, Waterborne Commerce Statistics Center, 2003.
U.S. Bureau of Census. County Business Patterns. 2000.
U.S. Department of Agriculture, National Agricultural Statistics Service. 1997 AgriculturalCensus. Obtained from http://www.nass.usda.gov/census/ on 2/2003.
U.S. Department of Commerce. U.S. Industry and Trade Outlook 2000.
U.S. Department of Energy, Energy Information Administration. Obtained fromhttp://www.eia.doe.gov/cneaf/nuclear/page/at_a_glance/reactors/grand_gulf.html on1/31/03.
U.S. Department of Energy, Energy Information Administration. Petroleum Supply Annual2001, Table 14, and Natural Gas Monthly, Table 7, November 2002.
U.S. Department of Energy, Energy Information Administration. State Coal Profile: Louisiana.Obtained from http://www.eia.doe.gov/cneaf/coal/st_coal_pdf/0576o.pdf on 1/28/03.
U.S. Department of Energy, Energy Information Administration. Supplement Tables to theAnnual Energy Outlook 2003. Table 60. Electric Power Projections for EMM Region.Obtained from http://www.eia.doe.gov/oiaf/aeo/supplement/sup_elec.pdf on 2/2/03.
U.S. Department of Energy, Energy Information Administration. Supplement Tables to theAnnual Energy Outlook 2003. Table 90. Obtained from http://www.eia.doe.gov/oiaf/aeo/supplement/ pdf/supplement_tables(2003).pdf on 2/13/03.

Appendix D
U.S. Department of Energy. Biopower. Obtained from http://www.eren.doe.gov/biopower/basics/ba_efb.htm on 1/28/03.
U.S. Environmental Protection Agency. E-Grids Database. 2000 preliminary data.
U.S. Environmental Protection Agency. Profile of the Non-Fuel, Non-Metal Mining Industry.EPA Office of Compliance Sector Notebook Project. September 1995.
U.S. Fish & Wildlife Service, Press Release, January 24, 1996,http://southeast.fws.gov/news/1996/lowmiss.html
U.S. Forest Service. 1995 Timber Products Output data.
U.S. Geological Survey. The Mineral Industry of [Louisiana, Mississippi, Arkansas, Tennessee,Kentucky, Missouri, Illinois]. Obtained from http://minerals.er.usgs.gov/minerals/ on01/03.
U.S. Geological Survey. National Water Summary on Wetland Resources. 1996.
U.S. Geological Survey. Status and Trends of the Nation’s Biological Resources. Vol. 1, 1998.
U.S. Geological Survey. Water Use in the United States. 1995.
U.S. National Park Service. Arkansas Post, Delta Queen, Fort Pillow, Jaketown Site,Montgomery (I.T.) House, Vieux Carre Historic District, National Historic LandmarkProgram Database. 2003.
U.S. National Park Service. Mississippi River Corridor Study, Volume 2 Inventory of Resourcesand Significance. Mississippi River Corridor Study Commission. 1996.
Value Line report on the Soft Drink Industry. January 7, 2003.
Virta, Robert L. Clay and Shale. U.S. Geological Survey. 2001 Minerals Yearbook.
Wainger, Lisa A and Dennis M. King. The Benefits and Costs of Reforesting EconomicallyMarginal Cropland in the Mississippi Delta. Delta Land Trust. 2000.http://www.deltalandtrust.org/King_Report_Cover_Page.pdf
Walsh, R.G., et al. “Estimating the Public Benefits of Protecting Forest Quality.” Journal ofEnvironmental Management. Volume 30, 1990. pp. 175-189
Wear, David N. and John G. Greis. The Southern Forest Resource Assessment: SummaryReport. U.S. Forest Service. 2002.
Wells, Ken. The American Waterway Operators. September 24, 2003.
Zepp, Laura and Leonard Shabman. Land Clearing in the Arkansas-Louisiana-Mississippi Delta.Delta Land Trust. 2000. http://www.deltalandtrust.org/Land_Clearing%20_Report%20_Version%20_1.0.pdf

APPENDIX E:
DRAFT REPORTCIRCULATION LIST

Appendix E
U. S. Army Corps of EngineersMississippi Valley DivisionP. O. Box 80Vicksburg, MS 39181-0080
U. S. Army Corps of EngineersMemphis District167 N. Mid-America MallMemphis, TN 38103-1894
U. S. Army Corps of EngineersVicksburg District4155 Clay StreetVicksburg, MS 39183-3435
U. S. Army Corps of EngineersNew Orleans DistrictP. O. Box 60267New Orleans, LA 70160-0267
U. S. Army Corps of EngineersSt. Louis District1222 Spruce StreetSt. Louis, MO 63103-2833Alan Dooley, Chief
Delta WildlifeP. O. Box 276Stoneville, MS 38776
The Delta Regional Authority236 Sharkey Ave., Suite 400Clarksdale, MS 38614
Audubon SocietyMississippi State OfficeMadge Lindsey285 Plains Road
Holly Springs, MS 38635
Louisiana Mid-ContinentOil and Gas Association801 North Blvd.Baton Rouge, LA 70802
National Marine Fisheries Service (NMFS)Southeast Regional Office (SERO)9721 Executive Center Drive NorthSt. Petersburg, FL 33702
US EPA, Region 61445 Ross AvenueSuite 1200
Dallas, TX 75202
US EPA, Region 4Sam Nunn Atlanta Federal Center61 Forsyth Street, SW
Atlanta, GA 30303
US EPA, Region 7 Office External Programs 901 N. 5th Street Kansas City, KS 66101
USDA Natural Res. Conservation Service3737 Government StreetAlexandria, LA 71303
USDA Natural Res. Conservation Service100 W. Capitol St., Suite 1321 Fed. Bldg.Jackson, MS 39269
USDA Natural Res. Conservation Service675 U. S. Courthouse801 BroadwayNashville, TN 37203
USDA Natural Res. Conservation ServiceRoom 3416, Federal Bldg700 West Capitol Ave.
Little Rock, AR 72201-3225
The Nature Conservancy642 West Main StreetLexington, KY 40508
The Nature ConservancyMississippi Chapter Office6400 Lakeover Road, Ste. CJackson, MS 39213
The Nature ConservancyP. O. Box 4125Baton Rouge, LA 70821
The Nature ConservancyArkansas Field Office601 North University Ave
Little Rock, AR 72205
The Nature ConservancyTennessee Chapter Headquarters2021 21 st Ave., South, Ste. C-400Nashville, TN 37212
The Nature ConservancyMissouri Chapter Office2800 S. Brentwood Blvd.
St. Louis, MO 63144

Appendix E
Dr. Charles WagonerAsst. Professor – EconomicsP. O. Box 3334, DSUCleveland, MS 38733
Mike StatenAnderson – Tully CompanyP. O. Box 761Lake Village, AR 71653
USDA Forest ServiceSouthern Research StationP. O. Box 2680Asheville, NC 28802
USDA Forest Service20380 HWY 61
Rolling Fork, MS 39159
National Forests in Mississippi100 W. Capital StreetSte. 1141Jackson, MS 39269
Travel Industry Association of America1100 New York Avenue, NW, Ste. 450
Washington, DC 20005-3934
Arkansas Department of Parks and TourismOne Capitol MallLittle Rock, AR 72201
Kentucky Department of Travel500 Mero St. #2200
Frankfurt, KY 40601
Mississippi Dept. of Economic andCommunity DevelopmentDivision of Tourism DevelopmentP. O. Box 849Jackson, MS 39205
Missouri Division of TourismP. O. Box 1055
Jefferson City, MO 65102
Tennessee Department of TourismDevelopmentRachel Jackson State Office Building320 Sixth Ave., 5th FloorNashville, TN 37243
Louisiana Dept. of Culture, Recreation andTourismP. O. Box 94291Baton Rouge, LA 70804-929
Delta CouncilP. O. Box 257Stoneville, MS 38776-0257
U. S. Fish and Wildlife Southeast Region1875 Century BoulevardAtlanta, GA 30345
MG Don T. RileyPresident – Mississippi River CommissionP. O. Box 80Vicksburg, MS 39181-0080
James L. Cummins, Jr.Mississippi Fish and Wildlife FoundationP. O. Box 10Stoneville, MS 38776
Dr. E. Jane LuzarDept. Agricultural Econ. & Agribusiness101 Agricultural Administration BuildingLouisiana State UniversityBaton Rouge, LA 70803-5604
Dr. Rex CarffeyDept. Agricultural Econ. & Agribusiness101 Agricultural Administration BuildingLouisiana State UniversityBaton Rouge, LA 70803-5604
Ducks Unlimited1 Waterfowl WayMemphis, TN 38120
Jennifer FrazierMidwest Project ManagerAmerican Land ConservancyRoute 1, PO Box 600CMarble Hill, MO 63764
Dr. Robert GramlingUniversity of LouisianaPO Box 20198Lafayette, LA 7050
Ann T. CurryState of MississippiMississippi Development AuthorityPO Box 849,Jackson, MS 39205

Appendix E
Regional Director U.S. Geological Survey Eastern Regional Office 1700 Leetown Road Kearneysville, WV 25430
Rayford E. Wilbanks Chief, Economic Analysis Division U.S. Army Corps of Engineers PO Box 80 Vicksburg, MS 39181
Center Director U.S. Geological Survey National Wetlands Research Center 700 Cajundome Boulevard Lafayette, Louisiana 70505
Gary M. Hanson, Director Red River Watershed Institute Louisiana State University One University Place Shreveport, LA 71115-2399
Regional Director Central Regional Office U.S. Geological Survey Denver Federal Center PO Box 25046 Denver, CO 80225-0046
Joseph J. Charbonneau, Chief Division of Economics U. S. Fish & Wildlife Service 4401 N. Fairfax Drive, Rm 226 Arlington, VA 22203
Regional Executive - Biology U.S. Geological Survey 373 McReynolds Hall Columbia, MO 65211
Larry Mallard Refuge Manager, White River NWR U.S. Fish and Wildlife Service 321 W. 7th, PO Box 308 DeWitt, AR 72042-0308
Mississippi River Basin Alliance 708 North First St. #238 Minneapolis, MS 55401
Wildon J. FontenotWater Resource SpecialistU.S. Department of Agriculture646 Cajundome BoulevardLaFayette, LA 70506
Dr. Bob Awh, EmeritusCollege of Business & IndustryPO Box 5288Mississippi State, MS 39762
G. Edward Dickey, PH.DDawson & Associates1225 I Street NW, Suite 500Washington, D.C. 20005
Chris WarshawIndustrial Economics, Inc2067 Massachusetts AveCambridge, MA 02140
Dr. Shirley LaskaVice Chancellor of ResearchUniversity of New Orleans2000 Lakeside DriveNew Orleans, LA 70148
Dr. Carrol Engle, ProfessorUniversity of ArkansasDepartment of Aquaculture & Fisheries1200 University DrivePine Bluff, AR 71611
Field SupervisorUSFWS Arkansas Field Office1500 Museum Rd., Suite 105Conway, Arkansas 72032
Field SupervisorUSFWS Louisiana Field Office646 Cajundome Blvd. - Suite 400Lafayette, LA 70506
Paul HansenThe Izaak Walton League707 Conservation LaneGaithersburg, Maryland 20878
Field SupervisorUSFWS Mississippi Field Office6578 Dogwood View ParkwayJackson, MS 39213

Appendix E
Bob PerciasepeNational Audubon Society1150 Connecticut Ave.Washington, DC 20036
Ken WellsAmerican Waterways Operators2020 North Causeway Boulevard, Suite AMandeville, LA 70471
Sam AngelEpstein GinP. O. Box 748Lake Village, AR 71653
John ThreadgillMemphis Chamber of CommerceP. O. Box 224Memphis, TN 38101
Clifford SmithT. Baker Smith & Sons, Inc.P. O. Box 2266Houma, LA 70361
Hank ToddMississippi River Parkway CommissionP. O. Box 59159Minneapolis, MN 55459-8257
R. D. JamesRiley Cotton Company810 Maple StreetNew Madrid, MO 63869
George GrugettLower MS Valley Flood Control Association1196 Poplar View Lane South, Suite 3Collierville, TN 38017
Tom CharlierCommercial Appeal495 Union AvenueMemphis, TN 38103
Henry GrahamLouisiana Chemical AssociationOne American Place, Suite 2040Baton Rouge, LA 70825
Kim McGuire – ReporterArkansas Democrat Gazette121 East CapitolLittle Rock, AR 72203
Doug DaigleMississippi River Basin Alliance400 Magazine Street, #499New Orleans, LA 70130
Don McCroryDirector , Memphis and Shelby County PortCommission1115 Riverside BoulevardMemphis, TN 38106-2504
Dave ConradNational Wildlife Federation1400 Sixteenth Street, NWWashington, DC 20036
T. Logan RussellRussell Outdoors IncP. O. Box 2052Jackson, MS 39130-2052
Allen HanceNortheast Midwest Institute218 D Street, S.E.Washington, D.C. 20003
Cynthia SarthouGulf Restoration Network CampaignP. O. Box 2245New Orleans, LA 70176
Jennifer S. DerbyUS EPA Region 4 - Water Management DivisionAtlanta Federal Center61 Forsyth StreetAtlanta, GA 30303
W. Scott GainDistrict ChiefU.S. Geological Survey640 Grassmere Park Drive, Suite 100Nashville, TN 37211
Barbara KeelerCoastal & Wetlands Planning CoordinatorEPA Region 61445 Ross Ave., Suite 1200Dallas, TX 75202-2733
Mark A. AyersDistrict ChiefU.S. Geological Survey9818 Bluegrass ParkwayLouisville, KY 40299

Appendix E
Larry Shepard U S EPA Region 7 (WWPD/GPCB) 901 North 5th Street Kansas City, KS 66101
Ray Bryant AgriCenter International 777 Walnut Grove Rd, Box27 Memphis, TN 38120
Gaye S. Farris Chief, Technology and Informatics U.S. Geological Survey National Wetlands Research Center 700 Cajundome Blvd. Lafayette, LA 70506
Randy Hanchey Assistant Secretary Louisiana Dept. Natural Resc. P O Box 44487 Baton Rouge, LA 70804
Michael l. Plunkett District Chief U.S. Geological Survey 308 South Airport Ro. Petal, MS 39208-6649
Mark Davis Coalition to Restore Coastal Louisiana 200 Lafayette St. Suite 500 Baton Rouge, LA 70801
Charles R. Demas District Chief U.S. Geological Survey 3535 S. Sherwood Forest Blvd, Suite 120 Baton Rouge, LA 70816
Len Bahr Office of Governor State of Louisiana P O Box 90804 Baton Rouge, LA 70804
John E. Terry JR District Chief U.S. Geological Survey 401 Hardin Rd. Little Rock, AR 72211
Clarice D. SundeenProject Development Branch167 N. Main, Room B202Memphis, TN 38103-1894
Dr. Rollin SparroweWildlife Management Institute1001 14th Street, NW, Suite 725Washington, DC 20036
Rebecca WodderAmerican River1025 Vermont Avenue, NW, Suite 720Washington, DC 20005
Michael E. SliferDistrict Chief1400 Independence Rd., Mail stop 200Rolla, MO 65401
Mike ArmstrongArkansas Game and Fish Commission2 Natural Resources DriveLittle Rock, AR 72205
Phil BassChief - Office of Pollution ControlMiss. Department of Environmental QualityPost Office Box 10385Jackson, MS 39289-0385
Gary ChristoffPolicy CoordinatorMO Department of ConservationPost Office Box 180Jefferson City, MO 65102-0180
Edwin CrowellAssistant Director – FisheriesKentucky Dept. of Fish and Wildlife Resources1 Game Farm RoadFrankfort, KY 40601
Paul DavisDirector - Division of Water Pollution ControlTN Department of Environment & Conservation6th Floor, L & C Annex401 Church St.Nashville, TN 37243-1534
Bennie Fontenot, Jr.Administrator - Inland Fisheries DivisionLA Department of Wildlife & FisheriesPost Office Box 98000, 2000 Quail DriveBaton Rouge, LA 70898-9000

Appendix E
Ron GaravelliDirector of FisheriesMS Department of Wildlife, Fisheries & Parks1505 Eastover DriveJackson, MS 39211-6322
Dugan Sabins,Program Manager - Planning and AssessmentSectionLA Department of Environmental QualityPost Office Box 82178Baton Rouge, LA 70884-2178
Robert Todd,Fishery BiologistTN Wildlife Resources AgencyPost Office Box 40747Nashville, TN 37204
Michael Wells,Dep. Division Director & Chief of Water ResourcesMissouri Department of Natural ResourcesGeological Survey and Resource Assessment Div.P. O. Box 176Jefferson City, Missouri 65102-0176
Jim Wise, Ecologist - Water DivisionAR Department of Environmental Quality8001 National Drive, Post Office Box 8913Little Rock, AR 72219-8913
Ted IllstonSenior Policy AdvisorThe Nature ConservancyInternational Headquarters4245 North Fairfax Drive, Suite 100Arlington, VA 22203-1606
Randy RichardsonDeputy DirectorInternational Port of Memphis1115 Riverside BoulevardMemphis, TN 38106-2504
Jeffrey BargerAquatic Habitats SpecialistGulf States Natural Resource Center44 East Avenue, Suite 200Austin, TX 78701
Kathy KroneState GazetteThe Dyersburg NewsP.O. Box 808294 U.S. Highway 51 BypassDyersburg, TN 38024
William D. FranzRegional Team ManagerU.S. Environmental Protection Agency – T-17J77 West Jackson Blvd.Chicago, Illinois 60604-3590
Mr. Haynes DentExecutive DirectorDelta Regional Authority236 Sharkey Avenue, Suite 400Clarksdale, MS 38614
Lee MooreDirector of External AffairsThe Nature Conservancy601 North University AvenueLittle Rock, Arkansas 72205
Laura Rowland, P.E.U.S. Army Corps of Engineers167 North Main, Rm. B202Memphis, Tennessee 38103-1894
Scott FaberEnvironmental Defense1875 Connecticut Ave, NW Suite 600Washington, D.C. 20009
Wyly GilfoilPort DirectorLake Providence Port Commission409 Port RoadLake Providence, LA 71254
Dr. Edmund BucknerAssistant ProfessorUniversity of Arkansas at Pine BluffDepartment of Aquaculture & FisheriesMail Slot 49121200 University DrivePine Bluff, AR 71611
DirectorUpper Mississippi Science CenterU.S. Geological Survey2630 Fanta Reed RoadLa Crosse, WI 54602-0818

Appendix E
DirectorColumbia Environmental Research CenterU.S. Geological Survey4200 New Haven RoadColumbia, MO 65201
Bob WardEconomic Development CoordinatorVicksburg Main Street Program701 Clay StreetP.O. Box 150Vicksburg, MS 39181
Edwin J. RoemerProfessional ArcheologistU.S. Army Corps of Engineers167 N. Main StreetMemphis, TN 38103
Mr. William WadePresident, Energy and Water Economics810 Walker StreetColumbia, TN 38401
Dr. Hal Schramm, Jr.U. S. Geological SurveyMiss. Cooperative Fish and Wildlife Research UnitMail Stop 9691Mississippi State, MS 39762
Jeffery A. Ballweber, J.D.Associate Director for Government AffairsGeoResources InstituteBox 9652Mississippi State, MS 39762-9652

Appendix F
APPENDIX F:
COMBINED ECONOMIC ACTIVITYIN UPPER AND LOWER MISSISSIPPI
RIVER REGIONS

Appendix F
A previous study examined economic activity associated with the Upper MississippiRiver (see Economic Profile of the Upper Mississippi River Region, prepared by IndustrialEconomics, Incorporated for the U.S. Fish and Wildlife Service Division of Economics, 1999).The current study of the LMR examines similar economic sectors and uses analogous methods,allowing a rough comparison of the results from the two analyses.
As shown in Exhibit F-1, economic activity in the UMR is somewhat greater than that inthe LMR, primarily because of a larger manufacturing sector in the more industrialized north.Overall, however, the UMR and LMR show similar patterns with respect to the relativesignificance of economic sectors. In each, the manufacturing, tourism, agriculture, and energysectors account for a significant share of revenue and employment. The LMR region is dominantin several sectors, including navigation (where major Gulf ports support international trade),mineral resources (where the oil and gas industry plays a major role), and harvest of naturalresources (where forestry and Gulf commercial fisheries drive the total).
The total economic activity for the full Mississippi River corridor is about $284 billion,supporting roughly 1.6 million jobs.
Exhibit F-1
SUMMARY OF ECONOMIC SIGNIFICANCE OF UMR AND LMR SECTORSUpper Mississippi Lower Mississippi Full Mississippi
SectorRevenue(millions$2001)
Employment(number of
jobs)
Revenue(millions$2001)
Employment(number of
jobs)
Revenue(millions$2001)
Employment(number of
jobs)Harvest of NaturalResources
$7* 2,600* $436 6,500 $443 9,100
OutdoorRecreation
$215 3,000 $791 13,500* $1,006 16,500
Tourism $7,000 140,000 $13,500 183,000 $20,500 323,000
Water Supply $140 1,000 $51 470 $191 1,470
Agriculture $5,380 94,000 $6,800 103,000 $12,180 197,000
Mineral Resources $1,300 6,500 $9,000 41,000 $10,300 47,500Energy $5,000 13,000 $4,700 11,200 $9,700 24,200Navigation $1,127 6,300 $6,000 29,000 $7,127 35,300Manufacturing $136,000 601,000 $87,000 383,000 $223,000 984,000Natural ResourceServices
N/A N/A N/A N/A N/A N/A
TOTAL ~$156,000 ~870,000 ~$128,000 ~771,000 ~$284,000 ~1,640,000* Mid-point of estimated range.