Embed Size (px)
Citation preview

9/23/2016
1
©2016 First American Financial Corporation and/or its affiliates. All rights reserved. � NYSE: FAF©2015 First American Financial Corporation and/or its affiliates. All rights reserved. � NYSE: FAF
First American Financial Corporation makes no express or implied warranty respecting the information presented and assumes no responsibility for errors or
omissions. First American Financial Corporation is a parent holding company that does business through its operating subsidiaries. First American and the
eagle logo are registered trademarks or trademarks of First American Financial Corporation and/or its affiliates.
The following presentation is for informational purposes only and is not and may not be construed as legal advice. First American Financial Corporation is
not a law firm and does not offer legal services of any kind. No third party entity may rely upon anything contained herein when making legal and/or other
determinations regarding title practices. You should consult with an attorney prior to embarking upon any specific course of action.
Boom Boom Boom
What Drives Commercial Real Estate Today
September, 2016
#FirstAmEcon
@mflemingecon
©2016 First American Financial Corporation and/or its affiliates. All rights reserved. � NYSE: FAF
First American Economics
Economic Potential Drives
Commercial Real Estate

9/23/2016
2
©2016 First American Financial Corporation and/or its affiliates. All rights reserved. � NYSE: FAF
@mflemingecon #FirstAmEcon
95
96
97
98
99
100
1 2 3 4 5 6 7 8
Underperforming PotentialUnderperforming PotentialUnderperforming PotentialUnderperforming Potential---- GDP Depth and DurationGDP Depth and DurationGDP Depth and DurationGDP Depth and DurationReal Quarterly GDP (SA, %, Recession Peak = 100)
1953 1957 1973 1981 1990 2007
Source: BEA, FRED, Q3 2009
Year from Peak
©2016 First American Financial Corporation and/or its affiliates. All rights reserved. � NYSE: FAF
@mflemingecon #FirstAmEcon4
58
60
62
64
66
68
0
2
4
6
8
10
12
14
16
18
Source: BLS,CBO, FRED, Q2 2016
Underworked or Aging? Finding the New NormalUnderworked or Aging? Finding the New NormalUnderworked or Aging? Finding the New NormalUnderworked or Aging? Finding the New NormalUnemployment Rates and Labor Force Participation (%,SA)
Recessions Unemployed (LHS)

9/23/2016
3
©2016 First American Financial Corporation and/or its affiliates. All rights reserved. � NYSE: FAF
@mflemingecon #FirstAmEcon
80
100
120
140
160
180
Jan-79 Jan-82 Jan-85 Jan-88 Jan-91 Jan-94 Jan-97 Jan-00 Jan-03 Jan-06 Jan-09 Jan-12 Jan-15
Capital Versus LaborCapital Versus LaborCapital Versus LaborCapital Versus Labor---- Who Gains the Growth Benefits?Who Gains the Growth Benefits?Who Gains the Growth Benefits?Who Gains the Growth Benefits?Real GDP Per Capita and Full Time Employed Median Earnings (SA, Q1 1979 = 100)
Recessions Earnings Real GDP
Source: BLS, BEA, FRED, Q2 2016
©2016 First American Financial Corporation and/or its affiliates. All rights reserved. � NYSE: FAF
@mflemingecon #FirstAmEcon6
20
25
30
35
40
45
50
55
60
Jan-84 Jan-88 Jan-92 Jan-96 Jan-00 Jan-04 Jan-08 Jan-12
Source: BLS, Census, FRED, 2014
Household Income Stagnating for DecadesHousehold Income Stagnating for DecadesHousehold Income Stagnating for DecadesHousehold Income Stagnating for DecadesMedian Household Income ($ Thousands, Annual)
Recessions 2014 Current Dollars Nominal

9/23/2016
4
©2016 First American Financial Corporation and/or its affiliates. All rights reserved. � NYSE: FAF
@mflemingecon #FirstAmEcon
80
90
100
110
120
130
Jul-00 Jul-02 Jul-04 Jul-06 Jul-08 Jul-10 Jul-12 Jul-14
Job PolarizationJob PolarizationJob PolarizationJob Polarization---- Job Creation is Skill SkewedJob Creation is Skill SkewedJob Creation is Skill SkewedJob Creation is Skill SkewedEmployment Count of Full Time Workers (Q3 2000 = 100)
Recessions Total Low Earning Total High Earning
Source: BLS, Q2 2016
©2016 First American Financial Corporation and/or its affiliates. All rights reserved. � NYSE: FAF
@mflemingecon #FirstAmEcon
90
95
100
105
110
Jul-00 Jan-02 Jul-03 Jan-05 Jul-06 Jan-08 Jul-09 Jan-11 Jul-12 Jan-14 Jul-15
Robot Maker or Wage TakerRobot Maker or Wage TakerRobot Maker or Wage TakerRobot Maker or Wage TakerMedian Usual Weekly Earnings (Inflation Adjust Q1 2016, Q3 2000 = 100)
Recessions < $40k > $40k
Source: BLS, Q2 2016

9/23/2016
5
©2016 First American Financial Corporation and/or its affiliates. All rights reserved. � NYSE: FAF
@mflemingecon #FirstAmEcon
50
90
130
170
210
Mar-01 Sep-02 Mar-04 Sep-05 Mar-07 Sep-08 Mar-10 Sep-11 Mar-13 Sep-14 Mar-16
Recession US CPPI GDP
Source: Real Capital Analytics, Inc., FRED, 2016
EconomicEconomicEconomicEconomic Growth Drives Commercial Real EstateGrowth Drives Commercial Real EstateGrowth Drives Commercial Real EstateGrowth Drives Commercial Real EstateGDP And Commercial Property Price Index (CPPI trailing 12 months, Dec. 2000=100)
mf4mf9
©2016 First American Financial Corporation and/or its affiliates. All rights reserved. � NYSE: FAF
“It ain’t what you don’t know that gets you into trouble. It’s
what you know for sure that just ain’t so.”
- Mark Twain

Slide 9
mf4 remove decimal from y-axis labels, why does x-axis start with March-01 when indexed to 100 for Dec
2000. Why q4 2000 for the index start point? Can we us a quarter label. Center legend, Source date? mark fleming, 9/6/2016
mf9 or the first month in the quarter instead of last- see GDP charts.mark fleming, 9/6/2016
9/23/2016
6
©2016 First American Financial Corporation and/or its affiliates. All rights reserved. � NYSE: FAF
@mflemingecon #FirstAmEcon11
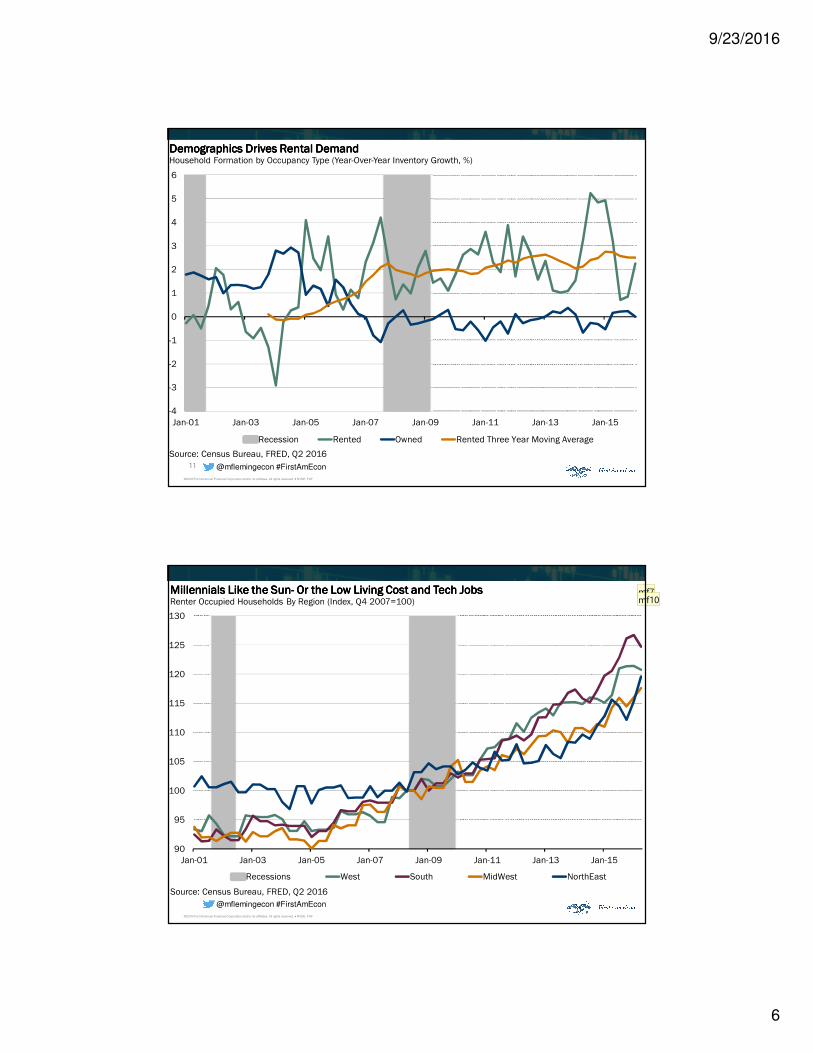
-4
-3
-2
-1
0
1
2
3
4
5
6
Jan-01 Jan-03 Jan-05 Jan-07 Jan-09 Jan-11 Jan-13 Jan-15
Source: Census Bureau, FRED, Q2 2016
Demographics Drives Rental DemandDemographics Drives Rental DemandDemographics Drives Rental DemandDemographics Drives Rental DemandHousehold Formation by Occupancy Type (Year-Over-Year Inventory Growth, %)
Recession Rented Owned Rented Three Year Moving Average
©2016 First American Financial Corporation and/or its affiliates. All rights reserved. � NYSE: FAF
@mflemingecon #FirstAmEcon
90
95
100
105
110
115
120
125
130
Jan-01 Jan-03 Jan-05 Jan-07 Jan-09 Jan-11 Jan-13 Jan-15
Source: Census Bureau, FRED, Q2 2016
Millennials Like the SunMillennials Like the SunMillennials Like the SunMillennials Like the Sun---- Or the Low Living Cost and Tech JobsOr the Low Living Cost and Tech JobsOr the Low Living Cost and Tech JobsOr the Low Living Cost and Tech JobsRenter Occupied Households By Region (Index, Q4 2007=100)
Recessions West South MidWest NorthEast
mf7mf10

Slide 12
mf7 quarterly date formattingmark fleming, 9/6/2016
mf10 most recent?mark fleming, 9/6/2016

9/23/2016
7
©2016 First American Financial Corporation and/or its affiliates. All rights reserved. � NYSE: FAF
@mflemingecon #FirstAmEcon
0.8
1
1.2
1.4
1.6
Homeownership
Income
Employment
Education
Children
Marriage
Baby Boomers
Generation X
Millennials
Over or Under Achieving GenYOver or Under Achieving GenYOver or Under Achieving GenYOver or Under Achieving GenY
Source: Census Bureau, 2013-2014
13
©2016 First American Financial Corporation and/or its affiliates. All rights reserved. � NYSE: FAF
@mflemingecon #FirstAmEcon
0
20
40
60
80
100
1992 1997 2002 2007 2012
Educational Attainment Sees Improvement NationallyEducational Attainment Sees Improvement NationallyEducational Attainment Sees Improvement NationallyEducational Attainment Sees Improvement NationallyEducational Attainment by Degree Type (% of Total)
No High School High School Degree Bachelor Degree MA or Higher
Source: IPUMS CPS, 2015

9/23/2016
8
©2016 First American Financial Corporation and/or its affiliates. All rights reserved. � NYSE: FAF
@mflemingecon #FirstAmEcon
0
5
10
15
20
25
30
35
40
45
20 25 30 35 40 45 50 55 60 65
With Age Comes WisdomWith Age Comes WisdomWith Age Comes WisdomWith Age Comes WisdomPercent Share of Population with Bachelors Degree or Higher by Age
Baby Boomers Gen X Millennials
Source: ACS IPUMS, 2015
©2016 First American Financial Corporation and/or its affiliates. All rights reserved. � NYSE: FAF
@mflemingecon #FirstAmEcon
0
10
20
30
40
50
60
70
80
90
100
25 35 45 55 65
With Age Comes With Age Comes With Age Comes With Age Comes A Different Tenure ChoiceA Different Tenure ChoiceA Different Tenure ChoiceA Different Tenure ChoicePercent of Renters
Asian Black Hispanic White
Source: IPUMS CPS, 2015

9/23/2016
9
©2016 First American Financial Corporation and/or its affiliates. All rights reserved. � NYSE: FAF
First American Economics
Seattle, Washington
©2016 First American Financial Corporation and/or its affiliates. All rights reserved. � NYSE: FAF
@mflemingecon #FirstAmEcon24
-4
-2
0
2
4
6
8
Jan-98 Jan-00 Jan-02 Jan-04 Jan-06 Jan-08 Jan-10 Jan-12 Jan-14
GDP Begins to Trail Upwards in WashingtonGDP Begins to Trail Upwards in WashingtonGDP Begins to Trail Upwards in WashingtonGDP Begins to Trail Upwards in WashingtonPercent Change (%) and Millions of Dollars ($), NSA
Washington GDP Growth US GDP GrowthSource: BEA, FRED, 2015

9/23/2016
10
©2016 First American Financial Corporation and/or its affiliates. All rights reserved. � NYSE: FAF
@mflemingecon #FirstAmEcon25
2
4
6
8
10
12
Jan-90 Jan-93 Jan-96 Jan-99 Jan-02 Jan-05 Jan-08 Jan-11 Jan-14
Unemployment Sees a Steady Drop Unemployment Sees a Steady Drop Unemployment Sees a Steady Drop Unemployment Sees a Steady Drop Unemployment Rates (SA, %)
Recession Seattle National
Source: BLS, FRED, Q2 2016
©2016 First American Financial Corporation and/or its affiliates. All rights reserved. � NYSE: FAF
@mflemingecon #FirstAmEcon
0
20
40
60
80
100
1992 1997 2002 2007 2012
Educational Attainment Sees Improvement in WashingtonEducational Attainment Sees Improvement in WashingtonEducational Attainment Sees Improvement in WashingtonEducational Attainment Sees Improvement in WashingtonEducational Attainment by Degree Type (% of Total)
No High School High School Degree Bachelor Degree MA or Higher
Source: IPUMS CPS, 2015
9/23/2016
11
©2016 First American Financial Corporation and/or its affiliates. All rights reserved. � NYSE: FAF
@mflemingecon #FirstAmEcon
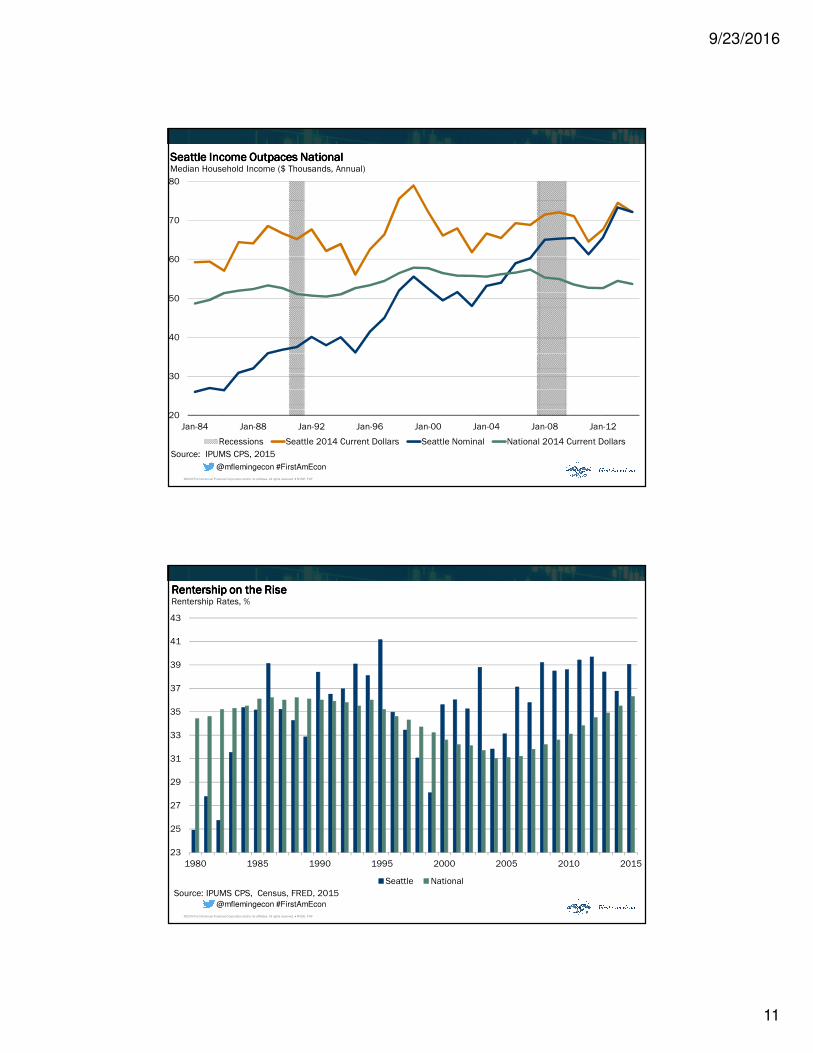
20
30
40
50
60
70
80
Jan-84 Jan-88 Jan-92 Jan-96 Jan-00 Jan-04 Jan-08 Jan-12
Source: IPUMS CPS, 2015
Seattle Income Outpaces NationalSeattle Income Outpaces NationalSeattle Income Outpaces NationalSeattle Income Outpaces NationalMedian Household Income ($ Thousands, Annual)
Recessions Seattle 2014 Current Dollars Seattle Nominal National 2014 Current Dollars
©2016 First American Financial Corporation and/or its affiliates. All rights reserved. � NYSE: FAF
@mflemingecon #FirstAmEcon
23
25
27
29
31
33
35
37
39
41
43
1980 1985 1990 1995 2000 2005 2010 2015
Rentership on the RiseRentership on the RiseRentership on the RiseRentership on the RiseRentership Rates, %
Seattle National
Source: IPUMS CPS, Census, FRED, 2015

9/23/2016
12
©2016 First American Financial Corporation and/or its affiliates. All rights reserved. � NYSE: FAF
First American’s
Office of Economic
Research
FirstAm.com/Economics
@mflemingecon
#FirstAmEcon