Embed Size (px)
Citation preview
1
ECONOMIC OUTLOOK REPORT XI
Prepared by the Economic Services Unit
Technology Transfer Division
July 2012
2
Table of Contents
1 EXECUTIVE SUMMARY 3
2 FOREWORD AND ACKNOWLEDGEMENTS 5
3 MACRO-ECONOMIC INDICATORS 6
Global macroeconomic status 6
South African macroeconomic status 6
Global Agricultural outlook 6
SA Agribusiness 7
SADC REGION 7
4 FIELD CROP PRODUCTS 8
Maize 8
Wheat 8
Sorghum 9
Barley 9
Cotton 10
Sunflower 10
Soya beans 11
Groundnuts 11
Dry beans 11
5 HORTICUTURAL OUTLOOK 12
South African canning industry 12
Bulida Apricots 12
Peaches 13
Bon Chretien Pear 13
Vegetables 13
6 ANIMAL PRODUCTION 15
Poultry 15
Beef 15
Pork 16
Dairy Products 16
Wool 17
Mohair 17
7 CONCLUSIONS 18
3
1 EXECUTIVE SUMMARY
Global macroeconomics
The global growth outlook remains weak with declining consumer confidence The Euro area remains at the
centre of the global financial crisis with potentially widely spread spill over effects through trade and
financial channels Although the outlook for growth in the US improved in the first quarter of 2012 activity
in China India and emerging Asia moderated alongside weaker growth prospects for the Euro area Sub-
Saharan Africa (SSA) sustained solid growth with relative insulation from financial spill overs from Europe
Global agricultural perspective
Current higher agriculture commodity prices are projected to last for some time Global wheat supplies for
201213 are lowered 70 million tons with beginning stocks lowered 15 million tons and world production
expected down 55 million tons reflecting reduced crop prospects in several exporting countries
South African macroeconomics
Real economic growth in the domestic economy decelerated to 27 in Q1 of 2012 GDP is predicted to
average 34 until 2016 while GDP per capita is expected to rise to $11 233 in 2016 from plusmn$8 088 in 2011
Unemployment rose from 25 in Q1 of 2011 to 252 in Q1 of 2012 It is predicted to fall to 201 by 2016
South African agricultural perspective
Agribusinesses kicked the first quarter of 2012 off on a positive note Due to the strong Rand and weak
demand in Europe exporters are also focussing on local markets which have a negative impact on growth
in volumes exported Fruit markets in the Far and Middle East are becoming very attractive and a significant
change in export focus could contribute to expanding export potential Private food consumption growth is
forecasted to grow at 33 in 2012 following a plusmn48 expansion in 2011 Agricultural exports are expected
to increase by almost 50 and imports by almost 47 in US dollar terms by 2016
Field crop outlook
Commercial maize production is projected to increase by 117 to 122 million tons at a yield of 410tha
whilst maize areas will remain unchanged at 2699 million ha New import duties and wheat varieties are
projected to benefit long term wheat production growth Sorghum production is also expected to increase
South Africarsquos dependence on expensive imported barley is expected to decrease due to a projected
recovery in local barley production A total cotton crop of 62 610 lint bales is expected The production
forecast for sunflower seed is at 527 110 tons The area estimate for soya beans is 472 000 ha with an
expected yield of 146tha The area estimate for groundnuts is 45 450 ha with an expected yield of 145
tha The production forecast for dry beans is 47 695 tons
Horticultural outlook
Export volumes of apples pears table grapes and stone fruits grew positively last year Both the area
planted to major deciduous fruits as well as rates of local consumption are declining About 90 of local
canned fruit is exported mainly to Europe but now also exploring Asian markets and fruit delivery for
processing increased by 4 in 201112 Quantities of vegetables sold remained relatively constant but local
market value increased significantly between 2006 and 2011
4
Livestock production
Falls in meat prices on a month on month basis have been noticed recently 18 in February 11 in
March 06 in April and 1 in May Poultry consumption is estimated to expand by 218 with strong
production growth of 214 envisaged up to 2016 A steady expansion in beef sector consumption is
expected due to strong demand and high tariffs on imports A 36 rise in beef consumption is expected in
2012 New forecasts see pork consumption growing by 52 in 2012 and by 293 in the five years to 2016
Total milk production during Q1 of 2012 was 31 higher than last year Total dairy exports exceeded
imports by 7 560 tons in May 2012 South African wool production in 2011-2012 was 28 000 tons a fall of
67 Mohair has been in good demand during the last 2-3 years boosted by high demand for natural fibres
and a lsquobulky hairy naturalrsquo look
SADC Food Security Outlook
Food security improvements are evident across most of the region enhanced in areas where crop
production benefited from favourable rainfall and minimal exposure to production shocks Staple food
prices are expected to continue to decline until the end of the harvest period (JulyAugust)
5
2 FOREWORD AND ACKNOWLEDGEMENTS
The Economic Services Unit presents this 11thEconomic Outlook to the ARC as a planning resource The
document analyses global and domestic trends in economic and agricultural markets and policy as well as
potential impacts on sector performance Apart from a macroeconomic perspective it deals with
agricultural production consumption and price trends A range of projections are provided based on
assumptions about a set of economic technological environmental political institutional and social
factors International and local publications form the basis of the Outlook Projections developed by the
OECD IMF Global Insight FAPRI and the World Agricultural Outlook are used whilst considerable local
input is obtained from BMI and BFAP Projections should be interpreted as possible scenarios The following
sources are acknowledged
Agricultural Business Chamber Media Release March 2012
Bureau for Food and Agricultural Policy (BFAP) 2011 Outlook
Business Monitor International Report Q3 2012
Business Report 28 June 2012
Cape Mohair Wool (CMW) Mohair amp Wool Market 30 November and 6 December Reports 2011
Cotton SA Cotton Market Report (9331) June 2012
Crop Estimates Committee May report 2012
Famine Early Warning Systems Network (FEWS-Net) May 2012
Fast Facts No62012 June 2012
FNB Agri-Weekly 12 June 2012
Food amp Agriculture Organization of the UN Food Outlook- Global market Analysis June 2011
GAIN Report 2011 USDA Foreign Agricultural Services SA Republic of canned Deciduous Fruit Annual
httpindexmundicomagriculture accessed on 28062012
httpwwwmpocozanews201225maypdf
httpwwwthebioenergysitecomarticles645oil-crops-outlook-may-2010
httpwwwmohaircozafilesnewsletterAngoraNewsMarch2012pdf
httpwwwwoolnewsnetnewsforecast-supply-and-demand-2012-13-and-beyond
httpwwwreuterscomarticle20120405us-food-fao-idUSBRE8331CU20120405
httpwwwfaoorgworldfoodsituationwfs-homecsdben
International Monetary Fund (IMF) World Economic outlook April 2012
NAMC -Food Price Monitor May 2012
NAMC ampDAFF -International Trade probe No 39 May 2012
OECD-FAO ndash Agricultural Outlook 2010-2019 and Economic Outlook May 2012
SA Economic Profile 2011 (httpwwwglobservercoensouth-africaeconomy)
SARB Quarterly Bulletin No 264 June 2012
wwwimforgexternalcountryzafindexhtm
6
3 MACRO-ECONOMIC INDICATORS
Global macroeconomic status
The Euro area remains at the centre of the current global financial crisis with potentially widely spread spill
over effects through trade and financial channels Weak recovery is anticipated in the major advanced
economies whilst activity will remain relatively solid in most emerging and developing economies There
are still daunting challenges including job creation and maintaining fiscal and financial stability Although
the outlook for growth in the US improved in the first quarter of 2012 activity in China India and emerging
Asia moderated alongside weaker growth prospects for the Euro area Sub-Saharan Africa (SSA) has thus far
sustained solid growth with relative insulation from financial spill overs emanating from the euro area
However high oil and food prices pose unprecedented inflationary pressures and these may exert
additional pressure on the regionrsquos external and fiscal balances
South African macroeconomic status
Real economic growth in the domestic economy decelerated to 27 in the first quarter of 2012 GDP is
predicted to average 34 over the five years to 2016 while GDP per capita is expected to rise to US$11 233
in 2016 from an estimated US$8 088 in 2011 Global consumer price inflation remained well contained in
early 2012 despite intensifying concerns regarding international oil prices resulting from geopolitical
tensions over the period The April 2012 Consumer Price Index (CPI) released by Statistics South Africa (Stats
SA) showed that food and non-alcoholic beverages inflation was 87 Headline CPI increased by 61
between April 2011 and April 2012 Food and non-alcoholic beverages inflation increased on a year-on-year
basis by 96 in February 2012 and 86 in March 2012 The lsquoFast Factsrsquo report from the South African
Institute for Race Relations (SAIRR) predicts a consumer price inflation of 62 in June 2012 up from an
average of 50 in 2011 According to Stats SA the unemployment rate rose from 25 in the first quarter of
2011 to 252 in the first quarter of 2012 The SAIRR predicts unemployment to fall to 201 by 2016
Combined with larger shortfall on services income and current transfer account with the rest of the world
the current-account deficit widened further to 49 of GDP in the first quarter of 2012
Global Agricultural outlook
The OECD-FAO Agricultural outlook forecasts higher agriculture commodity prices to last for some time A
good harvest in the coming months is expected to push commodity prices down from the extreme levels
seen earlier this year However over the coming decade real prices for cereals could average as much as
20 higher and those for meats as much as 30 higher compared to 2001-2010 Global wheat supplies for
201213 are expected to be 70 million tons lower with production expected down 55 million tons Higher
201112 global consumption fuelled by increased global trade and reflecting reduced crop prospects in
several exporting countries including Russia EU-27 Turkey and the United States Russian production is
expected 30 million tons lower due to a continuation of spring dryness in key winter wheat producing areas
and indications of crop development problems resulting from winter freeze damage EU-27 production is
also expected to be 10 million tons lower with reduced acreage in Germany Poland and Spain only partly
offset by higher expected yields in France and Bulgaria
7
SA Agribusiness
Agribusinesses kicked off Q1 of 2012 on a positive note The ABCIDC Agribusiness Confidence Index
increased to 64 index points in in Q1 of 2012 3 higher than in Q1 of 2011 25 higher than Q4 of 2011
Due to the strong Rand and weak Eurozone demand exporters are now focussing more on local markets
which has a negative impact on growth in volumes exported The fruit markets are seriously considering
markets in the Far and Middle East The significant change in export focus could contribute in expanding
export potential in future There is a relatively positive indication on private food consumption in South
Africa forecasting real growth of 33 in 2012 following an estimated 48 expansion in 2011 This is due
to a number of favourable factors including high nominal wage growth declining unemployment (although
slowly) and the low interest rate environment which should keep a lid on debt servicing costs BMI expects
South Africas food drink and tobacco trade surplus to increase slightly over the forecast period 2011-2016
Exports are expected to increase by plusmn 50 and imports by almost 47 in US dollar terms over this period
Figure 31 Trade Indicators - Historical Data amp Forecasts 2009-2016(BMI 2012)
A combination of weaker production and higher food prices is expected to contribute to reduced sugar
consumption in 2012 South African sugar consumption is predicted to grow by just 12 in 2012 and by just
over 141 in the five years to 2016 It is envisaged that over the long term macroeconomic fundamentals
together with the increasing use of sugar for biofuel will have a positive effect on sugar production levels
Figure32 Sugar production and consumption (BMI 2012)
SADC REGION
The regionrsquos food security outlook by FEWS NET (May 2012) shows a general improvement across most of
the region enhanced in areas where crop production benefited from favourable rainfall and where minimal
exposure to production shocks was experienced Increased on‐farm food availability has eased pressure on
local market supplies in turn easing the pressure on prices Staple food prices had stabilized and most
markets were adequately stocked with this seasonrsquos early harvests as well as last seasonrsquos stocks which
traders offloaded in preparation for this seasonrsquos crop Staple food prices are expected to decline until the
end of the harvest period (August) when prices should stabilize before rising as the lean season approaches
10002000300040005000600070008000
2009 2010 2011e 2012f 2013f 2014f 2015f 2016f
US$
mn
Exports Imports Balance
1600170018001900200021002200
2011 2012 2013f 2014f 2015f 2016f
00
0 t
on
ne
s
8
4 FIELD CROP PRODUCTS
Maize
Projected increases in the production of genetically modified (GM) maize together with the introduction of
new GM maize varieties in South African agriculture have improved estimates for the maize yield in 2012
The BMI projects that GM maize will account for 687 of total maize output in SA This will lead to a long-
term increase of 28 in maize production over the next 5 years Likewise first estimates of plantings and
yields look favourable BMI projects that the production of commercial maize will increase by 117 to 122
million tons with an expected yield of 410tha The CECrsquos revised area estimates that the area under maize
production will remain unchanged at 2699 million ha The total area for white maize production is 1636
million ha with 1063 million ha for yellow maize The yield for white maize dropped slightly to 389tha
against 392tha in the last forecast The yield for yellow maize is 442tha or 032tha higher than the
national maize yield average Maize demand for human consumption will continue to slow down given high
prices Demand for maize for animal feed purposes is expected to continue Total demand for maize will
increase by 29 in 2012 and is projected to increase by 152 over the next 5 years Greater consumer diet
diversification is expected to cause the demand for white maize to level off over the long term
Figure 41 South African maize production and consumption 2011 ndash 2016 (BMI 2012)
In the non-commercial sector the area for maize production is expected to decrease by 917 The CEC
predicts that the maize crop output will increase by 134 owing to higher maize yield in the Eastern Cape
which accounts for over 60 of total maize planted in the non-commercial sector The international price of
yellow maize (US No2 Yellow US Gulf) decreased by 848 between April 2011 and April 2012During the
same period the price of domestic yellow maize increased by 3117 The domestic price of yellow maize
traded on average at R 2 16467 per ton during April 2012 and above the export parity price of R 1 76216
The domestic white maize price increased by 4108 compared to April 2011
Wheat
The BMI estimates that the area for wheat plantings in 20122013 will decrease by 74 owing to increased
maize plantings Wheat production will continue to experience a production deficit A production deficit of
13million tons is forecasted against an estimated production output of 17 million tons The overall long-
9
term view for wheat is positive production will be moderate over the next 5 years New import duties and
wheat varieties are projected to benefit long term wheat production growth Supply side factors such as
increased maize production may stimulate farmers to allocate more land to wheat production In the five
years to 2016 BMI estimates that wheat production will grow by 347 to reach 20 million tons Weak
demand in 2012 is anticipated mainly driven by high wheat prices and local underproduction The
international price of wheat (US No2 Hard Red Winter ord Prot US Fob Gulf) decreased by 2042 and
the domestic price of wheat decreased by 1224 from April 2011 to April 2012
Figure 42 South African Wheat production and consumption 2011 ndash 2016 (BMI 2012)
Notwithstanding volatile wheat prices in April BMI predicts that wheat prices will average USc575bushel in
2012 and USc560bushel in 2013 Prices will be relatively stable owing to weak supply in North Africa
Sorghum
Sorghum production is expected to continue increasing The CEC predicts that sorghum output shall
increase by 450 tons to 141 050 tons in 2012 against 140 600 tons in the previous forecast The area
estimate for sorghum is 48 550 ha with an expected yield of 291 tha
Figure 43 SA Sorghum Summer crop estimate (CEC 2012)
Barley
South Africarsquos dependence on expensive imported barley is expected to decrease due to a projected recovery in barley production locally The BMI forecast for total barley output is 275 000 tons In the five years to 2016 barley production is projected to increase by 481 to reach 296 200 tons
10
Figure 44 SA Barley crop estimate 2011 ndash 2016 (BMI 2012)
Cotton
Sustained high levels of global cotton stocks will continue to affect cotton prices The Chinese are expected to decrease their cotton output by over 13 in 201213 The ICAC anticipates world cotton stocks to increase by 9 in 201213 to reach a record 145 million tons This is expected to represent 61 of global cotton use and the highest stock-to-use ratio in 14 years Global cotton consumption will drop by 6 against an 8 increase in production Combined forecasts by the ICAC and Cotton South Africa project a cotton surplus of 52 million tons despite an expected decline of 7 in global cotton production Whilst production is expected to decline to 251 million tons consumption will increase by 3 In the local outlook for cotton Cotton South Africarsquos 5th estimate for the 201112 production year predicts that a total crop of 66 610 lint bales will be produced of which 62 610 lint bales will be produced from SA grown seed cotton The shortfall of 4 000 lint bales will be covered with cotton produced in Swaziland Whereas lower cotton prices in 201112 will cause a decline of 26 in total cotton output compared to last season favourable prices for other competing summer crops will cause more farmers to move away from cotton production
Figure 45 RSA Cotton Lint Consumption (Cotton SA 2012)
Sunflower
Revised area estimates by the CEC for the 2012 summer crop is 453 350ha with an expected yield of
146tha The production forecast for sunflower seed is at 527 110 tons which is 12 105 tons more than the
previous forecast The sunflower seed price traded at R 4 83155 per ton in April 2012 On an annual basis
the price of sunflower seed increased by 2203 between April 2011 and April 2012
11
Figure 46 Sunflower area planted and 4th production forecast 2012 (CEC 2012)
Soya beans
The area estimate for soya beans is 472 000 ha with an expected yield of 146tha The anticipated output
for soya beans is 691 050 tons This will be 20 700 tons less than the previous forecastrsquos output
Figure 47 Soya beans area planted and 4th production forecast 2012 (CEC 2012)
Groundnuts
The CEC predicts that the expected groundnut crop is 65 690 tons This will be 150 tons more than the last forecast The area estimate is 45 450 ha with an expected yield of 145 tha
Figure 48 Groundnuts area planted and 4th production forecast (CEC 2012)
Dry beans
Dry beans production is predicted by the CEC to increase slightly The production forecast for dry beans is
47 695 tons which 380 tons more than the previous forecast The expected yield is 291 tha whilst the
area estimate is 39 750 ha
Figure 49 Dry beans area planted and 4th forecast for 2012 (CEC 2012)
12
5 HORTICUTURAL OUTLOOK
Export volumes of apples pears table grapes and stone fruits are expected to grow positively for the
20112012 production season This outlook presents information for different section of the horticulture
sector revolving around value-addition and agro-processing of these commodities
South African canning industry
About 90 of South African canned deciduous fruit is destined for export markets Despite Europe being the
leading market historically the South African canning industry has positioned itself to supply other major
markets in the East such as Japan This export orientation makes producers susceptible to foreign exchange
fluctuations While the industry struggles to remain price competitive the input cost of cans sugar and
electricity have increased significantly in recent years
Both the area planted to major deciduous fruits as well as the rate of consumption of commodities in local
markets have either remained flat (constant) or are declining due to the unexpected increase in the
establishment cost of orchards for these crops South African fruit deliveries for processing for the year
201112 is set to increase by nearly 4 overall as the crop recovers from previous seasons affected by the
bad weather conditions during the harvest period in December and January Apricot deliveries are forecast
at 26 000 million tons Clingstone peach raw fruit deliveries at 92 000 million tons and pear deliveries at
45 000 million tons
Figure 51 Fruit delivered for canning (Canning Fruit Producerrsquos Association in GAIN report 2011)
Apricots
The forecast for deliveries of Bulida apricots for canning increased by 4 to 26 000 million tons for 201112
as trees planted 2-3 years ago reach their bearing potential The area planted to Bulida apricots is expected
to remain flat for the year 201112 as rising production costs and weak demand for apricots for canning has
led to a decline in area planted for several years as illustrated in figure 52 below The cost of establishing an
apricot orchard has increased about 56 from 2008 and was R106 498 in 2010
0 20000 40000 60000 80000 100000
Jan-08
Jan-09
Jan-10
Jan-11
Million Tons
Bon Chretian pears
Clingstone peaches
Bulida apricot
13
Figure 51 Establishment costs of Bulida Apricot Orchard (Hortgro in GAIN report 2011)
Peaches
The area planted with Cling peaches is forecast at 6300 hectares a decline of 3 The area planted has been
declining since 2007 on escalating production costs The cost of establishing a peach orchard has increased
by 42 from 2008 and is currently R103 253ha Total deliveries of Cling peaches for canning are forecast at
92 000 million tons for 201112 a 4 increase driven by an increased number of trees at the prime of
production potential The main export markets are Russia Japan and Hong Kong
Pears
The area planted with canning pears is forecasted to remain stable at 11 400 hectares on demand for fresh
pears compared with canned pears Over the past three years the area planted has shifted towards pears
for the fresh market where producers enjoy stronger prices as opposed to canning The cost of establishing
one hectare of pears has risen 83 in the past three years driven by the cost of planting materials and the
cost of trellising Total deliveries of Bon Chretien pears are forecasted to remain flat at 42 000 million tons
for 201112 given the high number of aged trees
Figure 52 Export statistics for canned pears (GAIN report 2011)
Vegetables
Vegetable production in South Africa has experienced significant growth in the last eight years largely
driven by expanding domestic demand attributed to rising numbers of middle-class consumers Processing
and storage technology improvements are also stimulating vegetable production The bulk of vegetables
produced are sold domestically and only small amounts are exported annually Although the quantity of
vegetables sold on both the domestic and export market remained relatively constant the value of the
68301 91464
106498
0
50000
100000
150000
2008 2009 2010
Ran
ds
0
2000
4000
6000
8000
2008 2009 2010
Mill
ion
To
ns
UK Germany Japan Russia US
14
domestic market increased significantly between 2006 and 2011 Consumer preference for healthy products
also stimulated vegetables sales
Tomatoes Tomato prices lost momentum and softened due to weak uptake at most markets Weekly tomato prices
fell by 22 ww and 256 yy closing at R4 195 per ton Volumes traded fell by 63 ww but were 73
higher yy at 3 472 tons Prices will trend sideways in the short term with limited upside potential
Potatoes Potato prices decreased slightly due to limited market uptake Weekly prices fell by 44 ww and 156
yy to R2 384 per ton Volumes traded were pegged at 13 906 tons down 51 ww but still up 193 yy
Prices are expected to move sideways with some upside potential due to moderation in supplies
Onions Onion prices eased slightly lower as a result of weak uptake on markets Weekly onion prices closed at R3
114 per ton down 19 ww but still 189 higher yy Volumes traded came in at 4944 tons down 95
ww but 230 higher yy Prices are expected to trend sideways in the short term but with limited upside
potential
Carrots Carrot prices drifted lower despite reduced volumes due to softer demand Weekly carrot prices fell by 50
ww and 372 yy and closed at R2 168 per ton Volumes traded reached 1 525 tons down 1 ww but
487 higher yy It is however expected that prices will firm due to limited market supply
Cabbages Cabbage prices posted slight gains supported by improved demand across most markets Weekly cabbage
prices increased by 30 ww and 57 yy to close at R1 945 per ton Volumes traded were pegged at 1
314 tons up 08 ww 79 lower yy Prices are expected to improve somewhat in the short term
Table 51 Vegetable prices and volumes at major fresh produce markets (FNB Agri-weekly 15612)
Week ending
15 June 2012
Average
Price (Rt)
ww Yy Total
Volume (t)
ww Yy
Tomato 4195 -22 -256 3472 -63 73
Potato 2384 -44 -156 13906 -51 193
Onion 3114 -19 189 4944 -95 230
Carrot 2168 -50 -372 1525 -10 487
Cabbage 1945 30 57 1314 08 79
15
6 ANIMAL PRODUCTION
The forecast for consumption of meat and meat products remains vulnerable to any significant dip in
economic growth Recent sharp falls in prices have been recorded 18 in February 11 in March 06 in
April and 1 in May Although rising food prices especially in meat are expected to have a negative impact
on consumption in 2012 currently production is not expected to be adversely affected
Poultry
The poultry meat industry is the countryrsquos largest individual agricultural industry and contributes 17 to
agriculturersquos GDP Since 2000 broiler production has grown by an average of 4 pa The news in February
2012 that government planned to impose anti-dumping duties on imported Brazilian frozen whole birds and
boneless cuts saw JSE-listed poultry producers Country Bird Holdings Astral and Sovereign Foods gaining
market share However the poultry sector is projected to face challenges with elevated feed costs It is
estimated that in 2012 poultry consumption will increase by 29 to reach 17mn tons An extended
forecast envisages poultry consumption expanding by 218 in the five years to 2016 BMIrsquos extended
forecast for poultry production envisages strong growth of 214 in the five years to 201516 driven by
strong GDP per capita growth and a steady fall in unemployment
Figure 61 SA Poultry Utilization (httpindexmundicomagriculture)
Beef
The rising price of beef in 2012 is expected to have an impact on consumption levels A steady expansion is
expected to continue fuelled by consumption demand and high tariffs on beef imports from outside the
SADC A 36 rise in beef consumption is expected in 2012 In the next the five years to 2016 BMI forecast a
252 increase in beef and veal consumption This will be influenced by population growth rising GDP per
capita and the decision by more consumers to integrate red meat into their diets
250
500
750
1000
1250
1500
1750
2005 2006 2007 2008 2009 2010 2011 2012
00
0 t
on
s
Broiler meat production Total supply Broiler meat consumption
16
Figure 62 South Africa Beef amp Veal utilisation (httpindexmundicomagriculture)
Pork
Although only 3 of local pork production is exported any additional pork meat on the domestic market
helps to drive down prices Local producers compete with imports from Canada and Germany BMIrsquos new
forecast sees pork consumption growing by 52 in 2012 and by 293 in the five years to 2016 On the
domestic market prices continued to decline as a result of weak demand Weekly baconer prices traded at
R1697kg down 14 ww but still 75 higher yy Porkers prices fell by the same margin and traded at
R1803kg still 114 higher yy
Figure 63 Pork production amp consumption (BMI 2012)
Dairy Products
Total milk production during Q1 of 2012 was 31 more than last year mainly due to adverse production
conditions in 2011 and more favourable climatic conditions early this year The increase in milk production
as production shifts to more specialised dairy farmers also contributed to higher production According to
MPO economist Dr Koos Coetzee the higher production will enable processors to source the bulk of their
requirements from local producers Total dairy exports exceeded imports by 7 560 tons in May 2012 During
the first five months of the year 22 810 tons were imported while 44 185 tons were exported Although
higher imports are possible during the winter the significant increase in exports will probably result in a net
export situation for the year resulting in a favourable supplydemand situation
100
200
300
400
500
600
700
800
2005 2006 2007 2008 2009 2010 2011 2012Car
cass
we
igh
t e
qu
ival
en
ce
Beef amp Veal Production Beef amp Veal Consumption Total supply
0
100
200
300
2011 2012 2013 2014 2015 2016
00
0t
on
s
Pork production Pork consumption
17
Figure 64 SA Dairy Market Trends (BMI 2012)
Wool
SA produces 48 million kilograms of pa 90 of which is exported at a value of plusmnR $2 billion Weaker
consumer demand from the EU is causing concern for the global wool industry The lack of orders from
Europe has resulted in reduced production in China with both wool top and yarn manufacturers unable to
sell to their traditional markets in Europe and the US at past levels South African wool production in 2011-
2012 was 28 000 tons a fall of 67 due to an outbreak of Rift Valley Fever foot-and-mouth disease and
notably predators that are killing stock Most of the disease issues have been alleviated and it is expected
that South Africa will reach 30000 tonnes by 2013-2014 The demand from China the largest consumer is
expected to remain weak until Europe sorts out its economic woes and consumers feel more confident
Figure 6 5 Price Movement for good quality wool per micron (CMW 2012)
Mohair
South Africa currently produces approximately 50 of global production Mohair has been in high demand
during the last 2-3 years boosted by demand for natural fibres and a lsquobulky hairy naturalrsquo look As a result
demand for hand-knitting yarns and fancy yarns has been robust allowing adult prices to be maintained
Figure 66 Cape Mohair market indicator movement for different age group categories (CWM 2012)
10000350006000085000
110000135000160000185000210000
2009 2010 2011 2012 2013 2014 2015 2016
Ton
s
Yoghurt production Yoghurt sales Butter production Butter sales Cheese production Cheese sales
0
20000
07
-M
ar
14
-M
ar
28
-M
ar
04
-A
pr
18
-A
pr
25
-A
pr
09
-M
ay
23
-M
ay 06
-Ju
n
19 MICRON 21 MICRON ZAR Price
0
50
100
150
200
14-Feb 06-Mar 27-Mar 24-Apr 15-May 29-May 12-Jun
Kid Indicator Young Indicator Adult Indicator Average Price
18
7 CONCLUSIONS
Whilst the global outlook is characterised by heightened uncertainty weak growth and declining consumer
confidence the regional sub-Saharan economy is projected to grow at 5 in 2012 benefiting from
production boosts in a number of countries By 2050 the world population will reach 9 billion with demand
for food including meat products to increase by at least 70 Food security remains a challenge More
research development and technology transfer is needed to improve the profitability of resource poor
farmers to participate in well-defined commercial markets The ARC has a role in defining and conducting
research that address the challenges of farmers on the continent research that impact on job creation and
rural development
The prospects for agribusiness are improving globally and locally An increasing role for biofuels is projected
in the long-term which together with food security issues will make agricultural RampD a priority The ARC
should play a key role in enhancing productivity growth and competitiveness across a spectrum of value
chains
Import volumes continue to raise alongside declining export volumes Recession in Europe and economic
slowdown in Asia could worsen the situation as demand from these regions would decrease South Africa
will be affected as these regions are major export markets South Africa has the largest and most efficient
agricultural sector in Sub-Saharan Africa and there are expectation that the country will have to lead food
security and productivity initiatives The Agricultural Research Council with its extensive RampD know-how has
a role to play in development on the continent
In terms of grain production the biofuel industry will in all likelihood grow significantly in the coming years
increasing the importance of maize beyond human consumption and already extensive expected growth in
feed requirements The role of the ARC in maize production RampD will therefore in all likelihood increase In
wheat production the ARC will also have to play an increasingly important role as demand for wheat
products increases New import duties and wheat varieties are already projected to benefit long term wheat
production growth The ARC also has a key role in addressing South Africarsquos dependence on expensive
imported barley Oilseed crops such as soya beans groundnut and dry beans production are all predicted to
play an increasingly important role in food and feed production in South Africa and the ARC has extensive
RampD capacity that can be brought to bear on this issue
19
In the vegetable and fruit sector there are extensive business prospects as more middle class consumers
turn to healthy diets that include vegetables and fruit creating high demand also for processed products
There are significant opportunities for the ARC to invest in research in post-harvest and agro-processing as
well as in value-chain and business logistics Fruit and vegetable production efficiency can be improved
dramatically through relevant agro-processing and value-addition research A comprehensive study done
by the Bureau for Food and Agricultural Policy at UP for the Presidency indicated that the horticultural
sector has the highest most labour intensive growth potential
Despite a constant increase in South African meat production quantities produced are still below demand
and particularly beef pork and poultry are imported indicating significant local growth potential With
nearly 80 of South Africarsquos agricultural land almost solely suitable for extensive livestock production and
significant untapped communal reserves there is extensive scope for improved meat production A
particularly undeveloped focus area is the 86 of smallholder farmers that have cattle The ARC should
expand its RampD focus on these farmers to produce quality livestock with better feed efficiency and growth
to would address poverty rural development and food security South Africa is also a net importer of pork
and significant opportunities for new prospective producers to enter this market exist The ARC could play a
leading role in capacitating new producers
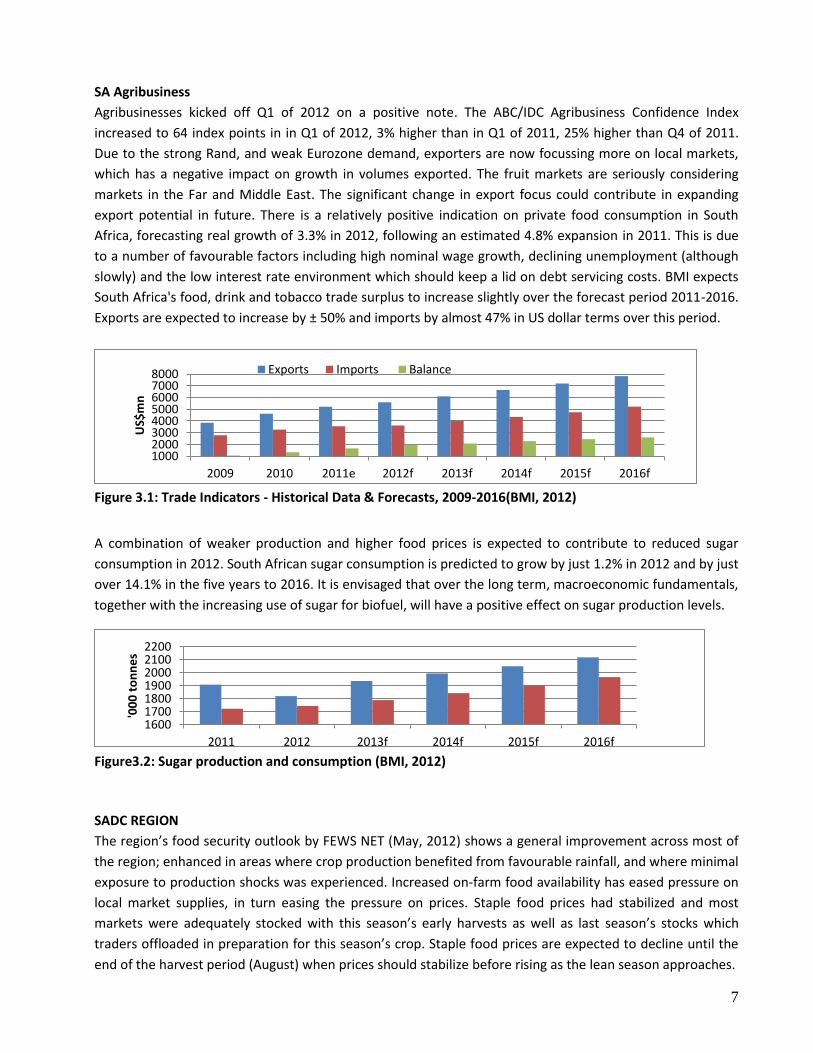

14
domestic market increased significantly between 2006 and 2011 Consumer preference for healthy products
also stimulated vegetables sales
Tomatoes Tomato prices lost momentum and softened due to weak uptake at most markets Weekly tomato prices
fell by 22 ww and 256 yy closing at R4 195 per ton Volumes traded fell by 63 ww but were 73
higher yy at 3 472 tons Prices will trend sideways in the short term with limited upside potential
Potatoes Potato prices decreased slightly due to limited market uptake Weekly prices fell by 44 ww and 156
yy to R2 384 per ton Volumes traded were pegged at 13 906 tons down 51 ww but still up 193 yy
Prices are expected to move sideways with some upside potential due to moderation in supplies
Onions Onion prices eased slightly lower as a result of weak uptake on markets Weekly onion prices closed at R3
114 per ton down 19 ww but still 189 higher yy Volumes traded came in at 4944 tons down 95
ww but 230 higher yy Prices are expected to trend sideways in the short term but with limited upside
potential
Carrots Carrot prices drifted lower despite reduced volumes due to softer demand Weekly carrot prices fell by 50
ww and 372 yy and closed at R2 168 per ton Volumes traded reached 1 525 tons down 1 ww but
487 higher yy It is however expected that prices will firm due to limited market supply
Cabbages Cabbage prices posted slight gains supported by improved demand across most markets Weekly cabbage
prices increased by 30 ww and 57 yy to close at R1 945 per ton Volumes traded were pegged at 1
314 tons up 08 ww 79 lower yy Prices are expected to improve somewhat in the short term
Table 51 Vegetable prices and volumes at major fresh produce markets (FNB Agri-weekly 15612)
Week ending
15 June 2012
Average
Price (Rt)
ww Yy Total
Volume (t)
ww Yy
Tomato 4195 -22 -256 3472 -63 73
Potato 2384 -44 -156 13906 -51 193
Onion 3114 -19 189 4944 -95 230
Carrot 2168 -50 -372 1525 -10 487
Cabbage 1945 30 57 1314 08 79
15
6 ANIMAL PRODUCTION
The forecast for consumption of meat and meat products remains vulnerable to any significant dip in
economic growth Recent sharp falls in prices have been recorded 18 in February 11 in March 06 in
April and 1 in May Although rising food prices especially in meat are expected to have a negative impact
on consumption in 2012 currently production is not expected to be adversely affected
Poultry
The poultry meat industry is the countryrsquos largest individual agricultural industry and contributes 17 to
agriculturersquos GDP Since 2000 broiler production has grown by an average of 4 pa The news in February
2012 that government planned to impose anti-dumping duties on imported Brazilian frozen whole birds and
boneless cuts saw JSE-listed poultry producers Country Bird Holdings Astral and Sovereign Foods gaining
market share However the poultry sector is projected to face challenges with elevated feed costs It is
estimated that in 2012 poultry consumption will increase by 29 to reach 17mn tons An extended
forecast envisages poultry consumption expanding by 218 in the five years to 2016 BMIrsquos extended
forecast for poultry production envisages strong growth of 214 in the five years to 201516 driven by
strong GDP per capita growth and a steady fall in unemployment
Figure 61 SA Poultry Utilization (httpindexmundicomagriculture)
Beef
The rising price of beef in 2012 is expected to have an impact on consumption levels A steady expansion is
expected to continue fuelled by consumption demand and high tariffs on beef imports from outside the
SADC A 36 rise in beef consumption is expected in 2012 In the next the five years to 2016 BMI forecast a
252 increase in beef and veal consumption This will be influenced by population growth rising GDP per
capita and the decision by more consumers to integrate red meat into their diets
250
500
750
1000
1250
1500
1750
2005 2006 2007 2008 2009 2010 2011 2012
00
0 t
on
s
Broiler meat production Total supply Broiler meat consumption
16
Figure 62 South Africa Beef amp Veal utilisation (httpindexmundicomagriculture)
Pork
Although only 3 of local pork production is exported any additional pork meat on the domestic market
helps to drive down prices Local producers compete with imports from Canada and Germany BMIrsquos new
forecast sees pork consumption growing by 52 in 2012 and by 293 in the five years to 2016 On the
domestic market prices continued to decline as a result of weak demand Weekly baconer prices traded at
R1697kg down 14 ww but still 75 higher yy Porkers prices fell by the same margin and traded at
R1803kg still 114 higher yy
Figure 63 Pork production amp consumption (BMI 2012)
Dairy Products
Total milk production during Q1 of 2012 was 31 more than last year mainly due to adverse production
conditions in 2011 and more favourable climatic conditions early this year The increase in milk production
as production shifts to more specialised dairy farmers also contributed to higher production According to
MPO economist Dr Koos Coetzee the higher production will enable processors to source the bulk of their
requirements from local producers Total dairy exports exceeded imports by 7 560 tons in May 2012 During
the first five months of the year 22 810 tons were imported while 44 185 tons were exported Although
higher imports are possible during the winter the significant increase in exports will probably result in a net
export situation for the year resulting in a favourable supplydemand situation
100
200
300
400
500
600
700
800
2005 2006 2007 2008 2009 2010 2011 2012Car
cass
we
igh
t e
qu
ival
en
ce
Beef amp Veal Production Beef amp Veal Consumption Total supply
0
100
200
300
2011 2012 2013 2014 2015 2016
00
0t
on
s
Pork production Pork consumption
17
Figure 64 SA Dairy Market Trends (BMI 2012)
Wool
SA produces 48 million kilograms of pa 90 of which is exported at a value of plusmnR $2 billion Weaker
consumer demand from the EU is causing concern for the global wool industry The lack of orders from
Europe has resulted in reduced production in China with both wool top and yarn manufacturers unable to
sell to their traditional markets in Europe and the US at past levels South African wool production in 2011-
2012 was 28 000 tons a fall of 67 due to an outbreak of Rift Valley Fever foot-and-mouth disease and
notably predators that are killing stock Most of the disease issues have been alleviated and it is expected
that South Africa will reach 30000 tonnes by 2013-2014 The demand from China the largest consumer is
expected to remain weak until Europe sorts out its economic woes and consumers feel more confident
Figure 6 5 Price Movement for good quality wool per micron (CMW 2012)
Mohair
South Africa currently produces approximately 50 of global production Mohair has been in high demand
during the last 2-3 years boosted by demand for natural fibres and a lsquobulky hairy naturalrsquo look As a result
demand for hand-knitting yarns and fancy yarns has been robust allowing adult prices to be maintained
Figure 66 Cape Mohair market indicator movement for different age group categories (CWM 2012)
10000350006000085000
110000135000160000185000210000
2009 2010 2011 2012 2013 2014 2015 2016
Ton
s
Yoghurt production Yoghurt sales Butter production Butter sales Cheese production Cheese sales
0
20000
07
-M
ar
14
-M
ar
28
-M
ar
04
-A
pr
18
-A
pr
25
-A
pr
09
-M
ay
23
-M
ay 06
-Ju
n
19 MICRON 21 MICRON ZAR Price
0
50
100
150
200
14-Feb 06-Mar 27-Mar 24-Apr 15-May 29-May 12-Jun
Kid Indicator Young Indicator Adult Indicator Average Price
18
7 CONCLUSIONS
Whilst the global outlook is characterised by heightened uncertainty weak growth and declining consumer
confidence the regional sub-Saharan economy is projected to grow at 5 in 2012 benefiting from
production boosts in a number of countries By 2050 the world population will reach 9 billion with demand
for food including meat products to increase by at least 70 Food security remains a challenge More
research development and technology transfer is needed to improve the profitability of resource poor
farmers to participate in well-defined commercial markets The ARC has a role in defining and conducting
research that address the challenges of farmers on the continent research that impact on job creation and
rural development
The prospects for agribusiness are improving globally and locally An increasing role for biofuels is projected
in the long-term which together with food security issues will make agricultural RampD a priority The ARC
should play a key role in enhancing productivity growth and competitiveness across a spectrum of value
chains
Import volumes continue to raise alongside declining export volumes Recession in Europe and economic
slowdown in Asia could worsen the situation as demand from these regions would decrease South Africa
will be affected as these regions are major export markets South Africa has the largest and most efficient
agricultural sector in Sub-Saharan Africa and there are expectation that the country will have to lead food
security and productivity initiatives The Agricultural Research Council with its extensive RampD know-how has
a role to play in development on the continent
In terms of grain production the biofuel industry will in all likelihood grow significantly in the coming years
increasing the importance of maize beyond human consumption and already extensive expected growth in
feed requirements The role of the ARC in maize production RampD will therefore in all likelihood increase In
wheat production the ARC will also have to play an increasingly important role as demand for wheat
products increases New import duties and wheat varieties are already projected to benefit long term wheat
production growth The ARC also has a key role in addressing South Africarsquos dependence on expensive
imported barley Oilseed crops such as soya beans groundnut and dry beans production are all predicted to
play an increasingly important role in food and feed production in South Africa and the ARC has extensive
RampD capacity that can be brought to bear on this issue
19
In the vegetable and fruit sector there are extensive business prospects as more middle class consumers
turn to healthy diets that include vegetables and fruit creating high demand also for processed products
There are significant opportunities for the ARC to invest in research in post-harvest and agro-processing as
well as in value-chain and business logistics Fruit and vegetable production efficiency can be improved
dramatically through relevant agro-processing and value-addition research A comprehensive study done
by the Bureau for Food and Agricultural Policy at UP for the Presidency indicated that the horticultural
sector has the highest most labour intensive growth potential
Despite a constant increase in South African meat production quantities produced are still below demand
and particularly beef pork and poultry are imported indicating significant local growth potential With
nearly 80 of South Africarsquos agricultural land almost solely suitable for extensive livestock production and
significant untapped communal reserves there is extensive scope for improved meat production A
particularly undeveloped focus area is the 86 of smallholder farmers that have cattle The ARC should
expand its RampD focus on these farmers to produce quality livestock with better feed efficiency and growth
to would address poverty rural development and food security South Africa is also a net importer of pork
and significant opportunities for new prospective producers to enter this market exist The ARC could play a
leading role in capacitating new producers