Embed Size (px)
Citation preview

8/3/2019 Economic Note1
http://slidepdf.com/reader/full/economic-note1 1/39
Karan Rulezzz
1 Karan Shah Copyrights©
Economic Notes
Scarcity .......................................................................................................................................... 4
Opportunity Cost ........................................................................................................................... 4
Types of Economies ........................................................................................................................... 5
Market Economies ......................................................................................................................... 5
Command Economy ....................................................................................................................... 6
Mixed Economy ............................................................................................................................. 7
Money ............................................................................................................................................... 7
Functions ....................................................................................................................................... 7
Key Concepts ..................................................................................................................................... 7
Demand ............................................................................................................................................. 8
Price Elasticity of Demand .............................................................................................................. 8
Cross Elasticity of Demand ............................................................................................................. 8
Income Elasticity of Demand .......................................................................................................... 8
Supply ............................................................................................................................................... 8
Price Elasticity of Supply ................................................................................................................ 8
Prices as rationing mechanism ........................................................................................................... 8
Consumer Surplus .............................................................................................................................. 9
Key Concepts ................................................................................................................................... 12
Market failure.................................................................................................................................. 13
Government Intervention ................................................................................................................ 13
Correcting Market Failure ................................................................................................................ 14
Cost Benefit Analysis CBA ................................................................................................................ 16
Key Concepts ................................................................................................................................... 16
Intro ................................................................................................................................................ 17
Assumptions for both theories......................................................................................................... 18
Absolute Advantage......................................................................................................................... 18
Example 1................................................................................................................................ 18
Example 2................................................................................................................................ 18
Comparative Advantage .................................................................................................................. 19
Assumptions for comparative advantage ......................................................................................... 19
Protectionism .................................................................................................................................. 19
8/3/2019 Economic Note1
http://slidepdf.com/reader/full/economic-note1 2/39
Karan Rulezzz
2 Karan Shah Copyrights©
Types of Protectionism .. .............................................................................................................. 19
Arguments for Protectionism ....................................................................................................... 20
Economic Integration ....................................................................................................................... 20
Free trade Area ............................................................................................................................ 20
Customs Union ............................................................................................................................ 20
Economic Union ........................................................................................................................... 20
Trade Creation ................................................................................................................................. 20
Occurrence of Trade Creation ...................................................................................................... 20
Downside of Trade Creation......................................................................................................... 21
Trade Diversion ............................................................................................................................ 21
Occurrence of Trade Diversion ..................................................................................................... 21
Downside of Trade Diversion ....................................................................................................... 21
Examples of Trade Creation and Diversion ....................................................................................... 22
Terms of Trade ................................................................................................................................ 24
Balance of Payments ....................................................................................................................... 24
Key Concepts ................................................................................................................................... 25
Inflation ........................................................................................................................................... 27
Causes of Inflation ....................................................................................................................... 27
Consequences of Inflation ............................................................................................................ 27
Anticipated and Unanticipated Inflation ....................................................................................... 28
Key Concepts ............................................................................................................................... 29
Balance of Payments Problem ......................................................................................................... 30
Equilibrium and Disequilibrium .................................................................................................... 30
Causes of BOP Disequilibrium ...................................................................................................... 30
Consequences Of Disequilibrium .................................................................................................. 32
Exchange Rates ................................................................................................................................ 32
Nominal Exchange Rate ............................................................................................................... 32
Real Exchange Rate ...................................................................................................................... 32
Purchasing Power Parity .............................................................................................................. 32
Trade Weighted Exchange Rate.................................................................................................... 32
Determination of Exchange Rates ................................................................................................ 32
Floating Exchange Rate Systems ............................................................................................... 32
Fixed Exchange Rate Systems ................................................................................................... 33
Managed Exchange Rate Systems ............................................................................................ 33

8/3/2019 Economic Note1
http://slidepdf.com/reader/full/economic-note1 3/39
Karan Rulezzz
3 Karan Shah Copyrights©
J- curve effect .............................................................................................................................. 33
Marshall Lerner Condition............................................................................................................ 34
Key Concepts ............................................................................................................................... 34
Example of nominal fiscal drag ..................................................................................................... 35
Unemployment................................................................................................................................ 36
Labour Force ................................................................................................................................ 36
Labour Productivity:..................................................................................................................... 37
Unemployment ............................................................................................................................ 37
General Level Of Prices; Inflation ................................................................................................. 38
Expenditure Switching Policies ..................................................................................................... 39
Expenditure Dampening Policies .................................................................................................. 39

8/3/2019 Economic Note1
http://slidepdf.com/reader/full/economic-note1 4/39
Karan Rulezzz
4 Karan Shah Copyrights©
Economic Problem
Scarcity
y Unlimited Wants
y Limited Resources
y Alternative Use
Thus decision has to be made of what should be produced, how should be produced and for
whom should it be produced.
Opportunity Cost
y Due to scarcity choice has to be made and when a choice is made some goods are foregone
for the other, the next best alternative forgone is the opportunity cost.
y This can be represented on a diagram of production possibility curve
y In considerations we take the curve as first one, as in examples of comparative advantage
however the production possibility curve can never be linear.
y It will always be as shown in the second diagram, a curve like shape
y This is because all resources that are removed from A cannot be used to produce B, for
example workers in a diamond factory cannot be removed and utilised with same
productivity and skill in cheese factory, there would be the extra costs of retraining.
y Machines required to make diamonds also cannot be replaced by machines of cheese
y Therefore there is never 100% efficiency in transfer of resources from 2 goods thus curvecannot be linear
y This extent is also known as the mobility of the factors of production, the more immobile the
less the efficiency in the transfer of resources
y Example at beginning the more able resources for B good or less able for A good is
transferred so opp cost is low, however nearing the end the more able resource for A are
transferred to B thus opp cost is high

8/3/2019 Economic Note1
http://slidepdf.com/reader/full/economic-note1 5/39
Karan Rulezzz
5 Karan Shah Copyrights©
y Shifts in production possibility growth outwards means economic growth and inwards mean
recession
y Partial outwards shifts in PPC means that the efficiency in producing that good has increased
and the opportunity cost has decreased however it still means there is some economic
growth in the economy
y The curve is bowed outwards due to diminishing returns and increasing opportunity costs
Types of Economies
Market Economies
y It is decided by firms , consumers and individuals on what should be produced and for whom
should it be produced
y Freedom Of Choice
y Minimal Govt intervention
y Self Interest
y Private Property
y Price mechanism(rationing) Adam Smith
Theory of invisible hand
...every individual necessarily labours to render the annual revenue of the society as great as he can.
He generally, indeed, neither intends to promote the public interest, nor knows how much he is
promoting it. By preferring the support of domestic to that of foreign industry, he intends only his
own security; and by directing that industry in such a manner as its produce may be of the greatest
value, he intends only his own gain, and he is in this, as in many other cases, led by an invisible
hand to promote an end which was no part of his intention. Nor is it always the worse for the society
that it was no part of it. By pursuing his own interest he frequently promotes that of the society more
effectually than when he really intends to promote it. I have never known much good done by thosewho affected to trade for the public good.
Nowadays, something much more general is meant by the expression "invisible hand". An invisible
hand process is one in which the outcome to be explained is produced in a decentralised way, with
no explicit agreements between the acting agents. The second essential component is that the
process is not intentional. The agents' aims are neither coordinated nor identical with the actual
outcome, which is a by-product of those aims. The process should work even without the agents
having any knowledge of it. This is why the process is called invisible.

8/3/2019 Economic Note1
http://slidepdf.com/reader/full/economic-note1 6/39
Karan Rulezzz
6 Karan Shah Copyrights©
The system in which the invisible hand is most often assumed to work is the free market. Adam
Smith assumed that consumers choose for the lowest price, and that entrepreneurs choose for the
highest rate of profit. He asserted that by thus making their excess or insufficient demand known
through market prices, consumers "directed" entrepreneurs' investment money to the most
profitable industry. Remember that this is the industry producing the goods most highly valued by
consumers, so in general economic well-being is increased.
One extremely positive aspect of a market-based economy is that it forces people to think about
what other people want. Smith saw this as a large part of what was good about the invisible hand
mechanism. He identified two ways to obtain the help and co-operation of other people, upon which
we all depend constantly. The first way is to appeal to the benevolence and goodwill of others. To do
this a person must often act in a servile and fawning way, which Smith found repulsive, and he
claimed it generally meets with very limited success. The second way is to appeal instead to other
people's self-interest. In one of his most famous quotes:
Man has almost constant occasion for the help of his brethren, and it is in vain for him to expect it
from their benevolence only. He will be more likely to prevail if he can interest their self-love in his
favour, and show them that it is for their own advantage to do for him what he requires of them.
Whoever offers to another a bargain of any kind, proposes to do this. Give me what I want, and youshall have this which you want, is the meaning of every such offer; and it is the manner that we
obtain from one another the far greater part of those good offices which we stand in need of. It is not
from the benevolence of the butcher, the brewer, or the baker that we expect our dinner, but from
their regard to their own interest. We address ourselves, not to their humanity but to their self-love.
For Smith, to propose an exchange is to attempt to show another that what you can do, or what you
have, can be of use to the other. When you carry out the exchange, it means the other person
recognises that what you can do or that what you have is of value. This is why so much of a person's
self-esteem is bound up in their job - a well-paid job is supposed to be a sign that others value your
contribution and finds it worth exchanging their own resources for.
y Market Failure
y Inequality of Income, rich will get richer
y Instability
y Dominant Firms
y Welfare, those who are fortunate will only get the provision
Command Economy
y Government take responsibility for
o Allocation of resources
o Determination of production targets for all sectors of the economy
o Distribution of income and determination of wages
o Ownership of most productive resources and povertyo Planning long term growth of the economy
y Problems
o Allocative inefficiency
o High Costs
o Tends to act like jail effect
o Firms not as successful as profit motive is not target so individual would not be
spirited to work as hard

8/3/2019 Economic Note1
http://slidepdf.com/reader/full/economic-note1 7/39
Karan Rulezzz
7 Karan Shah Copyrights©
Mixed Economy
Tends to combine the advantages of both the economies and remove the disadvantages.
Money
Functions
1. Medium of Exchange - products for money , vice versa
2. Unit of Account(measure of value)- Agree, Decide on what items are relatively worth
3. Store of Value money can be saved
4. Standard for deferred payments allows people to borrow and lend
Key Concepts
Specialisation: concentrating on the production of a certain commodity that gives greatest producer
efficiency
Division of Labour: form of individual specialisation where labour is divided to carry out single task
in whole process in aim of greater producer efficiency.
Ceterus Peribus: other things being equal
Positive Statements: they are statistical data that represent data
Normative Statements: statements that make value judgements
Capital: Money put into business is capital
Fixed Capital: It is a physical capital (fixed asset) that is not used up in the production of a product
and is contrasted with circulating capital such as raw materials, operating expenses and the like.
Fixed capital is that portion of the total capital that is invested in fixed assets (such as land, buildings,
vehicles and equipment) that stay in the business almost permanently.
Fixed Capital Formation: It basically refers to the net additions to the (physical) fixed capital stock in
an accounting period, or, to the value of the amount of increase of the fixed capital stock.
Working Capital: A measure of both a company's efficiency and its short-term financial health. The
working capital ratio is calculated as:

8/3/2019 Economic Note1
http://slidepdf.com/reader/full/economic-note1 8/39
Karan Rulezzz
8 Karan Shah Copyrights©
Price System
Demand
Market Demand, Aggregate Demand is attained by aggregating individual demand curveshorizontally.
Def inition: quantities of a product that purchasers are willing and able to buy at various prices per
period of time, other things remaining the same
Shif ts occur due to change in other factors like taste, fashion, income, hire purchase facilities,
complementary and substitute goods
Movement along the curve occur due to change in price
Price Elasticity of Demand
% change in qty demanded /% change in price = price elasticity of demand
Cross Elasticity of Demand
% change in qty demanded of A /% change in price of B = cross elasticity of demand
Income Elasticity of Demand
%change in qty demanded/% change in income= income elasticity of demand
When price Elasticity of demand is unitary then the total revenue will always be constant.
When above one it is more elastic
Below 1 less elastic
Supply
Def inition: the quantities of a product that suppliers are willing and able to sell at various prices per
period of time, other things remaining the same
Market Supply or Aggregate Supply is attained by individually adding the supply curves horizontally
Shif ts occur due to change in factors like technological progress, costs of factors of production, taxes
and subsidies and size and nature of industry
Price Elasticity of Supply
% change in qty supplied/ % change in price= price elasticity of supply
Prices as rationing mechanism
See above Adam smith example. Where price can ration resources in a market

8/3/2019 Economic Note1
http://slidepdf.com/reader/full/economic-note1 9/39
Karan Rulezzz
9 Karan Shah Copyrights©
Consumer Surplus
Consumer surplus is a measure of the welf are that people gain from the consumption of goods and
services, or a measure of the benefits they derive from the exchange of goods.
Consumer surplus is the difference between the total amount that consumers are willing and able
to pay for a good or service (indicated by the demand curve) and the total amount that they actually
do pay (i.e. the market price for the product). The level of consumer surplus is shown by the areaunder the demand curve and above the ruling market price as illustrated in the diagram below:
Consumer surplus and price elasticity of demand
When the demand for a good or service is perfectly elastic, consumer surplus is zero because the
price that people pay matches precisely the price they are willing to pay. This is most likely to
happen in highly competitive markets where each individual firm is assumed to be a price taker in
their chosen market and must sell as much as it can at the ruling market price.
In contrast, when demand is perfectly inelastic, consumer surplus is infinite. Demand is totally
invariant to a price change. Whatever the price, the quantity demanded remains the same. Are there
any examples of products that have such a low price elasticity of demand?
The majority of demand curves are downward sloping. When demand is inelastic, there is a greater
potential consumer surplus because there are some buyers willing to pay a high price to continue
consuming the product. This is shown in the diagram below:

8/3/2019 Economic Note1
http://slidepdf.com/reader/full/economic-note1 10/39
Karan Rulezzz
10 Karan Shah Copyrights©
Changes in demand and consumer surplus
When there is a shift in the demand curve leading to a change in the equilibrium market price and
quantity, then the level of consumer surplus will alter. This is shown in the diagrams above. In the
left hand diagram, following an increase in demand from D1 to D2, the equilibrium market price

8/3/2019 Economic Note1
http://slidepdf.com/reader/full/economic-note1 11/39
Karan Rulezzz
11 Karan Shah Copyrights©
rises to from P1 to P2 and the quantity traded expands. There is a higher level of consumer surplus
because more is being bought at a higher price than before.
In the diagram on the right we see the effects of a cost reducing innovation which causes an
outward shift of market supply, a lower price and an increase in the quantity traded in the market.
As a result, there is an increase in consumer welfare shown by a rise in consumer surplus.
Consumer surplus can be used frequently when analysing the impact of government intervention inany market for example the effects of indirect taxation on cigarettes consumers or the introducing
of road pricing schemes such as the London congestion charge.
Applications of consumer surplus
Paying for the right to drive into the centre of London
In July 2005, the congestion charge was raised to £8 per day. How has the London congestion charge
affected the consumer surplus of drivers?
Transport for London has details on the impact of the congestion charge
Consider the entry of Internet retailers such as Last Minute and Amazon into the markets for travel
and books respectively. What impact has their entry into the market had on consumer surplus? Have
you benefited from you perceive to be lower prices and better deals as a result of using e-commerce
sites offering large discounts compared to high street retailers?
Price discrimination and consumer surplus
Producers often take advantage of consumer surplus when setting prices. If a business can identify
groups of consumers within their market who are willing and able to pay different prices for the
same products, then sellers may engage in price discrimination the aim of which is to extract from
the purchaser, the price they are willing to pay, thereby turning consumer surplus into extrarevenue.
Airlines are expert at practising this form of yield management, extracting from consumers the price
they are willing and able to pay for flying to different destinations are various times of the day, and
exploiting variations in elasticity of demand for different types of passenger service. You will always
get a better deal / price with airlines such as Easy Jet and Ryan Air if you are prepared to book weeks
or months in advance. The airlines are prepared to sell tickets more cheaply then because they get
the benefit of cash-flow together with the guarantee of a seat being filled. The nearer the time to

8/3/2019 Economic Note1
http://slidepdf.com/reader/full/economic-note1 12/39
Karan Rulezzz
12 Karan Shah Copyrights©
take-off, the higher the price. If a businessman is desperate to fly from Newcastle to Paris in 24
hours time, his or her demand is said to be price inelastic and the corresponding price for the ticket
will be much higher.
One of the main arguments against firms with monopoly power is that they exploit their monopoly
position by raising prices in markets where demand is inelastic, extracting consumer surplus from
buyers and increasing profit margins at the same time. We shall consider the issue of monopoly inmore detail when we come on to our study of markets and industries.
Key Concepts
Ad valorem Tax: a tax that percentage of the price
Composite Demand: demand for something that has more than one use, eg mobile for calls, mp3player, camera etc.
Derived Demand: where demand for one good or service occurs as a result of demand for anotherie.
Demand for ipod causes demand for hard drive microphone etc, eg transport uses of transport are
not for the service itself but to be able to consume another service or good
Perishability: for how long may a good maintain its value?
Specif ic tax: a tax levied at a rate per physical unit of the good regardless of its price, contrast to ad
valorem
Rectangular Hyperbola: when the % change in values of both y and x axis is constant, for eg demand
curve with unitary price elasticity, or variation of average costs and qty

8/3/2019 Economic Note1
http://slidepdf.com/reader/full/economic-note1 13/39
Karan Rulezzz
13 Karan Shah Copyrights©
Government Intervention in the Price
System
Mark et f ailure is when the self-regulating mechanism of the invisible hand tends not to
allocate resources in the most efficient manner. They occur when:
y E xternalities
o Negative-Social cost greater than private cost
o Positive-Social Benefits greater than private benefits
o E ither too much or too little is produced
y Merit and Demerit Goods
o E ither too much or too little is produced
o H ow ever the difference between this and above is that this is due to failure of
information
y Public Goods
o T hese goods are
Non excludable
Non-rival o T hus they would not be produced at all by the market as it would be considered non
profitable by the market so govt would be required to produce it
Government Intervent ion
y Regulation-legal methods to control the qty and quality of goods and services that are
produced and consumed

8/3/2019 Economic Note1
http://slidepdf.com/reader/full/economic-note1 14/39
Karan Rulezzz
14 Karan Shah Copyrights©
y Financial Intervention- taxes and subsidies
y State Production nationalisation
y Income and other transf ers means of redistributing income to achieve equity
Correct ing Mark et Failure
In each panel, the potential gain f rom government intervention to correct market f ailure is shown
by the deadweight loss avoided, as given by the shaded triangle. In Panel (a), we assume that a
private market produces Qmunits of a public good. The eff icient level, Qe, is def ined by the
intersection of the demand curve D1 for the public good and the supply curve S1. Panel (b) shows
that if the production of a good generates an external cost, the supply curve S1 ref lects only the
private cost of the good. The market will produceQm units of the good at price P 1. If the public
sector f inds a way to conf ront producers with the social cost of their production, then the supply
curve shif ts to S2, and production f alls to the eff icient level Qe. Notice that this intervention results
in a higher price, P 2, which conf ronts consumers with the real cost of producing the good. Panel (c)
shows the case of a good that generates external benef its. Purchasers of the good base their
choices on the private benef it, and the market demand curve is D1. The market quantity isQm. This
is less than the eff icient quantity, Qe, which can be achieved if the activity that generates external
benef its is subsidized. That would shif t the market demand curve to D2, which intersects the

8/3/2019 Economic Note1
http://slidepdf.com/reader/full/economic-note1 15/39
Karan Rulezzz
15 Karan Shah Copyrights©
market supply curve at the eff icient quantity. Finally, Panel (d) shows the case of a monopoly f irm
that produces Qm units and charges a price P 1. The eff icient level of output, Qe, could be achieved
by imposing a price ceiling at P 2. As is the case in each of the other panels, the potential gain f rom
such a policy is the elimination of the deadweight loss shown as the shaded area in the exhibit.
Panel (a) of Figure 15.3, Correcting Market Failure illustrates the case of a public good. The market
will produce some of the public good; suppose it produces the quantity Qm. But the demand curve
that reflects the social benefits of the public good, D1, intersects the supply curve at Qe; that is the
efficient quantity of the good. Public sector provision of a public good may move the quantity closer
to the efficient level.
Panel (b) shows a good that generates external costs. Absent government intervention, these costs
will not be reflected in the market solution. The supply curve, S1, will be based only on the private
costs associated with the good. The market will produce Qm units of the good at a price P1. If the
government were to confront producers with the external cost of the good, perhaps with a tax on
the activity that creates the cost, the supply curve would shift to S2 and reflect the social cost of the
good. The quantity would fall to the efficient level, Qe, and the price would rise to P2.
Panel (c) gives the case of a good that generates external benefits. The demand curve revealed in
the market, D1, reflects only the private benefits of the good. Incorporating the external benefits of
the good gives us the demand curve D2 that reflects the social benefit of the good. The markets
output of Qm units of the good falls short of the efficient level Qe. The government may seek to move
the market solution toward the efficient level through subsidies or other measures to encourage the
activity that creates the external benefit.
Finally, Panel (d) shows the case of imperfect competition. A firm facing a downward-sloping
demand curve such as D1 will select the output Qm at which the marginal cost curve MC 1 intersects
the marginal revenue curve MR1. The government may seek to move the solution closer to the
efficient level, defined by the intersection of the marginal cost and demand curves.
While it is important to recognize the potential gains from government intervention to correct
market failure, we must recognize the difficulties inherent in such efforts. Government officials may
lack the information they need to select the efficient solution. Even if they have the information,
they may have goals other than the efficient allocation of resources. Each instance of government
intervention involves an interaction with utility-maximizing consumers and profit-maximizing firms,
none of whom can be assumed to be passive participants in the process. So, while the potential
exists for improved resource allocation in cases of market failure, government intervention may not
always achieve it.
The late George Stigler, winner of the Nobel Prize for economics in 1982, once remarked that people
who advocate government intervention to correct every case of market failure reminded him of the judge at an amateur singing contest who, upon hearing the first contestant, awarded first prize to
the second. Stiglers point was that even though the market is often an inefficient allocator of
resources, so is the government likely to be. Government may improve on what the market does; it
can also make it worse. The choice between the markets allocation and an allocation with
government intervention is always a choice between imperfect alternatives. We will examine the
nature of public sector choices later in this chapter and explore an economic explanation of why
government intervention may fail to move market solutions closer to their efficient levels.

8/3/2019 Economic Note1
http://slidepdf.com/reader/full/economic-note1 16/39
Karan Rulezzz
16 Karan Shah Copyrights©
Cost Benef it Analysis CBA1. Identification of all relevant costs and benefits
2. Putting a monetary value on all relevant costs and benefits
3. F orecasting future costs and benefits
4. Decision Making- interpretation of results of C BA
N ote: Quite d iffic ul t t o c oll ect d ata, have t o interpret f ut ure d ata and has t o k eep shad ow prices
on good s t hat d ont have mar k et prices
Key Concepts
Excise Duty: An excise or excise tax (sometimes called an excise duty or special tax) is a type
of tax charged on goods produced within the country (as opposed to customs, charged on goods
from outside the country). It is a tax on the production or sale of a good
Free Rider: free riders" are those who consume more than their fair share of a public resource, orshoulder less than a fair share of the costs of its production. Free riding is usually considered to be
an economic "problem" only when it leads to the non-production or under-production of a public
good (and thus toPareto inefficiency), or when it leads to the excessive use of a common property
resource.

8/3/2019 Economic Note1
http://slidepdf.com/reader/full/economic-note1 17/39
Karan Rulezzz
17 Karan Shah Copyrights©
International Trade
Int ro
International trade is the exchange of goods and services between countries. Tradeimproves consumer choice and total welfare.
Different countries have different factor endowments eg climate, skilled labourforce, and natural resources vary between nations. Therefore some countries arebetter placed in the production of certain goods than others.
Economic theory predicts all countries gain if they specialise and trade the goodsin which they have a comparative advantage. This is true even if one nation has an
absolute advantage over another country.
The Role of International Trade
International trade allows increased specialisation so that higher output allowseconomies of scale:
- A larger market allows domestic producers greater scope for economies of scale.Without trade the domestic market only allows Q1 output. Access to overseasmarkets means Q2 output at lowest unit cost
- International competition stimulates competition. Domestic firms strive tobecome ¶world class·, adapting modern technology, product and processinnovations that reduce unit costs.
Absolute advantage occurs when a country or region can create more of a productwith the same factor inputs.
Comparative advantage exists when a country has lower opportunity cost in theproduction of a good or service.

8/3/2019 Economic Note1
http://slidepdf.com/reader/full/economic-note1 18/39
Karan Rulezzz
18 Karan Shah Copyrights©
Assumpt ions for both theories1. Only two countries involved in the trade
2. Each can produce just two products
3. Productivity differs between them so varying quantities are produced
4. Production costs and opportunity costs are constant
Absolute Advant age
y The curves tend to intersect
y Clear-cut advantage
y Totally varying gradients of the line
Example 1
Party B has the absolute advantage.
Party A can produce 5 widgets per hour with 3 employees.
Party B can produce 10 widgets per hour with 3 employees.
Assuming that the employees of both parties are paid equally, Party B has an absolute advantage
over Party A in producing widgets per hour. This is because Party B can produce twice as many
widgets as Party A can with the same number of employees.
Example 2
Country C has the absolute advantage.
Country A can produce 1000 parts per hour with 200
workers.
Country B can produce 2500 parts per hour with 200
workers.
Country C can produce 10000 parts per hour with 200 workers.
Considering that labour and material costs are all equivalent, Country C has the absolute advantage
over both Country B and Country A because it can produce the most parts per hour at the same cost
as other nations. Country B has an absolute advantage over Country A because it can produce more
parts per hour with the same number of employees. Country A has no absolute advantage because it
can't produce more goods than either Country B or Country C given the same input.

8/3/2019 Economic Note1
http://slidepdf.com/reader/full/economic-note1 19/39
Karan Rulezzz
19 Karan Shah Copyrights©
Comparat ive Advant age
y The curves will never touch or meet as one country is better off producing both goods
y When curves are parallel, opportunity cost ratios are equal there is no benefit from
international trade
y Countries will specialise in goods that they have greatest efficiency and lowest opportunity
cost
Examine the following
Assumpt ions for comparat ive advant age1. Perfect occupational mobility, 100% efficiency in switching resources
2. Constant returns to Scale because specialization might lead to diminishing returns or
increasing returns as the scale of production is varied, thus linear curve, production costs to
be constant
3. No externalities from production or consumption
4. Zero or insignificant transport costs5. Exchange Rates must vary between the domestic opportunity cost ratios for trade to be
mutually beneficial
6. 2 country , 2 product
7. No restrictions on free trade
Protect ionism
Types of Protect ionism
o Tariffs a tax on imports; government gain
o Q uotas a limit to how many imports allowed; gain to produces as higher profitso Embargo Total ban on foreign imports
o Export Subsidies-distort market forces as supply will be greater , more volume of exports
o Exchange Control-limits on dealing of foreign currency, less imports possible
o Voluntary Export Restraint Arrangements where two countries make an agreement to limit
the volume of their exports to one another over an agreed period of time.
o Import licensing - governments grants importers the license to import goods .

8/3/2019 Economic Note1
http://slidepdf.com/reader/full/economic-note1 20/39
Karan Rulezzz
20 Karan Shah Copyrights©
Arguments for Protect ionism
o To safeguard employment in home industry
o To correct balance of payments disequilibria
o To prevent exploitation of labour in developing economies
o To prevent dumping
o To safeguard infant industrieso Strategic Arguments
o To prevent over specialization as specializing in 1 or 2 goods in a global economy where
demand in constantly changing it can be dangerous.
o Because other countries use barriers to trade
Economic Integrat ion1. Free trade area
2. Customs Union
3. Economic Union
Free t rade Area
o Removal of Tariffs and Q uotas on internal trade
o Members can determine their external trade policy towards other non-members
Customs Union
o Removal of tariffs and quotas on internal trade and also a common external tariff with non-
members
o Some trade being deflected from outside the union to within.
Economic Uniono As above but with more harmonization and centralization of policies
o EU has gone beyond with single currency and European Central Bank
Trade Creat ionTrade creation is an economic term related to international economics in which trade is created by
the formation of a customs union.
Occurrence of Trade Creat ion
When a customs union is formed, the member nations establish a free trade area amongst
themselves and a common external tariff on non-member nations. As a result, the member nations
establish greater trading ties between themselves now that protectionist barriers such
as tariffs, quotas, and non-tariff barriers such as subsidies have been eliminated. The result is an
increase in trade among member nations in the good or service of each nation's comparative
advantage.

8/3/2019 Economic Note1
http://slidepdf.com/reader/full/economic-note1 21/39
Karan Rulezzz
21 Karan Shah Copyrights©
Downside of Trade Creat ion
The creation of trade is important to the nation entering the customs union in that
increased specialization may hurt other industries. Arguments for protectionism, such as the infant
industry argument, national defence, outsourcing, and issues with health and safety regulations are
brought to mind. However, customs unions are typically formed with friendly nations, eliminating
the national defence argument, and in the long run serves to create more jobs and output due to
specialization.
Trade Diversion
Trade diversion is an economic term related to international economics in which trade is diverted
from a more efficient exporter towards a less efficient one by the formation of a free trade
agreement.
Occurrence of Trade Diversion
When a country applies the same tariff to all nations, it will always import from the most efficientproducer, since the more efficient nation will provide the goods at a lower price. With the
establishment of a bilateral or regional free trade agreement, that may not be the case. If the
agreement is signed with a less-efficient nation, it may well be that their products become cheaper
in the importing market than those from the more-efficient nation, since there are taxes for only one
of them. Consequently, after the establishment of the agreement, the importing country would
acquire products from a higher-cost producer, instead of the low-cost producer from which it was
importing until then. In other words, this would cause a trade diversion
Downside of Trade Diversion
Diverted trade may hurt the non-member nation economically and politically and create a strained
relationship between the two nations. The decreased output of the good or service traded from one
nation with a high comparative advantage to a nation of lower comparative advantage works against
creating more efficiency and therefore more overall surplus. It is widely believed by economists that
trade diversion is harmful to consumers

8/3/2019 Economic Note1
http://slidepdf.com/reader/full/economic-note1 22/39
Karan Rulezzz
22 Karan Shah Copyrights©
Examples of Trade Creat ion and Diversion
1. The diagram below shows the trade creation and trade diversion effects. Zambia has a domestic
supply curve for maize Sz. If it forms a trading bloc with South Africa then the supply curve for maize
is Sz/sa. The world output of maize is shown by the horizontal supply curve Sw. The Zambian
demand curve for maize is Dz.
Assuming no trade the domestic price of maize in Zambia would be Pz and the quantity would be Q 1.
By forming a trade bloc with South Africa the price of maize would fall to Pz+SA and the quantity
produced to Q 2. The triangle AEB represents the resulting welfare gain or trade creation effect. If
Zambia trade freely on the world market, quantity Q 3 of maize could be purchased at the world
price of Pw. This has been prevented from happening by the formation of the trade bloc with South
Africa, and the imposition of some form of trade barrier. There has therefore been a welfare loss of
BFC. This is the trade diversion effect.
A comparison of the two effects enables the overall welfare gain or loss of the formation of the
trading bloc to be assessed. The welfare implication of the trade creation and trade diversion effect
are summarised in the table below:
With no trade With trade bloc With free trade
Price and Q uantity Pz Q 1 Pz+sa, Q z+sa Pw
Trade Creation - EAB DAC
Trade Diversion ADC BFC -
From the point of view of LDCs the existence of trading blocs depends rather on firstly whether the
country is in the trading bloc and secondly which other countries are also members.
Being outside a trading bloc will often mean that a country loses out through the trade diversioneffect. Zambian textile producers will face trade barriers such as tariffs into the European Union and
consequently be disadvantaged.
Forming a trade bloc with other LDCs may result in only a small trade creation effect as the share of
world trade involving LDCs is so small, that the trade bloc has limited influence on the market price
and quantity. If the country joins a trade bloc with a MDC then there may be real advantages to the
LDC as resources flow within the bloc to the countries where there are cost advantages and the
potential market for exports is significantly expanded.
8/3/2019 Economic Note1
http://slidepdf.com/reader/full/economic-note1 23/39
Karan Rulezzz
23 Karan Shah Copyrights©
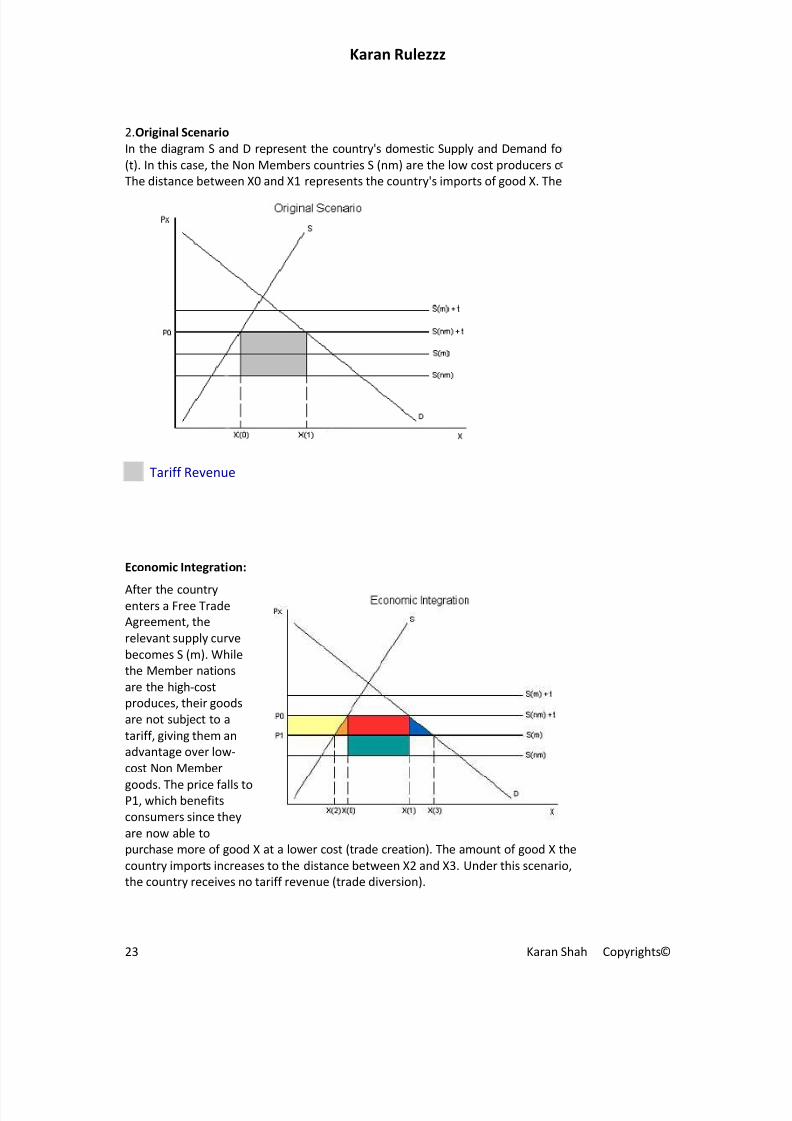
2.Original Scenario
In the diagram S and D represent the country's domestic Supply and Demand fo
(t). In this case, the Non Members countries S (nm) are the low cost producers c
The distance between X0 and X1 represents the country's imports of good X. The
Tariff Revenue
Economic Integration:
After the countryenters a Free Trade
Agreement, the
relevant supply curve
becomes S (m). While
the Member nations
are the high-cost
produces, their goods
are not subject to a
tariff, giving them an
advantage over low-
cost Non Member
goods. The price falls toP1, which benefits
consumers since they
are now able to
purchase more of good X at a lower cost (trade creation). The amount of good X the
country imports increases to the distance between X2 and X3. Under this scenario,
the country receives no tariff revenue (trade diversion).

8/3/2019 Economic Note1
http://slidepdf.com/reader/full/economic-note1 24/39
Karan Rulezzz
24 Karan Shah Copyrights©
Terms of TradeIn international economics and international trade, terms of trade or TOT is the relative prices of a
country's export to import. "Terms of trade" are sometimes used as a proxy for the relative social
welfare of a country, but this heuristic is technically questionable and should be used with extreme
caution. An improvement in a nation's terms of trade (the increase of the ratio) is good for that
country in the sense that it has to pay less for the products it imports. That is, it has to give up
fewer exports for the imports it receives.
Balance of PaymentsThe balance of payments consists of
Current Account
o Trade in Goods- balance of trade, visible imports and exports
o Trade in Services- invisible balance, invisible imports and exports
o Income
o Current Transfers
Producer surplus transferred to consumers
Efficiency gain (trade creation)
Formerly tariff revenue, now consumer surplus
Increased consumption (trade creation)
Lost tariff revenue (trade diversion)
Conclusion:
The net benefit (loss) to a country can be determined by comparing the trade creation and trade diversion effects.
diversion, economic integration will increase the country's welfare; if trade diversion dominates, entering a Free T
country's welfare. In the case of the European Union, most economist agree that trade creation far exceeds trade d
8/3/2019 Economic Note1
http://slidepdf.com/reader/full/economic-note1 25/39
Karan Rulezzz
25 Karan Shah Copyrights©
Capital Account
o Transfer or Ownership of Fixed Assets
o Acquisition or disposal of non-financial assets
Financial Account
o Investments overseas o Inward flow of investments from foreign residents
Note: Making an investment is recorded in f inancial account. However income earned f rom this
investment is current account
Key ConceptsBilateral Trade: Bilateral trade or clearing trade is trade exclusively between two states,
particularly, barter trade based on bilateral deals between governments, and without using hard
currency for payment. Bilateral trade agreements often aim to keep trade deficits at minimum by
keeping a clearing account where deficit would accumulate
Internal balance in economics is a state in which a country maintains full employment and price
level stability. It is a function of a country's total output,
Internal balance = Consumption [determined by disposable income] + Investment + Government
Spending + Current Account (determined by the real exchange rate, disposable income of home
country and disposable income of the foreign country).
External balance signifies a condition in which the country's current account, its exports minus
imports, is neither too far in surplus nor in deficit. It is signified by a level of the current account
which is consistent with the maintenance of existing (or growing) levels of consumption,
employment and national output over the long term. It is notated by
External balance = the right amount of surplus or deficit in the current account.
Maintaining both internal and external balances requires use of both monetary policy and fiscal
policy. That is one reason why floating exchange rates may be superior to fixed exchange rates.
Under fixed exchange rates, governments are not usually free to employ monetary policy. Under
floating rates, countries can use both
Globalization describes an ongoing process by which regional economies, societies and cultures
have become integrated through a globe-spanning network of exchange. The term is sometimes
used to refer specifically to economic globalization: the integration of national economies into the
international economy through trade.
Multilateral Trade: Multilateral trade agreements are between many nations at one time. For this
reason, they are very complicated to negotiate, but are very powerful once all parties sign the
agreement. The primary benefit of multilateral agreements is that all nations get treated equally,
and so it levels the playing field, especially for poorer nations that are less competitive by nature.
Net errors and omissions In balance of payments accounting, net errors and omissions record the
statistical discrepancies that arise in gathering balance of payments data.

8/3/2019 Economic Note1
http://slidepdf.com/reader/full/economic-note1 26/39
Karan Rulezzz
26 Karan Shah Copyrights©
Sunrise Industry sunrise industry is one that is new or relatively new, is growing fast and is expected
to become important in the future. Examples of sunrise industries include hydrogen fuel production,
space, and online encyclopaedias.
Sunset Industry: A sunset industry is an industry in decline, one that has passed its peak or boom
periods. As one example, analogue recording technologies for audio or video have been supplanted
by digital; although analogue equipment is still offered, sales have declined dramatically and are not
expected to recover, so this segment of the market has been branded a "sunset industry".
Trading Possibility Curve

8/3/2019 Economic Note1
http://slidepdf.com/reader/full/economic-note1 27/39
Karan Rulezzz
27 Karan Shah Copyrights©
Macroeconomic Problems
Inf lat ion
Persistent Increase in the general average level of prices of goods and services
Causes of Inf lat ion
y Cost-Push Inflation due to the increase in prices of factors of production , land labour ,
capital,
y Demand Pull inflation Due to the increase in demand for products
y Imported Inflation Increase in prices of imported materials that are used as raw materials
y Monetary Inflation Increase in the total money supply in the economy
MV = PT
M is money supply, velocity of circulation, (the number of times it changes hands), P is prices and T is
the number of transactions
Consequences of Inf lat ion
Disadvantages
y Tends to accelerate
y Affects the distribution of income
y Borrowers Gain at Expense of Lenders
y Affects the balance of payments
y Reduces purchasing power
y Shoe- leather costs, moving money from one financial asset to another, in search of greatest
interest rate , or lowest pricesy Menu Costs , costs involved in changing prices , bar codes catalogues etc
Advantages
y Pensioners who have fixed income gain by index-linking
y Demand Pull Inflation profits tend to increase to an extent
y Reasonable Rate can build business confidence
y May stimulate consumption as real interest rates may be low or negative , debt burdens fall
and people will be encouraged to spend more
y Inflation would help firms who need to reduce costs survive, as they can reduce real cost of
factors of production

8/3/2019 Economic Note1
http://slidepdf.com/reader/full/economic-note1 28/39
Karan Rulezzz
28 Karan Shah Copyrights©
Ant icipated and Unant icipated Inf lat ion
Anticipated inf lation:
When people/businesses can make accurate predictions of inflation, they can take steps
to protect themselves from its effects. If the inflation rate corresponds to what the majority of
people are expecting (anticipated inflation), then we can compensate and the cost isn't high. For
example, banks can vary their interest rates and workers can negotiate contracts that includeautomatic wage hikes as the price level goes up. Firms can negotiate their prices, nominal interest
rates can be changed to maintain real interest rates, consumers can distinguish between relative
prices and general prices etc
Unanticipated inf lation:
Unanticipated inflation occurs when economic agents (people, businesses and governments) make
errors in their inflation forecasts. Actual inflation may end up well below, or significantly above
expectations.
When inflation is volatile from year to year, it becomes difficult for individuals and
businesses to correctly predict the rate of inflation in the near future
y Creates Uncertainty
y Fall in consumption and investment
y Arbitrary distribution of income
y Income transferred from old to young
Stagf lation
High unemployment and high
inflation is known as stagflation.
Usually results from an increase
in price of raw materials.
Because this leads to inflation.
Secondly it leads to
unemployment as businesses
are less profitable (stagnation).
As both of these occur
simultaneously it leads
stagflation
Philipps Curve
Def lation
In economics, deflation is a decrease in the general price level of goods and services. [1] Deflation
occurs when the inflation rate falls below zero percent, resulting in an increase in the real value of
money a negative inflation rate. This should not be confused with disinflation, a slow-down in the
inflation rate (i.e. when the inflation decreases, but still remains positive).[2] Inflation reduces the
real value of money over time; conversely, deflation increases the real value of money. Money refers
to the functional currency (mostly unstable monetary unit of account) in a national or regional
economy.

8/3/2019 Economic Note1
http://slidepdf.com/reader/full/economic-note1 29/39
Karan Rulezzz
29 Karan Shah Copyrights©
Ref lation
Reflation is the act of stimulating the economy by increasing the money supply or by reducing taxes.
It is the opposite of disinflation. It can refer to an economic policy whereby a government uses fiscal
or monetary stimulus in order to expand a country's output. This can possibly be achieved by
methods that include reducing tax, changing the money supply, or even adjusting interest rates. Just
as disinflation is considered an acceptable antidote to high inflation, reflation is considered to be anantidote to deflation
Key Concepts
Hyperinf lation: In economics, hyperinflation is inflation that is very high or "out of control", a
condition in which prices increase rapidly as a currency loses its value. Definitions used by the media
vary from a cumulative inflation rate over three years approaching 100% to "inflation exceeding 50%
a month." [2] In informal usage the term is often applied to much lower rates. As a rule of thumb,
normal inflation is reported per year, but hyperinflation is often reported for much shorter intervals,
often per month.
Menu Costs: In economics, menu costs are the costs to firms of updating menus, price lists,
brochures, and other materials when prices change in an economy. Because this cost exists
, firms sometimes do not change their prices when the economy puts pressure on it, leading to price
stickiness. Generally, the effect on the firm of small shifts in price (by changes
in supply and/or demand, or else because of slight adjustments in monetary policy) are relatively
minor compared to the costs of notifying the public of this new information. Therefore, the firm
would rather exist in slight disequilibrium than incur the menu costs.
Shoe Leather Costs Shoe leather cost refers to the cost of time and effort (more specifically
the opportunity cost of time and energy) that people spend trying to counter-act the effects
of inflation, such as holding less cash and having to make additional trips to the bank. The term
comes from the fact that more walking is required (historically, although the rise of the Internet has
reduced it) to go to the bank and get cash and spend it, thus wearing out shoes more quickly. The
actual cost of reducing money holdings is the additional time and convenience that must be
sacrificed to keep less money on hand than would be required if there were no inflation.
Nominal Value: The stated value of an issued security that remains fixed, as opposed to its market
value, which fluctuates. Nominal value refers to any price or value expressed in money of the day, as
opposed to real value, which adjusts for the effect of inflation
s

8/3/2019 Economic Note1
http://slidepdf.com/reader/full/economic-note1 30/39
Karan Rulezzz
30 Karan Shah Copyrights©
Balance of Payments Problem
Equilibrium and Disequilibrium
Balance of payments equilibrium is defined as a condition where the sum of debits and credits from
the current account and the capital and financial accounts equal to zero; in other words, equilibrium
is where
This is a condition where there are no changes in Official Reserves. [3] When there is no change in
Official Reserves, the balance of payments may also be stated as follows:
or:
Balance of payments disequilibrium is when over a period of time a country is recording persistent
surpluses or deficits in the balance of payments. As a consequence the exchange rate has to either
be overvalue or undervalued
1. Imports of Goods and Services exceed exports and financial accounts is in deficit
2. Export of Goods just exceed imports but there is a financial account deficit
3. Large Surplus on the current account
Causes of BOP Disequilibrium
A number of factors may cause disequilibrium in the balance of payments. These various causes may
be broadly categorized into:
(i) Economic factors ;
(ii) Political factors; and
(iii) Sociological factors.
Economic Factors:
A number of economic factors may cause disequilibrium in the
balance of payments. These are:
Development Disequilibrium:
Large-scale development expenditures usually increase the purchasing power, aggregate demand
and prices, resulting insubstantially large imports. The development disequilibrium iscommon in developing countries, because the above factors, and large-scale capital goods imports
needed for carrying out the various development programmes, give rise to a deficit in the
balance of payments.

8/3/2019 Economic Note1
http://slidepdf.com/reader/full/economic-note1 31/39
Karan Rulezzz
31 Karan Shah Copyrights©
Cyclical Disequilibrium:
Cyclical disequilibrium occurs because of two reasons First two countries may be passing through
different paths of business cycle. Second, the countries may be following the same path but the
income elasticitys of demand or price elasticitys of demand are different. f prices rise in prosperity
and decline in depression, a country with price elasticity for imports greater than unity will
experience a tendency for decline in the value of imports in prosperity; while those for which importprice elasticity is less than one will experience a tendency for increase. These tendencies may be
overshadowed by the effects of income changes, of course. Conversely, as prices decline in
depression, the elastic demand will bring about an increase in imports, the inelastic demand a
decrease
Secular Disequilibrium:
Sometimes, the balance of payments disequilibrium persists for a long time because of certain
secular trends in the economy. For instance, in a developed country, the disposable income is
generally very high and, therefore, the aggregate demand, too, is very high. At the same time,
production costs are very high because of the higher wages. This naturally results in higher
prices. These two factors - high aggregate demand and higher domestic prices may result in theimports being much higher than the exports. This could be one of the reasons for the
persistent balance of payments deficits of the USA.
Structural Disequilibrium:
Structural changes in the economy may also cause balance of payments disequilibrium. Such
structural changes include the development of alternative sources of supply, the development
of better substitutes, the exhaustion of productive resources, the changes in transport routes and
costs, etc.
Political Factors:
Certain political factors may also produce balance of payments disequilibrium. For instance, a
country plagued with political instability may experience large capital outflows, inadequacy of
domestic investment and production, etc. These factors may, sometimes, cause disequilibrium in
the balance of payments. Further, factors like war, changes in world trade routes, etc., may
also produce balance of payments difficulties.
Social Factors:
Certain social factors influence the balance of payments. For instance, changes in tastes,
preferences, fashions, etc. may affect imports and exports and thereby affect the balance of
payments
8/3/2019 Economic Note1
http://slidepdf.com/reader/full/economic-note1 32/39
Karan Rulezzz
32 Karan Shah Copyrights©
Consequences Of Disequilibrium
Domestic Economy
y Pressing Need for corrective action
y Due to low business confidence foreigners are reluctant to invest in such economy
y Fewer stocks , variety of exotic goods as imports are limited and heavy protectionist policies
will be used
y Others are follow through, like high unemployment, reduced economic growth etc...
External Economy
y Put pressure in govt to edit protectionist policies
y Devaluation of exchange rate
Exchange Rates
Nominal Exchange RateIt is simply the price of one currency in terms of the other. They are bilateral rates as its only
between two countries
Real Exchange Rate
The purchasing power of two currencies relative to one another. While two currencies may have a
certain exchange rate on the foreign exchange market, this does not mean that goods and services
purchased with one currency cost the equivalent amounts in another currency. This is due to
different inflation rates with different currencies. Real exchange rates are thus calculated as
a nominal exchange rate adjusted for the different rates of inflation between the two currencies.
Purchasing Power ParityAn economic theory that estimates the amount of adjustment needed on the exchange rate
between countries in order for the exchange to be equivalent to each currency's purchasing power.
The relative version of PPP is calculated as:
Trade Weighted Exchange Rate
Multilateral rate that measures the overall nominal value of a currency in the foreign exchange
market. It is computed by formulating a weighted average (reflecting the importance of
each country's currency in international trade) of selected bilateral rates. In the index countries that
are larger percent of trade are given greater weightage in the index
Determinat ion of Exchange Rates
Totally dependant on the free market for the foreign exchange market. It is determined by the
supply and demand for the currency.
Float ing Exchange Rate Systems
These are the basic ones with which it follows the market forces without any intervention

8/3/2019 Economic Note1
http://slidepdf.com/reader/full/economic-note1 33/39
Karan Rulezzz
33 Karan Shah Copyrights©
Advantage
y Government is free to carry other objectives
Disadvantage
y It discourages trade as rate can become very unstable, sudden fluctuations can affectcompanys calculations and costs and there would always be a risk factor.
y Government do not face any pressure to exercise financial discipline , and a floating
exchange rate can be inflationary
Fixed Exchange Rate Systems
This is where the govt has a fixed pegged value where the government intervenes in the market
forces to maintain that value. They can do this buying their own currency or selling the foreign
currency reserves to increase the supply in the market
Managed Exchange Rate Systems
This is where the exchange rate mostly varies with market forces however there is some level of govt
intervention. Here the currency is allowed to vary between its upper limit and lower limit. However
if it crosses these limits govt intervention takes place
J- curve effect
In the short term a devaluation or depreciation of the exchange rate may not improve the current
account deficit of the balance of payments. This is due to the low price elasticity of demand for
imports and exports in the immediate aftermath of an exchange rate change. The diagram below
shows this possibility.
Assuming that the economy begins at position A with a substantial current account deficit there is
then a fall in the value of the exchange rate. Initially the volume of imports will remain steady partly
because contracts for imported goods will have been signed.

8/3/2019 Economic Note1
http://slidepdf.com/reader/full/economic-note1 34/39
Karan Rulezzz
34 Karan Shah Copyrights©
However, the depreciation raises the sterling price of imports causing total spending on imports to
rise. Export demand will also be inelastic in response to the exchange rate change in the short term;
therefore the earnings from exports may be insufficient to compensate for higher spending on
imports. The current account deficit may worsen for some months. This is shown by the movement
from A to B on the diagram.
The Inverse J Curve Effect
An appreciation in the exchange rate can lead to a short term improvement in thebalance of trade. Imports become cheaper and exports more expensive in overseasmarkets. But initially the elasticity of demand for both imports and exports isfairly low - leading to an overall improvement in the trade balance.
Marshall Lerner Condit ion
If a balance of payments disequilibrium is to be restored then it is important that the PED coefficient
for exports is greater than 1 and that the PED coefficient for imports is greater than 1. This is
embodied in a condition called the Marshall Lerner Condition and this states that:
"Provided that the sum of the price elasticity of demand coefficients for exports and imports is
greater than one then a fall in the exchange rate will reduce a deficit and a rise will reduce a
surplus."
If the Marshall Lerner Condition is not met and the sum of the price elasticity of demand for exports
and imports is less than one, then a fall in the exchange rate will bring about a worsening of the
balance of payments. The fall in the price of exports will lead to a proportionately smaller increase in
the number of exports demanded and the rise in the price of imports will lead to a proportionately
smaller reduction in the amount demanded. Both of these factors will contribute to a deterioration
of the balance of payments.
Key Concepts
Appreciation: is a rise of a currency in a floating exchange rate.
Depreciation: is a fall of a currency in a floating exchange rate
Devaluation: Devaluation is a reduction in the value of a currency with respect to other monetary
units. In common modern usage, it specifically implies an official lowering of the value of a country's
currency within a f ixed exchange rate system, by which the monetary authority formally sets a new
fixed rate with respect to a foreign reference currency. In contrast, depreciation is used for the
unofficial decrease in the exchange rate in a floating exchange rate system. The opposite of
devaluation is called revaluation...
Fiscal drag refers to the process where tax thresholds are either not adjusted for inflation, or fail to
keep pace with earnings growth, causing in either case an automatic rise in tax revenues.

8/3/2019 Economic Note1
http://slidepdf.com/reader/full/economic-note1 35/39
Karan Rulezzz
35 Karan Shah Copyrights©
Example of nominal f iscal drag
Suppose a person earns $20,000 per year and is liable to 20% tax on earnings above a threshold of
$5,000 per year. Then they pay (20000-5000)*0.2 = $3000 in tax, or 15% of income. Now suppose
that due to inflation, their wage goes up by 5%, but the government only increases the tax threshold
by 2%. They must now pay (21000-5100)*0.2 = $3180 or 15.14%. The proportion of income as tax
has increased - this is fiscal drag.
Fiscal Boost - inflation will reduce the real burden of specific taxes
(I.e. taxes levied per unit of a commodity
irrespective of its price) such as excise duty.
(Needs to be revised)
International Monetary Fund : The International Monetary Fund (IMF) is an international
organization that oversees the global financial system by following the macroeconomic of its
member countries, in particular those with an impact on exchange rates and the balance of
payments. It is an organization formed with a stated objective of stabilizing international exchange
rates and facilitating development.[2] It also offers highly leveraged loans mainly to poorer countries
Velocity Of Circulation: the speed with which money whizzes around the economy, or, put another
way, the number of times it changes hands. Technically, it is measured as GNP divided by the money
supply . It is an important ingredient of the quantity theory of money.
Wage Drif t: The tendency for the average level of wages paid to rise faster than official wage rates.
This is due to increases in overtime, or upgrading of job descriptions.
8/3/2019 Economic Note1
http://slidepdf.com/reader/full/economic-note1 36/39
Karan Rulezzz
36 Karan Shah Copyrights©
Measurement In the Macroeconomy
Unemployment
Labour Force
It is defined as the total number of workers who are available for work, normally 16 years and over
in most developed countries. This includes all people who are able and willing to work, employed
and unemployed, those who have searched for job in past 4 weeks, but not those who havent. So
retired and students in full-time education are also not considered.
Size of Labour Force depends on demographic, economics, social and cultural factors such as
y Total Size of the population of working age
y The number of people who remain in full-time education after leaving secondary school
y The normal retirement age for males and females
y Number of women who join the labour force on a full or part time basis
Another Measure used is
Labour Force Participation Rate
This refers to the % of total population or working age that are actually classified as being part of the
labour force.
This tends to mean that a lower participation rate means high participation rate in education and
relatively large no. of people opting for early retirement
Comparable Statistics with Developing economies are unreliable as:
y Existence of large subsistence sector
y Differences in official secondary school leaving age
y Differences In attitude towards married woman seeking paid employment
y Practical Problems of Data Collection
Demographic Trends affecting labour force in developing countries
y Birth Rates Exceed Death Rates
y Dependency Ratio are high as consequence of high birth rates and increasing life expectancy
y Rapid Growth In Urban Populations , due to migration, urbanisation has made it very
difficult for such economies to provide enough jobs to meet labour force
8/3/2019 Economic Note1
http://slidepdf.com/reader/full/economic-note1 37/39
Karan Rulezzz
37 Karan Shah Copyrights©
Labour Product ivity:
Q uantity of goods and services that a worker is able to produce in a given period of time.
y Even though Labour Force is a key resource, its output to a large extent is related to its skills,
technical knowledge and motivation, and thus productivity.
Unemployment
An economic condition marked by the fact that individuals actively seeking jobs remain unhired.
Unemployment Rate
Employment does cover
y Full time paid employment
y Recognised Training Schemes
y Working Minimum Number of Hours Per Week
Those in non-montarised situations be excluded and also unpaid volunteers
Claimant Count
These include all the people that are nationally registered as claiming unemployment benefit from
the government. This does not include those receiving a form of disability benefit, or those who do
not claim unemployment allowance, only those that are willing and able to find work, and do claim.
Labour F orce Survey
This is an internationally accepted measure used by the International Labour Organisation (ILO). This
counts everyone without a job of any kind who has looked for a job in the past month and is willing
to start working within the next fortnight. Of course since this is a survey and not a census (a survey
is of a representative sample of a population, a census is of the entire population), there will always
be inaccuracies and omissions in the data.
Generally, the ILO's LFS measure is higher than the claimant count, for the reasons mentioned
above. When countries' unemployment levels are compared, the LFS is usually used.

8/3/2019 Economic Note1
http://slidepdf.com/reader/full/economic-note1 38/39
Karan Rulezzz
38 Karan Shah Copyrights©
General Level Of Prices; Inf lat ion
Diff erence between CPI and RPI
y The RPI (Retail price index) includes mortgage interest payments. Thus changes in the
interest rates affect the RPI. If interest rates are cut, it will reduce mortgage interest
payments. Thus the RPI will fall but not the CPI.
y The RPI also includes council tax and some other housing costs not included in CPI
y The CPI includes some financial services not included in the RPI
y The CPI is based on a wider sample of the population for working out weights.
Main Stages in Calculation
y Base Year chosen, index values 100
y 7000 households asked to keep a record of their expenditure over a period
y Used to decide goods to be included and their relevant weight according to the percentage
of consumer expenditure spent on it
y Then every year, average prices of 600 goods chosen , are found and RPI is calculatedy % change in price is multiplied by weight
y Calculates weighted index. , to which we find the average and RPI is determined
Cost of Living

8/3/2019 Economic Note1
http://slidepdf.com/reader/full/economic-note1 39/39
Karan Rulezzz
Correcting Balance of Payments
Disequilibria
Expendit ure Switching Policies1. Switch the expenditure from one aspect of goods and services to another, but not reducing
gross expenditure. I
2. Its aim is to switch spending from imports to domestically produced goods, decrease
spending on imports and increase exports.
3. Thus supply of currency in foreign exchange market will decrease and thus again raise prices
and restabilise countrys exchange rate. These include
y Tariffs
y Q uotas
y Exchange Controls
y Export Subsidies
y Embargoes
y Voluntary Export Restraints
However these all lead to disadvantages to consumers and interfere with market forces and prevent
the benefit of specialisation of trade. Furthermore there are restrictions by WTO and thus it
would lead to govt switching to expenditure dampening policies
Expendit ure Dampening Policies
1. Aim to reduce gross expenditure
2. Effects
y Reduction in Spending means fewer purchases on imports.
y Domestic producers find domestic market dampened and thus will try increase
sales abroad.
3. Therefore less imports and more exports
4. Polices include
y Def lationary Fiscal Policy raising taxes and reducing government expenditure ,
however the extent of reduction of imports will depend on marginal propensity to
import(change in import spending as disposable incomes change , high means great
effect)
y Def lationary Monetary Policy- raising interest rates and reducing money supply ,
higher interest rates will attract foreign capital and also reduce money supply,
reducing aggregate demand