Embed Size (px)
Citation preview

Economic Models of Discrimination
Spring 2010
Rosburg (ISU) Economic Models of Discrimination Spring 2010 1 / 59
Models of Discrimination
Taste for Discrimination: people act as if there is a non-pecuniarycost of associating with particular group
Non-production related attributesSeveral possible sources: employer, employee, or customer
Statistical Discrimination: offer different transaction terms toindividuals because of perceived or accurate group differences
Group averages
Overcrowding Model: crowding into lower wage jobs due topreferences or lack of alternative opportunities
Institutional Model: everyday operation of firm causes differences inproductivity, promotion opportunities, and pay
Rosburg (ISU) Economic Models of Discrimination Spring 2010 2 / 59

Taste Discrimination
TASTE DISCRIMINATION
Rosburg (ISU) Economic Models of Discrimination Spring 2010 3 / 59
Taste Discrimination
Taste Discrimination
Gary Becker (1957)
Modeled discrimination as a personal prejudice, or taste, againstassociating with a particular group
Sources: employer, employee (coworker), customer
To affect earnings, tastes must influence actions
Act as if there were a non-pecuniary cost of associating with particulargroup
Rosburg (ISU) Economic Models of Discrimination Spring 2010 4 / 59

Taste Discrimination
Taste Discrimination
Discrimination Coefficient: measurement of the strength of anindividual’s discriminatory taste
Denote by “d”
Need to factor this “cost” into decision of firm or individual
Rosburg (ISU) Economic Models of Discrimination Spring 2010 5 / 59
Taste Discrimination
Notation
Use the following subscripts to denote ‘groups’ of people:
P: Preferred group
NP: Non-preferred group
e: Employer
w: Employee/Coworker
c: Customer
Rosburg (ISU) Economic Models of Discrimination Spring 2010 6 / 59

Taste Discrimination Employer
Employer Discrimination I
Cost of employing preferred group: wP
Full cost of employing non-preferred: wNP + de
Discriminating employer will only hire NP at lower wage:
wNP = wP − de < wP
wNP < wP
Rosburg (ISU) Economic Models of Discrimination Spring 2010 7 / 59
Taste Discrimination Employer
Employer Discrimination II
If P and NP have equal productivity:
wNP < wP = MP
Group discriminated against is paid less than their marginalproductivity
Wage gap increases with employers’ discriminatory tastes (i.e. the largerde) and the number of non-preferred workers seeking employment
Rosburg (ISU) Economic Models of Discrimination Spring 2010 8 / 59

Taste Discrimination Employer
Criticisms of model:
In theory, competitive markets should eliminate the gap
Discrimination is costly
If discriminate and hire more expensive workers, you are forgoing theopportunity to hire cheaper labor
Higher costs → lower profitsCompetitive advantage for non-discriminating firmsNon-discriminating firms drive out discriminatory firms
Even without driving them out of market, no wage gap will exist if thereare enough non-discriminatory firms to hire NP workers
→ Segregation
Rosburg (ISU) Economic Models of Discrimination Spring 2010 9 / 59
Taste Discrimination Employer
Reasons why competitive markets don’t solve gap:
Lack of competition due to market power
Monopsony: large buyer of labor relative to size of marketExample: Factory townPositive relationship between market power and employmentdiscrimination [Black and Brainerd (2004) test this]
Unions
Barrier to competitive wagesRecall diagram previous lecture
Search costs
Employees may be willing to settle on a lower paying job rather thanincur costs to search again
Discrimination may boost profits
Ex: Housing agents protect business of prejudiced clients
Rosburg (ISU) Economic Models of Discrimination Spring 2010 10 / 59

Taste Discrimination Employer
Arrow (1971) - “The Theory of Discrimination”Two types of labor: B and W
Perfect substitutes
Suppose employer prefers W to B
Trade-off between profits (π) and the number of B and W employees
Suppose that employer seeks to maximize utility rather than profitsdirectly:
U(π, B, W)
where
Output = f (B + W )
Profit = π = f (B + W )− wBB − wW W
wi is the wage for type iRosburg (ISU) Economic Models of Discrimination Spring 2010 11 / 59
Taste Discrimination Employer
Arrow (1971)
Convention is to equate MPL to price of input
Input price is now the market price (wage) plus the discriminationcoefficient
Arrow considers discrimination of both types of workers:
dB = “internal cost” for a one unit increase in type B labor force
Positive value
dW = “internal cost” for a one unit increase in type W labor force
Negative value
Rosburg (ISU) Economic Models of Discrimination Spring 2010 12 / 59

Taste Discrimination Employer
Arrow (1971)
Equate MP to “input price” for each type of worker:
MPB = wB + dB
MPW = wW + dW
Given equal productivity (MPB = MPW ):
MPW = wW + dW = wB + dB = MPB
wW − wB = dB − dW > 0
Rosburg (ISU) Economic Models of Discrimination Spring 2010 13 / 59
Taste Discrimination Employer
Arrow (1971)
If all firms have the same degree of discrimination:
B workers paid less than MP
W workers benefit with higher wages
Employers benefit from maximized utility
Effect on firm profit depends on nature of utility function
If firms have varying degrees of discrimination (different utility):
Wages still higher for W
Less discrimination as firm gets larger
Discrimination costly - like tax; restricts scale
Production no longer efficient since MP’s no longer same for all firms
Rosburg (ISU) Economic Models of Discrimination Spring 2010 14 / 59

Taste Discrimination Employer
Black and Brainerd (2004) - “Importing Equality? The Impact of
Globalization on Gender Discrimination.”
Becker’s model implies a positive relationship between market power andemployment discrimination.
Increased competition (decreased market power) should reduce thewage gap.
B&B (2004) use increased international trade in recent years as a measureof increased competition.
Evaluate impact of trade on wage gap in non-competitive(‘concentrated’) versus competitive industries.
Rosburg (ISU) Economic Models of Discrimination Spring 2010 15 / 59
Taste Discrimination Employer
Black and Brainerd (2004) - Data
Individual Data
Current Population Survey (CPS) 1977-1994
Full-time workers
Checked results using Census and Outgoing Rotation Groups of theCPS
Trade Data
National Bureau of Economic Research (NBER) Trade Database
Manufacturing industries only
Rosburg (ISU) Economic Models of Discrimination Spring 2010 16 / 59

Taste Discrimination Employer
Black and Brainerd (2004) - Model
Dependent variable: change in industry level residual gender wage gapfrom 1976 - 1993
Decline in residual wage gap is an improvement
Key independent variables:
1 Change in import share in industry over period
2 Dummy variable for concentrated industries
3 Interaction of (1) and (2)
Rosburg (ISU) Economic Models of Discrimination Spring 2010 17 / 59
Taste Discrimination Employer
Black and Brainerd (2004) - Results
Positive coefficient on concentrated industry dummy
Gap declined more in competitive industries in absence of importpenetration.
Positive coefficient on change in import share
Non-concentrated industries: gap grew more in industries that hadgreater import increases than those with little or no additionalcompetition from increased trade.
Captures negative effect trade has on less-skilled workers; women holddisproportionate share of less-skilled jobs.
Rosburg (ISU) Economic Models of Discrimination Spring 2010 18 / 59

Taste Discrimination Employer
Black and Brainerd (2004) - Results
Negative coefficient on interaction term
Trade increased gender gap in competitive industries but actuallyreduced gap in concentrated industries.
Results insensitive to measurement of wages, market structure, length oftime, and data set.
Trade may increase wage inequality by reducing relative wages ofless-skilled but also appears to benefit women by reducing ability of firmsto discriminate.
Rosburg (ISU) Economic Models of Discrimination Spring 2010 19 / 59
Taste Discrimination Employer
Bertrand and Mullainathan (2004) - “Are Emily and Greg more
Employable than Lakisha and Jamal? A Field Experiment on Labor Market
Discrimination”
Sent fictitious resumes with randomly assigned African-American- orWhite-sounding names to help-want ads in Chicago and Boston
Measured call-backs for interviews
Existence of racial gap?Does the racial gap change with resume quality?Does neighborhood of residence matter?Does the racial gap vary by occupation or industry?
Rosburg (ISU) Economic Models of Discrimination Spring 2010 20 / 59

Taste Discrimination Employer
Bertrand and Mullainathan (2004) - Resumes
Names
Data from birth certificates in Massachusetts between 1974 to 1979(racial frequency)Checked perceptions with survey
Two qualities of resumes
Experience, employment history, email address, honors, foreignlanguage, certifications, volunteer history, computer skills
Sent 4 resumes to each job
One for each quality and race combination
Rosburg (ISU) Economic Models of Discrimination Spring 2010 21 / 59
Taste Discrimination Employer
Bertrand and Mullainathan (2004) - Resumes II
Used online resumes as templates
Fake phone numbers, emails, addresses
Randomly assign postal address“Wealthier” neighborhoods tend to be more educated and Whiter
1,300 employment ads between 2001 and 2002
Sales, administrative support, clerical, and customer service jobcategories
Kept job information: job requirements, if equal opportunity employer
Rosburg (ISU) Economic Models of Discrimination Spring 2010 22 / 59

Taste Discrimination Employer
Bertrand and Mullainathan (2004) - Resumes III
Advantages:
Can generate compatibility of partner
No demand effects - participants can’t influence results [noface-to-face contact]
Low marginal cost - large sample size
Disadvantages:
Want employment and wage rather than callback rates
Do not directly report race (inferred from name)
Use very distinct names, may not represent average applicant
Rosburg (ISU) Economic Models of Discrimination Spring 2010 23 / 59
Taste Discrimination Employer
Bertrand and Mullainathan (2004) - Results
Mean Callback Rates By Racial Soundness of NamesPercent callback Percent callbackfor White names for Black names Ratio
All resumes 9.65 6.45 1.50Chicago 8.06 5.40 1.49Boston 11.63 7.76 1.50Females 9.89 6.63 1.49Females in Admin 10.46 6.55 1.60Females in Sales 8.37 6.83 1.22Males 8.87 5.83 1.52
Source: Bertrand and Mullainathan (2004), Table 1
Rosburg (ISU) Economic Models of Discrimination Spring 2010 24 / 59

Taste Discrimination Employer
Bertrand and Mullainathan (2004) - Results II
White names receive 50% more callbacks
Equivalent to 8 years of experience
Resume quality has greater effect for White names (higher return)
Significant “favoritism” towards whites
No evidence that African Americans benefit more than whites fromliving in a Whiter, more educated zip code
Race gap relatively uniform across occupations, job requirements,employer characteristics, and industries
Rosburg (ISU) Economic Models of Discrimination Spring 2010 25 / 59
Taste Discrimination Employer
Bertrand and Mullainathan (2004) - Results and Theory
Taste-based Discrimination
Customer and coworker - gap is not larger for jobs with more customeror coworker contact [not consistent with theory]
Employer discrimination - matches finding that employers located inneighborhood with higher percentage of black residents discriminateless; struggles to explain lower returns for credentials [could beconsistent]
Statistical Discrimination
Race does not appear to proxy for unobservables (lower returns)
Imprecise information theory - control resume characteristics
Rosburg (ISU) Economic Models of Discrimination Spring 2010 26 / 59

Taste Discrimination Employer
Bertrand and Mullainathan (2004) - Model Limitations
Data only from 2 large, metropolitan areas (Chicago and Boston)
Limited occupational categories
Quality may be subjective - have to pay more for a higher qualityemployee
No information on other applicants (racial proportion)
Non-random job selection:
Location of job advertisement - The Boston Globe, The ChicagoTribuneEliminated job if required call or appearance
Rosburg (ISU) Economic Models of Discrimination Spring 2010 27 / 59
Taste Discrimination Employer
Bertrand and Mullainathan (2004) - Model Limitations
Current staff at firm (proportion in each race)
Contact via postal mail not measured
Time of year (labor demand)
Economic environment
Rosburg (ISU) Economic Models of Discrimination Spring 2010 28 / 59

Taste Discrimination Employer
Bertrand and Mullainathan (2004) - Model Limitations andSuggested Corrections
Rosburg (ISU) Economic Models of Discrimination Spring 2010 29 / 59
Taste Discrimination Employee/Coworker
Taste Discrimination - Employee/Coworker
Coworkers require premium to work with non-preferred group (dW )
Similar to compensating wage differential
Example: Men who don’t like being supervised by women
Employees with taste discrimination against another ‘group’ of employeesmay have lower productivity or moral if forced to work in uncomfortableenvironment.
Reluctance to teach/help coworker (i.e. informal on-the-job training)
Rosburg (ISU) Economic Models of Discrimination Spring 2010 30 / 59

Taste Discrimination Employee/Coworker
Employer Response to Employee Discrimination
Segregate workforce
Premium no longer necessary
May be unprofitable
Recruitment/training costs
Against the law
Market wide wage differentials
Size of wage differential depends on distribution and intensity ofemployees discriminatory tastes and supply of NP workers
Rosburg (ISU) Economic Models of Discrimination Spring 2010 31 / 59
Taste Discrimination Employee/Coworker
Arrow (1971) - Employee/Coworker
Two types of workers: Foremen and floor workers
Foremen: Prefer working with W
Choose job based on wage and WB ratio
Assume all foreman have the same utility function
Results:
Even if firms have no discriminatory tastes, they will not hire B andW workers at equal wages since there is a lower supply of W
W is worth more than MP the the employer while B is worth less thanMP
Wage differential increases with importance of the share of foremenon output relative to floor workers
Rosburg (ISU) Economic Models of Discrimination Spring 2010 32 / 59

Taste Discrimination Employee/Coworker
Levitt (2004) - “Testing Theories of Discrimination: Evidence from Weakest
Link”
Constructed data on the voting patterns of participants on the showWeakest Link to test for taste and statistical discrimination
Research Question: If participants deviate from the “optimal” votingstrategy, does it occur based on taste or statistical discrimination?
Rosburg (ISU) Economic Models of Discrimination Spring 2010 33 / 59
Taste Discrimination Employee/Coworker
Levitt (2004) - Weakest Link
Video:
http://www.youtube.com/watch?v=Ov8W6GlCIxc
Game Setup:
Money increases with consecutive correct answers
Can “bank” before turn
Vote off 1 player each round
Head-to-head final round where winner-takes-all
Rosburg (ISU) Economic Models of Discrimination Spring 2010 34 / 59

Taste Discrimination Employee/Coworker
Levitt (2004) - Optimal Strategy
Optimal action will depend on actions of others and previous roundperformances
“Prize-building” effect dominant early in game
Vote off weakest players to increase prizeWeakens over rounds
“Weak-final-round-opponent” strategy increases over time
Vote off strongest competition before final roundWant to face easiest competition in winner-take-all final match
Rosburg (ISU) Economic Models of Discrimination Spring 2010 35 / 59
Taste Discrimination Employee/Coworker
Levitt (2004) - Discriminating Strategy
Expected strategies of discriminating participants:
Taste-based discrimination: more likely to vote off targeted group inall rounds
Information-based (statistical) discrimination: more likely to vote offtargeted group in early rounds but less likely in later rounds
Rosburg (ISU) Economic Models of Discrimination Spring 2010 36 / 59
Taste Discrimination Employee/Coworker
Levitt (2004) - Data
All shows aired prior to January 2003
25 prime-time and 136 daytime shows
Blacks overrepresented
Asians and Hispanics underrepresented
Disproportionate share from California
More young than old contestants
Rosburg (ISU) Economic Models of Discrimination Spring 2010 37 / 59
Taste Discrimination Employee/Coworker
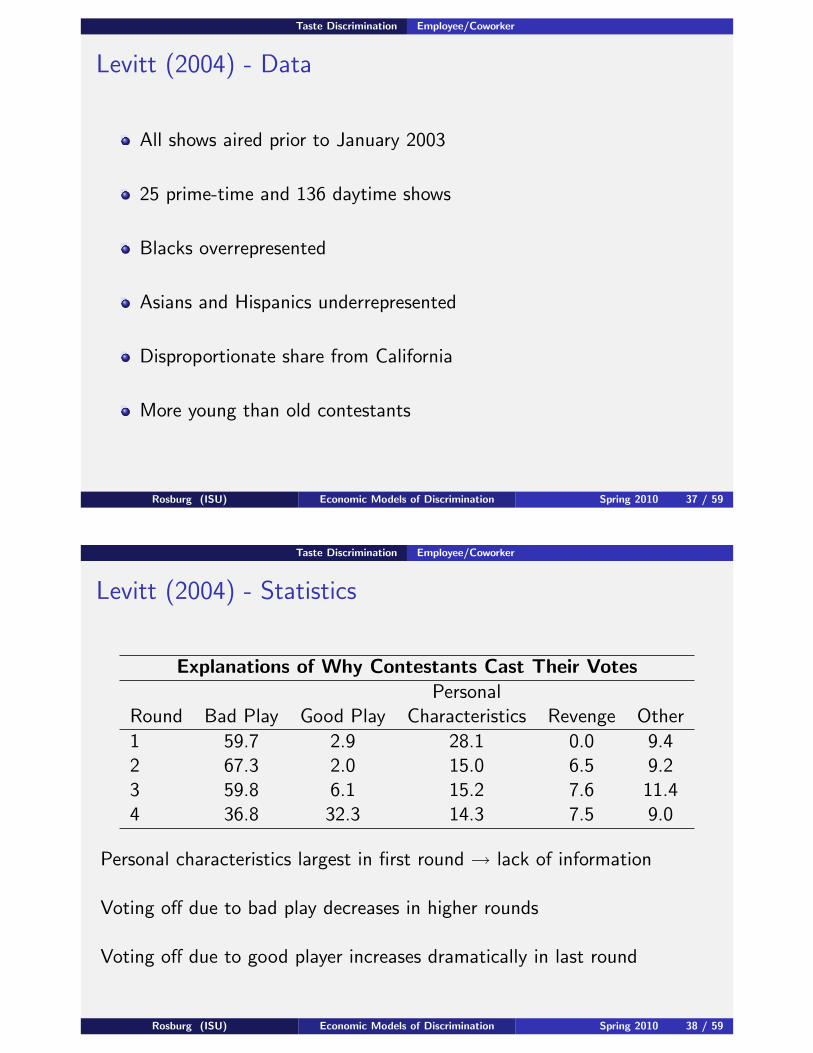
Levitt (2004) - Statistics
Explanations of Why Contestants Cast Their VotesPersonal
Round Bad Play Good Play Characteristics Revenge Other
1 59.7 2.9 28.1 0.0 9.42 67.3 2.0 15.0 6.5 9.23 59.8 6.1 15.2 7.6 11.44 36.8 32.3 14.3 7.5 9.0
Personal characteristics largest in first round → lack of information
Voting off due to bad play decreases in higher rounds
Voting off due to good player increases dramatically in last round
Rosburg (ISU) Economic Models of Discrimination Spring 2010 38 / 59

Taste Discrimination Employee/Coworker
Levitt (2004) - Statistics II
Raw Data on Votes ReceivedRound Male Female White Black Asian Hispanic Age 50+
Early 1.05 0.95 0.98 1.10 0.62 1.29 1.32Middle 1.00 1.00 1.00 0.93 1.24 1.38 1.27Final 1.02 0.98 1.02 0.97 0.83 0.71 1.50
Asians had higher proficiency: expect less votes early and more in laterrounds
Hispanics receive more votes early and less in later rounds: evidence forinformation-based discrimination
Age 50+ receive higher votes in all rounds: evidence for taste-baseddiscrimination
Rosburg (ISU) Economic Models of Discrimination Spring 2010 39 / 59
Taste Discrimination Employee/Coworker
Levitt (2004) - Regression Analysis
Dependent variable: Votes
Expect 1 per round
Independent variables:
Contestant characteristics [race, gender, age, education, residence]
Dynamic variables (performance in previous round)
Dummy variables for rounds and type of show
Rosburg (ISU) Economic Models of Discrimination Spring 2010 40 / 59

Taste Discrimination Employee/Coworker
Levitt (2004) - Regression Results
Confirmation of strategy structure for poor performance
Poor performers receive more votes in early rounds and less in laterounds
Previously good performers get same number of final-round votes aspreviously poor performers (unexpected)
Possible explanations:
Host pressureLack of skill or time to correctly identify strong playersBelief that past performance is not an indicator of future performance
Rosburg (ISU) Economic Models of Discrimination Spring 2010 41 / 59
Taste Discrimination Employee/Coworker
Levitt (2004) - Regression Results II
Revenge motive holds
Participants with Doctorates get fewer votes early and more late
Statistical discrimination?
Average contestant gets 30-40% more votes if Hispanic or above age50
Taste discrimination?
Men vote more for women and vice versa
Taste discrimination?
Rosburg (ISU) Economic Models of Discrimination Spring 2010 42 / 59

Taste Discrimination Employee/Coworker
Levitt (2004) - Model Limitations
Not a market - no choice of whom you interact with
Individuals highly selective and not representative of underlyingpopulation
Entertainment quality large factor in selection process
Televised audience
Participants may withhold racist views
Vote depends on own views but also beliefs about how others will vote
Rosburg (ISU) Economic Models of Discrimination Spring 2010 43 / 59
Taste Discrimination Employee/Coworker
Levitt (2004) - Model Limitations
Revenge effect may cloud discrimination
Host pressure to vote for weakest link
Disproportionate share of participants from California (societaldifferences)
Contestants self-reported personal information (occupation,education, etc.)
Rosburg (ISU) Economic Models of Discrimination Spring 2010 44 / 59

Taste Discrimination Employee/Coworker
Levitt (2004) - Model Limitations and SuggestedCorrections
Rosburg (ISU) Economic Models of Discrimination Spring 2010 45 / 59
Taste Discrimination Customer
Taste Discrimination - Customer
Customer acts as if there exists a non-pecuniary cost associated withpurchasing a good or service from a specific “type” of person (NP)
Non-preferred seller will sell less
Rosburg (ISU) Economic Models of Discrimination Spring 2010 46 / 59

Taste Discrimination Customer
Nardinelli and Simon (1990) - “Customer Racial Discrimination in the
Market for Memorabilia: The Case of Baseball”
Used data on the 1989 price of baseball cards issued in 1970 to examine ifconsumers discriminate based on the race of the player.
Athletics - have direct measures of productivity (ability) that are separatefrom consumer discrimination
Rosburg (ISU) Economic Models of Discrimination Spring 2010 47 / 59
Taste Discrimination Customer
Nardinelli and Simon (1990)
Productivity differences have two sources:
Discrimination
Ability
Typically hard to measureAthletics is one area with ability “measures”
Previous sports analysis has focused on wage differentials
Issues with separating employer, coworker, and customerdiscrimination
Rosburg (ISU) Economic Models of Discrimination Spring 2010 48 / 59

Taste Discrimination Customer
Nardinelli and Simon (1990) - Baseball Card Data
Prices from Beckett’s Official 1989 Price Guide to Baseball Cards
Supply fixed for cards and diminishes over season
Price determinants for baseball cards:
Career performance (primary determinant)Scarcity of card
1970 mint Topps baseball cards priced in 1989
Used each statistic separately rather than single-index
Rosburg (ISU) Economic Models of Discrimination Spring 2010 49 / 59
Taste Discrimination Customer
Nardinelli and Simon (1990) - Baseball Card Data II
Player statistics: Macmillan Baseball Encyclopedia
“Common Player” cards:
Cards at the minimum price that is unrelated to performance
Censored prices
Adjust model to account for data limitation
Rosburg (ISU) Economic Models of Discrimination Spring 2010 50 / 59

Taste Discrimination Customer
Nardinelli and Simon (1990) - Regression
Dependent variable:
log
[price
common card price
]= log(price)− log(common player price)
Independent variables (expected sign):
Hitters:
Hits (+), Doubles (+), Triples (+), Home Runs (+), Walks (+),Stolen Bases (+), At Bates (-), Seasons (-), Postseason games (+),Black (?), Hispanic (?), Position Dummy
Pitchers:
Wins (+), Losses (-), Saves (+), Complete Games (+), Earned Runs(-), Strikeouts (+), Walks (-), Innings pitched (?), Hits (-), Postseasoninnings (+), Black (?), Hispanic (?)
Rosburg (ISU) Economic Models of Discrimination Spring 2010 51 / 59
Taste Discrimination Customer
Nardinelli and Simon (1990) - Regression Results
Card price relative to a white player with comparable ability
Hitters:
Non-white: 10% lessBlack: 6.4% lessHispanics: 17% lessCard price for Black and Hispanic hitters significantly different
Pitchers:
Non-white: 13% lessBlack: 16% lessHispanic: 12% lessCard price for Black and Hispanic pitchers not significantly different
Rosburg (ISU) Economic Models of Discrimination Spring 2010 52 / 59

Taste Discrimination Customer
Nardinelli and Simon (1990) - Regression Results II
Outlier effect?
Do results hold for all levels of ability or are they driven by“superstar” end?
Hitters: same results
Pitchers:
Non-white variable still significant [differ from white player prices]Black and Hispanic variables insignificant (sample size)Preferences for Black versus Hispanic pitchers only visible at superstarend of the market
Effect of being non-white stronger for pitchers
Visibility of pitcher
Rosburg (ISU) Economic Models of Discrimination Spring 2010 53 / 59
Taste Discrimination Customer
Nardinelli and Simon (1990) - Model Limitations
Functional form and choice of explanatory variables may be importantdeterminants of sign and significance of race variables in studies ofdiscrimination
Limitation of baseball card analysis
Small marketNot a commodity purchased by most households
May not be able to completely separate customer discrimination andability measures
Employer or customer discrimination during performance time mayinfluence confidence and performance
Employer discrimination may influence selection
Rosburg (ISU) Economic Models of Discrimination Spring 2010 54 / 59

Taste Discrimination Customer
Nardinelli and Simon (1990) - Model Limitations andSuggested Corrections
Rosburg (ISU) Economic Models of Discrimination Spring 2010 55 / 59
Taste Discrimination Customer
Borjas and Bronars (1989) - “Consumer Discrimination and
Self-Employment”
Develop a (complicated) theoretical model of consumer discrimination
Taste discrimination
Consumers have incomplete information about price of good and raceof seller - must incur cost to obtain information
Used 1980 US Census data to test effect of consumer discrimination andincomplete information on self-employment and salaried employment ofwhite men and minority men
Rosburg (ISU) Economic Models of Discrimination Spring 2010 56 / 59

Taste Discrimination Customer
Borjas and Bronars (1989) - Data
1980 US Census of Population
White, Black, Asian and Hispanic Men employed in non-agriculturalindustries
Clear differences in probability of self-employment and earnings
Summary StatisticsSelf-Employment Self-Employed Salaried
Group Probability Earnings (ln) Earnings (ln)
Whites .118 5.842 5.849Blacks .045 5.371 5.466Hispanics .070 5.558 5.465Asians .119 5.792 5.646
Rosburg (ISU) Economic Models of Discrimination Spring 2010 57 / 59
Taste Discrimination Customer
Borjas and Bronars (1989) - Results
Lower earnings for self-employed minority men relative toself-employed white men
Smaller gains to self-employment for able minority men relative toable white men
Minorities have much lower incentive to become self-employed
Able minority men more likely to select into salary jobs
Able white men more likely to select into self-employment
Rosburg (ISU) Economic Models of Discrimination Spring 2010 58 / 59

Taste Discrimination Customer
Readings for Next Section
Statistical Discrimination:
Aigner and Cain (1977) [175-180 only]
Pinkston (2006)
Ladd (1998)
Rosburg (ISU) Economic Models of Discrimination Spring 2010 59 / 59