Embed Size (px)
Citation preview

Economic Indicatorsfor Greater Cheyenne
Wyoming Center for Business & Economic Analysis, Inc.1720 Carey Ave., Suite 520
Cheyenne, WY 82001(307) 632-1347
Volume XXIV, Number 4December 2008
TABLE OF CONTENTS
FRONT MATTER Preface ................................................................................................................. ii
ECONOMIC ANALYSIS Economic Indicators Analysis ............................................................................. 1 Data Tables ......................................................................................................... 3 Cheyenne/Laramie County Profile ......................................................................13 Economic Indicator Graphs .................................................................................15 Data Sources ......................................................................................................22
Editor ........................................................................................................................................... R.T. O’GaraResearch Assistance ............................................................................................................. Cynthia BranchTypography .................................................................................................................. Stacy L. Shultz-BissetPrinting ..............................................................................................................................................CopyCo
For your free subscription, please see the last page.
The articles appearing in this publication represent the opinions of the authors and do not necessarily reflect the views of funding agencies and organizations. Duplication or quotation of material in this publication is welcomed, but it is requested that the Center be credited.
CommuniCations Data Center Phone: (307) 632-1347 Data Center FAX: (307) 632-1368 Editor e-mail: [email protected] Web Site: www.wyomingeconomicdata.com Mailing Address: Wyoming Center for Business & Economic Analysis, Inc. 1720 Carey Ave., Suite 520 Cheyenne, WY 82001

(ii)
PrEFACE
If you would like to receive future issues of this publication, please detach the last page, complete it, and return it to the Wyoming Center for Business & Economic Analysis, Inc. There is NO CHARGE for this publication.
Also this publication can be found in PDF form on the WCBEA’s website (www.wyomingeconomicdata.com).
THE CENTER’S STAFF SINCERELY APPRECIATES THE CONTINUING AND PAST COOPERATION OF THE DATA SOURCES LISTED IN THE BIBLIOGRAPHY.
1
ECONOMIC INDICATOrS
ANALYSIS
The Greater Cheyenne Economy
VS.
The 2008/2009 RecessionOur standard quarterly analysis was suspended for this issue of the Economic Indicators in order to focus on the potential repercussions that will surely befall Cheyenne’s economy in coming months as the looming national reces-sion gains strength and momentum.
In early 2008, it was forecasted that the local economy would slow as 2008 proceeded and that by the third quarter the national economy would be in recession. Both events have come to pass. What was not foreseen was the unexpected implosion of national and global credit and financial markets. The shear size and velocity of this monetary crisis has added such a serious element in the last eight weeks to the recessionary environment that it guarantees this recession will be anything but a run of the mill recession. Dire predictions of the magnitude of the recession abound and so we will pass on adding to the list. There is, however, one salient fact that needs greater dissemination in regards to the current economic crisis. It is the fact this is the first time since the Great Depression that American households have faced the problem of a simultaneous decline in both housing values and earning paper assets. In 1932, the trough of that event, homes values had fallen by 10.5 percent in nominal dollars. By second quarter of 2008, homes in the U.S. had dropped by 18 percent in real dollars and then within a few short months thereafter, households watched the value of their financial (paper) wealth plummet. The latter event is fairly typical of past recessions with just varying levels of magnitude. The point, however, is from this dual loss springs the critical impetus for policy makers to stop the slide in housing values. One does not want to ponder potential outcomes should this goal not be met swiftly and successfully.
So how is the greater Cheyenne economy going to fair as the national recession ramps up and gains traction? Overall, it should fair better than other comparable cities due to its dependence upon government employment (inherently stable, if not somewhat counter-cyclical) which accounts for
30 percent of all jobs, and its lack of a manufacturing base and export dependant firms which are both pro-cyclical. Second, we expect to see the negative impacts from the national recession to hit the Cheyenne economy on a lagged basis (late 2Q09 and early 3Q09) because most of these impacts will be tied to the loss and stagnation in local household net wealth (the wealth effect), not due to large losses in jobs and wages.
Let’s take a brief look at how it has done thus far in 2008. New job creation, the critical measure of any economy’s economic health, during 2007 averaged 3.0 percent. Fourth quarter 2007 job growth was at a blistering rate of 3.7 percent while first quarter 2008 saw it decrease to 2.8 percent. Also the average weekly wage in Laramie County rose 4.9 percent during the first quarter. However, by third quarter 2008, job growth had fallen to 1.6 percent! Expect the rate of new job creation to fall for the balance of 2008 and well into 2009. Keep in mind, our local economy is still adding jobs, not losing them. On the optimistic upside, the local economy may eek out a 0.5 percent positive growth rate in new jobs though 2009. Thank the health care and government sectors if this occurs. The current slowdown in job growth can be attributed to the sharp drop in new commercial and residential construction, off by 24 percent and 31 percent respectively when compared to 2007. On the more pessimistic side, job creation could easily hit zero growth or go negative maybe by as much as 1 percent to 1.5 percent by late 2009. There will be local job losses by those firms tied to national markets such as the railroads, distribution centers, home building, trucking and oil related activities. If this is as far down as it goes, then again consider it good news given the 2009 projections for job losses at the national level.
Through the end of the third quarter, it appeared that local consumers had not started to cut back significantly on spending. Total spending, as measured by taxable sales (Table 1), had increased 7 percent over third quarter 2007. However, it is unrealistic to expect spending not to decrease in the fourth quarter as local households begin to fully digest the size of the losses in their financial net worth coupled with the realization that housing values will not be appreciating in 2008 and 2009. This is standard consumer

behavior, as people feel less wealthy, they will begin to adjust their consumption downwards. Expect holiday sales to be weak and to follow national trends. Projections for national retail spending for the holiday period range from a decline of 2 percent to positive gain of 0.6 percent. For the past 10 years, holiday spending had risen by 4.4 percent per year by comparison. Since the local economy has not yet experienced large job and personal income losses, we think local holiday sales will beat national forecasts by a few percentage points, up by 1 to 2 percent, but still nothing to cheer about. Local department stores sales may gain 1 percent, discount stores up by 5.5 percent, drug stores up by 4 to 5 percent and restaurants up by 2.2 percent. The most recent data for retail sales in Laramie County (2007/2008 fiscal year) showed an overall increase of 4.3 percent from the previous fiscal year.
LArAMIE COUNTY’S GrOSS DOMESTIC PrODUCTThe Bureau of Economic Analysis (BEA) released updated estimates of local gross domestic products (GDP) for Metropolitan Statistical Areas (MSA) throughout the United States in late September. Table A. presents these statistics for Laramie County plus Real Per Capita Income data. Local area GDP statistics have long been needed because they provide a very good singular and comprehensive measure of economic growth for the county’s economy.
GDP figures for a metropolitan area are sub-state counterparts to the nation’s GDP which is the best known and most comprehensive measure of the nation’s economic performance. GDP measures the final dollar value of all goods and services produced by an economic system within a specified time period.
The GDP figures below covered years 2001 through 2006 and obviously lag by two years. These are real dollar estimates which mean inflation has been removed. In 2001, local GDP was $2.745 billion dollars and by 2006, it had grown to $3.308 billion dollars. The greater Cheyenne
economy increased by 20.5 percent over this five year period and more importantly, it grew at an astounding and yet unsustainable rate of 8.2 percent between 2005 and 2006. On average the local economy grew at a 3.8 percent rate over the last six years. The average rate of growth unadjusted for inflation over this period was 6.6 percent.
Cheyenne was the 11th fastest growing metropolitan area out of 363 in the nation in 2006. Casper, by comparison, was the 38th fastest growing metro. Further, the Leisure and Hospitality sector accounted for 2.99 percent of the reported 8.2 percent growth rate while the Transportation and Utilities sector contributed another 2.78 percent.
Real per capita GDP was $38,538 in 2006 as compared to $33,312 in 2001, up 15.7 percent over the period. It rose 7.7 percent between 2005 and 2006. The Bridgeport-Stamford-Norwalk, Connecticut metropolitan area’s per capita GDP was the highest in the nation at $78,944 and the McAllen-Edinburg-Mission, Texas metropolitan area’s per capita GDP was the lowest at $14,900. The national average for all metros was $41,510 which meant Cheyenne’s per capita GDP was in 2006 was 7.2 percent below the national level.
TABLE A.
Laramie CountyGross Domestic Product
(2001 – 2006)
YEAr rEAL GDP % ChANGErEAL
PEr CAPITA GDP
2001 2,745 — 33,3122002 2,874 4.7 34,5602003 2,957 2.9 35,0592004 2,967 3.4 34,7962005 3,056 3.0 35,7922006 3,308 8.2 38,538
November 24, 2008

3
TABLE 1
A 3Q06
B 3Q07
C 2Q08
D 3Q08
PErCENTAGE ChANGE A TO D
PErCENTAGE ChANGE B TO D
PErCENTAGE ChANGE C TO D
EMPLOYMENT*
Total Civilian Labor Force (LAUS)
41,860 42,022 42,216 42,432 1.37 0.97 0.51
Total Employment (LAUS) 40,340 40,699 40,721 40,780 1.09 0.20 0.14
Total Employment (CES ) 43,167 44,700 45,233 45,367 5.10 1.49 0.29
Total Unemployment (LAUS) 1,520 1,323 1,496 1,652 8.68 24.87 10.45
Unemployment Rate (LAUS) 3.6% 3.1% 3.5% 3.9% 7.17 23.65 9.84
Initial Unemployment Claims 45 43 44 45 0.75 5.47 1.50
Help Wanted Ads 193 210 133 131 -32.25 -37.71 -1.59
GENErAL BUSINESS ACTIVITY
Auto Registrations New & Used 3,255 3,215 3,220 3,164 -2.79 -1.58 -1.74
Enplanements - Cheyenne Airport
1,362 1,547 1,485 1,254 -7.93 -18.96 -15.56
Total Taxable Sales ($000) 421,419 427,150 379,054 456,842 8.41 6.95 20.52
Bankruptcies 16 18 17 23 41.67 25.93 33.33
CONSTrUCTION
Single Fam Bldg Permits - Chey 68 59 37 40 -41.18 -32.20 8.11
Single Fam Bldg Permits - LarCo 50 29 30 15 -70.00 -48.28 -50.00
Total Bldg Permits - (Chey) (a) 196 149 136 144 -26.83 -3.58 5.64
Septic Permits - (Rural) 21 13 15 18 -15.63 38.46 20.00
Value of Authorized Construction ($000)
10,226 20,406 11,573 31,288 205.95 53.33 170.34
Residential ($000) 3,830 3,042 1,968 2,110 -44.92 -30.65 7.23
* Labor statistics are compiled from two major sources: Current Population Survey (CPS) and Current Employment Sta-tistics (CES). Local Area Unemployment Statistics (LAUS) are estimated based on CPS data which is collected through household surveys which individuals are reported as employed, unemployed or not in the labor force. This data includes employment for both agriculture and nonagricultural industries. CES data is based on establishment records compiled through monthly surveys of nonfarm employers. Individuals who worked in more than one establishment, full or part-time, are counted each time their names appear on payrolls.
(a) Data includes building and non-building.
Note: Total Taxable Sales ($000) are a total of figures for three months.
All other figures reported under Employment and General Business Activity are the monthly average for the quarter.
Single Family Building Permits are a total of the figures for three months.
All other construction figures are the monthly average for the quarter.

4
TABLE 1 A
housing ProfileLaramie County2007Authorized Construction by Permit
housing ProfileLaramie County2008Authorized Construction by Permit
MONTh SFU DUPLEXUNITS
TrI & FOUrPLEX
MULTI-FAMILY
TOTALUNITS MONTh SFU DUPLEX
UNITS
TrI & FOUrPLEX
MULTI-FAMILY
TOTALUNITS
January 13 0 0 0 13 January 10 0 0 0 10
February 18 0 0 0 18 February 18 0 8 0 26
March 29 0 0 0 29 March 30 0 16 0 46
April 48 0 0 0 48 April 19 0 8 0 27
May 33 0 0 0 33 May 23 0 0 0 23
June 29 0 0 0 29 June 25 0 0 0 25
July 31 0 0 0 31 July 25 0 0 0 25
August 34 0 0 0 34 August 10 0 0 0 10
September 23 0 0 0 23 September 20 0 8 0 28
October 17 0 0 0 17 October 0
November 27 0 0 0 27 November 0
December 19 0 0 0 19 December 0
Year to Date 321 0 0 0 321 Year to Date 180 0 40 0 220
5
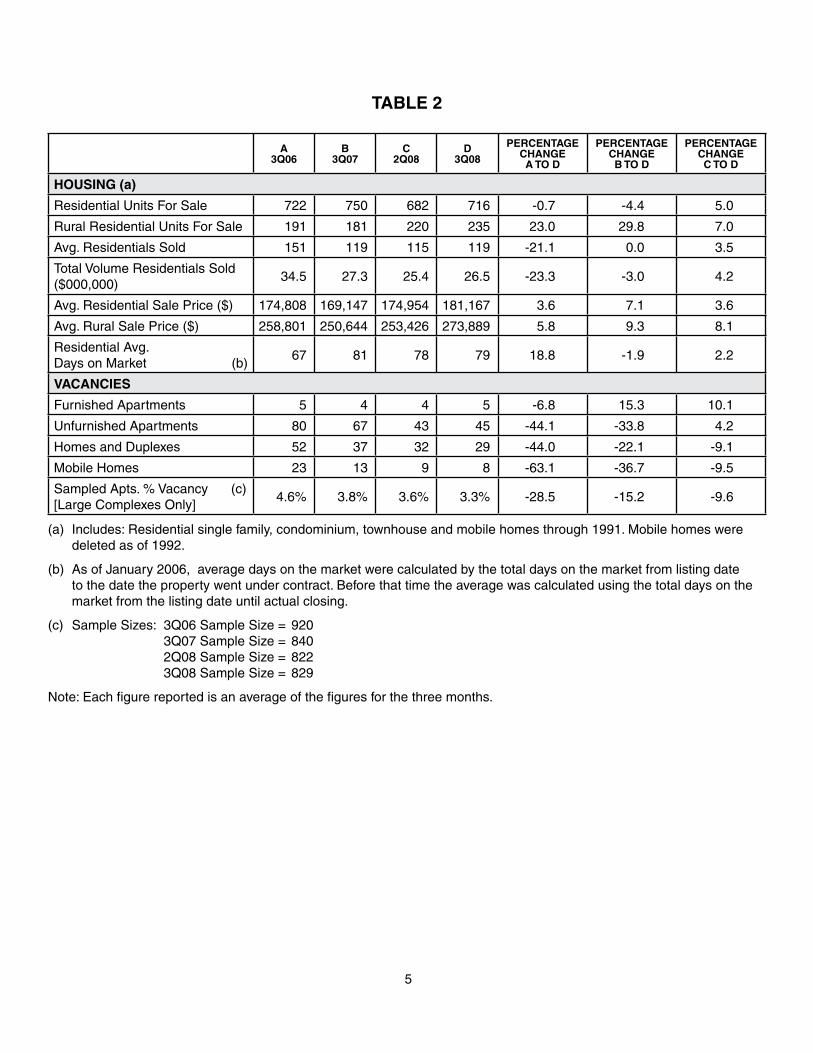
TABLE 2
A 3Q06
B 3Q07
C 2Q08
D 3Q08
PErCENTAGEChANGEA TO D
PErCENTAGEChANGEB TO D
PErCENTAGEChANGEC TO D
hOUSING (a)
Residential Units For Sale 722 750 682 716 -0.7 -4.4 5.0
Rural Residential Units For Sale 191 181 220 235 23.0 29.8 7.0
Avg. Residentials Sold 151 119 115 119 -21.1 0.0 3.5
Total Volume Residentials Sold ($000,000)
34.5 27.3 25.4 26.5 -23.3 -3.0 4.2
Avg. Residential Sale Price ($) 174,808 169,147 174,954 181,167 3.6 7.1 3.6
Avg. Rural Sale Price ($) 258,801 250,644 253,426 273,889 5.8 9.3 8.1
Residential Avg. Days on Market (b)
67 81 78 79 18.8 -1.9 2.2
VACANCIES
Furnished Apartments 5 4 4 5 -6.8 15.3 10.1
Unfurnished Apartments 80 67 43 45 -44.1 -33.8 4.2
Homes and Duplexes 52 37 32 29 -44.0 -22.1 -9.1
Mobile Homes 23 13 9 8 -63.1 -36.7 -9.5
Sampled Apts. % Vacancy (c) [Large Complexes Only]
4.6% 3.8% 3.6% 3.3% -28.5 -15.2 -9.6
(a) Includes: Residential single family, condominium, townhouse and mobile homes through 1991. Mobile homes were deleted as of 1992.
(b) As of January 2006, average days on the market were calculated by the total days on the market from listing date to the date the property went under contract. Before that time the average was calculated using the total days on the market from the listing date until actual closing.
(c) Sample Sizes: 3Q06 Sample Size = 920 3Q07 Sample Size = 840 2Q08 Sample Size = 822 3Q08 Sample Size = 829
Note: Each figure reported is an average of the figures for the three months.
6
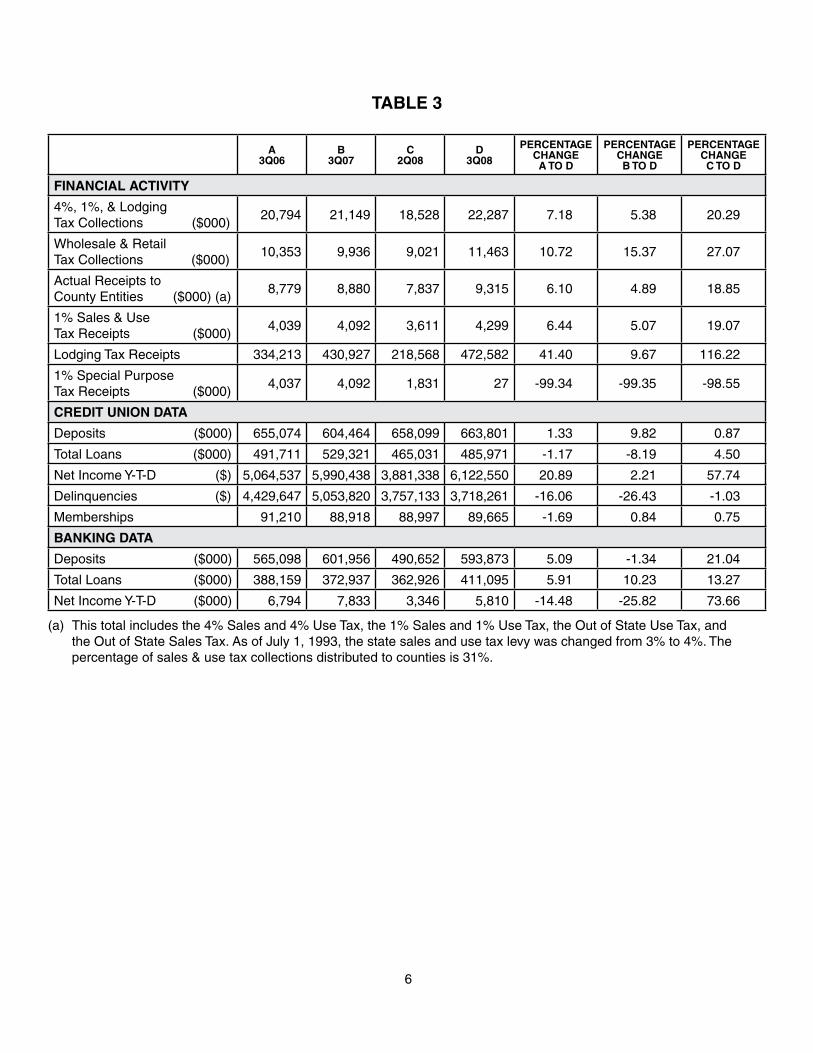
TABLE 3
A 3Q06
B 3Q07
C 2Q08
D 3Q08
PErCENTAGE ChANGE A TO D
PErCENTAGE ChANGE B TO D
PErCENTAGEChANGE C TO D
FINANCIAL ACTIVITY
4%, 1%, & Lodging Tax Collections ($000)
20,794 21,149 18,528 22,287 7.18 5.38 20.29
Wholesale & Retail Tax Collections ($000)
10,353 9,936 9,021 11,463 10.72 15.37 27.07
Actual Receipts to County Entities ($000) (a)
8,779 8,880 7,837 9,315 6.10 4.89 18.85
1% Sales & Use Tax Receipts ($000)
4,039 4,092 3,611 4,299 6.44 5.07 19.07
Lodging Tax Receipts 334,213 430,927 218,568 472,582 41.40 9.67 116.22
1% Special Purpose Tax Receipts ($000)
4,037 4,092 1,831 27 -99.34 -99.35 -98.55
CrEDIT UNION DATA
Deposits ($000) 655,074 604,464 658,099 663,801 1.33 9.82 0.87
Total Loans ($000) 491,711 529,321 465,031 485,971 -1.17 -8.19 4.50
Net Income Y-T-D ($) 5,064,537 5,990,438 3,881,338 6,122,550 20.89 2.21 57.74
Delinquencies ($) 4,429,647 5,053,820 3,757,133 3,718,261 -16.06 -26.43 -1.03
Memberships 91,210 88,918 88,997 89,665 -1.69 0.84 0.75
BANKING DATA
Deposits ($000) 565,098 601,956 490,652 593,873 5.09 -1.34 21.04
Total Loans ($000) 388,159 372,937 362,926 411,095 5.91 10.23 13.27
Net Income Y-T-D ($000) 6,794 7,833 3,346 5,810 -14.48 -25.82 73.66
(a) This total includes the 4% Sales and 4% Use Tax, the 1% Sales and 1% Use Tax, the Out of State Use Tax, and the Out of State Sales Tax. As of July 1, 1993, the state sales and use tax levy was changed from 3% to 4%. The percentage of sales & use tax collections distributed to counties is 31%.
7
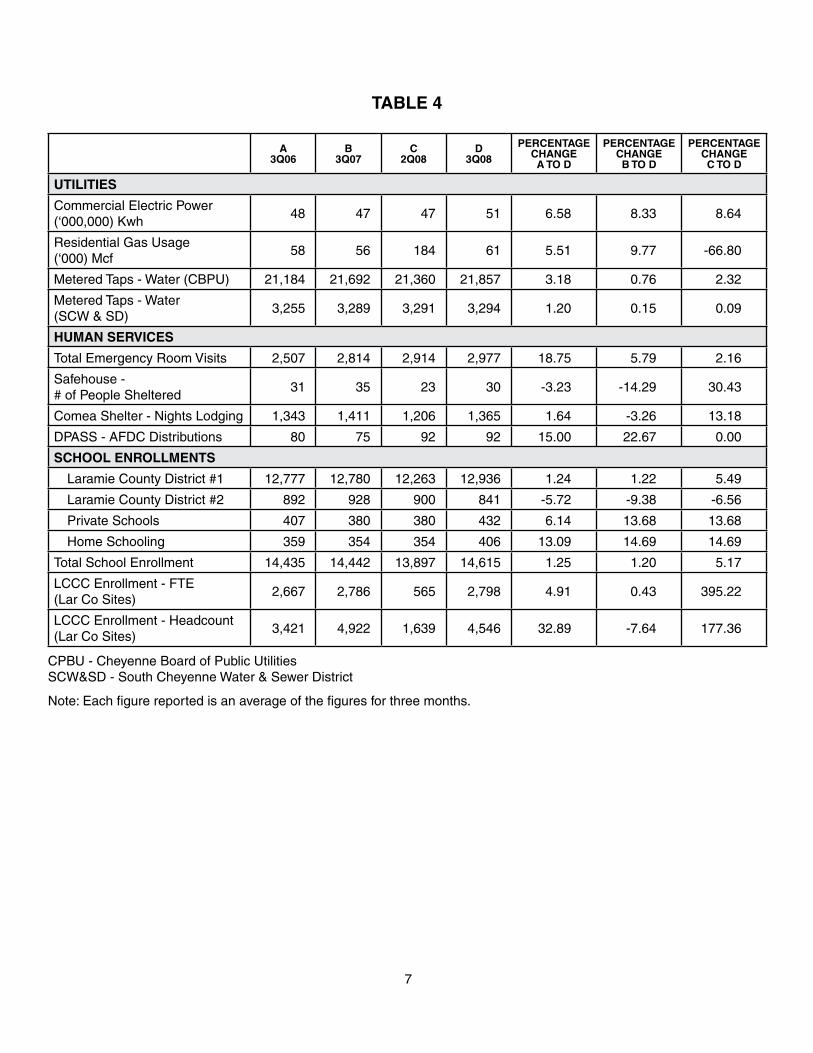
TABLE 4
A 3Q06
B 3Q07
C 2Q08
D 3Q08
PErCENTAGEChANGEA TO D
PErCENTAGEChANGEB TO D
PErCENTAGEChANGEC TO D
UTILITIES
Commercial Electric Power (‘000,000) Kwh
48 47 47 51 6.58 8.33 8.64
Residential Gas Usage (‘000) Mcf
58 56 184 61 5.51 9.77 -66.80
Metered Taps - Water (CBPU) 21,184 21,692 21,360 21,857 3.18 0.76 2.32
Metered Taps - Water (SCW & SD)
3,255 3,289 3,291 3,294 1.20 0.15 0.09
hUMAN SErVICES
Total Emergency Room Visits 2,507 2,814 2,914 2,977 18.75 5.79 2.16
Safehouse - # of People Sheltered
31 35 23 30 -3.23 -14.29 30.43
Comea Shelter - Nights Lodging 1,343 1,411 1,206 1,365 1.64 -3.26 13.18
DPASS - AFDC Distributions 80 75 92 92 15.00 22.67 0.00
SChOOL ENrOLLMENTS
Laramie County District #1 12,777 12,780 12,263 12,936 1.24 1.22 5.49
Laramie County District #2 892 928 900 841 -5.72 -9.38 -6.56
Private Schools 407 380 380 432 6.14 13.68 13.68
Home Schooling 359 354 354 406 13.09 14.69 14.69
Total School Enrollment 14,435 14,442 13,897 14,615 1.25 1.20 5.17
LCCC Enrollment - FTE (Lar Co Sites)
2,667 2,786 565 2,798 4.91 0.43 395.22
LCCC Enrollment - Headcount (Lar Co Sites)
3,421 4,922 1,639 4,546 32.89 -7.64 177.36
CPBU - Cheyenne Board of Public Utilities SCW&SD - South Cheyenne Water & Sewer District
Note: Each figure reported is an average of the figures for three months.
8
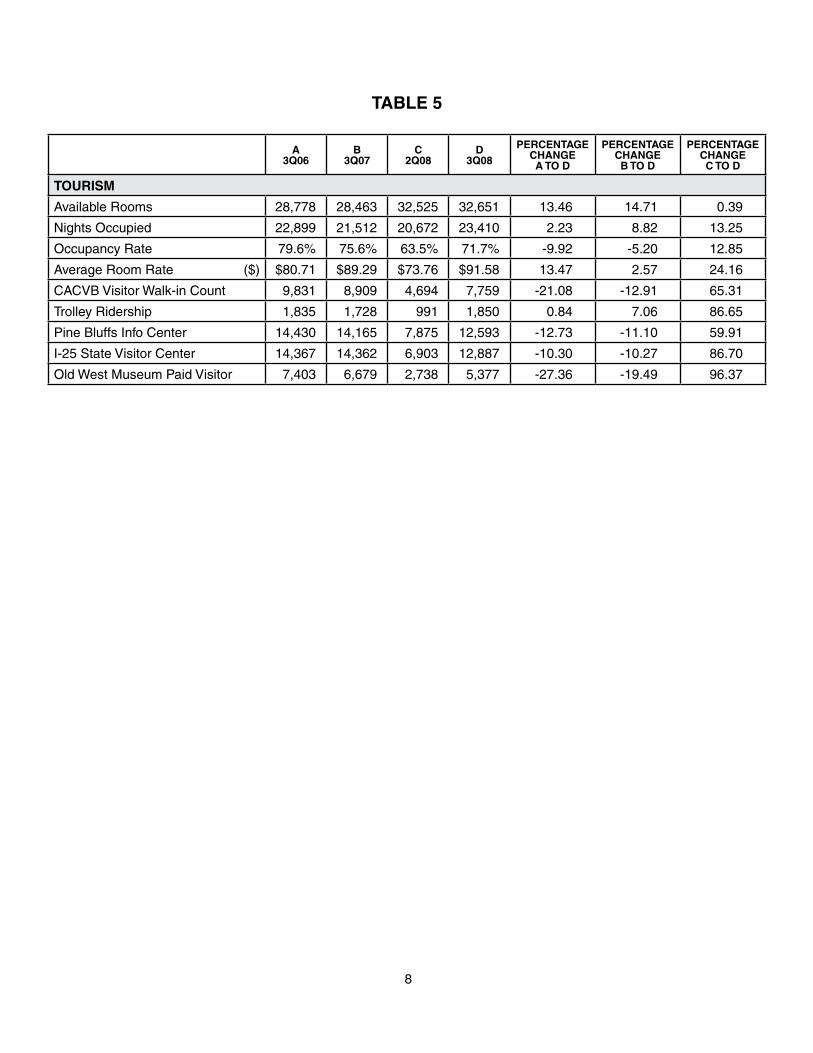
TABLE 5
A 3Q06
B 3Q07
C 2Q08
D 3Q08
PErCENTAGEChANGEA TO D
PErCENTAGEChANGEB TO D
PErCENTAGEChANGEC TO D
TOUrISM
Available Rooms 28,778 28,463 32,525 32,651 13.46 14.71 0.39
Nights Occupied 22,899 21,512 20,672 23,410 2.23 8.82 13.25
Occupancy Rate 79.6% 75.6% 63.5% 71.7% -9.92 -5.20 12.85
Average Room Rate ($) $80.71 $89.29 $73.76 $91.58 13.47 2.57 24.16
CACVB Visitor Walk-in Count 9,831 8,909 4,694 7,759 -21.08 -12.91 65.31
Trolley Ridership 1,835 1,728 991 1,850 0.84 7.06 86.65
Pine Bluffs Info Center 14,430 14,165 7,875 12,593 -12.73 -11.10 59.91
I-25 State Visitor Center 14,367 14,362 6,903 12,887 -10.30 -10.27 86.70
Old West Museum Paid Visitor 7,403 6,679 2,738 5,377 -27.36 -19.49 96.37

9
TAB
LE
6
JAN
FE
BM
Ar
AP
rM
AY
JUN
JUL
AU
GS
EP
OC
TN
OV
DE
CA
VG
YE
Ar
EM
PL
OY
ME
NT
*
Tota
l Civ
ilian
Lab
or
For
ce (
LAU
S)
41,9
3541
,848
42,0
0542
,062
41,8
0541
,932
42,4
4341
,815
41,8
0942
,248
42,8
2242
,685
42,1
1720
07
42,3
3642
,618
42,9
3242
,325
41,8
8742
,437
43,0
4542
,521
41,7
2942
,426
2008
Tota
l Em
ploy
men
t (L
AU
S)
39,8
0139
,987
40,1
4140
,463
40,2
7940
,437
41,0
0440
,515
40,5
7940
,990
41,3
7840
,723
40,5
2520
07
40,3
2940
,834
40,9
8740
,914
40,3
9240
,856
41,3
8840
,714
40,2
3740
,739
2008
Tota
l Em
ploy
men
t (C
ES
)42
,400
42,9
0043
,200
43,4
0044
,400
45,0
0044
,600
44,6
0044
,900
44,8
0044
,900
45,0
0044
,175
2007
43,8
0044
,100
44,4
0044
,400
45,2
0046
,100
45,7
0045
,400
45,0
0044
,900
2008
Tota
l Une
mpl
oym
ent
(LA
US
)2,
134
1,86
11,
864
1,59
91,
526
1,49
51,
439
1,30
01,
230
1,25
81,
444
1,96
21,
593
2007
2,00
71,
784
1,94
51,
411
1,49
51,
581
1,65
71,
807
1,49
21,
687
2008
Une
mpl
oym
ent R
ate
(LA
US
)5.
1%4.
4%4.
4%3.
8%3.
7%3.
6%3.
4%3.
1%2.
9%3.
0%3.
4%4.
6%0
2007
4.7%
4.2%
4.5%
3.3%
3.6%
3.7%
3.8%
4.2%
3.6%
020
08
Initi
al U
nem
ploy
men
t C
laim
s13
656
4355
4061
5531
4248
5510
861
2007
140
6264
4939
4557
3444
5920
08
Hel
p W
ante
d A
ds13
715
118
619
022
321
322
623
516
916
513
711
517
920
07
113
136
111
116
122
161
137
135
121
128
2008
GE
NE
rA
L B
US
INE
SS
AC
TIV
ITY
Aut
o R
egis
trat
ions
2,63
22,
707
3,20
33,
001
3,56
43,
391
3,22
63,
587
2,83
13,
346
2,72
32,
031
3,02
020
07
2,77
92,
848
2,99
73,
137
3,30
93,
214
3,31
73,
102
3,07
33,
086
2008
Enp
lane
men
ts -
C
hey.
Air
port
1,25
41,
188
1,25
41,
320
1,40
91,
421
1,55
81,
589
1,49
51,
620
1,38
91,
391
1,40
720
07
1,31
11,
381
1,40
21,
311
1,35
91,
785
1,50
31,
154
1,10
51,
368
2008
Tota
l Tax
able
Sal
es
($)
131,9
04,47
512
4,071
,475
107,3
89,83
612
0,112
,440
131,1
60,49
911
9,806
,351
148,1
76,01
715
1,218
,867
127,7
54,75
415
0,814
,015
137,0
76,80
912
8,228
,237
131,4
76,14
820
07
130,5
18,39
113
3,339
,338
117,3
68,12
011
6,640
,404
133,8
43,31
412
8,570
,463
134,7
90,80
115
5,681
,222
166,3
69,87
013
5,235
,769
2008
Ban
krup
tcie
s10
1421
2118
2415
2415
1726
1018
2007
916
2220
1516
2923
1618
2008
* La
bor
stat
istic
s ar
e co
mpi
led
from
two
maj
or s
ourc
es: C
urre
nt P
opul
atio
n S
urve
y (C
PS
) an
d C
urre
nt E
mpl
oym
ent S
tatis
tics
(CE
S).
Loca
l Are
a U
nem
ploy
men
t Sta
tistic
s (L
AU
S)
are
estim
ated
bas
ed o
n C
PS
dat
a w
hich
is c
olle
cted
thro
ugh
hous
ehol
d su
rvey
s w
hich
indi
vidu
als
are
repo
rted
as
em
ploy
ed, u
nem
ploy
ed o
r no
t in
the
labo
r fo
rce.
Thi
s da
ta in
clud
es e
mpl
oym
ent f
or b
oth
agric
ultu
re a
nd n
onag
ricul
tura
l ind
ustr
ies.
CE
S d
ata
is
base
d on
est
ablis
hmen
t rec
ords
com
pile
d th
roug
h m
onth
ly s
urve
ys o
f non
farm
em
ploy
ers.
Indi
vidu
als
who
wor
ked
in m
ore
than
one
est
ablis
hmen
t, fu
ll or
par
t-tim
e, a
re c
ount
ed e
ach
time
thei
r na
mes
app
ear
on p
ayro
lls.
10
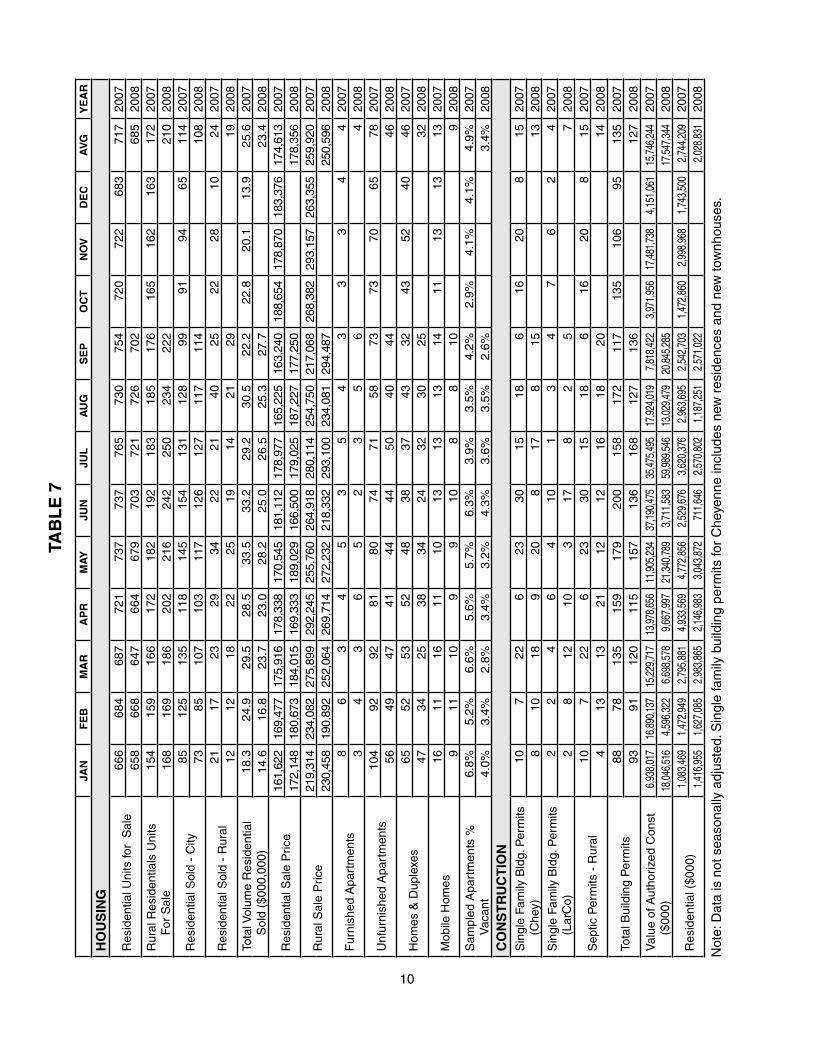
TAB
LE
7
JAN
FE
BM
Ar
AP
rM
AY
JUN
JUL
AU
GS
EP
OC
TN
OV
DE
CA
VG
YE
Ar
hO
US
ING
Res
iden
tial U
nits
for
Sal
e66
668
468
772
173
773
776
573
075
472
072
268
371
720
0765
866
864
766
467
970
372
172
670
268
520
08R
ural
Res
iden
tials
Uni
ts
For
Sal
e15
415
916
617
218
219
218
318
517
616
516
216
317
220
0716
816
918
620
221
624
225
023
422
221
020
08
Res
iden
tial S
old
- C
ity85
125
135
118
145
154
131
128
9991
9465
114
2007
7385
107
103
117
126
127
117
114
108
2008
Res
iden
tial S
old
- R
ural
2117
2329
3422
2140
2522
2810
2420
0712
1218
2225
1914
2129
1920
08To
tal V
olum
e R
esid
entia
l S
old
($00
0,00
0)18
.324
.929
.528
.533
.533
.229
.230
.522
.222
.820
.113
.925
.620
0714
.616
.823
.723
.028
.225
.026
.525
.327
.723
.420
08
Res
iden
tial S
ale
Pric
e16
1,62
216
9,47
717
5,91
617
8,33
817
0,54
518
1,11
217
8,97
716
5,22
516
3,24
018
8,65
417
8,87
018
3,37
617
4,61
320
0717
2,14
818
0,67
318
4,01
516
9,33
318
9,02
916
6,50
017
9,02
518
7,22
717
7,25
017
8,35
620
08
Rur
al S
ale
Pric
e21
9,31
423
4,08
227
5,89
929
2,24
525
5,76
026
4,91
828
0,11
425
4,75
021
7,06
826
8,38
229
3,15
726
3,35
525
9,92
020
0723
0,45
819
0,89
225
2,06
426
9,71
427
2,23
221
8,33
229
3,10
023
4,08
129
4,48
725
0,59
620
08
Fur
nish
ed A
part
men
ts8
63
45
35
43
33
44
2007
34
36
52
35
64
2008
Unf
urni
shed
Apa
rtm
ents
104
9292
8180
7471
5873
7370
6578
2007
5649
4741
4444
5040
4446
2008
Hom
es &
Dup
lexe
s65
5253
5248
3837
4332
4352
4046
2007
4734
2538
3424
3230
2532
2008
Mob
ile H
omes
1611
1611
1013
1313
1411
1313
1320
079
1110
99
108
810
920
08S
ampl
ed A
part
men
ts %
V
acan
t6.
8%5.
2%6.
6%5.
6%5.
7%6.
3%3.
9%3.
5%4.
2%2.
9%4.
1%4.
1%4.
9%20
074.
0%3.
4%2.
8%3.
4%3.
2%4.
3%3.
6%3.
5%2.
6%3.
4%20
08C
ON
ST
rU
CT
ION
Sin
gle
Fam
ily B
ldg.
Per
mits
(C
hey)
107
226
2330
1518
616
208
1520
078
1018
920
817
815
1320
08S
ingl
e Fa
mily
Bld
g. P
erm
its
(Lar
Co)
22
46
410
13
47
62
420
072
812
103
178
25
720
08
Sep
tic P
erm
its -
Rur
al10
722
623
3015
186
1620
815
2007
413
1321
1212
1618
2014
2008
Tota
l Bui
ldin
g P
erm
its88
7813
515
917
920
015
817
211
713
510
695
135
2007
9391
120
115
157
136
168
127
136
127
2008
Val
ue o
f Aut
horiz
ed C
onst
($
000)
6,93
8,01
716
,890,1
3715
,229,7
1713
,978,6
5611
,905,2
3437
,190,4
7535
,475,4
9517
,924,0
197,
818,
422
3,97
1,95
617
,481,7
384,
151,
061
15,74
6,244
2007
18,04
6,516
4,59
6,32
26,
698,
578
9,66
7,99
721
,340,7
893,
711,
583
59,98
9,546
13,02
9,479
20,84
5,285
17,54
7,344
2008
Res
iden
tial (
$000
)1,
083,
469
1,47
2,94
92,
795,
881
4,93
3,56
94,
772,
856
2,52
9,67
63,
620,
376
2,96
3,69
52,
542,
703
1,47
2,86
02,
998,
968
1,74
3,50
02,
744,
209
2007
1,41
6,95
51,
627,
085
2,98
3,86
52,
146,
983
3,04
3,87
271
1,64
62,
570,
802
1,18
7,25
12,
571,
022
2,02
8,83
120
08
Not
e: D
ata
is n
ot s
easo
nally
adj
uste
d. S
ingl
e fa
mily
bui
ldin
g pe
rmits
for
Che
yenn
e in
clud
es n
ew r
esid
ence
s an
d ne
w to
wnh
ouse
s.

11
TAB
LE
8
JAN
FE
BM
Ar
AP
rM
AY
JUN
JUL
AU
GS
EP
OC
TN
OV
DE
CA
VG
YE
Ar
UT
ILIT
IES
Com
mer
cial
Ele
ctric
Pow
er
(Kw
h) (
‘0,0
00)
4,61
54,
680
4,25
44,
398
4,09
14,
566
5,06
74,
254
4,84
64,
612
4,84
44,
254
4,54
020
07
4,96
24,
828
4,71
44,
695
4,75
74,
674
5,31
85,
264
4,76
44,
886
2008
Res
iden
tial G
as U
sage
(M
cf)
(‘000
)4,
134
3,81
03,
030
2,29
31,
562
928
579
532
562
1,05
61,
915
3,41
01,
984
2007
4,72
13,
999
3,36
12,
690
1,81
01,
030
627
536
672
2,16
120
08
Met
ered
Wat
er T
aps
(CB
PU
)21
,438
21,4
5321
,460
21,4
8521
,585
21,5
9321
,651
21,7
4321
,682
21,7
6121
,692
21,6
5721
,600
2007
21,6
6121
,671
21,6
8821
,332
21,3
4821
,401
21,8
3721
,859
21,8
7421
,630
2008
Met
ered
Wat
er T
aps
(SC
W &
SD
)3,
267
3,27
23,
274
3,27
93,
286
3,28
83,
289
3,28
93,
289
3,29
03,
290
3,29
03,
284
2007
3,29
03,
290
3,29
03,
291
3,29
13,
291
3,29
33,
293
3,29
63,
292
2008
hU
MA
N S
Er
VIC
ES
Tota
l Em
erge
ncy
Roo
m
Vis
its2,
480
2,38
02,
590
2,56
22,
494
2,49
72,
756
2,90
22,
785
2,72
22,
627
2,72
52,
627
2007
1,14
91,
061
1,19
21,
115
1,03
11,
026
1,07
41,
075
1,01
11,
082
2008
Saf
ehou
se -
Num
ber
of
Peo
ple
She
ltere
d22
1516
1924
3238
3533
1317
1924
2007
2332
2123
2323
3624
2926
2008
Com
ea S
helte
r - T
otal
N
ight
s Lo
dgin
g1,
104
952
1,20
81,
239
1,27
81,
237
1,45
31,
471
1,30
81,
304
1,24
61,
261
1,25
520
07
1,38
31,
076
1,03
793
21,
256
1,43
11,
399
1,33
51,
360
1,24
520
08
SC
hO
OL
EN
rO
LL
ME
NT
S
Lara
mie
Cou
nty
Dis
tric
t #1
12,7
1312
,713
12,7
1312
,280
12,2
80-
-12
,780
12,7
8012
,780
12,7
8012
,780
12,6
6020
07
12,2
6312
,263
12,2
6312
,263
12,2
63-
-12
,936
12,9
3612
,936
12,5
1520
08
Lara
mie
Cou
nty
Dis
tric
t #2
892
892
892
890
890
--
928
928
928
928
928
910
2007
905
905
905
900
900
--
841
841
841
880
2008
Tota
l Sch
ool E
nrol
lmen
t14
,371
14,3
7114
,371
13,9
3613
,936
--
14,4
4214
,442
14,4
4214
,442
14,4
4214
,320
2007
13,9
0213
,902
13,9
0213
,897
13,8
97-
-14
,615
14,6
1514
,104
2008
LCC
C E
nrol
lmen
t - F
TE
(L
ar C
o S
ites)
2,66
72,
667
2,91
42,
914
2,91
453
153
12,
782
2,78
62,
786
2,78
62,
786
2,42
220
07
2,76
52,
765
2,76
52,
766
2,76
756
556
52,
798
2,79
82,
284
2008
LCC
C E
nrol
lmen
t - H
ead-
coun
t (La
r C
o S
ites)
3,95
03,
950
3,95
03,
950
3,95
01,
650
1,65
04,
826
4,82
64,
826
4,82
64,
826
3,93
220
07
4,75
54,
755
4,75
54,
755
4,75
51,
639
1,63
94,
546
4,54
64,
016
2008
Not
e: D
ata
is n
ot s
easo
nally
adj
uste
d.

12
TAB
LE
9
JAN
FE
BM
Ar
AP
rM
AY
JUN
JUL
AU
GS
EP
OC
TN
OV
DE
CA
VG
YE
Ar
TAX
ES
4%, 1
%, &
Lod
ging
Tax
Col
lect
ions
6,43
5,20
4 6,
032,
919
5,19
7,67
2 5,
851,
414
6,41
7,58
8 5,
864,
451
7,31
4,37
7 7,
513,
054
6,32
1,16
2 7,
463,
115
6,78
7,91
3 6,
248,
261
6,45
3,92
8 20
07
6,36
8,36
5 6,
529,
894
5,69
7,79
5 5,
645,
420
6,57
2,48
6 6,
309,
731
6,62
2,25
4 7,
815,
116
7,84
9,26
8 6,
601,
148
2008
Who
lesa
le &
Ret
ail S
ales
&
Use
Tax
Col
lect
ions
3,24
5,26
6 3,
380,
458
2,54
3,50
8 2,
575,
681
2,77
2,81
4 2,
742,
227
3,41
5,16
6 3,
575,
906
2,94
5,08
6 3,
569,
980
3,21
1,64
6 3,
081,
481
3,08
8,26
8 20
07
3,34
1,35
8 3,
407,
881
2,82
1,41
8 2,
679,
760
3,33
7,00
0 3,
004,
524
3,32
8,97
7 3,
985,
217
4,14
8,77
0 3,
339,
434
2008
Act
ual R
ecei
pts
to
Cou
nty
Ent
ities
2,73
7,14
1 2,
565,
575
2,19
9,01
5 2,
490,
755
2,71
9,18
2 2,
481,
677
3,09
3,36
2 3,
146,
734
2,64
0,03
8 3,
130,
875
2,84
3,90
8 2,
654,
721
2,72
5,24
9 20
07
2,70
2,43
0 2,
758,
184
2,41
4,59
3 2,
402,
028
2,77
3,78
8 2,
661,
539
2,80
3,83
5 3,
232,
563
3,27
8,40
3 2,
780,
818
2008
1% S
ales
and
Use
Tax
R
ecei
pts
1,26
0,59
6 1,
182,
266
1,01
5,44
9 1,
142,
675
1,25
3,15
6 1,
139,
615
1,42
1,78
7 1,
452,
216
1,21
7,57
5 1,
448,
167
1,31
0,79
5 1,
222,
309
1,25
5,55
0 20
07
1,24
5,21
1 1,
273,
420
1,11
3,70
8 1,
106,
431
1,27
8,46
0 1,
225,
732
1,28
7,93
5 1,
496,
839
1,51
4,44
9 1,
282,
465
2008
Lodg
ing
Tax
Rec
eipt
s46
,359
50
,177
46
,093
58
,473
72
,950
88
,180
12
5,13
9 15
4,97
3 15
0,81
5 13
3,91
2 14
7,69
5 54
,006
94
,064
20
07
64,7
07
62,1
43
53,5
16
49,1
66
76,9
85
92,4
17
86,6
08
217,
365
168,
608
96,8
35
2008
TOU
rIS
M
Ava
ilabl
e R
oom
s27
,686
24,8
5327
,502
26,6
0628
,058
27,1
6228
,179
28,0
5229
,158
33,2
97
31,4
40
n/a
28,3
63
2007
31,3
2629
,483
29,5
8631
,874
33,3
4532
,355
32,8
5333
,042
32,0
5831
,769
20
08
Nig
hts
Occ
upie
d16
,857
15,0
2616
,052
15,8
7723
,150
22,8
1122
,556
21,6
0920
,372
18,4
41
13,2
08
n/a
18,7
24
2007
12,2
3317
,413
14,8
9417
,066
20,9
5823
,991
25,5
1523
,248
21,4
6819
,643
20
08
Occ
upan
cy P
erce
ntag
e60
.9%
60.5
%58
.4%
59.7
%82
.5%
84.0
%80
.0%
77.0
%69
.9%
55.4
%80
.6%
39.6
%67
.4%
2007
39.1
%59
.1%
50.3
%53
.5%
62.9
%74
.2%
77.7
%70
.4%
67.0
%61
.6%
2008
Ave
rage
Roo
m R
ate
($)
$61.
26$7
1.41
$61.
59$6
1.25
$59.
34$7
3.25
$111
.86
$80.
74$7
5.26
$71.
77$8
6.50
$67.
85$7
3.51
2007
$65.
24$6
7.15
$67.
55$7
0.13
$74.
22$7
6.93
$115
.93
$82.
14$7
6.68
$77.
3320
08
CA
CV
B V
isito
r Wal
k-In
C
ount
831
789
1,17
21,
620
4,40
07,
502
12,6
187,
711
6,39
92,
578
1,48
31,
075
4,01
5 20
07
947
1,00
31,
284
1,57
85,
377
7,12
610
,768
7,32
45,
185
4,51
0 20
08
Trol
ley
Rid
ersh
ip78
423
827
415
61,
646
1,86
02,
411
1,41
71,
357
505
112
1,51
3 1,
023
2007
5920
523
425
1,19
91,
350
1,76
51,
580
2,20
697
9 20
08
Pin
e B
luffs
Info
rmat
ion
Cen
ter
clos
edcl
osed
clos
edcl
osed
11,6
7715
,475
17,4
3214
,401
10,6
617,
898
clos
edcl
osed
12,9
2420
07
clos
edcl
osed
clos
ed2,
089
8,52
613
,010
14,5
4613
,237
9,99
620
08
Wyo
min
g S
tate
Mus
eum
1,05
81,
119
1,19
11,
997
1,92
93,
120
3,52
42,
610
1,72
41,
216
781
538
1,73
420
07
910
1,83
91,
696
1,35
02,
328
2,84
63,
839
2,49
51,
705
2,11
220
08
I-25
Sta
te V
isito
r C
ente
r1,
969
1,29
72,
237
2,92
97,
204
12,5
8816
,280
15,0
6411
,743
6,16
8 2,
760
1,81
0 6,
837
2007
1,60
01,
695
2,63
83,
747
5,64
011
,321
14,3
7813
,172
11,1
117,
256
2008
Old
Wes
t Mus
eum
Pai
d V
isito
r45
956
01,
595
1,04
02,
406
5,42
03,
524
3,54
83,
047
1,99
2 82
0 72
4 2,
095
2007
431
878
1,86
499
62,
417
4,80
211
,937
1,97
52,
220
3,05
820
08

13
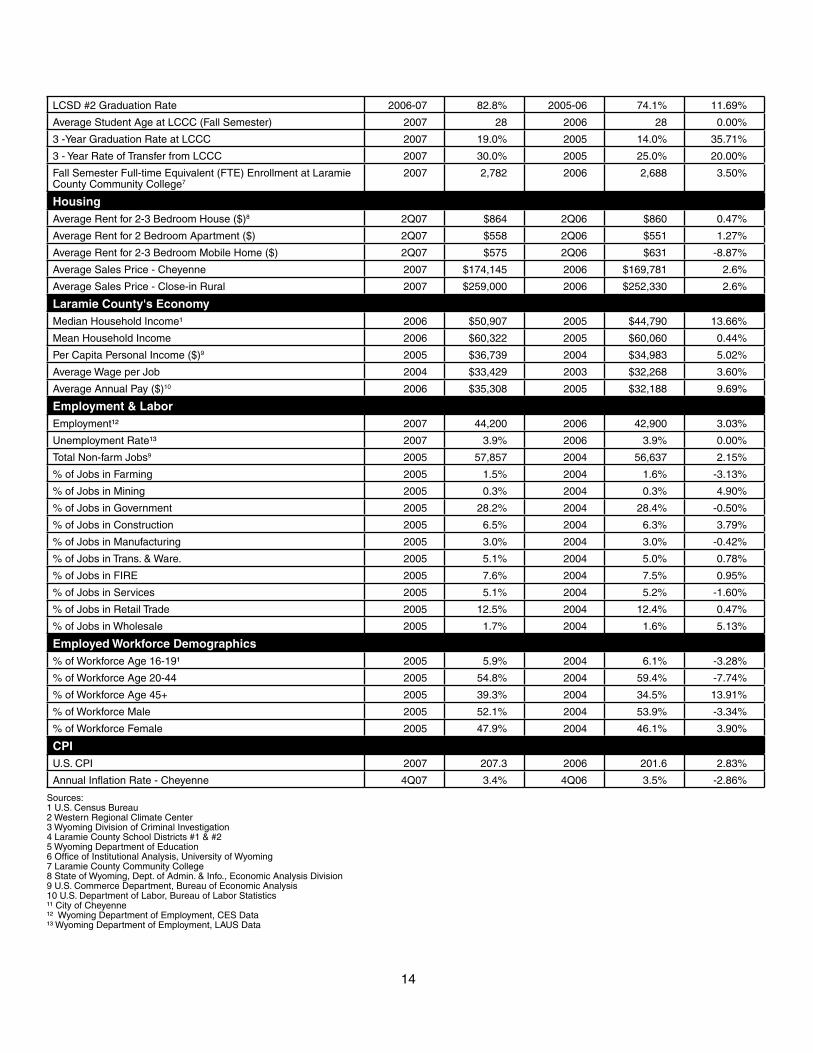
ChEYENNE/LArAMIE COUNTY PrOFILE - 2008Items Most Recent Period Previous Period % Change
In ValueYear Value Year Value
DemographyTotal Population - Cheyenne¹ 2006 55,314 2005 55,731 -0.75%
Total Population - Laramie County 2007 86,353 2006 85,384 1.13%
Total Male Population 2006 43,246 2005 40,085 7.89%
Total Female Population 2006 42,138 2005 41,708 1.03%
% of Population - Under 20 Years Old 2005 27.4% 2000 28.0% -2.14%
% of Population - 65 Years & Older 2005 12.0% 2000 7.1% 69.01%
Median Age 2006 36.0 2005 37.2 -3.23%
% of Population - White Alone (Non-Hispanic) 2006 82.7% 2005 83.0% -0.36%
% of Population - Native American Alone 2006 1.3% 2005 0.8% 62.50%
% of Population - Hispanic or Latino 2006 10.8% 2005 11.0% -1.82%
Households - County 2006 37,532 2005 36,747 2.14%
Households - City 2000 23,782 1990 20,243 17.48%
% of Households (HH) Headed by Married Couples 2005 51.1% 2000 54.5% -6.24%
% of HH Headed by Single Female (w/own children <18 yrs.) 2005 11.3% 2000 6.6% 71.21%
Weather & GeographyTotal Area (sq. miles)¹ 2000 2,688 - -
Total Area (sq. miles)¹¹ - Cheyenne 2006 24.3 2005 22.7 7.05%
Water Area (sq. miles) 2000 1.6 - -
Mean Elevation (ft.) 2000 6,100 - -
Normal Mean Temperature (F) - Cheyenne2 1949-06 45.9 1971-00 44.9 2.23%
Average Annual Precipitation (inches) - Cheyenne2 1949-06 14.6 1971-00 15.5 -5.50%
Average Wind Speed (mph) 1996-06 12.4 1992-02 12.6 -1.59%
Crime & Law EnforcementCrimes3 2007 3,233 2006 3,082 4.90%
Crimes per 100,000 Persons 2007 2,791.8 2006 2,619.7 6.57%
Homicides per 100,000 Persons 2007 1.7 2006 1.7 0.00%
Rapes per 100,000 Persons 2007 29.4 2006 32.3 -8.98%
Robberies per 100,000 Persons 2007 13.0 2006 24.7 -47.26%
Aggravated Assaults per 100,000 Persons 2007 93.3 2006 84.2 10.87%
Burglaries per 100,000 Persons 2007 329.9 2006 340.9 -3.21%
Larcenies & Thefts per 100,000 Persons 2007 2,224.5 2006 2,002.6 11.08%
Motor Vehicle Thefts per 100,000 Persons 2007 100.2 2006 133.5 -24.92%
Education% of Pop. (25 yrs. & older) with High School Diploma¹ 2006 90.5% 2000 89.1% 1.57%
% of Pop. (25 yrs. & older) with Bachelor's Degree 2006 22.3% 2000 23.4% -4.70%
Pupil -Teacher Ratio in LCSD #14 2006-07 14.10 2005-06 13.85 1.81%
Pupil -Teacher Ratio in LCSD #2 2006-07 10.31 2005-06 8.95 15.20%
Expenditures Per Pupil in LCSD #1 ($) 2006-07 $11,028 2005-06 $9,623 14.60%
Expenditures Per Pupil in LCSD #2 ($) 2006-07 $14,036 2005-06 $13,393 4.80%
LCSD #1 Enrollment Fall Semester 2007 12,776 2006 12,832 -0.44%
LCSD #2 Enrollment Fall Semester 2007 928 2005 893 3.92%
Total School Enrollments Laramie County Fall Semester 2007 14,443 2006 14,491 -0.33%
% of Students in Private Schools 2007 2.6% 2006 2.8% -7.14%
% of Students Home-Schooled 2007 2.5% 2006 2.5% 0.00%
ACT Average Composite Score (range 1-36) LCSD #1 2006-07 22.0 2005-06 21.1 4.27%
ACT Average Composite Score (range 1-36) LCSD #2 2006-07 22.3 2005-06 21.7 2.76%
LCSD #1 Graduation Rate5 2006-07 74.0% 2005-06 78.4% -5.57%
14
LCSD #2 Graduation Rate 2006-07 82.8% 2005-06 74.1% 11.69%
Average Student Age at LCCC (Fall Semester) 2007 28 2006 28 0.00%
3 -Year Graduation Rate at LCCC 2007 19.0% 2005 14.0% 35.71%
3 - Year Rate of Transfer from LCCC 2007 30.0% 2005 25.0% 20.00%
Fall Semester Full-time Equivalent (FTE) Enrollment at Laramie County Community College7
2007 2,782 2006 2,688 3.50%
housingAverage Rent for 2-3 Bedroom House ($)8 2Q07 $864 2Q06 $860 0.47%
Average Rent for 2 Bedroom Apartment ($) 2Q07 $558 2Q06 $551 1.27%
Average Rent for 2-3 Bedroom Mobile Home ($) 2Q07 $575 2Q06 $631 -8.87%
Average Sales Price - Cheyenne 2007 $174,145 2006 $169,781 2.6%
Average Sales Price - Close-in Rural 2007 $259,000 2006 $252,330 2.6%
Laramie County's EconomyMedian Household Income¹ 2006 $50,907 2005 $44,790 13.66%
Mean Household Income 2006 $60,322 2005 $60,060 0.44%
Per Capita Personal Income ($)9 2005 $36,739 2004 $34,983 5.02%
Average Wage per Job 2004 $33,429 2003 $32,268 3.60%
Average Annual Pay ($)10 2006 $35,308 2005 $32,188 9.69%
Employment & LaborEmployment¹² 2007 44,200 2006 42,900 3.03%
Unemployment Rate¹³ 2007 3.9% 2006 3.9% 0.00%
Total Non-farm Jobs9 2005 57,857 2004 56,637 2.15%
% of Jobs in Farming 2005 1.5% 2004 1.6% -3.13%
% of Jobs in Mining 2005 0.3% 2004 0.3% 4.90%
% of Jobs in Government 2005 28.2% 2004 28.4% -0.50%
% of Jobs in Construction 2005 6.5% 2004 6.3% 3.79%
% of Jobs in Manufacturing 2005 3.0% 2004 3.0% -0.42%
% of Jobs in Trans. & Ware. 2005 5.1% 2004 5.0% 0.78%
% of Jobs in FIRE 2005 7.6% 2004 7.5% 0.95%
% of Jobs in Services 2005 5.1% 2004 5.2% -1.60%
% of Jobs in Retail Trade 2005 12.5% 2004 12.4% 0.47%
% of Jobs in Wholesale 2005 1.7% 2004 1.6% 5.13%
Employed Workforce Demographics% of Workforce Age 16-19¹ 2005 5.9% 2004 6.1% -3.28%
% of Workforce Age 20-44 2005 54.8% 2004 59.4% -7.74%
% of Workforce Age 45+ 2005 39.3% 2004 34.5% 13.91%
% of Workforce Male 2005 52.1% 2004 53.9% -3.34%
% of Workforce Female 2005 47.9% 2004 46.1% 3.90%
CPIU.S. CPI 2007 207.3 2006 201.6 2.83%
Annual Inflation Rate - Cheyenne 4Q07 3.4% 4Q06 3.5% -2.86%
Sources:1 U.S. Census Bureau2 Western Regional Climate Center3 Wyoming Division of Criminal Investigation4 Laramie County School Districts #1 & #25 Wyoming Department of Education6 Office of Institutional Analysis, University of Wyoming7 Laramie County Community College8 State of Wyoming, Dept. of Admin. & Info., Economic Analysis Division9 U.S. Commerce Department, Bureau of Economic Analysis10 U.S. Department of Labor, Bureau of Labor Statistics ¹¹ City of Cheyenne¹² Wyoming Department of Employment, CES Data¹³ Wyoming Department of Employment, LAUS Data

15
LARAMIE COUNTY EMPLOYMENT*Monthly Average
1993 - 2008
* Current Employment Statistics (CES)
33
,65
0
34
,45
0
35
,09
2
35
,46
7
35
,82
5
36
,41
7
37
,19
2
37
,93
3
38
,18
3
39
,20
8
40
,24
2
40
,77
5
41
,72
5
42
,90
8
44
,17
5
44
,92
2
93 94 95 96 97 98 99 00 01 02 03 04 05 06 07 08
0
10,000
20,000
30,000
40,000
LARAMIE COUNTY UNEMPLOYMENTMonthly Average
1993 - 2008
1,5
64
1,6
10
1,4
60
1,4
57
1,4
35
1,4
66
1,4
14
1,5
05
1,6
56
1,7
44
1,9
23
1,9
03
1,7
47
1,6
37
1,5
91
1,6
87
93 94 95 96 97 98 99 00 01 02 03 04 05 06 07 08
0
500
1,000
1,500
2,000
HELP - WANTED ADS, CHEYENNE Monthly Totals
1993 - 2008
93 94 95 96 97 98 99 00 01 02 03 04 05 06 07 08
0
50
100
150
200
250

16
CHEYENNE METERED WATER TAPSMonthly Average
1993 - 2008
Metered Water Taps (CBPU)
17
,72
1
17
,92
6
18
,15
4
18
,44
4
18
,69
1
18
,89
0
19
,10
0
19
,19
3
19
,35
5
19
,53
2
19
,83
2
20
,24
6
20
,72
1
21
,22
5
21
,60
0
21
,63
0
93 94 95 96 97 98 99 00 01 02 03 04 05 06 07 08
17,000
17,500
18,000
18,500
19,000
19,500
20,000
20,500
21,000
21,500
SOUTH CHEYENNE METERED WATER TAPSMonthly Average
1993 - 2008
Metered Water Taps (SCW&SD)
2,9
64
2,9
74
2,9
85
3,0
13
3,0
26
3,0
45
3,0
67
3,0
94
3,1
12
3,1
31
3,1
56
3,1
78
3,2
10
3,2
50
3,2
84
3,2
92
93 94 95 96 97 98 99 00 01 02 03 04 05 06 07 08
2,500
2,700
2,900
3,100
3,300
ENPLANEMENTS, CHEYENNE AIRPORTMonthly Totals
1993 - 2008
93 94 95 96 97 98 99 00 01 02 03 04 05 06 07 08
0
1
2
3
4
5Thousands
17
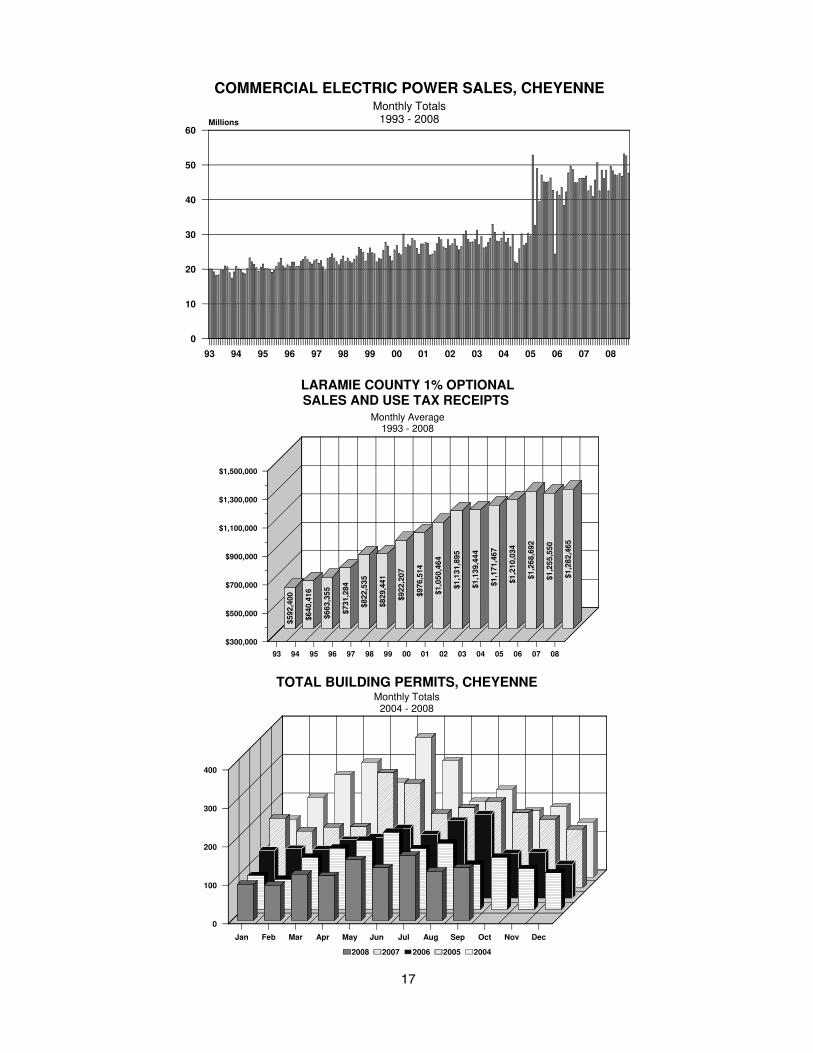
COMMERCIAL ELECTRIC POWER SALES, CHEYENNEMonthly Totals
1993 - 2008
93 94 95 96 97 98 99 00 01 02 03 04 05 06 07 08
0
10
20
30
40
50
60Millions
LARAMIE COUNTY 1% OPTIONALSALES AND USE TAX RECEIPTS
Monthly Average1993 - 2008
$5
92, 4
00
$6
40, 4
16
$6
63, 3
55
$7
31, 2
84
$8
22, 5
35
$8
29, 4
41
$9
22, 2
07
$9
76, 5
14
$1
,05
0,4
64
$1
,13
1,8
95
$1
,13
9,4
44
$1
,17
1,4
67
$1
,21
0,0
34
$1
,26
8,6
92
$1
,25
5,5
50
$1
,28
2,4
65
93 94 95 96 97 98 99 00 01 02 03 04 05 06 07 08
$300,000
$500,000
$700,000
$900,000
$1,100,000
$1,300,000
$1,500,000
TOTAL BUILDING PERMITS, CHEYENNEMonthly Totals
2004 - 2008
Jan Feb Mar Apr May Jun Jul Aug Sep Oct Nov Dec
0
100
200
300
400
2008 2007 2006 2005 2004
18
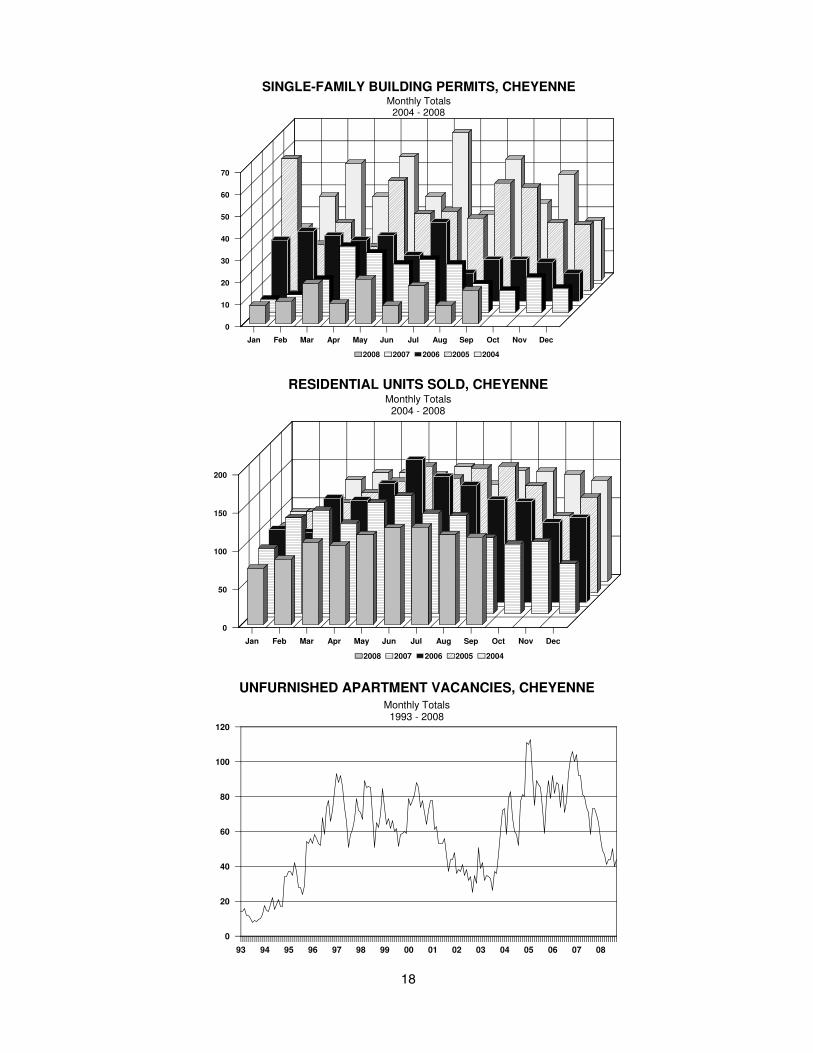
SINGLE-FAMILY BUILDING PERMITS, CHEYENNEMonthly Totals
2004 - 2008
Jan Feb Mar Apr May Jun Jul Aug Sep Oct Nov Dec
0
10
20
30
40
50
60
70
2008 2007 2006 2005 2004
RESIDENTIAL UNITS SOLD, CHEYENNE Monthly Totals
2004 - 2008
Jan Feb Mar Apr May Jun Jul Aug Sep Oct Nov Dec
0
50
100
150
200
2008 2007 2006 2005 2004
UNFURNISHED APARTMENT VACANCIES, CHEYENNE Monthly Totals
1993 - 2008
93 94 95 96 97 98 99 00 01 02 03 04 05 06 07 08
0
20
40
60
80
100
120
19
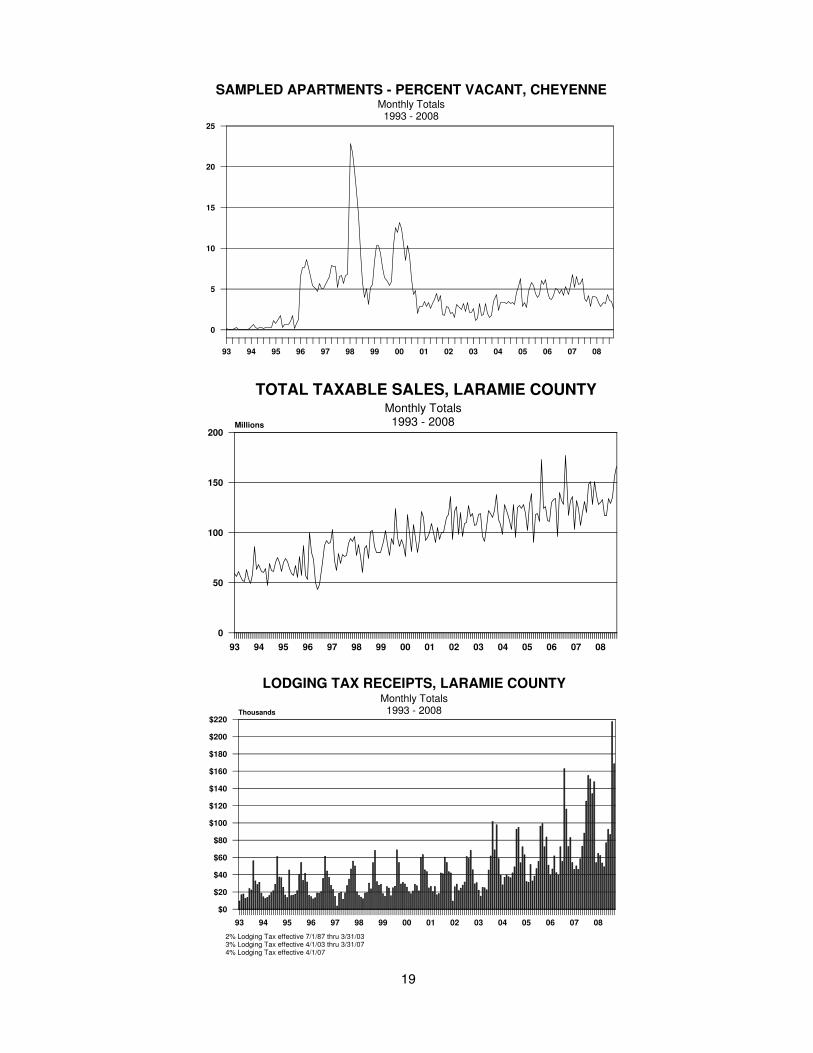
SAMPLED APARTMENTS - PERCENT VACANT, CHEYENNE Monthly Totals
1993 - 2008
93 94 95 96 97 98 99 00 01 02 03 04 05 06 07 08
0
5
10
15
20
25
TOTAL TAXABLE SALES, LARAMIE COUNTY Monthly Totals
1993 - 2008
93 94 95 96 97 98 99 00 01 02 03 04 05 06 07 08
0
50
100
150
200Millions
LODGING TAX RECEIPTS, LARAMIE COUNTY Monthly Totals
1993 - 2008
2% Lodging Tax effective 7/1/87 thru 3/31/033% Lodging Tax effective 4/1/03 thru 3/31/074% Lodging Tax effective 4/1/07
93 94 95 96 97 98 99 00 01 02 03 04 05 06 07 08
$0
$20
$40
$60
$80
$100
$120
$140
$160
$180
$200
$220Thousands
20
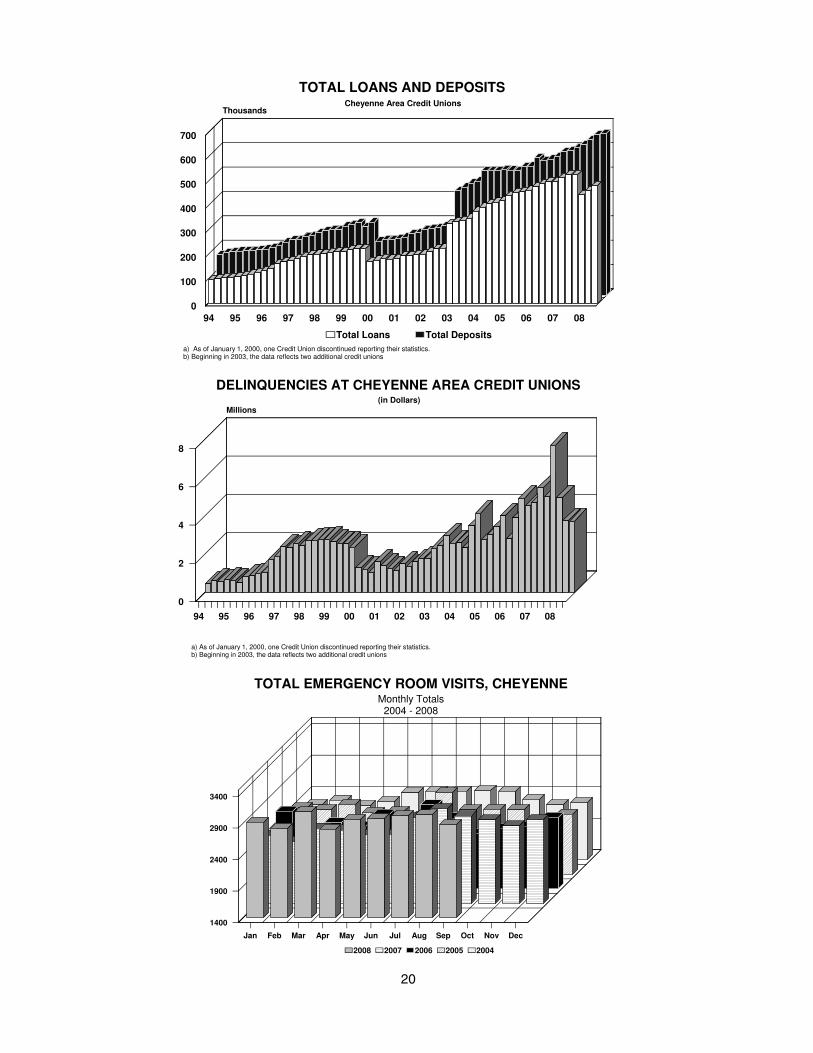
DELINQUENCIES AT CHEYENNE AREA CREDIT UNIONS(in Dollars)
94 95 96 97 98 99 00 01 02 03 04 05 06 07 08
0
2
4
6
8
Millions
a) As of January 1, 2000, one Credit Union discontinued reporting their statistics. b) Beginning in 2003, the data reflects two additional credit unions
TOTAL EMERGENCY ROOM VISITS, CHEYENNEMonthly Totals
2004 - 2008
Jan Feb Mar Apr May Jun Jul Aug Sep Oct Nov Dec
1400
1900
2400
2900
3400
2008 2007 2006 2005 2004
a) As of January 1, 2000, one Credit Union discontinued reporting their statistics. b) Beginning in 2003, the data reflects two additional credit unions
TOTAL LOANS AND DEPOSITSCheyenne Area Credit Unions
94 95 96 97 98 99 00 01 02 03 04 05 06 07 08
0
100
200
300
400
500
600
700
Thousands
Total Loans Total Deposits

21
LARAMIE COUNTY SCHOOLS Monthly Totals
2004 - 2008
Jan Feb Mar Apr May Jun Jul Aug Sep Oct Nov Dec
0
5
10
15
Thousands
2008 2007 2006 2005 2004
AVERAGE CITY AND RURAL RESIDENTIAL SALE PRICESLARAMIE COUNTY
1993 - 2008
*Data is incomplete for 1995.
&
&
&&
&&
& &&
&&
&&
& &&
!
!
! ! !! !
! ! !!
!!
!! !
19
93
19
94
19
95
19
96
19
97
19
98
19
99
20
00
20
01
20
02
20
03
20
04
20
05
20
06
20
07
20
08
50,000
75,000
100,000
125,000
150,000
175,000
200,000
225,000
250,000
275,000
300,000Sales Price
Avg. City Price Avg. Rural Price! &

22
DATA SOUrCES
1. Automobile Registrations: Laramie County Auto Titles Bureau
2. Construction, Permits, Valuation, Residential: City of Cheyenne Building Permits Agency
3. Employment: Wyoming Department of Employment
4. Help-Wanted Advertisements: Center for Economic and Business Data
5. Sales and Use Tax Collections: Wyoming Department of Revenue and Taxation Department of Administration & Information - DA
6. Utilities, Electrical, and Natural Gas: Cheyenne Light, Fuel & Power
7. Water Usage - Metered Taps: Board of Public Utilities South Cheyenne Sewer & Water District
8. Banking Data: Cheyenne Area Credit Unions (9) Cheyenne Area Banks (5)
9. Enplanements: Cheyenne Airport Board
10. Housing: Center for Economic and Business Data Cheyenne Board of Realtors
11. Human Services: Cheyenne Police Department, United Medical Center, Safehouse, Comea Shelter, Department of Family Services, School Districts No. 1 and No. 2, Private Schools.
12. Tourism: Cheyenne Area Convention & Visitors Bureau
13. Bankruptcies: U.S. Clerk of Bankruptcy Court
ECONOMIC INDICATOrSSubscription request
Please start my subscription to “Economic Indicators for Greater Cheyenne”
Name _______________________________________________________________________
Company ____________________________________________________________________
Street _______________________________________________________________________
City _________________________________________________________________________
State _________________________________________________ Zip ___________________
You can find this publication on the Internet at www.wyomingeconomicdata.com.
There is no charge for a subscription. If you would like to make a donation to help cover the cost of publication,
please forward your check to
Wyoming Center for Business & Economic Analysis in the amount of $___________.
Wyoming Center for Business & Economic Analysis, Inc.1720 Carey Ave., Suite 520 • Cheyenne, Wyoming 82001
(307) 632-1347