Embed Size (px)
Citation preview

Economic Importance of Tourism in Australia’s Regions
Phase 2: Large tourism-dependent regions

ISBN 978-1-921812-50-7
Tourism Research Australia GPO Box 1564 Canberra ACT 2601 Phone: 6243 7745 Email: [email protected] Web: www.ret.gov.au/tra
Publication date: August 2011
This work is licensed under a Creative Commons Attribution 3.0 Australia licence. To the extent that copyright subsists in third party quotes and diagrams it remains with the original owner and permission may be required to reuse the material.
This work should be attributed as Economic Importance of Tourism in Australia’s Regions: Phase 2 - Large Tourism-Dependent Regions, Tourism Research Australia, Canberra.
Enquiries regarding the licence and any use of work by Tourism Research Australia are welcome at [email protected]

1
Contents
1. Introduction ................................................................................................................ 2
2. Background ................................................................................................................. 2
3. Similarities and differences between regions .................................................................... 4
3.1 Profile and significance of the tourism industry ............................................................... 4
3.2 Attractions and experiences expected ............................................................................ 6
3.3 Trends and seasonality ................................................................................................ 8
3.4 Visitor Profile ........................................................................................................... 14
3.5 Information sources and booking ................................................................................ 16
3.6 Satisfaction with the region ........................................................................................ 16
4. Conclusion and implications ......................................................................................... 17
Appendices
Appendix A: Individual region profiles .................................................................................. 19
A1 Gold Coast and Tropical North Queensland .................................................................... 19
A2 Sunshine Coast ......................................................................................................... 20
A3 Northern Rivers ......................................................................................................... 21
A4 Mid North Coast ........................................................................................................ 22
A5 South Coast .............................................................................................................. 22
A6 Australia’s South West ............................................................................................... 23
Appendix B: Detailed Results .............................................................................................. 24
References ....................................................................................................................... 32
Tables
Table 1: Profiling tourism regions: Significance of the tourism industry ...................................... 5
Table 2: Attractions and experiences expected ....................................................................... 7
Table 3: Visitors, nights and expenditure in the region, 2010 ................................................. 13
Table 4: Typical domestic and international visitor features by region, 2010 ............................. 15
Table 5: Information sources used across regions ................................................................. 16
Figures
Figure 1: Comparison between Industry Size and Economic Importance of Tourism .................... 3
Figure 2: Domestic overnight visitors and visitor nights by region and total outbound travel, 1999
to 2010 ............................................................................................................................. 9
Figure 3: International visitors and visitor nights by region, 1999 to 2010 ............................... 10
Figure 4: Seasonality by region– Proportion of visitors by quarter, 1999 to 2010 ...................... 12

2
1. Introduction
For many regions in Australia, income from tourism contributes significantly to their local economies. Tourism Research Australia’s (TRA) report, The Economic Importance of Tourism in Australia’s Regions (TRA, 2011a) developed a measure for tourism’s economic importance and ranked each of Australia’s tourism regions by their relative economic importance. This showed that the economic importance of tourism to a region differs significantly across Australia’s tourism regions. The level of importance is influenced by a range of factors, including the size of the tourism industry and the level of economic diversity in the region. For the majority of regions, tourism industries are smaller but economically important (Figure 1). However, a group of seven regions, which account for 21% of total tourism expenditure in Australia, have both larger tourism industries and a high dependence on tourism. The seven regions include Australia’s South West (WA), Gold Coast (QLD), Mid North Coast (NSW), Northern Rivers (NSW), South Coast (NSW), Sunshine Coast (QLD) and Tropical North Queensland.
This report aims to build on the results produced in the first report by examining the set of large tourism regions, in which tourism is economically important. Specifically, it will focus on profiling the regions to gain a better understanding of the regions and their tourism industries. This report will examine the similarities and differences of the regions based on the local economy, the experiences offered and the visitor profile and satisfaction of visitors. Moreover, the aim of this report is to bring together this set of regions to determine what common factors drive both an economically large and important tourism industry and where the potential vulnerabilities lie.
Section 2 of this report provides further background on the first report, Section 3 will draw out key commonalities in the group, and Section 4 will provide concluding remarks and implications.
2. Background
Figure 1 plots the relative size of the tourism industry (based on tourism expenditure) against the relative importance of tourism for 77 tourism regions in Australia (see TRA, 2011a for more detail). The seven regions examined in this report are the regions in the top right hand quadrant (higher importance, larger tourism industry). Subsequent stages of the economic importance research will seek to address those regions occupying the other quadrants of Figure 1.

3
Figure 1: Comparison between Industry Size and Economic Importance of Tourism
Source: TRA (2011a)
The figures presented in this report are derived from data collected in the National Visitor Survey (NVS), International Visitor Survey (IVS) and the Visitor Profile and Satisfaction (VPS) database. Unless otherwise stated, all figures refer to the year ending December 2010.

4
3. Similarities and differences between regions 3.1 Profile and significance of the tourism industry
Tourism is one of the most prominent industries in all seven regions. The economic importance of tourism in these regions ranges from 4.8% in Australia’s South West to 9.7% in Tropical North Queensland (Table 1). The Australian benchmark for economic importance of tourism is 3%. Thus this set of regions is highly reliant on tourism income for their local economies. The economic importance of tourism in these regions is further illustrated by a relatively large number of tourism businesses. For this set of regions (excluding Australia’s South West), the proportion of businesses that are tourism related is above the national average of 20.2%. This importance also flows to the employment in the region, with over half of tourism businesses employing individuals in all regions other than the Gold and Sunshine Coasts1
, well above the national average of 39.7% (ABS, 2010). All regions are accessible by domestic air transport. Both the Gold Coast and Tropical North Queensland have international terminals, while Tropical North Queensland is the only region with a port. Outside of capital city regions, this is an attribute not found in many other tourism regions. The number of accommodation establishments in this set of regions is relatively high, ranging from 147 in Australia’s South West to 260 in the Mid North Coast, compared to the typical tourism region, which has 93 accommodation establishments, on average (TRA, 2011b). This is an indication of the larger volume of visitors to these regions. The breakdown of accommodation type also varies markedly across the regions (Appendix B, Tables B13 and B14).
1ABS unpublished data

5
Table 1: Profiling tourism regions - Significance of the tourism industry
Gold Coast
Tropical North
Queensland
Sunshine Coast
Northern Rivers
Mid North Coast
South Coast
Australia’s South West
Economic Importance (National benchmark = 3%)
6.4% 9.7% 6.7% 6.1% 8.7% 5.4% 4.8%
Main Industries Tourism,
Construction, Health & Medical
Agriculture, Mining and
Tourism
Tourism, Construction,
Health & Medical
Tourism, Health & Medical
Tourism, Manufacturing,
Agriculture
Manufacturing, Mining, Tourism
Agriculture, Mining, Tourism
Tourism Businesses
14,240 (20.8% of all businesses)
a (Benchmarks: Regional Australia, excluding capital cities=18.2% National=20.2%)
5,282 (21.9% of all businesses)
7,989 (20.7% of all businesses)
5,226 (20.2% of all businesses)
6,168 (22.5% of all businesses)
7,004 (24.2% of all businesses)
3,999 (18.1% of
all businesses)
Employing Businesses 6256 (43.9% of
all tourism businesses)
a (National Benchmark =39.7%)
2700 (51.1% of all tourism businesses)
3743 (46.9% of all tourism businesses)
2720 (52% of all tourism
businesses)
3467 (56.2% of all tourism businesses)
3841(54.8% of all tourism businesses)
2072 (51.8% of all tourism businesses)
Accommodation Establishments (as at March 2011)
172 228 164 158 260 217 147
Airports/Ports Domestic and International
Airports
Domestic and International Airports; Port
Domestic Airport Domestic
Airports (3 airports)
Domestic Airports (2 airports)
Domestic Airports (2 airports)
Domestic Airport
a Based on business numbers in June 2009 Sources: TRA (2011a, 2011b), ABS unpublished data, ABS 2010

6
3.2 Attractions and experiences expected2
The expectation of a wide range of experiences when visiting a region is something that is common across most of these regions (Table 2). Of the 13 experiences benchmarked
The dominant attractions across this set of regions revolve around the beach and/or the nature experiences offered. This may be explained by the fact that all regions are coastal and have National Parks. Experiences associated with beaches and nature can vary from providing a back drop for relaxing, rejuvenating and spending time with others through to providing a range of activities to keep visitors happy.
3
Visitors to these regions expect to relax, rejuvenate and spend quality time with others. These experiences are in line with previous research which has shown that relaxing and recharging, as well as allowing travellers the ability to break from everyday life and gain new experiences, are key motivators for Australian consumers to travel (TRA, 2007). These experiences are offered by these seven regions.
, visitors to the regions expect each region to offer at least five of the experiences, with most expecting eight or nine experiences ranging from relaxing and rejuvenating through to having an adventure. In contrast, experiences that were not expected from any of these regions were around art, culture and history/heritage, with the expectation of the region offering these experiences below the benchmark.
2 The experiences expected are based on VPS studies conducted in the Gold Coast; Cairns, Port Douglas and Tropical Tablelands in Tropical North Queensland; Noosa, Cooloola, Maroochy and Caloundra in the Sunshine Coast; Kingscliff/Cabarita in the Northern Rivers; Coffs Coast and Port Macquarie in the Mid North Coast; and Batemans Bay, Sapphire Coast and Shoalhaven in the South Coast. No VPS studies have been conducted in Australia’s South West. 3 All experiences are benchmarked against the average expectation across the destinations in the VPS benchmark database. To date there are over 70 destinations in the database.

7
Table 2: Attractions and experiences expected
Regions Attractions Experiences expected
Gold Coast • Beaches • Theme Parks
• Relaxation and rejuvenation • Spend quality time with others • Luxury and indulgence • Something the kids would enjoy • Food and wine experiences • An adventure • Enjoyable nightlife/entertainment • Good shopping
Tropical North Queensland
• Nature • Indigenous
Culture • Beaches
• Relaxation and rejuvenation • Spend quality time with others• Nature based experiences
a
• Luxury and indulgence • Food and wine experiences• An adventure
a
• To experience our nation’s history• Tour around and explore
a
• To discover and learn something new
• Enjoyable nightlife/entertainment
Sunshine Coast • Beaches • Nature
• Relaxation and rejuvenation • Spend quality time with others • Nature based experiences • Luxury and indulgence • Something the kids would enjoy • Food and wine experiences • Tour around and explore• Enjoyable nightlife/entertainment
a
• Good shopping
Northern Rivers • Beaches • Nature
• Relaxation and rejuvenation • Spend quality time with others • Luxury and indulgence • Something the kids would enjoy • Enjoyable nightlife/entertainmenta
Mid North Coast • Beaches • Nature
• Relaxation and rejuvenation • Spend quality time with others • Nature based experiences • Luxury and indulgence • Something the kids would enjoy • Food and wine experiences • Enjoyable nightlife/entertainment • Good shopping
South Coast • Beaches • Nature
• Relaxation and rejuvenation • Spend quality time with others • Nature based experiences • Luxury and indulgence• Something the kids would enjoy
a
• Food and wine experience• Tour around and explore
a
• Enjoyable nightlife/entertainment
a
• Good shopping
a a
Australia’s South West
• Food/Wine • Beaches • Nature
• Not available
a
Similar score to the benchmark (within +/- 3points). Source: TRA VPS database (unpublished data)

8
3.3 Trends and seasonality
Generally, trends in both domestic and international visitors have been similar across this set of regions and more broadly nationally. Moreover, general declines in domestic visitors have occurred over the past decade, while outbound travel by Australians increased significantly during this time, including to locations offering similar attractions and experiences, e.g. Bali and Fiji.
• Between 1999 and 2010 the average annual growth in domestic visitors ranged from 0.2% per year increase in Tropical North Queensland to 1.8% per year in the South Coast (Figure 2). This compares to a decline of 0.7% per year nationally and 1% per year in regional Australia (excluding capital cities). Visitor nights decreased across the board from between 0.3% per year in Tropical North Queensland to 1.7% per year in the South Coast.
• In contrast, outbound travel increased, on average, by 8.5% per year between 2004 and 2010, with outbound travel to Indonesia increasing at a rate of 13.9% per year and Fiji at 10.2% per year.
• Between 1999 and 2010 average annual growth in international visitors was positive for all regions except Tropical North Queensland, Gold Coast and Mid North Coast (declines of 1%, 0.6% and 0.3% per year respectively)(Figure 3). This is compared with increases both nationally (2.5% per year) and regionally (0.7% per year). International visitor nights increased across the board ranging from 0.5% per year in Tropical North Queensland to 7.1% per year in Australia’s South West. This compares to 5.7% nationally.
For all regions, other than Tropical North Queensland and the Sunshine Coast, domestic visitor nights are declining at a faster rate than the national average. However, international visitor nights are growing across all regions, albeit at a slower rate than the national average, for all regions other than the South Coast and Australia’s South West, which are growing at a faster rate than the national average.

9
Figure 2: Domestic overnight visitors and visitor nights by region and total outbound travel, 1999 to 2010
0
1,000
2,000
3,000
4,000
5,000
6,000
7,000
1999 2000 2001 2002 2003 2004 2005 2006 2007 2008 2009 2010
Vis
itor
s (0
00)
0
2,000
4,000
6,000
8,000
10,000
12,000
14,000
16,000
18,000
1999 2000 2001 2002 2003 2004 2005 2006 2007 2008 2009 2010
Vis
itor
Nig
hts
(000
)
Gold Coast Tropical North Queensland Sunshine Coast
Northern Rivers Mid North Coast South Coast
Australia's South West Total Outbound
Note: Outbound travel data only available from 2004 onwards Source: TRA National Visitor Survey

10
Figure 3: International visitors and visitor nights by region, 1999 to 2010
0
100,000
200,000
300,000
400,000
500,000
600,000
700,000
800,000
900,000
1,000,000
1999 2000 2001 2002 2003 2004 2005 2006 2007 2008 2009 2010
Vis
itor
s (0
00)
0
1,000,000
2,000,000
3,000,000
4,000,000
5,000,000
6,000,000
7,000,000
8,000,000
9,000,000
1999 2000 2001 2002 2003 2004 2005 2006 2007 2008 2009 2010
Vis
itor
nig
hts
(000
)
Gold Coast Tropical North Queensland Sunshine Coast
Northern Rivers Mid North Coast South Coast
Australia's South West
Source: TRA International Visitor Survey

11
With the exception of the Gold Coast, these regions are highly seasonal (Figure 4). For most the domestic peak season occurs in the March quarter, corresponding with the summer holiday period. A difference occurs in Tropical North Queensland, where their peak occurs in their dry season, which corresponds with the September quarter. Nationally there is a slight peak in the March quarter, although this peak is smaller than those experienced in the regions profiled. International peak seasons are very similar to domestic, with the Sunshine Coast changing from a March to September quarter peak, and Australia’s South West summer peak shifting to the December quarter.

12
Figure 4: Seasonality by region– Proportion of visitors by quarter, 1999 to 2010
Domestic overnight visitors
0
5
10
15
20
25
30
35
40
March Quarter June Quarter September Quarter December Quarter
Prop
orti
on o
f vis
itor
s (%
)
International visitors
0
5
10
15
20
25
30
35
40
March Quarter June Quarter September Quarter December Quarter
Prop
orti
on o
f vis
itor
s (%
)
Gold Coast Tropical North Queensland Sunshine Coast
Northern Rivers Mid North Coast South Coast
Australia's South West
Source: TRA - International Visitor Survey, National Visitor Survey
13
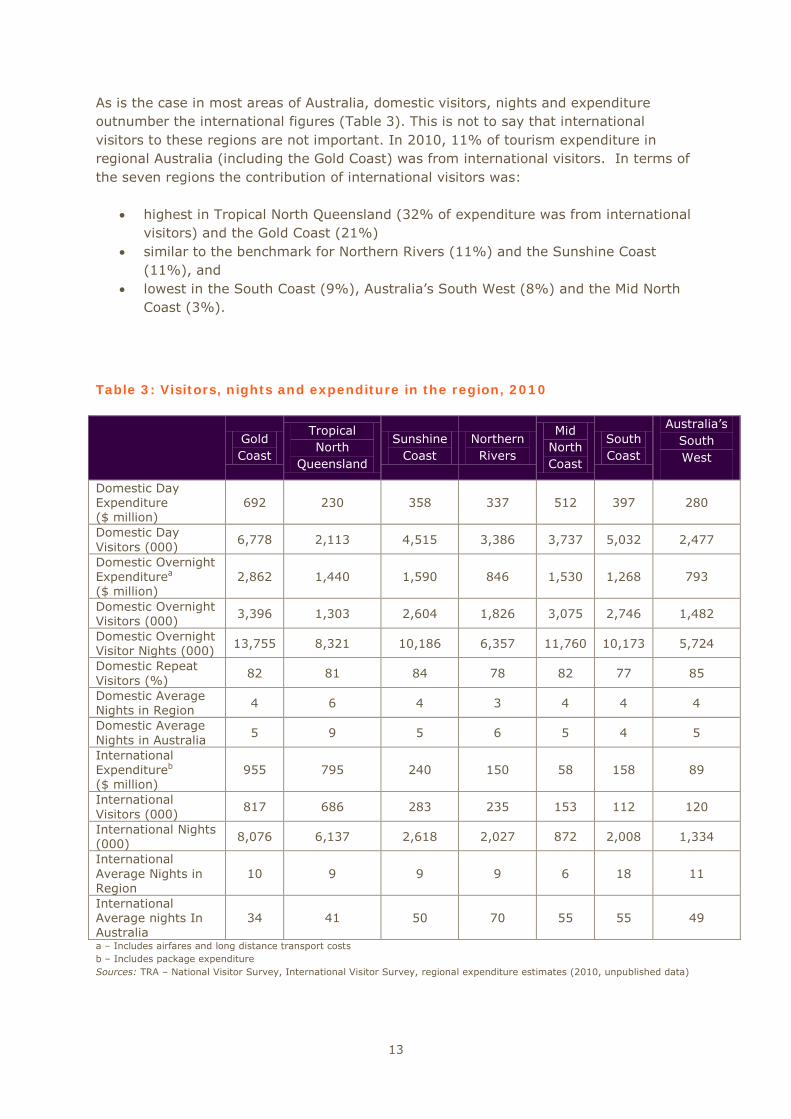
As is the case in most areas of Australia, domestic visitors, nights and expenditure outnumber the international figures (Table 3). This is not to say that international visitors to these regions are not important. In 2010, 11% of tourism expenditure in regional Australia (including the Gold Coast) was from international visitors. In terms of the seven regions the contribution of international visitors was:
• highest in Tropical North Queensland (32% of expenditure was from international visitors) and the Gold Coast (21%)
• similar to the benchmark for Northern Rivers (11%) and the Sunshine Coast (11%), and
• lowest in the South Coast (9%), Australia’s South West (8%) and the Mid North Coast (3%).
Table 3: Visitors, nights and expenditure in the region, 2010
Gold Coast
Tropical North
Queensland
Sunshine Coast
Northern Rivers
Mid North Coast
South Coast
Australia’s South West
Domestic Day Expenditure ($ million)
692 230 358 337 512 397 280
Domestic Day Visitors (000)
6,778 2,113 4,515 3,386 3,737 5,032 2,477
Domestic Overnight Expenditure 2,862 a
($ million) 1,440 1,590 846 1,530 1,268 793
Domestic Overnight Visitors (000)
3,396 1,303 2,604 1,826 3,075 2,746 1,482
Domestic Overnight Visitor Nights (000) 13,755 8,321 10,186 6,357 11,760 10,173 5,724
Domestic Repeat Visitors (%)
82 81 84 78 82 77 85
Domestic Average Nights in Region 4 6 4 3 4 4 4
Domestic Average Nights in Australia
5 9 5 6 5 4 5
International Expenditure 955 b
($ million) 795 240 150 58 158 89
International Visitors (000)
817 686 283 235 153 112 120
International Nights (000) 8,076 6,137 2,618 2,027 872 2,008 1,334
International Average Nights in Region
10 9 9 9 6 18 11
International Average nights In Australia
34 41 50 70 55 55 49
a – Includes airfares and long distance transport costs b – Includes package expenditure Sources: TRA – National Visitor Survey, International Visitor Survey, regional expenditure estimates (2010, unpublished data)

14
3.4 Visitor Profile
Table 4 provides a summary of the typical domestic and international visitor to these regions. Domestic visitors are similar across this set of regions and in most cases they are also similar to national averages. On the other hand, the profile of international visitors is more diverse across these regions. A detailed discussion on the separate regions is in Appendix 1, which profiles each region individually. The dominant life stages for domestic visitors to these regions are families and older couples, with visitors generally travelling as a family group or as an adult couple. This is similar with national trends. The majority of travel to these regions is made up of intrastate visitors, usually from adjacent regions. The exceptions to this are the Gold Coast and Northern Rivers; however this may be explained by their location adjacent to state borders. The Gold Coast is the only region with a significant number of visitors from non-adjacent interstate regions, particularly from Sydney and Melbourne. There is a high proportion of repeat visitation to this set of regions, with all but the South Coast and Northern Rivers above the national average. Moreover, the fact that, with the exception of Tropical North Queensland, each region is located in the proximity of a major capital city may also assist the levels of repeat visitation. With the exception of Tropical North Queensland, on average 88% of domestic visitors to these regions travel for either holiday/leisure or VFR, with the majority in the former category. Tropical North Queensland is more in line with the national average, with a larger proportion of business travel (20%). With the exception of Tropical North Queensland, due to its isolation, and the Gold Coast, with its popular airport, the dominant form of transport to these regions for domestic visitors is self-drive. In terms of international visitors, the dominant reason for travelling is holiday/leisure. Visitors tend to travel to the region alone or as an adult couple and a larger proportion is from Europe. The exceptions are the Gold Coast and Tropical North Queensland where a range of different travel parties travel to the region and a large proportion of visitors travel from Asia. As was the case with domestic visitors, self-drive is the main transport used to get to the region except for Tropical North Queensland.

15
Table 4: Typical domestic and international visitor features by region, 2010
Region Domestic Overnight International Gold Coast • Family or adult couple
• Interstate • March and December quarters • Self drive or air transport • Holiday/leisure or VFR • Repeat visitor
• Alone or adult couple • New Zealand or Asia (China,
Japan) • December quarter • Self drive or air transport • Holiday/leisure • First or repeat trip to Australia
Tropical North
Queensland
• Family group or adult couple • Intrastate • September quarter • Air transport • Holiday/leisure or VFR • Repeat visitor
• Alone or adult couple, • Asia (Japan, China) or Europe (UK) • December quarter • Air transport or self drive • Holiday/leisure • First trip to Australia
Sunshine Coast
• Adult couple or family • Intrastate • March quarter • Self drive • Holiday/leisure or VFR • Repeat visitor
• Alone or adult couple • New Zealand or Europe (UK) • September and December quarters • Self drive or long distance
coach/rail • Holiday/leisure • Repeat visitor to Australia
Northern Rivers
• Family/adult couple • Interstate • March quarter • Self drive • Holiday/leisure or VFR • Repeat visitor
• Alone or adult couple • Europe (UK) • March quarter • Self drive or long distance
coach/rail • Holiday/leisure • First trip to Australia
Mid North Coast
• Adult couple or family • Intrastate • March quarter • Self drive • Holiday/leisure or VFR • Repeat visitor
• Alone or adult couple • Europe (UK) • March and December quarters • Self drive • Holiday/leisure • First trip to Australia
South Coast • Family or adult couple • Intrastate • March quarter • Self drive • Holiday/leisure or VFR • Repeat visitor
• Alone or adult couple • Europe (UK) • March and December quarters • Self drive • Holiday/leisure or VFR • Repeat visitor to Australia
Australia’s South West
• Family or adult couple • Intrastate • March quarter • Private/company vehicle • Holiday/leisure or VFR • Repeat visitor
• Alone/adult couple • UK/Europe or Malaysia/Singapore • December and March quarters • Private/company vehicle • Holiday/leisure or VFR • Repeat visitor to Australia
Regional Australia
(excluding capital cities)
• Adult couple, family or alone • March quarter • Intrastate • Self drive • Holiday/leisure, VFR or business • Repeat Visitor
• Alone or adult couple • New Zealand, Europe (UK) or Asia
(Japan) • December and March quarters • Self drive or air transport • Holiday/leisure • Repeat visitor to Australia
National Benchmark
• Family, adult couple or alone • Intrastate • March quarter • Self drive or air transport • Holiday/leisure, VFR or business • Repeat Visitor
• Alone or adult couple • New Zealand, Asia or Europe • December and March quarters • Self drive or air transport • Holiday/leisure or VFR • Repeat visitor to Australia
Source: TRA – National Visitor Survey, International Visitor Survey

16
3.5 Information sources and booking
The internet was the most popular information source for domestic visitors4 to these regions, especially those in the larger regions of Tropical North Queensland, the Gold and Sunshine Coasts, which had similar proportions as the capital cities. Compared to other regional areas in Australia (excluding capital cities), the proportion that used the internet was higher except for the South Coast, Mid North Coast and Australia’s South West. This trend is also consistent for booking on the internet.
Table 5: Information sources used across regions
Region Internet Previous Visits No information sources used
Gold Coast 50% 17% 35%
Tropical North Queensland
51% 16% 27%
Sunshine Coast 42% 17% 40%
Northern Rivers 38% 17% 41%
Mid North Coast 32% 21% 43%
South Coast 30% 24% 41%
Australia’s South West
31% 17% 48%
Regional Australia (excluding capital
cities)
33% 18% 42%
National Benchmark 37% 17% 40%
Source: TRA National Visitor Survey
In terms of what visitors booked on the internet, accommodation was the most common item booked across all regions as was air travel for the Gold Coast, Sunshine Coast and Tropical North Queensland and car hire in Tropical North Queensland. Given the large proportion of domestic repeat visitors in these regions, it is not surprising that previous visits were also a popular source of information for visitors, especially in the South Coast and Mid North Coast. Many visitors report not using any information sources at all, although this is less the case for visitors to Tropical North Queensland and the Gold Coast.
3.6 Satisfaction with the region
Overall satisfaction with the destinations was either similar to or above the benchmark5. The regions where the destinations were above the benchmark in terms of satisfaction were the Sunshine Coast (59% very satisfied; 92% satisfied overall) and Northern Rivers (55% very satisfied; 92% satisfied overall). On average, the overall satisfaction with the group of destinations as a whole was 53% very satisfied and 88% satisfied overall. This
4 Information sources in the NVS and IVS are collected at the trip level rather than stopover level. Just under half of international visitors to Australia stop in more than one destination compared to 90% for domestic visitors. Thus inferences between information sources for international visitors at the region level will not be drawn. 5 Based on 73 destinations in the VPS benchmark database. Destinations within plus/minus three percentage points of the benchmark are considered similar.

17
is a higher satisfaction than the average of the remaining destinations which was 51% and 85% respectively.
The main drivers of satisfaction in these regions are the local atmosphere, the variety of things to see and do and value for money. This is not unlike other destinations generally. In terms of satisfaction with these attributes, satisfaction levels in the destinations in these regions and destinations more broadly showed little difference.
However, there are a number of attributes where satisfaction levels are higher in these regions compared with destinations in general. These include attributes that would be expected from larger established regions such as commercial accommodation, local transport, tours, shopping and entertainment and nightlife. Satisfaction was lower for some key attributes in these regions including roads, signage and information services. This was more of a case of visitors stating they were more neutral with their satisfaction with the attributes compared with the benchmarks rather than dissatisfied with them.
4. Conclusion and implications Through forming a profile of the set of regions with larger tourism industries and a higher economic importance of tourism it has become evident that a wide range of similar aspects link the regions together. All are on the coast and have National Parks, with the key experiences and activities in the regions revolving around the beach and nature. These key experiences enable visitors to relax, recharge and take a break from their every day life, all key motivators for Australian consumers to travel. The regions are all easily accessible by both major roads and air travel and offer a range of accommodation establishments. A typical domestic visitor to these regions has visited previously and visits the region for holiday or leisure purposes. Moreover, they travel as an adult couple or family group visiting the region for a week or less. In contrast, a typical international visitor also visits the region for holiday or leisure purposes, but travels alone or as an adult couple and stays for a longer period of time in the region. Overall, visitors are generally satisfied with their visit to these seven regions, and the drivers of this satisfaction are the local atmosphere, the variety of things to see and do and value for money. Visitors are also very satisfied with the commercial accommodation, local transport, tours, shopping and entertainment and nightlife of these destinations, generally key attributes of larger tourism destinations.
The level of economic importance of tourism in these regions, while emphasising the significance of the tourism industry, also leads to potential vulnerabilities. Each of the regions identified in this report relies on a similar product offering in attracting visitors. They also show a degree of seasonality in the patterns of visitation. Shocks that impact on the desirability of travel or the peak season of these regions would have a potentially large economic impact in the region. Given these regions also contribute significantly to Australia’s tourism industry the impact could also affect the economy more broadly.
In recent times Australians choosing to travel to nearby overseas destinations rather than at home has become an important factor for the decline in the domestic tourism industry. The experiences offered by outbound destinations like Indonesia (Bali) and Fiji are similar to those offered by these regions with these destinations having the added bonus of seeming exotic and different, important motivators for Australian consumers

18
(TRA, 2007). Factors such as increasing air access to outbound destinations, the strong Australian dollar and the value for money proposition offered by these overseas destinations makes this set of highly dependent regions vulnerable to further increases in outbound travel. This is further exaggerated by the key domestic markets for these regions also making up the highest proportion of outbound travellers to these overseas destinations. When this difficult tourism environment is combined with the fact that domestic consumers are becoming more demanding and discerning with regard to both their time and money (TRA, 2007), it is important that the tourism industry identifies and offers what consumers require from their travel. Therefore, the ability to understand the common drivers and features in these larger tourism dependent regions and what differentiates them from other Australian tourism regions more generally is of value. It is valuable for this set of regions themselves as it indicates what they do well and also areas that potentially require more focus. Finally, other regions broadly around the nation may use these findings to draw key insights and identify opportunities within their own region.

19
Appendices
Appendix A: Individual region profiles
A1 Gold Coast and Tropical North Queensland
Being the two largest regions in this set by total expenditure, there are a number of important similarities between the Gold Coast and Tropical North Queensland. Most notable is the size of their international visitor base relative to this group of regions.
The Gold Coast and Tropical North Queensland have experienced the slowest growth in international visitors over the past decade, relative to this group and nationally. Countering this is the fact that a high proportion of international visitors to these two regions are from the Asian visitor market (48% and 34% respectively). This also provides an explanation for the high proportion of package trips by international visitors relative to the other regions in this profile.
Domestic visitors to the Gold Coast and Tropical North Queensland are generally similar to other regions, although with a few notable differences. Similar to international visitors, many stay in hotels, resorts or motor inns and use air transport to visit the region. Additionally, domestic visitors come from a diverse base of regions across a number of states, unlike other regions where the majority of domestic visitors reside in adjacent regions.
Gold Coast
Possessing the largest tourism industry of the seven profiled regions and trailing only Sydney, Melbourne and Brisbane, the Gold Coast is the fourth largest tourism region in Australia by tourism expenditure. Moreover, of the regions profiled in this report the Gold Coast attracted the largest numbers of domestic and international visitors.
The Gold Coast is a popular destination for international visitors at each life stage, excluding older couples, with parents constituting the largest group (26% of visitors). This is higher than the other profiled regions but is in line with the national benchmark. Moreover, 16% of international visitors travel as a family group, which is not only higher than regions in this profile but also the national average. However, while only 3% of international visitors travel to the region for education purposes, they make up 29% of visitor nights. When coming to the region, visitors use a mix of air (30%), self drive (34%) and charter/tour buses (14%).
While the number of repeat visitors (49%) to the Gold Coast is lower than the national average, this does not seem to be an indication that visitors to the region are unsatisfied. Predominantly visitors expect experiences relating to relaxation, luxury, enjoyable nightlife and good shopping. They are generally satisfied at or above benchmark levels, with a high proportion of visitors satisfied with shopping and nightlife aspects of the region.

20
Tropical North Queensland
While similar to the Gold Coast, Tropical North Queensland is in other ways the most different from the other regions in this profile, largely due to its location and vast geographical size. There are a large number of accommodation providers in Tropical North Queensland spread evenly across all types. However, 59% of international and 47% of domestic visitors to Tropical North Queensland stay in hotels, resorts, motels and motor inns. These proportions are the highest for this profile and also are above the national average.
Tropical North Queensland is more reliant on the airline industry for transporting visitors to the region, with 57% of international and 51% domestic visitors using air transport, very high figures both in relation to the profiled regions and nationally. Notably, it is the only profiled region with a port; however, while more widely used than in other regions it is not a significant transport method. Tropical North Queensland also differs from other regions in that it has a strong September peak season for domestic visitors and a mixed September/December peak for international visitors.
Relative to the other regions in this profile, Tropical North Queensland has similar numbers of domestic and international visitors. A number of specific facts separate these visitors from each other:
• 49% of domestic visitors spend 3 to 7 nights in Tropical North Queensland, with 15% spending 8 to 14 nights. These figures are the highest for the profile and above the national average.
• 70% of international visitors to Tropical North Queensland are travelling to Australia for the first time. This is the highest proportion for this profile and well above the national average.
• Tropical North Queensland experienced some growth in domestic (overnight and day) visitors and visitor nights over the past decade.
Visitors to Tropical North Queensland are generally satisfied with their experiences, with 53% very satisfied overall. The majority of visitors make their decision to travel more than three months prior, a figure well above the national average. The longer distance that most visitors have to travel to the region may impact upon this decision.
A2 Sunshine Coast
Although similar in geography to the Gold Coast, with its beaches and hinterland, the Sunshine Coast shares more similarities with other regions in this profile than with its Queensland counterparts. While it has the third highest volume of international visitors, it still significantly trails the large international destinations of the Gold Coast and Tropical North Queensland. International visitors to the region are more likely to have visited Australia before (56%). This is unsurprising as the dominant international visitor origin is New Zealand (30%), of whom 97% have previously visited Australia. With only a domestic airport servicing the region and Brisbane airport located only an hour south, international visitors predominantly drive (59%) or use long distance coach/bus (21%) when travelling to the Sunshine Coast. The Sunshine Coast’s peak season for international travellers is the September Quarter, while for all other regions (excluding Tropical North Queensland) this is either their off-season or shoulder period. A positive

21
for the Sunshine Coast is that both international visitors and visitor nights have shown solid upward trends over the past decade in a fairly flat market.
This upward trend in international visitors should be weighed against a distinct fall in daytrips in the last few years. This fall has corresponded with a significant increase of daytrips to the Gold Coast. Given competition from the Gold Coast and Northern Rivers regions this may be of some concern, as 54% of all daytrip visitors to the Sunshine Coast are from the Brisbane region. Moreover, almost half of all domestic overnight visitors to the Sunshine Coast are also from the Brisbane region. This is countered by the high proportion of repeat visitors, with 84% of domestic visitors have previously visited the Sunshine Coast.
Visitors are generally very satisfied with their Sunshine Coast experiences. This is confirmed by figures that show, relative to other regions, visitors to the Sunshine Coast report the highest levels of being very satisfied and to recommend the Sunshine Coast to others.
A3 Northern Rivers
With three domestic airports in the region servicing 83 flights to and from Sydney, 20 flights to and from Melbourne per week, and Gold Coast Airport less than 5 minutes from the region, Northern Rivers is an accessible destination for both domestic and international travellers. When this is combined with its location, the result is a diverse range of domestic visitor origins when compared with the other regions in this group. In the international market Northern Rivers is a focal region for European tourists, with 30% from the UK, 11% from Germany and 29% from other European nations.
As expected, these European visitors drive a significant backpacker market in Northern Rivers, indicated by the following:
• 34% of international visitors use long distance bus/coach to travel to Northern Rivers,
• 48% stay in backpacker hostels, • 66% are visiting Australia for the first time, and • 61% are young or midlife singles, with 59% travelling alone.
Domestic visitors to Northern Rivers, however, are likely to be families (41%) or older couples (23%), which is in line with both national averages and this group of regions. Northern Rivers is a region where visitors do not spend long periods of time, with 91% of domestic visitors spending a week or less and 30% just one night. However, it is a region where domestic visitors travel repeatedly, with 78% having previously visited Northern Rivers.
While the proportion of repeat visitors is lower than the benchmark, it does not necessarily indicate that visitors are unsatisfied with the region. This is confirmed by the fact that 55% of visitors to the Kingscliff/Cabarita area were very satisfied, relative to the national benchmark of 51%. Travelling to this area visitors generally expect to relax and rejuvenate (87%) or experience luxury and indulgence (48%). These experiences are usually better than expected and at a level above the national benchmark.

22
A4 Mid North Coast
The second most reliant region on domestic visitors in this profile, domestic (day and overnight) visitors to the Mid North Coast outnumber international visitors forty four to one. This figure may be influenced by the location of the nearest international airport on the Gold Coast. This reliance should be weighed against the fact that 82% of domestic visitors to the region have previously visited the Mid North Coast. An indication that visitors travel to the Mid North Coast at regular intervals is the fact that 46% of visitors decided to travel to the region more than three months before their trip, well above the national average of 30%. Moreover, while visitors are generally satisfied with the Mid North Coast, a high proportion are very satisfied specifically with important trip aspects, which include attractions, local atmosphere and personal security and safety. Also contributing to the high numbers of domestic visitors is the Mid North Coast’s location in relation to the large population centres of the Hunter and Sydney. The typical domestic traveller to the Mid North Coast is either a family or older couple who drives to the region and stays for a week or less in a hotel, resort or motor inn or at a friend’s or relatives property.
While not representing a large proportion of the total, international visitors to the Mid North Coast do represent a different group than those in other regions. This is possibly due to the Mid North Coast being the only region in this profile that does not have an international airport or is located adjacent to a region with one. Similarly to Northern Rivers, young and midlife singles represent a high proportion (43%) of international visitors to the region. This group of travellers is coupled with the high proportion of older single international visitors (22%), which helps push the higher than average use of caravan accommodation (26%).
A5 South Coast
One of the most diverse regions out of the seven profiled, thanks in large part to its size and industries, the economic importance of tourism is the second lowest for the South Coast region. While this is the case, the South Coast has a very large and important domestic visitor market, where domestic visitors outnumber international visitors sixty nine to one. For domestic visitors and visitor nights, the South Coast has the largest peak season out of any of the regions, occurring in the March Quarter, which may place strain on the region at other periods of the year. The South Coast does have a high proportion of repeat domestic visitors (77%), most of whom come from the adjacent Sydney region. More than half (59%) of daytrip and 44% of overnight visitors to the South Coast travel from the Sydney region.
Although relatively small, the profile of international visitors to the South Coast is idiosyncratic, relying more on the international student market than other regions. Just over one in ten (11%) of international visitors spend 28 days or more in the South Coast, more than any of the other regions in this report, a figure clearly driven by education visitors. While only 7% of visitors travel for education, 56% of international visitor nights are attributable to education visitors. Moreover, 57% of visitors have previously visited Australia before. This figure is influenced by visitors from New Zealand, China and other Asian nations. Visitors from these nations to the South Coast have visited Australia on a previous occasion 96%, 69% and 67% respectively.

23
A6 Australia’s South West
The only region not on the east coast of Australia, Australia’s South West provides some valuable insights through its different geographical location. With regional tourism expenditure of $881 million, 1.6 million visitors and 7.1 million visitor nights, Australia’s South West is one of the smaller regions ranking sixth out of the seven regions for each of these measures. However, it is also the least economically dependent on tourism out of these seven regions, which can be attributed partly to the presence of the mining industry in the region. Contributing to its size is the fact that it has the fewest accommodation establishments and tourism businesses.
Although small, Australia’s South West is a region that visitors return to; with a high proportion (85%) of repeat domestic visitors. This figure is most likely driven by the fact that 90% of domestic visitors to the region come from Western Australia, with 72% alone from the neighbouring Perth region. For international visitors to the region, 68% have visited Australia on a previous occasion. This is assisted by the location of Perth Airport less than two hours from the region. The magnitude of this figure is driven by repeat visits to Australia by Asian tourists. Being located on the West Coast makes Australia’s South West a desirable location for visitors from the UK, Singapore and Malaysia, which constitute 24%, 10% and 6% of international visitors, respectively. The presence of agricultural and mining industries in the region leads to a greater presence of international visitors nights taken up by employment purposes, relative to regions in this group and also nationally.
With 92% of domestic visitors spending a week or less in the region, Australia’s South West can be seen as a shorter visit location. Its adjacency to Perth makes two night visits (29% of total visits) for families and older couples (38% and 28% of total domestic visitors respectively) popular. While only 14% of trips are package, this is the highest proportion of the seven regions.

24
Appendix B: Detailed Results
Table B1: Proportion of overnight domestic overnight visitors by lifecycle group, 2010 (%)
Tourism region Young/midlife singles, no kids
Young/midlife couple, no kids
Families Older singles Older couples
Gold Coast 19 9 41 6 24
Tropical North Queensland 15 8 43 9 25
Sunshine Coast 15 14 40 7 25
Northern Rivers 19 10 41 6 23
Mid North Coast 15 9 38 7 31
South Coast 17 9 42 7 24
Australia’s South West 17 10 38 7 28
Regional Australia (excluding capital cities) 17 10 39 8 26
National average 17 10 39 8 25 Source: TRA National Visitor Survey
Table B2: Proportion of international visitors by lifecycle group, 2010 (%)
Tourism region Young/midlife
singles, no kids Young/midlife couple, no kids
Families Older singles Older Couples
Gold Coast 33 16 26 5 20
Tropical North Queensland 38 18 18 6 20
Sunshine Coast 39 14 14 8 25
Northern Rivers 61 15 8 5 12
Mid North Coast 43 15 12 7 22
South Coast 35 14 17 9 26
Australia’s South West 28 12 19 12 29
Regional Australia (excluding capital cities) 32 14 22 8 23
National average 33 13 27 7 20 Source: TRA International Visitor Survey

25
Table B3: Proportion of domestic overnight visitors by travel party, 2010 (%)
Tourism region Alone Adult couple Family group Friends and/or relatives
Other
Gold Coast 17 27 33 18 5
Tropical North Queensland 20 26 27 18 9
Sunshine Coast 15 32 30 21 3
Northern Rivers 19 27 32 19 4
Mid North Coast 13 34 31 19 3
South Coast 15 29 34 18 4
Australia’s South West 16 30 27 22 5
Regional Australia (excluding capital cities) 20 27 27 19 7
National average 25 26 24 17 7
Source: TRA National Visitor Survey
Table B4: Proportion of international visitors by travel party, 2010 (%)
Tourism region Alone Adult couple Family group Friends and/or relatives
Other
Gold Coast 37 29 16 14 4
Tropical North Queensland 37 34 12 15 2
Sunshine Coast 48 32 8 11 1
Northern Rivers 59 21 4 16 0
Mid North Coast 50 31 7 12 0
South Coast 56 28 7 8 1
Australia’s South West 43 36 8 12 1
Regional Australia (excluding capital cities) 46 29 11 11 3
National average 56 22 9 9 4 Source: TRA International Visitor Survey

26
Table B5: Proportion of domestic overnight visitors by origin, 2010 (%)
Tourism region Interstate Intrastate
Gold Coast 54 46
Tropical North Queensland 40 60
Sunshine Coast 28 72
Northern Rivers 54 46
Mid North Coast 15 85
South Coast 25 75
Australia’s South West 10 90
Regional Australia (excluding capital cities) 24 76
National average 34 66 Source: TRA National Visitor Survey
Table B6: Proportion of international visitors by origin, 2010 (%)
Tourism region New
Zealand Japan Singapore Malaysia China Other Asia
USA/ Canada
United Kingdom
Other Europe
Other Countries
Gold Coast 24 13 3 4 15 13 6 8 9 5
Tropical North Queensland 5 16
11 6 15 15 26 5
Sunshine Coast 30 1 1 1
3 9 23 27 5
Northern Rivers 8 2 1 1
2 11 30 39 6
Mid North Coast 9 1 1
1 6 16 27 35 4
South Coast 12 2 1 1 4 9 16 22 26 6
Australia’s South West 9 2 10 6 1 8 8 29 22 5
Regional Australia (excluding capital cities) 19 10 3 2 7 10 11 14 17 6
National average 19 7 5 4 8 16 10 11 12 7 Source: TRA International Visitor Survey

27
Table B7: Proportion of domestic overnight visitors by whether visited the region before, 2010 (%)
Tourism region First time visitor Repeat visitor
Gold Coast 18 82
Tropical North Queensland 19 81
Sunshine Coast 16 84
Northern Rivers 22 78
Mid North Coast 18 82
South Coast 23 77
Australia’s South West 15 85
Regional Australia (excluding capital cities) 21 79
National average 20 80 Source: TRA National Visitor Survey
Table B8: Proportion of international visitors by whether visited Australia before, 2010 (%)
Tourism region First time visitor Repeat visitor
Gold Coast 51 49
Tropical North Queensland 70 30
Sunshine Coast 44 56
Northern Rivers 66 34
Mid North Coast 60 40
South Coast 43 57
Australia’s South West 32 68
Regional Australia (excluding capital cities) 46 54
National average 37 63 Source: TRA International Visitor Survey

28
Table B9: Proportion of domestic overnight visitors by purpose of visit, 2010 (%)
Tourism region Holiday/leisure Visiting friends and/or relatives
Business Other
Gold Coast 59 29 9 3
Tropical North Queensland 56 23 20 2
Sunshine Coast 59 31 6 3
Northern Rivers 52 36 9 4
Mid North Coast 61 30 7 4
South Coast 61 29 9 3
Australia’s South West 62 27 10 3
Regional Australia (excluding capital cities) 51 32 14 4
National average 45 33 19 6 Source: TRA National Visitor Survey
Table B10: Proportion of international visitors by purpose of visit, 2010 (%)
Tourism region Holiday/leisure Visiting friends and/or relatives Business Education Other
Gold Coast 78 15 5 3 1
Tropical North Queensland 91 5 3 2 2
Sunshine Coast 79 18 2 2 1
Northern Rivers 87 10 2 2 1
Mid North Coast 84 15 1 1 1
South Coast 59 27 6 7 3
Australia’s South West 79 19 3 1 3
Regional Australia (excluding capital cities) 73 23 7 3 4
National average 54 36 17 9 8 Source: TRA International Visitor Survey

29
Table B11: Proportion of domestic overnight visitors by transport used to travel to region, 2010 (%)
Tourism region Air transport Self drive Other
Gold Coast 36 61 4
Tropical North Queensland 51 50 7
Sunshine Coast 17 80 4
Northern Rivers 13 84 3
Mid North Coast 5 92 3
South Coast 3 91 6
Australia’s South West 4 92 4
Regional Australia (excluding capital cities) 14 83 6
National average 25 72 7 Source: TRA National Visitor Survey
Table B12: Proportion of international visitors by transport used to travel to region, 2010 (%)
Tourism region Air transport Self drive Long distance coach/rail
Charter or tour bus Other
Gold Coast 30 34 10 14 16
Tropical North Queensland 57 20 9 12 17
Sunshine Coast 10 59 23 6 13
Northern Rivers 8 52 36 6 3
Mid North Coast 7 66 20 8 1
South Coast 9 78 10 2 7
Australia’s South West 7 88 6 2 2
Regional Australia (excluding capital cities) 39 49 13 13 18
National average 34 49 8 11 44 Source: TRA International Visitor Survey

30
Table B13: Proportion of domestic overnight visitors by accommodation, 2010 (%)
Tourism region Hotel, resort, motor inn
Rented house/serviced
apartment
Caravan or camping
Friends and/or relatives
properties Other
Gold Coast 34 26 6 30 5
Tropical North Queensland 47 17 12 27 7
Sunshine Coast 23 21 12 38 6
Northern Rivers 26 13 21 37 5
Mid North Coast 29 17 19 30 8
South Coast 19 12 23 37 11
Australia’s South West 22 17 19 34 11
Regional Australia (excluding capital cities) 29 13 17 36 11
National average 34 12 12 39 9 Source: TRA National Visitor Survey
Table B14: Proportion of international visitors by accommodation, 2010 (%)
Tourism region Hotel, resort, motor inn
Rented house/serviced
apartment
Caravan or camping
Friends and/or relatives
properties Backpackers Other
Gold Coast 48 20 3 17 10 5
Tropical North Queensland 59 10 7 6 25 6
Sunshine Coast 17 24 12 22 27 5
Northern Rivers 14 8 18 14 48 4
Mid North Coast 31 5 26 17 21 6
South Coast 30 12 20 33 4 10
Australia’s South West 31 26 19 22 9 10
Regional Australia (excluding capital cities) 47 20 12 27 14 13
National average 49 22 6 41 11 11 Source: TRA International Visitor Survey

31
Table B15: Proportion of domestic overnight visitors by length of stay in region, 2010 (%)
Tourism region 1 night 2 nights 3 to 7 nights 8 to 14 nights 15+ nights
Gold Coast 23 22 44 10 2
Tropical North Queensland 15 15 49 15 7
Sunshine Coast 25 25 39 9 2
Northern Rivers 30 26 35 8 1
Mid North Coast 20 28 43 8 2
South Coast 22 28 41 8 1
Australia’s South West 19 29 44 6 2
Regional Australia (excluding capital cities) 29 29 40 7 2
National average 32 29 39 6 2 Source: TRA National Visitor Survey
Table B16: Proportion of international visitors by length of stay in region, 2010 (%)
Tourism region 1 night 2 nights 3 to 7 nights 8 to 14 nights 15 to 27 nights 28+ nights
Gold Coast 10 24 46 11 3 5
Tropical North Queensland 3 18 57 13 4 5
Sunshine Coast 13 17 46 13 6 6
Northern Rivers 18 21 44 8 4 5
Mid North Coast 28 24 35 8 2 3
South Coast 21 19 33 10 7 11
Australia’s South West 8 19 51 11 5 7
Regional Australia (excluding capital cities) 16 21 38 12 5 8
National average 12 16 37 14 8 14 Source: TRA International Visitor Survey

32
References
Australian Bureau of Statistics, 2010, Counts of Australian Businesses, including Entries and Exits, Jun 2007 to Jun 2009, cat no. 8165.0, ABS, Canberra.
Tourism Research Australia, 2007, Changing consumer behaviour: Impact on the Australian domestic tourism market, TRA, Canberra.
Tourism Research Australia, 2011a, The Economic Importance of Tourism in Australia’s Regions, TRA, Canberra.
Tourism Research Australia, 2011b, Regional Tourism Profiles 2009/2010, TRA, Canberra.

Tourism Research Australia Department of Resources, Energy and Tourism GPO Box 1564 Canberra ACT 2601 ABN: 46 252 861 927
Contact us at www.ret.gov.au/tra