Embed Size (px)
Citation preview

THE ECONOMIC IMPACT OF LOUISIANA'S ENTERTAINMENT TAX CREDIT PROGRAMS
For
Office of Entertainment Industry Development Louisiana Department of Economic Development
By
Loren C. Scott & Associates, Inc. 743 Woodview Court
Baton Rouge, LA 70810 www.lorencscottassociates.com
225-751-1707
March 2015

ii
Executive Summary
The purpose of this report is to examine the economic impact of the Louisiana tax credit incentive programs for the entertainment industry as administered by the Office of Entertainment Industry Development (OEID) within the Louisiana Department of Economic Development (LED) as required by La R.S. 47:6007(D)(6); 47:6023(D)(5) and 47:6034(G). Six programs are examined: (1) film production, (2) film infrastructure---which sunset on January 1, 2009, (3) sound recording production, (4) sound recording infrastructure---which sunset on August 1, 2009, (5) live performance production, and (6) live performance infrastructure---scheduled to sunset on January 1, 2014. A history of each program's development and a comparison to similar programs in key competing states is reviewed. This analysis is based upon the amount of audited expenditures finally certified and credits issued in calendar years 2013and 2014 based upon the final certification date. The economic impact is measured and calculated upon this premise. A portion of the spending that has been subsequently certified in a given calendar year, likely occurred in a different year. However, the fiscal impact is not felt until the credits are certified and issued. An important caveat to inform the reader is that this report attempts to describe the impacts as resulting from the certified Louisiana spending. In reality, when measuring the economic impact of an activity on the state one should only include money actually spent within the state. Measuring the impacts using certified spending means including under the film production section, payments made to talent, directors, producers, and writers---who in most cases do not live in Louisiana and are therefore, unlikely to spend all that money in the state. Thus the state’s return on investment is typically worse for those projects (primarily films) that involve a large proportion of multi-million dollar payments made to non-residents. To more accurately measure the impact on the state's economy the payments made to these individuals should include only the portion of their salaries spent directly in the state and injected into the I/O table. The data indicate that about 27% of the certified film production spending goes to these individuals, which turns out to be 25.2% of the total certified entertainment spend across all programs.

iii
Table EX-1 shows the amount of tax credits certified by year in each of the six programs in 2013 and 2014.
Table EX-1
Tax Credits Certified Per Program: CY2013-CY14 ($ Millions)
Category 2013 2014
Film Industry
Production $251.1* $226.4*
Infrastructure $2.7 $0.0
Sound Recording
Production $0.2 $0.2
Infrastructure $0.1 $0.0
Live Performance
Production $0.4 $0.1
Infrastructure $8.2 $11.9
Total $262.7 $238.6 Source: Louisiana Department of Economic Development, Office of Entertainment Industry Development. *Gross total of credits issued based upon date of final certification in the calendar year. The amount of certified Louisiana spending in each of these six programs in 2013 and 2014 is shown in Table EX-2. For the purposes of this analysis, “certified Louisiana spending” is defined as the actual amounts of qualified spending verified by an independent audit and certified in the given calendar year based upon the final certification date when the tax credits are issued.
Table EX-2 Certified Spending in Louisiana: CY2013- CY14
($ Millions)
Category 2013 2014
Film Industry
Production $809.8 $727.1
Infrastructure $6.7 $0.0
Sound Recording
Production $0.7 $0.8
Infrastructure $0.3 $0.0
Live Performance
Production $2.0 $1.0
Infrastructure $31.7 $47.5
Total $851.2 $776.3 Source: Louisiana Department of Economic Development, Office of Entertainment Industry Development

iv
A state input-output table was used to estimate, inserting the direct spending in Table EX-2, the total impact on the Louisiana economy. Table EX-3 illustrates the impact in 2014 of each of the three programs on business sales, household earnings and jobs in the state. In that year the tax credit programs supported a little over $1.1 billion in sales at firms in the state, $760.2 million in household earnings for state residents, and 12,890 jobs. While not shown in the table, it is estimated that in 2014 this spending generated $53.2 million for the state treasury and another $34.2 million for local governments. The last column shows the weighted average of business sales per dollar of tax credits.
Table EX-3 Total Impacts Certified Spending on the Louisiana Economy: CY2014
($ Millions)
Category Business Sales Household Earnings Jobs
Sales per Dollar of Tax
Credit
Film Industry
Production $1,048.4 $727.8 12,107 $4.63
Infrastructure $0.0 $0.0 0 -
Sound Recording
Production $1.0 $0.7 21 $5.50
Infrastructure $0.0 $0.0 0 -
Live Performance
Production $1.2 $0.4 10 $11.20
Infrastructure $98.9 $31.3 752 $8.32
Total $1,149.5 $760.2 12,890 $4.82
No certified film infrastructure or sound recording infrastructure spending in 2014. *Weighted average across all programs.
Data from Table EX-2 along with certified tax credits were used to estimate the impact to the state budget of achieving the benefits shown in Table EX-3. The amount of the impact to the state’s budget and the cost to the state per job are shown in Table EX-4.

v
Table EX-4 Budgetary Impacts Across All Entertainment Programs: 2014
($ Millions)
Category Impact on State Budget Cost per Job to State per
Year Film Industry
Production -$171.4 $14,157 Infrastructure* None NA
Sound Recording
Production -$0.1 $6,872 Infrastructure* None NA
Live Performance
Production -$0.07 $6,983
Infrastructure -$9.7 $12,883 There was no film infrastructure or sound recording infrastructure spending in 2014.
The programs clearly have an economic impact to the state of Louisiana in the form of increased business sales and jobs for Louisiana residents. However, some expenditures that currently qualify have minimal direct impact to Louisiana’s economy. As a result, it is recommended that certain changes (documented in Section VI) recommended by the Alvarez & Marsal study be adopted. These changes include: (1) amending state law to eliminate certain spending presently qualified because the state enjoys little if any benefit from it, (2) changing state law to allow LDED to take steps to improve the quality of audits conducted on qualifying spending and (3) LDED should take steps to automate the analytics of the film expenditure review process.

vi
TABLE OF CONTENTS
Page
Executive Summary ...................................................................................................................... ii I. Introduction ................................................................................................................................1 II. History of Entertainment Incentives in Louisiana.................................................................1 Film - Legislative History ..................................................................................................1 Film-Administrative Improvements .................................................................................2 Sound Recording – Legislative History............................................................................5 Musical and Theatrical Production Income Tax Credit - Legislative History .............7 III. A Comparison to Programs in Other States .........................................................................8 Comparative Film Inducements .......................................................................................9
Incentives for Sound Recording and Live Performance .............................................11 IV. Economic Impacts of Entertainment Spending in Louisiana ............................................12 Direct Entertainment Spending in Louisiana ...............................................................12 Indirect Impacts of Entertainment Spending in Louisiana .........................................12 Measuring the Indirect Effects .......................................................................................13 Data Nuances for Impact Analysis .................................................................................13 Impact of Film Production Spending .............................................................................14 Impact of Film Infrastructure Spending .......................................................................15 Industry effects of Film Production Spending ..............................................................16 Impact of Sound Recording Production Spending .......................................................17 Impact of Sound Recording Infrastructure Spending ..................................................18 Sound Recording Production & Infrastructure Industry Effects ...............................18 Impact of Live Performance Production Spending ......................................................18 Impact of Live Performance Infrastructure Spending .................................................19 Live Performances Production & Infrastructure Industry Effects ............................20 Total Impacts of All Certified Entertainment Spending ..............................................21 V. Benefits Compared to Tax Credits ........................................................................................23
Impact on the State Treasury.........................................................................................24 Uses for Tax Credits ........................................................................................................24 Tax Credits and Film Production ...................................................................................26 Tax Credits and Film Infrastructure .............................................................................27 Tax Credits and Sound Recording Production .............................................................27 Tax Credits and Sound Recording Infrastructure .......................................................28 Tax Credits and Live Performance Production ............................................................28

vii
Tax Credits and Live Performance Infrastructure ......................................................29 Summary of Budgetary Impact for 2012 .......................................................................29 VI. Recommendations for Program Improvement ...................................................................30 VII. Summary & Conclusions .....................................................................................................31

I. Introduction
The purpose of this report is to examine the economic impact of the Louisiana tax credit incentive programs for the entertainment industry as administered by the Office of Entertainment Industry Development (OEID) within the Louisiana Department of Economic Development (LED) as required by La R.S. 47:6007(D)(6); 47:6023(D)(5) and 47:6034(G). Six programs are examined: (1) film production, (2) film infrastructure---which sunset on January 1, 2009, (3) sound recording production, (4) sound recording infrastructure---which sunset on August 1, 2009, (5) live performance production, and (6) live performance infrastructure. A history of each program's development and a comparison to similar programs in key competing states is reviewed. In Section II of this report, a brief history of the legislation that has been adopted to secure these industries for Louisiana is highlighted and shows recent trends in the four different areas over 2008-14. A comparison of Louisiana's entertainment promotion programs to those in several competing states is the topic of Section III. A key question is to what extent have these incentives impacted business sales, household earnings, jobs, and tax collections in the state? That is the topic covered in Section IV. While the impacts estimated in Section IV may be impressive, it is important to compare those benefits to the cost of the program to the state's budget. That is the subject of Section V. In Section VI, the information covered to that point in the report is used to make suggestions for future changes in the incentive program if any appear warranted. A summary and conclusions follow in Section VII.
II. History of Entertainment Incentives in Louisiana Film - Legislative History1:
The modern day film incentive program was originally enacted in 2002 as a non-transferable tax credit program for film investors. In later years, the program has been enhanced to include fully transferable tax credits, an infrastructure tax credit (which has since sunset), and a state-buyback.
Substantive details of the program are documented in the timeline below:
In 2002, the modern Motion Picture Investor Tax Credit Program was created. The program allowed for a 10% tax credit to be earned on projects investing between $300,000 and $1,000,000 with an additional 10% for Louisiana payroll. For investments greater than $1,000,000 a 15% tax credit was allowed and an additional 20% for
1 Film: Acts 2002, 1st Ex. Sess., No. 6, §1, eff. July 1, 2002; Acts 2003, No. 551, §§3 and 6; Acts 2003, No. 1240, §3, eff. July 1, 2003; Acts 2004, 1st Ex. Sess., No. 7, §1, eff. March 25, 2004; Acts 2005, No. 456, §1; Acts 2007, No. 456, §2, eff. July 1, 2007; Acts 2009, No. 478, §1, eff. July 9, 2009; Acts 2009, No. 530, §1, eff. July 10, 2009; Acts 2010, No. 633, §2, eff. July 1, 2010.

2
Louisiana payroll. In addition, there was a sales tax exemption on purchases totaling $250,000 or more in Louisiana.
In 2003, minor tweaks were made to the program to increase the investment range and the credits were made transferable. A 10% tax credit on investments between $300,000 and $8,000,000 was allowed, and a 15% tax credit was allowed on investments greater than $8,000,000. The Louisiana payroll credit remained the same as did the sales tax exemption.
In 2005, the first wave of major changes to the program was enacted. A 25% credit was allowed on in-state expenditures from January 1, 2006 through December 31, 2009, a 20% credit from January 1, 2010 through December 31, 2011 and a 15% from January 1, 2012 onwards. The Louisiana payroll credit was made 10% across the board. In the same statute, for the first time, an infrastructure incentive program was enacted at a total rate 40% (the original statute allowed for 25% plus an additional 15% for state-certified infrastructure projects). The sales tax exemption was removed and a full audit became mandatory for any project seeking motion picture tax credits. Also, the state buy-back provision was added starting at 72% of the face value of the credits and increasing 2% every two years starting in 2009 until the percentage reached 80%.
In 2007, minor clarifications were made to the production credit, and the infrastructure credit---originally scheduled to sunset at the end of 2007---was extended another year to January 1, 2009. For further details on specific program requirements, see the legislation referenced in the footnote below.
A second wave of major changes was enacted in 2009. The credit on in-state spending was raised to 30% without a sunset. The scale back in the credit value was removed, the Louisiana labor wage was reduced to 5% and the state buy-back was increased to 85% of the face value of the credits.
The current program has no sunset and remains at 30% of qualified in-state spending on goods and services performed in Louisiana. An additional 5% (limited to the first $1,000,000 per Louisiana resident, per project) may be earned by the production for the employment of Louisiana resident labor. The tax credits remain fully transferable and there are three options for claiming these credits: First, the entity or individual that earns the credit can utilize it to offset any personal or corporate income tax liabilities. Second, the credits can be transferred to another Louisiana taxpayer. Third, the credits can be transferred back to the state for 85 percent of the face value of the credits.
Film - Administrative Improvements
Since 2008, significant improvements have been made to the program and the administration of the program as follows:
A new legal position was funded that was dedicated to supporting the Office of Entertainment Industry Development (OEID) programs in 2008. Previously there

3
was dedicated legal staff to support OEID, including the Motion Picture Tax Credit Program.
Several staff positions were added in 2008 dedicated to administering OEID programs not associated with the Motion Picture Investor Tax Credit program, which enabled OEID staff members handling the Motion Picture Tax Credit Program to focus exclusively on administering and marketing that program (whereas before they had to divide their time across multiple incentive programs);
Following years of negotiations and hearings with industry stakeholders and the legislative oversight committees, as well as multiple changes in related state law (in 2003, 2004, 2005, 2007, and 2009) that followed enactment of the modern-day Motion Picture Tax Credit Program in 2002, program rules were promulgated in 2010, and since promulgation they have been regularly issued to all applicants;
With extensive input from the Louisiana Society of CPAs, audit guidelines for the Motion Picture Tax Credit Program, which are provided as an attachment to initial certifications, were strengthened and made more specific to the particular nature of the program in 2009, 2011 and 2012;
Following the creation of a new mechanism to authorize and fund additional audits (at the direction of the Louisiana Department of Economic Development (LED)) when appropriate, the OEID entered into a professional services contract with a forensic auditor who conducts such audits on a case-by-case basis on behalf of the state;
OEID launched an updated website (LouisianaEntertainment.gov) in 2010, updated in 2012 and again in 2014, with an enhanced focus on informational notices, current audit guidelines and FAQs designed to better educate the entertainment industry on the Motion Picture Tax Credit Program (and other OEID programs), such as eligible and ineligible expenditures.
An obvious question is whether the legislative and administrative tweaks to the film production tax credit program have had any measurable effect in attracting the industry to Louisiana? The data on actual certified Louisiana spending on film production that has utilized the tax credit program over 2008-14 that are shown in Figure 1 is revealing. Since 2011, the data seems to indicate that the program is leveling off to some degree. The spending and credits issued have been fairly consistent across these years. Note that in the 7-year period from 2008-14, actual certified spending in Louisiana on film production (that utilized the tax credit program) is up by $264.5 million since 2008---over a quarter of a billion dollars---an improvement of 57%.

4
When it comes to the certified film infrastructure spending in Louisiana the same sort of pattern does not exist, as seen in Figure 2. While film production spending increased in 2011-2014, film infrastructure spending fell. This spending reduction is because the motion picture infrastructure program is no longer active and sunset at the end of 2008 (statutory descriptions are detailed in the history section above). Tax credits were issued from 2010 through 2013 as a result of projects that were closing out their spending, and Figure 2 notes a steady decline in certified spending for these calendar years which, again, is appropriate for a program that is no longer active. There was no film infrastructure spend certified in 2014. It is apparent that the film infrastructure spending in the earlier years worked as an added incentive to attract film production spending in the following years by providing the state with much needed infrastructure.
0
100
200
300
400
500
600
700
800
900
2008 2009 2010 2011 2012 2013 2014
462.6499.3
387.1
677.0717.2
809.8
727.1
Fig. 1: Certified Film Producton Spend in LouisianaM
illio
ns
of
Do
llars
Calendar Year

5
Sound Recording - Legislative History2:
Louisiana has a rich musical heritage, and the Sound Recording Investor Tax Credit Program, enacted in 2005, was designed to increase sound recording productions in Louisiana. The program’s primary objective is to encourage development in Louisiana of a strong investment base for sound recording productions in order to achieve an indigenous sound recording industry. The sound recording program has provided support for many Grammy winning and nominated recordings including most recently, Landmarks by Brian Blade and the Fellowship Band recorded in Shreveport. Also, Dr. John’s latest critical success, Ske-Dat-De-Dat: The Spirit of Satch, utilized the sound recording program.
2 Sound: Acts 2005, No. 485, §1, eff. July 12, 2005, applicable to tax years beginning on and after Jan. 1,
2006; Acts 2007, No. 368, §1, eff. July 10, 2007; Acts 2009, No. 475, §1.
0
10
20
30
40
50
2008 2009 2010 2011 2012 2013 2014
21.7
32.7
43.2
22.3
18.0
6.7
Fig. 2: Certified Film Infrastructure Spend in LouisianaM
illio
ns
of
Do
llars
Calendar Year

6
Again, the first legislation was passed in 2005 and it was scheduled to sunset in 2008. The program originally granted tiered tax credits of 10%, 15% or 20% based on level of expenditures for qualifying recording and infrastructure projects. There was a minimum spend requirement of $15,000. In 2007, the sunset was extended to January 1, 2010. Credit was changed to 25% for all projects applying after July 1, 2007 that met a minimum spending requirement of $15,000. In 2009, the sunset for production was extended to January 1, 2015. Sunset of infrastructure program was set at August 1, 2009. The program is capped annually at $3,000,000 and is a 100% refundable tax credit.
In 2013, the sunset for production was extended to January 1, 2020. An additional spend threshold of $5000 was enacted exclusively for Louisiana resident’s applying to the program. Figure 3 illustrates the total Louisiana spending on both sound recording production and infrastructure. The charted decline between calendar years 2011 and 2014 highlights the sunset of the sound recording infrastructure program which had seen the bulk of related spending finally certified in calendar years 2010 and 2011. In 2013 and 2014, the sound recording production has seen a slight increase in the use of the program. This may be attributed to the decrease in the spending threshold for Louisiana resident musicians and an increased focus on marketing/advertising over the course of the past two or three years.
0.0
0.5
1.0
1.5
2.0
2.5
3.0
3.5
4.0
2008 2009 2010 2011 2012 2013 2014
Fig. 3: Certified Sound RecordingProduction & Infrastructure Spend in Louisiana
Mill
ions o
f D
olla
rs
Calendar Year
1.6
0.4
2.8
3.5
0.4
1.00.8

7
Musical and Theatrical Production Income Tax Credit Program - Legislative History3: The Musical and Theatrical Production Income Tax Credit Program (also called the live performance tax incentive program) is the least mature of the entertainment incentive programs, but its early successes have been substantial and, much like the film program, other states are following Louisiana’s lead by creating similar incentive programs. The program has provided support for major infrastructure projects in New Orleans, Shreveport, Baton Rouge, Lake Charles and Monroe. The damage from Katrina to New Orleans’ historic theaters provided the impetus for the original legislation.
In 2013/2014, major concert tour launched out of Louisiana and utilized the live production incentive. The state welcomed some of the biggest names in music including George Strait, Jason Aldean and Eric Church. Several debut performing arts and concert series also launched via use of the incentive including Broadway at NOCCA, The Bowery Series at the Civic Theater, Bold Sphere Concert Series at Champions Square, The New Orleans Opera Association, and The Winter Circle Progression Series at The Joy Theater. The Musical and Theatrical Production Income Tax Credit program was originally enacted in 2007. The focus of the program is twofold: (1) renovation, restoration and construction of new and existing musical and theatrical production infrastructure, and (2) encouraging investment in production which originates in the State of Louisiana in the form of tour launches, pre-Broadway tryouts, technical rehearsals, and new resident and regional productions.
Again, in 2007 the first legislation was passed authorizing a refundable or transferable tax credit of 10%, 20% or 25% based upon level of expenditures with an additional 10% labor credit for Louisiana residents for qualifying production and infrastructure projects. The infrastructure program was capped at $60,000,000 annually; however, there is no cap on production credits. In addition, while there is no sunset on production credits, there was a January 1, 2014 sunset on infrastructure credits. In 2009, minor statutory revisions were made to clarify definitions and the scope of qualifying projects. No material changes were made to the credits. In 2013, there were additional minor revisions made to the statue in order to clarify definitions, qualifying expenditures and extend the spending deadline for state-certified infrastructure projects to December 31, 2014. An additional infrastructure
3 Live: Acts 2007, No. 482, §1, eff. July 19, 2007; Acts 2009, No. 448, §1, eff. July 8, 2009; Acts 2009,
No. 465, §1, eff. July 8, 2009.
8
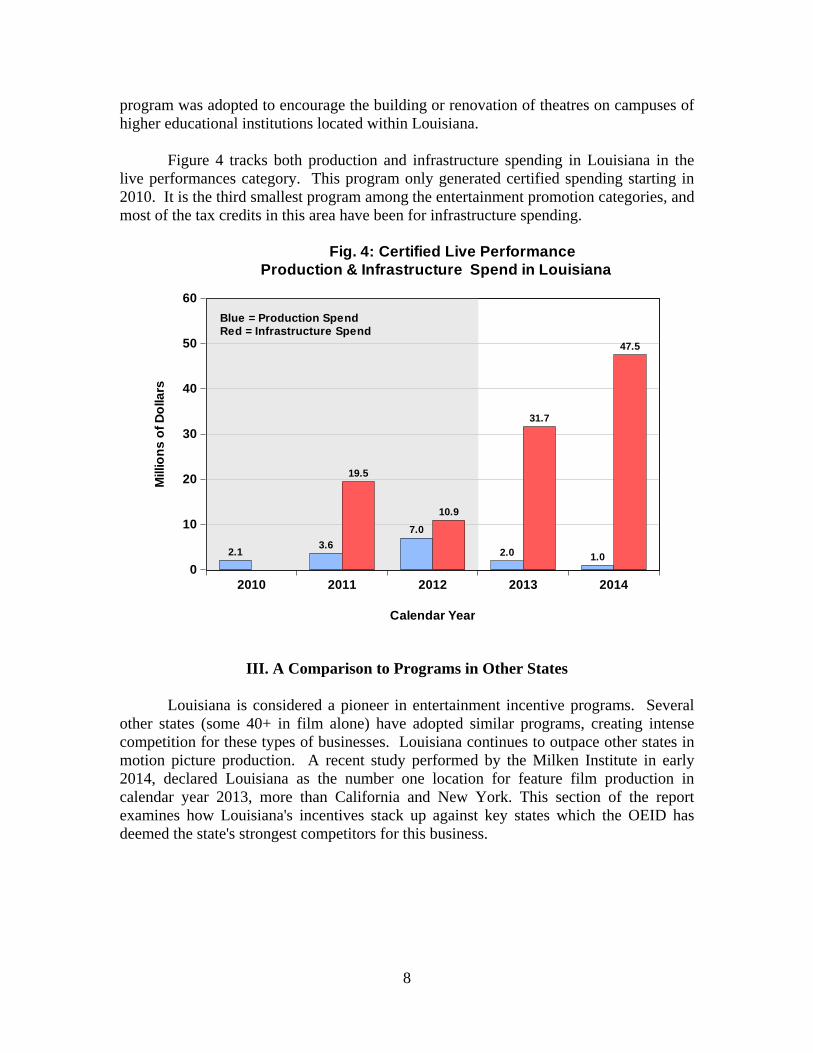
program was adopted to encourage the building or renovation of theatres on campuses of higher educational institutions located within Louisiana. Figure 4 tracks both production and infrastructure spending in Louisiana in the live performances category. This program only generated certified spending starting in 2010. It is the third smallest program among the entertainment promotion categories, and most of the tax credits in this area have been for infrastructure spending.
III. A Comparison to Programs in Other States
Louisiana is considered a pioneer in entertainment incentive programs. Several other states (some 40+ in film alone) have adopted similar programs, creating intense competition for these types of businesses. Louisiana continues to outpace other states in motion picture production. A recent study performed by the Milken Institute in early 2014, declared Louisiana as the number one location for feature film production in calendar year 2013, more than California and New York. This section of the report examines how Louisiana's incentives stack up against key states which the OEID has deemed the state's strongest competitors for this business.
0
10
20
30
40
50
60
2010 2011 2012 2013 2014
2.13.6
19.5
7.0
10.9
2.0
31.7
1.0
47.5
Fig. 4: Certified Live Performance Production & Infrastructure Spend in Louisiana
Mill
ion
s o
f D
olla
rs
Calendar Year
Blue = Production SpendRed = Infrastructure Spend

9
Comparative Film Inducements Table 1 details film incentive structures across various states including Louisiana, Georgia4, North Carolina5, Michigan6 and New Mexico7. Among these five states, Louisiana offers a base incentive rate of 30%. Out of the five states, Georgia and Louisiana are the two most competitive; both offering a 30% base incentive rate (with added caveats noted in Table 1 below).
Table 1 Film Incentive structures Across Various States: 2015
Incentive Louisiana Georgia North
Carolina Michigan New Mexico
Rate 30% 20% 25%
25% on direct production
expenditures; 25% for qualified
personnel expenditures
25%
Additional Incentive
5% resident labor
10% logo or marketing
credit None
3% qualified facility or post facility, added 10% for direct production and
personnel expenditures at a postproduction
facility
None
Caps/Limitations None None
$5 million per film or TV Series;
$10 million annual
program cap
$50 million annual program cap; limits ATL expenditures to not more than
30% of the total direct
expenditures
$50 million allocation per fiscal
year
Sunsets None None 6/30/2020 12/30/2021 None
Minimum Spend $300,000 $500,000
$5 million for feature
films/ $250,000 for
others
$100,000 None
Credit Type Transferable Transferable Refundable Refundable Refundable
Source: Louisiana Department of Economic Development, Office of Entertainment Industry Development
4 O.C.G.A. § 48-7-40.26 5 H 1973 (SL 2010-147); H 713 (SL 2010-89); S847 (SL 2012-194) 6 MCL 125.2029-MCL 125.2029h 7 New Mexico Statutes 7-2F-1

10
In addition to the 30% base rate, Louisiana offers an additional credit for resident labor while Georgia, Louisiana’s main competitor, allows for a sales/use tax exemption. While the base rate of incentives are important, the programs that have no overall caps in place tend to be the most successful. North Carolina experienced the most radical change to their program in 2014 and now has an annual cap of $10 million. Other states such as Michigan (which recently underwent some legislative revisions to their incentive program including placing limitations on eligible above the line expenditures) and New Mexico began their programs with no cap. Since caps that were set well below that particular state’s annual average were introduced, these states have seen a significant reduction in the production activity within their jurisdictions. In the past, it was determined that implementing a program cap of any sort would clearly make it difficult for Louisiana to remain competitive with Georgia and other similar programs. However, if a cap is set at or above the current average level of annual credits (~$300 million per year) and is implemented on a rolling accrual basis (with any credits in excess of the current-year cap automatically first in line for the following year), then it is unlikely that Louisiana would experience a major decline in motion picture production activity.
Table 2 lists some key restrictions on what qualifies for the tax credits that are available across these five states. Generally speaking, with the exception of how the resident labor provisions are handled, the other four states are more restrictive in what is allowed to count towards spending that qualifies for tax credits. For example, Michigan, North Carolina and New Mexico place caps on Above-The-Line (ATL) expenditures and talent salaries. Indeed, New Mexico does not allow any tax credits for non-resident directors, producers and writers. Finally, when it comes to finance fees, loan interest, legal fees, insurance, bond fees, and airfare, all are qualified in Louisiana, Michigan and New Mexico. However, Georgia does not allow finance fees and loan interest while North Carolina prohibits finance fees, interest expenses, legal fees and bond fees.

11
Table 2 Specific Limits on Tax Credit Qualifications
State Limitations ATL Spending
Louisiana 5% credit limited to 1st $1 million of any
individual resident's salary Qualifies at 30%
Georgia $500,000 cap per W2 employee, per
production; no cap on 1099 or services contract employee
Qualifies if paid as a loan-out or 1099
North Carolina
Only on 1st $1 million of each resident/non-resident
Only qualified on 1st $1 million of each resident/non-resident
Michigan Payments/compensation to any one resident that exceeds $2 million is
ineligible
ATL expenditures limited to only 30% of the total direct
expenditures
New Mexico
Lodging - $150 per night; Rental car - $100 a day; gifts - up to $25 per item;
Art, jewelry used in film production - less than $2,500 per item
Credits on non-resident talent capped at $5 million; Non-resident directors, producers & writers do not qualify
Source: Louisiana Department of Economic Development, Office of Entertainment Industry Development Incentives for Sound Recording and Live Performance At this time, although most states have active music industry development initiatives, the only sound recording tax credits that mirror Louisiana’s are located in Canada. Mississippi is pursuing a sound recording program very similar to Louisiana’s and there are efforts in Massachusetts as well as at the federal level to provide incentives in the live performance arena. Additionally, new laws modeled on Louisiana’s live performance program have been enacted in Rhode Island, New York State and Illinois. These programs are solely for production tax credits and do not include infrastructure. In Rhode Island, the credit is 25% of total production and performance and transportation expenditures that must total at least $100,000. No more than $15 million in tax credits can be issued each year for motion picture productions and live performances combined.8 The Illinois law is even more restrictive with credits capped at $500,000 per production and $2 million per year, plus companies must use a venue with seating of at least 1,500.9
8 Title 44, Chapter 44-31.3, Section 44-31.3-2 9 http://blogs.wrpi.com/2012/11/27/ri-is-1-of-3-states-that-offer-musicals-plays-a-theater-tax-credit/

12
IV. Economic Impacts of Entertainment Spending in Louisiana
In an earlier report, dated April 2013, we reported the impacts of the certified spending in the entertainment industry for each year between 2010 and 2012. An important aspect of the statutory requirement is to provide a report every other year is to estimate the impact of this certified spending on the Louisiana economy. In this report we provide those estimates for 2013 and 2014. That is the topic of this section. Direct Entertainment Spending In Louisiana The amount of the certified direct Louisiana expenditures from 2013 and 2014 by category are detailed in Table 3. As was noted in the discussion of Figures 1-4, expenditures on film production are by far the largest component of certified spending in Louisiana. Since the legislative enhancements to the motion picture program in mid-2009, total entertainment spending has steadily risen from almost $446.6 million in 2010 to nearly $851 million in 2013----with a slight decline to $776.3 in 2014. By examining these data, it is clear that the program is performing as designed and continues to provide an economic impact to the state.
Table 3 Certified Spending in Louisiana: CY2013-CY2014
($ Millions)
Category 2013 2014
Film Industry
Production $809.8 $727.1
Infrastructure $6.7 $0.0
Sound Recording
Production $0.7 $0.8
Infrastructure $0.3 $0.0
Live Performance
Production $2.0 $1.0
Infrastructure $31.7 $47.5
Total $851.1 $776.3 Source: Louisiana Department of Economic Development, Office of Entertainment Industry Development Indirect Impacts of Entertainment Spending in Louisiana In determining the impact of the entertainment spending on the Louisiana economy it is important to note that the data in Table 3 do not capture the full impact. The reason is that these data only capture the direct impact on the economy. When workers in the industry receive their paychecks, they will in turn take that money and spend some of it at grocery stores, car dealerships, clothing stores, theaters, etc., in the

13
state. This creates new incomes for people in those sectors, and they too will spend their new earnings at grocery stores, car dealerships, clothing stores, theaters, etc., and the cycle keeps repeating. It may be helpful to think of the Louisiana economy as one large economic pond. For example, in 2014, $776.3 million rock was dropped into this pond. When the rock hit the pond, it sent ripple effects all the way out to the edge of the pond. These ripples are what economists refer to as the indirect or multiplier effects of the entertainment spending. These multiplier effects need to be added to the direct effects to determine the full impact on the Louisiana economy of the entertainment spending certified in 2014. Measuring the Indirect Effects Fortunately, there is a handy tool for measuring these multiplier effects---an input-output (I/O) table. Such a table has been constructed for the Louisiana economy by the Bureau of Economic Analysis (BEA) in the U.S. Department of Commerce. The BEA has been building I/O tables for various geographic areas for decades. The BEA is the same agency of the federal government that is responsible for such widely used data as national gross domestic product, gross state products, state income levels, and state/local population estimates between the census years. Using the Louisiana I/O tables constructed by the BEA, the multiplier effect of the various types of entertainment spending back in Table 3 on (1) sales at Louisiana firms, (2) household earnings for Louisianans, and (3) jobs supported by the certified spending for residents of the state can be estimated. These data can then be used to estimate the impact of the various kinds of entertainment spending on state and local tax revenues. Data Nuances for Impact Analysis There are some unusual data issues that have to be addressed in order to use the I/O table for measuring the indirect effects. First, the spending data shown in Table 3 is aggregate spending. When these data are plugged into the I/O table they must be broken down into various specific spending categories, such as labor, construction, rentals, hotels, etc. This is particularly problematic in dealing with the largest category---film production. Films range widely in size from small to very large productions, and as a result the percentage of spending in each specific category can vary noticeably. To address this problem, the OEID reviewed all projects which received final certification in calendar years 2010-12 and broke down the spending into the specific categories (in cooperation with OEID) for input into the I/O table. Thus, the full "population" of the productions---not just a "sample"---was used, which increases the confidence in the breakdowns. We continue to use this breakdown for production spending in 2013 and 2014. A similar methodology was used in all the other spending categories listed in Table 3.

14
A second data issue had to do with measuring the direct employment supported by the spending in each category. When requesting tax credits for their entertainment spending, applicants are required to document how much money (i.e., payroll) was spent hiring Louisiana residents on their projects. They are not required to document how many people they hired to generate this payroll. In addition, part of the issue in effectively accounting for everyone working in the motion picture industry is that many people are hired indirectly, either through 1099s or through a company that is engaged by the film production. The way the I/O tables work is that these 1099 individuals are captured in the indirect job count, when some might argue they should be included as direct workers in the industry. This report also attempts to provide a best estimate of the current jobs number by implementing the following methodology. First, it was known from the certified spending in each calendar year how much the total direct resident payroll (employed directly by the production company and issued the traditional W2) was in each category in Table 3. Secondly, the U.S. Bureau of Labor Statistics generates data on the average annual wage for persons working in the NAICS codes that cover the spending categories in Table 3. These average annual wage data were divided into the certified resident payroll data to produce an estimate of direct resident employment generated by the various types of entertainment spending. Again, some might reasonably argue that this methodology likely underestimates the total direct employment as the data provided does not capture individuals that may work as contract labor (1099) or for companies that contract these services. However, these individuals are captured in the overall (direct plus indirect) total employment estimate. Impact of Film Production Spending Table 4 shows the I/O table estimates of the impact on the Louisiana economy of film production spending certified for 2013 and 2014. Not surprisingly (given the data back in Table 3), the largest impacts of film production spending was in the year of the largest aggregate spend---2013. According to the I/O table, the aggregate film production spending of $809.8 million created (1) almost $1.2 billion in sales at firms in Louisiana, (2) $810.6 million in household earnings for Louisiana residents, and (3) a total of 13,175 direct and indirect jobs were supported within the state. As a reference point10:
Total earnings of all workers in Louisiana's paper industry and printing industries combined in 2013 (latest data available) was $788 million.11
In December 2014, there were 13,502 people employed in the entire Beauregard Parish economy.12
10 Entertainment numbers are a combination of direct + indirect, while other industries are represented by direct numbers. 11 www.bea.gov. 12 "Louisiana Workforce at a Glance", Louisiana Workforce Commission, January 30, 2015, p. 16.

15
Table 4 Impacts of Film Industry Production Certified Spending on Louisiana:
CY2013-CY2014 ($ Millions)
Sales Earnings Jobs
2013 $1,167.7 $810.6 13,175
2014 $1,048.4 $727.8 12,107
Total $2,216.1 $1,538.5 12,641 . Jobs total represents an average of employment over the two year period.
There are a few other noteworthy points about the impacts reported in Table 4. First, over the two-year period certified spending on film production created a little over $2.2 billion in business sales within the state and a total of over $1.5 billion in household earnings. Second, over this two-year period, an average of 12,641 jobs were supported by the certified film production spending within the state.
Third, by dividing the household earnings number for 2014 by the total jobs generated one gets an implied average annual wage for all workers---direct and indirect---of $60,114. The average annual wage of all workers in Louisiana's private sector in December 2014 was $41,851 and the average annual wage in manufacturing was $60,050.13 This suggests that the jobs supported by the film production activities are among the higher wage jobs in the economy---and about equal to that of the state's manufacturing sector.
However, there is an important caveat to this conclusion. Under the regulations, the certified spending numbers used to calculate the numbers in Table 4 include payments made to talent, writers, directors, and producers---which are going to be the higher-end paid individuals on the project. It is a heroic assumption that these monies will actually be spent in Louisiana, since these individuals are typically not Louisiana residents. Inclusion of their salaries in the "certified Louisiana spend" for tax credit purposes no doubt exaggerates the numbers in Table 4.
Impact of Film Infrastructure Spending Table 5 documents the I/O table estimates of film infrastructure spending on the Louisiana economy. Recall, there was no reported infrastructure spending for film production in 2014. The impact estimates for 2013, while impressive, are much smaller than the impact numbers in Table 4, because the certified Louisiana spend numbers are so much smaller (see Table 3). Despite the smaller size, film infrastructure spending
13 Ibid., p. 17.

16
certified in 2013 produced (1) $13.9 million in sales at Louisiana firms, (2) $4.4 million in household earnings for Louisiana residents and (3) 107 jobs for state residents.
Table 5 Impacts of Film Industry Infrastructure Certified Spending on Louisiana:
CY2013-CY2014 ($ Millions)
Sales Earnings Jobs
2013 $13.9 $4.4 107
2014 $0.0 $0.0 0
Total $13.9 $4.4 107
The implied average annual wage for the jobs supported by the film infrastructure spending in 2013 is just in excess of $41,174. This is essentially equivalent to the average wage in the private sector of the Louisiana economy ($41,851). Industry Effects of Film Production Spending Readers may be curious about which sectors of the Louisiana economy gain the most from the multiplier effects of the film production spending. Those estimates are provided in Table 6. It is important to note that these are the industries most affected by the multiplier effect. It does not include industries impacted by the direct spending.
Perhaps the columns in Table 6 of greatest interest to citizens of the state are the last two. Which sectors gain the most in terms of creating incomes and jobs for Louisianans? From both an earnings ($46.2 million) and job creation (1,113 jobs) standpoint, in 2014 workers in the health care sector are the largest beneficiaries of the film programs. Workers in the construction sector came in #2 in earnings ($31.4 million and #3 in job creation (710). Since payrolls play a big role in the direct film spending in 2014 it is not surprising that the retail trade sector ranks #2 in jobs creation (1,042 jobs) and #3 in earnings ($28.2 million).
Note that the total impact of the film production spending is +12,107 jobs (see
Table 4). At the bottom of Table 5, the I/O table indicates that 7,886 were supported indirectly, which means 4,221 jobs were supported directly in the industry. This implies a job multiplier of 2.9 (12,107/4,221), which means for every direct job supported via the film production spending another 1.9 jobs are supported in the state’s economy via the multiplier effect.

17
Table 6 Indirect Effects of Certified Film Production Spending
on Louisiana by Industry: CY2014 ($ Millions)
Sales Earnings Jobs
Agriculture, Forestry, Fishing, And Hunting $6.4 $1.4 56
Mining $17.1 $2.5 21
Utilities $21.9 $3.4 37
Construction $87.8 $31.4 710
Manufacturing $90.9 $12.9 209
Wholesale Trade $41.7 $13.5 214
Retail Trade $76.4 $28.2 1,042
Transportation And Warehousing $84.6 $25.8 553
Information $25.4 $4.8 97
Finance And Insurance $67.3 $16.1 351
Real Estate And Rental And Leasing $212.6 $19.8 805
Professional, Scientific, And Technical Services $35.2 $16.1 277
Management Of Companies And Enterprises $8.9 $4.1 59
Administrative And Waste Management Services $24.9 $10.5 411
Educational Services $12.4 $6.2 217
Health Care And Social Assistance $99.2 $46.2 1,113
Arts, Entertainment, And Recreation $8.0 $3.0 99
Accommodation $30.9 $8.5 266
Food Services And Drinking Places $30.9 $10.0 560
Other Services $65.8 $26.4 714
Household - $0.9 75
Total $1,048.4 $291.6 7,886
Impact of Sound Recording Production Spending In terms of total Louisiana spending---including both production and infrastructure spending---the sound recording (SR) area is the smallest as seen back in Table 3. SR production spending certified in 2013 and 2014 amounted to only $726,965 and $772,238, respectively. I/O estimates of the impact of certified SR production spending is provided in Table 9. These numbers are quite small and declined slightly from 2013 to 2014.
18
Table 9 Impacts of Certified Sound Recording Production Spending:
CY2013-CY2014 ($ Millions)
Sales Earnings Jobs
2013 $0.9 $0.6 20
2014 $1.0 $0.7 21
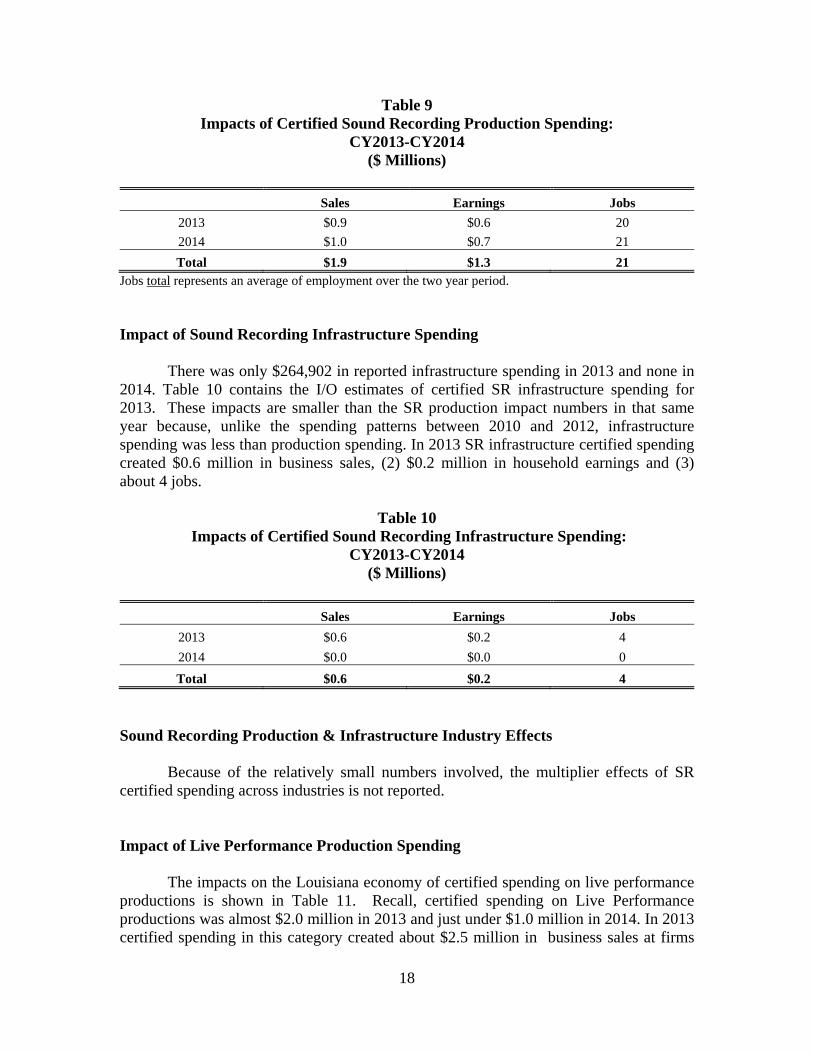
Total $1.9 $1.3 21 Jobs total represents an average of employment over the two year period. Impact of Sound Recording Infrastructure Spending There was only $264,902 in reported infrastructure spending in 2013 and none in 2014. Table 10 contains the I/O estimates of certified SR infrastructure spending for 2013. These impacts are smaller than the SR production impact numbers in that same year because, unlike the spending patterns between 2010 and 2012, infrastructure spending was less than production spending. In 2013 SR infrastructure certified spending created $0.6 million in business sales, (2) $0.2 million in household earnings and (3) about 4 jobs.
Table 10 Impacts of Certified Sound Recording Infrastructure Spending:
CY2013-CY2014 ($ Millions)
Sales Earnings Jobs
2013 $0.6 $0.2 4
2014 $0.0 $0.0 0
Total $0.6 $0.2 4
Sound Recording Production & Infrastructure Industry Effects Because of the relatively small numbers involved, the multiplier effects of SR certified spending across industries is not reported. Impact of Live Performance Production Spending The impacts on the Louisiana economy of certified spending on live performance productions is shown in Table 11. Recall, certified spending on Live Performance productions was almost $2.0 million in 2013 and just under $1.0 million in 2014. In 2013 certified spending in this category created about $2.5 million in business sales at firms

19
within the state. It also generated about $1.2 million in household earnings and approximately 22 jobs. In 2014 business sales rose about $1.2 within the state due to certified spending on live performance productions, with an associated increase in household earnings of approximately $0.4 million and 10 jobs. For this two-year period, this program produced $3.7 million in sales, $1.6 million in household earnings and an average of 16 jobs a year.
Table 11 Impacts of Certified Live Performance Production Spending:
CY2013-CY2014 ($ Millions)
Sales Earnings Jobs
2013 $2.5 $1.2 22
2014 $1.2 $0.4 10
Total $3.7 $1.6 16 Jobs total represents an average of employment over the two year period. Impact of Live Performance Infrastructure Spending In 2013 certified spending on live performance infrastructure amounted to $31.7 million, and in 2014 it rose to $47.5 million. I/O table estimates of the impacts of this spending are detailed in Table 12.
Table 12 Impacts of Certified Live Performance Infrastructure Spending:
CY2013-CY2014 ($ Millions)
Sales Earnings Jobs
2013 $65.8 $20.9 506
2014 $98.9 $31.3 752
Total $164.7 $52.2 629 Jobs total represents an average of employment over the two-year period.
Impact volumes obviously track the spending pattern. Over this 2-year period, certified live performance infrastructure expenditures generated $164.7 million in sales for Louisiana firms, $52.2 million in household earnings, and an average of 629 jobs a year.
20
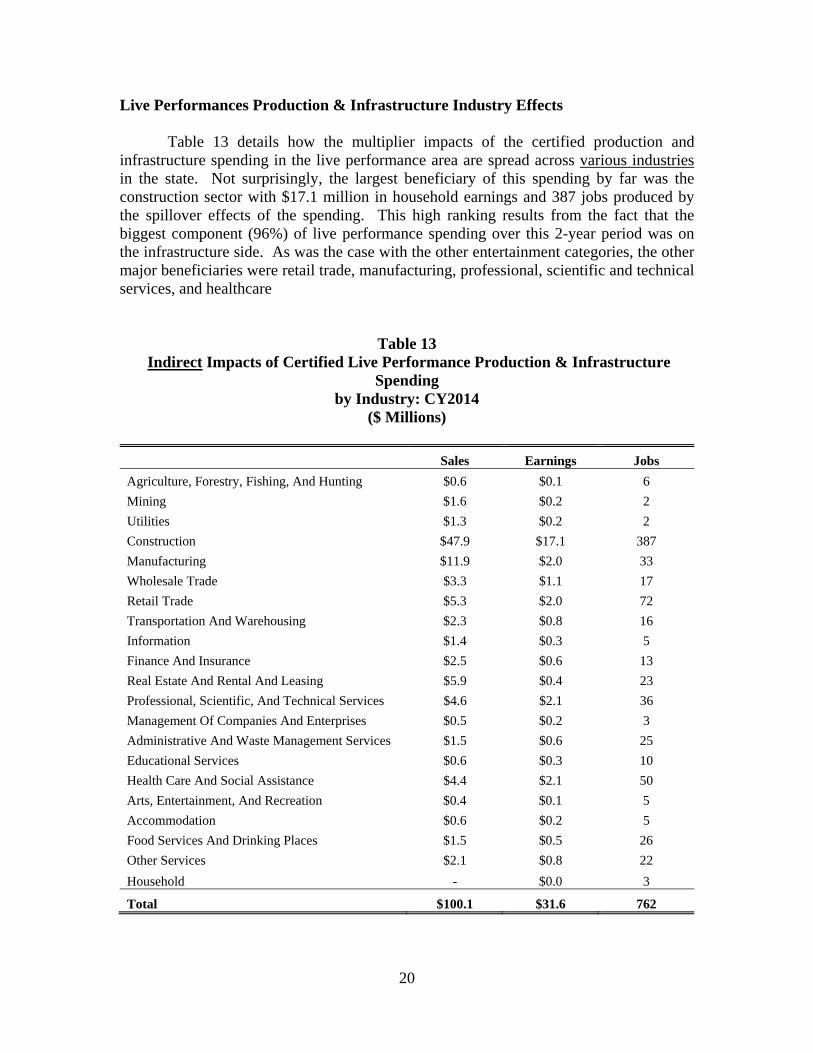
Live Performances Production & Infrastructure Industry Effects Table 13 details how the multiplier impacts of the certified production and infrastructure spending in the live performance area are spread across various industries in the state. Not surprisingly, the largest beneficiary of this spending by far was the construction sector with $17.1 million in household earnings and 387 jobs produced by the spillover effects of the spending. This high ranking results from the fact that the biggest component (96%) of live performance spending over this 2-year period was on the infrastructure side. As was the case with the other entertainment categories, the other major beneficiaries were retail trade, manufacturing, professional, scientific and technical services, and healthcare
Table 13 Indirect Impacts of Certified Live Performance Production & Infrastructure
Spending by Industry: CY2014
($ Millions)
Sales Earnings Jobs
Agriculture, Forestry, Fishing, And Hunting $0.6 $0.1 6
Mining $1.6 $0.2 2
Utilities $1.3 $0.2 2
Construction $47.9 $17.1 387
Manufacturing $11.9 $2.0 33
Wholesale Trade $3.3 $1.1 17
Retail Trade $5.3 $2.0 72
Transportation And Warehousing $2.3 $0.8 16
Information $1.4 $0.3 5
Finance And Insurance $2.5 $0.6 13
Real Estate And Rental And Leasing $5.9 $0.4 23
Professional, Scientific, And Technical Services $4.6 $2.1 36
Management Of Companies And Enterprises $0.5 $0.2 3
Administrative And Waste Management Services $1.5 $0.6 25
Educational Services $0.6 $0.3 10
Health Care And Social Assistance $4.4 $2.1 50
Arts, Entertainment, And Recreation $0.4 $0.1 5
Accommodation $0.6 $0.2 5
Food Services And Drinking Places $1.5 $0.5 26
Other Services $2.1 $0.8 22
Household - $0.0 3
Total $100.1 $31.6 762

21
As seen along the bottom line in Table 13, in 2014, 762 jobs were created by certified live performance spending in the Louisiana economy via the multiplier effect. A total of $31.6 million in household earning was created for residents of the state via the multiplier effect of this spending. That means that the average wage for this multiplier effect jobs was $41,470---right at the average annual wage for all workers in the private sector in the state. Total Impacts of All Certified Entertainment Spending Tables 4-13 highlight the data for the I/O estimates of the impact of the certified spending across each of the three different categories of entertainment covered by Louisiana's entertainment industry incentives. What are the total impacts of that spending? Answers to this question are shown for each year in Table 14.
Table 14 Upper Bound Estimates of the Total Impacts of All Certified Entertainment Industry Spending
on Louisiana: CY2013 and CY2014
($ Millions)
Category Sales Earnings Jobs Taxes
Local State
2013 $1,251.4 $837.9 13,835 $37.8 $58.7
2014 $1,149.5 $760.2 12,890 $34.2 $53.3
Total $2,400.9 $1,598.1 13,363 $72.0 $112.0 . Jobs total represents an average of employment over the two year period.
These numbers are quite impressive. According to our estimates, the total certified entertainment spending over this two-year period created or supported:
Over $2.4 billion in sales for firms in Louisiana; Nearly $1.6 billion in household earnings for Louisiana residents and; An average 13,363 total jobs per year for residents of Louisiana.
To put the 2014 numbers in perspective14:
Total income of all workers in gasoline stations in Louisiana in 2013 (latest data available) was $766.1 million.15
14 Entertainment numbers are a combination of direct + indirect, while other industries are represented by direct numbers. 15 www.bea.gov.

22
The total personal income of all residents of St. James Parish in 2013 was $753.6 million. In 2013 there were 22 parishes in Louisiana where total personal income was less than $760.2 million.16
In December 2014, there were 13,200 people employed statewide in Louisiana's transportation equipment manufacturing sector.17
In December 2014 there were 12,051 people employed in Iberville Parish. In December 2014, there were 32 parishes in Louisiana where employment did not reach the 12,890 figure created by this tax credit program in that year.18
A second very important piece of data is provided in Table 14. It is possible to estimate the impact of this certified spending on state and local tax revenues. Officials in Louisiana's Legislative Fiscal Office (LFO) have estimated that for every dollar of earnings created in the state, a large portion of that money gets spent in Louisiana and the state collects taxes as a result. The LFO estimates that for every dollar of household earnings generated in Louisiana the state treasury collects seven cents in various taxes and fees, such as sales taxes, income taxes, gasoline taxes, etc. Thus, from the $1.6 billion in earnings created in 2013 and 2014 by the certified spending, the State of Louisiana collected an extra $112 million in various taxes and fees. Further, in consultation with officials in the LFO, our team estimated that for every dollar of earnings generated in the state, local governments collect an additional 4.5 cents in various taxes and fees. Thus, on the $1.6 billion in household earnings generated by the certified entertainment spending, local governments were estimated to have collected an extra $72 million in taxes and fees. An Important Caveat A careful reader will notice that the title of Table 14 contains the phrase “Upper Bound”. In all our economic impact discussions above, this report attempts to describe the impacts as resulting from the certified Louisiana spending. In reality, when measuring the economic impact of an activity on the state one should only include money actually spent within the state. Measuring the impacts using certified spending means including under the film production section, payments made to talent, directors, producers, and writers---who in most cases do not live in Louisiana and are therefore, unlikely to spend all that money in the state. Thus the state’s return on investment is typically worse for those projects (primarily films) that involve a large proportion of multi-million dollar payments made to non-residents. To more accurately measure the impact on the state's economy the payments made to these individuals should include only the portion of their salaries spent directly in the state and injected into the I/O table. The OEID data indicate that about 27% of the certified film production spending goes to these individuals, which turns out to be 25.2% of the total certified entertainment spend across all programs.
16 Ibid. 17 "Louisiana Workforce at a Glance", Louisiana Workforce Commission, January 30, 2015. 18 Ibid., p. 16.

23
The data in Table 15 show the impact estimates on the state if these talent, producer, director and writer payments are totally excluded. Basically, this means dropping the initial estimates back in Table 14 by 25.2%. For example, instead of supporting 13,835 jobs in 2013, our lower-bound estimate is 10,349. Also, our estimate of household earnings drops from $837.9 million to $627.5 million. Similar results are observed for 2014. A reasonable case can be made that the data in Table 15 represent a lower bound estimate of the impacts, because perhaps at least some percentage of the payments made to these individuals would have been spent in the state while they were working on the film. No data exist suggesting what this percentage might be, but intuition suggests it is not a very large percentage.
Table 15 Total Impacts of Adjusted Entertainment Industry Certified Spending on Louisiana:
CY2013 and CY2014 ($ Millions)
Category Adjusted*
Sales Adjusted Earnings
Adjusted Jobs Adjusted Taxes
Local State
2013 $936.1 $627.5 10,349 $28.3 $43.9
2014 $859.8 $568.6 9,642 $25.6 $39.9
Total $1,795.9 $1,196.1 9,995 $53.9 $83.8 *Adjusted means talent, producer, director, and writer payments are excluded. Jobs total represents an average of employment over the two year period.
V. Benefits Compared to Tax Credits
Benefits from the state's entertainment promotion legislation---whether one accepts the data in Table 14 or the adjusted smaller numbers in Table 15---are significant. For example, if the state had landed a company that would create $1,149.5 million in business sales in Louisiana, along with $760.2 million in household earnings, 12,890 jobs, $34.2 million for local governments and $53.2 million for the state treasury, that would no doubt appear on the front page of the paper, above the fold the next day. An alternative way of measuring the benefits to the state---one that was used in the previous two studies of these programs---is to look at the costs per dollar of business sales created. Each program for calendar year 2014 is reported in Table 16. The business sales per dollar of adjusted certified tax credits are shown in the last column of this table. The value ranges from a high of $11.20 per dollar of tax credit certified for live performance production spending to a low of $4.63 for film production. The weighted

24
average across all programs is $4.82. It is important to note that these are upper bound estimates of these business sales impacts, i.e. they have not been adjusted for leakages associated with talent, directors, producers, and writers earnings that may not have been spent in the state.
Table 16 Upper Bound Estimates of the Total Impacts Certified Spending on the Louisiana
Economy: CY2014 ($ Millions)
Category Business
Sales Household Earnings Jobs
Sales per Dollar of Tax
Credit
Film Industry
Production $1,048.4 $727.8 12,107 $4.63
Infrastructure $0.0 $0.0 0 -NA
Sound Recording
Production $1.0 $0.7 21 $5.50
Infrastructure $0.0 $0.0 0 -NA
Live Performance
Production $1.2 $0.4 10 $11.20
Infrastructure $98.9 $31.3 752 $8.32
Total $1,149.5 $760.2 12,890 $4.82
No certified film infrastructure or sound recording infrastructure spending in 2014. *Weighted average across all programs. Impact on the State Treasury However, on hearing the news reported above the analytically minded might ask, what did it cost the state to attract this entertainment business? The benefits in Table 14 were not free. In order to attract this activity to Louisiana the state has granted tax credits which effectively reduce the amount of money flowing into the state treasury. In 2014, the total face value of the tax credits certified was approximately $238.6 million. While this is the full face value of the credits, some of these credits may be claimed for less than face value (i.e. film credits may be transferred back to the state for 85% of their face value). Uses for Tax Credits The tax incentives administered by OEID have a variety of redemption and transfer options. Motion Picture tax credits may be used to offset personal and/or corporate income tax liabilities; may be transferred to another Louisiana taxpayer; or may be transferred back to OEID for 85% of the face value of the credits Any credits earned under the Sound Recording program are directly rebated at 100%. The credits earned
25
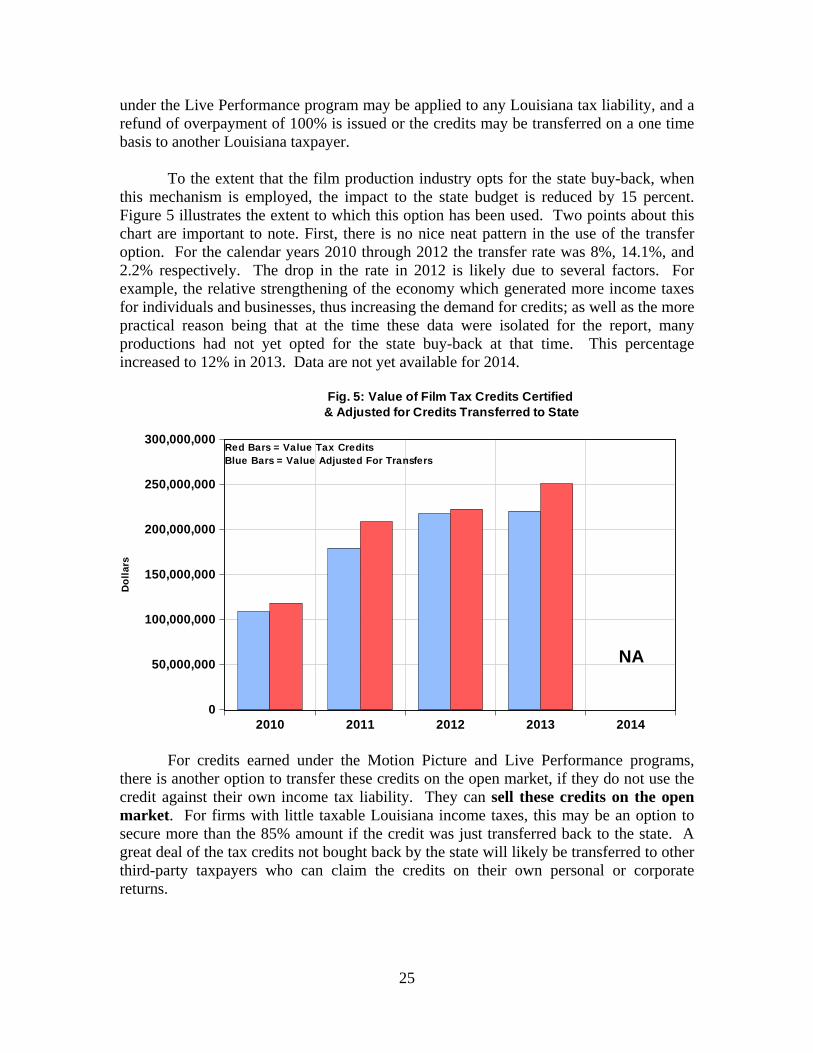
under the Live Performance program may be applied to any Louisiana tax liability, and a refund of overpayment of 100% is issued or the credits may be transferred on a one time basis to another Louisiana taxpayer. To the extent that the film production industry opts for the state buy-back, when this mechanism is employed, the impact to the state budget is reduced by 15 percent. Figure 5 illustrates the extent to which this option has been used. Two points about this chart are important to note. First, there is no nice neat pattern in the use of the transfer option. For the calendar years 2010 through 2012 the transfer rate was 8%, 14.1%, and 2.2% respectively. The drop in the rate in 2012 is likely due to several factors. For example, the relative strengthening of the economy which generated more income taxes for individuals and businesses, thus increasing the demand for credits; as well as the more practical reason being that at the time these data were isolated for the report, many productions had not yet opted for the state buy-back at that time. This percentage increased to 12% in 2013. Data are not yet available for 2014.
For credits earned under the Motion Picture and Live Performance programs, there is another option to transfer these credits on the open market, if they do not use the credit against their own income tax liability. They can sell these credits on the open market. For firms with little taxable Louisiana income taxes, this may be an option to secure more than the 85% amount if the credit was just transferred back to the state. A great deal of the tax credits not bought back by the state will likely be transferred to other third-party taxpayers who can claim the credits on their own personal or corporate returns.
0
50,000,000
100,000,000
150,000,000
200,000,000
250,000,000
300,000,000
2010 2011 2012 2013 2014
Fig. 5: Value of Film Tax Credits Certified & Adjusted for Credits Transferred to State
Red Bars = Value Tax CreditsBlue Bars = Value Adjusted For Transfers
Do
lla
rs
NA

26
How does the gross value of these tax credits, which are effectively the costs to the state, compare with the benefits? Below the report compares these costs to the tax receipts and jobs associated with each entertainment endeavor using the credits. Tax Credits and Film Production Table 17 provides some markers for decision makers to use in evaluating the film production tax credit. Row one shows the amount of the adjusted tax credits credited to these firms. "Adjusted" means that the revised numbers now are taking into account the savings to the state from transferring some of the credits to the state at an 85% discount.19 Row two provides our estimate of the gains to the state treasury from the economic activity brought to the state by the certified film production spend. This row is calculated by taking the I/O table household earnings estimates back in Table 4 and multiplying them by 7%. Row three is the difference between row one and row two---the estimated net deficit to the state treasury from this incentive program. Row four contains the total jobs supported by the program as estimated by the I/O table and reported back in Table 4. The last row is the cost per job of this incentive program.
Table 17 Evaluating the Film Production Tax Credit Program Based on the Calendar Year
the Spending Was Certified ($ Millions)*
Category 2013 2014
Adjusted Certified Tax Credits $246.6 $222.3**
Taxes Received $56.7 $50.9
Net Impact on State Treasury -$189.9 -$171.4
Jobs 13,175 12,107
Cost to State per Job per Year $14,414 $14,157 Numbers adjusted for state buyback and reflects the real value of the credits. *Values of first three rows. **Assumes the same transfer rate as in 2013 at 12% Given the recent ramp up in Louisiana spend in this category the last column of Table 17 is likely the best indicator of the cost of this program's future impact. The film production tax credit program’s net cost to the state treasury was over $171 million in 2014 and was almost $190 million in 2013.
It is very important to note that the “Taxes Received” row in Table 17 is based on the upper bound estimate of the impact of the tax credits on the economy. If we use the “lower bound” estimate of the impacts---that is assuming that none of the talents’,
19 The formula used was: Adjusted amount = (certified credits) – 15% (amount bought back).

27
directors’ and writers’ salaries were spent in Louisiana---then the hit to the state treasury in 2013 rises to $204.2 million and in 2014 to $184.2 million. Tax Credits and Film Infrastructure Table 18 provides data on the impact of the film infrastructure tax credit program. This table is set up in the same manner as Table 17.
Table 18
Evaluating the Film Infrastructure Tax Credit Program Based on the Calendar Year the Spending Was Certified
($ Millions)*
Category 2013 2014
Certified Tax Credits $2.7 $0.0
Taxes Received $0.3 $0.0
Net Impact on State Treasury -$2.4 $0.0
Jobs 107 0
Cost to State per Job per Year $22,117 - *Values of first three rows. No recorded infrastructure spending in 2014.
Since the motion picture infrastructure program sunset in 2008, the certified spending in the calendar years covered by this report indicates that the program is really ramping down. As indicated in the middle row of numbers in Table 18, the film infrastructure tax credit program is becoming less of an impact to the state treasury, ranging from a high of $15.3 million in 2010 to a recent low of $2.4 million in 2013. However, this is also a program that creates substantially fewer jobs than the film production program, and as a result the cost to the state per job is almost double that of the production side---averaging about $21,700 per job. Tax Credits and Sound Recording Production Impacts of the sound recording production program are detailed in Table 19. Note that this program is small, so the dollar figures in the first three rows are actual (versus in millions in the previous three tables). The negative impact on the state treasury of the certified spend in this peaked at $258,995 in 2010, and over 2013-14 was in the $140,000-$144,000 range. In 2014, the cost per job supported was $6,827---the lowest cost of the programs evaluated to this point in the report.

28
Table 19 Evaluating the Sound Recording Production Tax Credit Program Based on the
Calendar Year the Spending Was Certified
Category 2013 2014
Adjusted Certified Tax Credits $181,741 $193,059
Taxes Received $42,000 $49,000
Net Impact on State Treasury -$139,741 -$144,059
Jobs 20 21
Cost to State per Job per Year $6,917 $6,827
Tax Credits and Sound Recording Infrastructure Like its production counterpart, the SR infrastructure program is a small part of the entertainment tax credit program, and all the dollar figures in Table 20 are actual numbers as opposed to being presented in millions. Since this program has also sunset, there was no certified spending on this program for calendar year 2014. The SR infrastructure program impacted the state treasury for $293,199 in 2010, and had dropped to only $52,226 by 2013. As was the case with the film infrastructure program, the cost per job for SR infrastructure was at $13,057 per job in 2013---second only to the much higher cost per job in film infrastructure ($22,117 in 2013).
Table 20 Evaluating the Sound Recording Infrastructure Program Based on the Calendar
Year the Spending Was Certified
Category 2013 2014
Certified Tax Credits $66,226 $0.0
Taxes Received $14,000 $0.0
Net Impact on State Treasury -$52,226 $0.0
Jobs 4 0
Cost to State per Job per Year $13,057 - No recorded infrastructure spending in 2014. Tax Credits and Live Performance Production Table 21 provides data on the impact of the live performance production tax credit program. Live performance is comparable to the sound recording category, and both are a fraction of the size of the film area. The treasury was reduced by $243,624 in 2013, and then by a much smaller $69,827 in 2014.

29
Table 21 Evaluating the Live Performance Production Program Based on the Calendar Year
the Spending Was Certified
Category 2013 2014
Adjusted Certified Tax Credits $327,288 $97,545
Taxes Received $83,664 $27,718
Net Impact on State Treasury -$243,624 -$69,827
Jobs 22 10
Cost to State per Job $11,074 $6,983
Tax Credits and Live Performance Infrastructure
In Table 22, data are presented on the budgetary impact of the live performance infrastructure program. In 2013 this certified spending impacted the state budget by $6.7 million, followed by $9.7 million in 2014. The 752 jobs this program supported in 2014 came at an estimated cost of $12,883 per job.
Table 22 Evaluating the Live Performance Infrastructure Program Based on the Calendar
Year the Spending Was Certified ($ Millions)*
Category 2013 2014
Certified Tax Credits $8.2 $11.9
Taxes Received $1.5 $2.2
Net Impact on State Treasury -$6.7 -$9.7
Jobs 506 752
Cost to State per Job per Year $13,241 $12,883 Value of the first three rows. Summary of Budgetary Impacts for 2014 While comparative budgetary impacts across the seven programs examined were discussed under each heading, the data for 2014 are summarized in Table 23 to make it easy for readers to compare results across each program. Note that there was no certified film or sound recording infrastructure spending in 2014.

30
Table 23
Budgetary Impacts across All Entertainment Programs: Certified Spending for CY2014
($ Millions)
Category Impact on State Budget Cost per Job to State per Year
Film Industry
Production -$171.4 $14,157
Infrastructure* None NA
Sound Recording
Production -$0.1 $6,872
Infrastructure* None NA
Live Performance
Production -$0.07 $6,983
Infrastructure -$9.7 $12,883 There was no film infrastructure or sound recording infrastructure spending in 2014.
VI. Recommendations for Program Improvement
Some recommendations below follow as a result of investigations by Alvarez & Marsal in conjunction with officials within the Louisiana Department of Economic Development (LDED). These are recommendations that the author supports. There are basically three problematic areas that these recommendations address. First, there are related party transactions (RPTs) that are presently treated as qualifying transactions, where it is difficult to ascertain where the state enjoys any economic benefit from these expenditures. Among these are “soft” costs” such as insurance, finance fees, air fare, and interest payments. Secondly, LDED has found issues with the quality of the audits submitted by some CPA firms. Thirdly, there is a need to automate the analytics of the film expenditure review process. With these issues in mind, the following are recommendations for improvement in the program:20
Allowing only one audit submission per project upon completion of spending in Louisiana.
Eliminating certain RTPs as qualifying expenditures.
20 Taken from Alvarez & Marsal, Louisiana Government Efficiencies Management Support: Final Report, pp. 217-219.

31
State law should be amended to eliminate certain “soft costs” such as finance fees, airfare, interest payments and insurance that generate no significant direct benefit to the Louisiana economy.
Granting LDED the authority to exercise more discretion through written policy as to the qualifying nature of the transactions and whether or not the transactions meet the stated interest of the Legislature.
State law needs to be changed, granting LDED the authority to engage with CPAs directly for the audit of cost reports submitted by applicants. LDED should develop minimum competency standards expected for audits submitted to LDED, which may include an approved list of CPAs and require CPA attendance at LDED training classes.
Develop a standardized chart, in alignment with entertainment industry accounting terminology, clearly identifying qualifying/non-qualifying expenditures by category.
Document current application and audit review procedures into an operating procedures manual, including proposed expenditures presented in the preliminary budget, as well as a detailed outline of the multiple review steps to be taken in order to verify the validity of related party transactions and soft cots.
Fully integrate an electronic submission system (currently through FastLane) and require any and all documentation submitted to OED to be done through the electronic system. The system may be accessed by other state agencies, such as LDR.
VII. Summary & Conclusions
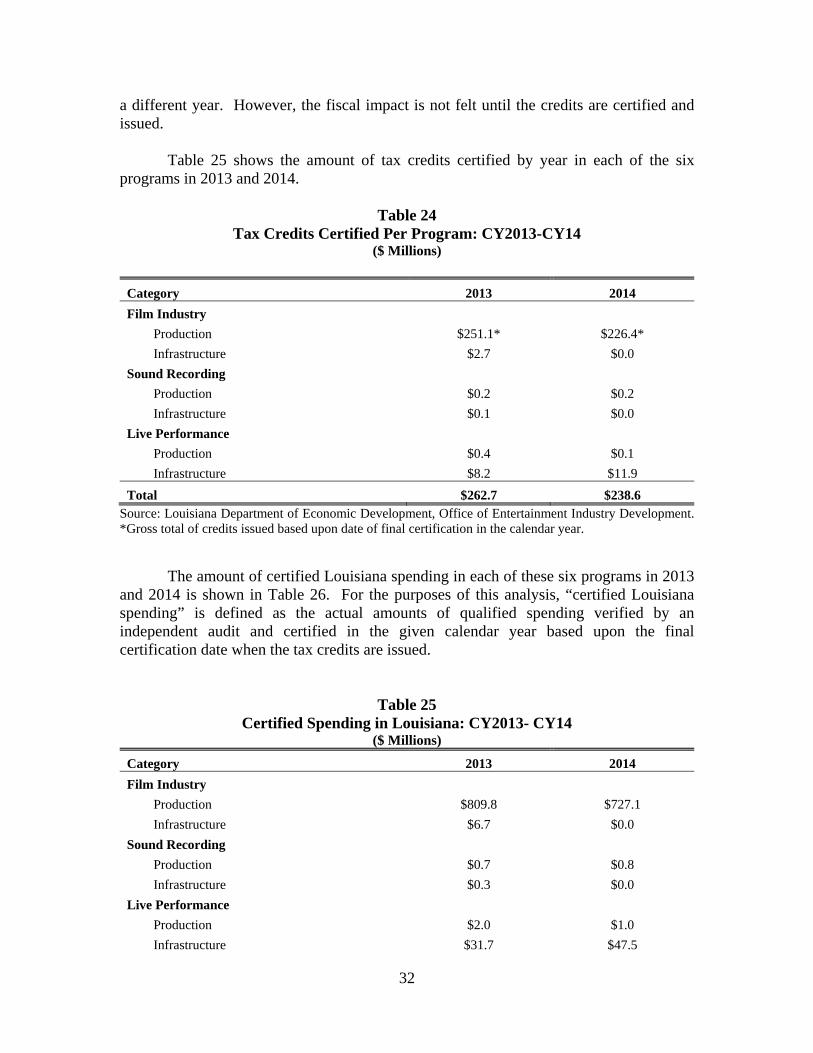
The purpose of this report is to examine the economic impact of the Louisiana tax credit incentive programs for the entertainment industry as administered by the Office of Entertainment Industry Development (OEID) within the Louisiana Department of Economic Development (LED) as required by La R.S. 47:6007(D)(6); 47:6023(D)(5) and 47:6034(G). Six programs are examined: (1) film production, (2) film infrastructure---which sunset on January 1, 2009, (3) sound recording production, (4) sound recording infrastructure---which sunset on August 1, 2009, (5) live performance production, and (6) live performance infrastructure---scheduled to sunset on January 1, 2014. A history of each program's development and a comparison to similar programs in key competing states is reviewed. This analysis is based upon the amount of audited expenditures finally certified and credits issued in calendar years 2013and 2014 based upon the final certification date. The economic impact is measured and calculated upon this premise. A portion of the spending that has been subsequently certified in a given calendar year, likely occurred in
32
a different year. However, the fiscal impact is not felt until the credits are certified and issued. Table 25 shows the amount of tax credits certified by year in each of the six programs in 2013 and 2014.
Table 24
Tax Credits Certified Per Program: CY2013-CY14 ($ Millions)
Category 2013 2014
Film Industry
Production $251.1* $226.4*
Infrastructure $2.7 $0.0
Sound Recording
Production $0.2 $0.2
Infrastructure $0.1 $0.0
Live Performance
Production $0.4 $0.1
Infrastructure $8.2 $11.9
Total $262.7 $238.6 Source: Louisiana Department of Economic Development, Office of Entertainment Industry Development. *Gross total of credits issued based upon date of final certification in the calendar year. The amount of certified Louisiana spending in each of these six programs in 2013 and 2014 is shown in Table 26. For the purposes of this analysis, “certified Louisiana spending” is defined as the actual amounts of qualified spending verified by an independent audit and certified in the given calendar year based upon the final certification date when the tax credits are issued.
Table 25 Certified Spending in Louisiana: CY2013- CY14
($ Millions)
Category 2013 2014
Film Industry
Production $809.8 $727.1
Infrastructure $6.7 $0.0
Sound Recording
Production $0.7 $0.8
Infrastructure $0.3 $0.0
Live Performance
Production $2.0 $1.0
Infrastructure $31.7 $47.5

33
Total $851.2 $776.3 Source: Louisiana Department of Economic Development, Office of Entertainment Industry Development
A state input-output table was used to estimate, inserting the direct spending in Table 26, the total impact on the Louisiana economy. Table 27 illustrates the impact in 2014 of each of the six programs on business sales, household earnings and jobs in the state. In that year the tax credit programs supported a little over $1.1 billion in sales at firms in the state, $760.2 million in household earnings for state residents, and 12,890 jobs. While not shown in the table, it is estimated that in 2014 this spending generated $53.3 million for the state treasury and another $34.2 million for local governments. The last column shows the weighted average of business sales per dollar of tax credits.
Table 26 Total Impacts Certified Spending on the Louisiana Economy: CY2014
($ Millions)
Category Business
Sales Household Earnings Jobs
Sales per Dollar of Tax
Credit
Film Industry
Production $1,048.4 $727.8 12,107 $4.63
Infrastructure $0.0 $0.0 0 NA
Sound Recording
Production $1.0 $0.7 21 $5.50
Infrastructure $0.0 $0.0 0 NA
Live Performance
Production $1.2 $0.4 10 $11.20
Infrastructure $98.9 $31.3 752 $8.32
Total $1,149.5 $760.2 12,890 $4.82
No certified film infrastructure or sound recording infrastructure spending in 2014. *Weighted average across all programs Data from Table 26 along with certified tax credits were used to estimate the impact to the state budget of achieving the benefits shown in Table 27. The amount of the impact to the state’s budget and the cost to the state per job are shown in Table 28.

34
Table 27 Budgetary Impacts Across All Entertainment Programs: 2014
($ Millions)
Category Impact on State Budget Cost per Job to State
Film Industry
Production -$171.4 $14,157
Infrastructure* None NA
Sound Recording
Production -$0.1 $6,872
Infrastructure* None NA
Live Performance
Production -$0.07 $6,983
Infrastructure -$9.7 $12,883 There was no film infrastructure or sound recording infrastructure spending in 2014.
The programs clearly have an economic impact to the state of Louisiana in the form of increased business sales and jobs for Louisiana residents. However, there are some expenditures that currently qualify which have minimal direct impact to Louisiana’s economy. As a result, it is recommended that eight changes (documented in Section VI) recommended by the Alvarez & Marsal study be adopted to: (1) eliminate certain spending presently qualified because the state enjoys little if any benefit from it, (2) that LDED be allowed to take steps to improve the quality of audits conducted on qualifying spending and (3) that LDED take steps to automate the analytics of the film expenditure review process.