Embed Size (px)
Citation preview

OCS Study MMS 2004-041
Economic Impact in the U.S. of Deepwater Projects: A Survey of Five Projects
U.S. Department of the InteriorMinerals Management Service Gulf of Mexico OCS Region

U.S. Department of the InteriorMinerals Management Service Gulf of Mexico OCS Region
OCS Study MMS 2004-041
Economic Impact in the U.S. of Deepwater Projects: A Survey of Five Projects Authors John J. Stiff Joachim Singelmann Prepared under MMS Contract 1435-01-99-CT-31019 by ABS Group, Inc. 16855 Northchase Drive Houston, Texas 77060 Published by
New OrleansMay 2004

iii
DISCLAIMER
This report was prepared under contract between the Minerals Management Service (MMS) and ABS Group, Inc. This report has been reviewed by the MMS and approved for publication. Approval does not signify that the contents necessarily reflect the views and policies of the Service, nor does mention of trade names or commercial products constitute endorsement or recommendation for use. It is, however, exempt from review and compliance with MMS editorial standards.
REPORT AVAILABILITY
Extra copies of the report may be obtained from the Public Information Office (Mail Stop 5034) at the following address:
U.S. Department of the Interior Minerals Management Service Gulf of Mexico OCS Region Attention: Public Information Office (MS 5034) 1201 Elmwood Park Boulevard New Orleans, Louisiana 70123-2394 Telephone Number: (504) 736-2519 or 1-800-200-GULF
CITATION Suggested citation:
Stiff, J. and J. Singelmann. 2004. Economic impact in the U.S. of deepwater projects: A survey
of five projects. U.S. Dept. of the Interior, Minerals Management Service, Gulf of Mexico OCS Region, New Orleans, LA. OCS Study MMS 2004-041. 184 pp.

v
TABLE OF CONTENTS Page
FIGURES.....................................................................................................................................................ix
TABLES ......................................................................................................................................................xi
1. SUMMARY AND OVERVIEW............................................................................................................1 1.1. Project Overview ........................................................................................................................ 1 1.2. Report Structure .......................................................................................................................... 3 1.3. Components of Deepwater Facility............................................................................................. 4
1.3.1. Decks......................................................................................................................... 4 1.3.2. Jackets ....................................................................................................................... 5 1.3.3. TLP and Spar Hulls................................................................................................... 6 1.3.4. TLP Tendons............................................................................................................. 7 1.3.5. Spar Moorings........................................................................................................... 8
1.4. Project Overview – Discussion of Findings................................................................................ 8 1.5. Possible Way Forward for Future Studies .................................................................................. 9
2. SUMMARY OF INFORMATION GATHERED ................................................................................11 2.1. Ursa Project............................................................................................................................... 13
2.1.1. Shell Supplied Data on Ursa - Fabrication.............................................................. 13 2.1.2. Shell Supplied Data on Ursa - Operations .............................................................. 16
2.2. Baldpate .................................................................................................................................... 20 2.3. Pompano ................................................................................................................................... 21 2.4. Neptune Spar............................................................................................................................. 21 2.5. “Sir Douglas Morpeth” Development....................................................................................... 23
2.5.1. Overview of Project ................................................................................................ 23 2.5.2. Information Gathered .............................................................................................. 25 2.5.3. Gulf Island Fabrication Inc. Data............................................................................ 29 2.5.4. Atlantia Supplied Information................................................................................. 34
2.5.4.1. Atlantia......................................................................................................34 2.5.4.2. Alan C. McClure and Assoc. Inc. .............................................................34 2.5.4.3. Survival Systems Int. ................................................................................34 2.5.4.4. Solar Turbines ...........................................................................................34 2.5.4.5. Offshore Technology Research Center at Texas A&M ............................34 2.5.4.6. ABB Vetco................................................................................................35 2.5.4.7. Smithco .....................................................................................................35 2.5.4.8. American Bureau of Shipping...................................................................35 2.5.4.9. Global Maritime........................................................................................35 2.5.4.10. Wellstream ................................................................................................35
2.5.5. Morpeth Conclusions .............................................................................................. 35
3. ECONOMIC ANALYSIS ....................................................................................................................36 3.1. Amount of Labor and Its Occupational Composition of the Morpeth Project.......................... 36 3.2. Occupational Structure of the Houma Labor Market Area ....................................................... 41
3.2.1. OES Data for Houma MSA..................................................................................... 42 3.2.2. STIO Data for Houma MSA ................................................................................... 42 3.2.3. OES-LA Data for Louisiana RLMA 3 .................................................................... 42 3.2.4. STIO for Louisiana RLMA 3.................................................................................. 42

vi
4. CHRONOLOGY OF FIELD DEVELOPMENT..................................................................................43 4.2. Prelease Acquisition.................................................................................................................. 43 4.3. Partners and Operator................................................................................................................ 43 4.4. Bids to Minerals Management Service ..................................................................................... 44 4.5. More Detailed Seismic.............................................................................................................. 44 4.6. Exploratory Drilling.................................................................................................................. 44 4.7. Field Delineation....................................................................................................................... 44 4.8. Well Testing.............................................................................................................................. 45 4.9. Decide to Develop..................................................................................................................... 45 4.10. Factors Affecting Development Options .................................................................................. 45
4.10.1. Water Depth ............................................................................................................ 46 4.10.2. Size of Field and Number of Wells......................................................................... 46 4.10.3. Expected Production Rate ....................................................................................... 46 4.10.4. Type of Crude ......................................................................................................... 46 4.10.5. Quantity of Gas ....................................................................................................... 47 4.10.6. Financial Risk ......................................................................................................... 47 4.10.7. Politics..................................................................................................................... 47 4.10.8. Local Infrastructure................................................................................................. 47 4.10.9. Length of Field Life ................................................................................................ 47 4.10.10. Possible Re-Use of Platform as a Hub .................................................................... 48 4.10.11. Need for Workover ................................................................................................. 48 4.10.12. Decommissioning Costs and Technology............................................................... 48
4.11. Development Options ............................................................................................................... 49 4.11.1. Conventional Jacket Based Structures .................................................................... 49
4.11.1.1. Limitations ................................................................................................49 4.11.1.2. Advantages................................................................................................49 4.11.1.3. Disadvantages ...........................................................................................50 4.11.1.4. Fabrication ................................................................................................50 4.11.1.5. Load-out, Transportation, Installation, and Piling ....................................51
4.11.2. Compliant Tower .................................................................................................... 54 4.11.2.1. Limitations ................................................................................................54 4.11.2.2. Advantages................................................................................................54 4.11.2.3. Disadvantages ...........................................................................................55 4.11.2.4. Fabrication ................................................................................................56 4.11.2.5. Load-out, Transportation, Installation, and Piling ....................................56
4.11.3. Tension-Leg Platform (TLP)................................................................................... 56 4.11.3.1. Limitations ................................................................................................57 4.11.3.2. Advantages................................................................................................57 4.11.3.3. Disadvantages ...........................................................................................57 4.11.3.4. Fabrication ................................................................................................58 4.11.3.5. Load-out, Transportation, Installation, and Piling ....................................58
4.11.4. Mini-TLP ................................................................................................................ 59 4.11.4.1. Limitations ................................................................................................61 4.11.4.2. Advantages................................................................................................61 4.11.4.3. Disadvantages ...........................................................................................61 4.11.4.4. Fabrication ................................................................................................61 4.11.4.5. Load-out, Transportation, Installation, and Piling ....................................61
4.11.5. Spar ......................................................................................................................... 62 4.11.5.1. Limitations ................................................................................................63 4.11.5.2. Advantages................................................................................................64 4.11.5.3. Disadvantages ...........................................................................................64

vii
4.11.5.4. Fabrication ................................................................................................64 4.11.5.5. Load-out, Transportation, Installation, and Piling ....................................64
4.11.6. Converted Semisubmersible.................................................................................... 64 4.11.6.1. Limitations ................................................................................................65 4.11.6.2. Advantages................................................................................................65 4.11.6.3. Disadvantages ...........................................................................................66 4.11.6.4. Fabrication ................................................................................................66 4.11.6.5. Transportation, Installation, and Anchoring/Piling...................................66
4.11.7. Deep-Draft Semisubmersible .................................................................................. 66 4.11.7.1. Limitations ................................................................................................66 4.11.7.2. Advantages................................................................................................67 4.11.7.3. Disadvantages ...........................................................................................67 4.11.7.4. Fabrication ................................................................................................67 4.11.7.5. Load-out, Transportation, Installation, and Piling ....................................67
4.11.8. Floating Production, Storage, and Offloading System (FPSO) .............................. 67 4.11.8.1. Limitations ................................................................................................68 4.11.8.2. Advantages................................................................................................69 4.11.8.3. Disadvantages ...........................................................................................69 4.11.8.4. Fabrication ................................................................................................69 4.11.8.5. Load-out, Transportation, Installation, and Piling ....................................70
4.11.9. Subsea Tieback ....................................................................................................... 70 4.11.9.1. Limitations ................................................................................................70 4.11.9.2. Advantages................................................................................................70 4.11.9.3. Disadvantages ...........................................................................................70 4.11.9.4. Fabrication ................................................................................................70 4.11.9.5. Load-out, Transportation, Installation, and Piling ....................................70
4.12. Financing................................................................................................................................... 71 4.12.1. Company Cash ........................................................................................................ 71 4.12.2. Stock Issues............................................................................................................. 71 4.12.3. Bond Issues ............................................................................................................. 71 4.12.4. Bank Loans ............................................................................................................. 71 4.12.5. Sale-Leaseback........................................................................................................ 71 4.12.6. Hedging................................................................................................................... 72
4.13. Preliminary Engineering ........................................................................................................... 72 4.14. Model Testing ........................................................................................................................... 72 4.15. Detail Engineering .................................................................................................................... 73 4.16. Bidding Options ........................................................................................................................ 73
4.16.1. Whole Project Turnkey ........................................................................................... 73 4.16.2. Major Packages ....................................................................................................... 73 4.16.3. Cost Plus ................................................................................................................. 74
4.17. Contractors ................................................................................................................................ 74 4.17.1. Schedule .................................................................................................................. 74 4.17.2. Project Management ............................................................................................... 74 4.17.3. Labor Force ............................................................................................................. 74 4.17.4. Material Supply....................................................................................................... 74 4.17.5. Transportation ......................................................................................................... 75 4.17.6. Safety Systems ........................................................................................................ 75 4.17.7. Weather ................................................................................................................... 75

viii
4.18. Quality Control ......................................................................................................................... 75 4.19. Transportation ........................................................................................................................... 75 4.20. Assembly................................................................................................................................... 76 4.21. Installation................................................................................................................................. 76
4.21.1. Template.................................................................................................................. 76 4.21.2. Tendons................................................................................................................... 76 4.21.3. Tendon Connectors ................................................................................................. 77 4.21.4. Jacket....................................................................................................................... 77 4.21.5. Deck ........................................................................................................................ 77 4.21.6. Moorings ................................................................................................................. 77 4.21.7. Pipelines .................................................................................................................. 77 4.21.8. Risers....................................................................................................................... 77 4.21.9. Subsea Wells ........................................................................................................... 77
4.22. Commissioning ......................................................................................................................... 78 4.22.1. Topsides .................................................................................................................. 78 4.22.2. Pipelines .................................................................................................................. 78 4.22.3. Risers....................................................................................................................... 78
4.23. Development Drilling ............................................................................................................... 78 4.24. Operations ................................................................................................................................. 78
4.24.1. Production and Processing ...................................................................................... 78 4.24.2. Well Maintenance ................................................................................................... 79 4.24.3. Maintenance and Inspection.................................................................................... 79 4.24.4. Supply Boats ........................................................................................................... 79 4.24.5. Crew Changes ......................................................................................................... 79
5. SHALLOW WATER VS. DEEPWATER............................................................................................79 5.1. Manning .................................................................................................................................... 80 5.2. Subsea ....................................................................................................................................... 80 5.3. Pipelines and Gas ...................................................................................................................... 80 5.4. Infrastructure............................................................................................................................. 81 5.5. Drilling...................................................................................................................................... 81 5.6. Platforms ................................................................................................................................... 81 5.7. Workover .................................................................................................................................. 83 5.8. Blowouts ................................................................................................................................... 84 5.9. Evacuation................................................................................................................................. 84
References...................................................................................................................................................87
Appendix...................................................................................................................................................A-1

ix
FIGURES Page
Figure 1. Gulf of Mexico Seafloor Relief Map Showing Locations of Platforms in Study (Courtesy of Geoscience Earth & Marine Services, Inc. (GEMS)). ....................................... 2
Figure 2. Distribution Between Cost of Development Drilling and Structure. ...................................... 3 Figure 3. Deck Installed on a Jacket....................................................................................................... 4 Figure 4. Pompano Platform on Location (Artist impression courtesy of J. Ray McDermott, Inc.)...... 5 Figure 5. Baldpate Compliant Tower (Courtesy of Amerada Hess). ..................................................... 5 Figure 6. Shell Ursa TLP (Courtesy of Shell Exploration and Production Co.). ................................... 6 Figure 7. Sir Douglas Morpeth Mini-TLP (Courtesy of Atlantia Offshore Ltd.)................................... 7 Figure 8. Neptune Spar Operating on Location (Courtesy of Kerr-McGee Oil and Gas Corp.). ........... 7 Figure 9. Studless Chain (Courtesy of Vicinay International Chain Co.). ............................................. 8 Figure 10. Cost of Offshore Platforms Compared to Other Structures and Contracts. .......................... 12 Figure 11. Approximate Distribution of Costs for Ursa TLP (100% is $950 million)........................... 13 Figure 12. Discoverer Seven Seas (Courtesy of Transocean). ............................................................... 14 Figure 13. Ursa Project Management: Distribution of 130 Interface Personnel Between Disciplines
and Locations. ....................................................................................................................... 15 Figure 14. Number and Location of Vendors on Ursa Project by State (Courtesy of Shell
Exploration and Production Co). .......................................................................................... 16 Figure 15. Approximate Monthly Pay for Offshore Personnel (US$ per calendar month).................... 17 Figure 16. C-Port Supply Boat Base in Fourchon, LA (Courtesy of Edison Chouest Offshore). .......... 18 Figure 17. Drilling and Production Operating Costs of Ursa TLP. ........................................................ 19 Figure 18. Ursa Production and Drilling Costs Per Day. ....................................................................... 19 Figure 19. Baldpate Compliant Tower: Topside Engineering, Procurement, Inspection,
Project/Construction Management........................................................................................ 20 Figure 20. Neptune Spar After Mating and Under Tow to Location...................................................... 22 Figure 21. Sea Pony Shallow Water Platform (Courtesy of Seahorse Platform Partners Ltd.).............. 24 Figure 22. Sir Douglas Morpeth Mini-TLP Installed (Courtesy of Atlantia Offshore Ltd.). ................. 24 Figure 23. Morpeth Field Layout Showing Subsea Wellheads and Pipeline to Shallow Water
Facility (Courtesy of Atlantia Offshore Ltd.). ...................................................................... 25 Figure 24. Sir Douglas Morpeth Mini-TLP: Cost Breakdown. .............................................................. 27 Figure 25. Breakdown of $99,200,000 Cost for Morpeth Platform with Sample Vendor Locations
(Note: Costs do not include subsea and pipeline costs.). ..................................................... 28 Figure 26. Outside Expenditure by Gulf Island by State........................................................................ 30 Figure 27a. Vendors to Gulf Island Fabrication for the Hull and Deck Structure Fabrication of
Morpeth Mini-TLP (Primary supplies are steel, paint, and anodes.) .................................... 31 Figure 27b. Morpeth Mini-TLP Number of Primary Vendors by State. .................................................. 32 Figure 27c. Morpeth Mini-TLP Income for Primary Vendors by State................................................... 33 Figure 28. Man-hour Labor Distribution on Morpeth at Gulf Island Fabrication. ................................. 39

x
Figure 29. Cumulative Hours on Hull and Deck Fabrication and Assembly at Gulf Island Fabrication on Morpeth......................................................................................................... 40
Figure 30. Pompano Jacket at Harbor Island Yard during Side Roll-Up (Courtesy of J. Ray McDermott)........................................................................................................................... 51
Figure 31. Shell Bullwinkle Jacket Just Prior to Launch (Courtesy of Shell Exploration and Production Co.). .................................................................................................................... 52
Figure 32. Bullwinkle Jacket during Launch (Courtesy of Shell Exploration and Production Co.). ..... 53 Figure 33. Jacket Deck Arriving on a Barge. ......................................................................................... 53 Figure 34. Lifting a Deck onto Jacket with Two Cranes on One Derrick Barge.................................... 54 Figure 35. Ursa TLP after Installation of Deck at Curacao (Courtesy of Shell Exploration and
Production Co.). .................................................................................................................... 57 Figure 36. Deck Installation on Ursa (Courtesy of Shell Exploration and Production). ........................ 58 Figure 37. Ursa TLP Dry Towed from Italy (Courtesy of Shell Exploration and Production). ............. 59 Figure 38. Wet Tow of Ursa from Curacao to Site (Courtesy of Shell Exploration and
Production Co.). .................................................................................................................... 59 Figure 39. El Paso Prince TLP (Courtesy of MODEC Int. LLC). ......................................................... 60 Figure 40. Anadarko Operated Marco Polo TLP Owned by El Paso & Caldive (Courtesy of
MODEC Int. LLC)................................................................................................................ 60 Figure 41. Morpeth Hull Transportation to Site (Courtesy of Atlantia Offshore Ltd.). ......................... 62 Figure 42. Lifting Deck of Morpeth into Place (Courtesy of Atlantia Offshore Ltd.). .......................... 62 Figure 43. Neptune Spar (Courtesy of Kerr-McGee Oil and Gas Corp.). .............................................. 63 Figure 44. Three Spar Configurations as Used by Kerr-McGee (Courtesy of Kerr-McGee Oil and
Gas Corp.). ............................................................................................................................ 63 Figure 45. Converted Semisubmersible Laffit Pincay............................................................................ 65 Figure 46. Pemex Ta’Kuntah FSO (Courtesy of MODEC Int. LLC). ................................................... 68 Figure 47. Pemex Ta’Kuntah FSO Simultaneous Offloading (Courtesy of MODEC Int. LLC). .......... 69 Figure 48. Model of a Mini-TLP being Model Tested in a Wave Basin (Courtesy of Atlantia
Offshore Ltd.). ...................................................................................................................... 73 Figure 49. Shallow Water Gulf of Mexico Jacket under Tow in Bayous............................................... 76 Figure 50. Supply Vessel Amy Chouest at Dock. .................................................................................. 79 Figure 51. SeaHarvester Minimal Platform (Courtesy of Sea Horse Platform Partners Ltd.). .............. 82 Figure 52. Platform Complex in Cantarell Field, Mexico. ..................................................................... 82 Figure A-1. Data for the 1998-2008 Employment Projections Cover the State of Louisiana and the
Eight Regional Labor Market Areas (RLMA’s). ................................................................A-3 Figure A-2. Houma Metropolitan Statistical Area (MSA) Includes Lafourche and Terrebonne
Parishes Compared to Regional Labor Market Area 3 (RLMA 3), which also Includes Assumption Parish. .............................................................................................................A-4

xi
TABLES
Page Table 1 Projects Studied ...................................................................................................................... 1 Table 2 Areas of Major Fabrication or Assembly................................................................................ 1 Table 3 Overall Costs of Baldpate (extracted from OTC paper 10914) ............................................ 20 Table 4 High-Level Cost Breakdown for Neptune Spar .................................................................... 22 Table 5 Breakdown of Principal Costs for Morpeth (from OTC paper 10854) ................................. 26 Table 6 Percent Hours and Percent of Wages for Morpeth Project ................................................... 37 Table 7 Summary of Hours and Percent of Wages for Morpeth by Discipline ................................. 38 Table 8 Number of Full-Time Equivalent Workers ........................................................................... 41 Table A-1 Regional Labor Market Area and Houma Metropolitan Statistical Area—1999 Wage
Comparison .........................................................................................................................A-5 Table A-2 Houma Metropolitan Statistical Area—1998, Occupational Employment Statistics
(OES) Survey (Bureau of Labor Statistics, Department of Labor, website: http://stats.bls.gov/oeshome.htm)......................................................................................A-16
Table A-3 Houma Metropolitan Area—Lafourche and Terrebonne Parishes (Data are from the1990 Census special tabulation of occupation by industry. These counts are for all industries.).........................................................................................................................A-28
Table A-4 Houma Metropolitan Area—Lafourche and Terrebonne Parishes (Data are from the 1990 Census special tabulation of occupation by industry. These counts are for SIC=353, Construction and Related Machinery, and SIC=373, Ship and Boat Building and Repairing.)..................................................................................................................A-39
Table A-5 Regional Labor Market Area 3—Assumption, Lafourche, and Terrebonne Parishes Occupational Employment Statistics (Louisiana Department of Labor) .........................A-42
Table A-6 Louisiana Department of Labor Region 3—Lafourche, Terrebonne, and Assumption Parishes (Data are from the 1990 Census Special Tabulation of Occupation by Industry. These counts are for all industries.) ..................................................................................A-70
Table A-7 Louisiana Department of Labor Region 3—Lafourche, Terrebonne and Assumption Parishes (Data are from the 1990 Census Special Tabulation of Occupation by Industry. These counts are for SIC=353, Construction and Related Machinery, and SIC=373, Ship and Boat Building and Repairing.) ...........................................................................A-78

1
1. SUMMARY AND OVERVIEW 1.1. PROJECT OVERVIEW
The aim of the project was to study five specific deepwater Gulf of Mexico developments and show how their fabrication, installation, and operation has had an economic impact around the United States and, to a lesser extent, the world. The five developments studied cover a number of different methods for developing deepwater reserves in the Gulf of Mexico. The projects are summarized in the two tables below. Table 1 gives the type and general costs. These are not entirely consistent as discussed in the notes, but the major deviation concerns Pompano that does not include many additional costs associated with the project. Table 2 gives a very broad layout of where the major components were fabricated or assembled. Figure 1 shows the locations of the different projects on a map of the Gulf of Mexico.
Table 1
Projects Studied
Project Name Operator Structure Type Water
Depth Cost (see notes)
Ursa Shell Tension Leg Platform (TLP) 3,800 feet $950 million1
Sir Douglas Morpeth
British Borneo (now Agip) Mini-TLP 1,690 feet $159 million2
Neptune Oryx (now Kerr-McGee) Spar 1,930 feet $130 million3
Baldpate Amerada Hess Compliant Tower 1,650 feet $215 million4
Pompano BP Amoco (now BP) Conventional Jacket 1,294 feet $100 million5
Notes on costs: 1 This cost includes the hull, tendons, deck, facilities, risers, pipelines, and installation. It is based on Shell published total project cost of $1.45 billion, of which 65% is for the facilities and 35%, or $500 million, is for the development drilling and completion. 2 Includes TLP, subsea, pipelines, and project costs, but does not include development drilling. 3 Includes hull, mooring, topsides, installation, risers, and project costs. Development drilling and completion were an additional $42 million. 4 Includes the tower, facilities, pipeline, and project costs. Development drilling and completion were an additional $117 million. 5 Includes the fabrication costs ONLY; does not include installation, pipelines, or any drilling costs.
Table 2
Areas of Major Fabrication or Assembly
Project Type Deck Hull/Jacket Tendons/Mooring Ursa TLP Louisiana Italy Japan Sir Douglas Morpeth Mini-TLP Louisiana Louisiana Japan Neptune Spar Louisiana Finland Pennsylvania/Spain Baldpate Compliant Tower Texas Texas/Louisiana N/A Pompano Conventional Jacket Louisiana Texas N/A
Figure 2 shows the approximate breakdown between the cost of the installed structure, and the cost to
drill development production wells. There are many factors that affect the cost of development drilling, and while water depth is important, it is not necessarily the most important factor. As an example, Shell had serious problems drilling the development wells for Ursa, and had to abandon the first wells. The Morpeth wells were also far more expensive than expected.

2
Figure 1. Gulf of Mexico Seafloor Relief Map Showing Locations of Platforms in Study (Courtesy of Geoscience Earth & Marine Services, Inc. (GEMS)).
Baldpate (Compliant Tower) Garden Banks 260 1650 feet W.D.
Pompano (Jacket)Viosca Knoll 989 1294 feet W.D.
Sir Douglas Morpeth (Mini-TLP)Ewing Bank 921 1690 feet W.D.
Neptune (Spar)Viosca Knoll 826 1930 feet W.D.
Ursa (TLP) Mississippi Canyon 810
4000 feet W.D.
New Orleans
Houston

3
$0
$100
$200
$300
$400
$500
$600
$700
$800
$900
$1,000
URSA TLP Morpeth Mini-TLP
Neptune Spar BaldpateCompliant Tower
Cos
t of S
truct
ure
vs D
rillin
g ($
Mill
ions
)
DrillingStructure
Figure 2. Distribution Between Cost of Development Drilling and Structure.
1.2. REPORT STRUCTURE The purpose of this report is to present the information gathered during the course of the project, as
requested by the Minerals Management Service (MMS) as part of the contract. The report is split into five major parts. These include:
1. Summary and Overview: This section of the report briefly discusses the deepwater projects that were studied, an overview of each project, a brief discussion of the findings, and a possible way forward that could be taken by a new study to gather the information that was wanted.
2. Summary of Information Gathered: This section presents the information that was possible to gather on the different deepwater projects concerning where the structures were fabricated, the major sub-contractors, and any other additional information discovered during the course of the study.
3. Economic Analysis: The section presents the results of an analysis of information obtained from one fabrication yard. The analysis was performed by Dr. Joachim Singelmann of Louisiana State University in Baton Rouge. Only one suitable data set was given to the project team during the course of the study. Other data were found, but not in sufficient detail to warrant analysis.
4. Chronology of Field Development: The section goes through the process of developing a deepwater prospect from pre-lease acquisition to abandonment. This had been requested by the MMS team at the start of the project. It is known that some of this information is available in other MMS published documents, but the intent was to present the information in a slightly different form.
5. Shallow Water vs. Deepwater: The section discusses some of the major differences between developing a deepwater and shallow water field, as required by the contract.
Ursa TLP

4
1.3. COMPONENTS OF DEEPWATER FACILITY Some very general discussions can be made concerning the information contained in Table 2. The
major components are discussed at a high level in the following subsections to help give an overview of how each deepwater facility was developed.
1.3.1. Decks The deck of an offshore installation is the main part above water that supports all the living quarters,
process equipment, power generation, etc. While there will normally be a significant amount of structure, the main cost will normally be in the installed equipment (Figure 3 shows a deck installed on a jacket. This is not a deep water structure, but shows the major components of accommodation and equipment. Some decks will have drilling capability, although this does not have a derrick.). The decks for all the structures were fabricated within the Gulf Coast region. Decks are generally fabricated at a location from which they can easily be loaded onto a barge for transportation to the installation site. The Gulf Coast region has extensive experience fabricating decks for offshore installations, and can do so efficiently. In addition, transportation costs and risk make overseas fabrication significantly less attractive. This is illustrated by the example of the Nemba deck that was being transported from the fabrication yard in the Far East to the installation site in West Africa. The ship capsized after hitting an unmarked obstruction in the Sunda Strait, Indonesia. Both the deck and ship were total losses, and the field development was seriously delayed at significant cost to Chevron, the operator.
Figure 3. Deck Installed on a Jacket. The vast majority of the components used to assemble these decks are supplied by local vendors,
including most of the process equipment. One of the major exceptions is solar turbines that supply the power generation equipment on many of the deepwater projects. They are based in California where the gas turbines are fabricated1. There are other non-Gulf Coast vendors, but they tend to total a relatively small percentage of the overall deck fabrication cost. This is generally true for all decks, regardless of structure type, or even water depth. What is less clear is where the vendors get their supplies, and this is possibly an area for future study. 1 As discussed later, even this can be confusing since Shell has Solar based in Texas on their vendor list for Ursa, their contract being with the local office.

5
1.3.2. Jackets A jacket is the main support structure for most types of conventional shallow water offshore
platforms, and some deepwater platforms, up to approximately 1,300 feet water depth. It is called a jacket because it encloses and supports the conductors that carry the piping through which the hydrocarbons are produced. Because they have to act as a support structure for the deck, taking the loads all the way to the seabed, as the water depth increases, the size of the jacket increases enormously.
There are two structures on the list that are essentially jacket-based, Pompano (a conventional jacket structure; see Figure 4) and Baldpate (a compliant tower; see Figure 5). Both of these structures employed similar construction methods. As with decks, jackets need to be fabricated close to the sea so that they can be loaded onto a barge and towed to location. The Gulf Coast has many years experience fabricating jackets for the Gulf of Mexico and West Africa. The yards and labor force can efficiently fabricate jackets without incurring the additional risk and cost of trans-oceanic towing2.
Figure 4. Pompano Platform on Location (Artist impression courtesy of J. Ray McDermott, Inc.).
Figure 5. Baldpate Compliant Tower (Courtesy of Amerada Hess).
With years of experience, jacket construction is relatively straightforward and involves a large labor
force to roll the steel, cut and prepare the tubulars, and weld them in place. The major costs besides the local labor force are the fabrication materials including steel members, sacrificial anodes (to protect the jacket from corrosion), and welding rods.
2 Most of the large California jackets installed in Santa Barbara Channel were built in Japan. One of those suffered significant damage during transportation. The others involved very expensive analysis and modification to ensure no damage. Other jackets not going to California have been total losses after falling off the barge in heavy seas.

6
1.3.3. TLP and Spar Hulls A tension leg platform (TLP) is a floating structure that is held to the seabed by vertical tendons that
are kept in high tension by the buoyancy of the TLP hull (Figure 6 shows the Shell Ursa TLP, and Figure 7 shows the Sir Douglas Morpeth mini-TLP on location). A spar is a large vertical cylinder (although variations now exist) that floats in the sea, and is moored to the seabed by relatively conventional mooring lines and anchors (Figure 8 shows the Neptune spar on location). The TLP and spar hulls can be likened to conventional steel plate construction common to many shipyards. However the unique cylindrical shape of a conventional spar necessitates setting up a series of special “jigs,” to aid in construction and assembly, which requires a relatively large capital expenditure. A yard so equipped has an automatic advantage over its competitors. When Spars International was established as a joint venture between McDermott and Aker, it was agreed that any spar contracts would have a hull built in Aker Rauma, Finland, and the deck built by McDermott. This put Aker Rauma in a strong competitive position. Future spars, especially those with modifications to the original spar concept3, will be built on the Gulf Coast. Indeed, since the start of this project, Kerr McGee has contracted to have a cell spar built for the Red Hawk field development by CSO Aker in their yard near Corpus Christi. As with conventional jacket construction, such projects would primarily involve local Gulf Coast labor.
Figure 6. Shell Ursa TLP (Courtesy of Shell Exploration and Production Co.).
The Shell TLP hulls have been built at Belleli Offshore Oil and Gas in Italy. There is no reason that TLP hulls could not be built around the Gulf Coast, except that there are not many shipyards that can competitively undertake that sort of plate construction on a large scale, particularly given some of the Italian government incentives. However, the mini-TLP’s (Morpeth in this study, but also Allegheny, Prince, and others) installed in the Gulf of Mexico have been built on the Gulf Coast, though there have also been some contracted for construction in Korea. Typically the expense and risk of open ocean transportation makes the Korea fabricators less appealing, but the lower construction costs in Korea are challenging this view. At this time domestic shipyards are still at an advantage over their foreign competition for mini-TLP’s. It is also of note that these mini-TLP’s would probably not have been installed without the previous Gulf of Mexico experience with full-size TLP’s (e.g., Ursa, Mars, etc.). In effect, the foreign content spawned domestic work around the Gulf Coast.
3 There has been some research into the use of noncylindrical spars, including truss braced versions. There is a truss spar being fabricated at this time in Finland, although there is no reason that this could not have been economically fabricated on the Gulf Coast. The Finland connection is through Spars International, the contractor. There has also been discussion concerning the fabrication of rectangular spars. These would not need the expensive jigs, and could be easily fabricated on the Gulf Coast.

7
Figure 7. Sir Douglas Morpeth Mini-TLP (Courtesy of Atlantia Offshore Ltd.).
Figure 8. Neptune Spar Operating on Location (Courtesy of Kerr-McGee Oil and Gas Corp.).
1.3.4. TLP Tendons Sumitomo Corporation, out of Japan, has supplied nearly all the tendons used on TLP’s. The pipe is
shipped to Aker Gulf Marine yard in Texas where the tendons are assembled, and end connections fitted. It is not that other steel mills cannot supply the material, but Sumitomo have gained significant credibility over the years, which is extremely important, particularly if the oil company is trying to finance the venture. Banks prefer proven technology for their loans (see section on Financing). The top and bottom tendon connectors were supplied by ABB Vetco Gray (Houston, Texas) and the tendon connectors were supplied by Oil States Industries out of Aberdeen, United Kingdom. Like Sumitomo, both of these companies have a proven track record, which gives them the edge in their respective fields.

8
1.3.5. Spar Moorings The Neptune spar moorings are made up of both wire rope and chain. The chain was supplied by
Vicinay in Spain. Figure 9 shows 6-inch diameter chain being manufactured and inspected for defects at the Vicinay fabrication facility in Spain. There are three main offshore chain manufacturers, and none is domestic (the other two are Scana Ramnas in Finland and Hamanaka in Japan). The cost of the chain was approximately $3.5 million, or just under 3 percent of the spar costs. The wire rope was supplied by Williamsport Wire Rope, out of Williamsport, Pennsylvania, for approximately $2 million, including the cost of sheathing it at Wellstream in Panama City, Florida.
Figure 9. Studless Chain (Courtesy of Vicinay International Chain Co.).
1.4. PROJECT OVERVIEW – DISCUSSION OF FINDINGS There is no doubt that much of what goes into the deepwater development in the Gulf of Mexico
comes from all over the United States, but the present level of study has not uncovered this. The problem is that most of the fabrication is centered on the Gulf Coast, and most of the equipment vendors are local to the fabrication. It is not until one gets to at least the next level down that one is likely to uncover the diverse sources of the supply.
As an example, Shell supplied a list of their Ursa vendors to the study team. This list contained approximately 1,000 company names coming from all over the U.S. Of those, probably less than 10 percent represent individual expenditures of over 1 percent of the TLP cost (approximately $1 million). The other 90 percent of vendors represent small to very small expenditures (the lowest being under $10). While the list is not in error, it can be misleading. As an example it states that Sumitomo Corporation of America, in Illinois, supplied the pipe for the tendons. While this is no doubt where it was ordered, and to whom the money was paid, the actual pipe came from Japan, not Illinois. Another example has the turbines ordered from Solar Turbines Inc. in Texas. In fact the turbines would have been fabricated in California, although these were some of the few components that came from outside the Gulf Coast area.
Under the original scope of work, ABS Consulting agreed to trace back to major vendors. This, however, has not shown the level of diversification sought from the study. It has shown that the majority of the work is centered on the Gulf Coast, with only a very limited number of major vendors situated outside that area. While the study has not been successful in obtaining detailed information on the project vendors, it has certainly discovered that the vast majority of the major vendors and sub-contractors are from around the Gulf Coast. It is only at the next level down, or even deeper than that, that the diversification comes to light. As an example, Hydralift was one of the Ursa vendors. The size of their contract was approximately $10 million, and they supplied the tensioner system for the risers. What they supplied was assembled in Houston, but their suppliers included cylinders that came from Chicago (cost a

9
few million dollars), and specialist composite accumulators that came from Nebraska. Of their ~$10 million contract, maybe as much as $6 million was for hardware that came from areas other than the Gulf Coast.
Compounding the problem has been the reluctance with which certain companies have supplied data: information has been slow, and at times very difficult to obtain. The number of telephone calls needed to obtain any meaningful data has been excessive in the vast majority of cases. There have been some notable exceptions, which is the main reason for the progress on the Morpeth project: the major players in the development of that project have been extremely helpful, but that cooperation did not necessarily filter down to the next level of companies. Unfortunately, British Borneo has now been taken over by Agip, and most of the staff have had to find alternative employment.
Shell has been extremely cooperative with information on vendors, but have been reticent in supplying any cost data. It is corporate policy not to disclose the value of contracts that make up the development. This has made it difficult to meaningfully assess their fabrication vendor list, and impossible to determine labor usage at the various facilities. Alternatively, they have supplied excellent data on their operating expenditures and project management labor usages. These data have been helpful in putting deepwater facility operations into perspective, but they cannot be analyzed with respect to labor markets because the number of persons employed in any given aspect is so small. Indeed, this could be a problem associated with gathering data on suppliers to the subcontractors: each supplier will have a relatively small percentage of their output assigned to any specific project, so at the lower levels, the impact of deepwater development on any given company is reduced. It should not be inferred that the overall impact is low, but as one investigates further down the supply hierarchy, the impact is reduced.
Difficulty in gathering data was not necessarily because the companies were trying to be uncooperative: there has been a major change in the way oil companies work over the last decade, and they do not currently have the personnel to supply the requested information. Their personnel are extremely busy, particularly at this time of increased development. There was a willingness in some companies to help the study, but no time to put in the level of effort required. It is only the major oil companies that have a strong public relations department that can field questions about a particular development. Most of the independent oil companies would have to rely on the project personnel to supply the needed information, and while these people may be willing to “talk over lunch,” they have full time jobs managing the next development.
The lack of cooperation at the next level down, the vendors of equipment to be installed on the decks, and the process equipment suppliers, was probably more due to a lack of understanding as to the advantage in assisting the project. They supply a certain type of separator, for example. It makes no difference to them if it is on a deepwater or shallow water platform. Hence, they do not see any advantage in showing diversification of input to deepwater facilities. In addition, they are in a highly competitive market and see no advantage in using their time to supply the requested information, and are possibly somewhat concerned that the data may help their competition: why risk supplying data when there is no advantage, even if the risk is small?
1.5. POSSIBLE WAY FORWARD FOR FUTURE STUDIES The extant study has had limited success in unearthing the desired level of national involvement in
deepwater developments. This is for two main reasons: the main contractors are all located around the Gulf Coast, and because of a general unwillingness to dedicate resources to gather information. Also it is clear that while there are differences between the different development methods, they are largely ones of magnitude rather than content. Consequently, it may be possible for a future study to take a deepwater project that is under development and trace the content one stage further back – to find out where the vendors get their supplies.
Gulf Island Fabricators, who were the major fabricator for the Morpeth hull and deck, gave the study team a list of their suppliers of steel and paint. Over 40 percent of their expenditure on basically steel and paint was in Louisiana. How many steel mills are there in Louisiana? Clearly they are buying from suppliers rather than from the mills themselves. This will be, in part, because of the way the project was structured. They did not have the opportunity to purchase the steel in one block. Some of this steel will have come from overseas, some from within the U.S., but this could not be determined through the present study.

10
If one were to research an ongoing project, it may be possible to trace the equipment suppliers back more easily than is possible on an old project, but this will not be a simple task. When equipment is ordered, there are situations in which the supplier does not know to which project the equipment is going. They simply know that a specific customer has ordered a specific “widget” based on a specific purchase order, and it must be supplied to a specific specification. They cannot necessarily tie that to any particular project. In addition, the oil companies are using single contracts that cover almost the entire project. Hence they will generally have less information about the details of the constituent components that are ordered by their engineering, procurement, installations, and construction (EPIC) contractors. Hence, an extra level is added that must be penetrated in order to determine the true source of the equipment. In addition, the power of the oil company to pressure the contractor is diminished as one moves away from the main contractor.
When an installation is classed by ABS, surveyors will attend to ensure that all the major components are manufactured to the required classification society rules. Consequently, they will attend all over the U.S. and the world inspecting equipment. These data could be used to determine where the pieces of equipment which make up an installation come from, but even this would not be simple. The ABS contract will normally be with the vendor of each piece of equipment. Hence, to release that information, they would need to get the permission of each vendor. In addition, there would be no information on the value of each component, and certainly no information on the percentage of a company’s capacity used in each item. There are a number of ways that parts of the required information could be obtained, but the systems are not set up to gather additional information. It would probably not be possible to get the individual surveyors to try to get additional information because of the number of different surveyors involved, and because of the added expense – who would pay for it, and how would it be tracked? In addition, unless the process equipment is specifically being classed, there could be large holes in the data collected.
It is not entirely clear what is the best way forward. In part it depends on the priority for the different types of information. If the source of supplies is wanted, then that could probably be determined from classification society records, with permission from each vendor, but even this would need to be done on an ongoing construction project: it could not realistically be done retroactively.
Information on the price breakdown on a specific project could probably be gathered from the oil company via their AFEs (Approved for Construction Expenses). But this again would need to be agreed to up front, before project start-up, and getting cooperation from all parties could still be problematic.
The greatest difficulty comes in getting all the information tied together: the source of the steel: the value of the steel: the effect of that steel production on local labor. The AFE records will say who was paid a specific sum of money, but not where they subsequently spent it. Hence, the tracking back will be, at best, difficult. The class survey records will give the location of the supplies (although these may be limited if the topside is not classed) but will have no information on value. The individual sub-contractors may have a high percentage of their business with the offshore industry, but any specific project may have a minor impact on their labor usage, and an even smaller effect on a local market. The components of the information may well be discoverable by one method or another. It may even be possible to get all the information, but it will be very difficult to get all the information tied together in a way that it can be analyzed. A map similar to the one produced by Shell (see Figure 14) could be produced through use of class records. Analyses of labor may be possible by using AFE data, and through company assistance, but that would be much more difficult.
It should be possible to complete a project similar to this on a project that is identified prior to its commencement, but realistic goals will need to be set, and the types of data wanted realistically identified.

11
2. SUMMARY OF INFORMATION GATHERED This section sets out the basic data that was gathered during the course of the project. Unfortunately,
in few cases was it possible to get sufficient information on all the projects to undertake a meaningful comparison: where there is good data on one project, there is poor data on another. The three projects undertaken by the independent oil companies (Neptune by Oryx4, Baldpate by Amerada Hess, and Sir Douglas Morpeth by British Borneo) were each the subject of special sessions of technical papers at the Offshore Technology Conference (OTC) in 1997, 1999, and 1999, respectively. These papers were a very good starting point for gathering the needed information, and gave a high level breakdown of the project costs. There were no technical sessions for Ursa or Pompano as neither represented particularly new technology at the time (there had already been sessions on a full-size TLP in the Gulf of Mexico, and a deepwater jacket at earlier OTC’s), but Shell had an excellent web site that gave a good overview of the Ursa project, including the overall cost of the project. Unfortunately, very little information was available about BP’s Pompano project, either on the web, or through published sources.
Having surveyed the public sources, the next step was to gather information directly from the oil companies, and their contractors. To help in getting consistent information, a guide was developed that would help set out the types of information needed, and to document other possible sources. This guide allowed the gathering of a broad range of information on costs, from overall project, exploration, project management, and fabrication, through to final operations. It was well understood that not all companies would be able to supply all the requested information, but it had been hoped there would be more consistency than was achieved.
The following subsections set out an overview of the information obtained from each of the oil companies, or other sources, on each of the projects. Analysis of the data is not realistically possible because of the lack of consistency in quantity and quality of the data, but the results are presented in graphical form. As these are generally isolated pieces of information, one cannot draw conclusions as to, for example, the difference in project management costs between a project by a major oil company, and one by an independent. Notwithstanding this, there is a significant amount of data that could be used for other projects in the future.
The purpose of the study was not just to gather data on the costs of the projects, but to tie that into socioeconomic effects of the projects on the local communities. This issue is addressed in the section on Economic analysis, but as with much of the other data, no firm conclusions could be drawn.
It may be constructive to initially give a visual presentation of the costs of the studied offshore projects in comparison with some other objects (or in one case, a sport’s contract). The shallow water minimal platform is at the lower end of the cost of an offshore structure, but there are certainly some that cost significantly less than $1 million, even as a new installation. However, when one then includes the cost of drilling the wells, then the price will normally increase significantly. Clearly the costs are approximate, but give an indication of the level of expenditure in different classes of industry. It is amusing to note that Alex Rodriguez’s 10-year contract is approximately the same as the cost of a new modern baseball stadium (see Figure 10).
4 The names given are those of the companies that installed the facilities. Ownership has changed in some cases since installation.

12
Petronas Tower $1.6 Billion
(World’s Tallest Building 1,483 feet high)
URSA TLP $950 Million(3,900 feet Water Depth)
3,000 passenger cruise ship
$300 Million
Baseball Stadium or Alex Rodriguez Salary for 10 years
$250 Million
Boeing 747$200 Million Morpeth mini-
TLP$159 million
(1,690 feet Water Depth)
Oil Tanker$40 Million
Shallow Water minimal Offshore
Platform $1,000,000
Neptune Spar$130 million
(1,930 feet Water Depth)
Baldpate Compliant Tower
$215 million(1,650 feet Water
Depth)
Figure 10. Cost of Offshore Platforms Compared to Other Structures and Contracts.

13
2.1. URSA PROJECT
2.1.1. Shell Supplied Data on Ursa - Fabrication Shell has a corporate view that they do not supply detailed information as to the cost breakdown of
their projects. They have a web site for the Ursa project that sets out the basic information they are prepared to share with the public. This gave the overall cost of the project (at $1.45 billion) and described a split of approximately 65 percent to facilities ($950 million), and 35 percent to development drilling and completion5 ($500 million). Figure 11 gives a diagrammatic estimate of the distribution of costs over the phases of the Ursa project. This diagram is based on corporate experience with similar projects, and has not been supplied by Shell, but the general distribution is likely to be reasonable.
23%
13%
11%8%
21%
8%
16%
TLP Hull
Deck Structure
Deck Equipment
Tendons & Piles
Installation &CommissioningPipelines
Design & ProjectManagement
Figure 11. Approximate Distribution of Costs for Ursa TLP (100% is $950 million).
Shell was extremely helpful in supplying other related information and costs for the project, if little
data was supplied for the fabrication and installation. Each of the phases discussed in this section is covered in greater detail in the relevant section of Chronology of Field Development later in this report, but normally without costs.
The Ursa field was first discovered in 1991 by wells drilled by the drillship Discoverer Seven Seas (see Figure 12). This is a dynamically positioned drillship that was built in 1976 in Japan. For many years the Discoverer Seven Seas held the water depth record for drilling in the deepest water, and after an upgrade in 1996, is still operating as a drilling unit. The rig is operated by Transocean based in Houston, although in 1991 the owners were Sonat, also based in Houston6. The whole issue of employment in the offshore industry is complicated by the phases in which a field is developed. As an example, most mobile drilling units employed in drilling exploratory wells are built overseas, but the operating companies, and many of the operating personnel are American. In addition, much of the equipment on an exploratory rig, although installed in a foreign yard, has been exported from the U.S. for that purpose. Hence, the domestic and foreign content of even the initial drilling is complex and difficult to trace.
5 It was almost impossible to get any direct information on the cost of exploratory drilling of the lease. The oil companies do not track this as part of the development cost. One must assume exploratory drilling is an overhead that is given a corporate budget, but not tracked through project development. It is possible to make some estimates of the cost based on the type of mobile drilling unit used, day rates at the time, and estimated consumable costs. 6 This is another example of consolidation within the offshore oil industry. Sonat became Transocean, then acquired some other drilling contractors, changed its name, and then reverted to the name Transocean.

14
Figure 12. Discoverer Seven Seas (Courtesy of Transocean).
Prior to deciding on using a TLP to develop Ursa, Shell assessed a number of other development
options, including a spar, compliant tower, and a conventionally moored semisubmersible option. These studies continued for approximately 9 months and employed approximately 12 technical staff. Based on normal consulting rates, this effort would be worth approximately $2 million although it is likely some additional work was undertaken by independent outside consultants.
Once it was decided to use a full-size TLP for development, engineering design companies were contracted to undertake much of the design. Shell maintained a strong influence over the design, and employed a considerable number of direct personnel in the design effort. However, the detail topside design (deck and processing) was undertaken by an alliance between Waldemar S. Linder and W. H. Nelson (called DCA), and the hull structural details were developed by Han Padron (part of ABB), a company with many years experience with design of TLPs. The DCA had approximately 40 full time employees working on the project based in New Orleans. Han Padron had approximately 15 engineers and 15 drafting personnel based in Houston.
This phase would also have involved model testing. In this a scale model of the chosen structure is built and placed in a wave basin so that its performance in a seastate can be assessed. This work was undertaken at Texas A&M university in College Station, Texas. The cost of the model testing was $155,000, excluding the cost of the model, and employed three engineers and four technicians for 4 weeks. Typically a model will take 6 weeks to produce and will employ one engineer and two fabricators. Undertaking the model testing at a university helps the university support its facilities, and gives students a better understanding of genuine industrial projects. Texas A&M also did the model testing for the Neptune Spar and Morpeth mini-TLP. The costs for these were comparable to those for Ursa, but in each of the other cases, the University built the models.
Project management is an extremely important part of any major project. The oil company needs to ensure that the contractors are doing what they are supposed to, on time, and on budget. Even on a fixed price contract one needs to keep careful monitoring of the budget as if the job goes too far over budget, and the contractor goes bankrupt, there is little recourse for reimbursement. In addition, there will be changes required to the contract, design, detailing, etc. and these need to be monitored. Shell had 40 engineering technical leads in direct project management. These individuals would have each been responsible for a specific area of the platform (e.g., hull, deck structure, drilling equipment, risers, processing, power generation, and operational aspects such as installation, etc). Their job is to ensure that, apart from the schedule and budget issues, there are no incompatibilities at the interface between modules and components, that the design is progressing as expected, and that what is being produced is functionally as expected.
In addition to the direct project managers, there were approximately 130 personnel employed in interface operations. These individuals would be more involved in the details of ensuring the components

15
are fabricated as designed. Independent of these, there would be, for example, a large number of welding inspectors, but it would be the job of the interface personnel to ensure that everything required to be inspected is inspected, that testing is in compliance with the specification, etc. Figure 13 gives the distribution of personnel by both discipline, and their location.
New Orleans3 8%
Houston31%
Amelia LA5%
Italy4 %
Vario us Onsho re and Offsho re
2 2%
Engineering19%
Operations31%
Drafting46%
Miscellaneous4%
New Orleans3 8%
Houston31%
Amelia LA5%
Italy4 %
Vario us Onsho re and Offsho re
2 2%
Engineering19%
Operations31%
Drafting46%
Miscellaneous4%
Figure 13. Ursa Project Management: Distribution of 130 Interface Personnel Between Disciplines and Locations.
The seven personnel based in Amelia, Louisiana, will have been working in McDermott yard on the
deck and process equipment installation. Those in Italy will have been in Belleli shipyard working on the TLP hull. There were 28 personnel who were at various locations, both onshore and offshore. These would, in part, have been attending fabrication shops around the U.S. and the world ensuing that all the individual components that are part of the overall TLP are manufactured to specification, and suitably tested prior to installation. It is the locations of these 28 personnel that give an indication of the distribution of component fabrication, but even their locations would not be sufficient to show the full extent of the distribution of fabrication.
Shell supplied a chart showing where they had expended costs on the Ursa project around the U.S. (see Figure 14). The number given in the state represents the number of vendors from that state supplying the Ursa project. This diagram gives some good information, but unfortunately, it is only part of the picture, and can be somewhat misleading. The difficulty is that the magnitude of the expenditure is not given. The largest single contract on the Ursa project, the hull fabrication, is estimated to be somewhat over $200 million, and was expended in Italy. The next largest was to J. Ray McDermott Inc, the deck fabricator, based in Amelia, Louisiana. This contract would probably have been a little under $150 million, and is one of the 536 costs shown in Figure 14 to have been expended in Louisiana. At the other end of the spectrum, the smallest expenditure of the approximately 1,000 costs covered on the chart was also one of the 536 costs in Louisiana, and was for under $10. There is no indication within the chart as to the weighting of expenditure between the states.
Another problem with the diagram is that it gives only where the costs were paid. This does not necessarily coincide with where the components were fabricated, or where the labor used in the fabrication was situated. As an example, the back-up to the chart gives the tendons as being paid for in Illinois. In fact the tendons were produced in Japan. Similar problems were found when assessing supplied data on the Morpeth project. The only realistic way to circumvent these problems would be to undertake this type of study on a project in progress at the time of the study. This way the real source of expenditure, and labor input to that expenditure, could be determined and documented, as discussed at the end of this section.

16
Figure 14. Number and Location of Vendors on Ursa Project by State (Courtesy of Shell Exploration and Production Co).
McDermott supplied a limited amount of information on the Ursa project, but they did say they
employed an average of approximately 450 personnel on the deck construction in the Amelia yard, near Morgan City, Louisiana. Their maximum number of personnel employed on the project was 700. They also stated that the project came in under budget, and they received some additional monies in the form of bonuses.
Commissioning is a major exercise on any production facility. The normal plan is to commission as much equipment as possible onshore, prior to installation of the facility offshore. This significantly decreases costs, and problems are more easily solved onshore, but it is difficult to do all the commissioning before all the components are together in their final place. Hence offshore commissioning is still a major exercise. Independent of vendor personnel, who look after the equipment that they supply, there were consultants, 2 Shell engineers overseeing the operation, and approximately 40 Shell operations personnel. It is not clear if it was the case with Ursa, but on many platforms, the greatest number of personnel that will ever be onboard a platform is during commissioning, and often additional temporary accommodation is supplied for their housing.
2.1.2. Shell Supplied Data on Ursa - Operations Shell supplied a considerable quantity of data on the operating costs, and personnel levels for Ursa.
When Ursa was originally put on location, only 3 of the planned 24 possible wells had been pre-drilled. The general plan for a deepwater installation is to pre-drill a limited number of wells so that production can be started as soon as possible after installation. This ensures that there is some income from the platform soon after installation. However, it is expensive to pre-drill wells from an exploratory drilling unit, so the number of pre-drilled wells is limited. Once the platform is on location, and the pre-drilled wells are completed for production, the platform will be generating income. It is then that the rest of the wells are drilled. The reason it is cheaper to drill them from the platform rather than a mobile drilling unit is that you are not having to pay the market rate for a deepwater drillship or semi-submersible, in effect a complex support platform for the drilling equipment. The platform is already installed, and a relatively inexpensive drilling rig can be mounted on the TLP to drill the additional wells. Not all platforms are designed to allow a drilling rig (and all its associated equipment) to be installed on board because they are too small. This becomes a trade-off between the capital cost (CAPEX) of installing a bigger platform and the operating cost (OPEX) of paying for a mobile drilling unit to drill and maintain the wells. In the case of Ursa, because of the required size of the platform for the production equipment, and the time expected to drill the wells, it was clear that a platform mounted drilling rig would be the safest and most cost

17
effective way to proceed. It is of note that the drilling rig is not owned by Shell, but leased from Helmerich & Payne, who also supply the drilling crew.
The accommodation unit on Ursa is sized for the number of personnel expected during the simultaneous operations of drilling and production, 156 persons. Drilling and production are 24 hour a day operations and there are two “tours” on the unit at any given time, each working for 12 hours. The crews are paid a monthly wage, but work only half a month offshore, although if working 12 hours per day, for 14 days out of 28, this is equivalent to a “normal” workday length of over 8 hours7. Figure 15 shows the range of basic pay for offshore personnel. It needs to be noted that some of these individuals can get additional income from working overtime, when needed, but others are exempt, and expected to work the hours needed to complete the tasks. The chart covers both the drilling and the production personnel, so not all are employed by Shell.
0
10,000
OIM
Product
ion Forem
an
Rig Man
ager
Toolpu
sher
Marine s
uperv
isor
Driller
ControlRoo
m Ops
Electro
nic Tech
Product
ion oper
ator
Electric
ian
Well Log
ger
Derrick
man
Motorm
anCler
ks
Steward
s
Cooks
Caterin
g perso
nnel
Figure 15. Approximate Monthly Pay for Offshore Personnel (US$ per calendar month). In addition to the full time personnel offshore, there will be other service personnel who come out for
a specific task. As an example, it is common to employ a casing crew whose job is purely to run the well casing (piping installed in the hole to prevent the sides collapsing, and drilling mud leaking out of the hole). They come out to the rig, complete their job, and return to shore. There will also be maintenance personnel, United States Coast Guard (USCG) inspectors, Minerals Management Service (MMS) inspectors, and many individual specialists out for a specific task.
In addition to the salaries of offshore personnel, there are many other expenses that need to be paid to keep the installation running, and the greatest of these when drilling operations are underway are consumables. The mud used in drilling is not just a mixture of clay and water, it is a specialized mix of constituent parts. Even the water has to be taken out to the rig as generally one needs to use fresh, not salt water. Occasionally oil based mud will be used. For this special types of oil are used that have the required properties, but are also nontoxic. Mud is an expensive commodity, and it all has to be transported out to the platform. Indeed, the transportation costs are significant, particularly during drilling. Because of the high usage of consumables, there will normally be approximately one boat a day visiting a platform during drilling, but this will be reduced to one or two a week during normal production operations.
Figure 16 shows the Edison Chouest C-Port in Fourchon, Louisiana. This is an all weather facility for loading the supply boats that keep the offshore platforms operational. Although not a specific part of
7 Assume working 14 days on the rig, and 14 days at home. Time worked in a month is 14 days x 12 hours = 168 hours per 28 days. But a normal 28-day period has 20 working days, so equivalent workday length = 168/20 = 8.4 hours per day.

18
this study, it is of note that Edison Chouest Offshore operates over 100 boats in the Gulf of Mexico, and the vast majority of these will have been fabricated in their own yard. They have two yards, one called North American Shipbuilding which employs over 500 shipyard workers in Larose, Louisiana, and the other called North American Fabricator yard in Houma, Louisiana, that employs 300 shipyard workers.
Figure 16. C-Port Supply Boat Base in Fourchon, LA (Courtesy of Edison Chouest Offshore).
Edison Chouest, with its head office in Galliano, Louisiana, has over 3,000 employees worldwide
with the majority domestic, and 200-300 overseas. A significant number of their employees are foreign nationals on H2B visas, and they have difficulty getting local labor because of the low unemployment levels in southern Louisiana (we were informed that it was less than 3%). The recently completed Laney Chouest, the largest anchor handling towing supply (AHTS) vessel in the world, “... represents tens of thousands of man-hours...” involved in the design and fabrication in Louisiana. At the present time,8 the yard is producing one 280 feet long offshore supply vessel (OSV) every four months.
Another significant expense is helicopter transportation, costing nearly $500,000 per year. For some of the near shore platforms it is reasonable to use crew boats to change out personnel, but at the greater distance to deepwater installations, the extra time makes it impractical.
Figure 17 shows the operating costs for the Ursa platform, both for drilling and production. The production costs are given at the top of the diagram above the line, and drilling is below the line. It can be seen that the drilling costs far outweigh the production costs. This is not just because of the increased consumable costs, but the contractor fees are significant, and these include all the direct drilling contractor labor costs. Figure 18 shows similar data to that in Figure 17, except that it is shown by the same categories in both drilling and production.
It can be seen that out of the total cost per day, the drilling consumables and rental costs account for nearly all of those expenses. The labor input to consumables is not known, but the drilling rental costs do not just support the cost of new construction for the drilling equipment (a platform rig will have a useful life of around 20 years) but also supports the office staff in the head office and the field office close to the shore base.
8 Summer 2003

19
$0
$20,000
$40,000
$60,000
$80,000
$100,000
$120,000
$140,000
$160,000
$180,000
$200,000
Production Costs per Day
Drilling Costs per Day
Tota
l Cos
ts p
er D
ay
Drilling and Operating Costs of URSA Tension Leg Platform
Supply BaseOil Co. PersonnelOther ConsumablesCrew TransportationFood & HotelSupply BoatsEquipment RentalContractor FeesDrilling Comsumables
Equipment RentalCrew TransportationFood & HotelSupply BoatsContractorMaintenanceProduction ConsumablesPersonnel
Drilling Costs per Day
Production Costs per Day
$0
$50,000
$100,000
$150,000
$200,000
Spares and Maintenance
Food & Hotel
Transportation
Personnel
Rental and Fees
Consumables
Total cost of drilling and
Production per Day
Drilling Cost per Day Production Cost per Day$0
$50,000
$100,000
$150,000
$200,000
$0
$50,000
$100,000
$150,000
$200,000
Spares and Maintenance
Food & Hotel
Transportation
Personnel
Rental and Fees
Consumables
Total cost of drilling and
Production per Day
Drilling Cost per Day Production Cost per Day
Figure 17. Drilling and Production Operating Costs of Ursa TLP.
Figure 18. Ursa Production and Drilling Costs Per Day.

20
2.2. BALDPATE A limited amount of information was gathered on the Baldpate development. There was an OTC
session on Baldpate, and a certain amount of costing information was presented, but Amerada Hess was reticent in giving additional cost information. Table 3 gives the basic costing information contained in the OTC paper on Baldpate, paper 10914 in 1999.
Table 3
Overall Costs of Baldpate (extracted from OTC paper 10914)
Capital Expenditure Cost ($ Millions) Tower $137.6 Facilities $64.0 Pipelines $13.4 Subtotal Construction $215.0 Development Drilling/Completion $116.9 Total Project Capital Expenditure $331.9
Some points that were given are that they spent between $2 and $3 million on assessing other possible
development options. This is comparable to the amount spent by Shell on Ursa, although in the case of Amerada Hess, most of the work was undertaken by independent consultants.
Another point of interest is while no specific data were available on the cost of predevelopment seismic, interpretation, and exploration drilling, it was estimated they were between $100 and $200 million.
One area in which good data on the Baldpate project was available was from Paragon who did the topside engineering, equipment procurement, design, inspection, and much of the project management (see Figure 19).
5% 4%
3%
27%
32%
24%
5%
Project Management
Procurement
Secretarial/Clerical
Engineering
Drafting
Construction Management& InspectionExpenses
Total 50 people (but not all full time) for
28 Monthscost
$5,700,000
5% 4%
3%
27%
32%
24%
5%
Project Management
Procurement
Secretarial/Clerical
Engineering
Drafting
Construction Management& InspectionExpenses
Total 50 people (but not all full time) for
28 Monthscost
$5,700,000
Figure 19. Baldpate Compliant Tower: Topside Engineering, Procurement, Inspection, Project/Construction Management.

21
2.3. POMPANO Almost no information was available about Pompano, a jacket based structure installed in 1,294 feet
water depth in 1994. The jacket and deck were both built by J. Ray McDermott on a lump sum cost basis, who also did the procurement, front end engineering design (FEED), detailed design, and marine installation. The deck was constructed in Amelia, Louisiana (near Morgan City), and towed out directly from there to site for installation. The jacket was assembled in Harbor Island facility near Aransas Pass, Texas. Some of the components for the jacket were fabricated in Amelia and then transported by barge to Harbor Island. The total weight of the jacket was 34,000 tons, and the deck weight was 4,600 tons9.
J. Ray McDermott was cooperative in supplying photographs of the various installations with which they were involved, but did not supply significant additional information. Contacts were made within the organization, and there was a general willingness to cooperate, but there never appeared to be sufficient time to gather and supply the needed data. Some information was supplied on the overall project costs as charged by McDermott, but there was no breakdown of labor costs. It is interesting to note one individual at McDermott stated he had gathered some of the labor statistical data together in the past for MMS, but could not supply it now.
Very little information is known about the cost breakdown on Pompano, but there can be some very general estimations made concerning the labor costs and expenditures. A fabricated steel jacket costs approximately $2,000 per ton. The original plate steel will cost about $500 per ton. The two major stages the steel has to go through include rolling and seam welding it into pipe, then cutting and assembling the pipe into the jacket. The cost of the rolled and welded pipe increases the value of the plate steel from about $500 to $700 per ton. McDermott will roll most of their own pipe (it is assumed that this will have been carried out in Amelia, Louisiana) and then transport it to Harbor Island. There are some other incidental costs involved in jacket construction (welding rods, oxygen/acetylene, anodes, coatings/paint of the “splash zone”) but the vast majority of the added value is from the input of labor. McDermott gave the cost of jacket fabrication as $66 million, which is very close to the estimated $2,000 per ton. Given a jacket of 34,000 tons, the cost will be comprised of $17 million for the steel, $7 million is the cost of rolling and welding it into pipe, and around $42 million will be for fabrication labor.
The deck cost was given as $35 million, but that will have included a significant quantity of third party equipment that will have been installed by McDermott in their Amelia yard. Although it did not affect the cost to BP, the deck fabrication costs went slightly over budget, but the jacket was on budget.
Personnel were found within BP who knew about the project, but either they did not have the time, or the authority to release information on the project. The only information available was obtained from a very limited number of published data sources. Part of the reason was that the project had long been completed at this project start up, so most of the relevant information had been previously filed. It is of note this is the project that probably had the least foreign content. The jacket was fabricated in south Texas, and the deck in Louisiana. While much of the steel may have come from foreign sources, all the fabrication was in the U.S., and probably most of the equipment was of U.S. origin.
2.4. NEPTUNE SPAR The Neptune spar was originally fabricated for Oryx as the operator, but since installation, Oryx has
become part of Kerr-McGee. It was the world’s first spar to be used as the base for well production operations, and is located in Viosca Knoll Block 826 in a water depth of 1,930 feet. Prior to committing to a spar, Oryx considered a number of other development options, including a TLP, a compliant tower, a floating production system, and a floating production, storage, and offloading (FPSO) system. The main reasons for choosing a spar were that it would be equipped with dry surface trees that would allow easy access to work on the wells, and remove any build up of paraffin. Another consideration was that it would be possible to move the spar a limited distance should it prove necessary to access some different reservoirs that could not be reached by directional drilling.
At the time it was decided to develop the field with a spar, there was a patent held by Deep Oil Technology, Inc. (DOT) on spars, and DOT had formed a consortium for the use of spars to develop
9 The weight supplied by McDermott is 5,200 short tons (each 2,000 lbs), equivalent to 4,600 long tons (each 2,240 lbs) for the deck, and 38,000 short tons for the jacket.

22
fields. Consortium members included DOT, J. Ray McDermott for topside fabrication, and overall installation, and Aker Rauma Offshore for design and fabrication of the hull and mooring system.
The spar has a diameter of 72 feet and a length of 705 feet. The weight of the hull was 12,900 tons, and the topside weight grew from an original design of 1,200 to 1,600 tons.
Table 4 gives a high level cost breakdown for the major components of the Neptune spar, as extracted from the OTC paper 8381, given in 1997.
Table 4
High-Level Cost Breakdown for Neptune Spar
Item Cost $ Million
Spar Hull and Mooring $53
Topside and Installation $47
Production Risers $14
Drilling and Completion $42
Engineering, Project Management, Permitting, & Misc. $16
Total $172 Million The hull was fabricated in Pori, Finland, at Aker Rauma yard. Aker was approached to supply
additional information contained in the OTC papers, but was somewhat reluctant. They did, however, state that most of the steel within the hull would have been Finnish, with the iron ore probably coming from Sweden, and coal for processing coming from Poland. The price given for rolled steel was $750 per ton, but this would be increased considerably by the time it is fabricated into the hull. The main US input on the hull was from certain import duties, and for the mating of the two sections at Ingalls Shipyard in Pascagoula, Mississippi.
The hull was fabricated in 17 sections under cover, and then the sections were welded together to form two cylinders, one 390 feet long and the other 315 feet. The two sections were then put onto a dry transport semisubmersible ship and transported across the Atlantic to Pascagoula where they were discharged. The two sections were then floated into alignment, and welded together. Figure 20 shows a photograph of the Neptune spar after the two parts have been mated at Ingalls, and just as the tow is started out to the location. Once on location, it was upended, and the deck placed on top.
Figure 20. Neptune Spar After Mating and Under Tow to Location. The Neptune topsides were fabricated by J. Ray McDermott in Amelia, Louisiana. The value of the
fabrication contract was $28 million, which included equipment design and procurement. The contract

23
was lump sum, and went slightly over budget. The duration of the contract was approximately one year from September 1996 to September 1997 during which time McDermott used a total of 337,000 man-hours.
The mooring system for Neptune had two main suppliers: Vicinay for the chain, and Williamsport Wire Rope for the wire. Vicinay manufactured the chain in Bilbao, Spain. Their facility employs 237 people of which approximately 100 skilled workers would have worked on producing the chain for 2½ months. The facility can run two or three projects at any given time, and they have four machines for producing chain of less than 3-inch diameter, and four for producing chain of over 3 inches. The Neptune chain is 4.75-inch. (The diameter of a chain is the basic diameter of the steel bar stock from which it is made. A single link of 4.75” chain will be just under 30 inches long, 16 inches wide, and will weigh approximately 400 pounds.) The total cost for the chain was $3.5 million at a price of $1.85 per Kg.
The wire rope was manufactured in Williamsport, Pennsylvania, and was sheathed by Wellstream in Panama City, Florida. The total cost of the wire rope, including sheathing, was $2 million.
2.5. “SIR DOUGLAS MORPETH” DEVELOPMENT
2.5.1. Overview of Project The “Sir Douglas Morpeth” (Morpeth) development is operated by British Borneo (since taken over
by Agip) in Blocks 921, 964, and 965 of Ewing Banks area. The water depth at the location is 1,690 feet, and the installation of the Atlantia designed SeaStar mini-TLP was completed in the latter half of 1998. British Borneo acquired the field from Shell Offshore Inc. in 1995 and had a 100% working interest in the field. Shell maintains a financial interest.
The development of Morpeth followed a somewhat unusual course: normally a field is chosen for development, and then a development option is chosen to suit that field. The reverse was the case for Morpeth10.
British Borneo started developing shallow water interests in the Gulf of Mexico in 1989. They quickly formed an informal partnership with Atlantia Offshore Ltd. who supplied them with a number of minimal shallow water platforms on a turnkey basis. These tended to be low value contracts, mostly under $1 million, but they led to a confidence between the parties. Figure 21 shows a Sea Pony, similar to the small platforms installed by Atlantia for British Borneo11. When in 1993 British Borneo decided to speed up their move into international oil and gas exploration, they decided to build on this relationship.
At the time, Atlantia was developing the SeaStar concept (see Figure 22), a mini-TLP that was to be ideally suited to marginal field development in deepwater. Through their previous working arrangements British Borneo saw the potential for a mini-TLP within their own deepwater plans, so entered a strategic alliance with Atlantia to gain early access to a SeaStar. In effect, British Borneo selected a development concept in parallel with the search for a field to develop.
The SeaStar mini-TLP has a single central column that supports the deck above the water. At the bottom of the column there are three pontoons that radiate out from the column. At the outer end of these pontoons there are two tendons that are attached to piles in the seabed directly below them. The pontoons give spread between the tendons, thereby ensuring the platform’s stability.
The choice of the Morpeth field was in part driven by what was suitable for development by a mini-TLP. The requirements were that the field could be developed with subsea trees12. This meant there had to be low workover/intervention requirements, a field that could be developed with a small number of wells, and wells that had good flow assurance. Figure 23 shows the overall layout of the Morpeth field,
10 Much of what follows by way of background comes from the Offshore Technology Conference paper 10854, 1999, “Morpeth Field Development Overview.” 11 Atlantia has recently been acquired by IHC and has sold off the shallow water platform business to Seahorse Platform Partners Ltd. 12 Since the installation of Morpeth and Allegheny, Atlantia have developed a version of the SeaStar that can have dry trees up on the deck. This option was not available at the time.

24
Figure 21. Sea Pony Shallow Water Platform (Courtesy of Seahorse Platform Partners Ltd.).
Figure 22. Sir Douglas Morpeth Mini-TLP Installed (Courtesy of Atlantia Offshore Ltd.).

25
Figure 23. Morpeth Field Layout Showing Subsea Wellheads and Pipeline to Shallow Water Facility (Courtesy of Atlantia Offshore Ltd.).
with the subsea wellheads on the left side of the picture, with risers coming up to the platform, and export risers/pipelines going off to the shallow water facility 19 miles away in 366 feet water on the right of the diagram.
The project to install a platform at Morpeth was carried out under two main contracts: Atlantia to supply the mini-TLP, and J. Ray McDermott to install it13. The setup of the supply contract was somewhat unusual in that it was on a cost plus basis, with Atlantia being the main contractor. In effect, British Borneo gave Atlantia the responsibility of supplying a suitable structure on budget, and on time. It would not have been possible for Atlantia to undertake the project on a lump-sum basis the way they had done for the shallow water developments. Given the size of their organization (roughly 200 employees) they would not have been in a position to offer a turnkey contract on a platform costing nearly $100 million. None of their subcontractors would have had sufficient confidence in being paid unless British Borneo guaranteed payment. In addition, the design had not been completed by the time the contract was awarded.
The hull was built by Gulf Island Fabrication Inc. in Houma, Louisiana. They also built the deck structure, and assembled the various components supplied by other vendors. This was one of the largest contracts on the project. Gulf Island is an experienced yard that has been building jackets and decks for many years. They have tried, and are generally successful at keeping a stable workforce, and to this end train a large percentage of their own labor. This is supplemented, by additional labor taken on an as needed basis.
2.5.2. Information Gathered Information has been supplied to the study team by British Borneo, Atlantia, Gulf Island, and a
number of other contractors and subcontractors. Of assistance was a list of vendors supplied by Atlantia, although this contained only an indication as to the level of costs, not the actual costs themselves. It is through this list that most of the information has been obtained, however, the problem of where the various materials have come from, as discussed in the “Summary and Status”, has not been overcome. Probably even more than the Ursa TLP, most of the direct labor and suppliers have been from around the Gulf Coast. Also as discussed in the Summary, it is likely that much of the equipment has origins outside the Gulf Coast area, but so far it has been outside the scope to follow that course. In addition, it is too late to get those sorts of details from the vendors: they will have changed their suppliers over the years, and will probably not remember whom they used.
13 There were other contracts for the drilling, subsea systems, risers, pipelines, etc.

26
The project costs are given in an OTC paper from the special Morpeth session, OTC 10854. These are shown in Table 5. In addition to these costs was the cost of drilling the exploratory and development wells which were a total of $152 million. Figure 24 gives a high-level breakdown of the costs. The left side of the chart shows the total costs comprising the physical installation of the TLP at the top, and the drilling at the bottom. The costs for the TLP are graphically broken down to their major constituent parts. The drilling costs are broken into the three major costs, and an indication as to what is involved in each of those.
Table 5
Breakdown of Principal Costs for Morpeth (from OTC paper 10854)
Equipment/ Service Cost ($MM)
TLP Foundation $2.91 Tendon System $15.10 Hull $24.16 Deck $6.98 Production Facilities $24.59 Facilities Hook up $12.08 Installation $13.38 Subtotal $99.20
Subsea Trees $12.90 Controls $3.49 Flowlines $8.00 Installation $3.15 Subtotal $27.54
Pipelines Materials $8.18 Installation $12.41 Subtotal $20.59
3rd Party Costs Subtotal $11.67 Project Total $159.00
Figure 25 gives a sample breakdown of the costs for constructing the physical TLP without any of the
other associated facilities (e.g., pipelines, subsea equipment, etc.). It also shows the locations of some of the vendors that supplied goods or services to the facility. In some cases additional information is known about these vendors, and they are discussed in further detail later in this section, but in most cases, all that is known is what was supplied, and the location of the vendor.
British Borneo supplied some useful information about the project background, and some of the other costs, although, because of the way it was contracted to Atlantia, there were relatively few additional costs. It is interesting to compare the project management team size for the Morpeth development with that for Ursa. British Borneo had a maximum of 11 personnel on the team compared to 130 from Shell on Ursa, although this is not an entirely fair comparison as the Shell number includes more on-site personnel who would have been supplied by Atlantia in the case of Morpeth. The British Borneo project management budget was $750,000.
The operational aspects of Morpeth bear some comparison to those of Ursa. Morpeth, being a relatively small facility with limited production capacity of 35,000 barrels of oil per day (BOPD) and 38 million standard cubic feet of gas per day (MMSCFD), has living quarters for 18, with a normal crew size of 13. There are no facilities for drilling on Morpeth. Ursa, with production capacity of 150,000 BOPD and gas of 400 MMSCFD, has accommodation for 156 persons, and is normally full during drilling operations.

27
Tension Leg Plat form$99,200,000
SubSea$27,540,000
Pipeline$20,590,000
Oil Co and 3rd Party$11,600,000
Tota
l Pro
ject
Cos
t $31
1,00
0,00
0(Ex
clud
ing
cost
of l
ease
, ini
tial s
urve
ys, s
eism
ic, e
xplo
rato
ry d
rillin
g, e
tc.)
Tota
l TLP
, Ins
talla
tion,
Pip
elin
es,S
ubse
a, e
tc $
159,
000,
000
(51%
)D
evel
opm
ent D
rilli
ng &
Com
plet
ion
$152
,000
,000
(49%
)
Cost of Semi-Submersible“Ocean Endeavor”
approx. $80,000/day
Cost of Drilling Consumablesapprox. $100,000/day
Cost of Transportation Services
(Boats & Helicopters)approx. $20,000/day
~75 Man CrewDebt for Fabrication/Modifications
of Semi-SubmersibleMaintenanceInsuranceSpare partsSupport of Shore BaseSupport of Head Office in Houston
Drilling MudBulk BariteSacked Mud AdditivesCementDrilling WaterDrilling BitsDown-Hole ToolsWell Casing PipeProduction TubingDieselWell Logging
Development Drilling and Completion49% of Total Cost
Total TLP, Installation, Pipelines, Subsea, etc51% of Total Cost
Helicopter FlightsSupply BoatsCrew Boats
Tension Leg Plat form$99,200,000
SubSea$27,540,000
Pipeline$20,590,000
Oil Co and 3rd Party$11,600,000
Tota
l Pro
ject
Cos
t $31
1,00
0,00
0(Ex
clud
ing
cost
of l
ease
, ini
tial s
urve
ys, s
eism
ic, e
xplo
rato
ry d
rillin
g, e
tc.)
Tota
l TLP
, Ins
talla
tion,
Pip
elin
es,S
ubse
a, e
tc $
159,
000,
000
(51%
)To
tal T
LP, I
nsta
llatio
n, P
ipel
ines
,Sub
sea,
etc
$15
9,00
0,00
0 (5
1%)
Dev
elop
men
t Dri
lling
& C
ompl
etio
n $1
52,0
00,0
00 (4
9%)
Cost of Semi-Submersible“Ocean Endeavor”
approx. $80,000/day
Cost of Semi-Submersible“Ocean Endeavor”
approx. $80,000/day
Cost of Drilling Consumablesapprox. $100,000/day
Cost of Drilling Consumablesapprox. $100,000/day
Cost of Transportation Services
(Boats & Helicopters)approx. $20,000/day
Cost of Transportation Services
(Boats & Helicopters)approx. $20,000/day
~75 Man CrewDebt for Fabrication/Modifications
of Semi-SubmersibleMaintenanceInsuranceSpare partsSupport of Shore BaseSupport of Head Office in Houston
Drilling MudBulk BariteSacked Mud AdditivesCementDrilling WaterDrilling BitsDown-Hole ToolsWell Casing PipeProduction TubingDieselWell Logging
Development Drilling and Completion49% of Total Cost
Total TLP, Installation, Pipelines, Subsea, etc51% of Total Cost
Helicopter FlightsSupply BoatsCrew Boats
Figure 24. Sir Douglas Morpeth Mini-TLP: Cost Breakdown.
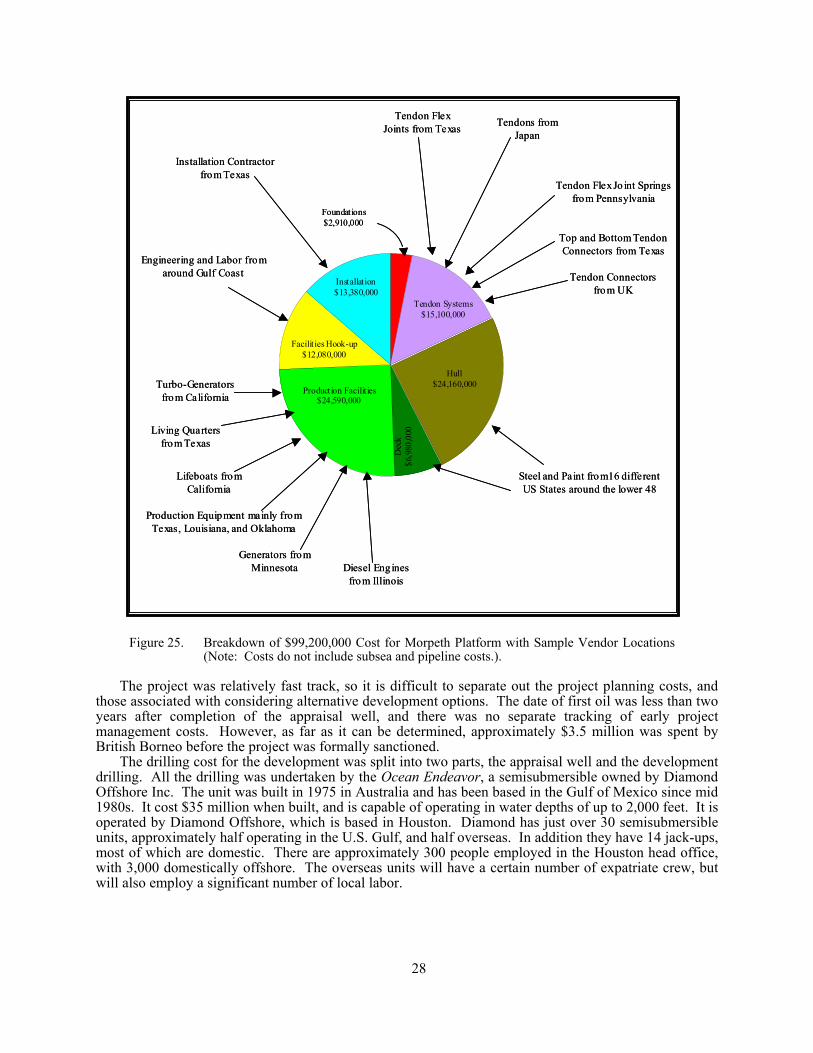
28
Facilities Hook-up$12,080,000
Production Facilities$24,590,000
Hull$24,160,000
Tendon Systems$15,100,000
Installation$13,380,000
Dec
k$6
,980
,000
Foundations$2,910,000
Generators from Minnesota
Tendons from Japan
Top and Bottom Tendon Connectors from Texas
Tendon Connectors from UK
Steel and Paint from16 different US States around the lower 48
Turbo-Generators from California
Lifeboats from California
Diesel Engines from Illinois
Living Quarters from Texas
Production Equipment mainly from Texas, Louisiana, and Oklahoma
Engineering and Labor from around Gulf Coast
Installation Contractor from Texas
Tendon Flex Jo int Springs from Pennsylvania
Tendon Flex Joints from Texas
Figure 25. Breakdown of $99,200,000 Cost for Morpeth Platform with Sample Vendor Locations (Note: Costs do not include subsea and pipeline costs.).
The project was relatively fast track, so it is difficult to separate out the project planning costs, and
those associated with considering alternative development options. The date of first oil was less than two years after completion of the appraisal well, and there was no separate tracking of early project management costs. However, as far as it can be determined, approximately $3.5 million was spent by British Borneo before the project was formally sanctioned.
The drilling cost for the development was split into two parts, the appraisal well and the development drilling. All the drilling was undertaken by the Ocean Endeavor, a semisubmersible owned by Diamond Offshore Inc. The unit was built in 1975 in Australia and has been based in the Gulf of Mexico since mid 1980s. It cost $35 million when built, and is capable of operating in water depths of up to 2,000 feet. It is operated by Diamond Offshore, which is based in Houston. Diamond has just over 30 semisubmersible units, approximately half operating in the U.S. Gulf, and half overseas. In addition they have 14 jack-ups, most of which are domestic. There are approximately 300 people employed in the Houston head office, with 3,000 domestically offshore. The overseas units will have a certain number of expatriate crew, but will also employ a significant number of local labor.

29
The day rate for the Ocean Endeavor ranged from $37,000 to $82,000 per day. Note that was a relatively low rate for a semisubmersible, but this is in part because of the age of the unit14, and the relatively shallow water depth limit. Some of the constituent parts of the cost of drilling the wells is given in Figure 24, but it is of note the main costs associated with the rig day rate are normally debt repayment and labor. In the case of the Ocean Endeavor it is unlikely there is still any debt outstanding, but the maintenance costs may be increased, however, a large percentage of the day rate will be direct labor costs.
The appraisal well was flow tested to ensure the expected flow from the well, and this produced around $50,000 revenue, but this is insignificant by comparison to the cost of flow testing. It is the results of the flow testing that are important rather than the revenue generated.
It is interesting British Borneo estimates the cost of abandoning the structure and wells would be approximately $13.5 million. There is certainly a possibility the unit could be reused at another location, and the assumption is that the main components which would require replacement would be the tendons and piles.
2.5.3. Gulf Island Fabrication Inc. Data Gulf Island Fabrication Inc., the company that fabricated the hull and assembled the deck, was
extremely cooperative. They supplied the information that was the basis for the economic analysis undertaken by Joachim Singelmann (see next section of report). They also supplied information on the cost and source of their supplies to build the hull and deck structure. It needs to be borne in mind that the vast majority of the Gulf Island work involved steel construction and painting. Hence their main supplies would be steel, paint, and anodes. While the majority of those subcontracts are provided by companies located in Louisiana, there is no way of ascertaining the extent to which goods and services where produced at the site of those companies. It appears that for a substantial proportion of those subcontracts, funding was merely passed though that location for actual work performed elsewhere. It is clear, since there are no significant steel mills in Louisiana, most of the steel purchased in Louisiana must have been bought from suppliers who had imported it from either other states or other countries.
Keeping in mind the recorded expenditures may not represent any significant associated labor, simply a throughput of cash, most of the outside costs originated in two states, Texas and Louisiana. Together they account for 85 percent of all outside costs. This can clearly be seen by reference to Figure 26, which shows the expenditure by state. All other states are in the single digits, with Mississippi companies coming in as distant third, receiving 4.1 percent of all outside contracts. The information is shown by state on the U.S. map in Figure 27.
14 It is normal to design a mobile offshore drilling unit to have a 25-year life. That does not mean they cannot successfully operate for longer, but maintenance will increasingly become a problem. On some units, technical obsolescence can also be important: the equipment is too old, and parts are not available to repair it.

30
Ala
bam
a
Ark
ansa
s
Geo
rgia
Illin
ois
Loui
sian
a
Mas
sach
uset
ts
Mis
siss
ippi
Nor
th C
arol
ina
New
Jer
sey
Ohi
o
Okl
ahom
a
Pen
nsyl
vani
a
Texa
s
Uta
h
Virg
inia
Wes
t Virg
inia
0
500
1000
1500
2000
2500
3000Th
ousa
nds
Materials and Outside Service Costs
Figure 26. Outside Expenditure by Gulf Island by State.


33
Figure 27c. Morpeth Mini-TLP Income for Primary Vendors by State.
Morpeth Mini TLP Income for
Primary Vendors by State
LA. $70.23 MM
FL.$8 MM
OK.$0.2MM
CA.$3.6 MM
TX. $67.9 MM
UK/Japan$9.35 MM
34
2.5.4. Atlantia Supplied Information Atlantia supplied a list of the main contractors and suppliers for the Morpeth TLP. Unfortunately not
all the contact information was supplied, and some companies could not be contacted. In addition, there was no great rush to assistance from most of the companies approached. This was mainly due to a lack of time, but also there was no perceived benefit, and no desire to commit the needed time. Notwithstanding the difficulty in getting information, some companies were extremely cooperative. The following is not presented in any particular order, but gives an idea of the level of effort expended in supplying certain services or equipment.
2.5.4.1. Atlantia Atlantia had some initial funding of $50,000 from the Small Business Administration (SBA) to help
them undertake a scoping study on the SeaStar design of mini TLP. They later got an additional $500,000 grant to refine the design, and estimate they put in an additional $500,000 of their own money to help develop the design. All these costs were at a low hourly rate of $50 per hour, so the estimated level of effort to get a saleable design onto the market was $1 million representing 20,000 man-hours of engineering and drafting. When the contract was signed with British Borneo, Atlantia received the Tibbetts Award from the SBA.
When Atlantia started they had 25 persons committed to the project. This later increased to around 100 people by the end (and the subsequent start of Allegheny, another British Borneo mini TLP from Atlantia). The project management team started out as a single person, but grew to include a cost control staff of 2 to 3 full-time equivalent employees over a two-year period. In addition, there were 4 people in the contact & procurement department, 8-10 onsite inspectors, and 1 site construction manager/engineer based in Gulf Island’s yard. It is an interesting comparison, but for a simple shallow water minimal platform, Atlantia would have had but one site inspection person.
2.5.4.2. Alan C. McClure and Assoc. Inc. Alan C. McClure and Associates Inc. supplied shipyard drawings, and to a lesser extent, detail
engineering on the project. McClure is a Houston based consultancy, and the value of their contract on Morpeth was $1.8 million over 14 months. There were up to 14 people working on the project, including a full-time project manager, with about 85% drafting and 15% engineering.
2.5.4.3. Survival Systems Int. Survival Systems supplied the lifeboats used on both Morpeth and Ursa15, and is based in Valley
Center, California (zip code 92082) near Escondido. Morpeth has two 21-man boats, and Ursa has six 58- man boats. All the boats are built at the Valley Center facility where there is a 100,000 square feet factory employing 60 full-time employees. In addition, the company employs 25 people in New Orleans to do installation and maintenance on their boats. On average they produce three boats per month. Their supplies include the engines, glass fiber, etc., but most of the costs are down to labor. The Morpeth boats would have cost about $100,000 each, and the Ursa ones around $150,000 each.
2.5.4.4. Solar Turbines The power generating system on Morpeth was supplied by solar turbines, based in San Diego,
California. Not much information could be obtained, but the contract amount for Morpeth was approximately $3 million. Solar employs approximately 3,000 people at two separate facilities in California. Solar also supplied the turbines for Ursa.
2.5.4.5. Offshore Technology Research Center at Texas A&M The Morpeth model testing was carried out in the model basin at Texas A&M, College Station (see
discussion of model testing in section on Ursa, and in Field Development Chronology). The cost of the
15 The lifeboats are sometimes referred to as Totally Enclosed Motor Propelled Survival Craft (TEMPSC).

35
tests was $230,000, including the cost of building the model. It took six weeks to build the model, and an additional 4 weeks to test it, employing two engineers and four technicians.
2.5.4.6. ABB Vetco ABB Vetco designed and fabricated the tendon connectors. The value of the contract was not
disclosed or known, but they said that up to 110 people would have been involved with the project. Steel supplies come from both domestic and foreign sources. Approximately 75 percent of the work would have been shop workers, and 25 percent office based. All work was in Houston.
2.5.4.7. Smithco Smithco supplied the air coolers within the gas compression plant. The company is based in Tulsa,
Oklahoma, where the work would have been carried out. The value of their contract was approximately $200,000, relatively low by comparison to their normal contract size of $500,000. The company has an annual revenue of $12 million and employs 200 people at two facilities (130 at one, 70 at the other). Under 40 percent of their work is for offshore applications, most of it being for onshore refineries. The shop personnel are paid between $8 and $15 per hour. They employ 8 degreed engineers, another 45 office personnel, and 145 shop staff. It takes around 5 weeks to produce a small unit, and 25 weeks to produce a large one.
2.5.4.8. American Bureau of Shipping The American Bureau of Shipping (ABS) classed the TLP and acted as the Certified Verification
Agent (CVA). The total cost of the work was $700,000 and involved approximately 7,000 man hours of engineering and survey effort. The split of work was one surveyor employed part-time in the fabrication yard (in Houma, Louisiana) over the duration of the project for a total of 700 hours, plus another 300 offshore for installation. There were 4,000 of office based engineering time employing up to 60 engineers in Houston, Texas. In addition to the standard engineering effort, there were another 1,000 hours spent on review of vendor equipment that is subject to class review. This includes items associated with power generation, fire fighting, safety equipment, electrical, emergency systems, etc. There were also surveys at the vendors’ facilities that accounted for an additional 1,000 hours. These extra hours would have involved a large number of individuals for relatively short durations as the equipment and steel would have come from many different sources.
This breakdown of cost is comparable to the other projects on which ABS was involved. (Neptune spar was classed, and ABS was the CVA on Ursa. The costs for Neptune will have been slightly higher than for Morpeth. Those for Ursa somewhat lower.)
2.5.4.9. Global Maritime Global Maritime had two separate functions on the Morpeth project: the first was as TLP consultants
directly to British Borneo and the other as the marine warranty surveyor (MWS) for towage and installation. Their total fees were $400,000 of which $200,000 were for high level engineering consultancy involving a very limited number of personnel. The MWS work would have involved a mix of engineers and master mariners to ensure that good marine practices were adhered to during the transportation and installation. Although much of the work was in Louisiana, all the staff would have been based in Houston.
2.5.4.10. Wellstream Wellstream, which is based in Panama City, Florida, supplied the flexible flowlines. Little additional
information is known except that the cost of the flowlines was $8 million.
2.5.5. Morpeth Conclusions Gathering information from the vendors to the project was extremely difficult and time consuming. It
was not only difficult to determine the correct person to talk to, even if you knew which company and telephone number to call, but getting anyone to give the type of data needed was difficult. It was

36
certainly impossible to get consistently good data that could be used for comparison even within a project. To get data that could be compared between projects was almost impossible. Many companies apart from those listed above were contacted, but in most cases it was not possible to get through to the relevant person, and rarely were calls returned. Indeed, it tended to be the smaller companies that were most cooperative, however these were the ones with the smallest expenditure, and hence the least impact on labor markets.
3. ECONOMIC ANALYSIS ABS Consulting contracted Dr. Joachim Singelmann of Louisiana State University Department of
Sociology to assist with the economic analysis of the data gathered from the various sources. As discussed in the introduction, the quantity and quality of the gathered data was limited, so meaningful comparison between the projects was not possible. The only data that was supplied in sufficient detail, and involving enough personnel, was that supplied by Gulf Island Fabrication, Inc. in Houma, Louisiana. Gulf Island built the hull of the Sir Douglas Morpeth mini-TLP for British Borneo, although their actual contract was with Atlantia. They also fabricated the structure of the deck, and assembled the components onto it.
Other labor data was supplied (e.g., Shell supplied a significant quantity of data on the operational aspects of Ursa, as discussed previously) but the number of persons employed on any specific aspect was insufficient to have a meaningful impact on the local labor market. This may be an inherent problem with the type of analysis that was intended for this project: the effect on labor markets outside the Gulf Coast may not individually be large enough to quantify. The majority of the U.S. fabrication will inherently be close to the coast (for transportation reasons) so it is only as one considers the smaller component parts that there is an increasing involvement from areas away from the Gulf. However, these components will be spread increasingly thinly as one looks at increasingly small components. There are some possible exceptions if some specific component happens to be manufactured in a small community that has a single industry, but generally, the components for an offshore platform are associated with relatively heavy industry.
This following discussion provides information about the labor demand generated by the fabrication of the Morpeth platform. We will first describe the amount of labor and occupations that went into the fabrication of Morpeth. We then show how this labor demand relates to the labor supply in the labor market area around Houma in which the company is located. Finally, we show what other costs were incurred by the Morpeth project, and in which states those costs occurred.
3.1. AMOUNT OF LABOR AND ITS OCCUPATIONAL COMPOSITION OF THE MORPETH PROJECT
Most of the onsite fabrication for the Morpeth project in the Houma area was carried out during April 1997-August 1998. The project required a total of 423,874 nonmanagerial hours during that time period, for an overall labor cost of $6.7 million. Tables 6 and 7 summarize the amount of total hours and percent of wages for nonmanagerial work on the Morpeth project during the period April 1997-August 1998. Most project tasks were carried out by welders and fitters, painters, electricians, equipment operators, riggers, and sand blasters. (The category “Extra Work” consists of various tasks that the client asked for during the fabrication stage. The documentation for the fabrication process does not permit an allocation of these tasks to specific occupations.) Fitters and welders account for two thirds of all hours that went into the fabrication of the Morpeth platform. The pay for the various occupations required for the platform construction ranges from about $13 to $28 per hour. Clearly, that pay level makes those jobs very attractive, especially in the Houma labor market area.

37
Table 6
Percent Hours and Percent of Wages for Morpeth Project
Occupation Hours % Total Hours
% Total Wages
Brace Rack—Welders/Fitters 4,532 1.1 1.0 Confined Space Watch— Technicians 1,912 0.5 0.3 Dimensional Control—Technicians (Quality Assessment) 840 0.2 0.2 Electrical—Electricians 2,600 0.6 0.5 Equipment—Equipment Operators 42,546 10.0 12.3 Field Fitting—Fitters 48,644 11.5 9.8 Field Welding—Welders 58,328 13.8 14.0 Loadout/Lofting—Riggers 6,004 1.4 1.5 Material Moving—Laborers 5,621 1.3 1.3 Painting—Painters 13,878 3.3 3.5 Pipe Field Fitting—Fitters 41,784 9.9 10.8 Pipe Field Welding—Welders 12,214 2.9 3.2 Pipe Support—Fitters/Welders 1,588 0.4 0.4 Pipe Rack—Fitters/Welders 681 0.2 0.2 Pipe Shop Fitting—Fitters 6,238 1.5 1.2 Pipe Shop Welding—Welders 10,084 2.4 2.3 Pipe Supports—Fitters/Welders 9,160 2.2 2.1 QualityControlDocumentation—Clerical 840 0.2 0.1 Quality Control Paint Inspection—Painters 311 0.1 0.1 Reblasts Welds—Sand Blasters 475 0.1 0.1 Safety Training—Safety Training 1,561 0.4 0.3 Sandblasting/Prime—Sand Blasters 26,462 6.2 6.6 Shop Fitting—Fitters 51,925 12.3 10.3 Shop Welding—Welders 39,269 9.3 8.6 Extra Work 32,839 7.7 8.4 TOTAL 423,874 100.0 100.0

38
Table 7
Summary of Hours and Percent of Wages for Morpeth by Discipline
Occupation Hours %Total Hours
%Total Wages
Welders/Fitters 15,961 3.8 3.6
Welders 119,895 28.3 28.1 Fitters 148,591 35.1 32.2 Technicians 1,912 0.5 0.3 Technicians (Qual. Assess.)
840
0.2
0.2
Electricians 2,600 0.6 0.5 Equipment Operators 42,546 10.0 12.3
Riggers 6,004 1.4 1.5 Laborers 5,621 1.3 1.3 Painters 13,878 3.3 3.5 Painters (QC) 311 0.1 0.1 Clerical 840 0.2 0.1 Sand Blasters 26,937 6.4 6.7 Safety Training 1,561 0.4 0.3 Extra Work 36,377 8.6 9.2 Total 423,874 100 100
Figure 28 shows the man-hour distribution of labor over the duration of the project. This again brings
out the preponderance of effort put in by the welders and fitters throughout the project. Hours on assembly tend to be weighed towards the latter part of the project, as would be expected. Painting is weighed towards the second half of the project, but not specifically towards the end. Figure 29 shows the cumulative hours spent by all labor on the Morpeth project at Gulf Island Fabrication.
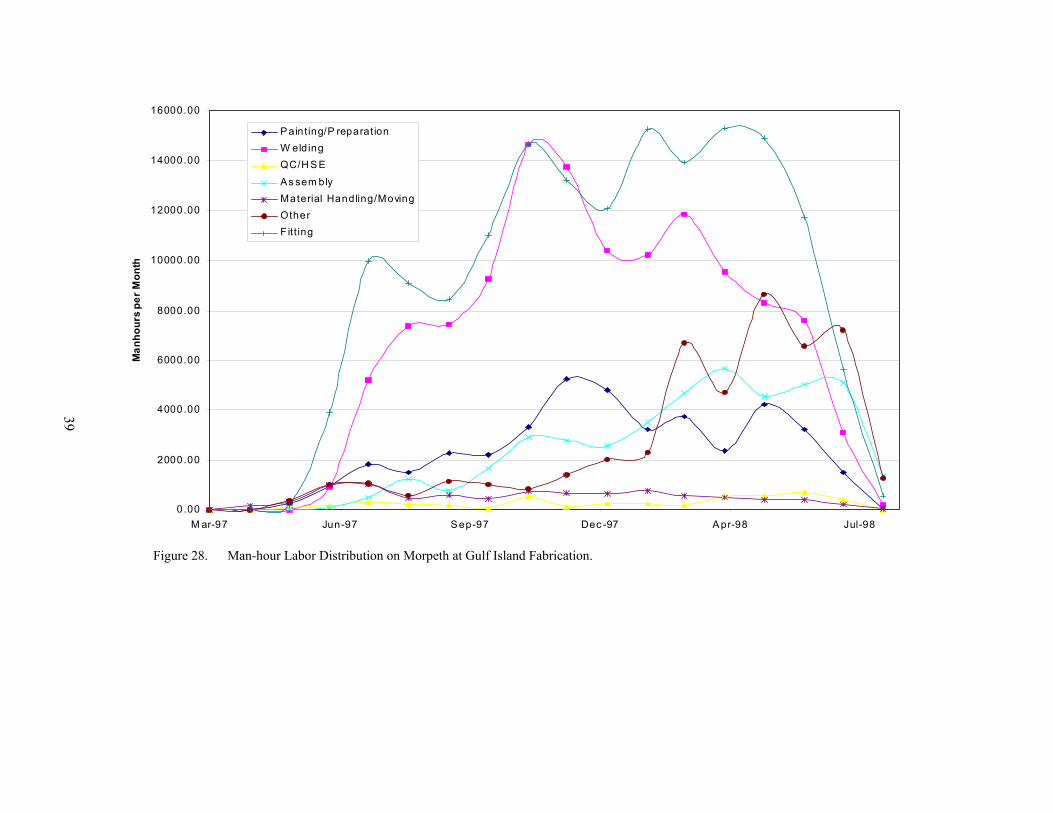
39
0.00
2000.00
4000.00
6000.00
8000.00
10000.00
12000.00
14000.00
16000.00
M ar-97 Jun-97 S ep-97 Dec -97 A pr-98 Jul-98
Man
hour
s pe
r Mon
thPainting/P reparationW eldingQC/H S E
As sem blyMaterial Handling/MovingOtherF itt ing
Figure 28. Man-hour Labor Distribution on Morpeth at Gulf Island Fabrication.

40
0
50,000
100,000
150,000
200,000
250,000
300,000
350,000
400,000
450,000
Mar-97 Jun-97 Sep-97 Jan-98 Apr-98 Jul-98
Cum
ulat
ive
Hour
s, A
ll Di
scip
lines
Figure 29. Cumulative Hours on Hull and Deck Fabrication and Assembly at Gulf Island Fabrication on Morpeth.

41
Table 8 presents our estimates of the average number of persons employed for the various project tasks during the 16-month duration of the fabrication. We combined all tasks that essentially required the same type of occupations. According to those estimates, the fabrication project employed a total of 662 persons working a standard work week every month during the length of the project. This includes a total of 444 fitters and welders, 66 equipment operators, and 22 painters for those 16 months.
Table 8
Number of Full-Time Equivalent Workers
Occupation Total Hours
FTE per Month
Welders/Fitters 15,961 25 Welders 119,895 187 Fitters 148,591 232 Technicians 1,912 3 Technicians (Qual. Assess.) 840 1 Electricians 2,600 4 Equipment Operators 42,546 66 Riggers 6,004 9 Laborers 5,621 9 Painters 13,878 22 Painters (QC) 311 0.5 Clerical 840 1 Sand Blasters 26,937 42 Safety Training 1,561 2 Extra Work 36,377 57 Total 423,874 662
Note: We estimate FTE employment by dividing the total number of hours worked by the standard work week (40 hours) and the duration of the project (16 months).
3.2. OCCUPATIONAL STRUCTURE OF THE HOUMA LABOR MARKET AREA A key objective of this research project is an estimation of the effect of platform fabrication on the
local labor market area. What is the demand for labor from this fabrication, and how is it related to the supply of labor in that local labor market area? To answer that question, we will first present a brief summary of the occupational structure in the Houma labor market area, to be followed by the impact of occupation-specific labor demand in this area that results from fabrication work for the Morpeth platform.
A major methodological problem for the estimation of the effect of labor demand on a local labor market area in 1998 is the lack of industry-specific occupational information for that year. Essentially, occupation-by-industry data are available from the U.S. Bureau of the Census every 10 years. Unfortunately, the 1990 census data are likely to have a substantial error term, yet the 2000 census data for industry and occupation will not become available until late 2003. Given these data constraints, we chose three datasets for our analysis of the effect of the Morpeth project on the Houma labor market area: (1) the 1998 Occupational Employment Statistics (OES) Survey from the Bureau of Labor Statistics of the U.S. Department of Labor for the Houma Metropolitan Statistical Area (Lafourche and Terrebonne Parishes). (2) A special tabulation of 1990 industry by occupation data (STIO) from the U.S. Bureau of the Census that was commissioned in conjunction with the Socioeconomic Database for the Gulf of Mexico Region 1930-1990 sponsored by MMS; those data are also for the Houma Metropolitan Statistical Area (Lafourche and Terrebonne Parishes). And (3) Occupational Employment Statistics from
42
the Louisiana Department of Labor (OES-LA) for 1998 (and projections for 2008), covering Louisiana’s regional labor market area No. 3 that includes Assumption, Lafourche, and Terrebonne Parishes.
Each of these three datasets has advantages and shortcomings. By presenting datasets with different advantages and disadvantages, we hope to minimize any systematic error in relating Morpeth-generated labor to the Houma labor market area. While the OES data cover 12 months of the Morpeth project in 1998, they are only for occupations and do not permit the identification of occupational data within the fabrication industry. However, since many welding skills can be transferred among various industries, we decided that these data do have informational value for the present analysis of labor demand. The 1990 STIO data have the disadvantage that they are somewhat dated, but they permit us to examine the relationship between specific occupations involved in the Morpeth project and the supply of those occupations within the two industries relevant for fabrication: Standardized Industry Code (SIC) 353 = Construction and related industries, and SIC 373 = Ship and boat building and repairing. Finally, the OES-LA data have the same advantage and disadvantage as the STIO data, but they cover a different geography (regional labor market area vs. metropolitan statistical area), and they also include employment projections to 2008 that might be useful for some policy makers who wish to view the Morpeth generated labor demand in the context of those projections. Occupational information from those three datasets are presented in Tables A1.1-A1.3 and A2.1-A2.3.
3.2.1. OES Data for Houma MSA The 1998 OES data (see Table A1.1) showed 5,148 workers in the Houma Metropolitan Statistical
Area (MSA) who were employed in the occupational categories of Welders (Occupation Code=93914), Shipfitters (89121), Riggers (85935), Painters (87402), Sheetmetal (89132), Assemblers and Fabricators (93956), and Operators (92998). The Morpeth fabrication project employed about 11 percent of workers in those occupations. (These occupations make up 88% of all workers for the Morpeth fabrication project.) Morpeth workers tended to have slightly higher hourly wages than other workers in the same occupations in the Houma MSA; thus, the Morpeth project accounted for about 15 percent of the total payroll for these occupations in the Houma MSA.
3.2.2. STIO Data for Houma MSA The 1990 STIO data for the Houma MSA (see Table A1.2) show a total of 4,742 workers in these
same occupations (Occupation Codes 579, 725, 777, 779, 783, 759, 785 and 859). The number of workers in these occupations who worked on the Morpeth project in 1998 amounts to 12 percent of that 1990 figure, which is comparable to what was shown above for the OES data.
The 1990 STIO data permit a differentiation of occupations by industry for the Houma MSA (see Table A1.2). Considering only the two industries of construction and related machinery and ship and boat building and repairing, 1,227 persons worked in the above occupations in 1990. By 1998, Morpeth’s employment of 583 workers with the same occupational skills made up 48 percent of employment in the construction and ship building industries. This is an indicator of the substantial impact of Morpeth on employment in those specific occupations within the construction and ship building industries.
3.2.3. OES-LA Data for Louisiana RLMA 3 The 1998 OES-LA data cover Louisiana’s regional labor market area (RLMA) No. 3, which includes
Assumption, Lafourche, and Terrebonne Parishes. According to Table A2.1, there were 4,510 workers in the same occupations as specified in the section on OES data. Morpeth in 1998 accounted for 13 percent of that employment.
3.2.4. STIO for Louisiana RLMA 3 To compare the same geography with the OES-LA data, we also aggregated the STIO data to the
same RLMA by adding Assumption to the Houma MSA. For the La. RLMA 3 in 1990, the STIO data show an employment level of 5817 in the occupations referenced in the STIO-HOUMA-MSA section (see Table A2.2). Morpeth’s employment of personnel in the same occupations was 10 percent of that total. Considering only the two industries of construction and ship building, Morpeth’s 1998 employment represents 40 percent of the corresponding 1990 employment for Louisiana’s RLMA 3 (see Table A2.3).

43
Comparing the impact of Morpeth’s labor demand on the Houma MSA and Louisiana’s RLMA 3, using the three datasets as specified above, it becomes apparent that
1. Morpeth had a substantial impact on the demand for those occupations that are required for the fabrication of platforms (at least of the Morpeth type);
2. this impact is especially large within the industry of the company where the fabrication took place; and
3. there is not very much demand for those kinds of occupations in Assumption Parish, since the impact of Morpeth does not differ much between the Houma MSA and Louisiana’s RLMA 3.
4. CHRONOLOGY OF FIELD DEVELOPMENT The following section describes the processes by which a field is acquired and developed. In
practice, there are many variations in the details, and probably some in the fundamentals, but this outline has been written with the intent of giving an overview of the process, especially for people unfamiliar with the offshore industry. Since this project was started, and the original report written, there have been a number of documents published that cover some of the information contained here. However, there are still sufficient gaps in the literature for this document to fill.
4.1. PRELEASE ACQUISITION The profit potential of an oil lease is the overriding factor in determining an oil company’s interest in
it, whether or not they develop it themselves. In some less developed areas of the world this may mean that sufficient acreage is offered at a sufficiently low price to make a bid attractive. In the Gulf of Mexico, an attractive price is typically not enough incentive by itself. The lease area must be studied, through the development and interpretation of geologic and seismic data, to determine if economically recoverable reserves exist.
Though it is no longer a deciding factor, companies prefer that a field lies within or near an area in which they have existing infrastructure, so it can be serviced from an existing supply base and have good access to existing pipelines (particularly their own). For leases outside a company’s area of interest, the magnitude of the expected reserves must be greater in order to pay for the additional expense of establishing bases and infrastructure.
Even at this early stage, companies need to consider how they would develop the field, in broad terms, were they to be successful in winning the lease and finding the expected reserves. There is little point in having a major discovery if it cannot be economically developed. One alternative to make the profit potential more attractive is to take on a lease with the intent of selling it outright or selling an interest in it, after having assessed its capability.
4.2. PARTNERS AND OPERATOR Depending on the results of the initial assessment of the lease, partners may be taken on or
encouraged to buy in. It may be that a particular area looks considerably more attractive when the existing infrastructure of a potential partner is considered. The reasons for partnering are to spread the risk, and to improve the consortium’s capabilities in certain areas. It may be that one potential partner has expertise in a specific area that would be of value to a specific development option, so they may be encouraged to join in order to gain additional knowledge. Equally, a company may join a venture in part to learn how another company acts as the operator. For example, Shell had a financial interest in Morpeth and is reported to have taken an active interest in how a minor operator developed the field. This may not have been their primary purpose, but it was certainly an added benefit.
Additional partners may be taken on later in the process as the need and opportunity arises. In a limited number of cases drilling contractors have taken a working interest in lieu of payment for drilling the exploratory wells, but this has always been after the lease has been acquired. Drilling contractors have never got into the position of competing with the oil companies at the lease bid stage. Drilling contractor involvement has had limited success because they are somewhat risk averse: they like a steady income from their assets, while oil companies are inherent risk takers.

44
4.3. BIDS TO MINERALS MANAGEMENT SERVICE As with any competitive bid process, bids made to the MMS for the leases attempt to keep a balance
between paying a low price and winning the bids on the blocks that are important. Clearly, the value is based on all the same factors that were used to decide where to consider bidding. But there may also be specific strategic issues, such as a desire to be seen as a major deepwater operator at the forefront of technology, which can influence the magnitude of a bid. But the aim is always to get the bid for the lowest possible price.
4.4. MORE DETAILED SEISMIC Having obtained the lease, the next step is to get a more detailed understanding of the potential
reserves. Normally, unless already available from pre-lease acquisition activities, a more detailed seismic study is performed. This 3D seismic data, and its subsequent interpretation, gives the best available data on any potential hydrocarbon reservoir structures in the lease area short of actually drilling wells. Reserve estimates are made from this data though it cannot confirm the presence of hydrocarbons. Gas can be seen sometimes, but it is extremely difficult to distinguish between oil and water16. Fluid densities are easier to determine in shallow formations, but even in these, the level of data processing to ascertain the differences is considerable. In addition, the salt of salt domes can seriously degrade the quality of returned seismic signals.
4.5. EXPLORATORY DRILLING No drilling can be undertaken prior to lease acquisition, but the 3D seismic results provide a good
idea of where one should drill once the bid has been accepted. The cost of drilling is relatively high. A deepwater semi-submersible will cost around $200,000 per day (more for a drillship), and the consumable/transportation costs are approximately another $100,000 per day17. Given an exploratory well, excluding well testing or any drilling problems, may take 60 days to complete, the cost for an exploratory well will be on the order of $15 to $20 million. If significant hydrocarbon is found, then well testing may cost another $5 million, although there will be some return through sales of produced hydrocarbon.
The number of wells drilled will depend considerably on what is found. If everything appears to confirm what had been expected, then the number of exploratory wells will be minimized; but should there be surprises, then it may be necessary to drill more wells to gather additional information.
4.6. FIELD DELINEATION Field delineation through exploratory drilling is an expensive exercise so it will tend to be minimized.
If a field is relatively homogenous and can clearly be economically developed, then there is little need to determine its exact boundaries. Conversely, if the field is made up of multiple thin pay zones and complex geology, it may be necessary to drill more wells to confirm the presence of hydrocarbon in the potential pay zones. It may be impossible to access all the relevant areas by directional drilling, so determination of the field layout will significantly impact how the field is to be developed: from a central facility, or a series of subsea facilities tied back to one point.
The economics of additional exploratory drilling and field delineation are very much in dispute, and there are those who suggest that too much time is spent determining to too fine a level the field properties. In addition to the cost of more exploratory wells, the process delays production start up. The earlier the decision to develop is made, the earlier a company sees a return on its investment. It may even be
16 After time, and experience with a field, it can be possible to distinguish between oil and water, but this is generally true only for fields that have had a history of seismic signatures run. 17 Rig day rates vary considerably, depending on the capability of the drilling rig, and market demand. When this project was started in early 2000, the day rates were as quoted in the text. Since then, the rates for deepwater semi-submersibles in the Gulf of Mexico have dropped to around $50,000 per day in 2003, or approximately one-third of what they were three years ago.

45
economic to have two vessels working the field, one drilling and the other, at a much lower day rate, completing the wells.
4.7. WELL TESTING All the fields included in this study performed some well testing, but not for very long. Well testing
is a compromise for all parties, including the MMS. The oil company wants to get realistic data on reservoir flow rates, but does not want to deal with the produced gas. The MMS does not want the operator to flare, and hence waste, the gas. The operator wants to get some return on the well testing by flowing into a barge, but the economics are marginal, at best. The end result is that most of the wells considered in this study were flow tested for a maximum of a few days, many much less.
A well that is producing 10,000 bpd will generate $200,000 to $300,000 per day. But the cost of the semisubmersible, with all its associated costs, will be around $200,000 per day, so the margin is small. There are some deepwater drillships available that have limited onboard storage capability, and can easily be set up for either early or extended well testing. Their use may alter the economics, but given their day rate is higher than a conventional deepwater semisubmersible, it is not immediately apparent how this would work in the Gulf except for early well testing.
4.8. DECIDE TO DEVELOP At some point a decision to develop must be made. As presented here, it is a linear process from
lease acquisition to this point. In reality there is a combination of forward thinking about how to develop, and what development will entail and backward assessment of what facilities exist. Certainly it will be necessary to define the recoverable reserves, estimate the rate of recovery, and assess the expected cash flow. This must be compared to the cost of development and operations which themselves are dependent on the development option chosen.
Most of the projects included in this study decided on the type of development relatively early on by considering the various factors discussed in the following section (Factors Affecting Development Options). Depending on how these factors are evaluated a specific development option may become apparent or several will be considered. For example, a company may evaluate the advantages of a spar versus a mini-TLP for a given development, while another may decide on a specific development option and search for a suitable field to meet its demands.
It may transpire that even if a field appears to be economic, it is better to farm-out or sell the explored lease than to develop it, as was the case for Shell on Morpeth when they sold it to British Borneo. Sometimes a smaller company can develop a field more economically than a large one.
4.9. FACTORS AFFECTING DEVELOPMENT OPTIONS There is a long list of reasons why one particular development option is chosen over another, and the
major ones are discussed in the following section. Generally there is a strong logic behind why a particular route is taken, but it is not uncommon for circumstances to dictate that a company moves forward with a particular development option before they have had time to fully assess all the options. Consequently, the development decision becomes a best compromise at the time.
The development decision is typically an iterative process as various factors are considered and choices evaluated. The layout of this report suggests a linear process of field discovery, decision to develop, choice of development option, development, etc. While there is a clear linear component to the process, as with any complex problem, it is not always reasonable to move forward without consideration of the steps ahead: it may be reasonable to decide to look for oil in ultra-deepwater, but without development options, one is not likely to start delineating the field. Without this process of thinking ahead, one can arrive at a situation where there has been so much commitment to a project that it is unstoppable, even though it may be economically dubious.
Oil companies will often use consultants to help them assess the various development options. As an example, Amerada Hess spent about $2 to $3 million on preliminary engineering to assess the possible options for the Baldpate development. These studies included floating production options, TLP, and the compliant tower. For a number of reasons they relatively quickly decided that the tower was the way forward, but still had to study the type of tower, and the various options. While these studies tend to be at

46
a high level, they need to consider all aspects in order to be beneficial. One development option may appear to be the best, but if it means the use of, say, subsea wellhead, then well intervention techniques and costs must be included.
4.9.1. Water Depth Generally the first factor considered when evaluating development options is the water depth at the
proposed site. Not only does this affect the overall cost of development, but it also limits the development options. In shallow water (less than 200 feet) there are many fixed structure options including converted jack-up, caissons, lean-to-well-protectors, other minimal structures, and conventional jackets. Subsea development is probably feasible, but would not normally be considered because of the necessity to either bury the wellhead, or install some trawl protection so that it would not snag fishing nets.
As the water depth increases, some of the minimal platforms become infeasible, but subsea becomes a possibility for individual wells. These can then be tied together and produced to a shallow water hub platform for processing. There is still a large array of minimal platforms designed for intermediate water depths, but there is a limit to the number of wells and process equipment they can support. Beyond 500 feet water depth the number of minimal platforms available sharply decreases. A conventional jacket structure becomes more expensive as the size must increase in order to withstand the higher environmental loads; consequently they tend to be economic only if they are producing a large number of wells.
Beyond 500 feet water depth it is possible to use converted semi-submersible drilling units. The first of these was installed in the North Sea in 260 feet of water, but they have been used in over 2,000 feet water depth in the Gulf of Mexico, and over 3,000 feet offshore Brazil.
It is at around 1,000 feet water depth that the various deepwater options will be considered: compliant tower, spar, TLP, FPSO, etc. There are water depth limits to the compliant tower, and TLPs are not well suited to the shallower end of the deepwater spectrum. The limits of each option are discussed in greater detail in the section on types of structure.
4.9.2. Size of Field and Number of Wells The number of wells, and how they will be drilled, has a major influence on the type of installation
chosen. Each well takes up a certain amount of physical space on the platform, so the more wells, the larger the platform has to be. Also, if the wells are to have dry trees, then the structure needs to be able to support all of the additional weight. If the field is highly fragmented, then subsea development may be the best option since it may be difficult to drill all the needed wells from the central facility. Conversely, if the wells can all be clustered, then a single central structure will offer the advantage of being able to complete all the wells using a rig package rather than having to use a deepwater semisubmersible. The difference in price will be well in excess of $100,000 per day.
4.9.3. Expected Production Rate A high production rate will necessitate larger separators and other processing equipment leading to
higher deck load. In addition the export risers will need to be larger, as will all the onboard piping. The development option chosen would have to accommodate both the space for the equipment and its weight. It would be possible to undersize the equipment if the high production rate was expected for a short time only, but the economics would have to be carefully assessed.
4.9.4. Type of Crude Subsea developments are generally best suited to wells with low workover/intervention requirements
and with good flow assurance (i.e., wells that will not get fouled with paraffins, etc.). Though these limitations can be offset with chemicals and the application of other technologies, it may not be economic or practical to do so. These considerations may push the development option in a different direction.

47
4.9.5. Quantity of Gas If a field has very large quantities of gas, particularly at high pressure, then the size of the processing
equipment will increase. As with the impact of high production rates and a large number of wells, some of the smaller development options may not be reasonable in this case if they cannot support the deck load of the larger structures.
4.9.6. Financial Risk The speed with which any option can start bringing a return on investment is an important
consideration in any development decision. Look at these examples:
• The economics might dictate that a quick development via a subsea tie-back to an adjacent structure may be attractive if the short time to first oil and the low capital costs offset the higher operating expenses.
• A smaller company may wish to install a less costly structure to quickly develop known reserves, without the additional expense of having to accurately delineate the field. Should later drilling show that the field is larger than expected, additional tie-backs can be installed. The downside to this approach is that the platform may not be installed in the best place, and additional expense may be required to either move it or use other drilling options. A major oil company may be in the position to fund far more detailed assessments of the field, but this may make the development less economically viable.
4.9.7. Politics Government, corporate and industry politics may all play a role in influencing a development
decision. Governments can affect how a field is developed through local content requirements, restrictions on particular development options, health, safety and environment regulations, etc. Corporate politics may arise through the influence of corporate perceptions that specific development options are higher risk than others. Additionally, past experience with specific contractors may lead a development team to favor a specific development option, not necessarily because it is the best option, but because of a trust in that contractor to produce a quality product on time and budget.
4.9.8. Local Infrastructure The presence and ownership of local infrastructure influences the ability to economically export the
produced hydrocarbons. The viability of a new facility can be compromised if sufficient infrastructure is not available. As an example, subsea completion options may not be feasible (because of maintenance costs associated with cleaning lines fouled with paraffin and hydrate deposits) if pipelines are longer than about 20 miles for oil and 70 miles for gas18. Conversely, it may be that the installation of infrastructure will allow adjacent fields to become economically viable which can make up for the added expense either through direct development of those fields or through fees paid by other operators to process their crude on your facility. Rates vary depending on the market, type of crude, location, etc., but would likely be in the range of approximately $2.50 per barrel of oil, and $0.50 per 1,000 cubic feet of gas.
4.9.9. Length of Field Life Field life normally only affects the decommissioning considerations, since some development options
can be reused at other fields. As an example, one of the reasons for choosing a spar for the Neptune development was that the structure would need to be moved to an adjacent field in order to continue production. This would be practically impossible with a fixed base structure. A TLP could be moved, but there would be considerable expense associated with obtaining new tendons, and installing new piles. A spar moored using conventional drag-embedment anchors can be relocated a short distance (e.g., about 18 These estimates are based on discussions with industry representatives as well as data in the May 2002 edition of Offshore magazine.

48
100 miles) with relative ease (although longer distances would involve considerable complications because it must be towed vertically at slow speeds).
4.9.10. Possible Re-Use of Platform as a Hub When the wells associated with an installation have paid out, a decision needs to be made regarding
what to do with the structure. Decommissioning is discussed below, but an alternative is to use the facility as a “hub” for other fields with operating wells. A hub facility may continue to produce from other wells that have been tied back into it, act as a gathering point for hydrocarbons for piping to shore, or act as a maintenance point for pigging the pipelines. As a hub, the installation can become an integral part of the OCS infrastructure, with an extended life generating cash for the operator through fees for processing, flow-through, and maintenance.
4.9.11. Need for Workover All wells need maintenance that requires entry into the well (intervention). Some well intervention
can be accomplished using a coiled tubing unit; other wells require the tubing to be pulled in order to develop a new or different pay zone. If the facility has drilling equipment on board, or the ability to install a rig package, then the cost of these well interventions is relatively low. Subsea developments are somewhat more complicated because some type of vessel, such as a conventional deepwater drilling unit, is needed for any required well intervention. Since these vessels can cost around $250,000 per day, it is an expensive option. There are well intervention vessels that are much less expensive than drilling units, but their capabilities are limited (e.g., it is unlikely that they would be capable of re-completing a well). Consequently, there is a trade-off between capital expenditure, operating expenditure, and potential downtime, all of which need to be considered when making a development option choice.
4.9.12. Decommissioning Costs and Technology Decommissioning is becoming increasingly important. In the early 1980s little consideration was
given to what should be done with the old platforms in the Gulf, and around the world, when they reached the end of their useful life. By the early 1990’s it had become common to reuse shallow water platforms (i.e., removing them from site, refurbishing them, and then re-installing them at new locations), some even being transported overseas to new fields. In addition, the rigs-to-reefs program became well established.
However, as an issue of importance to the development team, decommissioning was not given much weight until attention was brought to the issue by the Brent Spar in the North Sea. Shell had decided to sink the old platform in the North Atlantic, and had obtained permission to do so from the British Government. They then ran into problems with Greenpeace, leading to public outcry and boycotting of Shell gas stations around Europe. This raised the issue from one of technical and economic considerations to one of public policy. While still not as important a consideration in the U.S. as in Europe, decommissioning is now a serious issue for any development decision.
A number of companies approached concerning this study have indicated that it is not exactly clear what will be required of them when the time comes to decommission their offshore facilities in the Gulf of Mexico. They assume that all the wells will need to be plugged and abandoned, but are not sure of the requirements for the remaining structure. Floating units (TLP’s, spars, semisubmersible based systems, etc.) are relatively easily decommissioned down to the subsea equipment. Clearing all the equipment off the seabed would be complicated and expensive, but probably not outside present technology.
The difficulty comes with the bottom-founded structures (i.e., jackets and compliant towers in the Gulf, and including gravity based structures in other areas of the world). In shallow water the piles can be cut, and the jackets lifted onto a barge for reuse or shore-based dismantling. In deepwater it would be possible to sever the base using explosives and topple them in place, but recovering the structure would be extremely difficult. Structure recovery systems are being proposed for use in the North Sea, but, though they must lift heavy structures, they do not have to operate in such deep water or recover such tall, and often skinny structures as in the Gulf.
Based on responses from industry representatives, the whole area of decommissioning has not been fully addressed by many of the companies involved in the Gulf OCS. There is uncertainty as to what will be required, and what is feasible, and, consequently, the issue is not being fully incorporated into the

49
development decision process. There have been attempts to organize effective education on these issues but the required knowledge has not necessarily filtered down to the project level at the time development options are considered. The issue is not one of lack of regulations, but a need for more open discussions as there have been in other areas of the world.
4.10. DEVELOPMENT OPTIONS 4.10.1. Conventional Jacket Based Structures
The conventional jacket based offshore structure is what most people think of when they think of an offshore platform. Jackets have evolved over the years from the early platforms built on location offshore to the modern engineered structures of today, but they are still, in many respects, the same as they were over forty years ago -- fixed steel structures constructed of tubular members welded together and founded on driven steel piles.
Some modifications to the basic concept have come about. In the middle 1970’s a two-piece jacket was installed in the Santa Barbara Channel off California. And in 1980, Cognac, a three-piece jacket, was installed in the Gulf of Mexico. Both of these were attempts to extend what is basically a shallow water technology into deeper water depths. Later jackets, such as Pompano and Virgo, were installed in deep water in a single section, but these represent the water depth limit in practical and economic terms for jacket technologies at present.
Jacket structures are normally installed in two stages: first the jacket is piled to the seabed, then a deck structure, prefitted with all the process equipment and accommodation, is lifted atop and welded in place.
4.10.1.1. Limitations Jacket structures are limited to specific water depths. This is not necessarily because one cannot
design a jacket for deeper water, but because the fabrication, transportation, and installation become impractical, and their weight makes them uneconomic. In the Gulf of Mexico, approximately 1,500 feet water depth is commonly considered the limit, although this would likely be significantly less in harsh environments (e.g., North Sea and East Canada) and possibly a little more in benign areas such as West Africa.
4.10.1.2. Advantages The main advantage of a jacket type structure is that based on the long experience with such facilities
in the Gulf of Mexico, in shallow enough water depths (i.e., less than about 350 feet) one gets a stable platform that is not too sensitive to topsides weight for a well understood price. Other advantages include
• Construction Experience. Jacket construction is relatively simple and well understood around the Gulf Coast, with many yards having extensive experience. Hence the potential for cost overruns is very much reduced. This is extremely important on most projects. (In the case of shallow water platforms it is possible to get lump sum fixed price bids for an installed facility, with little chance of significant change orders increasing the cost.)
• Short Transportation. This expensive and high-risk task is minimized since jackets are normally built close to the installation site.
• Installation Experience. Whether lifting or launching, jacket installation techniques are well established; hence the risks are better known and can be better controlled.
• High Production Capacity. If a large number of wells and export risers are needed to develop a field, the increase in weight and other loads can be designed within a fairly broad range.
• Expansion Capability. As with the ability to accommodate a fairly large production capacity, if it transpires that additional processing capacity is required at a later date,

50
it is likely that simple modifications will allow the addition of more process equipment, conductors, risers, etc.
• Deck Installation. The deck can simply be lifted into place with few hook up problems.
• Drilling Flexibility. The structure can normally be designed for the installation of a “rig package” to complete the wells perform workovers. In shallower water depths (up to approximately 350 feet) it may be possible to use a jack-up for workover, which could considerably reduce costs.
• Low Tolerances. The deck and jacket can adjust to reasonable lack-of-fit (compared to other options), so tolerances do not have to be tight and are within the capability of many yards.
• Robust Structures. Jacket structures are relatively robust and can withstand considerable damage (through collision, overload, etc.) without collapsing.
• Hub Capabilities. Jackets are ideally suited for extended use as a processing hub after the platforms associated wells have dried up. Maintenance costs are relatively low as long as corrosion is kept under control and large topsides payloads can usually be accommodated.
• Inspection Ease. Experience has shown where underwater damage is most likely to occur, so periodic inspection is simplified.
• Export Pipelines. The cost of export pipelines is significantly lower than on a floating platform that uses, for example, steel catenary export risers.
4.10.1.3. Disadvantages The greatest disadvantage of a conventional jacket is the limited water depth in which it can be
installed. Other issues include
• Water Depth. At greater water depths, jacket costs and weight are high for the supported topsides as compared to other options.
• Repair Costs. While jackets can withstand considerable damage without collapsing, they are very expensive to repair. Underwater repairs are expensive (e.g., some require special chambers to allow dry welding) and dangerous, and the structure cannot be removed from location and taken to a yard for repairs.
• Decommissioning. Jackets are expensive to decommission and remove from location once their useful life has been reached.
4.10.1.4. Fabrication The jacket part of the platform, so called because it surrounds the well conductors, involves relatively
simple construction. Jackets are fabricated from tubes forming a braced structure of typically 4, 6, or 8 legs. Each face is normally fabricated flat on the ground and then “rolled up” into the upright position, with larger jackets fabricated on their sides. The intermediate bracing is then welded into place. The main skills and equipment required are the equipment to cut the tubular intersections, and welders to weld the individual tubes together. While some higher strength steel may be used, most of the structure can be built using standard “mild” steel. This keeps the cost of the steel down, but also means that welders do not have to be so highly qualified. Welding high strength steel requires extremely good quality control, and the welding rods need to be kept in an oven until ready for use in order to avoid “hydrogen embrittlement” which can cause the welds to crack.
Because of the relatively simple construction, and potential risks associated with transportation, jackets are normally fabricated in the same general area were they are to be installed. There are some exceptions (frequently West Africa jackets are built in the U.S. or South America, and some of the large

51
West Coast jackets were built in Japan) but they do not apply to the Gulf of Mexico. There are many small yards that will fabricate shallow water jackets, but there are a limited number of yards that can handle jackets large enough for deep water. As an example, the base section of Cognac was built in Morgan City, Louisiana. Photographs of that being transported through the bayous show how little clearance there was on each side. Water depth for the tugs and barges can also be an issue. Also, rolling up the sides of a large jacket needs plenty of crane capacity, and adequate space for a large jacket lying on its side (see Figure 30).
Figure 30. Pompano Jacket at Harbor Island Yard during Side Roll-Up (Courtesy of J. Ray McDermott).
The platform deck structure (the part of the structure that starts approximately 20 feet above the water
line) is normally fabricated and assembled in a yard under a different contract than the jacket. While there is a significant structural component to deck fabrication, there is also a very significant assembly component. It is the responsibility of the deck fabricator to assemble and install all the modules that will have been fabricated by other vendors. Such modules would include the accommodation, power supply, pump skids, separator modules, etc. that are used for the operations of the facility. This could involve modules from over 50 major vendors. The structural aspects of the deck will be highly dependent on the type of support structure (jacket, TLP, etc.) but the assembly aspect will be comparable regardless of platform type. Deck fabrication can lead to schedule bottlenecks because some components and modules require significant lead time (some in excess of a year).
4.10.1.5. Load-out, Transportation, Installation, and Piling As stated above, most large jackets are fabricated on their side. Once they are completed, they need
to be loaded onto a transport barge and towed to site. This is normally achieved by skidding the jacket along a “skid rail” onto the transport barge. The barge will be brought alongside the fabrication yard and aligned with the skid rails, both vertically and laterally. The jacket is then pulled onto the barge with a combination of winches and hydraulic rams. Normally, once the jacket has started to move, the winches are sufficient to keep it moving. As the jacket starts to move onto the barge, ballast has to be adjusted in order to keep the overall deflections of jacket and barge within reasonable limits as determined by analyses. Alternatively, if the jacket is small enough and the crane capacity great enough, a jacket may be lifted onto the barge.
Once the jacket is loaded onto the barge it is “seafastened” to the barge to prevent it from sliding or rolling off during transportation. For short tows, as would be normal in the Gulf of Mexico, these seafastenings are designed assuming a relatively short exposure to severe weather. For jackets built in
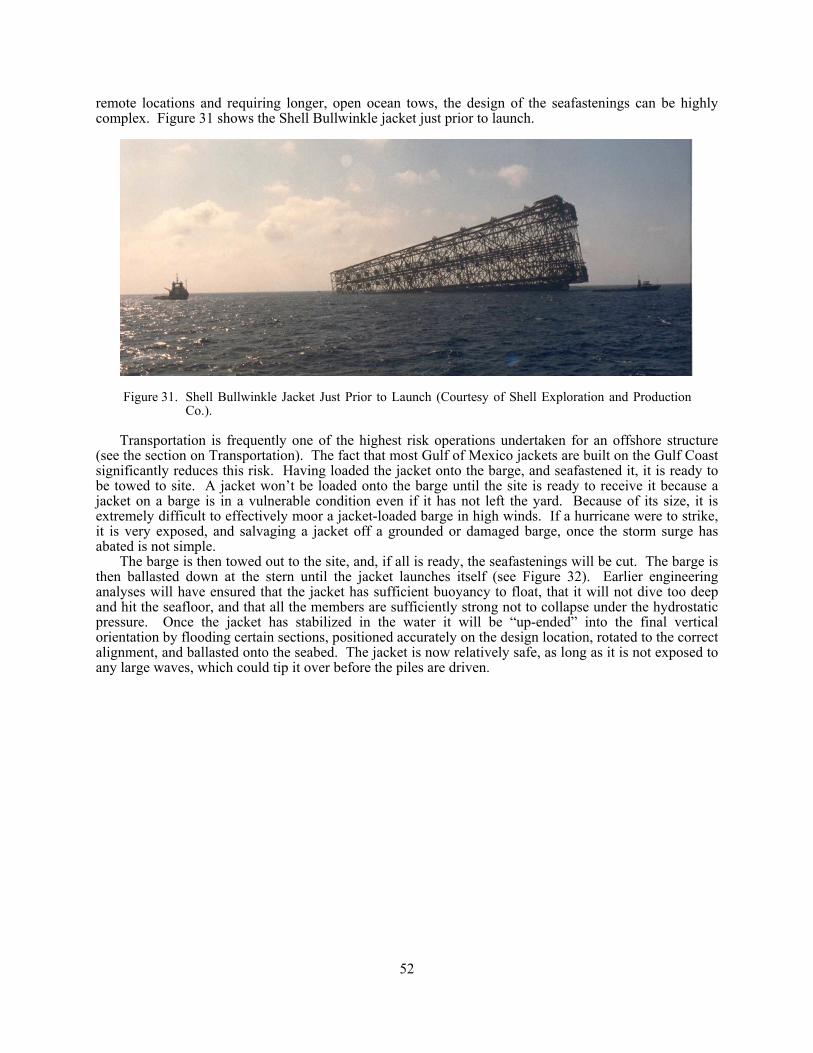
52
remote locations and requiring longer, open ocean tows, the design of the seafastenings can be highly complex. Figure 31 shows the Shell Bullwinkle jacket just prior to launch.
Figure 31. Shell Bullwinkle Jacket Just Prior to Launch (Courtesy of Shell Exploration and Production
Co.). Transportation is frequently one of the highest risk operations undertaken for an offshore structure
(see the section on Transportation). The fact that most Gulf of Mexico jackets are built on the Gulf Coast significantly reduces this risk. Having loaded the jacket onto the barge, and seafastened it, it is ready to be towed to site. A jacket won’t be loaded onto the barge until the site is ready to receive it because a jacket on a barge is in a vulnerable condition even if it has not left the yard. Because of its size, it is extremely difficult to effectively moor a jacket-loaded barge in high winds. If a hurricane were to strike, it is very exposed, and salvaging a jacket off a grounded or damaged barge, once the storm surge has abated is not simple.
The barge is then towed out to the site, and, if all is ready, the seafastenings will be cut. The barge is then ballasted down at the stern until the jacket launches itself (see Figure 32). Earlier engineering analyses will have ensured that the jacket has sufficient buoyancy to float, that it will not dive too deep and hit the seafloor, and that all the members are sufficiently strong not to collapse under the hydrostatic pressure. Once the jacket has stabilized in the water it will be “up-ended” into the final vertical orientation by flooding certain sections, positioned accurately on the design location, rotated to the correct alignment, and ballasted onto the seabed. The jacket is now relatively safe, as long as it is not exposed to any large waves, which could tip it over before the piles are driven.

53
Figure 32. Bullwinkle Jacket during Launch (Courtesy of Shell Exploration and Production Co.). On shallow water jackets the piles are normally driven through the center of the individual legs, and
then welded off above the waterline. On larger jackets this is uneconomic, so the piles are driven, underwater, through pile sleeves that are located around the base of the jacket. By using an underwater hammer, one does not have all the extra pile steel reaching from the seabed up to the surface. After piling, the deck structure is transported out to the jacket, lifted onto the jacket, and welded in place (see Figure 33 and Figure 34). Proper planning and execution is critical to keep the offshore work to an absolute minimum in order to reduce costs.
Figure 33. Jacket Deck Arriving on a Barge.

54
Figure 34. Lifting a Deck onto Jacket with Two Cranes on One Derrick Barge.
4.10.2. Compliant Tower A compliant tower uses many of the same features of a conventional jacket, steel tubular members,
welded frame construction, etc. However, rather than remaining rigid in the face of environmental forces (wind and waves), a compliant tower is built to be flexible, absorbing the energy of the environment by deflecting. There are a number of different options for compliant towers. The main distinction is between guyed (as in Exxon Lena) and free standing, as in Baldpate and Petronius, but there are variations within the freestanding design as well.
4.10.2.1. Limitations The maximum water depth for compliant towers is generally accepted to be approximately 3,000 feet,
but there is also a minimum (roughly 1,000 feet), below which it is difficult to get a structure that has a long enough natural period to achieve compliance. There have been relatively shallow water equivalents to the compliant tower (e.g., the Elf Oscillating Tower that was installed in the early 1970’s) but they are likely to be of very limited application.
4.10.2.2. Advantages The main advantage of a compliant tower is that it takes relatively conventional jacket structure
technology and construction techniques and, through careful modification, applies it to deepwater. For this reason many of the advantages of jacket structures apply to compliant towers
• Deep Water Capable. Compliant towers extend the water depth capability of jacket type construction to approximately 3,000 feet water depth.

55
• Lower Cost. Relative to other deep water options, compliant towers offer an inexpensive method of developing the shallower end of the deepwater spectrum (1,000 to 3,000 feet).
• Construction Experience. Construction of most of the tower is similar to that used for jackets, is relatively simple, and well understood around the Gulf Coast. Hence there are many yards that have the fabrication capability, assuming sufficient space, even if they lack the actual compliant tower fabrication experience.
• Short Transportation. This expensive, high-risk task is short since towers can be economically fabricated on the Gulf Coast.
• Installation Experience. Launch installation is well proven and established technology, hence the risks are better known and should be controllable. There is a slight increase in risk over a jacket because the compliant tower is narrower and more flexible.
• Deck Installation. As with conventional jackets, the deck can be simply lifted into place with few hookup problems.
• Drilling Flexibility. The structure can normally be easily designed to support the installation of a “rig package” to complete the wells, and for workover.
• Low Tolerances. The deck and jacket can adjust to reasonable lack-of-fit; hence construction tolerances do not have to be extremely tight.
• Robust. The structure is flexible enough to be able to absorb significant collision energy without collapsing, as long as the colliding vessel is moving slowly (see disadvantages below).
• Export Pipelines. The cost of export pipelines is significantly lower than on a floating platform that uses, for example, steel catenary export risers.
4.10.2.3. Disadvantages The disadvantages of a compliant tower include
• Production Limits (size and weight). Because the structure depends on maintaining a specific range of dynamic characteristics, the size and weight of the deck are limited which leads to limits on production equipment and capacity. This also limits future expansion so if field flow characteristics have been underestimated during design it may be difficult to find the space or weight capacity to expand the facilities.
• Production Limits (space). The relatively small plan area of the structure limits the number of wells that can be produced through the conductor framing, and load capacity limits the number and size of remote tie-ins and export risers.
• Impact Vulnerable. While the structure is capable of absorbing large quantities of energy at low speeds, the slow response time means that higher speed impacts could cause considerable damage.
• Repair Costs. As with jackets, underwater repairs are expensive (e.g., some require special chambers to allow dry welding) and dangerous, and the structure cannot be removed from location and taken to a yard for repairs.
• Decommissioning. Towers are expensive to decommission and remove from location once their useful life has been reached.

56
4.10.2.4. Fabrication The details of fabrication will be different than those for a conventional jacket, but the overall scheme
will be very similar – a compliant tower looks like a very tall slender jacket. The tower structure may be built in one or more parts (e.g., Baldpate comprised a lower “jacket base section” and an upper “jacket tower section”) and these parts may be built in different fabrication yards (as was the case with the Baldpate tower).
The deck section is very similar to that of a conventional jacket, albeit somewhat smaller.
4.10.2.5. Load-out, Transportation, Installation, and Piling The various installation phases are similar to those of a conventional jacket, with a few changes. On
a guyed compliant tower, a derrick barge will normally install the moorings prior to tower arrival. Once the tower is installed, the moorings will be pulled in to the tower and connected. The tower portion of the process proceeds much as for a conventional jacket with the pieces loaded onto a barge, towed to site and launched, upended and lowered into place.
The Baldpate tower, which is freestanding, was installed in two major parts, the jacket base section (JBS) and the jacket tower section (JTS). The JBS was lowered over two docking piles that ensured the correct location (within ± 2 ½ inches of location relative to center well) onto four leveling piles that ensured the JBS was sufficiently level (within 1 degree). The JBS was then piled into place. Next, the JTS was towed out, lowered and locked to the JBS. This installation procedure minimized the exposure of an un-piled structure to damage due to inclement weather. The JBS was deep enough that had a storm arisen during installation it would have been relatively safe from wave action.
There were some differences between the launch of the JTS and a conventional jacket, but they involved technicalities of overhang, stability, floating level, etc., not methodology.
Deck installation was in a single lift, as for many other offshore structures.
4.10.3. Tension-Leg Platform (TLP) Unlike the previously discussed options (jackets and towers) that are pile founded, large steel frames
made of tubular members, a TLP (see Figure 35) is a watertight, buoyant hull that floats at the surface and is connected to the seafloor via tendons, or “tension legs,” that have been attached to driven piles. The topsides facilities sit atop this hull, subject only to slight horizontal movements caused by wind, waves and currents, and operate much like conventional platform structures. A TLP hull usually consists of four columns up to 100 feet in diameter connected by pontoons around the perimeter.
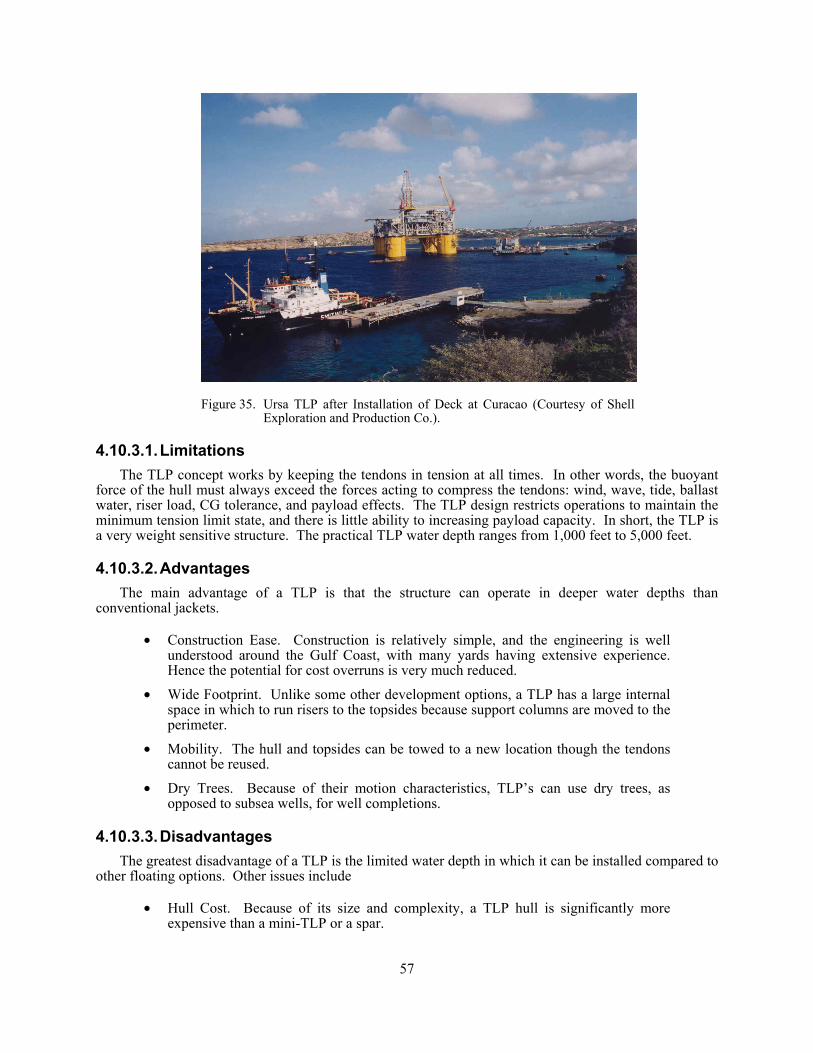
57
Figure 35. Ursa TLP after Installation of Deck at Curacao (Courtesy of Shell Exploration and Production Co.).
4.10.3.1. Limitations The TLP concept works by keeping the tendons in tension at all times. In other words, the buoyant
force of the hull must always exceed the forces acting to compress the tendons: wind, wave, tide, ballast water, riser load, CG tolerance, and payload effects. The TLP design restricts operations to maintain the minimum tension limit state, and there is little ability to increasing payload capacity. In short, the TLP is a very weight sensitive structure. The practical TLP water depth ranges from 1,000 feet to 5,000 feet.
4.10.3.2. Advantages The main advantage of a TLP is that the structure can operate in deeper water depths than
conventional jackets.
• Construction Ease. Construction is relatively simple, and the engineering is well understood around the Gulf Coast, with many yards having extensive experience. Hence the potential for cost overruns is very much reduced.
• Wide Footprint. Unlike some other development options, a TLP has a large internal space in which to run risers to the topsides because support columns are moved to the perimeter.
• Mobility. The hull and topsides can be towed to a new location though the tendons cannot be reused.
• Dry Trees. Because of their motion characteristics, TLP’s can use dry trees, as opposed to subsea wells, for well completions.
4.10.3.3. Disadvantages The greatest disadvantage of a TLP is the limited water depth in which it can be installed compared to
other floating options. Other issues include
• Hull Cost. Because of its size and complexity, a TLP hull is significantly more expensive than a mini-TLP or a spar.

58
• Foundation. The seafloor piles are more complex than that of other offshore mooring systems.
• Riser Cost. Compared to jackets and towers using traditional riser technology, the steel catenary export risers necessary for a TLP are expensive.
• Tendon Costs. The TLP tendons are relatively unique items, which makes them expensive. And they are designed only for the depth at original location so a relocated TLP will require new tendons.
4.10.3.4. Fabrication The TLP fabrication consists of separate hull and topsides construction, often at different locations.
The hull is built from four upright airtight cylinders (columns), up to 100 feet. in diameter, with tendon guides at the base corners. These columns are connected by pontoons at their base. Fairly standard steel plate construction methods common to shipbuilding are used.
The tendons are typically 24 inches or more in diameter and comprise 40 percent or more of the hull and mooring costs. In conjunction with the tendons there may also be a subsea template fabrication for the foundation and for drilling. Foundation templates would include guides for the driving of piles and attachments for the tendons.
Topsides construction is typical of that used for conventional jackets and compliant towers, although will often be installed in components on larger TLP’s (see Figure 36).
Figure 36. Deck Installation on Ursa (Courtesy of Shell Exploration and Production).
4.10.3.5. Load-out, Transportation, Installation, and Piling If templates are used for either drilling or foundation, these will be constructed onshore, loaded onto a
barge via a crane and towed to the installation site. Depending on the template size, either a MODU or heavy lift vessel will be required to lift and lower the templates in place. For foundation templates, piles will be driven using an underwater hammer to secure the foundation. An alternative to driving the piles is to drill, install and grout the piles in place. This will depend on the pile strength needed, the soil conditions and the available equipment.
If the hull has been constructed near the installation site, it can be towed from the construction yard to the location. However, if a longer distance is required (e.g., a TLP hull constructed in Italy) would normally be transported “dry” using a heavy lift vessel or large barge (see Figure 37).

59
Figure 37. Ursa TLP Dry Towed from Italy (Courtesy of Shell Exploration and Production). If the topsides are to be installed before towing the completed platform to site, this will be completed
at a shore-based facility with adequate lifting capacity. Figure 38 shows a wet tow of Ursa once the topside had been installed. Otherwise, both the topsides and hull will be towed separately to the installation site and mated on location. Factors affecting this decision are construction locations of the hull and topsides, available equipment for towing to site and installing the platform, and budget and time restraints.
Generally, at least some of the tendons will have been attached to the template or piles prior to the hull arrival. Those pre-installed tendons will then be attached to the hull prior to installing and attaching the remaining tendons, if any.
Figure 38. Wet Tow of Ursa from Curacao to Site (Courtesy of Shell Exploration and Production Co.).
4.10.4. Mini-TLP There are alternatives to the typical TLP design, for instance the MOSES design (minimum offshore
surface equipment structure), that are known as mini-TLP’s. These alternatives are tension leg platforms, but they differ from the larger TLP’s by hull configuration and they have greater weight limitations. A mini-TLP (see Figure 39 and Figure 40) has similar production capacity to a spar, but due to equipment constraints, less than a full-sized TLP. The practical mini-TLP water depth ranges from 1,000 feet to 5,000 feet.

60
Figure 39. El Paso Prince TLP (Courtesy of MODEC Int. LLC).
Figure 40. Anadarko Operated Marco Polo TLP Owned
by El Paso & Caldive (Courtesy of MODEC Int. LLC).

61
4.10.4.1. Limitations The main limitation of the mini-TLP is in the total load it is able to support. The mini-TLP cannot
hold as much production and drilling equipment as a spar or a full-size TLP.
4.10.4.2. Advantages The main advantage of a mini-TLP, just like the full-size TLP, is that the structure can operate in
deeper water depths than conventional jackets. Additionally,
• Construction Ease. The construction is relatively simple, and the engineering is well understood around the Gulf Coast, with many yards having extensive experience.
• Cost. The mini-TLP hull is a relatively inexpensive option compared to a spar or a full-size TLP.
• Arrangement. Risers run along the external edge of the hull, allowing for greater capacity for production and subsea risers.
• Dry Trees. Because of their motion characteristics, mini-TLP’s can use dry trees, as opposed to subsea wells, for well completions.
4.10.4.3. Disadvantages Unlike a Spar, a mini-TLP’s topsides and hull must be separated before it can be moved to a new
location. In addition,
• Tendon Costs. The seafloor piles and the tendon system are more expensive than a Spar’s mooring system.
• Mobility. Though it can be moved to a new location (if the hull and topsides are separated) its tendons are designed for a single water depth and cannot be reused.
• Drilling Capability. Though mini-TLP’s can and do incorporate workover drilling capability, full drilling capability is generally not suited to the lower weight capability of these systems.
4.10.4.4. Fabrication Like a full-size TLP or a spar, mini-TLP fabrication consists of separate hull and topsides
construction, often at different locations. The hull is built in quadrants that form a mono-column, leading to a submerged base. The base consists of 3 or 4 watertight arms, extending from the base of the mono-column, forming a “Y” or a cross. These arms provide stability and are used as the connection point for the tendons. The main column of a mini-TLP can measure up to 100 feet in diameter and 360 feet in length, and the tendons may be up to 24 inches in diameter. In conjunction with the tendons there may also be a subsea template fabrication for the foundation. Foundation templates would include guides for the driving of piles and attachments for the tendons.
Like the other deepwater structures, a mini-TLP employs separately built topsides, containing multiple decks. These decks are built in stages, with separate modules or “skids,” blocks of production equipment, control facilities, crew accommodations, etc. Once all of these blocks are built, they are brought to a common location and placed upon the decks according to function.
4.10.4.5. Load-out, Transportation, Installation, and Piling Similar to the full-size TLP, templates may be used for either drilling or foundation and are typically
installed first. Depending on the distance between the construction site and the installation site, the hull will be transported dry (on a heavy lift vessel) or wet using tugs (see Figure 41). The topsides will be transported using a heavy lift vessel (unlike a full-size TLP, the option to install the topsides on the hull prior to towing to the site is not available for the mini-TLP).

62
Figure 41. Morpeth Hull Transportation to Site (Courtesy of Atlantia Offshore Ltd.). Generally, at least some of the tendons will have been attached to the template or piles prior to the
hull arrival. Those pre-installed tendons will then be attached to the hull prior to installing and attaching the remaining tendons, if any. Once all the tendons have been secured, the topsides can be lifted in place (see Figure 42).
Figure 42. Lifting Deck of Morpeth into Place (Courtesy of Atlantia Offshore Ltd.).
4.10.5. Spar As with most other deepwater options, a spar is a floating system. Similar to the TLP and mini-TLP
designs, a spar consists of a watertight, buoyant hull supporting the production topsides. However, a spar hull is cylindrical, like an upright tube or buoy, connected to the seafloor via heavy, low-tensioned, spread mooring lines that radiate from the submerged section of the hull (see Figure 43). There are some variations to the basic hull design (e.g., a truss-spar with a lower truss section replacing part of the

63
cylindrical hull minimizing the effects of “loop” currents) but the overall concept remains the same (see Figure 44).
Figure 43. Neptune Spar (Courtesy of Kerr-McGee Oil and Gas Corp.).
Figure 44. Three Spar Configurations as Used by Kerr-McGee (Courtesy of Kerr-McGee Oil and Gas Corp.).
4.10.5.1. Limitations As with most of the floating development options, strict weight limitations exist. Because the spar
hull is long and narrow, and uses buoyancy cans for riser tensioning, there is a limited centerwell space for risers. The spar also has less equipment capacity than a full-size TLP. Spars can be installed in a great range of water depths, up to 10,000 feet.

64
4.10.5.2. Advantages The greatest advantage of the spar is its range of applicable water depths, which exceed those of most
other deepwater development options. Other advantages include
• Production Capacity. The spar has greater equipment and production capacity than a mini-TLP.
• Cost. A spar is generally less expensive than a full-size TLP.
• Mobility. A spar can be moved in an upright tow position up to approximately 100 miles to a new location and the mooring system may be reused at depths up to that of its original location.
• Stability. The spar design is inherently stable, as the center of buoyancy is located above the center of gravity.
• Dry Trees. Because of their motion characteristics, spars can use dry trees, as opposed to subsea wells, for well completions.
4.10.5.3. Disadvantages Spars are generally more susceptible to heave motion than TLP’s, making hydraulic riser tensioning
systems necessary. In addition, the deep draft of a spar hull can make the structure subject to loop currents and vibration issues, which must be accounted for in design.
4.10.5.4. Fabrication Spar fabrication consists of separate hull and topsides construction, often at different locations. The
hull is built using a truss, rolled up and covered to form a watertight column. The lower portion of the steel truss frame can be constructed and left bare so as to allow stressful currents to flow through. The upper hull portions contain the riser buoyancy cans and sealed, watertight ballasts.
The topsides is typically built using three integrated decks, each consisting of ‘skids.’ Skids are large blocks of production or drilling equipment, built in advance and later placed upon the decks and connected in accordance with functionality. These skids also contain the crew’s control rooms, office space, and living/dining areas.
4.10.5.5. Load-out, Transportation, Installation, and Piling Typically, a drilling rig will pre-drill one or more of the necessary wells, and export pipelines are laid
and buoyed for later hookup. Prior to installation, a survey is performed to define the mooring lay down area and a derrick barge will install the anchor piles using an ROV and a free-riding hydraulic hammer. The mooring lines are laid out and connected to a recovery line for later recovery and hull attachment.
Once the hull is completed, typically in Finland, it is shipped to the Gulf of Mexico on a heavy-lift vessel, sometimes in two sections due to weight and size constraints. The hull can be connected and held at an onshore GOM location until it is ready to be transported to site. Typically, it can be towed to this location using oceangoing tugs. Once in position, the ballast tanks in the hull are filled as necessary, and the structure upends (this takes approximately two minutes). Then a derrick barge places a temporary work deck on the hull to facilitate utility hook up, mooring line attachment, and riser installation. Tugs put the hull in position, the mooring lines are reeled in and attached.
The topsides are later transported to the site via material barge, and placed onto the hull by a heavy lift crane on the derrick barge. Finally, the buoyancy cans are lifted off the material barge and placed into the centerwell bay, and ballasted to production deck requirements.
4.10.6. Converted Semisubmersible Semisubmersible platforms are used all over the world as mobile work structures for drilling, lifting
and other operations. Their hulls are similar to the hull of the TLP in that they are vertical column-based floating systems with pontoons (see Figure 45, which shows the Laffit Pincay, a converted semi-

65
submersible that at the time of the photograph was stacked in Pascagoula, Mississippi). These mobile units have been converted to permanently moored platforms as an alternative to some of the other relatively deepwater development options. This is advantageous since the hull requires little retrofit and with a mooring system and upgraded topsides can relatively quickly and inexpensively be used as a production platform. One of the first converted units was the Transworld 58, which was converted and used to produce the first oil in the United Kingdom sector of the North Sea from the Hamilton Argyll field. PETROBRAS in Brazil operates about 15 semisubmersible production platforms.
Figure 45. Converted Semisubmersible Laffit Pincay.
4.10.6.1. Limitations Similar to a spar, semisubmersibles have a wide range of practical water depth applicability, up to
10,000 feet, but most of the semisubmersibles capable of being operated in such a water depth would be too expensive to purchase to consider suitable for conversion. The best candidates for conversion are older units that have water depth limits of around 2,000 feet. They are only suited to developments with subsea completions since their motion properties, and to a certain extent mooring system reliability, make them unsuitable for dry trees.
These limitations do not apply to the purpose built large deep draft semisubmersibles such as is being used to develop Thunder Horse for BP in the Gulf of Mexico.
4.10.6.2. Advantages Their suitability to a wide range of water depths and the relatively simple conversion from mobile
drilling unit to permanently moored facility are two important advantages. Other advantages include
• Risers. Semisubmersible units can handle a large number of risers compared to other development options.
• Relatively inexpensive if the correct candidate can be found for conversion when the market is down.
• Can be moved easily from one location to another if the wells pay out.

66
4.10.6.3. Disadvantages The motion characteristics of semi-submersibles make them less stable than TLP’s, and spars,
although their motions should be significantly better than many converted tankers. Additionally
• Storage. Semisubmersibles have little if any storage capability.
• Likely to be very sensitive to weight. There is always a tendency for production equipment to get heavier as a project progresses. Weight control when converting a semisubmersible is critical.
• May not be ideally suited to the location, so may have to compromise during the conversion.
• Much of the installed equipment may need to be replaced because it is technically obsolete (i.e., it may still be operational, but it does not do what is now required, and it may not be possible to get the parts to repair it).
• May require considerably more conversion than expected. Whenever converting a vessel, there are almost always unexpected surprises. These may include unexpected corrosion, cracking in critical areas, higher usage of fatigue life than expected, etc.
4.10.6.4. Fabrication Development of a converted semisubmersible platform begins with identifying a suitable drilling unit
for the conversion. Depending on the existing demand for mobile drilling facilities, this may be a difficult task since an operator may be able to make considerably more money from drilling contracts than from selling the asset, hence one is often stuck in the position of either having to pay too much, or getting a considerably less than optimum unit. Once located, the facility will be taken to a shipyard to be converted. This involves outfitting the topsides facilities with the necessary production and processing equipment, installing equipment for the mooring system, etc. Any yard capable of constructing or servicing semisubmersible drilling units are generally capable of a conversion such as this.
4.10.6.5. Transportation, Installation, and Anchoring/Piling Generally, the completed unit, including topsides, will be towed to the installation site rather than
towing the hull, installing it and then installing the topsides, which has been transported separately. These vessels were designed to be mobile in their life as a drilling unit so this process is normally relatively straightforward. Prior to the transportation of the facility, the mooring lines will have been installed with either drag anchors or one of the various pile configurations available. The lines will have been attached and readied for hookup with the hull when it arrives on station. It may be that the rig’s original mooring system can be used, but it would require very careful inspection, and even with this, there is a reasonable chance that defects will be missed. Once this has been accomplished, commissioning can begin since the topsides are already in place.
4.10.7. Deep-Draft Semisubmersible This deepwater option is similar to a converted semisubmersible platform, but is purpose-built for use
as a production platform. In most respect its properties are the same as any semisubmersible, but its hull design allows deeper draft and greater stability for the overall system. Because they are purpose built, they tend not to have some of the disadvantages of a converted semisubmersible, but at a considerably higher price.
4.10.7.1. Limitations Similar to a spar, semisubmersibles have a wide range of practical water depth applicability, up to
10,000 feet.

67
4.10.7.2. Advantages The deep-draft motion characteristics of these facilities allow the use of dry tree well completions,
although they do not necessarily use them. The main advantages are
• can be designed for almost any water depth and load carrying capability required;
• capable of huge deck and very large process capacity;
• can handle large number of wells;
• large deck area;
• can store crude in the lower hull (although this would not normally be used for export, simply to back-flush the flow lines before or after a shutdown; and
• can choose a range of construction materials (there are some concrete semisubmersible production units).
4.10.7.3. Disadvantages Although a semi-submersible can be designed for the required load capability, weight growth during
fabrication can still be a problem, as with any floating installation. Other disadvantages include the following:
• Cost will likely be expensive.
• Best suited for very large developments where other options are not as attractive.
• Mooring system is likely to be expensive, and may require the use of new materials (e.g., polyester) that are very expensive, and have not had the extent of field testing as conventional wire and chain.
• Need to use a shipyard that understands building a vessel with all the concomitant ballast and weight control systems.
• Transportation may be complicated for large units.
4.10.7.4. Fabrication Fabrication of deep-draft semisubmersibles needs to be undertaken at a proper shipyard that knows
how to build marine equipment. This is not necessarily a serious limitation, but few facilities around the Gulf Coast have the experience of facility size to build a large, deep-draft semisubmersible.
4.10.7.5. Load-out, Transportation, Installation, and Piling Transportation may be a significant issue. Most deep draft semisubmersibles will be large, or an
alternative option will have been used. But there are limits to the size of cargo that can be carried on either a barge or self propelled ship. One does not want to be in the position that there is only one vessel that is capable of transporting the unit: the costs will likely be very high, and there is no back-up should the ship/barge sink. To a certain extent, the same applies to the installation: everything will be big, so will take a long time and use expensive equipment. If using polyester line, and one mooring line is dropped, then is there a replacement available to complete the installation. Likely there will not be, unless such an eventuality has been built into the project, thereby again increasing the costs.
4.10.8. Floating Production, Storage, and Offloading System (FPSO) An FPSO is a vessel with the capabilities inherent in its name: production, storage, and offloading of
oil and gas. While there are an increasing number of purpose-built FPSO’s, the majority of facilities in use today are converted tankers that have been modified to execute these functions in deepwater environments.
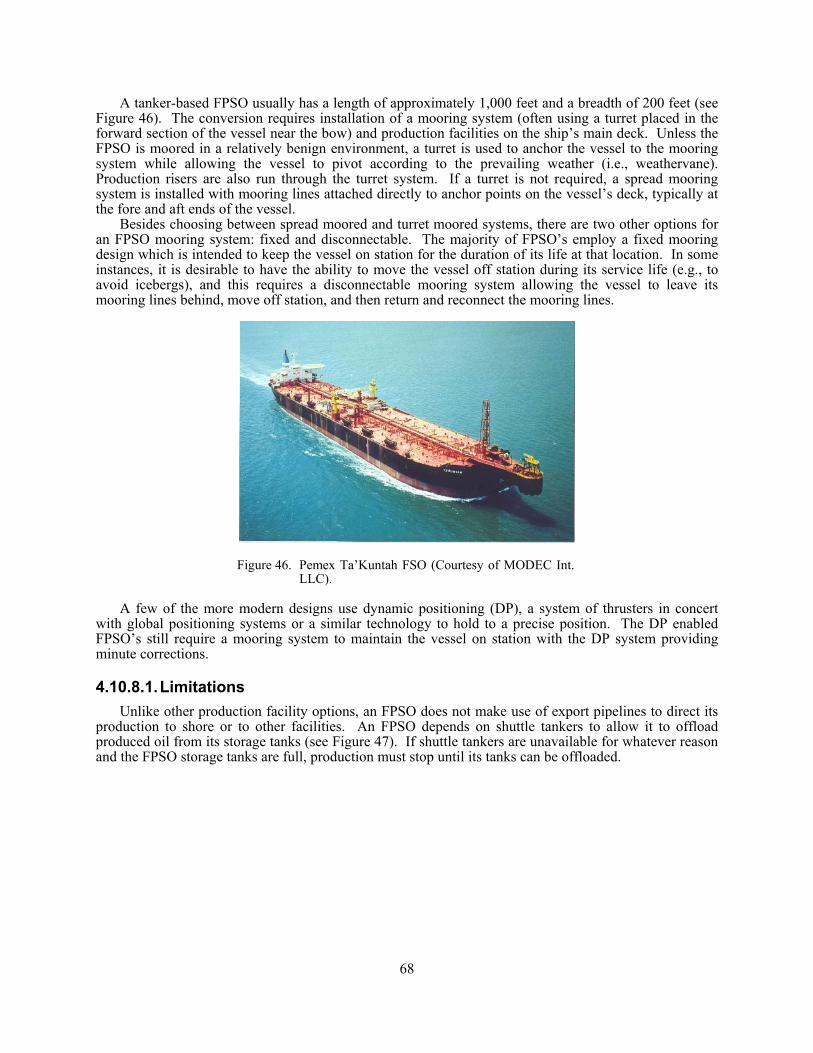
68
A tanker-based FPSO usually has a length of approximately 1,000 feet and a breadth of 200 feet (see Figure 46). The conversion requires installation of a mooring system (often using a turret placed in the forward section of the vessel near the bow) and production facilities on the ship’s main deck. Unless the FPSO is moored in a relatively benign environment, a turret is used to anchor the vessel to the mooring system while allowing the vessel to pivot according to the prevailing weather (i.e., weathervane). Production risers are also run through the turret system. If a turret is not required, a spread mooring system is installed with mooring lines attached directly to anchor points on the vessel’s deck, typically at the fore and aft ends of the vessel.
Besides choosing between spread moored and turret moored systems, there are two other options for an FPSO mooring system: fixed and disconnectable. The majority of FPSO’s employ a fixed mooring design which is intended to keep the vessel on station for the duration of its life at that location. In some instances, it is desirable to have the ability to move the vessel off station during its service life (e.g., to avoid icebergs), and this requires a disconnectable mooring system allowing the vessel to leave its mooring lines behind, move off station, and then return and reconnect the mooring lines.
Figure 46. Pemex Ta’Kuntah FSO (Courtesy of MODEC Int. LLC).
A few of the more modern designs use dynamic positioning (DP), a system of thrusters in concert
with global positioning systems or a similar technology to hold to a precise position. The DP enabled FPSO’s still require a mooring system to maintain the vessel on station with the DP system providing minute corrections.
4.10.8.1. Limitations Unlike other production facility options, an FPSO does not make use of export pipelines to direct its
production to shore or to other facilities. An FPSO depends on shuttle tankers to allow it to offload produced oil from its storage tanks (see Figure 47). If shuttle tankers are unavailable for whatever reason and the FPSO storage tanks are full, production must stop until its tanks can be offloaded.

69
Figure 47. Pemex Ta’Kuntah FSO Simultaneous Offloading (Courtesy of MODEC Int. LLC).
4.10.8.2. Advantages The primary advantage of an FPSO is its suitability to a wide range of water depths. Though most of
the units have been installed in water depths less than 3,000 feet, they have also been successfully employed in greater depths, such as in Petrobras’ Marlin Sul Field (about 4,700 feet water depth). Other advantages include the following:
• Weight Insensitive. Compared to its other deepwater floating counterparts, an FPSO is not particularly sensitive to the weight of its production equipment.
• Infrastructure Free. The FPSO’s need not be installed in areas with existing infrastructure since they don’t depend on export pipelines.
• Hull Experience. Because even new-build FPSO’s rely on a typical ship-shaped hull, there is a large depth of experience with fabrication around the world.
• Storage Capacity. The FPSO’s, by design, can carry significant volumes of produced oil in its storage tanks, much more than other deepwater options.
• Deck Space. Unlike other deepwater facilities, there is a large deck area to use for production trains. This allows greater expansion options and reduces the risk of vapor cloud explosions since equipment is more spread out.
• Mobility. It is possible to relocate an FPSO, even great distances since its typical ship shape makes it suitable for open ocean transport.
4.10.8.3. Disadvantages The primary disadvantage for an FPSO is the significant inspection costs particularly associated with
the storage tanks. Unlike other deepwater systems, the main structural system is also used to store produced oil and ballast water. Cleaning and inspecting the tanks is expensive and dangerous and impacts production operations, but is vital to maintaining the facility.
4.10.8.4. Fabrication Whether the FPSO is a new build or a conversion, the hull work will be completed in a shipyard and
follow the path very similar to that of a tanker fabrication. For a conversion, the primary hull work will involve replacing existing steelwork that has corroded or become damaged, reinforcing support points for topsides equipment, and installing a turret or other mooring attachment structures. If a turret mooring system is used, the turret will be either delivered from the fabricator as a unit to be installed or will be fabricated by the shipyard depending on the contract arrangements.

70
The topsides equipment and supports are installed in the shipyard. A process deck is installed on top of the ship main deck to provide clearance (typically about 10 feet) and to protect the process from wave impact in high seas. All the equipment, piping, etc. will be installed and readied before the unit is taken to the installation site.
4.10.8.5. Load-out, Transportation, Installation, and Piling Whether spread moored, or turret moored, the mooring lines (composed of wire rope, chain,
connectors and anchors) will be installed before the arrival of the FPSO unit. The anchors will be set in their proper location with the attached mooring lines and readied for retrieval.
As with any ship-shaped vessel, the unit will be launched from the shipyard. No lifting, upending, flooding, etc. are required as with most other floating production options since this behaves much like an ocean-going ship. However, the FPSO will typically not have the ability to move on its own (though some are equipped with dynamic positioning systems). They require tugs to tow them from the fabrication yard to the site. Once the unit is towed to the installation site, the mooring lines are retrieved and attached to the turret or the deck mounted anchor points.
4.10.9. Subsea Tieback This is the most basic development option and is used in conjunction with some other deepwater
development option (e.g., TLP or spar) or a shallower water host platform. A subsea system is a minimal structure that houses a variety of equipment (e.g., wellheads and manifolds) at the seafloor. It is designed strictly to protect the wells and direct their flow to other locations.
4.10.9.1. Limitations Subsea tiebacks require some other production facility to receive its flow and process it. They cannot
process the product and must be maintained remotely.
4.10.9.2. Advantages The primary advantage of subsea systems is their relatively low cost (compared to installing a
complete production platform) that allows them to access reserves that could not be economically exploited otherwise.
4.10.9.3. Disadvantages Unlike some of the other deepwater development options, any well maintenance must be handled
using a MODU or other drilling vessel. This leaves them subject to the prevailing rates and availability of such equipment.
4.10.9.4. Fabrication Often, a subsea system will make use of a template. The template is essentially a steel frame that is
used to house the subsea production equipment and may serve as a drilling guide. If used, the template is fabricated in an onshore facility and equipped appropriately. All the equipment, manifolds, production trees, piping, etc., is usually sourced from various manufacturers. Often the specifications of this equipment are customized to suit the particular needs of the project rather than use “stock” items.
4.10.9.5. Load-out, Transportation, Installation, and Piling If a template is to be used for the system and it is needed as a drilling guide, it will be taken to the site
and lowered to the seabed with some type of lift vessel. Typically, the template is piled in place using either driven or grouted piles.
With or without the template, drilling takes place using a drillship or semisubmersible. The wellheads, templates, flowlines, etc. are installed to complete the wells and tie back the production to a host facility.

71
4.11. FINANCING The type of financing method used is subject to significant variation based on many factors including
oil company size, cost of development, novelty of development, who the partners are, availability of cash, etc. The following section briefly discusses the most commonly used options, but it must be realized that new financing methods are being developed continually: some may be variations of existing methods, some completely new. In addition, there have been some relatively recent changes in the way partnering works. In the past it was normal for two or more oil companies to cooperate to explore and develop a specific field. Now, although with some limited success, some of the larger drilling contractors are becoming partners in a field by helping with the exploration costs, while others have subsidiaries that are acting in some respects as independent oil companies.
Not all the partners involved with a development will use the same method of financing, and the method may change during the project, or after installation. It is normal for all parties to have an agreement as to how the moneys are to be raised so that all liabilities are known by all parties.
4.11.1. Company Cash The simplest method by which an oil company might develop a field is with cash that they have on
hand, or is generated by profits as needed. This is an eminently suitable method for relatively inexpensive developments, but is not normally viable for smaller companies, or large deepwater projects. Through partnering the costs of some high value projects can be brought within the reach of smaller companies. Examples of company cash deals include Shell’s commitment in Ursa (45% working interest of $1.45 billion) or British Borneo’s commitment to a shallow water installation ($500,000). This is not meant to imply that Shell could immediately come up with the cash for such a project, but planned over time, they could meet the required draws on funds.
4.11.2. Stock Issues Another way to raise money to finance a major project is through stock issues. As an example,
British Borneo raised U.K. £54 million (about $80 million) in early 1996 and an additional U.K. £167 million (about $270 million) in July 1997 through rights issues. This money was to help fund their expansion into such projects as Morpeth and Allegheny, although there were other expansions going on at the same time. This method is particularly useful to smaller companies whose stock prices are increasing. This is not normally a project specific way of raising funds.
4.11.3. Bond Issues Companies can issue bonds as a way of raising money to pay for major projects. None of the projects
studied for this paper used bond issues as a way of raising funds.
4.11.4. Bank Loans One or all of the partners approach a bank, or consortium of banks to finance a project, somewhat
akin to taking out a mortgage. Morpeth was partially funded by bank loans. The bank will normally insist that there is an independent engineer’s “due diligence” study undertaken to verify the feasibility of the venture. Assuming nothing untoward is found, the lead bank will find additional partners to help fund the project. The details of the loans, and required guarantees vary from case to case. Some structures, like a spar or a TLP, have a potential for reuse after the field has paid out, so the bank has a real collateral interest in the structure as well as the field. In the case of a jacket-based structure, the collateral is more in the field than in the structure as the potential for reuse is extremely limited. Consequently, the thrust of the due diligence study may change depending on the type of structure being financed.
4.11.5. Sale-Leaseback In a sale-leaseback the oil company finances the particular venture through other means, but at some
stage after completion of the project, sells it to a third party, and leases it back. This releases capital to fund another project and is particularly useful for companies that are expanding relatively slowly, and want to finance a limited number of projects at a time. Additionally, the cost of money influences the
72
attractiveness of a sale-leaseback deal. Because of U.S. tax laws, it is cheaper to effectively borrow money via a sale-leaseback than through conventional means.
A sale-leaseback arrangement can also be valuable for projects that use relatively new technology. Sometimes these projects are difficult to fund through conventional loans because the banks perceive them as increased risk, and even if they will finance them, the rate may be high. To help offset this, the project is funded by other means, and once it has proved itself in operation, it can be easier to find a prospective purchaser to undertake a sale-leaseback. This purchaser will not normally be a bank, but some structured finance corporation.
The terms of the sale-leaseback vary depending on the circumstances, but normally the value of the installation is paid off, plus some effective interest, over the period of the leaseback. At the end of the period the structure must have some value within a specific range, for tax purposes. The lessee then has the option to either buy the structure back at some agreed value, normally determined by an independent appraiser, or to renew the lease. As an example, Philip Morris owns a number of offshore installations that are leased back to their operators.
It is possible for a company to raise funds through a sale-leaseback of their interest in a field, without them being the sole owner. Amerada Hess’s interest in Baldpate is an example of this.
4.11.6. Hedging Hedging is a method of protecting revenue by agreeing to sell a percentage of output at a specific rate,
regardless of what happens to the world price. By protecting the sale price, hedging ensures cash flow to pay off incurred debt. For example, British Borneo hedged by selling a percentage of its production from Morpeth at a rate of approximately $16 per barrel. As it happened, the price of oil increased sharply during the hedging period, so the company missed out on a significant amount of income, however, they protected themselves from a potential drop in prices.
An alternative to selling a percentage of production is to sell a fixed quantity at a specified price. This works as long as the price does not rise and production does not fall to below the agreed quantity to be supplied. In this situation, the company that hedged is required to buy oil at a high price and sell it at the hedging price in order to meet their commitment. Clearly this can potentially lead to very large losses.
4.12. PRELIMINARY ENGINEERING In many cases there will be significant preliminary engineering at the decision to develop stage. The
economics of the project will depend on the cost of development, and these will, in turn, depend on the preliminary engineering. In other cases, there will have been less detailed work at the earlier stage, and additional preliminary engineering will be needed to ensure technical feasibility prior to advancing. If this is the case, the purpose of the preliminary engineering is to generate sufficient information to allow the detail design to be put out to bid.
It is possible that preliminary engineering at this stage will be an extension of some of the concept assessments undertaken earlier in the project, but frequently non-design companies will be used for the concept assessment in order to prevent any conflicts. The amount of preliminary engineering, and who undertakes the work, will often depend on the type of bid sought, and how the project is planned to progress. Sometimes the oil company may undertake the work themselves. Conversely, the work may be undertaken as a steady refinement of a plan, allowing a stop at any point without too significant an expenditure.
4.13. MODEL TESTING Floating structures move with the seas, and it is important for the safe and efficient operation of an
installation to know how much it will move. There are computer programs that can predict vessel motions in a sea state, but these do not necessarily work particularly well with non-ship-shaped objects. They can be good at predicting the effects of changes in certain parameters, but normally need to be calibrated to a “base case.” In addition, there is a need to know what the loads will be resisted by the moorings or tendons, and if they will vibrate at any unexpected frequencies. These loads can be complicated and influenced by the low frequency response of the moored object. The best way to answers these questions is through model tests.

73
A model of the structure is made at as large a scale as practical, normally in excess of 1 to 100. Figure 48 shows a model of a mini-TLP being tested in a wave basin. The model will include tendons (for a TLP) or moorings (for a spar or semisubmersible) that accurately represent their properties. The model will then be placed into a model basin that is capable of generating waves and currents. The tank where tests were undertaken on Ursa, Neptune, and Morpeth, located at Texas A&M University, is 150 feet long, 100 feet wide, and 20 feet deep, with a deeper pit of 55 feet. The cost of the tests varies depending on modeling detail, number of parameters considered, etc., but were in the range of $200,000.
Figure 48. Model of a Mini-TLP being Model Tested in a Wave Basin
(Courtesy of Atlantia Offshore Ltd.).
4.14. DETAIL ENGINEERING If a concept has been decided upon in some detail prior to bidding, then there may be a separate
contract for detailed engineering. For example, Hudson Engineering (part of McDermott) did the detail engineering on the Baldpate compliant tower although they did not win all of the construction bids. In other cases, the oil company may put the concept out for bid, to include design and fabrication.
4.15. BIDDING OPTIONS There is a broad range of bidding options for the oil company, from complete project turnkey to a
detailed managed project. Some of these possibilities are discussed below.
4.15.1. Whole Project Turnkey Turnkey contracts are common in shallow water, and occasionally in deep water. The oil company
puts out a bid request for a structure capable of producing specific field characteristics. They may give some specifications for the type of structure (frequently this is implied by whom they request to bid) or may leave it very open. It is significantly less common in deep water because few companies are capable of undertaking such a project from either the risk or technical standpoint.
4.15.2. Major Packages This is probably the most common type of contract in deep water. The operator gives a number of
major turnkey or cost plus packages. A common split is Hull, Topside Design, Topside Fabrication, Pipelines, and Installation. The operator administers each package, although they may designate a specific company to act as liaison to ensure that weight and dimensional controls are maintained. The individual packages may be either fixed price or cost plus based on an estimate. On fast track projects the operator may order some of the major components, which require a longer lead time, in advance in order

74
to prevent delays. They may also split out other items that they want to control more strictly, either based on past experience, or because of known quality issues.
4.15.3. Cost Plus The Morpeth mini-TLP structure was let as two contracts, one for installation, and the other for the
completed SeaStar mini-TLP. This was a risky move by British Borneo. In the past they had worked with Atlantia on a number of shallow water turnkey contracts in which minimal platforms were installed. When they decided to move into deepwater, they formed an alliance with Atlantia to develop the SeaStar design from concept to a reality. After various original cost estimates, Atlantia was contracted on a cost plus basis to fabricate a SeaStar mini-TLP. Some of the original cost estimates were low, but the main reason for these underestimates was that the size of the TLP kept growing along with the required production equipment. This was a case of a cost plus contract based on past experience, confidence in the product, and reasonable expectations of a well managed project.
Notwithstanding Morpeth, it is unusual to have cost plus contracts because of the uncertainty of the final cost, and the high potential for cost overruns. These types of contracts are most common on time-critical projects, which are let before the design has been finalized, hence the details of scope are not known. These projects are hardest to control, and hence cost overruns most likely.
4.16. CONTRACTORS Price is very important in choosing a contractor, but it is rarely the only consideration. Clearly there
is the question of experience, capability, and other factors as discussed below.
4.16.1. Schedule Schedule is extremely important on deepwater projects. Given the magnitude of the investments,
considerable money can be spent on interest alone before production starts, and any delay can alter how a company performs financially in any given year. When considering a contractor it is important not only to ensure that they can meet the schedule, but that they can compensate for any delays that may occur. As an example, a specific yard may be capable of building a structure on schedule with its normal labor force, but delays may require an increased labor force to “make up time” that may either be unavailable in the local labor market or be unworkable if the yard does not have sufficient infrastructure to support more workers. It is not that the yard cannot meet the schedule, but they have no ability to compensate for delays that are outside their control.
4.16.2. Project Management It is critical that the chosen yard has excellent project management skills. This extends into the areas
of material traceability, weight control, scheduling, etc. Without these basics, a simple project can be brought to a halt.
4.16.3. Labor Force There are obviously the issues discussed above about having sufficient available labor to compensate
for delays, but the stability of the labor force must also be considered. Does the yard have a dedicated labor force supplemented as needed? If the yard is unionized, are all the relevant contracts in place for the duration of the required fabrication period? Could changes in government affect the labor force? If so, how stable is that government?
4.16.4. Material Supply It can be difficult to get certain materials in some yards, particularly on short notice. European
designs will often use materials that are not readily available in the U.S., and vice versa. To compound the problem, steel specifications change from country to country, and it can be difficult to get an exact match. This can lead to additional work in verifying compatibility. If only metric materials are available for an imperial designed structure, there may be an increase in weight because of the need to compensate

75
for plate sizes. Since weight control is extremely important on most deepwater structures, this can lead to serious problems later on. These issues are not insurmountable, but need to be considered.
4.16.5. Transportation Transportation is one of the highest risk operations. There have been a large number of structures lost
over the years due to problems in transportation: recently one of the Mighty Servant semisubmersible transport ships sank with a high value deck as cargo. It was due for installation by Chevron in West Africa. These vessels are considered a “safe” means of transportation, but the delays due to the loss of that deck will have cost Chevron millions of dollars. Closer is not necessarily better, but as a general rule it is safer.
4.16.6. Safety Systems A fabrication yard’s safety policy and procedures can significantly affect their suitability, particularly
when it comes to the oil company’s field surveyors.
4.16.7. Weather The weather can affect the ability of a yard to meet specifications, and to complete work. If the yard
has enclosed facilities for fabrication, then they are less affected by the weather, but high humidity can have a serious impact on the ability to produce high quality welds, and high quality painting. There is also the risk of hurricanes or other storm events causing delays in schedule and damage to the facility.
4.17. QUALITY CONTROL There are a number of different groups involved with the quality control on a deepwater development
project. These all have the same basic aim, but with different emphasis. The fabrication yard wants to produce a quality product, but for the minimum cost (assuming lump sum pricing). They will have specifications that establish how much non-destructive testing (NDT) they do on welds, the tolerance on construction, the types of materials, the methods for ensuring that correct materials are used in the right places, etc. They need to produce a quality product to protect their name, and encourage future work, but they also need to keep costs down. The fabrication certified verification agent (CVA) will be doing a similar task, but with the aim of ensuring the project meets a set of standards acceptable to the appropriate regulatory agency. The owner’s representative will want to get the best quality product achievable from the yard, however they are not necessarily tied to the specifications. They have the option to interpret the specifications, and decide that certain things outside the specification may be acceptable (i.e., they are allowed judgment). If there is a classification society surveyor involved (e.g., if the vessel is to be classed) then they will be ensuring that the structure is built to their own rules.
4.18. TRANSPORTATION As mentioned in previous sections, transportation activities are some of the riskiest tasks undertaken
as part of an offshore development, and the deeper the water the higher the risk. This is in part due to the unpredictability of weather conditions (especially in open ocean) but also due to the lack of control and recovery available should something go wrong. At sea, there are few options available if serious problems arise and the entire load (costing millions of dollars and months of work) can be lost.
However, with proper planning and execution, transportation of platforms, topsides and equipment can and is successfully undertaken. Transportation is typically discussed in terms of dry and wet. A dry tow involves a vessel large enough to transport the cargo entirely out of the water while a wet tow is performed with the cargo (e.g., a spar hull) in the water pulled by tugs.
Depending on the size of the cargo and the distance to be traveled, there are many transportation options. An ocean transport of significant size will require a heavy lift vessel to transport it. A smaller cargo over a shorter distance may only require an ocean going barge pulled by tugs (see Figure 49). In any case, proper seafastenings are required, planning of the route and coordination among the crew to handle the operation.

76
Figure 49. Shallow Water Gulf of Mexico Jacket under Tow in Bayous.
4.19. ASSEMBLY Like transportation operations, assemblies on site are also risky. While the likelihood of an error
occurring may be low, the consequences of a problem can be quite high from a safety and operational standpoint. But, as with any activity, proper planning and execution can overcome the obstacles.
The most common assembly activities on site include topsides installation, riser hookup, mooring or tendon attachment, and pile driving. Most of these activities require a vessel with lift capability. The availability and cost of such a piece of equipment will depend on the size of the load and its location. Based on the development option considered, these factors will have been taken into account at the planning stage.
4.20. INSTALLATION Listed and described below are some of the physical components necessary for a given offshore
development installation.
4.20.1. Template A template is a fabricated structure, typically rectangular in shape, that houses subsea equipment such
as trees, manifolds, and pigging and may also provide guides for drilling. The template sits on the sea floor and can range from 10 to 150 feet in length, 10 to 70 feet wide, and 5 to 30 feet high, depending on the range and the amount of equipment it houses. Templates that provide the capability of linking several wells in a building block fashion are known as “Host Templates.”
4.20.2. Tendons The TLP’s use tendons to secure their buoyant hulls to the seafloor. They are attached to the seafloor
using concrete or steel piles, which are driven into or grouted to the seafloor. Each of these piles can be as large as 10 feet in diameter and 400 feet long. One disadvantage to this type of mooring is that the tendons for a TLP are designed for a specific depth (i.e., they cannot be reused at other locations requiring different depths) and are relatively expensive compared to other mooring systems.

77
4.20.3. Tendon Connectors Tendon connectors are specially designed hardware used to attach the tendons to the anchor points at
the sea floor and at the hull.
4.20.4. Jacket As described in more detail in the sections on conventional jackets and compliant towers, a jacket is a
welded steel frame made of tubular steel members which is almost completely submerged and supports the topsides structure and equipment as well as protecting the conductors and risers. Jackets are primarily pile founded though there are also gravity base structures that rest on the sea floor and are stabilized by their own weight. Jackets are typically four and eight leg structures though six and three leg alternatives are not uncommon.
4.20.5. Deck The deck is the above-water structure of any offshore development platform. Like a jacket, it is a
welded steel frame with a mix of tubular members and other structural shapes. Typically, decks are built with several (two or more) vertical levels to support various equipment packages. The arrangement and orientation of the deck will depend on the production requirements and the supporting structure (e.g., jacket, TLP, spar, etc.).
4.20.6. Moorings Moorings as found on semisubmersibles, spars and FPSO’s are different from tendons used for
TLP’s. Moorings do not run vertically from hull to seabed, but typically radiate away from the structure for some distance. Moorings are usually composed of heavy chain and wire rope and are anchored in a variety of ways (e.g., drag anchors, driven piles, grouted piles, suction piles, etc.). Moorings are less expensive than tendons since they are not such a specialized piece of equipment.
4.20.7. Pipelines Pipelines allow production from wells to be directed to platforms, hubs, terminals, etc. Unless shuttle
tankers will be used exclusively to transport the hydrocarbons from the field, every offshore installation requires some sort of pipeline connection to another facility. Just as with onshore pipelines, offshore lines are steel tubular members of various sizes and carry oil, gas or a mixture from one location to another. Pipelines typically refer to only that portion of the flowline that rests on the seafloor, as opposed to risers, which are discussed below.
4.20.8. Risers A riser is the portion of a flowline that runs from the pipeline on the seafloor up to the platform
production area. For a jacket installation, risers are run along the outer face of the steel frame and supported at intervals with clamps. For deepwater installations, special types of risers are used due to the long distances they travel. Steel catenary risers are one type of special riser used in deepwater installations. Spars typically require risers with special buoyancy cans at the top in order to support their weight. Whatever system is used, risers are part of the flow of hydrocarbons from one installation to another.
4.20.9. Subsea Wells Subsea wells have their wellheads at the seafloor (either as part of a subsea template or alone) as
opposed to dry wellheads that sit above the water on platforms. For wells away from the production facility that cannot be reached by directional drilling, subsea wells are the only way to produce the hydrocarbons.

78
4.21. COMMISSIONING Commissioning is the process of completing and testing the installation and function of the operations
side of the facility—as opposed to its structural side.
4.21.1. Topsides Once the facilities have been transported to site and installation is complete, the commissioning
process begins. All the production and processing facilities must be hooked up and tested to assure their proper function. Transportation and installation are considered in their design, but these activities may cause problems with these systems, e.g., fittings that have worked loose, supports that have been damaged, etc. Addressing these issues is part of the commissioning that must take place before the facility becomes operational.
4.21.2. Pipelines As discussed in earlier sections, pipelines are the primary means of transporting produced
hydrocarbons from wells to the platform and from the platform to other facilities (either offshore hubs or onshore terminals). Whether installed prior to the facility installation or after its arrival, the pipelines must be commissioned just as the topsides facilities. Connections to risers must be completed and functionality tests run. This may involve the use of “pigs,” which are run through the lines to determine its fitness.
4.21.3. Risers Risers connect the topsides production facilities with the pipelines at the sea floor. Like pipelines, the
risers must be connected and tested after installation of the facility to allow production to begin. Depending on the development option used, some risers may be preinstalled with the structure to facilitate this commissioning process. Otherwise, the risers must be installed on site once the facility is in place.
4.22. DEVELOPMENT DRILLING Earlier in this document, exploratory drilling was discussed as a method of defining, in greater detail,
the production prospects of a field. Development drilling is the more involved process of drilling the production wells for the field. Depending on the development option chosen, the development drilling activities will be accomplished from the platform itself, or using a mobile offshore drilling unit or drill ship. Platforms, compliant towers, TLP’s, mini-TLP’s, spars and deep-draft semisubmersibles are capable of having dry tree wells with drilling operations taking place from the topsides. Other development options require a drilling vessel to drill and complete the wells.
If drilling is to be completed using a drilling vessel, these wells may be completed before the installation of the facility. All commissioning activities must be coordinated with the development drilling activities since both activities must be accomplished before production can begin on a facility.
4.23. OPERATIONS While the earlier stages of the development chronology are important to a project’s success, the
operations are the money producing activities that last from first oil until decommissioning. Successful and efficient operations are key to the profitable development of a field. These operations encompass a wide range of activities from drilling, production and processing to maintenance, repairs and upgrades.
4.23.1. Production and Processing Ensuring the regular flow of hydrocarbons from the wells and processing the production so it can be
transferred to other facilities is the primary function of the platform operations. Production activities include water and gas injection for those wells that are not free flowing, flow assurance activities such as flowline maintenance, etc. Processing primarily involves separation of the production into water, oil and gas, compression of gas production to facilitate transport, re-injection of produced water, etc.

79
4.23.2. Well Maintenance If the development option allows it, well maintenance may be performed from the production facility.
This activity must be coordinated carefully with the ongoing production activities since some drilling and production activities should not be performed at the same time due to the risk to personnel and equipment. Fewer limitations exist when the well maintenance activities occur from a drill vessel, which would be the case for remote wells, or development options that don’t support drilling activities.
4.23.3. Maintenance and Inspection In order to keep the facility operating efficiently and effectively, a comprehensive maintenance and
inspection program is necessary. These activities should be focused on proactively addressing maintenance needs to minimize the need for repairs and replacements. Inspections are an important part of this process and include both above and below water visual and non-destructive testing techniques.
4.23.4. Supply Boats The most efficient method of delivery the large amounts of consumables and other supplies needed by
a large offshore development platform is through the use of supply boats. The increasing need for more capable vessels to service deepwater facilities has led to improvements in the supply boats themselves and the crews that operate them. This has been made possible, in part, by the long-term contracts given to supply operators allowing them the revenue stream to invest in assets and training. Improvements include more reliable better maintained vessels, more use of dynamic positioning systems, larger and better trained crews, and greater cargo capacity (see Figure 50).
Figure 50. Supply Vessel Amy Chouest at Dock.
4.23.5. Crew Changes Deepwater development operations involve fairly large crews (50 persons or more). Because of the
logistical challenges and the size of the crews, crew changes are minimized as much as possible by extending the shifts served by each crewmember. Helicopters are the primary method of facilitating crew changes for deepwater operations because they offer greater speed and flexibility than crew boats.
5. SHALLOW WATER VS. DEEPWATER Based on the different economic, technological, operational and safety factors involved in offshore
operations, there are significant differences between how a shallow water facility and a deepwater facility are planned, built, installed and operated. This section addresses the differences seen in specific areas of an offshore development when operating in shallow water versus deepwater.

80
5.1. MANNING The driving factors behind manning levels in shallow water versus deepwater are distance and
production. Because many shallow water platforms are close to shore, they can economically be manned during the day only, with crews coming aboard via helicopter or even supply boats. The distances required to reach deepwater platforms make this kind of partial manning impractical both from a cost and an operational standpoint.
Production is the overriding factor determining manning requirements. Many shallow water platforms have no processing capacity at all, or minimal capacity and act merely as well protectors with the production redirected to hub platforms or to shore-based facilities. There is no need for a crew on these facilities and they are typically only visited for maintenance purposes. On a deepwater facility this is never the case. In order to be feasible economically, the production rates must be high and there must be processing capability to handle the hydrocarbons. This requires manning on a 24-hour basis with a significant crew size (e.g., 50 or more). Additionally, more maintenance is required for the significantly larger and more complex facilities found in deepwater compared to shallow water structures. This also requires a dedicated work force.
5.2. SUBSEA Subsea systems (e.g., wellheads, manifolds, etc.) are useful for producing wells that can’t be reached
by more conventional methods. However, they add more complexity to the process of installation, production and maintenance, and this increased complexity brings increased cost. The typical shallow water production in the Gulf of Mexico does not generate enough return to offset this increased cost, so subsea systems are less attractive in this environment.
For deepwater production, the greater production levels make the use of subsea more economical. It may be relatively straightforward to install a minimal structure (e.g., a caisson or well protector) in shallow water to develop a field not accessible from existing infrastructure. But in deepwater, the subsea systems are the only minimal structures available. The cost of a new development structure for deepwater may not be justified by the potential production, but a subsea system could be installed at much lower cost and tied back to an existing facility.
5.3. PIPELINES AND GAS The primary means of directing production from offshore facilities to onshore facilities is through the
use of pipelines. Every potential field development must consider the availability and suitability of pipelines to handle the produced hydrocarbons.
For shallow water developments, there is a network of pipelines available that has been installed over the more than 40 years of Gulf of Mexico production. If the company does not own their own pipelines, fees can be paid to the owners for their use in what have become fairly standard arrangements. Typically, only a short pipeline is required in order to tie the new production into the existing network. While any pipeline work is costly and requires specialized equipment, it is a fairly straightforward process and can be completed by a number of contractors.
Deepwater developments are no different in their need to transport their product, but their options are more limited and more costly. There are far fewer deepwater developments compared to shallow water, and the existing network of pipelines that serve them is smaller and more spread out. In order to tie into this network, or create a new path to a hub platform in more shallow water is costly in terms of time, materials and equipment.
Besides the cost differences between deepwater and shallow water pipeline systems, there are other considerations somewhat unique to deepwater operating environments. Hydrostatic pressure, temperature, and material weight are important considerations. The system design must address the large pressures that can crush the material. Temperatures in deepwater environments can cause flow restrictions inside the pipelines. And the large volume of materials required to connect subsea systems to platforms, and deepwater production to hubs, involve weight that cannot be carried by more conventional shallow water systems. Though these effects also must be considered in shallow water developments, they are not as critical.

81
5.4. INFRASTRUCTURE Over the many years of production in the Gulf of Mexico, a significant infrastructure has been built
up along the Gulf Coast to serve the industry. Companies of all sorts (e.g., diving, repairs, equipment, food services, etc.) thrive in a relatively competitive environment giving operators a choice of provider for most of the services they require. But the bulk of these companies operate almost exclusively in the shallow water arena. The number of companies with the capability and experience to operate in deepwater is much smaller. As a result, shallow water facilities have an advantage in being able to obtain a more competitive price for these services than deepwater facilities.
As an example, look at underwater inspection services. All facilities in the Gulf of Mexico have inspection requirements that must be met and there are a number of companies that can offer those services. The bulk of underwater inspections for shallow water facilities can be accomplished by divers operating from a dive boat in one or two days. These services can be contracted months in advance or, if available, only days in advance using a “vessel of opportunity.” However, for deepwater facilities, many underwater inspections must be accomplished using remote operated vehicles (ROV) that can descend much further than a diver. These operations can be accomplished by a far fewer number of companies and require much more planning and expense.
5.5. DRILLING As with most of the comparisons between shallow and deepwater facilities, the differences in drilling
are driven by costs. Shallow water facilities are serviced by a number of experienced drilling contractors that offer a well-understood service. Operators can draw upon a fairly large equipment base (e.g., jack-up rigs). All of these things work to keep costs within a fairly manageable range which is necessary given the relatively low production rates generated by shallow water developments. Deepwater drilling contractors are fewer in number, their equipment is less plentiful, and their costs in time, materials and manpower are greater.
5.6. PLATFORMS The advantages and disadvantages of the different types of platforms available for a deepwater
development have been discussed earlier in this document. The same sorts of factors used to differentiate deepwater options can also be used to differentiate shallow water options from deepwater options. In shallow water it is possible to install a minimal platform, capable of producing five wells for around $1 million. Such a facility would be tied back to some other complex, so it would not be manned and would be fitted with only minimal processing equipment. Such a facility would probably produce up to about 5,000 bbls/day. Given the relatively low cost of these platforms, it may be cheaper to install a few of these, connected by pipelines, rather than installing a larger platform producing from directional wells. Figure 51 shows a “large scale” minimal platform that has been designed for up to 650 feet water depth, and up to 25,000 BOPD; however, the cost would be closer to $10 million than $1 million.
Because everything in deepwater is more expensive, the type of scenario described above would not be feasible in a deepwater environment. A platform producing only 5,000 bbl/day would not produce sufficient return to make a profit in deepwater. To exploit the larger reserves needed for a deepwater development platforms need to be capable of carrying larger process equipment, with more throughput and the fewer platforms required the better.
To connect several structures in shallow water via pipelines requires a simple pipelay barge at a cost of around $30,000 per day. In deepwater, a semisubmersible installation vessel would be needed that may cost over $300,000 per day. So directional drilling becomes more attractive in deeper water to allow production of more wells from a central platform. Those that are too far away, or too complex to drill, may be produced through a subsea wellhead that is connected to the platform via a flowline. In the end, to make the investment pay off you’re more likely to end up with a single platform, manned 24 hours a day, producing close to 50,000 bbl/day. And the cost for such a platform may be in the area of $150 million.
This is a broad example used to illustrate a point and there are exceptions. The Cantarell field in the Bay of Campeche (Southern Gulf of Mexico) is mainly located in 150 feet water depth, but because of the huge size of the reservoir, and the extremely high production rates, these shallow water platforms are

82
large and clumped together to form bridge-connected complexes (see Figure 52). Also, in harsh environment areas, the arguments do not hold true as each platform is more expensive, and more likely to need to be permanently manned. (The risk and cost of using day visits is too high, and may often be prohibited by the weather.)
Figure 51. SeaHarvester Minimal Platform (Courtesy of Sea Horse Platform Partners Ltd.).
Figure 52. Platform Complex in Cantarell Field, Mexico.

83
5.7. WORKOVER A producing well will normally require some maintenance during its life. For example, the well may
penetrate various production zones, and, as one is depleted, the oil company will want to start producing from others. It may not be possible to complete and produce from multiple zones at the same time as they may be at different pressures which would result in hydrocarbons flowing from the higher pressure reservoir to the lower pressure one, with a consequent reduction in total production at the surface. In addition, the zones may be producing different products that the company may not want to “co-mingle.” Maintenance of an existing well may necessitate re-perforating (breaking up the rock formation around the well in order to allow the oil to flow into the production tubing) or other methods of stimulating recovery. All this requires workover.
On a shallow water platform in the Gulf of Mexico, it is normal to bring a jack-up drilling rig alongside the platform, cantilever the derrick over the stern of the jack-up and out over the platform, and allow the derrick direct access to the wells, with all the drilling support equipment19 being contained on the jack-up. Given that all this equipment is supported on the jack-up, the platform does not have to be designed for the additional drilling weight, hence it can be much smaller and cheaper. The jack-up may cost in the range of $20,000 to $50,000 per day, depending on its size and the going rates, but that is inexpensive in comparison to the extra cost that would be associated with building a platform capable of supporting all the personnel and equipment required to work on the wells. Indeed, this ability to get access to the wells with a jack-up is one of the reasons that it is economic to use a relatively large number of small platforms in shallow water.
In deepwater, there are a number of alternative solutions to the workover issue. The large platforms, like full-size TLP’s and most of the spars, have a drilling package mounted on the platform. This drilling package does most of the development drilling, and may be permanently mounted so that it can do the necessary workover. On the Baldpate compliant tower, a drilling package was installed soon after tower installation to complete the wells, but the intent was to remove it after these had been completed. To achieve this, Amerada Hess hired a drilling contractor to install their drilling rig and undertake the work. If at a later stage it is necessary to do additional drilling, then the rig can be brought back out to the platform, and re-installed. This way they are not saddled with the cost of purchasing and running a drilling package that will only be useful for a limited time. The rental cost for a platform rig will vary depending on the size of the equipment, complexity of the wells, etc., but will normally be in the range of $20,000 to $40,000 per day. This approach of a platform mounted drilling rig is often used in water depths that are too deep for a jack-up, although in some cases the platform rig will be supported by equipment mounted on a drilling tender, a barge that floats next to the platform. The disadvantage of using a drilling tender is that there is an increase in the amount of downtime due to weather, particularly in the winter months.
The small TLPs, and some of the other minimal deepwater development options, use a floating mobile offshore drilling unit (MODU) to do their development drilling and workover. In the case of the Sir Douglas Morpeth mini-TLP, the wells were located approximately 1,500 feet south of the facility. The hydrocarbons are produced through flexible flowlines that run from subsea completions up to the platform. After processing, they are exported through steel catenary risers (SCR) to export pipelines to a shallow water production facility. If the wells need maintenance, a semisubmersible is brought in to re-enter them, and carry out the additional work. The great advantage of this approach is that, like the shallow water platform, the structure does not need to be designed for the additional weight of the drilling package. The downside is that the cost of a deepwater semisubmersible drilling unit is much higher than the cost of a platform rig. A semisubmersible will likely cost between $50,000 and $120,000 per day depending on water depth and availability. In deepwater there are significantly fewer units capable of doing the drilling work, so their rates tend to be higher, but also subject to availability. Given that a
19 This may be the full set of equipment required to drill a well, including mud pumps, shale shakers, blowout prevention equipment, electrical power generation, storage of all the consumables in both the sack store and bulk store, drilling crew and accommodation, drill pipe, etc.

84
deepwater well on a small platform may be producing at 20,000 bbd, downtime for that well will cost $300,000 per day at $15 per bbl20, so delays caused by unavailable rigs can be very expensive.
5.8. BLOWOUTS The potential for deepwater blowouts is a much-studied issue. The MMS has funded the first stage of
a study being undertaken by Global Petroleum Research Institute (GPRI), the Offshore Technology Research Center (OTRC), and Texas A&M University to look at some of the issues associated with a deepwater blowout. It has been suggested that in the OCS there is one blowout for every 285 wells21. So far there have been no deepwater blowouts, although there have been a number of cases of sub-surface cross flow, where hydrocarbons have migrated from one formation to another because of downhole problems. However, there is no real reason to believe that there will not be a blowout, and the question then becomes, how it can be controlled.
In shallow water there are a number of alternative control measures available depending on the circumstances of the blowout, and plenty of drilling units available for use in shallow water. Conversely, in deepwater not only are the options more limited, there are few units capable of operating at the required water depths. It may be that there are only one or two drillships capable of drilling in 10,000 feet water depth in the Gulf of Mexico at any given time, so the availability of a unit to undertake a dynamic kill22 is extremely limited, not counting the time taken to drill the intersecting well (which may be 25,000 feet below the seabed).
The issue of deepwater blowouts is complicated, and starting to get the serious study that it deserves. The intent of this very brief discussion is to establish that there are significant differences between shallow water blowouts and deepwater blowouts, but not to go into great detail. There are many other potential differences that are being studied. For example, a relatively large percentage of blowouts in shallow water “bridge over”23 (approximately 40%). It may be that the same could be said for deepwater wells, but it is not clear that that is true. The issue is complicated because the pressure gradient inside a deepwater well will be much lower than in a shallow water well, and a high pressure gradient leads to high flow rates, and an increased potential for bridging. Combine that with the different formations, and their propensity to collapse, and it is certainly not clear how deepwater wells would react in the event of open flow.
5.9. EVACUATION The issue of evacuation has been debated many times over the years. There are those who swear that
the reason offshore installations are evacuated dates back to the early days of the industry when the offshore workers were needed onshore to help their families prepare for the hurricane’s arrival, or even evacuate the area. There are others who state that the perceived reliability of early offshore structures was
20 There is always discussion regarding the effects of “loss of production.” There are those who argue that production is not lost, only delayed. Since the oil is in the ground, you can just get it out later. The other side of the argument is that the facility has been cost modeled based on certain production rates. If those rates are reduced for any reason, there is a cash flow crunch – all the debt associated with the installation needs to be serviced, but there is no money flowing in to service it. This is a real loss, and may cause the costs associated with the debt to increase, hence there is potentially an actual loss due to the delayed production. 21 Podio Study of 1996. The statistics were presented at a deepwater blowout industry workshop on 15th August 2002. Details of the presentation can be found at http://pumpjack.tamu.edu/gpri/index.html. 22 A hole is drilled to intersect the well that is blowing out, normally close to where the hydrocarbons are entering the hole. Water is then pumped down the hole at a very high rate such that the back-pressure induced as the water flows up and out of the blowing well causes the hydrocarbons to stop flowing into the well. 23 Bridging is simply the case where the well gets blocked with formation rock that flows into the well with the blowing out hydrocarbons. The pressure gradient is change in pressure, with respect to the distance, between the bottom of the hole, and the “surface.” In shallow water the “surface” may actually be at atmospheric pressure. In a deepwater well, the “surface” will be at the seabed, under 10,000 feet of water. If the deepwater and shallow water wells are at the same depth below the seabed, then the pressure gradient will likely be much greater on the shallow water well.

85
too low, and that evacuation was needed to protect the offshore workers. Yet others state that regulators mandate evacuation. Regardless of the real reasons, there are certain facts about all precautionary hurricane evacuations from offshore platforms:
• In the event that a platform is hit by a hurricane, there is little that a crew could do onboard a platform, FPSO, or other installation apart from being inside a protected area. The wind force on a man in a 60-knot wind (about 70 mph) is roughly 70 pounds. This increases to approximately 200 pounds in a wind of 100 knots (115 mph). In addition, any loose objects will be flying around making open areas extremely dangerous. All processing should have been shut-in before transit of the storm, so little assistance could be given there. There is a possibility that on certain moored vessels, some limited actions could be taken to reduce the probability of a mooring failure.
• Precautionary evacuations are associated with some risk – there have been people killed and injured during these evacuations. It is not to be inferred that staying offshore is necessarily safer than evacuation to shore, but there are inherent risks associated with any movement of personnel.
• The potential for legal action by injured parties needs to be very carefully considered when discussing the merits or otherwise of precautionary evacuation.
• As structures move further offshore, there is an increased need to plan evacuations such that those furthest offshore do not get stranded as those closer in are evacuated. This is discussed in greater detail below.
Most of the shallow water Gulf of Mexico is relatively close to land such that a helicopter can fly out to a platform and back to land on a single tank of fuel. This is important because whenever a helicopter takes off, it must always have sufficient fuel to get back without having to take on additional fuel. This is to allow for unexpected eventualities that disallow landing at the expected destination (e.g., severe weather, fog, fire at the facility, etc.). Most shallow water facilities are located close enough that as long as they have a refueling facility, they meet this criterion. The same cannot be said for many of the deepwater facilities. In order to fly out to these, the helicopter must take on fuel part way out in order to have sufficient for the return flight.
Consider now a platform that is used as the refueling station for another platform further offshore. If the refueling platform is threatened by a hurricane, it is necessary to evacuate both the nearshore platform, and the deepwater platform that it “serves.” In addition, the deepwater platform has to be evacuated first so that there are personnel on the inshore platform to refuel the helicopter. While this is not complicated for a few platforms, a major hurricane threatening a large area of the Gulf could lead to relatively complex logistical issues. In addition, there is a possibility that the near shore platforms could be evacuated by supply and crew boats. The boats will generally want to run for shelter in the event of severe weather (unlike large ships which will often put to sea when threatened by hurricanes), but can often help with the evacuation of close in platforms. Given that most supply boats will have a cruising speed of only about 12 knots, and the speed of a rapidly moving hurricane may be close to 12 knots, they will generally not want to wait offshore for too long before heading for home.
There has been talk about having offshore bases that could be used for supplies, and as evacuation “ports” in the event of a hurricane. The intent would be that personnel are evacuated to these facilities, but remain offshore through the storm. While such a facility may be used in the future, none exist at present, so evacuation, and precautionary evacuations need to be carefully planned for the far offshore deepwater facilities.

References

89
The following is a list of some of the more important documents accessed during the course of this project. Many of the papers were published at various Offshore Technology Conferences where new technology is often given an entire sessions, with six or more papers dedicated to the one subject. Much of the unreferenced information used was supplied directly by the companies approached, and hence cannot be given a public reference. Individuals closely associated with the particular projects supplied additional information. Some information was obtained off the Internet; but in most cases, this was subject to confirmation prior to its use. Some companies (particularly Shell) directed the authors to their web site as an official source of information. In these cases, the information was not subject to additional confirming research. Only a limited number of newspaper/periodical articles have been included, and only those that were found to be of particular relevance. Clearly, the authors are continually reviewing the trade press and much background information is gleaned from it.
Beckmann, M.M., M.L. Byrd, J. Holt, J.W. Riley, C.K. Snell, C. Tyer, and D. Brewster. 1996. Pompano
subsea development: Template/manifold, tree & ROV intervention systems. Paper No. 8205, presented at the Offshore Technology Conference, Houston, TX.
Bevan, J. 1997, July 20. Miracle man from British Borneo city profile – Alan Gaynor has turned a quirky little shell company into Britain’s third largest independent oil producer. The Sunday Telegraph, London.
Burke, R.G. 2000, February. Back to the cradle. Offshore Engineer, 22(4 pages). Business Wire. 1997, October 1. Gulf Island fabrication announces letter of intent for British Borneo’s
Allegheny field SeaStar TLP. Carminati, J.R., L.F. Eaton, K.A. Folse, and R.E. Sokoll. 1999. Ursa TLP well systems. Paper No.
10758, presented at the Offshore Technology Conference, Houston, TX. Davies, K. and M. Srivareerat. 1999. Morpeth SeaStar: foundation and tendon systems. Paper No.
10856, presented at the Offshore Technology Conference, Houston, TX. de Koeijer, D.M., D. Renkema, J.C. Edel, C.H. Willis, and D. Payne. 1999. Installation of the Baldpate
Compliant Tower. Paper No. 10919, presented at the Offshore Technology Conference, Houston, TX.
Digre, K.A., R.M. Kipp, R.J. Hunt, S.Y. Hanna, J.H. Chan, V. Rosen, and C. van der Voort. 1999. Ursa TLP, tendon & foundation design, fabrication, transportation and TLP installation. Paper No. 10756, presented at the Offshore Technology Conference, Houston, TX.
Edel, J.C., S. Thibodeaux, F. Sezer, J.D. Payne, and C.H. Willis. 1999. Fabrication of the Baldpate compliant tower. Paper No. 10918, presented at the Offshore Technology Conference, Houston, TX.
Ganguly, P., L. Goldberg, and B. Wood. 1997. The Pompano subsea inspection. Paper No. 8469, presented at the Offshore Technology Conference, Houston, TX.
Gatlin, M.E. 1999. Operations role in the design and commissioning of the Ursa TLP. Paper No. 10759, presented at the Offshore Technology Conference, Houston, TX.
Glanville, R.S. 1996. The Oryx spar Vioska Knoll Block 826. Society of Naval Architects and Marine Engineers Offshore Symposium, Texas Section.
Glanville, R.S. and R.D. Vardeman. 1999. The Neptune spar – performance over the first two years of production. Paper No. 11073, presented at the Offshore Technology Conference, Houston, TX.
Gottung, P.W., K.A. Digre, R.A. Hughson, M.S. Lindsay, and H. Schipper. 1999. Ursa TLP topside-module installation and hull-deck-rig integration. Paper No. 10757, presented at the Offshore Technology Conference, Houston, TX.
Grimond, M. 1997, July 17. British Borneo to raise pounds 167 m from shareholders. Independent, London, Page 23.
Hart’s Daily Petroleum Monitor. 1998, October 21. British Borneo field onstream. Hosey, J. 1996, October/November. A mate’s life on a Gulf supply boat. Professional Mariner, 21:11.
90
Hunt, M. and L. Gary. 2000, January. Gulf of Mexico fabrication yards build 5,500 platforms over 50 years. Offshore, 60(1): 94.
Jefferis, R.G., K.A. Digre, and J.P. Haney. 1999. Ursa – team-based project management – overcoming adversity in 4000 ft. of water. Paper No. 10753, presented at the Offshore Technology Conference, Houston, TX.
Kennefick, J., P. Lang, and D. Harvey. 1999. Morpeth export system. Paper No. 10859, presented at the Offshore Technology Conference, Houston, TX.
Kibbee, S.E, S.J. Leverette, K.B. Davies, and R.B. Matten. 1999. Morpeth SeaStar Mini-TLP. Paper No. 10855, presented at the Offshore Technology Conference, Houston, TX.
Knott, T. 2000, January. SAW cuts against the grain. Offshore Engineer, 28 (2 pages). Kocaman, A., E. Verdin, and J. Toups. 1997. Neptune project: spar hull, mooring and topsides
installation. Paper No. 8385, presented at the Offshore Technology Conference, Houston, TX. Kypke, D.A. 1995. Tension leg platforms, in the beginning... Society of Naval Architects and Marine
Engineers Offshore Symposium, Texas Section. Le Blanc, L. 1996, November. Spar-shaped drilling unit designed for 8,000-10,000 ft depth corridor.
Offshore, 56(11):30 Lehtinen, T. 1997. Spar hull construction. Society of Naval Architects and Marine Engineers 5th
Offshore Symposium, Texas Section. Lochte, G., T. Dean, D. Gray, C. Kochenower, C. Loper, and O. Tarlton. 1999. Morpeth subsea
production system. Paper No. 10858, presented at the Offshore Technology Conference, Houston, TX.
Major, R.A., G.R. Frazer, J.E. Taylor, and J.A. Mercier. 1999. World’s fifth TLP to achieve classification. Paper No. 11072, presented at the Offshore Technology Conference, Houston, TX.
Means, E. and B. Wright. 2000, January 14. Aker and J Ray kill off spars. Upstream, 5(02):7. Oil & Gas Journal. 1994, September 5. BP installs big pompano platform in Gulf of Mexico, 92(36):34. Oil & Gas Journal. 1995, March 13. Economics and technology spark deepwater projects in Gulf,
93(11):25. Oil & Gas Journal. 1996, September 9. Deepwater experience, prospects outlined, 94(37):35. Preston, S.M., T.D. Caldwell, M.M. Beckmann, R.F. Coffman, D. Hanks, and C.L. Hebert. 1996.
Pompano subsea development: An example of how successful client/contractor relationships result in effective project execution. Paper No. 8204, presented at the Offshore Technology Conference, Houston, TX.
Professional Mariner. 2000, December/January. Gulf coast mariners have a new voice, 45:16. Redfern, I.J., D.E. Calkins, and R.B. Matten. 1999. Morpeth SeaStar installation. Paper No. 10857,
presented at the Offshore Technology Conference, Houston, TX. Rigden, D. 2000, February 11. Sinking Borneo sends a mayday. Upstream, 5(06):31. Simon, J.V., J.C. Edel, and C. Melancon. 1999. An overview of the Baldpate project. Paper No. 10914,
presented at the Offshore Technology Conference, Houston, TX. Smith, P.L., S.B. Hodges, and K.A. Digre, B.A. Sarwono, and H. Schipper. 1999. Ursa TLP hull design,
fabrication, and transportation. Paper No. 10754, presented at the Offshore Technology Conference, Houston, TX.
Upstream. 2000, January 21. Pompano opens door for Mica. 5(03). Wall Street Journal. 1994, November 10. Oryx Energy to use a floating system in Gulf of Mexico.

91
William, J., F. Roach, V.C. Knight, G.E. Lochte, S.E. Kibbee, and N. Mackintosh. 1999. Morpeth field development overview. Paper No. 10854, presented at the Offshore Technology Conference, Houston, TX.
Wright, B. 2000, February 11. McDermott hits Typhoon jackpot. Upstream, 5(06):12. Wright, B. and E. Means. 2000, January 7. Statoil heads for deep-water exit. Upstream, 5(01):2. Vardeman, D., S. Richardson, and C.R. McCandless. 1997. Neptune project: overview and project
management. Paper No. 8381, presented at the Offshore Technology Conference, Houston, TX. Zimmer, R.A., R.F. Figgers, J.F. Geesling, H. Kim, D.H. Yeung, Z. Banatwala, G.A. Sidwell, J.A. Stout,
B.W. Harris, and M. van Vught. 1999. Design and fabrication of the Ursa TLP deck modules and TLP hull upper column frame. Paper No. 10755, presented at the Offshore Technology Conference, Houston, TX.

A-1
Appendix

A-3
GEOGRAPHY
Jefferson Orleans Plaquemines St. Bernard St. Charles St. James St. John the Baptist St. Tammany
Ascension East Baton Rouge East Feliciana Iberville Livingston Pointe Coupee St. Helena Tangipahoa Washington West Baton Rouge West Feliciana
Assumption Lafourche Terrebonne
Acadia Evangeline Iberia Lafayette St. Landry St. Martin St. Mary Vermilion
Allen Beauregard Calcasieu Cameron Jefferson Davis
Avoyelles Catahoula Concordia Grant LaSalle Rapides Vernon Winn
Bienville Bossier Caddo Claiborne DeSoto Lincoln Natchitoches Red River Sabine Webster
Caldwell East Carroll Franklin Jackson Madison Morehouse Ouachita Richland Tensas Union West Carroll
Figure A-1. Data for the 1998-2008 Employment Projections Cover the State of Louisiana and the Eight Regional Labor Market Areas (RLMA’s).
* *
* Please note: The geographic make-up of these areas have been redefined; therefore, data are not comparable to previous projections. (RLMA 1 now includes the parishes of St. Charles, St. James, and St. John the Baptist. RLMA3 now excludes parishes St. Charles, St. James and St. John the Baptist.)

A-4
GEOGRAPHY
RLMA 3 Houma MSA
Figure A-2. Houma Metropolitan Statistical Area (MSA) Includes Lafourche and Terrebonne Parishes Compared to Regional Labor Market Area 3 (RLMA 3), which also Includes Assumption Parish.

A-5
Table A-1
Regional Labor Market Area and Houma Metropolitan Statistical Area—1999 Wage Comparison
RLMA 3 Houma MSA
SOC-Code
Occupational Title Total # Empl.
Mean ($/hour)
Entry ($/hour)
Median ($/hour)
Experience ($/hour)
Annual $ Total # Empl.
Mean ($/hour)
Entry ($/hour)
Median ($/hour)
Experience ($/hour)
Annual $
Management Occupations 11-1011 Chief Executives 280 41.18 23.88 32.80 > 70.00 85,657 270 39.75 22.95 30.49 > 70.00 82,690 11-1021 General & Operations Managers 1,820 25.39 16.90 21.62 32.30 52,804 1,720 25.08 17.21 21.21 31.57 52,160 11-1031 Legislators * 5.96 5.75 6.17 6.58 12,398 * ** 5.55 5.95 6.35 11,960 11-2011 Advertising & Promotions Managers 30 36.77 24.64 35.79 42.69 76,477 30 35.47 23.77 34.54 41.18 73,780 11-2021 Marketing Managers 50 22.86 17.34 23.35 26.23 47,540 50 22.05 16.73 22.53 25.30 45,870 11-2022 Sales Managers 390 28.25 17.10 25.44 35.39 58,756 390 27.25 16.50 24.54 34.14 56,690 11-3011 Administrative Services Managers 110 18.09 10.18 17.20 24.49 37,624 110 17.14 9.74 15.48 22.54 35,660 11-3021 Computer & Information Systems
Managers 40 23.72 18.60 21.48 26.20 49,343 40 22.88 17.94 20.72 25.28 47,600
11-3031 Financial Managers 180 26.81 13.90 21.37 33.93 55,764 170 26.13 13.34 20.91 33.57 54,340 11-3040 Human Resources Managers 60 24.05 17.92 22.99 31.37 50,020 60 23.05 17.16 22.01 29.76 47,940 11-3051 Industrial Production Managers 110 25.71 18.60 25.12 34.26 53,474 110 24.70 17.73 24.11 32.83 51,370 11-3061 Purchasing Managers 80 21.58 13.85 19.66 29.64 44,882 70 20.67 13.29 18.76 28.22 42,990 11-3071 Transportation, Storage, & Distribution
Managers. 50 19.40 16.09 19.30 22.51 40,354 50 18.72 15.52 18.63 21.73 38,930
11-9021 Construction Managers 80 24.23 19.60 22.31 26.11 50,392 80 23.37 18.91 21.52 25.19 48,620 11-9041 Engineering Managers 70 29.34 21.44 30.68 35.60 61,019 * 29.14 21.08 29.94 36.33 60,620 11-9051 Food Service Managers 130 12.23 8.50 10.41 15.67 25,449 130 11.81 8.20 10.04 15.12 24,560 11-9061 Funeral Directors 30 13.82 8.60 13.82 16.99 28,733 30 13.32 8.30 13.33 16.39 27,710 11-9081 Lodging Managers * 13.56 12.23 13.31 14.98 28,203 N/A N/A N/A N/A N/A N/A 11-9111 Medical & Health Services Managers * 18.61 10.37 17.66 24.77 38,702 N/A N/A N/A N/A N/A N/A 11-9141 Property, Real Estate, & Community
Association Managers * 17.61 7.97 9.15 12.44 36,641 N/A N/A N/A N/A N/A N/A
11-9151 Social & Community Service Managers 20 23.87 22.95 25.09 27.22 49,652 N/A N/A N/A N/A N/A N/A 11-9199 Managers, All Other 220 20.62 15.64 18.78 25.60 42,885 220 19.65 15.04 17.74 24.35 40,860

A-6
Table A-1
Regional Labor Market Area and Houma Metropolitan Statistical Area—1999 Wage Comparison
RLMA 3 Houma MSA
SOC-Code
Occupational Title Total # Empl.
Mean ($/hour)
Entry ($/hour)
Median ($/hour)
Experience ($/hour)
Annual $ Total # Empl.
Mean ($/hour)
Entry ($/hour)
Median ($/hour)
Experience ($/hour)
Annual $
Business and Financial Operations Occupations 13-1021 Purchasing Agents & Buyers, Farm
Products * 15.50 11.90 13.67 19.73 32,233 N/A N/A N/A N/A N/A N/A
13-1022 Wholesale & Retail Buyers, Except Farm Products
30 15.08 12.63 14.17 18.00 31,365 30 14.47 12.27 13.61 17.00 30,100
13-1023 Purchasing Agents, Except Wholesale, Retail, & Farm Products
100 16.15 11.92 14.75 20.44 33,590 100 15.34 11.45 14.10 19.30 31,910
13-1031 Claims Adjusters, Examiners, & Investigators
10 21.74 16.20 18.90 29.64 45,219 N/A N/A N/A N/A N/A N/A
13-1051 Cost Estimators 80 24.12 17.70 22.29 27.78 50,162 80 22.62 16.77 21.01 24.94 47,050 13-1061 Emergency Management Specialists 10 23.03 13.51 21.46 31.66 47,898 N/A N/A N/A N/A N/A N/A 13-1071 Employment, Recruitment, & Placement
Specialists 10 15.98 13.59 15.80 18.24 33,250 N/A N/A N/A N/A N/A N/A
13-1072 Compensation, Benefits, & Job Analysis Specialists
20 13.53 11.20 12.99 16.54 28,142 N/A N/A N/A N/A N/A N/A
13-1073 Training & Development Specialists * 18.35 14.66 17.19 22.09 38,154 * 17.70 14.14 16.58 21.31 36,810 13-1199 Business Operations Specialists, All Other 210 22.96 12.64 25.70 31.98 47,754 210 22.15 12.19 24.80 30.86 46,070 13-2011 Accountants & Auditors 330 18.24 13.26 16.54 21.00 37,955 330 17.83 12.75 16.39 20.49 37,090 13-2072 Loan Officers 50 17.54 15.11 17.55 20.24 36,474 50 16.92 14.58 16.93 19.53 35,180 13-2099 Financial Specialists, All Other 50 11.56 9.30 10.26 14.62 24,030 50 11.14 8.97 9.90 14.10 23,180 Computer and Mathematical Occupations 15-1021 Computer Programmers 10 16.90 12.14 15.95 20.34 35,142 N/A N/A N/A N/A N/A N/A 15-1041 Computer Support Specialists * 17.32 12.26 13.32 17.08 36,039 * 16.62 11.76 12.78 16.39 34,580 15-1051 Computer Systems Analysts 50 21.56 16.60 21.10 26.26 44,837 50 20.69 15.93 20.24 25.20 43,020 15-1099 Computer Specialists, All Other 20 17.47 15.56 17.06 19.40 36,326 N/A N/A N/A N/A N/A N/A Architecture and Engineering Occupations 17-2111 Health & Safety Engineers, Except Mining
Safety Engineers & Inspectors 20 26.90 21.21 25.13 31.63 55,966 * 28.21 20.76 28.99 37.42 58,690
17-2112 Industrial Engineers 30 26.19 24.06 26.02 27.98 54,474 30 25.13 23.08 24.96 26.84 52,260 17-2199 Engineers, All Other 80 30.34 26.18 30.94 34.80 63,117 * 29.11 25.12 29.68 33.39 60,550 17-3011 Architectural & Civil Drafters * 13.45 10.51 13.52 16.09 27,961 N/A N/A N/A N/A N/A N/A

A-7
Table A-1
Regional Labor Market Area and Houma Metropolitan Statistical Area—1999 Wage Comparison
RLMA 3 Houma MSA
SOC-Code
Occupational Title Total # Empl.
Mean ($/hour)
Entry ($/hour)
Median ($/hour)
Experience ($/hour)
Annual $ Total # Empl.
Mean ($/hour)
Entry ($/hour)
Median ($/hour)
Experience ($/hour)
Annual $
17-3022 Civil Engineering Technicians * 18.35 11.38 17.02 24.16 38,157 * 17.61 10.92 16.32 23.18 36,620 17-3099 All Other Drafters, Engineering, &
Mapping Technicians 40 18.18 13.05 16.63 28.55 37,814 40 17.01 11.44 15.23 23.03 35,380
Life, Physical, and Social Science Occupations 19-4099 Life, Physical, & Social Science
Technicians, All Other 20 19.49 17.56 20.20 23.10 40,547 N/A N/A N/A N/A N/A N/A
Community and Social Service Occupations 21-1013 Marriage & Family Therapists * 9.91 9.44 10.04 10.62 20,618 N/A N/A N/A N/A N/A N/A 21-1014 Mental Health Counselors * 14.98 14.17 15.52 16.89 31,164 * 14.37 13.59 14.89 16.20 29,900 21-1021 Child, Family, & School Social Workers 60 14.84 11.95 13.88 17.58 30,880 60 14.24 11.46 13.32 16.87 29,620 21-1022 Medical & Public Health Social Workers * 9.55 6.01 6.66 15.17 19,854 * 9.01 5.76 6.37 14.43 18,740 21-1093 Social & Human Service Assistants 90 9.20 6.95 8.85 11.05 19,149 90 8.90 6.60 8.69 10.70 18,510 21-9099 All Other Counselors, Social & Religious
Workers. 80 12.97 7.88 12.44 16.29 26,965 80 12.44 7.56 11.93 15.63 25,880
Legal Occupations 23-1011 Lawyers 50 16.00 6.83 13.36 19.93 33,272 50 15.37 6.55 12.83 19.14 31,960 23-2091 Court Reporters 20 13.35 12.04 13.33 15.17 27,777 N/A N/A N/A N/A N/A N/A Education, Training, and Library Occupations 25-3021 Self-Enrichment Education Teachers * 17.23 14.88 17.35 19.88 35,834 * 16.53 14.28 16.65 19.07 34,380 25-4021 Librarians * 17.44 13.55 17.27 20.79 36,264 * 16.44 12.68 16.32 19.75 34,190 25-9041 Teacher Assistants * ** ** ** ** 15,148 * ** ** ** ** 13,560 Arts, Design, Entertainment, Sports, and Media Occupations 27-1024 Graphic Designers 20 12.40 9.27 14.23 15.97 25,807 N/A N/A N/A N/A N/A N/A 27-4013 Radio Operators 30 10.69 7.62 9.61 12.87 22,255 * 10.27 7.26 8.99 12.42 21,360 27-4021 Photographers * 7.83 5.97 6.92 9.65 16,283 N/A N/A N/A N/A N/A N/A Healthcare Practitioners and Technical Occupations 29-1051 Pharmacists 90 29.15 24.22 30.45 37.65 60,644 90 27.46 22.66 28.14 35.00 57,120 29-1111 Registered Nurses 270 19.78 16.64 19.21 22.57 41,145 250 18.92 15.90 18.36 21.54 39,350 29-1123 Physical Therapists * 37.58 27.46 36.59 50.68 78,163 * 35.90 26.22 34.85 46.36 74,680

A-8
Table A-1
Regional Labor Market Area and Houma Metropolitan Statistical Area—1999 Wage Comparison
RLMA 3 Houma MSA
SOC-Code
Occupational Title Total # Empl.
Mean ($/hour)
Entry ($/hour)
Median ($/hour)
Experience ($/hour)
Annual $ Total # Empl.
Mean ($/hour)
Entry ($/hour)
Median ($/hour)
Experience ($/hour)
Annual $
29-2041 Emergency Medical Technicians & Paramedics
30 11.38 8.88 11.40 13.93 23,666 * 10.92 8.52 10.94 13.36 22,700
29-2051 Dietetic Technicians - 9.65 8.39 9.61 10.72 20,075 N/A N/A N/A N/A N/A N/A 29-2052 Pharmacy Technicians 130 7.71 6.58 7.67 8.79 16,035 130 7.36 6.23 7.32 8.44 15,300 Healthcare Support Occupations 29-2061 Licensed Practical & Licensed Vocational
Nurses 360 11.80 9.77 11.01 13.29 24,540 * 11.32 9.36 10.54 12.74 23,550
29-2071 Medical Records & Health Information Technicians
10 8.98 8.06 9.09 10.14 18,697 N/A N/A N/A N/A N/A N/A
29-2081 Opticians, Dispensing * 9.10 7.72 9.55 10.43 18,918 * 8.73 7.42 9.16 10.01 18,150 31-1012 Nursing Aides, Orderlies, & Attendants 590 6.63 5.96 6.52 7.14 13,798 590 6.38 5.78 6.28 6.87 13,260 31-9091 Dental Assistants 250 9.13 7.20 8.22 10.94 18,993 * 8.80 6.94 7.92 10.53 18,300 31-9099 Healthcare Support Workers, All Other * 10.20 9.50 10.16 10.84 21,225 * 9.83 9.15 9.79 10.44 20,450 Protective Service Occupations 33-1012 First-Line Supervisors/
Managers of Police & Detectives 30 16.91 12.77 15.76 18.09 35,167 30 16.29 12.29 15.18 17.42 33,890
33-3021 Detectives & Criminal Investigators 70 15.02 10.72 12.67 16.13 31,247 * 14.48 10.33 12.21 15.54 30,110 33-3051 Police & Sheriff's Patrol Officers 310 11.53 9.85 11.15 13.27 23,975 * 11.41 9.69 10.96 12.89 23,720 33-9032 Security Guards 390 8.00 6.26 7.17 9.31 16,634 390 7.75 6.07 6.94 9.11 16,110 33-9099 Protective Service Workers, All Other * 6.29 5.77 6.20 6.62 13,092 * 6.06 5.56 5.97 6.38 12,610 Food Preparation and Serving Related Occupations 35-1012 First-Line Supervisors/
Managers of Food Preparation & Serving Workers
320 11.66 7.65 10.68 15.41 24,234 310 11.42 7.49 10.76 14.96 23,740
35-2011 Cooks, Fast Food 940 6.05 5.74 6.08 6.51 12,591 940 5.78 5.66 5.92 6.28 12,030 35-2012 Cooks, Institution & Cafeteria 470 8.13 6.16 6.96 9.72 16,911 * 7.82 5.95 6.70 9.39 16,270 35-2014 Cooks, Restaurant * 7.56 6.10 7.33 8.94 15,726 * 7.26 5.94 7.06 8.61 15,090 35-2015 Cooks, Short Order * 6.26 5.94 6.39 6.92 13,016 60 5.90 5.72 6.10 6.56 12,270 35-2021 Food Preparation Workers 740 6.38 5.81 6.29 6.76 13,288 * 6.19 5.61 6.07 6.53 12,870 35-3011 Bartenders 120 6.22 5.66 5.96 6.26 12,938 120 6.23 5.69 5.98 6.55 12,970

A-9
Table A-1
Regional Labor Market Area and Houma Metropolitan Statistical Area—1999 Wage Comparison
RLMA 3 Houma MSA
SOC-Code
Occupational Title Total # Empl.
Mean ($/hour)
Entry ($/hour)
Median ($/hour)
Experience ($/hour)
Annual $ Total # Empl.
Mean ($/hour)
Entry ($/hour)
Median ($/hour)
Experience ($/hour)
Annual $
35-3021 Combined Food Preparation & Serving Workers, Incl.uding Fast Food
700 6.34 5.65 5.95 6.25 13,200 700 6.02 5.66 5.86 6.06 12,520
35-3022 Counter Attendants, Cafeteria, Food Concession, & Coffee Shop
80 7.09 6.09 6.72 8.26 14,754 80 6.51 5.81 6.33 6.88 13,540
35-3031 Waiters & Waitresses 860 6.43 5.77 6.14 6.68 13,358 860 6.14 5.69 5.97 6.44 12,780 35-9011 Dining Room & Cafeteria Attendants &
Bartender Helpers * 6.01 5.80 6.19 6.63 12,493 * 5.77 5.64 5.98 6.39 12,000
35-9021 Dishwashers 190 6.07 5.78 6.23 6.66 12,622 190 5.85 5.57 6.00 6.42 12,160 35-9031 Hosts & Hostesses, Restaurant, Lounge, &
Coffee Shop 130 6.29 5.81 6.22 6.85 13,075 130 6.02 5.70 6.02 6.60 12,530
Building and Grounds Cleaning and Maintenance Occupations 37-1011 First-Line Supervisors/
Managers of Housekeeping & Janitorial Workers
50 11.76 7.58 9.62 11.14 24,452 50 11.33 7.30 9.27 10.73 23,560
37-1012 First-Line Supervisors/ Managers of Landscaping, Lawn Service, & Groundskeeping Workers
* 12.69 11.76 12.70 13.65 26,406 30 12.19 11.29 12.20 13.11 25,360
37-2011 Janitors & Cleaners, Except Maids & Housekeeping Cleaners
980 7.04 6.00 6.68 7.96 14,634 970 6.65 5.82 6.39 7.47 13,840
37-2012 Maids & Housekeeping Cleaners 330 6.93 6.01 6.80 8.01 14,413 310 6.67 5.87 6.57 7.74 13,870 37-3011 Landscaping & Groundskeeping Workers 250 9.02 7.31 8.37 9.91 18,751 * 8.56 6.91 7.83 9.17 17,800 37-9099 All Other Building & Grounds Cleaning &
Maintenance Workers 60 7.50 6.14 6.92 8.45 15,604 60 7.21 5.90 6.65 8.11 14,990
Personal Care and Service Occupations 39-1021 First-Line Supervisors/
Managers of Personal Service Workers 30 10.06 6.55 10.76 12.84 20,925 30 9.69 6.31 10.37 12.37 20,160
39-5012 Hairdressers, Hairstylists, & Cosmetologists
120 7.85 7.13 7.92 8.70 16,331 120 7.57 6.87 7.63 8.38 15,740
39-9011 Child Care Workers 90 6.40 5.70 6.04 6.48 13,321 90 6.09 5.68 5.91 6.24 12,670 39-9031 Fitness Trainers & Aerobics Instructors * 5.97 5.76 6.18 6.59 12,414 N/A N/A N/A N/A N/A N/A 39-9032 Recreation Workers 80 6.15 5.82 6.25 6.70 12,798 80 5.90 5.58 6.01 6.43 12,280

A-10
Table A-1
Regional Labor Market Area and Houma Metropolitan Statistical Area—1999 Wage Comparison
RLMA 3 Houma MSA
SOC-Code
Occupational Title Total # Empl.
Mean ($/hour)
Entry ($/hour)
Median ($/hour)
Experience ($/hour)
Annual $ Total # Empl.
Mean ($/hour)
Entry ($/hour)
Median ($/hour)
Experience ($/hour)
Annual $
Sales and Related Occupations 41-1011 First-Line Supervisors/
Managers of Retail Sales Workers 870 13.59 9.79 12.26 16.58 28,270 800 13.72 9.97 12.27 16.53 28,540
41-1012 First-Line Supervisors/ Managers of Non-Retail Sales Workers
40 15.75 11.59 13.18 17.19 32,775 40 15.19 11.17 12.70 16.57 31,590
41-2011 Cashiers 2,330 6.56 5.84 6.29 6.92 13,636 2,140 6.32 5.78 6.12 6.68 13,150 41-2021 Counter & Rental Clerks 120 8.29 6.14 7.14 9.38 17,249 120 7.99 6.02 6.88 9.04 16,620 41-2022 Parts Salespersons 240 10.41 7.50 9.44 12.79 21,654 240 10.05 7.25 9.12 12.34 20,900 41-2031 Retail Salespersons 2,390 8.78 6.08 6.88 9.19 18,265 2,380 8.50 5.94 6.64 8.94 17,680 41-3011 Advertising Sales Agents * 14.99 9.98 12.38 15.93 31,189 * 14.46 9.62 11.93 15.34 30,080 41-3021 Insurance Sales Agents 160 26.51 20.03 28.30 32.26 55,154 * 25.55 19.30 27.27 31.09 53,150 41-3041 Travel Agents 30 8.68 6.27 9.25 10.49 18,043 30 8.36 6.13 8.91 10.11 17,400 41-4011 Sales Representative, Wholesale &
Manufacturing, Technical. & Scientific Products
80 17.62 11.97 17.18 22.42 36,650 80 16.93 11.48 16.55 21.62 35,220
41-4012 Sales Representative, Wholesale & Manufacturing, Except Technical & Scientific Products
720 19.10 11.55 17.86 23.99 39,740 720 18.44 11.14 17.24 23.13 38,350
41-9022 Real Estate Sales Agents * 9.38 5.84 6.34 6.83 19,511 N/A N/A N/A N/A N/A N/A 41-9031 Sales Engineers 60 27.63 21.03 25.62 38.28 57,475 60 26.63 20.27 24.70 36.89 55,400 41-9099 Sales & Related Workers, All Other * 9.57 6.01 6.68 9.33 19,904 * 9.22 5.79 6.44 8.99 19,180 Office and Administrative Support Occupations 43-1011 First-Line Supervisors/
Managers of Office & Administrative Support Workers
470 14.43 9.92 12.05 16.66 30,002 470 14.20 9.46 12.37 16.63 29,530
43-2011 Switchboard Operators, Including Answering Service
80 8.14 6.56 8.01 9.51 16,937 * 7.77 6.27 7.65 9.09 16,160
43-3011 Bill & Account Collectors 100 10.03 7.96 9.82 11.66 20,863 * 9.61 7.63 9.41 11.17 19,990 43-3021 Billing & Posting Clerks & Machine
Operators 120 10.67 8.08 9.60 12.37 22,185 120 10.27 7.78 9.25 11.91 21,360
43-3031 Bookkeeping, Accounting, & Auditing Clerks
1,270 9.57 7.13 8.76 11.43 19,898 1,250 9.19 6.82 8.40 11.03 19,120

A-11
Table A-1
Regional Labor Market Area and Houma Metropolitan Statistical Area—1999 Wage Comparison
RLMA 3 Houma MSA
SOC-Code
Occupational Title Total # Empl.
Mean ($/hour)
Entry ($/hour)
Median ($/hour)
Experience ($/hour)
Annual $ Total # Empl.
Mean ($/hour)
Entry ($/hour)
Median ($/hour)
Experience ($/hour)
Annual $
43-3051 Payroll & Timekeeping Clerks 40 12.15 9.59 11.89 13.95 25,282 40 11.59 9.13 11.27 13.30 24,100 43-3061 Procurement Clerks 20 10.56 8.37 10.26 12.67 21,972 N/A N/A N/A N/A N/A N/A 43-4051 Customer Service Representatives 270 9.62 7.79 9.42 11.10 20,019 * 9.22 7.46 9.02 10.63 19,180 43-4071 File Clerks * 7.41 6.33 7.31 8.42 15,412 * 7.05 6.09 6.98 8.04 14,670 43-4081 Hotel, Motel, & Resort Desk Clerks 80 7.31 6.21 6.88 8.31 15,198 80 7.00 5.96 6.60 7.96 14,550 43-4111 Interviewers, Except Eligibility & Loan 70 8.94 7.40 8.73 10.46 18,579 * 8.55 7.06 8.38 10.03 17,790 43-4131 Loan Interviewers & Clerks 60 10.41 9.16 10.42 11.97 21,647 * 9.97 8.78 9.98 11.47 20,740 43-4151 Order Clerks * 15.28 11.95 15.26 16.95 31,779 * 14.64 11.45 14.62 16.24 30,440 43-4999 All Other Financial, Information, & Record
Clerks * 9.67 6.12 6.87 14.90 20,101 N/A N/A N/A N/A N/A N/A
43-5032 Dispatchers, Except Police, Fire, & Ambulance
270 13.10 9.73 11.09 16.47 27,255 270 12.56 9.31 10.63 15.84 26,130
43-5041 Meter Readers, Utilities * 9.61 7.63 9.71 11.72 19,997 * 9.21 7.31 9.30 11.23 19,160 43-5061 Production, Planning, & Expediting Clerks 240 13.42 10.70 12.70 15.44 27,919 240 12.82 10.26 12.16 14.70 26,670 43-5071 Shipping, Receiving, & Traffic Clerks 250 9.76 7.62 8.77 10.89 20,297 250 9.37 7.31 8.41 10.49 19,500 43-5081 Stock Clerks & Order Fillers 1,010 8.26 6.15 7.12 9.46 17,176 1,010 7.90 5.96 6.84 9.06 16,440 43-5111 Weighers, Measurers, Checkers, &
Samplers 40 12.50 6.89 9.95 17.17 26,010 N/A N/A N/A N/A N/A N/A
43-4161 Human Resources Assistants, Except Payroll & Timekeeping
30 11.75 8.42 10.79 13.44 24,455 30 11.05 8.04 10.23 12.66 22,990
43-4171 Receptionists & Information Clerks 780 8.29 7.02 8.25 9.54 17,236 770 8.07 6.95 8.02 9.24 16,780 43-5199 All Other Material Record., Scheduling,
Dispatching, & Distributing Workers * 12.19 11.18 12.32 13.42 25,367 * 11.68 10.71 11.80 12.87 24,300
43-6011 Executive Secretaries & Administrative Assistants
340 12.53 9.79 11.71 14.88 26,052 340 12.03 9.39 11.29 14.33 25,030
43-6013 Medical Secretaries * 9.84 8.54 9.86 11.36 20,476 * 9.43 8.18 9.45 10.88 19,620 43-6014 Secretaries, Except Legal, Medical, &
Executive 2,440 11.16 8.32 11.57 13.61 23,207 2,390 10.75 8.02 11.15 13.07 22,350
43-9011 Computer Operators 90 10.40 7.01 9.12 11.93 21,616 90 9.85 6.66 8.57 11.00 20,480 43-9021 Data Entry Keyers 130 7.83 6.29 7.48 9.29 16,294 130 7.45 6.04 7.11 8.86 15,500 43-9022 Word Processors & Typists 40 8.26 6.52 7.75 10.03 17,179 * 7.87 6.22 7.27 9.54 16,370

A-12
Table A-1
Regional Labor Market Area and Houma Metropolitan Statistical Area—1999 Wage Comparison
RLMA 3 Houma MSA
SOC-Code
Occupational Title Total # Empl.
Mean ($/hour)
Entry ($/hour)
Median ($/hour)
Experience ($/hour)
Annual $ Total # Empl.
Mean ($/hour)
Entry ($/hour)
Median ($/hour)
Experience ($/hour)
Annual $
43-9041 Insurance Claims & Policy Processing Clerks
20 14.20 12.11 13.00 13.88 29,529 N/A N/A N/A N/A N/A N/A
43-9061 Office Clerks, General 1,440 9.32 6.81 8.41 10.78 19,391 1,440 8.91 6.51 8.05 10.31 18,530 43-9999 All Other Secretaries, Administrative
Assistants, & Other Office Support 70 13.81 11.33 13.92 16.15 28,727 70 13.21 11.02 13.41 15.44 27,480
Farming, Fishing, and Forestry Occupations N/A N/A N/A N/A N/A N/A N/A N/A N/A N/A Construction and Extraction Occupations 47-1011 First-Line Supervisors/
Managers of Construction Trades & Extraction Workers
1,490 17.48 15.12 18.16 20.40 36,352 1480 16.80 14.55 17.47 19.62 34,950
47-2031 Carpenters 460 10.55 6.67 10.68 13.60 21,940 460 10.16 6.42 10.28 13.10 21,130 47-2051 Cement Masons & Concrete Finishers * 8.01 5.92 6.49 9.97 16,665 * 7.72 5.70 6.25 9.60 16,050 47-2061 Construction Laborers 60 7.79 6.23 7.13 8.48 16,196 60 7.48 5.98 6.85 8.14 15,550 47-2073 Operating Engineers & Other Construction
Equipment Operators 110 12.94 10.23 12.14 14.54 26,924 110 12.33 9.76 11.47 14.18 25,640
47-2111 Electricians 270 13.80 11.96 13.24 15.64 28,713 260 13.28 11.50 12.73 15.04 27,620 47-2121 Glaziers * 8.72 6.23 9.08 11.37 18,155 * 8.41 6.00 8.74 10.95 17,480 47-2141 Painters, Construction & Maintenance 420 11.97 11.28 12.36 13.43 24,915 420 11.53 10.86 11.90 12.93 23,990 47-2152 Plumbers, Pipefitters, & Steamfitters 1,000 14.87 12.41 15.03 16.78 30,943 1,000 14.31 12.00 14.47 16.12 29,770 47-2221 Structural Iron & Steel Workers * 15.02 13.87 15.29 16.63 31,227 * 14.46 13.36 14.72 16.01 30,070 47-3012 Helpers--Carpenters 30 9.39 6.98 8.54 11.95 19,541 * 9.03 6.70 8.21 11.49 18,770 47-4011 Construction & Building Inspectors 20 16.64 12.12 15.38 21.04 34,614 * 7.58 6.26 7.28 8.40 15,760 47-4999 All Other Construction Trades & Related
Workers * 10.76 8.50 10.54 13.13 22,377 30 10.40 8.56 11.22 12.36 21,630
Installation, Maintenance, and Repair Occupations 49-1011 First-Line Supervisors/
Managers of Mechanics, Installers, & Repairmen
300 18.45 14.28 18.65 22.40 38,388 300 17.77 13.75 17.96 21.57 36,960
49-2091 Avionics Technicians 10 8.05 6.18 7.01 8.83 16,744 N/A N/A N/A N/A N/A N/A 49-2094 Electrical & Electronic Repairmen,
Commercial & Industrial Equipment 140 21.78 17.40 23.34 26.03 45,310 140 20.97 16.75 22.47 25.06 43,630

A-13
Table A-1
Regional Labor Market Area and Houma Metropolitan Statistical Area—1999 Wage Comparison
RLMA 3 Houma MSA
SOC-Code
Occupational Title Total # Empl.
Mean ($/hour)
Entry ($/hour)
Median ($/hour)
Experience ($/hour)
Annual $ Total # Empl.
Mean ($/hour)
Entry ($/hour)
Median ($/hour)
Experience ($/hour)
Annual $
49-3023 Automotive Service Technicians & Mechanics
490 14.75 11.36 14.71 18.44 30,682 490 14.20 10.94 14.14 17.77 29,540
49-3031 Bus & Truck Mechanics & Diesel Engine Specialists
350 13.80 10.70 13.51 17.27 28,700 350 13.28 10.28 12.98 16.66 27,610
49-3042 Mobile Heavy Equipment Mechanics, Except Engines
390 15.14 11.83 13.97 16.85 31,499 390 14.75 11.50 13.61 16.43 30,690
49-3051 Motorboat Mechanics 50 14.60 10.96 13.77 17.88 30,363 50 14.06 10.55 13.26 17.23 29,240 49-3053 Outdoor Power Equipment & Other Small
Engine Mechanics * 10.79 8.05 9.76 14.36 22,434 * 10.39 7.75 9.40 13.84 21,600
49-3092 Recreational Vehicle Service Technician * 12.18 9.81 12.14 14.83 25,342 N/A N/A N/A N/A N/A N/A 49-3093 Tire Repairers & Changers * 7.96 7.22 7.93 8.66 16,558 * 7.66 6.95 7.64 8.34 15,930 49-3099 All Other Vehicle & Mobile Equipment
Mechanics, Installers, & Repairmen * 8.40 7.57 8.12 8.68 17,467 * 8.09 7.29 7.82 8.36 16,820
49-9012 Control & Valve Installers & Repairmen, Except Mechanical Door
40 17.75 11.67 16.40 24.55 36,916 40 17.09 11.25 15.80 23.64 35,550
49-9021 Heating, Air Conditioning, & Refrigeration Mechanics & Installers
120 12.88 11.02 12.65 14.39 26,793 120 12.40 10.61 12.18 13.86 25,800
49-9041 Industrial Machinery Mechanics 180 17.00 14.34 15.97 17.60 35,372 180 16.37 13.81 15.38 16.95 34,060 49-9042 Maintenance & Repair Workers, General 640 10.69 7.74 9.67 12.19 22,233 640 10.70 7.85 9.75 12.29 22,250 49-9043 Maintenance Workers, Machinery * 14.03 9.34 12.70 19.74 29,189 * 14.14 9.92 13.62 20.16 29,420 49-9044 Millwrights 100 16.43 9.68 14.84 20.95 34,181 100 15.83 9.32 14.29 20.17 32,920 49-9052 Telecommunications Line Installers &
Repairmen 70 17.89 12.07 19.11 23.15 37,216 * 17.23 11.63 18.40 22.29 35,840
49-9069 Precision Instrument & Equipment Repairmen, All Other
* 16.93 13.81 17.46 19.93 35,215 N/A N/A N/A N/A N/A N/A
49-9096 Riggers * 10.57 8.90 9.94 11.03 21,987 * 10.15 8.59 9.52 10.44 21,120 49-9098 Helpers--Installation, Maintenance, &
Repair Workers 220 8.88 7.21 8.48 10.17 18,471 190 8.55 6.94 8.15 9.79 17,780
49-9099 Installation, Maintenance, & Repair Workers, All Other
170 14.27 12.24 13.96 16.32 29,671 170 13.74 11.79 13.45 15.71 28,570

A-14
Table A-1
Regional Labor Market Area and Houma Metropolitan Statistical Area—1999 Wage Comparison
RLMA 3 Houma MSA
SOC-Code
Occupational Title Total # Empl.
Mean ($/hour)
Entry ($/hour)
Median ($/hour)
Experience ($/hour)
Annual $ Total # Empl.
Mean ($/hour)
Entry ($/hour)
Median ($/hour)
Experience ($/hour)
Annual $
Production Occupations 51-1011 First-Line Supervisors/
Managers of Production & Operating Workers
460 21.76 14.54 19.29 29.41 45,263 400 21.97 14.76 20.19 29.49 45,690
51-2041 Structural Metal Fabricators & Fitters * 14.10 12.25 14.42 16.20 29,331 * 13.71 12.05 13.97 15.61 28,520 51-2092 Team Assemblers 130 11.76 10.35 12.04 13.37 24,475 130 11.42 10.05 11.69 12.98 23,760 51-2099 Assemblers & Fabricators, All Other * 13.73 12.22 14.44 15.98 28,551 * 13.33 11.86 14.02 15.51 27,720 51-3011 Bakers 110 7.13 5.88 6.42 8.06 14,841 110 6.84 5.78 6.18 7.76 14,230 51-3021 Butchers & Meat Cutters 200 10.02 6.50 9.99 13.03 20,854 200 9.66 6.26 9.63 12.56 20,080 51-3022 Meat, Poultry, & Fish Cutters & Trimmers 80 6.87 5.75 6.19 7.87 14,301 80 6.62 5.76 6.05 7.64 13,780 51-4033 Grinding, Polishing & Buffing Machine
Tool Setter, Operator, Metal & Plastic * 12.56 11.45 12.55 13.64 26,121 30 12.19 11.12 12.18 13.24 25,360
51-4034 Lathe & Turning Machine Tool Setter, Operator, Metal & Plastic
200 15.80 11.30 13.74 21.41 32,859 200 15.34 10.97 13.34 20.79 31,900
51-4041 Machinists 520 14.43 12.08 14.53 16.44 29,998 520 13.73 11.61 13.96 15.78 28,550 51-4121 Welders, Cutters, Solderers, & Brazers 1,690 14.65 12.68 14.72 16.36 30,475 1,650 14.17 12.24 14.23 15.89 29,470 51-6011 Laundry & Dry-Cleaning Workers 160 5.93 5.72 6.13 6.55 12,344 160 5.76 5.55 5.96 6.36 11,980 51-6021 Pressers, Textile, Garment, & Related
Material * 6.03 5.73 6.12 6.56 12,545 * 5.84 5.64 5.96 6.37 12,140
51-8031 Water & Liquid Waste Treatment Plant & System Operator
130 11.06 8.67 10.85 12.38 23,015 130 10.21 8.19 10.31 11.80 21,230
51-8093 Petroleum Pump System Operator, Refinery Operator, & Gaugers
810 17.87 15.20 16.99 20.05 37,167 * 17.26 14.70 16.40 19.36 35,890
51-9061 Inspectors, Testers, Sorters, Samplers, and Weighers
140 16.40 12.31 15.55 21.61 34,110 130 15.78 12.02 15.13 20.82 32,820
51-9122 Painters, Transportation Equipment 110 13.34 10.74 12.42 15.10 27,745 110 12.95 10.43 12.06 14.65 26,940 51-9198 Helpers--Production Workers * 7.38 6.01 6.64 8.41 15,367 * 7.25 5.81 6.46 8.22 15,090 51-9199 Production Workers, All Other * 12.28 6.30 12.03 18.61 25,530 * 12.02 6.09 12.38 18.04 25,000

A-15
Table A-1
Regional Labor Market Area and Houma Metropolitan Statistical Area—1999 Wage Comparison
RLMA 3 Houma MSA
SOC-Code
Occupational Title Total # Empl.
Mean ($/hour)
Entry ($/hour)
Median ($/hour)
Experience ($/hour)
Annual $ Total # Empl.
Mean ($/hour)
Entry ($/hour)
Median ($/hour)
Experience ($/hour)
Annual $
Transportation and Material Moving Occupations 53-1021 First-Line Supervisors/
Managers of Helpers, Laborers, & Material Movers, Hand
60 13.63 9.48 12.28 17.40 28,353 50 12.84 8.84 11.79 15.76 26,720
53-1031 First-Line Supervisors/ Managers of Transportation & Material-Moving Machine & Vehicle
80 18.42 15.94 18.47 20.59 38,306 80 17.76 15.38 17.81 19.86 36,950
53-3021 Bus Drivers, Transit & Intercity 60 8.17 6.44 8.37 9.85 16,989 60 7.87 6.22 8.07 9.50 16,360 53-3022 Bus Drivers, School * 8.54 6.26 7.80 9.85 17,768 * 8.05 5.99 7.22 8.66 16,740 53-3031 Driver/Sales Workers * 11.26 9.71 10.95 13.10 23,433 * 10.86 9.36 10.56 12.63 22,600 53-3032 Truck Drivers, Heavy & Tractor-Trailer 760 9.71 7.89 8.78 10.79 20,184 760 9.36 7.61 8.47 10.41 19,470 53-3033 Truck Drivers, Light or Delivery Services 530 10.21 7.46 8.59 10.95 21,246 520 9.90 7.18 8.29 10.63 20,590 53-3041 Taxi Drivers & Chauffeurs 110 6.71 5.85 6.39 7.63 13,945 80 6.49 5.77 6.24 7.48 13,500 53-3099 Motor Vehicle Operator, All Other * 10.79 6.71 10.41 14.61 22,458 * 10.41 6.47 10.04 14.09 21,660 53-4031 Railroad Conductors & Yardmasters * 6.87 6.17 7.00 7.90 14,307 N/A N/A N/A N/A N/A N/A 53-5011 Sailors & Marine Oilers 1,380 10.80 8.48 10.83 12.81 22,469 1,380 10.42 8.18 10.44 12.35 21,670 53-5021 Captains, Mates, & Pilots of Water Vessels 1,590 22.49 18.34 22.16 25.94 46,785 1,590 21.65 17.67 21.34 24.97 45,030 53-5022 Motorboat Operators * 17.67 13.72 15.86 18.91 36,762 * 17.05 13.23 15.30 18.24 35,460 53-5099 All Other Water Transportation Workers * 11.68 10.32 12.02 13.09 24,288 * 11.26 9.95 11.59 12.62 23,420 53-7021 Crane & Tower Operators 110 14.65 12.83 14.50 16.18 30,474 110 14.28 12.43 14.22 15.73 29,700 53-7051 Industrial Truck & Tractor Operators 210 9.52 7.97 9.34 11.11 19,798 170 9.17 7.69 8.91 10.64 19,070 53-7061 Cleaners of Vehicles & Equipment 310 7.01 5.96 6.53 7.52 14,587 310 6.72 5.78 6.27 7.23 13,980 53-7062 Laborers & Freight, Stock, & Material
Movers, Hand 1,220 8.32 7.25 8.20 9.53 17,312 1,200 8.02 7.00 7.90 9.18 16,690
53-7064 Packers & Packagers, Hand 430 6.49 5.91 6.38 6.92 13,505 430 6.23 5.71 6.13 6.65 12,960 53-7072 Pump Operators, Except Wellhead Pumpers 120 16.12 8.65 19.11 23.32 33,545 120 15.55 8.34 18.44 22.49 32,350 SOC Code – Standard occupational classification. * Suppressed - Relative standard error for employment greater than 50 percent. ** Hourly wages for occupation where workers typically work fewer than 2,080 hours per year not available.
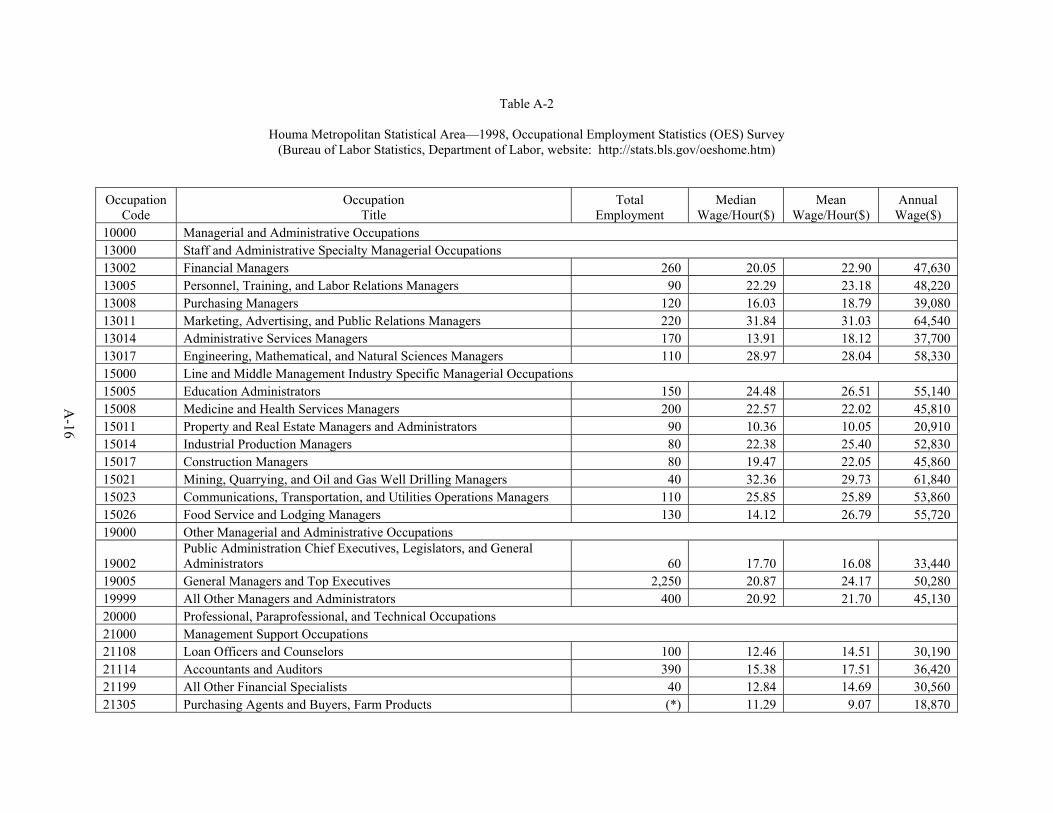
A-16
Table A-2
Houma Metropolitan Statistical Area—1998, Occupational Employment Statistics (OES) Survey (Bureau of Labor Statistics, Department of Labor, website: http://stats.bls.gov/oeshome.htm)
Occupation Code
Occupation Title
Total Employment
Median Wage/Hour($)
Mean Wage/Hour($)
Annual Wage($)
10000 Managerial and Administrative Occupations 13000 Staff and Administrative Specialty Managerial Occupations 13002 Financial Managers 260 20.05 22.90 47,630 13005 Personnel, Training, and Labor Relations Managers 90 22.29 23.18 48,220 13008 Purchasing Managers 120 16.03 18.79 39,080 13011 Marketing, Advertising, and Public Relations Managers 220 31.84 31.03 64,540 13014 Administrative Services Managers 170 13.91 18.12 37,700 13017 Engineering, Mathematical, and Natural Sciences Managers 110 28.97 28.04 58,330 15000 Line and Middle Management Industry Specific Managerial Occupations 15005 Education Administrators 150 24.48 26.51 55,140 15008 Medicine and Health Services Managers 200 22.57 22.02 45,810 15011 Property and Real Estate Managers and Administrators 90 10.36 10.05 20,910 15014 Industrial Production Managers 80 22.38 25.40 52,830 15017 Construction Managers 80 19.47 22.05 45,860 15021 Mining, Quarrying, and Oil and Gas Well Drilling Managers 40 32.36 29.73 61,840 15023 Communications, Transportation, and Utilities Operations Managers 110 25.85 25.89 53,860 15026 Food Service and Lodging Managers 130 14.12 26.79 55,720 19000 Other Managerial and Administrative Occupations
19002 Public Administration Chief Executives, Legislators, and General Administrators 60 17.70 16.08 33,440
19005 General Managers and Top Executives 2,250 20.87 24.17 50,280 19999 All Other Managers and Administrators 400 20.92 21.70 45,130 20000 Professional, Paraprofessional, and Technical Occupations 21000 Management Support Occupations 21108 Loan Officers and Counselors 100 12.46 14.51 30,190 21114 Accountants and Auditors 390 15.38 17.51 36,420 21199 All Other Financial Specialists 40 12.84 14.69 30,560 21305 Purchasing Agents and Buyers, Farm Products (*) 11.29 9.07 18,870

A-17
Table A-2
Houma Metropolitan Statistical Area—1998, Occupational Employment Statistics (OES) Survey (Bureau of Labor Statistics, Department of Labor, website: http://stats.bls.gov/oeshome.htm)
Occupation Code
Occupation Title
Total Employment
Median Wage/Hour($)
Mean Wage/Hour($)
Annual Wage($)
21308 Purchasing Agents, Except Wholesale, Retail, and Farm Products 110 14.58 15.01 31,230 21511 Personnel, Training, and Labor Relations Specialists 60 16.01 16.31 33,920 21902 Cost Estimators 60 18.93 19.84 41,280 21999 All Other Management Support Workers (*) 14.07 14.89 30,980 22000 Engineers and Related Occupations 22121 Civil Engineers, Including Traffic 30 22.38 24.71 51,390 22135 Mechanical Engineers 50 25.04 24.73 51,440 22138 Marine Engineers 40 12.27 12.38 25,760 22199 All Other Engineers 230 18.75 19.26 40,060 22311 Surveyors and Mapping Scientists 140 9.10 11.29 23,470 22502 Civil Engineering Technicians and Technologists 50 12.82 15.34 31,900 22505 Electrical and Electronic Engineering Technicians and Technologists 100 13.16 14.71 30,590 22514 Drafters 170 12.66 13.64 28,360 22521 Surveying and Mapping Technicians 100 13.12 14.18 29,500 24000 Natural Scientists and Related Occupations 24105 Chemists, Except Biochemists (*) 14.66 18.70 38,900 24511 Petroleum Technicians and Technologists 30 20.85 21.84 45,430 25000 Computer, Mathematical, Operations Research, and Related Occupations 25102 Systems Analysts, Electronic Data Processing 30 17.71 18.43 38,330 25104 Computer Support Specialists 50 15.42 16.70 34,740 25105 Computer Programmers 70 17.67 17.61 36,620 27000 Social Scientists and Other Social, Recreational, and Religious Occupations 27302 Social Workers, Medical and Psychiatric 60 14.08 14.48 30,110 27307 Residential Counselors 50 6.10 7.79 16,210 27308 Human Services Workers 190 8.16 8.43 17,520 28000 Law and Related Occupations 28108 Lawyers 300 27.57 29.72 61,810 28305 Paralegal Personnel 30 11.55 11.97 24,890

A-18
Table A-2
Houma Metropolitan Statistical Area—1998, Occupational Employment Statistics (OES) Survey (Bureau of Labor Statistics, Department of Labor, website: http://stats.bls.gov/oeshome.htm)
Occupation Code
Occupation Title
Total Employment
Median Wage/Hour($)
Mean Wage/Hour($)
Annual Wage($)
31000 Teachers, Educators, Librarians, and Related Occupations 31114 Nursing Instructors, Postsecondary (*) * * 38,150 31303 Teachers, Preschool 70 6.09 9.28 19,310 31314 Teachers and Instructors, Vocational Education and Training 250 8.87 12.25 25,480 31321 Instructors and Coaches, Sports and Physical Training 80 6.38 9.80 20,370 31399 All Other Teachers and Instructors (*) * * 35,750 31502 Librarians, Professional 90 20.93 21.35 44,410 31514 Vocational and Educational Counselors 80 22.86 23.32 48,500 31517 Instructional Coordinators 40 20.51 21.80 45,350 32000 Health Practitioners, Technologists, Technicians, and Related Health Occupations 32102 Physicians and Surgeons 180 # 55.15 114,710 32105 Dentists 60 28.26 30.95 64,380 32302 Respiratory Therapists 90 14.11 14.15 29,440 32308 Physical Therapists 60 36.30 36.15 75,190 32314 Speech-Language Pathologists and Audiologists 60 18.93 20.94 43,550 32502 Registered Nurses 1,200 17.91 18.40 38,280 32505 Licensed Practical Nurses 590 10.46 11.59 24,100 32508 Emergency Medical Technicians 70 9.36 10.15 21,110 32517 Pharmacists 120 24.36 25.37 52,780 32519 Pharmacy Technicians and Aides 60 7.37 7.37 15,330 32523 Dietetic Technicians (*) 7.38 8.21 17,080 32902 Medical and Clinical Laboratory Technologists 100 16.54 16.70 34,740 32905 Medical and Clinical Laboratory Technicians 70 11.21 12.09 25,140 32908 Dental Hygienists 40 12.60 12.96 26,970 32911 Medical Records Technicians 40 8.05 8.13 16,900 32919 Radiologic Technologists 80 12.91 13.62 28,320 32928 Surgical Technologists and Technicians 30 9.60 9.89 20,570 32999 All Other Health Professionals, Paraprofessionals, and Technicians 250 11.56 16.01 33,300

A-19
Table A-2
Houma Metropolitan Statistical Area—1998, Occupational Employment Statistics (OES) Survey (Bureau of Labor Statistics, Department of Labor, website: http://stats.bls.gov/oeshome.htm)
Occupation Code
Occupation Title
Total Employment
Median Wage/Hour($)
Mean Wage/Hour($)
Annual Wage($)
34000 Writers, Artists, Entertainers, Athletes, and Related Occupations 34023 Photographers 30 6.18 7.06 14,680 34044 Merchandise Displayers and Window Trimmers 30 8.37 8.02 16,680 39000 Other Professional, Paraprofessional, and Technical Occupations 39999 All Other Professional, Paraprofessional, and Technical Workers 200 14.19 15.41 32,050 40000 Sales and Related Occupations 41000 First Line Supervisors and Manager/Supervisors - Sales Workers
41002 First-Line Supervisors and Managers/Supervisors - Sales and Related Workers 980 11.18 13.40 27,880
43000 Sales Occupations, Services 43002 Sales Agents and Placers, Insurance 150 16.31 22.57 46,940 43017 Sales Agents, Selected Business Services 110 16.19 19.26 40,060 49000 Merchandise, Products, and Other Sales and Sales Related Occupations 49002 Sales Engineers 30 24.66 25.21 52,440
49005 Sales Representatives, Scientific and Related Products and Services, Except Retail 150 16.71 17.47 36,350
49008 Sales Representatives, Except Retail and Scientific and Related Products and Services 570 17.66 19.55 40,660
49011 Salespersons, Retail 1,890 6.51 8.53 17,740 49014 Salespersons, Parts 200 9.75 10.11 21,020 49017 Counter and Rental Clerks 250 6.56 7.84 16,300 49021 Stock Clerks, Sales Floor 1,020 6.33 6.95 14,460 49023 Cashiers 2,290 6.06 6.27 13,040 49999 All Other Sales and Related Workers 310 7.71 11.99 24,930 50000 Clerical and Administrative Support Occupations 51000 First Line Supervisors and Manager/Supervisors - Clerical Workers
51002 First-Line Supervisors and Managers/Supervisors - Clerical and Administrative Support Workers 780 11.55 13.62 28,320
53000 Industry Specific Clerical and Administrative Support Occupations

A-20
Table A-2
Houma Metropolitan Statistical Area—1998, Occupational Employment Statistics (OES) Survey (Bureau of Labor Statistics, Department of Labor, website: http://stats.bls.gov/oeshome.htm)
Occupation Code
Occupation Title
Total Employment
Median Wage/Hour($)
Mean Wage/Hour($)
Annual Wage($)
53102 Tellers 400 6.29 6.46 13,430 53105 New Accounts Clerks 100 7.77 7.86 16,360 53121 Loan and Credit Clerks 50 8.05 8.10 16,840 53123 Adjustment Clerks 110 7.28 8.36 17,390 53311 Insurance Claims Clerks 30 8.29 9.09 18,900 53314 Insurance Policy Processing Clerks 50 9.45 9.27 19,270 53508 Bill and Account Collectors 80 8.93 9.67 20,120 53808 Hotel Desk Clerks 50 6.79 7.06 14,690 53905 Teacher Aides and Educational Assistants, Clerical 590 9.32 8.69 18,080 55000 Secretarial and General Office Occupations 55102 Legal Secretaries 170 10.28 10.45 21,730 55105 Medical Secretaries 130 8.93 8.95 18,620 55108 Secretaries, Except Legal and Medical 1,510 8.22 8.65 18,000 55302 Stenographers and/or Court Reporters 30 9.60 10.13 21,080 55305 Receptionists and Information Clerks 620 7.43 7.57 15,740 55307 Typists, Including Word Processing 110 7.82 8.13 16,910 55314 Personnel Clerks, Except Payroll and Timekeeping 70 10.02 10.21 21,240 55321 File Clerks 70 6.33 6.57 13,670 55323 Order Clerks, Materials, Merchandise, and Service 110 7.82 8.38 17,430 55332 Interviewing Clerks, Except Personnel and Social Welfare 50 7.67 7.86 16,340 55335 Customer Service Representatives, Utilities 80 11.19 12.38 25,750 55338 Bookkeeping, Accounting, and Auditing Clerks 940 9.07 9.42 19,600 55341 Payroll and Timekeeping Clerks 90 9.64 10.31 21,450 55344 Billing, Cost, and Rate Clerks 230 8.99 9.92 20,620 55347 General Office Clerks 1,880 7.41 7.95 16,530 56000 Electronic Data Processing and Other Office Machine Occupations 56002 Billing, Posting, and Calculating Machine Operators 30 9.25 8.99 18,690 56011 Computer Operators, Except Peripheral Equipment 30 8.30 9.24 19,210

A-21
Table A-2
Houma Metropolitan Statistical Area—1998, Occupational Employment Statistics (OES) Survey (Bureau of Labor Statistics, Department of Labor, website: http://stats.bls.gov/oeshome.htm)
Occupation Code
Occupation Title
Total Employment
Median Wage/Hour($)
Mean Wage/Hour($)
Annual Wage($)
56017 Data Entry Keyers, Except Composing 80 7.34 7.49 15,580 57000 Communications, Mail, and Message Distributing Occupations 57102 Switchboard Operators 90 7.12 7.26 15,090 58000 Material Recording, Scheduling, Dispatching, and Distributing Occupations 58002 Dispatchers, Police, Fire, and Ambulance 40 8.16 8.58 17,850 58005 Dispatchers, Except Police, Fire, and Ambulance 240 12.67 13.27 27,600 58008 Production, Planning, and Expediting Clerks 70 11.21 12.65 26,310 58014 Meter Readers, Utilities 30 10.31 10.09 20,990 58023 Stock Clerks - Stockroom, Warehouse or Storage Yard 600 7.60 8.27 17,190 58026 Order Fillers, Wholesale and Retail Sales 30 11.43 14.43 30,020 58028 Shipping, Receiving, and Traffic Clerks 370 8.75 11.13 23,150 58099 All Other Material Recording, Scheduling, and Distributing Workers 60 10.28 11.42 23,750 59000 Other Clerical and Administrative Support Occupations 59999 All Other Clerical and Administrative Support Workers 320 8.73 9.09 18,910 60000 Service Occupations 61000 First-Line Supervisors and Managers/Supervisors - Service Occupations 61008 Housekeeping Supervisors 50 8.55 10.57 21,990 61099 All Other Supervisors and Managers/Supervisors - Service Workers 400 8.48 10.58 22,010 63000 Protective Service Occupations 63014 Police Patrol Officers 90 10.06 10.27 21,370 63047 Guards and Watch Guards 150 6.58 7.29 15,170 63099 All Other Protective Service Workers 70 10.56 10.13 21,070 65000 Food and Beverage Preparation and Service Occupations 65002 Hosts and Hostesses, Restaurant, Lounge, or Coffee Shop 70 5.79 5.71 11,880 65005 Bartenders 120 6.63 6.77 14,090 65008 Waiters and Waitresses 770 5.75 5.57 11,570 65014 Dining Room and Cafeteria Attendants and Bartender Helpers 50 5.79 5.62 11,690 65017 Counter Attendants - Lunchroom, Coffee Shop, or Cafeteria (*) 6.15 6.35 13,210

A-22
Table A-2
Houma Metropolitan Statistical Area—1998, Occupational Employment Statistics (OES) Survey (Bureau of Labor Statistics, Department of Labor, website: http://stats.bls.gov/oeshome.htm)
Occupation Code
Occupation Title
Total Employment
Median Wage/Hour($)
Mean Wage/Hour($)
Annual Wage($)
65021 Bakers, Bread and Pastry 160 5.92 6.63 13,790 65023 Butchers and Meat Cutters 150 8.65 9.13 18,990 65026 Cooks, Restaurant 250 5.96 6.41 13,330 65028 Cooks, Institution or Cafeteria 560 8.85 8.95 18,620 65032 Cooks, Fast Food 490 5.73 5.58 11,600 65035 Cooks, Short Order (*) 5.87 5.67 11,800 65038 Food Preparation Workers 880 5.90 6.51 13,550 65041 Combined Food Preparation and Service Workers 890 5.70 5.80 12,060 65099 All Other Food Service Workers 440 7.38 8.05 16,740 66000 Health Service and Related Occupations 66002 Dental Assistants 120 7.68 8.31 17,290 66005 Medical Assistants 110 8.96 9.07 18,870 66008 Nursing Aides, Orderlies, and Attendants 790 6.06 6.43 13,360 66011 Home Health Aides 610 6.20 6.74 14,020 66099 All Other Health Service Workers 100 7.03 7.40 15,390 67000 Cleaning and Building Service Occupations 67002 Maids and Housekeeping Cleaners 520 6.58 6.59 13,710 67005 Janitors and Cleaners, Except Maids and Housekeeping Cleaners 1,090 6.11 6.47 13,450 67099 All Other Cleaning and Building Service Workers 130 6.46 7.87 16,360 68000 Personal Service Occupations 68005 Hairdressers, Hairstylists, and Cosmetologists 100 5.74 5.77 12,000 68014 Amusement and Recreation Attendants 90 6.20 6.93 14,420 68038 Child Care Workers 170 5.75 5.80 12,060 69000 Other Service Occupations 69999 All Other Service Workers 130 6.04 7.00 14,560 70000 Agricultural, Forestry, Fishing, and Related Occupations 79000 Other Agricultural, Forestry, Fishing, and Related Occupations 79011 Graders and Sorters, Agricultural Products 40 5.75 5.80 12,070

A-23
Table A-2
Houma Metropolitan Statistical Area—1998, Occupational Employment Statistics (OES) Survey (Bureau of Labor Statistics, Department of Labor, website: http://stats.bls.gov/oeshome.htm)
Occupation Code
Occupation Title
Total Employment
Median Wage/Hour($)
Mean Wage/Hour($)
Annual Wage($)
79041 Laborers, Landscaping and Groundskeeping 360 6.73 7.03 14,610 79806 Veterinary Assistants 30 6.02 6.01 12,510 80000 Production, Construction, Operating, Maintenance, and Material Handling Occupations 81000 First-Line Supervisors and Managers/Supervisors - Production, Construction, Maintenance, and Related Workers
81002 First-Line Supervisors and Managers/Supervisors - Mechanics, Installers, and Repairers 280 15.98 18.11 37,670
81005 First-Line Supervisors and Managers/Supervisors - Construction Trades and Extractive Workers 420 26.09 24.69 51,360
81008 First-Line Supervisors and Managers/Supervisors - Production and Operating Workers 200 18.24 20.00 41,600
81011 First-Line Supervisors and Managers/Supervisors - Transportation and Material-Moving Machine and Vehicle Operators 220 16.45 17.78 36,990
81017 First-Line Supervisors and Managers/Supervisors - Helpers, Laborers, and Material Movers, Hand 150 14.22 16.33 33,960
81099 All Other First-Line Supervisors and Managers/Supervisors - Production, Construction, Maintenance, and Related Workers 390 19.36 20.06 41,730
83000 Inspectors and Related Occupations 83002 Precision Inspectors, Testers, and Graders 70 14.56 15.45 32,140
83005 Production Inspectors, Testers, Graders, Sorters, Samplers, and Weighers 110 11.48 12.12 25,210
85000 Mechanics, Installers, and Repairers 85110 Machinery Maintenance Mechanics 480 14.72 16.51 34,330 85116 Machinery Maintenance Mechanics, Marine Equipment 150 12.82 13.60 28,300 85128 Machinery Maintenance Workers 50 9.45 10.38 21,600 85132 Maintenance Repairers, General Utility 1,040 8.96 9.52 19,790 85302 Automotive Mechanics 440 11.84 12.99 27,020 85305 Automotive Body and Related Repairers 60 12.80 13.52 28,120 85311 Bus and Truck Mechanics and Diesel Engine Specialists 180 12.08 12.66 26,330 85314 Mobile Heavy Equipment Mechanics, Except Engines 170 12.10 12.91 26,850

A-24
Table A-2
Houma Metropolitan Statistical Area—1998, Occupational Employment Statistics (OES) Survey (Bureau of Labor Statistics, Department of Labor, website: http://stats.bls.gov/oeshome.htm)
Occupation Code
Occupation Title
Total Employment
Median Wage/Hour($)
Mean Wage/Hour($)
Annual Wage($)
85702 Telephone and Cable Television Line Installers and Repairers 100 14.18 14.76 30,700 85717 Electronics Repairers, Commercial and Industrial Equipment 50 14.38 13.79 28,680 85902 Heating, Air Conditioning, and Refrigeration Mechanics and Installers 120 11.60 11.56 24,050 85935 Riggers 180 9.31 10.33 21,480 85953 Tire Repairers and Changers 50 5.84 6.01 12,500 85999 All Other Mechanics, Installers, and Repairers 450 11.50 12.08 25,130 87000 Construction Trades and Extractive Occupations 87102 Carpenters 430 12.26 12.68 26,360 87105 Ceiling Tile Installers and Acoustical Carpenters (*) 11.82 12.08 25,130 87202 Electricians 410 14.59 14.73 30,640 87311 Concrete and Terrazzo Finishers 30 8.17 8.84 18,390 87402 Painters and Paperhangers, Construction and Maintenance 340 10.87 11.23 23,360 87502 Plumbers, Pipefitters, and Steamfitters 310 14.26 14.21 29,570 87508 Pipelayers 60 7.88 8.88 18,470 87917 Service Unit Operators 220 11.16 13.32 27,710 87999 All Other Construction and Extractive Workers, Except Helpers 30 10.08 10.26 21,350 89000 Precision Production Occupations 89108 Machinists 580 13.95 13.98 29,080 89121 Shipfitters 380 13.53 13.17 27,390 89132 Sheet Metal Workers 30 9.43 9.70 20,170 89999 All Other Precision Workers 230 10.41 10.54 21,920 91000 Machine Setters, Set-Up Operators, Operators, and Tenders
91502 Numerical Control Machine Tool Operators and Tenders, Metal and Plastic 100 12.07 12.15 25,280
92726 Laundry and Dry-Cleaning Machine Operators and Tenders, Except Pressing 100 6.62 6.86 14,260
92951 Coating, Painting, and Spraying Machine Setters and Set-Up Operators 80 11.00 11.41 23,730 92974 Packaging and Filling Machine Operators and Tenders 80 7.70 8.07 16,790

A-25
Table A-2
Houma Metropolitan Statistical Area—1998, Occupational Employment Statistics (OES) Survey (Bureau of Labor Statistics, Department of Labor, website: http://stats.bls.gov/oeshome.htm)
Occupation Code
Occupation Title
Total Employment
Median Wage/Hour($)
Mean Wage/Hour($)
Annual Wage($)
92998 All Other Machine Operators and Tenders 1,250 15.97 16.52 34,370 93000 Hand Occupations, Including Assemblers and Fabricators 93914 Welders and Cutters 2,550 13.69 13.70 28,500
93956 Assemblers and Fabricators, Except Machine, Electrical, Electronic, and Precision 410 11.58 12.05 25,070
93999 All Other Hand Workers 1,250 12.31 11.85 24,640 95000 Plant and System Occupations 95002 Water and Liquid Waste Treatment Plant and System Operators 120 9.31 9.39 19,530 95017 Gaugers (*) 16.28 16.73 34,790 95099 All Other Plant and System Operators 260 14.82 15.70 32,650 97000 Transportation and Material-Moving Machine and Vehicle Operators 97102 Truck Drivers, Heavy or Tractor-Trailer 940 10.37 11.42 23,760 97105 Truck Drivers, Light, Include Delivery and Route Workers 810 7.27 9.30 19,350 97117 Driver/Sales Workers 110 11.10 10.82 22,510 97502 Captains, Water Vessel 1,340 22.21 23.49 48,860 97505 Mates, Ship, Boat, and Barge 370 18.35 18.64 38,770 97514 Able Seamen 470 12.01 11.93 24,800 97517 Ordinary Seamen and Marine Oilers 930 10.09 9.92 20,630 97805 Service Station Attendants (*) 10.29 9.31 19,370 97899 All Other Transportation and Related Workers 180 15.24 16.14 33,570 97923 Excavating and Loading Machine Operators 60 10.67 10.29 21,390 97938 Grader, Bulldozer, and Scraper Operators 100 11.18 11.66 24,250 97944 Crane and Tower Operators 320 13.66 13.25 27,560 97947 Industrial Truck and Tractor Operators 190 8.50 8.98 18,670 97989 All Other Material-Moving Equipment Operators 100 9.55 9.71 20,200 98000 Helpers, Laborers, and Material Movers, Hand 98102 Helpers, Mechanics and Repairers 500 7.56 7.91 16,440 98312 Helpers, Carpenters and Related Workers 90 7.88 8.64 17,980

A-26
Table A-2
Houma Metropolitan Statistical Area—1998, Occupational Employment Statistics (OES) Survey (Bureau of Labor Statistics, Department of Labor, website: http://stats.bls.gov/oeshome.htm)
Occupation Code
Occupation Title
Total Employment
Median Wage/Hour($)
Mean Wage/Hour($)
Annual Wage($)
98313 Helpers, Electricians and Power-Line Transmission Installers 30 8.26 8.45 17,580 98315 Helpers, Plumbers, Pipefitters, and Steamfitters 160 8.93 9.14 19,020 98319 Helpers, All Other Construction Trades Workers 130 8.48 8.74 18,180 98502 Machine Feeders and Offbearers (*) 7.48 8.15 16,950 98799 All Other Freight, Stock, and Material Movers, Hand 340 7.14 7.68 15,980 98902 Hand Packers and Packagers 320 5.94 6.06 12,600 98905 Vehicle Washers and Equipment Cleaners 210 6.07 6.25 13,000 98999 All Other Helpers, Laborers, and Material Movers, Hand 2,000 7.81 8.24 17,140 Occupation Code - a unique, five-digit numerical identifier for each OES occupation. Occupation Title - a descriptive title that corresponds to the OES code. Total Employment - the estimated total occupational employment; rounded to nearest 10 (excludes self-employed). Median Wage/Hour - estimated median hourly wage; the 50% percentile wage. Mean Wage/Hour - estimated mean hourly wage; an occupation's total wages divided by its employment (the average wage). Annual Wage - estimated mean annual wage; the estimated mean hourly wage of an occupation multiplied by 2,080 hours.

A-27
Table A-3
Houma Metropolitan Area—Lafourche and Terrebonne Parishes (Data are from the1990 Census special tabulation of occupation by industry.
These counts are for all industries.)
Number in Experienced Labor Force
Census Occupation
Code Occupation Title
36 3 Legislators 8 4 Chief Executives and General Administrators, Public Administration
149 5 Administrators and Officials, Public Administration 45 6 Administrators, Protective Service
369 7 Financial Managers 151 8 Personnel and Labor Relations Managers 36 9 Purchasing Managers
204 13 Managers, Marketing, Advertising, and Public Relations 449 14 Administrators, Education and Related Fields 77 15 Managers, Medicine and Health 19 16 Postmasters and Mail Superintendents
726 17 Managers, Food Serving and Lodging Establishments 184 18 Managers, Properties and Real Estate 41 19 Funeral Directors
233 21 Managers, Service Organizations, n.e.c. 2,545 22 Managers and Administrators, n.e.c.
523 23 Accountants and Auditors 17 24 Underwriters
241 25 Other Financial Officers 51 26 Management Analysts
208 27 Personnel, Training, and Labor Relations Specialists 113 29 Buyers, Wholesale and Retail Trade (except farm products) 191 33 Purchasing Agents and Buyers 71 35 Construction Inspectors 84 36 Inspectors and Compliance Officers (except construction) 68 37 Management Related Occupations, n.e.c. 16 43 Architects
6 45 Metallurgical and Materials Engineers 9 46 Mining Engineers
209 47 Petroleum Engineers 15 48 Chemical Engineers
126 53 Civil Engineers 12 54 Agricultural Engineers 43 55 Electrical and Electronic Engineers 45 56 Industrial Engineers 27 57 Mechanical Engineers
120 58 Marine and Naval Architects 49 59 Engineers, n.e.c. 17 63 Surveyors and Mapping Scientists 31 64 Computer Systems Analysts and Scientists

A-28
Table A-3
Houma Metropolitan Area—Lafourche and Terrebonne Parishes (Data are from the1990 Census special tabulation of occupation by industry.
These counts are for all industries.)
Number in Experienced Labor Force
Census Occupation
Code Occupation Title
20 65 Operations and Systems Researchers and Analysts 12 67 Statisticians 20 73 Chemists, Except Biochemists 15 75 Geologists and Geodesists 28 77 Agricultural and Food Scientists 33 78 Biological and Life Scientists
193 84 Physicians 121 85 Dentists 13 86 Veterinarians 18 87 Optometrists 32 89 Health Diagnosing Practitioners, n.e.c.
883 95 Registered Nurses 90 96 Pharmacists 59 97 Dietitians 45 98 Respiratory Therapists 31 103 Physical Therapists 52 104 Speech Therapists 51 105 Therapists, n.e.c. 13 106 Physicians' Assistants 10 118 Psychology Teachers
7 127 Engineering Teachers 7 134 Health Specialties Teachers
15 135 Business, Commerce, and Marketing Teachers 9 137 Art, Drama, and Music Teachers 8 143 English Teachers
286 154 Postsecondary Teachers, Subject Not Specified 104 155 Teachers, Prekindergarten and Kindergarten
3,265 156 Teachers, Elementary School 429 157 Teachers, Secondary School 27 158 Teachers, Special Education
344 159 Teachers, n.e.c. 109 163 Counselors, Educational and Vocational 98 164 Librarians
9 165 Archivists and Curators 16 166 Economists 21 167 Psychologists
411 174 Social Workers 50 175 Recreation Workers
164 176 Clergy 44 177 Religious Workers, n.e.c.

A-29
Table A-3
Houma Metropolitan Area—Lafourche and Terrebonne Parishes (Data are from the1990 Census special tabulation of occupation by industry.
These counts are for all industries.)
Number in Experienced Labor Force
Census Occupation
Code Occupation Title
215 178 Lawyers 9 179 Judges
18 183 Authors 208 185 Designers 38 186 Musicians and Composers 43 187 Actors and Directors 20 188 Painters, Sculptors, Craft-Artists, and Artist Printmakers 30 189 Photographers 32 193 Dancers 17 194 Artists, Performers, and Related Workers, n.e.c. 50 195 Editors and Reporters 64 197 Public Relations Specialists 29 198 Announcers
157 199 Athletes 239 203 Clinical Laboratory Technologists and Technicians 29 204 Dental Hygienists 20 205 Health Record Technologists and Technicians
110 206 Radiologic Technicians 323 207 Licensed Practical Nurses 239 208 Health Technologists and Technicians, n.e.c. 168 213 Electrical and Electronic Technicians
5 215 Mechanical Engineering Technicians 151 216 Engineering Technicians, n.e.c. 170 217 Drafting Occupations 56 218 Surveying and Mapping Technicians 50 223 Biological Technicians
110 224 Chemical Technicians 89 225 Science Technicians, n.e.c. 96 226 Airplane Pilots and Navigators 19 227 Air Traffic Controllers 53 228 Broadcast Equipment Operators 93 229 Computer Programmers
125 234 Legal Assistants 277 235 Technicians, n.e.c.
2,666 243 Supervisors and Proprietors, Sales Occupations 471 253 Insurance Sales Occupations 210 254 Real Estate Sales Occupations 73 255 Securities and Financial Services Sales Occupations 60 256 Advertising and Related Sales Occupations
178 257 Sales Occupations, Other Business Services

A-30
Table A-3
Houma Metropolitan Area—Lafourche and Terrebonne Parishes (Data are from the1990 Census special tabulation of occupation by industry.
These counts are for all industries.)
Number in Experienced Labor Force
Census Occupation
Code Occupation Title
13 258 Sales Engineers 1,002 259 Sales Representatives, Mining, Manufacturing, and Wholesale
170 263 Sales Workers, Motor Vehicles and Boats 273 264 Sales Workers, Apparel 102 265 Sales Workers, Shoes 119 266 Sales Workers, Furniture and Home Furnishings 106 267 Sales Workers, Radio, TV, Hi-Fi, and Appliances 116 268 Sales Workers, Hardware and Building Supplies 78 269 Sales Workers, Parts
1,561 274 Sales Workers, Other Commodities 144 275 Sales Counter Clerks
4,047 276 Cashiers 194 277 Street and Door-To-Door Sales Workers 107 278 News Vendors 15 283 Demonstrators, Promoters and Models, Sales 12 285 Sales Support Occupations, n.e.c.
221 303 Supervisors, General Office 24 305 Supervisors, Financial Records Processing 59 307 Supervisors, Distribution, Scheduling, and Adjusting Clerks
270 308 Computer Operators 2,974 313 Secretaries
55 314 Stenographers 363 315 Typists 155 316 Interviewers 47 317 Hotel Clerks 31 318 Transportation Ticket and Reservation Agents
603 319 Receptionists 113 323 Information Clerks, n.e.c.
8 325 Classified-Ad Clerks 99 327 Order Clerks 45 328 Personnel Clerks (except payroll and timekeeping) 55 329 Library Clerks
147 335 File Clerks 45 336 Records Clerks
1,400 337 Bookkeepers, Accounting and Auditing Clerks 56 338 Payroll and Timekeeping Clerks 61 339 Billing Clerks 52 343 Cost and Rate Clerks
7 344 Billing, Posting, and Calculating Machine Operators 156 348 Telephone Operators

A-31
Table A-3
Houma Metropolitan Area—Lafourche and Terrebonne Parishes (Data are from the1990 Census special tabulation of occupation by industry.
These counts are for all industries.)
Number in Experienced Labor Force
Census Occupation
Code Occupation Title
12 353 Communications Equipment Operators, n.e.c. 126 354 Postal Clerks (except mail carriers) 134 355 Mail Carriers, Postal Service 58 356 Mail Clerks (excluding postal service)
118 357 Messengers 235 359 Dispatchers 101 363 Production Coordinators 187 364 Traffic, Shipping and Receiving Clerks 521 365 Stock and Inventory Clerks 72 366 Meter Readers 61 368 Weighers, Measurers, and Checkers -- Samplers
105 373 Expediters 7 374 Material Recording, Scheduling and Distributing Clerks, n.e.c.
75 375 Insurance Adjusters, Examiners, and Investigators 210 376 Investigators and Adjusters, Except Insurance 55 377 Eligibility Clerks, Social Welfare
151 378 Bill and Account Collectors 876 379 General Office Clerks 585 383 Bank Tellers 168 385 Data-Entry Keyers 33 386 Statistical Clerks
187 387 Teachers' Aides 347 389 Administrative Support Occupations, n.e.c.
6 404 Cooks, Private Household 34 405 Housekeepers and Butlers
172 406 Child Care Workers, Private Household 342 407 Private Household Cleaners and Servants 35 414 Supervisors, Police and Detectives 10 415 Supervisors, Guards
5 416 Fire Inspection and Fire Prevention Occupations 81 417 Firefighting Occupations
292 418 Police and Detectives, Public Service 185 423 Sheriffs, Bailiffs, and Other Law Enforcement Officers 67 424 Correctional Institution Officers
7 425 Crossing Guards 373 426 Guards and Police (excluding public service) 67 427 Protective Service Occupations
182 433 Supervisors, Food Preparation and Service Occupations 399 434 Bartenders
1,025 435 Waiters and Waitresses

A-32
Table A-3
Houma Metropolitan Area—Lafourche and Terrebonne Parishes (Data are from the1990 Census special tabulation of occupation by industry.
These counts are for all industries.)
Number in Experienced Labor Force
Census Occupation
Code Occupation Title
2,207 436 Cooks 112 438 Food Counter, Fountain and Related Occupations 319 439 Kitchen Workers, Food Preparation 211 443 Waiters'/Waitresses' Assistants 757 444 Miscellaneous Food Preparation Occupations 120 445 Dental Assistants 198 446 Health Aids, Except Nursing
1,595 447 Nursing Aides, Orderlies and Attendants 86 448 Supervisors, Cleaning and Building Service Workers
593 449 Maids and Housemen 1,847 453 Janitors and Cleaners
70 455 Pest Control Occupations 41 456 Supervisors, Personal Service Occupations
105 457 Barbers 782 458 Hairdressers and Cosmetologists 89 459 Attendants, Amusement and Recreation Facilities 20 461 Guides
6 463 Public Transportation Attendants 36 465 Welfare Service Aides
211 466 Family Child Care Providers 300 467 Early Childhood Teacher's Assistants 227 468 Child Care Workers, n.e.c. 155 469 Personal Service Occupations, n.e.c. 154 473 Farmers, Except Horticultural
9 474 Horticultural Specialty Farmers 130 475 Managers, Farms, Except Horticultural 13 476 Managers, Horticultural Specialty Farms
9 477 Supervisors, Farm Workers 326 479 Farm Workers 31 485 Supervisors, Related Agricultural Occupations
516 486 Groundskeepers and Gardeners (except farm) 23 487 Animal Caretakers (except farm) 85 488 Graders and Sorters, Agricultural Products 10 494 Supervisors, Forestry and Logging Workers 26 496 Timber Cutting and Logging Occupations
236 497 Captains and Other Officers, Fishing Vessels 1,939 498 Fishers
32 499 Hunters and Trappers 312 503 Supervisors, Mechanics and Repairers 673 505 Automobile Mechanics (except apprentices)

A-33
Table A-3
Houma Metropolitan Area—Lafourche and Terrebonne Parishes (Data are from the1990 Census special tabulation of occupation by industry.
These counts are for all industries.)
Number in Experienced Labor Force
Census Occupation
Code Occupation Title
413 507 Bus, Truck, and Stationary Engine Mechanics 34 508 Aircraft Engine Mechanics
245 509 Small Engine Repairers 137 514 Automobile Body and Related Repairers 18 515 Aircraft Mechanics, Excluding Engine
249 516 Heavy Equipment Mechanics 25 517 Farm Equipment Mechanics
314 518 Industrial Machinery Repairers 35 519 Machinery Maintenance Occupations
194 523 Electronic Repairers, Communications and Industrial Equipment 44 525 Data Processing Equipment Repairers 62 526 Household Appliance and Power Tool Repairers 53 527 Telephone Line Installers and Repairers
158 529 Telephone Installers and Repairers 50 533 Miscellaneous Electrical and Electronic Equipment Repairers 86 534 Heating, Air Conditioning, and Refrigeration Mechanics 18 535 Camera, Watch, and Musical Instrument Repairers 12 536 Locksmiths and Safe Repairers 14 538 Office Machine Repairers 81 539 Mechanical Controls and Valve Repairers
7 543 Elevator Installers and Repairers 295 547 Specified Mechanics and Repairers, n.e.c. 379 549 Not Specified Mechanics and Repairers 15 554 Supervisors, Carpenters and Related Work 17 555 Supervisors, Electricians and Power Transmission Installers 51 556 Supervisors, Painters, Paperhangers, and Plasterers
6 557 Supervisors, Plumbers, Pipefitters, and Steamfitters 434 558 Supervisors, Construction, n.e.c. 92 563 Brickmasons and Stonemasons (except apprentices) 15 565 Tile Setters, Hard and Soft 70 566 Carpet Installers
1,009 567 Carpenters (except apprentices) 25 569 Carpenter Apprentices 55 573 Drywall Installers
675 575 Electricians (except apprentices) 7 576 Electrician Apprentices
79 577 Electrical Power Installers and Repairers 566 579 Painters, Construction and Maintenance
8 583 Paperhangers 534 585 Plumbers, Pipefitters, and Steamfitters (except apprentices)

A-34
Table A-3
Houma Metropolitan Area—Lafourche and Terrebonne Parishes (Data are from the1990 Census special tabulation of occupation by industry.
These counts are for all industries.)
Number in Experienced Labor Force
Census Occupation
Code Occupation Title
112 588 Concrete and Terrazzo Finishers 26 589 Glaziers
364 593 Insulation Workers 12 594 Paving, Surfacing, and Tamping Equipment Operators 89 595 Roofers
9 596 Sheetmetal Duct Installers 39 597 Structural Metal Workers 20 598 Drillers, Earth
423 599 Construction Trades, n.e.c. 907 613 Supervisors, Extractive Occupations
1,149 614 Drillers, Oil Well 96 615 Explosives Workers
192 616 Mining Machine Operators 448 617 Mining Occupations, n.e.c. 801 628 Supervisors, Production Occupations 30 634 Tool and Die Makers (except apprentices) 18 636 Precision Assemblers, Metal
493 637 Machinists (except apprentices) 8 639 Machinist Apprentices
73 643 Boilermakers 27 645 Patternmakers and Model Makers, Metal
333 646 Lay-Out Workers 15 647 Precious Stones and Metals Workers
8 649 Engravers, Metal 79 653 Sheet Metal Workers (except apprentices) 77 666 Dressmakers 10 667 Tailors 34 668 Upholsterers
6 669 Shoe Repairers 21 674 Miscellaneous Precision Apparel and Fabric Workers 35 677 Optical Goods Workers 38 678 Dental Laboratory and Medical Appliance Technicians 11 679 Bookbinders 38 684 Miscellaneous Precision Workers, n.e.c.
309 686 Butchers and Meat Cutters 110 687 Bakers 53 688 Food Batchmakers 16 689 Inspectors, Testers, and Graders
6 693 Adjusters and Calibrators 48 694 Water and Sewage Treatment Plant Operators

A-35
Table A-3
Houma Metropolitan Area—Lafourche and Terrebonne Parishes (Data are from the1990 Census special tabulation of occupation by industry.
These counts are for all industries.)
Number in Experienced Labor Force
Census Occupation
Code Occupation Title
46 695 Power Plant Operators 188 696 Stationary Engineers 232 699 Miscellaneous Plant and System Operators 11 704 Lathe and Turning Machine Operators
7 706 Punching and Stamping Press Machine Operators 24 707 Rolling Machine Operators 19 708 Drilling and Boring Machine Operators 15 717 Fabricating Machine Operators, n.e.c.
9 719 Molding and Casting Machine Operators 15 723 Metal Plating Machine Operators
137 725 Miscellaneous Metal and Plastic Processing Machine Operators 8 727 Sawing Machine Operators 4 728 Shaping and Joining Machine Operators
17 733 Miscellaneous Woodworking Machine Operators 44 734 Printing Press Operators 15 736 Typesetters and Compositors 51 744 Textile Sewing Machine Operators
132 747 Pressing Machine Operators 154 748 Laundering and Dry Cleaning Machine Operators 147 754 Packaging and Filling Machine Operators 14 755 Extruding and Forming Machine Operators 61 756 Mixing and Blending Machine Operators 41 757 Separating, Filtering, and Clarifying Machine Operators 48 759 Painting and Paint Spraying Machine Operators 26 766 Furnace, Kiln, and Oven Operators, Except Food
6 768 Crushing and Grinding Machine Operators 79 769 Slicing and Cutting Machine Operators 61 774 Photographic Process Machine Operators
350 777 Miscellaneous and Not Specified Machine Operators, n.e.c. 340 779 Machine Operators, Not Specified
2,810 783 Welders and Cutters 191 785 Assemblers 302 786 Hand Cutting and Trimming Occupations
8 787 Hand Molding, Casting, and Forming Occupations 29 789 Hand Painting,Coating, and Decorating Occupations
6 793 Hand Engraving and Printing Occupations 252 796 Production Inspectors, Checkers, and Examiners 76 797 Production Testers 11 798 Production Samplers and Weighers 81 799 Graders and Sorters (except agricultural)

A-36
Table A-3
Houma Metropolitan Area—Lafourche and Terrebonne Parishes (Data are from the1990 Census special tabulation of occupation by industry.
These counts are for all industries.)
Number in Experienced Labor Force
Census Occupation
Code Occupation Title
57 803 Supervisors, Motor Vehicle Operators 2,422 804 Truck Drivers
163 806 Driver-Sales Workers 416 808 Bus Drivers 58 809 Taxicab Drivers and Chauffeurs
6 814 Motor Transportation Occupations, n.e.c. 87 824 Locomotive Operating Occupations
9 825 Railroad Brake, Signal, and Switch Operators 2,088 828 Ship Captains and Mates (except fishing boats) 1,229 829 Sailors and Deckhands
30 833 Marine Engineers 159 834 Bridge, Lock and Lighthouse Tenders 18 843 Supervisors, Material Moving Equipment Operators
124 844 Operating Engineers 21 845 Longshore Equipment Operators
155 848 Hoist and Winch Operators 360 849 Crane and Tower Operators 136 853 Excavating and Loading Machine Operators 42 855 Grader, Dozer, and Scraper Operators
172 856 Industrial Truck and Tractor Equipment Operators 300 859 Miscellaneous Material Moving Equipment Operators
5 864 Supervisors, Handlers, Equipment Cleaners, and Laborers, n.e.c. 15 865 Helpers, Mechanics and Repairers
203 866 Helpers, Construction Trades 16 867 Helpers, Surveyor 37 868 Helpers, Extractive Occupations
895 869 Construction Laborers 122 874 Production Helpers 83 875 Garbage Collectors 15 876 Stevedores
1,120 877 Stock Handlers and Baggers 7 878 Machine Feeders and Offbearers
310 883 Freight, Stock, and Material Handlers, n.e.c. 293 885 Garage and Service Station Related Occupations 168 887 Vehicle Washers and Equipment Cleaners 511 888 Hand Packers and Packagers
1,626 889 Laborers (except construction) n.e.c. – not else classified.

A-37
Table A-4
Houma Metropolitan Area—Lafourche and Terrebonne Parishes (Data are from the 1990 Census special tabulation of occupation by industry. These counts are for
SIC=353, Construction and Related Machinery, and SIC=373, Ship and Boat Building and Repairing.)
Number in Experienced Labor Force
Census Occupation
Code Occupation Title
10 7 Financial Managers 11 13 Managers, Marketing, Advertising, and Public Relations
152 22 Managers and Administrators, n.e.c. 9 25 Other Financial Officers 4 27 Personnel, Training, and Labor Relations Specialists
38 33 Purchasing Agents and Buyers 8 36 Inspectors and Compliance Officers (except construction) 7 56 Industrial Engineers 5 57 Mechanical Engineers
54 58 Marine and Naval Architects 16 59 Engineers, n.e.c.
7 64 Computer Systems Analysts and Scientists 18 213 Electrical and Electronic Technicians 15 217 Drafting Occupations
8 226 Airplane Pilots and Navigators 6 229 Computer Programmers 8 235 Technicians, n.e.c. 6 243 Supervisors and Proprietors, Sales Occupations
20 259 Sales Representatives, Mining, Manufacturing, and Wholesale 31 308 Computer Operators 19 313 Secretaries
8 319 Receptionists 47 337 Bookkeepers, Accounting and Auditing Clerks
8 338 Payroll and Timekeeping Clerks 11 363 Production Coordinators 74 365 Stock and Inventory Clerks
6 376 Investigators and Adjusters (except insurance) 15 379 General Office Clerks 18 389 Administrative Support Occupations, n.e.c.
7 417 Firefighting Occupations 10 426 Guards and Police, Excluding Public Service
4 436 Cooks 44 453 Janitors and Cleaners
7 469 Personal Service Occupations, n.e.c. 16 507 Bus, Truck, and Stationary Engine Mechanics 32 509 Small Engine Repairers 15 516 Heavy Equipment Mechanics 58 518 Industrial Machinery Repairers
8 519 Machinery Maintenance Occupations 8 534 Heating, Air Conditioning, and Refrigeration Mechanics

A-38
Table A-4
Houma Metropolitan Area—Lafourche and Terrebonne Parishes (Data are from the 1990 Census special tabulation of occupation by industry. These counts are for
SIC=353, Construction and Related Machinery, and SIC=373, Ship and Boat Building and Repairing.)
Number in Experienced Labor Force
Census Occupation
Code Occupation Title
6 539 Mechanical Controls and Valve Repairers 37 547 Specified Mechanics and Repairers, n.e.c. 10 549 Not Specified Mechanics and Repairers
5 555 Supervisors, Electricians and Power Transmission Installers 29 556 Supervisors, Painters, Paperhangers, and Plasterers
6 557 Supervisors, Plumbers, Pipefitters, and Steamfitters 143 567 Carpenters (except apprentices) 103 575 Electricians (except apprentices) 73 579 Painters, Construction and Maintenance 77 585 Plumbers, Pipefitters, and Steamfitters (except apprentices) 14 593 Insulation Workers
7 599 Construction Trades, n.e.c. 8 613 Supervisors, Extractive Occupations 8 615 Explosives Workers 7 617 Mining Occupations, n.e.c.
309 628 Supervisors, Production Occupations 7 634 Tool and Die Makers (except apprentices)
114 637 Machinists (except apprentices) 8 639 Machinist Apprentices 9 645 Patternmakers and Model Makers, Metal
312 646 Lay-Out Workers 24 653 Sheet Metal Workers (except apprentices)
5 696 Stationary Engineers 7 706 Punching and Stamping Press Machine Operators 9 719 Molding and Casting Machine Operators
110 725 Miscellaneous Metal and Plastic Processing Machine Operators 14 744 Textile Sewing Machine Operators
7 747 Pressing Machine Operators 15 759 Painting and Paint Spraying Machine Operators
8 774 Photographic Process Machine Operators 108 777 Miscellaneous and Not Specified Machine Operators, n.e.c. 49 779 Machine Operators, Not Specified
849 783 Welders and Cutters 17 785 Assemblers
6 789 Hand Painting, Coating, and Decorating Occupations 21 796 Production Inspectors, Checkers, and Examiners
8 797 Production Testers 69 804 Truck Drivers 51 828 Ship Captains and Mates (except fishing boats) 16 829 Sailors and Deckhands

A-39
Table A-4
Houma Metropolitan Area—Lafourche and Terrebonne Parishes (Data are from the 1990 Census special tabulation of occupation by industry. These counts are for
SIC=353, Construction and Related Machinery, and SIC=373, Ship and Boat Building and Repairing.)
Number in Experienced Labor Force
Census Occupation
Code Occupation Title
1 849 Crane and Tower Operators 24 856 Industrial Truck and Tractor Equipment Operators
6 859 Miscellaneous Material Moving Equipment Operators 5 865 Helpers, Mechanics and Repairers
42 866 Helpers, Construction Trades 18 869 Construction Laborers 37 874 Production Helpers
7 876 Stevedores 8 883 Freight, Stock, and Material Handlers, n.e.c.
11 887 Vehicle Washers and Equipment Cleaners 139 889 Laborers (except construction)
n.e.c. – not else classified.

A-40
Table A-5
Regional Labor Market Area 3—Assumption, Lafourche, and Terrebonne Parishes Occupational Employment Statistics
(Louisiana Department of Labor)
Occupation Code
Occupational Title
1998 Employment
Projected 2008
Employment
Projected Total
Growth
Area 3 Average Wage ($)
State Average Wage ($)
13002 Financial Managers 340 400 60 22.06 23.8513005 Personnel Managers 110 140 30 23.28 21.8313008 Purchasing Managers 100 120 20 18.88 18.1313011 Marketing & Public Relations Managers 180 220 40 30.88 24.1513014 Administrative Services Managers 210 250 40 18.76 19.913017 Engineering, Math & Science Managers 190 250 60 28.54 30.4615002 Postmasters & Mail Superintendents 10 10 0 23.49 22.7415005 Education Administrators 330 390 60 27.32 25.5515008 Health Services Managers 180 240 60 21.88 23.8915011 Property & Real Estate Managers 70 90 20 10.05 11.9615014 Industrial Production Managers 100 120 20 25.31 28.4515017 Construction Managers 120 160 40 24.32 21.8315021 Mining & Oil & Gas Drilling Managers 90 100 10 29.74 36.515023 Transportation & Public Utility Managers 160 190 30 25.89 22.415026 Food Service & Lodging Managers 300 370 70 26.5 15.515031 Nursery & Greenhouse Managers * * * N/A N/A15032 Lawn Service Managers 30 30 0 N/A 9.9719002 Government Chief Executives & Legislators 60 70 10 13.69 11.619005 General Managers & Top Executives 2,330 2,850 520 24.29 25.0819999 All Other Managers & Administrative 1,330 1,510 180 22.33 21.2221102 Underwriters 40 30 -10 N/A 16.1421105 Credit Analysts 10 10 0 N/A 14.2621108 Loan Officers & Counselors 110 130 20 14.52 16.3921111 Tax Preparers 20 20 0 N/A 9.6321114 Accountants & Auditors 530 580 50 17.38 17.0121117 Budget Analysts 30 30 0 22.02 22.1421199 All Other Financial Specialists 90 100 10 17.48 16.01

A-41
Table A-5
Regional Labor Market Area 3—Assumption, Lafourche, and Terrebonne Parishes Occupational Employment Statistics
(Louisiana Department of Labor)
Occupation Code
Occupational Title
1998 Employment
Projected 2008
Employment
Projected Total
Growth
Area 3 Average Wage ($)
State Average Wage ($)
21302 Buyers Wholesale & Retail Trade 50 60 10 11.28 14.121305 Buyers Farm Products 20 20 0 N/A 11.7821308 Purchasing Agents 140 180 40 15.39 16.9721502 Claims Takers Unemployment Benefits 10 0 -10 N/A 16.2521505 Special Agents Insurance 10 20 10 14.11 14.7521508 Employment Interviewers 30 30 0 N/A 11.4721511 Personnel Specialists 170 210 40 13.41 16.6521902 Cost Estimators 90 120 30 20.61 19.9821905 Management Analysts 60 70 10 N/A 21.0621908 Construction & Building Inspectors 20 20 0 18.92 17.8721911 Enforcement Inspectors (except construction) 90 110 20 19.38 17.1421914 Tax Examiners & Collectors 40 60 20 N/A 14.9721917 Assessors 10 20 10 N/A 18.9321921 Claims Examiners Property/Casualty Insurance 10 10 0 N/A 16.8521999 All Other Management Support Workers 460 560 100 14.47 15.0522105 Metallurgists & Ceramics & Materials Engineers * * * N/A 23.622108 Mining Engineers (including safety) 10 20 10 N/A 23.4122111 Petroleum Engineers 190 210 20 22.16 32.522114 Chemical Engineers 20 20 0 N/A 31.1122117 Nuclear Engineers 10 10 0 N/A N/A22121 Civil Engineers 90 100 10 N/A 27.6122123 Agricultural Engineers * * * N/A 24.0722126 Electrical & Electronic Engineers 60 80 20 25.57 26.5322127 Computer Engineers 30 60 30 N/A 22.3522128 Industrial Engineers (except safety) 70 70 0 26.2 25.6822132 Safety Engineers (except mining) 30 40 10 20.51 22.2722135 Mechanical Engineers 80 100 20 25.42 24.37

A-42
Table A-5
Regional Labor Market Area 3—Assumption, Lafourche, and Terrebonne Parishes Occupational Employment Statistics
(Louisiana Department of Labor)
Occupation Code
Occupational Title
1998 Employment
Projected 2008
Employment
Projected Total
Growth
Area 3 Average Wage ($)
State Average Wage ($)
22138 Marine Engineers 30 30 0 13.3 26.3922199 All Other Engineers 250 300 50 20.8 25.1922302 Architects (except landscape & marine) 20 20 0 N/A 21.9322308 Landscape Architects 10 10 0 N/A 13.2522311 Surveyors & Mapping Scientists 30 30 0 11.52 16.5222502 Civil Engineering Technicians 60 80 20 15.34 13.7922505 Electrical & Electronic Engineering Technicians 150 200 50 14.76 16.8722508 Industrial Engineering Technicians 10 10 0 N/A 17.7722511 Mechanical Engineering Technicians 40 50 10 20.28 21.0522514 Drafters 300 330 30 14.08 15.9122517 Estimators & Drafters Utilities * * * N/A 20.0922521 Surveying & Mapping Technicians 80 100 20 11.45 12.9522599 All Other Engineering Technician 200 230 30 17.95 17.8824105 Chemists (except biochemists) 20 30 10 N/A 23.9424108 Meteorologists & Space Scientists * * * N/A 23.8424111 Geologists, Geophysicists & Oceanographers 190 150 -40 N/A 30.0124199 All Other Physical Scientists 50 50 0 N/A 24.8524302 Foresters & Conservation Scientists 10 10 0 N/A 20.1124305 Agricultural & Food Scientists 10 10 0 N/A 19.2324308 Biological Scientists 20 20 0 N/A 19.1724311 Medical Scientists * * * N/A N/A24399 All Other Life Scientists 10 10 0 N/A 20.1124502 Biological, Agricultural & Food Technicians 10 10 0 N/A 15.6124505 Chemical Technicians (except health) 20 20 0 9.17 19.1124511 Petroleum Technicians 170 170 0 21.84 18.8724599 All Other Science Technicians 60 70 10 11.04 15.2725102 Systems Analysts 150 260 110 18.44 22.08

A-43
Table A-5
Regional Labor Market Area 3—Assumption, Lafourche, and Terrebonne Parishes Occupational Employment Statistics
(Louisiana Department of Labor)
Occupation Code
Occupational Title
1998 Employment
Projected 2008
Employment
Projected Total
Growth
Area 3 Average Wage ($)
State Average Wage ($)
25103 Data Base Administrators 20 20 0 16.89 20.7325104 Computer Support Specialists 110 180 70 16.71 16.225105 Computer Programmers 160 200 40 17.57 21.0225108 Computer Programmer Aides 20 20 0 12.33 14.4525111 Numerical Tool/Process Control Programmers 10 10 0 13.27 17.2725199 All Other Computer Scientists 10 30 20 11.62 20.6825302 Operations/Systems Analysts (except computer) 10 10 0 N/A 19.3425310 Mathematical Scientists * * * N/A N/A25315 Financial Analysts (statistical) * * * N/A 23.9525319 Mathematicians & Math Scientists * * * 13.93 N/A27102 Economists & Market Research Analysts 10 10 0 N/A 22.3127105 Urban & Regional Planners 20 30 10 N/A 17.1227108 Psychologists 50 60 10 17.47 19.3527199 All Other Social Scientists 10 10 0 16.05 15.4327302 Social Workers (medical & psychiatric) 90 120 30 14.48 15.827305 Social Workers (except medical & psychiatric) 170 240 70 N/A 14.4827307 Residential Counselors 60 90 30 7.88 7.4427308 Human Services Workers 100 150 50 8.43 9.4227311 Recreation Workers 70 90 20 N/A 7.627502 Clergy * * * N/A 15.0227505 Religious Activities & Education Directors * * * N/A 16.8728102 Judges & Magistrates 20 30 10 N/A 14.4428105 Administrative Law Judges 20 20 0 11.64 N/A28108 Lawyers 310 340 30 26.59 32.7428302 Law Clerks 40 40 0 N/A 12.2228305 Paralegals 50 80 30 N/A 13.9228308 Title Searchers * * * N/A 13.54

A-44
Table A-5
Regional Labor Market Area 3—Assumption, Lafourche, and Terrebonne Parishes Occupational Employment Statistics
(Louisiana Department of Labor)
Occupation Code
Occupational Title
1998 Employment
Projected 2008
Employment
Projected Total
Growth
Area 3 Average Wage ($)
State Average Wage ($)
28311 Title Examiners & Abstractors * * * N/A 14.0528399 All Other Legal Assistants 30 40 10 N/A 12.5931111 Lecturers * * * N/A N/A31114 Nursing Instructors 30 30 0 N/A **31117 Graduate Assistants (teaching) 100 130 30 N/A N/A31202 Life Sciences Teachers, College 10 10 0 N/A **31204 Chemistry Teachers, College * * * N/A **31206 Physics Teachers, College * * * N/A **31209 All Other Physics Science Teachers, Postsecondary * * * N/A **31211 Health Diagnostics Teachers, Postsecondary 40 60 20 N/A N/A31212 Health Specialties Teachers, College 10 10 0 N/A N/A31213 Communications Teachers, Post Secondary 10 10 0 N/A N/A31214 English Language & Literature Teachers, Postsecondary 20 20 0 N/A **31215 Foreign Language & Literature Teachers, Postsecondary * * * N/A **31218 Art, Drama & Music Teachers, College 20 30 10 N/A **31222 Engineering Teachers, College 40 60 20 N/A N/A31224 Mathematical Sciences Teachers, College 10 20 10 N/A **31226 Computer Science Teachers, College 30 40 10 N/A **31231 Anthropology & Sociology Teachers, Postsecondary * * * N/A **31233 Economics Teachers, Postsecondary * * * N/A **31234 Geography Teachers, Postsecondary * * * N/A N/A31235 History Teachers, Postsecondary * * * N/A **31236 Political Science Teachers, Postsecondary * * * N/A **31237 Psychology Teachers, Postsecondary 10 10 0 N/A **31242 Business Teachers, Postsecondary 10 20 10 N/A **31244 Law Teachers, Postsecondary * * * N/A N/A31246 Criminal Justice & Law Enforce Teachers, Postsecondary * * * N/A **

A-45
Table A-5
Regional Labor Market Area 3—Assumption, Lafourche, and Terrebonne Parishes Occupational Employment Statistics
(Louisiana Department of Labor)
Occupation Code
Occupational Title
1998 Employment
Projected 2008
Employment
Projected Total
Growth
Area 3 Average Wage ($)
State Average Wage ($)
31247 Social Work Teachers, Postsecondary 10 10 0 N/A **31252 Education Teachers, Postsecondary 10 20 10 N/A **31254 Philosophy and Religion Teachers, Postsecondary * * * N/A **31256 Library Science Teachers, Postsecondary * * * N/A N/A31258 Parks, Recreation, Leisure, & Fitness Studies Teachers * * * N/A N/A31262 Home Economic Teachers, Postsecondary * * * N/A N/A31299 All Other Postsecondary Teachers 290 370 80 ** **31303 Teachers, Preschool 110 140 30 10.06 8.3531304 Teachers, Kindergarten 150 170 20 ** **31305 Teachers, Elementary School 1,330 1,550 220 ** **31308 Teachers, Secondary School 740 940 200 N/A **31311 Teachers, Special Education 430 600 170 ** **31314 Teachers, Vocational Education & Training 330 370 40 14.3 13.4531317 Instructors, Nonvocational Education 50 60 10 N/A 11.0431321 Instructors & Coaches-Sports, Physical Training 80 100 20 9.79 13.0831399 All Other Teachers, Instructors 300 340 40 ** **31502 Librarians 100 110 10 21.39 17.9731505 Library Technical Assistants 40 50 10 N/A 9.2831508 Audio Visual Specialists * * * N/A 14.1531511 Curators, Archivists & Museum Technicians * * * N/A 10.9731514 Counselors (vocational & educational) 150 190 40 23.64 18.0931517 Education Program Specialists 60 70 10 22.75 14.3831521 Teacher Aides (paraprofessional) 210 290 80 N/A 6.1932102 Physicians & Surgeons 280 330 50 55.15 44.6932105 Dentists 50 50 0 30.95 47.5232108 Optometrists 20 20 0 N/A 28.6732111 Podiatrists * * * N/A 41.55

A-46
Table A-5
Regional Labor Market Area 3—Assumption, Lafourche, and Terrebonne Parishes Occupational Employment Statistics
(Louisiana Department of Labor)
Occupation Code
Occupational Title
1998 Employment
Projected 2008
Employment
Projected Total
Growth
Area 3 Average Wage ($)
State Average Wage ($)
32113 Chiropractors 20 30 10 N/A N/A32114 Veterinarians 10 20 10 22.3 26.4232199 All Other Health Practitioners 10 10 0 33.82 28.9932302 Respiratory Therapists 60 90 30 14.25 16.4132305 Occupational Therapists 40 50 10 28.56 26.2332308 Physical Therapists 60 80 20 36.14 30.3432311 Corrective & Manual Arts Therapists * * * N/A 17.8632314 Speech Pathologists & Audiologists 70 100 30 21.15 19.6332317 Recreational Therapists 20 20 0 N/A 13.0332399 All Other Therapists 20 20 0 14.94 16.7532502 Registered Nurses 1,230 1,450 220 18.46 20.1932505 Licensed Practical Nurses 650 750 100 11.7 11.6832508 Emergency Medical Technicians 50 80 30 10.15 9.9932511 Physician Assistants 40 50 10 N/A 15.8232514 Opticians (dispensing) 50 60 10 9.03 12.4832517 Pharmacists 120 120 0 26.08 26.0832518 Pharmacy Technicians 70 80 10 7.43 832521 Dietitians 30 30 0 15.75 1632523 Dietetic Technicians 20 30 10 N/A 8.8932902 Medical Laboratory Technologists 110 120 10 16.69 17.8232905 Medical Laboratory Technicians 100 110 10 12.41 11.7332908 Dental Hygienists 60 90 30 12.96 19.3932911 Medical Records Technicians 40 60 20 8.33 10.0432913 Radiation Therapists 20 20 0 N/A 18.4632914 Nuclear Medicine Technologists 10 10 0 20.34 19.3132919 Radiologic Technologists 100 110 10 13.71 14.632923 Electroencephalograph Technologists * * * N/A 13.13

A-47
Table A-5
Regional Labor Market Area 3—Assumption, Lafourche, and Terrebonne Parishes Occupational Employment Statistics
(Louisiana Department of Labor)
Occupation Code
Occupational Title
1998 Employment
Projected 2008
Employment
Projected Total
Growth
Area 3 Average Wage ($)
State Average Wage ($)
32925 Cardiology Technologists 20 20 0 N/A 15.0832926 Electrocardiograph Technicians 10 10 0 8.32 8.9832928 Surgical Technologists 40 50 10 9.89 11.5732931 Psychiatric Technicians 60 60 0 N/A 8.1632951 Veterinary Technicians 10 10 0 N/A 8.0632999 All Other Health Professional, Paraprofessional,Technician 430 570 140 14.75 14.1534002 Writers & Editors 50 80 30 15.24 13.3334005 Technical Writers & Editors 10 10 0 N/A 17.0534008 Public Relations Specialists 40 40 0 17.02 15.1534011 Reporters 30 30 0 N/A 13.6834014 TV & Radio News Broadcasters * * * N/A 22.6434017 Announcers-Radio & TV 30 30 0 N/A 8.7734023 Photographers 50 60 10 N/A 9.5934026 Camera Operators-TV & Motion Pictures 10 10 0 N/A 10.6434028 Broadcast Technicians 20 20 0 N/A 10.0534032 Film Editors * * * N/A 18.7434035 Artists & Commercial Artists 60 80 20 N/A 12.5234038 Designers (except interior designers) 150 210 60 9.49 19.7934041 Interior Designers 30 30 0 7.01 10.3934044 Merchandise Displayers & Window Trimmers 20 20 0 7.95 8.834051 Musicians (instrumental) 10 10 0 N/A N/A34053 Dancers & Choreographers * * * N/A 7.6134056 Producers, Directors, Actors & Entertainers 20 30 10 ** N/A34058 Athletes, Coaches, Umpires & Related Workers 10 20 10 N/A N/A39002 Airplane Dispatchers & Air Traffic Controllers * * * N/A 26.4239005 Traffic Technicians * * * N/A 14.5439008 Radio Operators 10 10 0 N/A 8.02

A-48
Table A-5
Regional Labor Market Area 3—Assumption, Lafourche, and Terrebonne Parishes Occupational Employment Statistics
(Louisiana Department of Labor)
Occupation Code
Occupational Title
1998 Employment
Projected 2008
Employment
Projected Total
Growth
Area 3 Average Wage ($)
State Average Wage ($)
39011 Funeral Directors & Morticians 10 10 0 N/A 14.0439014 Embalmers 10 10 0 13.94 13.0739999 All Other Professional, Paraprofessional, Technician 310 370 60 12.65 16.9341002 Supervisors-Sales 1,530 1,730 200 13.45 14.8443002 Insurance Sales Agents 120 140 20 22.7 18.6443005 Real Estate Brokers 10 10 0 N/A 37.7743008 Real Estate Sales Agents 60 70 10 N/A 14.2643011 Real Estate Appraisers 10 10 0 N/A 19.4343014 Securities Sales Representatives 30 40 10 N/A 27.5643017 Business Services Sales Representatives 160 220 60 18.63 17.1843021 Travel Agents 70 70 0 N/A 10.9443023 Advertising Sales Representatives 50 70 20 13.36 16.1143099 All Other Service Sales Occupations 50 80 30 14.19 14.8549002 Sales Engineers 80 100 20 25.21 23.6649005 Sales Representatives-Scientific Product, Services 300 360 60 17.53 20.649008 Sales Representatives (except scientific, retail) 650 800 150 19.52 17.4149011 Retail Salespersons 2,340 2,740 400 8.48 8.5149014 Parts Salespersons 230 260 30 10.09 11.3749017 Counter & Rental Clerks 230 300 70 7.84 7.5349021 Stock Clerks-Sales Floor 1,030 1,020 -10 6.94 6.8949023 Cashiers 2,710 3,020 310 6.25 6.4449026 Telemarketers, Vendors, Door-to-Door Sales Workers 190 270 80 13.62 9.7349034 Demonstrators and Promoters 30 30 0 N/A 8.3349075 Gaming Change Person 20 20 0 N/A N/A49076 Casino Cage Cashiers 10 10 0 N/A N/A49077 Currency Counting Clerk 10 10 0 N/A N/A49999 All Other Sales & Related Workers 310 370 60 11.89 10.85

A-49
Table A-5
Regional Labor Market Area 3—Assumption, Lafourche, and Terrebonne Parishes Occupational Employment Statistics
(Louisiana Department of Labor)
Occupation Code
Occupational Title
1998 Employment
Projected 2008
Employment
Projected Total
Growth
Area 3 Average Wage ($)
State Average Wage ($)
51002 Supervisors-Clerical Workers 820 1,010 190 13.43 14.0953102 Tellers 340 320 -20 6.48 7.6653105 New Accounts Clerks-Banking 60 70 10 N/A 8.9653108 Transit Clerks-Banking * * * N/A 8.2553111 Loan Interviewers 10 10 0 N/A 11.8753114 Credit Authorizers * * * N/A 10.3453117 Credit Checkers 10 10 0 N/A 9.2553121 Loan & Credit Clerks 70 70 0 8.1 9.7253123 Adjustment Clerks-Merchandise & Billing 160 210 50 8.29 9.4853126 Statement Clerks-Banking * * * N/A 9.4453128 Brokerage Clerks * * * N/A 12.5553302 Insurance Adjusters, Examiners & Investigators 60 80 20 N/A 18.8353305 Insurance Appraisers-Auto Damage * * * N/A 20.2653308 Insurance Examining Clerks-Banking 10 10 0 N/A 8.8953311 Insurance Claims Clerks 50 60 10 9.09 10.4153314 Insurance Policy Processing Clerks 50 60 10 9.14 10.1753502 Welfare Eligibility Workers 70 70 0 N/A 13.3253505 Investigators (clerical) * * * N/A 10.653508 Bill & Account Collectors 120 150 30 9.67 9.9353702 Court Clerks 100 140 40 10.75 11.2153705 Municipal Clerks 40 60 20 7.23 10.2653708 License Clerks 30 30 0 N/A 8.7953802 Travel Clerks * * * N/A 7.8553805 Reservation & Transportation Ticket Agents 50 50 0 N/A 11.5653808 Hotel Desk Clerks 50 60 10 7.06 6.8753902 Library Assistants & Bookmobile Drivers 50 70 20 7.67 7.3553905 Teacher Aides (clerical) 400 560 160 8.71 7.04

A-50
Table A-5
Regional Labor Market Area 3—Assumption, Lafourche, and Terrebonne Parishes Occupational Employment Statistics
(Louisiana Department of Labor)
Occupation Code
Occupational Title
1998 Employment
Projected 2008
Employment
Projected Total
Growth
Area 3 Average Wage ($)
State Average Wage ($)
53908 Advertising Clerks * * * N/A 9.3553911 Proofreaders 10 10 0 N/A 8.453914 Real Estate Clerks * * * N/A 10.7155102 Legal Secretaries 140 140 0 N/A 12.3555105 Medical Secretaries 90 100 10 8.95 8.8555108 Secretaries (except legal & medical) 1,480 1,550 70 8.67 9.7955302 Stenos, Court Reporters & Transcriptionists 120 140 20 10.38 11.6355305 Receptionists & Information Clerks 590 720 130 7.49 7.8255307 Typists (including word processing) 210 180 -30 8.14 8.5655314 Personnel Clerks (except payroll) 50 50 0 10.39 10.8655317 Correspondence Clerks 10 10 0 N/A 10.3355321 File Clerks 110 120 10 6.65 7.1855323 Order Clerks 120 130 10 8.28 9.7755326 Purchasing Clerks 20 20 0 8.17 10.5355328 Statistical Clerks 10 10 0 N/A 9.355332 Interviewing Clerks 60 70 10 7.9 8.0555335 Customer Service Representatives-Utilities 60 80 20 11.6 11.7255338 Bookkeeping & Accounting Clerks 1,060 1,070 10 9.37 10.1255341 Payroll Clerks 100 110 10 10.39 11.0555344 Billing, Cost & Rate Clerks 170 200 30 9.86 9.8755347 General Office Clerks 2,110 2,570 460 8.02 8.6756002 Billing/Posting/Calculating Machine Operators 50 50 0 8.91 8.9856005 Duplicating Machine Operators 20 30 10 6.86 8.4656008 Mail Machine Operators 10 20 10 N/A 7.4856011 Computer Operators (except peripheral equipment) 90 70 -20 9.47 11.0756014 Peripheral Computer Equipment Operators 10 10 0 N/A 8.9956017 Data Entry Keyers (except printing) 140 160 20 7.57 8.61

A-51
Table A-5
Regional Labor Market Area 3—Assumption, Lafourche, and Terrebonne Parishes Occupational Employment Statistics
(Louisiana Department of Labor)
Occupation Code
Occupational Title
1998 Employment
Projected 2008
Employment
Projected Total
Growth
Area 3 Average Wage ($)
State Average Wage ($)
56021 Data Entry Keyers (printing) * * * N/A 10.0756099 All Other Office Machine Operators 20 20 0 7.44 9.957102 Switchboard Operators 140 130 -10 7.39 7.1957108 Central Office Operators 10 10 0 N/A N/A57111 Telegraph & Teletype Operators * * * N/A 12.2557199 All Other Communication Operator 10 10 0 13.11 16.0757302 Mail Clerks, Except Mail Machine, Postal Service 40 50 10 N/A 8.0857305 Mail Carriers 70 70 0 N/A 16.2757308 Postal Service Clerks 10 10 0 N/A 16.1457311 Messengers 60 70 10 7.4 7.6358002 Dispatchers-Police, Fire & Ambulance 50 60 10 8.58 8.4458005 Dispatchers (except police, fire & ambulance) 270 340 70 13.3 13.3258008 Production & Expediting Clerks 150 180 30 12.71 13.6358011 Transportation Agents 10 10 0 N/A 10.6858014 Meter Readers-Utilities 40 50 10 10.1 9.2858017 Weighers, Measurers & Checkers (clerical) 20 20 0 9.1 9.6858021 Marking Clerks * * * N/A 7.4558023 Stock Clerks-Stockroom, Warehouse, Storage Yard 650 780 130 8.3 8.6558026 Order Fillers-Wholesale & Retail Sales 80 90 10 14.42 8.2958028 Shipping, Receiving & Traffic Clerks 390 440 50 11.22 11.4858099 All Other Material Workers 50 60 10 11.36 11.4259999 All Other Clerical & Admin Support 400 490 90 10.09 9.761002 Supervisors-Fire Fighting 30 40 10 N/A 14.7561005 Supervisors-Police & Detectives 40 50 10 10.34 15.9661008 Supervisors-Cleaning & Building Services 50 50 0 10.57 9.2661075 Boxtender, Dice * * * N/A N/A61080 Gaming Supervisors 20 20 0 N/A N/A

A-52
Table A-5
Regional Labor Market Area 3—Assumption, Lafourche, and Terrebonne Parishes Occupational Employment Statistics
(Louisiana Department of Labor)
Occupation Code
Occupational Title
1998 Employment
Projected 2008
Employment
Projected Total
Growth
Area 3 Average Wage ($)
State Average Wage ($)
61099 All Other Service Supervisors 450 570 120 10.32 11.1762021 Cooks-Private Household * * * N/A N/A62031 Housekeepers & Butlers-Private Household * * * N/A N/A62041 Child Care Workers-Private Household 50 40 -10 N/A N/A62051 Cleaners & Servants-Private Household 90 120 30 N/A N/A63002 Fire Inspectors 10 20 10 N/A 18.363005 Forest Fire Inspectors & Prevention Specialists 30 30 0 N/A 14.6563008 Fire Fighters 110 150 40 N/A 10.563011 Police Detectives 50 70 20 N/A 12.7263014 Police Patrol Officers 320 510 190 10.27 10.0963017 Correction Officers & Jailers 370 580 210 N/A 9.5663021 Parking Enforcement Officers 10 10 0 N/A N/A63023 Bailiffs 10 20 10 N/A 8.0163028 Criminal Investigators-Public Service * * * N/A 2763032 Sheriffs & Deputy Sheriffs 90 140 50 N/A 10.0363035 Private Detectives & Investigators 20 30 10 8.05 11.7563038 Railroad & Transit Police * * * N/A 15.6563041 Fish & Game Wardens 10 10 0 N/A N/A63044 Crossing Guards 30 40 10 N/A 6.4763047 Security Guards 500 650 150 7.25 7.5463099 All Other Protective Service Workers 80 100 20 10.08 8.8565002 Hosts & Hostesses-Restaurants & Lounges 110 130 20 5.71 6.4865005 Bartenders 220 230 10 6.38 6.5965008 Waiters & Waitresses 870 1,100 230 5.56 665011 Food Servers (outside) 30 40 10 N/A 6.1665014 Dining Room, Cafeteria & Bartender Helpers 160 170 10 5.62 5.9565017 Counter Attendants-Coffee Shop or Cafeteria 200 220 20 6.7 6.52

A-53
Table A-5
Regional Labor Market Area 3—Assumption, Lafourche, and Terrebonne Parishes Occupational Employment Statistics
(Louisiana Department of Labor)
Occupation Code
Occupational Title
1998 Employment
Projected 2008
Employment
Projected Total
Growth
Area 3 Average Wage ($)
State Average Wage ($)
65021 Bakers-Bakery Shops & Restaurants 150 170 20 6.63 7.4165023 Meat Cutters 190 170 -20 9.07 8.8465026 Cooks-Restaurants 350 450 100 6.43 7.1565028 Cooks-Institution or Cafeteria 320 340 20 8.95 6.7965032 Cooks-Fast Food 590 760 170 5.57 5.7565035 Cooks-Short Order 190 240 50 N/A 6.3665038 Food Preparation Workers 710 810 100 6.51 6.2165041 Fast Food Workers 810 990 180 5.8 5.9265099 All Other Food Service Workers 460 480 20 7.31 6.8566002 Dental Assistants 110 150 40 8.31 8.366005 Medical Assistants 140 210 70 9.07 8.2366008 Nursing Aides 910 1,110 200 6.43 6.366011 Home Health Aides 210 340 130 6.76 8.0966014 Psychiatric Aides 60 70 10 N/A 7.4166017 Physical Therapy Assistants & Aides 40 50 10 8.16 10.9866021 Occupational Therapy Assistants & Aides 10 10 0 N/A 12.4266023 Ambulance Drivers & Attendants 10 10 0 N/A 7.1766026 Pharmacy Assistants 30 30 0 N/A N/A66099 All Other Health Service Workers 120 150 30 7.27 7.9367002 Maids & Room Cleaners 470 530 60 6.58 6.267005 Janitors 1,260 1,410 150 6.66 6.8467008 Pest Controllers & Assistants 60 80 20 N/A 9.9667099 All Other Clean, Building Service 160 180 20 8.48 7.1268002 Barbers * * * N/A 9.1468005 Cosmetologists 150 180 30 5.77 8.3368008 Manicurists 10 10 0 N/A 6.5568011 Shampooers 10 10 0 N/A 6.17
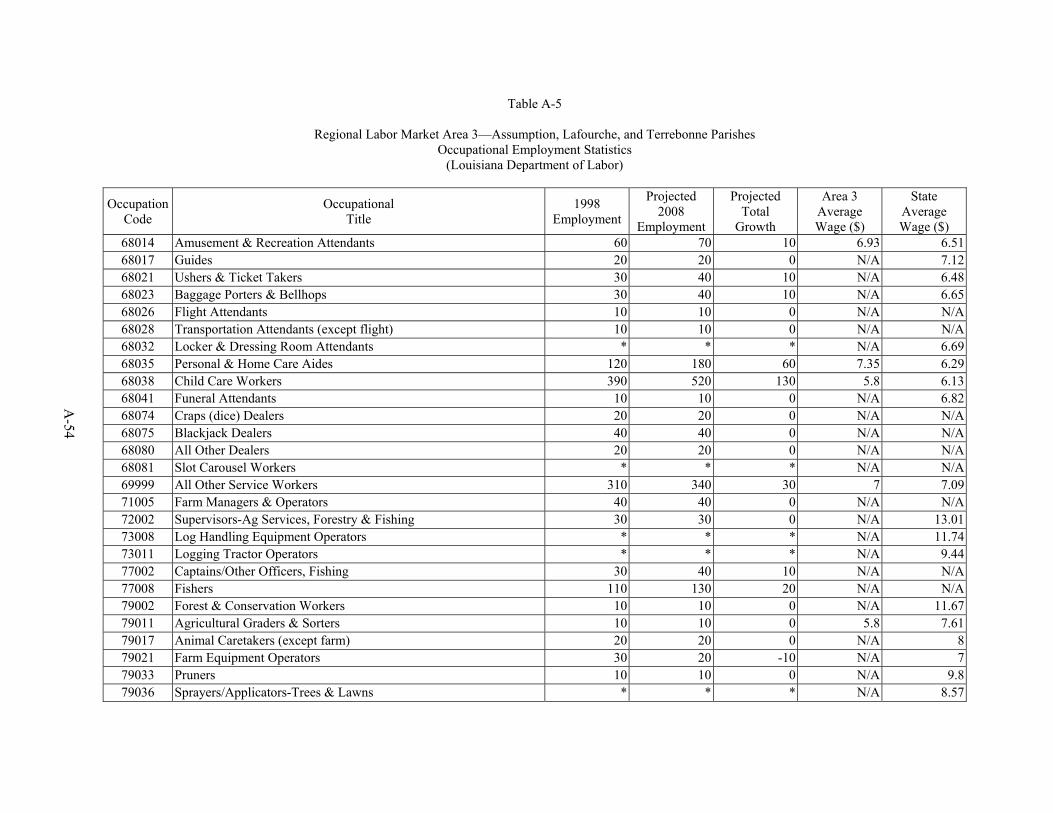
A-54
Table A-5
Regional Labor Market Area 3—Assumption, Lafourche, and Terrebonne Parishes Occupational Employment Statistics
(Louisiana Department of Labor)
Occupation Code
Occupational Title
1998 Employment
Projected 2008
Employment
Projected Total
Growth
Area 3 Average Wage ($)
State Average Wage ($)
68014 Amusement & Recreation Attendants 60 70 10 6.93 6.5168017 Guides 20 20 0 N/A 7.1268021 Ushers & Ticket Takers 30 40 10 N/A 6.4868023 Baggage Porters & Bellhops 30 40 10 N/A 6.6568026 Flight Attendants 10 10 0 N/A N/A68028 Transportation Attendants (except flight) 10 10 0 N/A N/A68032 Locker & Dressing Room Attendants * * * N/A 6.6968035 Personal & Home Care Aides 120 180 60 7.35 6.2968038 Child Care Workers 390 520 130 5.8 6.1368041 Funeral Attendants 10 10 0 N/A 6.8268074 Craps (dice) Dealers 20 20 0 N/A N/A68075 Blackjack Dealers 40 40 0 N/A N/A68080 All Other Dealers 20 20 0 N/A N/A68081 Slot Carousel Workers * * * N/A N/A69999 All Other Service Workers 310 340 30 7 7.0971005 Farm Managers & Operators 40 40 0 N/A N/A72002 Supervisors-Ag Services, Forestry & Fishing 30 30 0 N/A 13.0173008 Log Handling Equipment Operators * * * N/A 11.7473011 Logging Tractor Operators * * * N/A 9.4477002 Captains/Other Officers, Fishing 30 40 10 N/A N/A77008 Fishers 110 130 20 N/A N/A79002 Forest & Conservation Workers 10 10 0 N/A 11.6779011 Agricultural Graders & Sorters 10 10 0 5.8 7.6179017 Animal Caretakers (except farm) 20 20 0 N/A 879021 Farm Equipment Operators 30 20 -10 N/A 779033 Pruners 10 10 0 N/A 9.879036 Sprayers/Applicators-Trees & Lawns * * * N/A 8.57

A-55
Table A-5
Regional Labor Market Area 3—Assumption, Lafourche, and Terrebonne Parishes Occupational Employment Statistics
(Louisiana Department of Labor)
Occupation Code
Occupational Title
1998 Employment
Projected 2008
Employment
Projected Total
Growth
Area 3 Average Wage ($)
State Average Wage ($)
79041 Laborers, Landscape/Groundkeep 420 550 130 7.03 7.6879801 Farm Workers 490 480 -10 N/A N/A79806 Veterinary Assistants 20 30 10 6.01 7.0579856 Farm Workers, Food & Fiber Crops 20 20 0 N/A 6.5179858 Farm Workers, Farm & Ranch Animals * * * N/A 5.7679999 All Other Agriculture, Forest, Fish 140 150 10 8.9 9.0181002 Supervisors-Mechanics, Installers & Repairers 310 380 70 18.05 19.781005 Supervisors-Construction & Extractive Workers 790 1,040 250 24.38 18.7681008 Supervisors-Production & Operating Workers 310 380 70 19.71 20.6381011 Supervisors-Transportation/Material Moving Equipment Operators 170 200 30 17.92 19.2481017 Supervisors-Helpers, Laborers, Material Handler 170 210 40 16.34 15.3381099 All Other First Line Supervisors, Prod. Construction Maintenance 400 500 100 20.32 18.9983002 Precision Inspectors, Testers & Graders 90 100 10 15.27 16.2683005 Production Inspectors, Testers & Graders 150 170 20 12.7 14.2983008 Transportation Inspectors 20 20 0 N/A 15.2583099 All Other Inspectors, Testers 90 110 20 13.78 13.7285110 Industrial Machinery Mechanics 380 460 80 16.33 15.4585116 Marine Equipment Mechanics 100 130 30 13.6 14.5485118 Machinery Mechanics-Water or Power Plant 40 40 0 N/A 18.8285119 All Other Machinery Maint. Mechanics 40 50 10 12.79 19.9485123 Millwrights 60 90 30 N/A 14.5985128 Machinery Maintenance Workers 100 130 30 10.53 13.8185132 Maintenance Repairers (general) 820 930 110 9.42 10.6585302 Auto Mechanics 580 750 170 12.75 13.285305 Auto Body Repairers 130 160 30 13.52 12.5385308 Motorcycle Repairers 10 10 0 N/A 10.3185311 Bus, Truck & Diesel Engine Mechanics 150 190 40 12.67 13.48

A-56
Table A-5
Regional Labor Market Area 3—Assumption, Lafourche, and Terrebonne Parishes Occupational Employment Statistics
(Louisiana Department of Labor)
Occupation Code
Occupational Title
1998 Employment
Projected 2008
Employment
Projected Total
Growth
Area 3 Average Wage ($)
State Average Wage ($)
85314 Mobile Heavy Equip Mechanics (except engines) 120 160 40 12.74 13.6485321 Farm Equipment Mechanics 30 30 0 N/A 10.5685323 Aircraft Mechanics 30 30 0 N/A 14.9385326 Aircraft Engine Specialists * * * N/A 15.4985328 Small Engine Specialists 20 20 0 N/A 10.0385502 Central Telephone Office/Pbx Installers, Repairers 10 10 0 19.05 20.1785505 Frame Wirers-Central Telephone Office * * * N/A 20.0785508 Telegraph & Teletype Installers & Repairers * * * N/A N/A85514 Radio Mechanics * * * N/A 14.6185599 All Other Communications Equip Mechanics 30 40 10 10.67 13.8385702 Telephone & Cable TV Line Installers, Repairers 70 100 30 14.76 14.6885705 Data Processing Equipment Repairers 10 20 10 N/A 14.4185708 Electronic Home Entertainment Equipment Repairers 20 20 0 N/A 11.285711 Electric Home Appliance/Power Tool Repairers 20 30 10 9.8 10.9785714 Electric Motor & Transformer Repairers 40 30 -10 N/A 13.1885717 Electronics Repairers-Commercial/Indust Equip 30 30 0 13.79 17.4385721 Powerhouse, Substation & Relay Electricians * * * N/A 18.3385723 Electrical Power Line Installers & Repairers 60 80 20 N/A 16.0885726 Telephone Installers & Repairers 20 10 -10 N/A 17.8485728 Electrical Repairers-Transportation Equipment 60 100 40 N/A 14.7785799 All Other Electric, Electronic Mechanics 50 70 20 18.32 13.2685902 Heating, A/C & Refrigeration Mechanics 190 250 60 11.56 12.5985905 Precision Instrument Repairers 30 40 10 17.55 19.885908 Electromedical Equipment Repairers 10 10 0 N/A 13.4785911 Electric Meter Installers & Repairers 10 10 0 N/A 17.0885914 Camera & Photographic Equipment Repairers 20 20 0 N/A 6.9885917 Watchmakers * * * N/A N/A

A-57
Table A-5
Regional Labor Market Area 3—Assumption, Lafourche, and Terrebonne Parishes Occupational Employment Statistics
(Louisiana Department of Labor)
Occupation Code
Occupational Title
1998 Employment
Projected 2008
Employment
Projected Total
Growth
Area 3 Average Wage ($)
State Average Wage ($)
85921 Musical Instrument Repairers & Tuners * * * N/A 9.8985923 Locksmiths & Safe Repairers 10 10 0 N/A 11.5685926 Office Machine Repairers 20 30 10 N/A 11.2985928 Mechanical Control Installers & Repairers 10 10 0 N/A 16.9585932 Elevator Installers & Repairers * * * N/A N/A85935 Riggers 220 320 100 10.27 12.9485938 Mobile Home/Prefab Building Install/Repairers 20 30 10 9.3 9.985944 Gas Appliance Repairers 10 10 0 N/A 15.3185947 Coin & Vending Machine Servicers & Repairers 10 10 0 N/A 10.8785953 Tire Repairers & Changers 70 80 10 6.5 7.3685956 Menders-Garments & Linens * * * N/A 7.0185975 Slot & Amusement Machine Repairers * * * N/A N/A85999 All Other Mechanics, Installers & Repairers 470 610 140 12.97 13.5987102 Carpenters 520 640 120 12.62 12.8187105 Ceiling Tile Installers 10 20 10 N/A 12.8887108 Drywall Installers 110 140 30 N/A 12.8487111 Tapers * * * N/A 15.7787114 Lathers * * * N/A 14.6987202 Electricians 590 770 180 14.57 15.2187302 Brickmasons 60 90 30 N/A 13.1387305 Stonemasons * * * N/A N/A87308 Hard Tile Setters 10 20 10 N/A 9.2387311 Concrete & Terrazzo Finishers 50 70 20 9.19 11.6687314 Reinforcing Metal Workers 10 20 10 N/A 16.9887317 Plasterers & Stucco Masons 10 20 10 N/A 12.3587402 Painters & Paperhangers Construction 720 910 190 11.17 11.0187502 Plumbers & Pipefitters 710 890 180 14.22 15.25

A-58
Table A-5
Regional Labor Market Area 3—Assumption, Lafourche, and Terrebonne Parishes Occupational Employment Statistics
(Louisiana Department of Labor)
Occupation Code
Occupational Title
1998 Employment
Projected 2008
Employment
Projected Total
Growth
Area 3 Average Wage ($)
State Average Wage ($)
87505 Pipelaying Fitters 20 20 0 N/A 20.5687508 Pipelayers 20 30 10 8.88 9.7487511 Septic Tank & Sewer Pipe Servicers 10 10 0 N/A 8.7787602 Carpet Installers 30 30 0 12.42 10.9387605 Floor Layers (except carpet, wood & hard tile) * * * N/A 11.5787608 Floor Sanding Machine Operators * * * N/A N/A87705 Pile Driver Operators 10 10 0 N/A 14.4287708 Paving & Surfacing Equipment Operators 30 50 20 N/A 9.8187711 Highway Maintenance Workers 60 80 20 9.73 9.5987714 Rail Track Laying Equipment Operators * * * N/A N/A87802 Insulation Workers 220 290 70 N/A 12.5587803 Hazardous Materials Removal Workers 30 40 10 N/A 12.7687805 Sheet Metal Duct Installers 10 20 10 N/A 11.7287808 Roofers 50 70 20 N/A 10.7287811 Glaziers 40 50 10 N/A 10.1287814 Structural Metal Workers 30 40 10 12.37 12.7387817 Fence Erectors * * * N/A 7.3487899 All Other Construction Workers 130 180 50 9.18 11.9187902 Earth Drillers (except oil & gas) 10 10 0 N/A 13.5587905 Blasters & Explosives Workers 10 10 0 N/A 13.6787911 Rotary Drill Operators, Oil & Gas 210 300 90 N/A 18.1987914 Derrick Operators, Oil & Gas 220 310 90 N/A 17.7987917 Service Unit Operators, Oil & Gas 210 310 100 13.32 12.5487921 Roustabouts 590 670 80 N/A 9.7387989 All Other Extractive Workers (except helpers) 260 390 130 13.64 14.1187999 All Other Construction & Extractive Workers 70 100 30 10.18 10.0789102 Tool & Die Makers 10 10 0 N/A 18.99

A-59
Table A-5
Regional Labor Market Area 3—Assumption, Lafourche, and Terrebonne Parishes Occupational Employment Statistics
(Louisiana Department of Labor)
Occupation Code
Occupational Title
1998 Employment
Projected 2008
Employment
Projected Total
Growth
Area 3 Average Wage ($)
State Average Wage ($)
89108 Machinists 680 900 220 13.97 14.61 89111 Tool Grinders, Filers & Sharpeners 10 10 0 N/A 14.09 89117 Precision Layout Workers, Metal 10 10 0 N/A 14.23 89121 Shipfitters 230 300 70 13.17 12.38 89123 Jewelers & Silversmiths 10 10 0 13.51 11.28 89132 Sheet Metal Workers 160 200 40 9.7 11.86 89135 Boilermakers 110 150 40 N/A 17.89 89199 All Other Precision Metal Workers 40 50 10 12.12 14.12 89302 Pattern & Model Makers, Wood * * * N/A 12 89308 Wood Machinists * * * N/A 8.55 89311 Cabinetmakers & Bench Carpenters 60 80 20 N/A 9.83 89314 Furniture Finishers 10 10 0 N/A 9.1 89399 All Other Precision Woodworkers * * * N/A 9.58 89505 Custom Tailors & Sewers 30 30 0 6.39 7.31 89508 Upholsterers 10 10 0 N/A 10.91 89511 Precision Shoe & Leather Workers * * * N/A 7.78 89514 Spotters-Dry Cleaning * * * N/A 6.65 89517 Pressers-Delicate Fabrics 10 10 0 N/A 6.18 89702 Hand Compositors & Typesetters 10 0 -10 N/A 9.75 89705 Job Printers * * * N/A 11.59 89707 Electronic Pagination System Operators * * * N/A 11.64 89713 Camera Operators * * * N/A 10.22 89717 Strippers-Printing * * * N/A 12.71 89718 Platemakers * * * N/A 10.44 89719 All Other Lithographic & Photoengraving Workers * * * N/A N/A 89721 Bookbinders * * * N/A 9.46 89799 All Other Precision Printing Workers * * * N/A 10.4

A-60
Table A-5
Regional Labor Market Area 3—Assumption, Lafourche, and Terrebonne Parishes Occupational Employment Statistics
(Louisiana Department of Labor)
Occupation Code
Occupational Title
1998 Employment
Projected 2008
Employment
Projected Total
Growth
Area 3 Average Wage ($)
State Average Wage ($)
89805 Bakers, Manufacturing 40 20 -20 N/A 9.61 89808 Food Batchmakers 20 10 -10 N/A 9.09 89902 Foundry Mold & Core Makers (precision) * * * N/A 11.38 89905 Molders & Shapers (except jewelry & foundry) * * * N/A N/A 89911 Detail Design Decorators (precision) 10 10 0 N/A 7.77 89914 Photographic Process Workers (precision) 10 10 0 N/A 7.64 89917 Optical Goods Workers (precision) * * * N/A 10.11 89921 Dental Laboratory Technicians (precision) 10 10 0 N/A 11.48 89923 Medical Appliance Makers * * * N/A 17.95 89999 All Other Precision Workers 100 120 20 N/A 11.15 91102 Sawing Machine Setters, Metal/Plastic 10 10 0 9.61 9.67 91105 Lathe & Turning Machine Setters, Metal/Plastic 20 30 10 N/A 11.82 91108 Drilling & Boring Machine Setters, Metal/Plastic 10 10 0 10.58 10.42 91111 Milling & Planing Machine Setters, Metal/Plastic 20 30 10 15.2 14.61 91114 Grinding/Buffing Machine Setters, Metal/Plastic 10 10 0 N/A 8.73 91117 Machine Tool Cutting Operators, Metal/Plastic 20 20 0 N/A 9.74 91302 Punching Machine Setters, Metal/Plastic 10 10 0 N/A 12.18 91305 Press & Brake Machine Setters, Metal/Plastic 20 20 0 N/A 9.39 91308 Shear & Slitter Machine Setters, Metal/Plastic 10 10 0 N/A 7.2 91311 Extruding Machine Setters, Metal/Plastic * * * N/A 10.66 91314 Rolling Machine Setters, Metal/Plastic * * * N/A N/A 91317 Forging Machine Setters, Metal/Plastic 20 20 0 N/A N/A 91321 Machine Forming Operators, Metal/Plastic 40 40 0 13.12 9.73 91502 Numerical Control Machine Tool Operators, Metal/Plastic 40 70 30 12.15 12.3 91505 Combination Machine Tool Setters, Metal/Plastic 10 10 0 N/A 10.97 91508 Combination Machine Tool Operators, Metal/Plastic 20 30 10 N/A 15.05 91702 Welding Machine Setters 10 10 0 N/A 10.08

A-61
Table A-5
Regional Labor Market Area 3—Assumption, Lafourche, and Terrebonne Parishes Occupational Employment Statistics
(Louisiana Department of Labor)
Occupation Code
Occupational Title
1998 Employment
Projected 2008
Employment
Projected Total
Growth
Area 3 Average Wage ($)
State Average Wage ($)
91705 Welding Machine Operators 120 160 40 N/A 13.52 91714 Metal Fabricators-Structural Metal Products 50 70 20 N/A 12.76 91902 Plastic Molding Machine Setters * * * N/A 12.83 91905 Plastic Molding Machine Operators * * * N/A N/A 91908 Metal Molding & Casting Machine Setters 40 50 10 N/A 11.28 91911 Metal Molding & Casting Machine Operators 10 10 0 N/A N/A 91917 Electrolytic Plating Machine Setters, Metal/Plastic 10 20 10 N/A 8.3 91921 Electrolytic Plating Machine Operators, Metal/Plastic * * * N/A 10.98 91923 Nonelectrolytic Plating Machine Setters, Metal/Plastic * * * N/A N/A 91926 Nonelectrolytic Plating Machine Operators, Metal/Plastic * * * N/A N/A 91932 Heat Treating Machine Operators, Metal/Plastic * * * N/A N/A 91935 Furnace Operators & Tenders * * * N/A 10.46 92197 All Other Metal & Plastic Machine Setters/Operators * * * 20.88 11.54 92198 All Other Metal/Plastic Operators/Tenders 20 30 10 14.92 9.41 92308 Sawing Machine Operators & Tenders * * * N/A 9.49 92512 Offset Lithographic Press Setters * * * N/A 11.34 92515 Letterpress Setters * * * N/A 13.06 92519 All Other Printing Press Setters/Operators * * * N/A 9.93 92524 Screen Printing Machine Setters 10 10 0 N/A 8.14 92525 Bindery Machine Setters * * * N/A 10.99 92541 Typesetting & Composing Machine Operators * * * N/A 11.4 92543 Printing Press Operators 30 40 10 10.05 11.42 92545 Photoengraving & Lithographic Machine Operators * * * N/A 12.05 92546 Bindery Machine Operators 10 20 10 N/A 9.29 92549 All Other Printing, Binding, Related * * * N/A 8.7 92717 Sewing Machine Operators-Garment 10 10 0 N/A 6.6 92721 Sewing Machine Operators-Non-Garment 20 20 0 N/A 7.45

A-62
Table A-5
Regional Labor Market Area 3—Assumption, Lafourche, and Terrebonne Parishes Occupational Employment Statistics
(Louisiana Department of Labor)
Occupation Code
Occupational Title
1998 Employment
Projected 2008
Employment
Projected Total
Growth
Area 3 Average Wage ($)
State Average Wage ($)
92726 Laundry & Dry-cleaning Machine Operators 80 90 10 6.86 6.53 92728 Pressing Machine Operators-Textiles/Garments 20 30 10 N/A 6.38 92905 Motion Picture Projectionists * * * N/A 6.45 92908 Photographic Processing Machine Operators 20 20 0 N/A 9.45 92914 Paper Goods Machine Setters 10 10 0 N/A 14.32 92917 Cooking Machine Operators-Food/Tobacco 10 10 0 N/A 8.12 92921 Roasting/Drying Machine Operators-Food/Tobacco 10 10 0 N/A 10.96 92923 Furnace, Kiln, Oven & Kettle Operators 10 10 0 14.2 16.73 92926 Boiler Operators & Tenders (low pressure) 10 10 0 9.84 12.26 92935 Chemical Equipment Controllers & Operators * * * N/A 20.49 92938 Chemical Equipment Tenders * * * N/A 21.5 92941 Cutting & Slicing Machine Setters * * * N/A 10.64 92944 Cutting & Slicing Machine Operators * * * N/A 9.99 92947 Painters-Transportation Equipment 40 50 10 N/A 13.28 92951 Coating & Painting Machine Setters 40 60 20 11.41 11.55 92953 Coating & Painting Machine Operators 80 110 30 12.72 10.11 92958 Cleaning/Pickling Equipment Operators 30 40 10 N/A 11.33 92962 Separating & Filtering Machine Operators 50 40 -10 N/A 20.97 92965 Crushing/Grinding/Mixing Machine Operators 30 20 -10 N/A 19.53 92971 Extruding & Forming Machine Operators 20 20 0 N/A 13.93 92974 Packaging & Filling Machine Operators 120 100 -20 8.07 10.58 92997 All Other Machine Setters/Operators 60 60 0 12.06 14.53 92998 All Other Machine Operators 610 790 180 15.57 12.74 93102 Aircraft Structure Assemblers (precision) * * * N/A N/A 93105 Machine Builders/Precision Machine Assemblers 20 30 10 N/A 13.49 93108 Structural Metal Fitters (precision) 210 230 20 N/A 13.32 93111 Electromechanical Equipment Assemblers (precision) 10 10 0 N/A 10.54

A-63
Table A-5
Regional Labor Market Area 3—Assumption, Lafourche, and Terrebonne Parishes Occupational Employment Statistics
(Louisiana Department of Labor)
Occupation Code
Occupational Title
1998 Employment
Projected 2008
Employment
Projected Total
Growth
Area 3 Average Wage ($)
State Average Wage ($)
93114 Electrical & Electronic Assemblers (precision) 20 20 0 N/A 10.67 93197 All Other Precision Assemblers 10 10 0 13.02 10.89 93902 Machine Assemblers 30 40 10 N/A 10.01 93905 Electrical & Electronic Assemblers * * * N/A 11.08 93911 Glaziers-Manufacturing 10 20 10 N/A 9.96 93914 Welders & Cutters 2,150 2,770 620 $13.72 $14.06 93917 Solderers & Brazers 10 20 10 N/A 9.42 93921 Pressers (hand) * * * N/A 6.46 93923 Sewers (hand) * * * N/A 7.36 93935 Cannery Workers 90 40 -50 N/A 6.93 93938 Meat, Poultry & Fish Cutters (hand) 40 20 -20 N/A 7.53 93944 Molders & Casters (hand) * * * N/A 8.06 93947 Painting, Coating & Decorating Workers (hand) 30 50 20 N/A 9.15 93953 Grinding & Polishing Workers (Hand) 40 50 10 8.26 8.6 93956 Assemblers (except machine/electronic/precision) 420 540 120 12.05 10.48 93999 All Other Hand Workers 650 850 200 11 12.28 95002 Water & Waste Treatment Plant Operators 80 100 20 9.64 10.63 95005 Gas Plant Operators 20 20 0 N/A 20.03 95008 Chemical Plant & System Operators 20 30 10 N/A 22.07 95011 Petroleum Pump System Operators 30 40 10 N/A 22.21 95014 Petroleum Refinery & Control Panel Operators 70 90 20 N/A 18.73 95017 Gaugers 230 290 60 16.72 17.83 95021 Power Plant Operators (except auxiliary equipment) 20 20 0 N/A 20.77 95023 Auxiliary Equipment Operators-Power 10 10 0 N/A N/A 95026 Power Reactor Operators * * * N/A N/A 95028 Power Distributors & Dispatchers 10 10 0 N/A 17.5 95032 Stationary Engineers 20 10 -10 N/A 13.71

A-64
Table A-5
Regional Labor Market Area 3—Assumption, Lafourche, and Terrebonne Parishes Occupational Employment Statistics
(Louisiana Department of Labor)
Occupation Code
Occupational Title
1998 Employment
Projected 2008
Employment
Projected Total
Growth
Area 3 Average Wage ($)
State Average Wage ($)
95099 All Other Plant & System Operators 310 370 60 16.05 13.63 97102 Truck Drivers-Heavy or Tractor-Trailer 1,050 1,280 230 11.41 12.07 97105 Truck Drivers-Light (including delivery) 890 1,090 200 9.24 9.16 97108 Bus Drivers (except school) 60 80 20 N/A 10.14 97111 School Bus Drivers 380 440 60 15.06 8.87 97114 Taxi Drivers & Chauffeurs 60 80 20 N/A 7.74 97117 Driver/Sales Workers 140 150 10 10.82 9.95 97199 All Other Motor Vehicle Operators 30 30 0 7.63 8.66 97502 Captains-Water Vessel 1,060 1,160 100 23.5 19.97 97505 Mates-Ship, Boat & Barge 470 530 60 18.91 13.47 97508 Pilots-Ship 130 140 10 N/A 17.58 97511 Motorboat Operators 20 20 0 N/A 11.93 97514 Able Seamen 310 340 30 11.93 10.9 97517 Ordinary Seamen & Marine Oilers 730 810 80 9.92 8.93 97521 Ship Engineers 210 230 20 N/A 14.47 97702 Aircraft Pilots & Flight Engineers 30 30 0 ** N/A 97802 Bridge, Lock & Lighthouse Tenders 10 10 0 N/A 10.77 97805 Service Station Attendants 60 70 10 N/A 7.61 97808 Parking Lot Attendants 20 20 0 N/A 6.52 97899 All Other Transportation Workers 220 280 60 12.09 15.04 97902 Longshore Equipment Operators 140 160 20 N/A 19.36 97908 Oil Pumpers (except wellhead) 30 30 0 N/A 16.8 97911 Wellhead Pumpers 70 60 -10 N/A 16.36 97914 Main-Line Station Engineers-Oil & Gas 10 20 10 N/A N/A 97917 Gas Pumping Station Operators * * * N/A 20.62 97921 Gas Compressor Operators 10 10 0 21.48 18.83 97923 Excavating & Loading Machine Operators 30 50 20 10.15 11.47

A-65
Table A-5
Regional Labor Market Area 3—Assumption, Lafourche, and Terrebonne Parishes Occupational Employment Statistics
(Louisiana Department of Labor)
Occupation Code
Occupational Title
1998 Employment
Projected 2008
Employment
Projected Total
Growth
Area 3 Average Wage ($)
State Average Wage ($)
97926 Dragline Operators * * * N/A 13.56 97928 Dredge Operators 10 10 0 N/A 14.98 97938 Grader, Bulldozer & Scraper Operators 90 130 40 11.68 11.53 97941 Hoist & Winch Operators 50 70 20 N/A 14.88 97944 Crane & Tower Operators 220 300 80 13.21 14.35 97947 Industrial Truck & Tractor Operators 230 270 40 9.05 10.79 97951 Conveyor Operators & Tenders 10 10 0 8.73 10.14 97953 Pump Operators 30 30 0 12.56 19.18 97956 Operating Engineers 50 70 20 11.8 14.15 97989 All Other Material Equipment Moving Operators 130 150 20 12.92 10.68 97999 All Other Material Moving Equipment Operators 60 80 20 15.41 11.79 98102 Mechanic & Repairer Helpers 340 450 110 7.91 8.69 98311 Brick & Stonemason & Hard Tile Setter Helpers 20 20 0 N/A 8.4 98312 Carpenter Helpers 100 130 30 8.64 8.95 98313 Electrician Helpers 100 120 20 8.45 8.46 98314 Painter, Paperhanger & Plasterer Helpers 40 50 10 N/A 8.17 98315 Plumber & Pipefitter Helpers 90 120 30 9.13 9.54 98316 Roofer Helpers 20 20 0 N/A 7.87 98319 Helpers, All Other Construction 220 370 150 N/A 8.52 98323 Extractive Worker Helpers 10 10 0 N/A 9.08 98502 Machine Feeders & Offbearers 50 40 -10 8.31 8.93 98702 Stevedores (except equipment operators) 370 350 -20 N/A 16.14 98705 Refuse & Recyclable Materials Collectors 40 40 0 N/A 9.15 98799 Freight, Stock & Material Handlers 310 340 30 7.67 8.53 98902 Hand Packers & Packagers 360 400 40 6.05 6.5 98905 Vehicle Washers & Equipment Cleaners 150 200 50 6.26 6.83 98999 All Other Helpers, Laborers, & Material Movers 1,920 2,480 560 8.24 8.34

A-66
Table A-5
Regional Labor Market Area 3—Assumption, Lafourche, and Terrebonne Parishes Occupational Employment Statistics
(Louisiana Department of Labor)
Occupation Code
Occupational Title
1998 Employment
Projected 2008
Employment
Projected Total
Growth
Area 3 Average Wage ($)
State Average Wage ($)
Annual Total Growth = demand in the occupation as a function of replacement demand (retirements + turnover) + net growth. N/A—Not Available. * 1998 employment under 10 suppressed. ** Hourly wages for occupations where workers typically work fewer than 2,080 hours per year not available.

A-67
Table A-6
Louisiana Department of Labor Region 3—Lafourche, Terrebonne, and Assumption Parishes (Data are from the 1990 Census Special Tabulation of Occupation by Industry.
These counts are for all industries.)
Number in Experienced Labor Force
Census Occupation Code Occupation Title
36 3 Legislators 11 4 Chief Executives and General Administrators, Public Administration
183 5 Administrators and Officials, Public Administration 67 6 Administrators, Protective Service
393 7 Financial Managers 165 8 Personnel and Labor Relations Managers 36 9 Purchasing Managers
217 13 Managers, Marketing, Advertising, and Public Relations 498 14 Administrators, Education and Related Fields 83 15 Managers, Medicine and Health 32 16 Postmasters and Mail Superintendents
805 17 Managers, Food Serving and Lodging Establishments 200 18 Managers, Properties and Real Estate 47 19 Funeral Directors
239 21 Managers, Service Organizations, n.e.c. 2,701 22 Managers and Administrators, n.e.c.
553 23 Accountants and Auditors 23 24 Underwriters
268 25 Other Financial Officers 63 26 Management Analysts
223 27 Personnel, Training, and Labor Relations Specialists 115 29 Buyers, Wholesale and Retail Trade (except farm products) 203 33 Purchasing Agents and Buyers 90 35 Construction Inspectors 84 36 Inspectors and Compliance Officers (except construction) 74 37 Management Related Occupations, n.e.c. 16 43 Architects
6 45 Metallurgical and Materials Engineers 9 46 Mining Engineers
209 47 Petroleum Engineers 21 48 Chemical Engineers
142 53 Civil Engineers 12 54 Agricultural Engineers 58 55 Electrical and Electronic Engineers 45 56 Industrial Engineers 40 57 Mechanical Engineers
126 58 Marine and Naval Architects 58 59 Engineers, n.e.c. 17 63 Surveyors and Mapping Scientists 38 64 Computer Systems Analysts and Scientists

A-68
Table A-6
Louisiana Department of Labor Region 3—Lafourche, Terrebonne, and Assumption Parishes (Data are from the 1990 Census Special Tabulation of Occupation by Industry.
These counts are for all industries.)
Number in Experienced Labor Force
Census Occupation Code Occupation Title
20 65 Operations and Systems Researchers and Analysts 12 67 Statisticians 35 73 Chemists (except biochemists) 15 75 Geologists and Geodesists 28 77 Agricultural and Food Scientists 33 78 Biological and Life Scientists
204 84 Physicians 121 85 Dentists 13 86 Veterinarians 18 87 Optometrists 32 89 Health Diagnosing Practitioners, n.e.c.
931 95 Registered Nurses 92 96 Pharmacists 72 97 Dietitians 47 98 Respiratory Therapists 31 103 Physical Therapists 52 104 Speech Therapists 51 105 Therapists, n.e.c. 13 106 Physicians' Assistants 10 118 Psychology Teachers
7 127 Engineering Teachers 7 134 Health Specialties Teachers
15 135 Business, Commerce, and Marketing Teachers 9 137 Art, Drama, and Music Teachers 8 143 English Teachers
296 154 Postsecondary Teachers, Subject Not Specified 118 155 Teachers, Prekindergarten and Kindergarten
3,649 156 Teachers, Elementary School 454 157 Teachers, Secondary School 27 158 Teachers, Special Education
365 159 Teachers, n.e.c. 120 163 Counselors, Educational and Vocational 105 164 Librarians
9 165 Archivists and Curators 16 166 Economists 21 167 Psychologists
433 174 Social Workers 50 175 Recreation Workers
182 176 Clergy 52 177 Religious Workers, n.e.c.
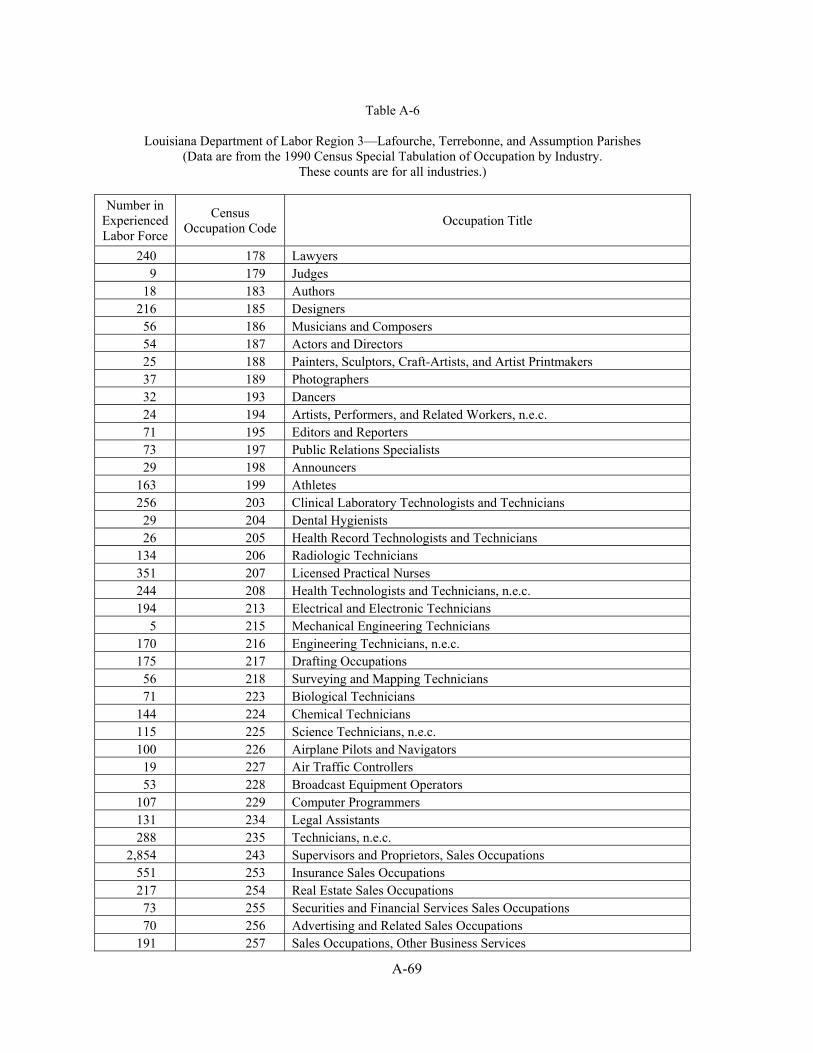
A-69
Table A-6
Louisiana Department of Labor Region 3—Lafourche, Terrebonne, and Assumption Parishes (Data are from the 1990 Census Special Tabulation of Occupation by Industry.
These counts are for all industries.)
Number in Experienced Labor Force
Census Occupation Code Occupation Title
240 178 Lawyers 9 179 Judges
18 183 Authors 216 185 Designers 56 186 Musicians and Composers 54 187 Actors and Directors 25 188 Painters, Sculptors, Craft-Artists, and Artist Printmakers 37 189 Photographers 32 193 Dancers 24 194 Artists, Performers, and Related Workers, n.e.c. 71 195 Editors and Reporters 73 197 Public Relations Specialists 29 198 Announcers
163 199 Athletes 256 203 Clinical Laboratory Technologists and Technicians 29 204 Dental Hygienists 26 205 Health Record Technologists and Technicians
134 206 Radiologic Technicians 351 207 Licensed Practical Nurses 244 208 Health Technologists and Technicians, n.e.c. 194 213 Electrical and Electronic Technicians
5 215 Mechanical Engineering Technicians 170 216 Engineering Technicians, n.e.c. 175 217 Drafting Occupations 56 218 Surveying and Mapping Technicians 71 223 Biological Technicians
144 224 Chemical Technicians 115 225 Science Technicians, n.e.c. 100 226 Airplane Pilots and Navigators 19 227 Air Traffic Controllers 53 228 Broadcast Equipment Operators
107 229 Computer Programmers 131 234 Legal Assistants 288 235 Technicians, n.e.c.
2,854 243 Supervisors and Proprietors, Sales Occupations 551 253 Insurance Sales Occupations 217 254 Real Estate Sales Occupations 73 255 Securities and Financial Services Sales Occupations 70 256 Advertising and Related Sales Occupations
191 257 Sales Occupations, Other Business Services

A-70
Table A-6
Louisiana Department of Labor Region 3—Lafourche, Terrebonne, and Assumption Parishes (Data are from the 1990 Census Special Tabulation of Occupation by Industry.
These counts are for all industries.)
Number in Experienced Labor Force
Census Occupation Code Occupation Title
13 258 Sales Engineers 1,029 259 Sales Representatives, Mining, Manufacturing, and Wholesale
214 263 Sales Workers, Motor Vehicles and Boats 279 264 Sales Workers, Apparel 107 265 Sales Workers, Shoes 124 266 Sales Workers, Furniture and Home Furnishings 113 267 Sales Workers, Radio, TV, Hi-Fi, and Appliances 130 268 Sales Workers, Hardware, and Building Supplies 89 269 Sales Workers, Parts
1,669 274 Sales Workers, Other Commodities 147 275 Sales Counter Clerks
4,538 276 Cashiers 207 277 Street and Door-To-Door Sales Workers 118 278 News Vendors 15 283 Demonstrators, Promoters and Models, Sales 12 285 Sales Support Occupations, n.e.c.
252 303 Supervisors, General Office 5 304 Supervisors, Computer Equipment Operators
24 305 Supervisors, Financial Records Processing 59 307 Supervisors, Distribution, Scheduling, and Adjusting Clerks
313 308 Computer Operators 3,365 313 Secretaries
65 314 Stenographers 410 315 Typists 155 316 Interviewers 50 317 Hotel Clerks 33 318 Transportation Ticket and Reservation Agents
640 319 Receptionists 119 323 Information Clerks, n.e.c.
8 325 Classified-Ad Clerks 99 327 Order Clerks 45 328 Personnel Clerks (except payroll and timekeeping) 79 329 Library Clerks
170 335 File Clerks 53 336 Records Clerks
1,553 337 Bookkeepers, Accounting, and Auditing Clerks 79 338 Payroll and Timekeeping Clerks 66 339 Billing Clerks 52 343 Cost and Rate Clerks 18 344 Billing, Posting, and Calculating Machine Operators
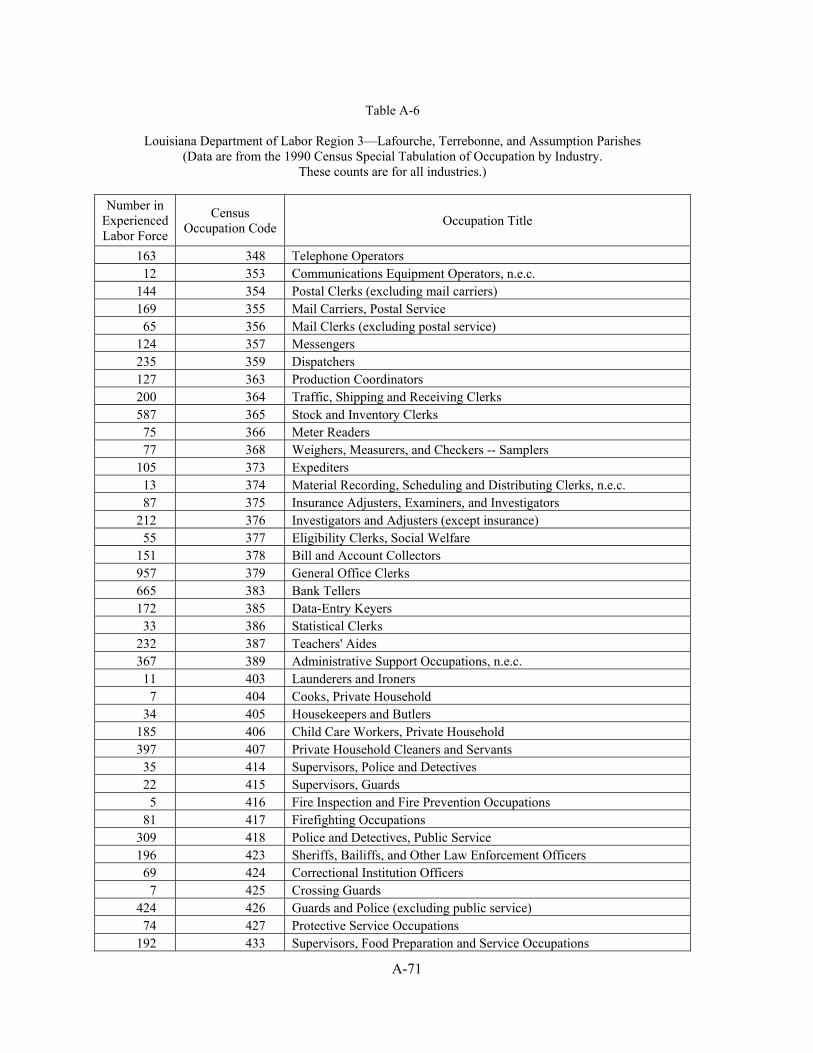
A-71
Table A-6
Louisiana Department of Labor Region 3—Lafourche, Terrebonne, and Assumption Parishes (Data are from the 1990 Census Special Tabulation of Occupation by Industry.
These counts are for all industries.)
Number in Experienced Labor Force
Census Occupation Code Occupation Title
163 348 Telephone Operators 12 353 Communications Equipment Operators, n.e.c.
144 354 Postal Clerks (excluding mail carriers) 169 355 Mail Carriers, Postal Service 65 356 Mail Clerks (excluding postal service)
124 357 Messengers 235 359 Dispatchers 127 363 Production Coordinators 200 364 Traffic, Shipping and Receiving Clerks 587 365 Stock and Inventory Clerks 75 366 Meter Readers 77 368 Weighers, Measurers, and Checkers -- Samplers
105 373 Expediters 13 374 Material Recording, Scheduling and Distributing Clerks, n.e.c. 87 375 Insurance Adjusters, Examiners, and Investigators
212 376 Investigators and Adjusters (except insurance) 55 377 Eligibility Clerks, Social Welfare
151 378 Bill and Account Collectors 957 379 General Office Clerks 665 383 Bank Tellers 172 385 Data-Entry Keyers 33 386 Statistical Clerks
232 387 Teachers' Aides 367 389 Administrative Support Occupations, n.e.c. 11 403 Launderers and Ironers
7 404 Cooks, Private Household 34 405 Housekeepers and Butlers
185 406 Child Care Workers, Private Household 397 407 Private Household Cleaners and Servants 35 414 Supervisors, Police and Detectives 22 415 Supervisors, Guards
5 416 Fire Inspection and Fire Prevention Occupations 81 417 Firefighting Occupations
309 418 Police and Detectives, Public Service 196 423 Sheriffs, Bailiffs, and Other Law Enforcement Officers 69 424 Correctional Institution Officers
7 425 Crossing Guards 424 426 Guards and Police (excluding public service) 74 427 Protective Service Occupations
192 433 Supervisors, Food Preparation and Service Occupations

A-72
Table A-6
Louisiana Department of Labor Region 3—Lafourche, Terrebonne, and Assumption Parishes (Data are from the 1990 Census Special Tabulation of Occupation by Industry.
These counts are for all industries.)
Number in Experienced Labor Force
Census Occupation Code Occupation Title
424 434 Bartenders 1,190 435 Waiters and Waitresses 2,497 436 Cooks
136 438 Food Counter, Fountain, and Related Occupations 329 439 Kitchen Workers, Food Preparation 221 443 Waiters'/Waitresses' Assistants 804 444 Miscellaneous Food Preparation Occupations 138 445 Dental Assistants 211 446 Health Aids (except nursing)
1,889 447 Nursing Aides, Orderlies, and Attendants 86 448 Supervisors, Cleaning and Building Service Workers
628 449 Maids and Housemen 2,141 453 Janitors and Cleaners
70 455 Pest Control Occupations 64 456 Supervisors, Personal Service Occupations
106 457 Barbers 863 458 Hairdressers and Cosmetologists 89 459 Attendants, Amusement and Recreation Facilities 20 461 Guides
6 463 Public Transportation Attendants 45 465 Welfare Service Aides
231 466 Family Child Care Providers 322 467 Early Childhood Teacher's Assistants 269 468 Child Care Workers, n.e.c. 165 469 Personal Service Occupations, n.e.c. 220 473 Farmers (except horticultural)
9 474 Horticultural Specialty Farmers 265 475 Managers, Farms (except horticultural) 13 476 Managers, Horticultural Specialty Farms 20 477 Supervisors, Farm Workers
631 479 Farm Workers 31 485 Supervisors, Related Agricultural Occupations
609 486 Groundskeepers and Gardeners (except farm) 25 487 Animal Caretakers (except farm) 85 488 Graders and Sorters, Agricultural Products 10 494 Supervisors, Forestry and Logging Workers 37 496 Timber Cutting and Logging Occupations
238 497 Captains and Other Officers, Fishing Vessels 1,996 498 Fishers
32 499 Hunters and Trappers

A-73
Table A-6
Louisiana Department of Labor Region 3—Lafourche, Terrebonne, and Assumption Parishes (Data are from the 1990 Census Special Tabulation of Occupation by Industry.
These counts are for all industries.)
Number in Experienced Labor Force
Census Occupation Code Occupation Title
330 503 Supervisors, Mechanics and Repairers 749 505 Automobile Mechanics (except apprentices) 441 507 Bus, Truck, and Stationary Engine Mechanics 34 508 Aircraft Engine Mechanics
261 509 Small Engine Repairers 154 514 Automobile Body and Related Repairers 18 515 Aircraft Mechanics (excluding engine)
263 516 Heavy Equipment Mechanics 55 517 Farm Equipment Mechanics
352 518 Industrial Machinery Repairers 42 519 Machinery Maintenance Occupations
217 523 Electronic Repairers, Communications and Industrial Equipment 44 525 Data Processing Equipment Repairers 68 526 Household Appliance and Power Tool Repairers 55 527 Telephone Line Installers and Repairers
158 529 Telephone Installers and Repairers 59 533 Miscellaneous Electrical and Electronic Equipment Repairers 92 534 Heating, Air Conditioning, and Refrigeration Mechanics 18 535 Camera, Watch, and Musical Instrument Repairers 12 536 Locksmiths and Safe Repairers 14 538 Office Machine Repairers 88 539 Mechanical Controls and Valve Repairers
7 543 Elevator Installers and Repairers 42 544 Millwrights
371 547 Specified Mechanics and Repairers, n.e.c. 429 549 Not Specified Mechanics and Repairers 29 554 Supervisors, Carpenters and Related Work 22 555 Supervisors, Electricians and Power Transmission Installers 61 556 Supervisors, Painters, Paperhangers, and Plasterers
6 557 Supervisors, Plumbers, Pipefitters, and Steamfitters 499 558 Supervisors, Construction, n.e.c. 92 563 Brickmasons and Stonemasons (except apprentices) 15 565 Tile Setters, Hard and Soft 70 566 Carpet Installers
1,113 567 Carpenters (except apprentices) 25 569 Carpenter Apprentices 55 573 Drywall Installers
773 575 Electricians (except apprentices) 7 576 Electrician Apprentices
79 577 Electrical Power Installers and Repairers

A-74
Table A-6
Louisiana Department of Labor Region 3—Lafourche, Terrebonne, and Assumption Parishes (Data are from the 1990 Census Special Tabulation of Occupation by Industry.
These counts are for all industries.)
Number in Experienced Labor Force
Census Occupation Code Occupation Title
654 579 Painters, Construction and Maintenance 8 583 Paperhangers
850 585 Plumbers, Pipefitters, and Steamfitters (except apprentices) 15 587 Plumber, Pipefitter, and Steamfitter Apprentices
129 588 Concrete and Terrazzo Finishers 26 589 Glaziers
375 593 Insulation Workers 12 594 Paving, Surfacing, and Tamping Equipment Operators 94 595 Roofers 18 596 Sheetmetal Duct Installers 53 597 Structural Metal Workers 20 598 Drillers, Earth
501 599 Construction Trades, n.e.c. 938 613 Supervisors, Extractive Occupations
1,184 614 Drillers, Oil Well 115 615 Explosives Workers 199 616 Mining Machine Operators 455 617 Mining Occupations, n.e.c. 883 628 Supervisors, Production Occupations 30 634 Tool and Die Makers (except apprentices) 18 636 Precision Assemblers, Metal
533 637 Machinists (except apprentices) 8 639 Machinist Apprentices
93 643 Boilermakers 27 645 Patternmakers and Model Makers, Metal
411 646 Lay-Out Workers 15 647 Precious Stones and Metals Workers
8 649 Engravers, Metal 102 653 Sheet Metal Workers (except apprentices)
5 659 Miscellaneous Precision Woodworkers 82 666 Dressmakers 10 667 Tailors 34 668 Upholsterers
6 669 Shoe Repairers 21 674 Miscellaneous Precision Apparel and Fabric Workers 35 677 Optical Goods Workers 38 678 Dental Laboratory and Medical Appliance Technicians 17 679 Bookbinders 38 684 Miscellaneous Precision Workers, n.e.c.
366 686 Butchers and Meat Cutters

A-75
Table A-6
Louisiana Department of Labor Region 3—Lafourche, Terrebonne, and Assumption Parishes (Data are from the 1990 Census Special Tabulation of Occupation by Industry.
These counts are for all industries.)
Number in Experienced Labor Force
Census Occupation Code Occupation Title
119 687 Bakers 60 688 Food Batchmakers 22 689 Inspectors, Testers, and Graders
6 693 Adjusters and Calibrators 56 694 Water and Sewage Treatment Plant Operators 46 695 Power Plant Operators
214 696 Stationary Engineers 310 699 Miscellaneous Plant and System Operators 17 704 Lathe and Turning Machine Operators 22 706 Punching and Stamping Press Machine Operators 36 707 Rolling Machine Operators 19 708 Drilling and Boring Machine Operators
3 709 Grinding, Abrading, Buffing, and Polishing Machine Operators 15 717 Fabricating Machine Operators, n.e.c.
9 719 Molding and Casting Machine Operators 15 723 Metal Plating Machine Operators
137 725 Miscellaneous Metal and Plastic Processing Machine Operators 8 727 Sawing Machine Operators 4 728 Shaping and Joining Machine Operators
17 733 Miscellaneous Woodworking Machine Operators 49 734 Printing Press Operators 15 736 Typesetters and Compositors 86 744 Textile Sewing Machine Operators
145 747 Pressing Machine Operators 154 748 Laundering and Dry Cleaning Machine Operators
2 753 Cementing and Gluing Machine Operators 168 754 Packaging and Filling Machine Operators 14 755 Extruding and Forming Machine Operators 67 756 Mixing and Blending Machine Operators 78 757 Separating, Filtering, and Clarifying Machine Operators 72 759 Painting and Paint Spraying Machine Operators
6 763 Roasting and Baking Machine Operators, Food 8 764 Washing, Cleaning, and Pickling Machine Operators
48 766 Furnace, Kiln, and Oven Operators (except food) 6 768 Crushing and Grinding Machine Operators
163 769 Slicing and Cutting Machine Operators 1 773 Motion Picture Projectionists
70 774 Photographic Process Machine Operators 478 777 Miscellaneous and Not Specified Machine Operators, n.e.c. 400 779 Machine Operators, Not Specified

A-76
Table A-6
Louisiana Department of Labor Region 3—Lafourche, Terrebonne, and Assumption Parishes (Data are from the 1990 Census Special Tabulation of Occupation by Industry.
These counts are for all industries.)
Number in Experienced Labor Force
Census Occupation Code Occupation Title
3,489 783 Welders and Cutters 233 785 Assemblers 317 786 Hand Cutting and Trimming Occupations
8 787 Hand Molding, Casting, and Forming Occupations 38 789 Hand Painting, Coating, and Decorating Occupations
6 793 Hand Engraving and Printing Occupations 276 796 Production Inspectors, Checkers, and Examiners 76 797 Production Testers 11 798 Production Samplers and Weighers 81 799 Graders and Sorters (except agricultural) 57 803 Supervisors, Motor Vehicle Operators
2,716 804 Truck Drivers 163 806 Driver-Sales Workers 474 808 Bus Drivers 58 809 Taxicab Drivers and Chauffeurs
6 814 Motor Transportation Occupations, n.e.c. 87 824 Locomotive Operating Occupations
9 825 Railroad Brake, Signal, and Switch Operators 2,156 828 Ship Captains and Mates (except fishing boats) 1,317 829 Sailors and Deckhands
37 833 Marine Engineers 166 834 Bridge, Lock and Lighthouse Tenders 24 843 Supervisors, Material Moving Equipment Operators
173 844 Operating Engineers 29 845 Longshore Equipment Operators
189 848 Hoist and Winch Operators 439 849 Crane and Tower Operators 143 853 Excavating and Loading Machine Operators 54 855 Grader, Dozer, and Scraper Operators
220 856 Industrial Truck and Tractor Equipment Operators 354 859 Miscellaneous Material Moving Equipment Operators
5 864 Supervisors, Handlers, Equipment Cleaners, and Laborers, n.e.c. 22 865 Helpers, Mechanics and Repairers
239 866 Helpers, Construction Trades 16 867 Helpers, Surveyor 37 868 Helpers, Extractive Occupations
1,043 869 Construction Laborers 185 874 Production Helpers 86 875 Garbage Collectors 15 876 Stevedores

A-77
Table A-6
Louisiana Department of Labor Region 3—Lafourche, Terrebonne, and Assumption Parishes (Data are from the 1990 Census Special Tabulation of Occupation by Industry.
These counts are for all industries.)
Number in Experienced Labor Force
Census Occupation Code Occupation Title
1,232 877 Stock Handlers and Baggers 15 878 Machine Feeders and Offbearers
344 883 Freight, Stock, and Material Handlers, n.e.c. 316 885 Garage and Service Station Related Occupations 184 887 Vehicle Washers and Equipment Cleaners 552 888 Hand Packers and Packagers
1798 889 Laborers (except construction) n.e.c.—not else classified.
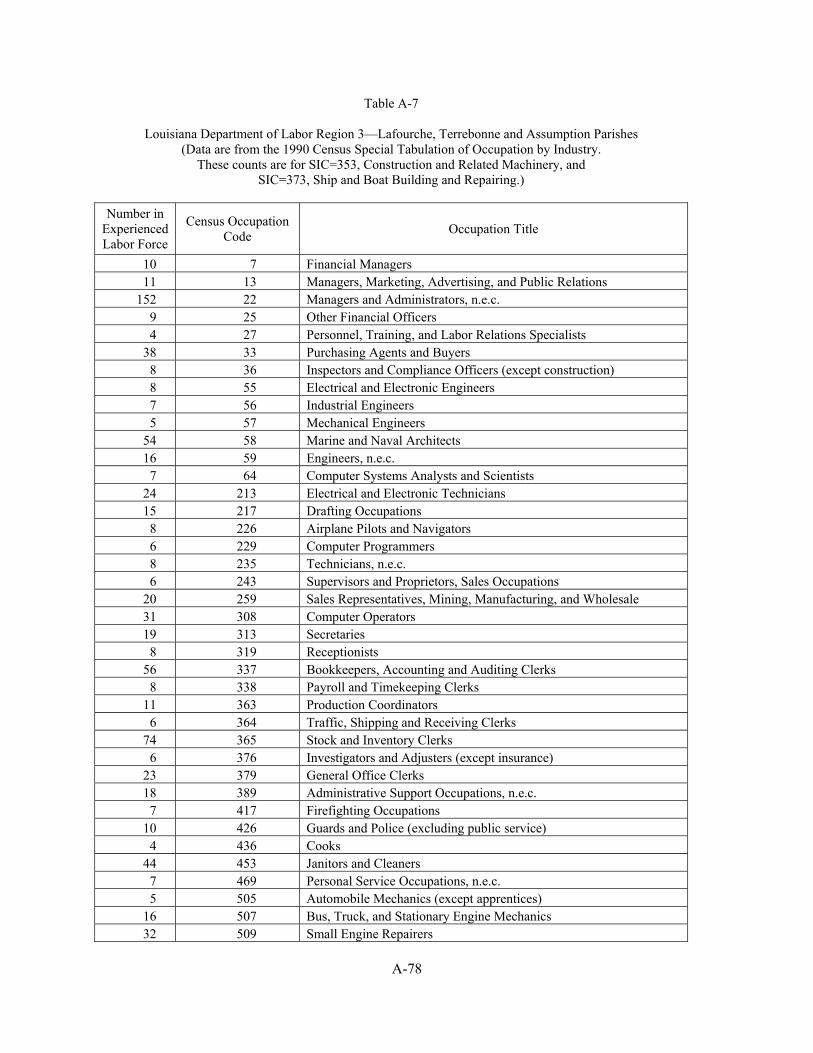
A-78
Table A-7
Louisiana Department of Labor Region 3—Lafourche, Terrebonne and Assumption Parishes (Data are from the 1990 Census Special Tabulation of Occupation by Industry.
These counts are for SIC=353, Construction and Related Machinery, and SIC=373, Ship and Boat Building and Repairing.)
Number in
Experienced Labor Force
Census Occupation Code Occupation Title
10 7 Financial Managers 11 13 Managers, Marketing, Advertising, and Public Relations
152 22 Managers and Administrators, n.e.c. 9 25 Other Financial Officers 4 27 Personnel, Training, and Labor Relations Specialists
38 33 Purchasing Agents and Buyers 8 36 Inspectors and Compliance Officers (except construction) 8 55 Electrical and Electronic Engineers 7 56 Industrial Engineers 5 57 Mechanical Engineers
54 58 Marine and Naval Architects 16 59 Engineers, n.e.c.
7 64 Computer Systems Analysts and Scientists 24 213 Electrical and Electronic Technicians 15 217 Drafting Occupations
8 226 Airplane Pilots and Navigators 6 229 Computer Programmers 8 235 Technicians, n.e.c. 6 243 Supervisors and Proprietors, Sales Occupations
20 259 Sales Representatives, Mining, Manufacturing, and Wholesale 31 308 Computer Operators 19 313 Secretaries
8 319 Receptionists 56 337 Bookkeepers, Accounting and Auditing Clerks
8 338 Payroll and Timekeeping Clerks 11 363 Production Coordinators
6 364 Traffic, Shipping and Receiving Clerks 74 365 Stock and Inventory Clerks
6 376 Investigators and Adjusters (except insurance) 23 379 General Office Clerks 18 389 Administrative Support Occupations, n.e.c.
7 417 Firefighting Occupations 10 426 Guards and Police (excluding public service)
4 436 Cooks 44 453 Janitors and Cleaners
7 469 Personal Service Occupations, n.e.c. 5 505 Automobile Mechanics (except apprentices)
16 507 Bus, Truck, and Stationary Engine Mechanics 32 509 Small Engine Repairers

A-79
Table A-7
Louisiana Department of Labor Region 3—Lafourche, Terrebonne and Assumption Parishes (Data are from the 1990 Census Special Tabulation of Occupation by Industry.
These counts are for SIC=353, Construction and Related Machinery, and SIC=373, Ship and Boat Building and Repairing.)
Number in
Experienced Labor Force
Census Occupation Code Occupation Title
15 516 Heavy Equipment Mechanics 10 517 Farm Equipment Mechanics 64 518 Industrial Machinery Repairers
8 519 Machinery Maintenance Occupations 8 534 Heating, Air Conditioning, and Refrigeration Mechanics 6 539 Mechanical Controls and Valve Repairers
40 547 Specified Mechanics and Repairers, n.e.c. 17 549 Not Specified Mechanics and Repairers
8 554 Supervisors, Carpenters and Related Work 5 555 Supervisors, Electricians and Power Transmission Installers
29 556 Supervisors, Painters, Paperhangers, and Plasterers 6 557 Supervisors, Plumbers, Pipefitters, and Steamfitters
158 567 Carpenters (except apprentices) 116 575 Electricians (except apprentices) 80 579 Painters, Construction and Maintenance
118 585 Plumbers, Pipefitters, and Steamfitters (except apprentices) 14 593 Insulation Workers
7 599 Construction Trades, n.e.c. 8 613 Supervisors, Extractive Occupations 8 615 Explosives Workers 7 617 Mining Occupations, n.e.c.
324 628 Supervisors, Production Occupations 7 634 Tool and Die Makers (except apprentices)
114 637 Machinists (except apprentices) 8 639 Machinist Apprentices 9 645 Patternmakers and Model Makers, Metal
390 646 Lay-Out Workers 29 653 Sheet Metal Workers (except apprentices)
5 696 Stationary Engineers 7 706 Punching and Stamping Press Machine Operators 5 707 Rolling Machine Operators 9 719 Molding and Casting Machine Operators
110 725 Miscellaneous Metal and Plastic Processing Machine Operators 14 744 Textile Sewing Machine Operators
7 747 Pressing Machine Operators 26 759 Painting and Paint Spraying Machine Operators
8 774 Photographic Process Machine Operators 119 777 Miscellaneous and Not Specified Machine Operators, n.e.c. 53 779 Machine Operators, Not Specified

A-80
Table A-7
Louisiana Department of Labor Region 3—Lafourche, Terrebonne and Assumption Parishes (Data are from the 1990 Census Special Tabulation of Occupation by Industry.
These counts are for SIC=353, Construction and Related Machinery, and SIC=373, Ship and Boat Building and Repairing.)
Number in
Experienced Labor Force
Census Occupation Code Occupation Title
1,013 783 Welders and Cutters 17 785 Assemblers 14 789 Hand Painting, Coating, and Decorating Occupations 21 796 Production Inspectors, Checkers, and Examiners
8 797 Production Testers 69 804 Truck Drivers 51 828 Ship Captains and Mates, Except Fishing Boats 16 829 Sailors and Deckhands
6 848 Hoist and Winch Operators 1 849 Crane and Tower Operators
24 856 Industrial Truck and Tractor Equipment Operators 20 859 Miscellaneous Material Moving Equipment Operators
5 865 Helpers, Mechanics and Repairers 42 866 Helpers, Construction Trades 18 869 Construction Laborers 73 874 Production Helpers
7 876 Stevedores 8 883 Freight, Stock, and Material Handlers, n.e.c.
11 887 Vehicle Washers and Equipment Cleaners 153 889 Laborers (except construction)
n.e.c.—not else classified.

The Department of the Interior Mission As the Nation's principal conservation agency, the Department of the Interior has responsibility for most of our nationally owned public lands and natural resources. This includes fostering sound use of our land and water resources; protecting our fish, wildlife, and biological diversity; preserving the environmental and cultural values of our national parks and historical places; and providing for the enjoyment of life through outdoor recreation. The Department assesses our energy and mineral resources and works to ensure that their development is in the best interests of all our people by encouraging stewardship and citizen participation in their care. The Department also has a major responsibility for American Indian reservation communities and for people who live in island territories under U.S. administration. The Minerals Management Service Mission As a bureau of the Department of the Interior, the Minerals Management Service's (MMS) primary responsibilities are to manage the mineral resources located on the Nation's Outer Continental Shelf (OCS), collect revenue from the Federal OCS and onshore Federal and Indian lands, and distribute those revenues. Moreover, in working to meet its responsibilities, the Offshore Minerals Management Program administers the OCS competitive leasing program and oversees the safe and environmentally sound exploration and production of our Nation's offshore natural gas, oil and other mineral resources. The MMS Minerals Revenue Management meets its responsibilities by ensuring the efficient, timely and accurate collection and disbursement of revenue from mineral leasing and production due to Indian tribes and allottees, States and the U.S. Treasury. The MMS strives to fulfill its responsibilities through the general guiding principles of: (1) being responsive to the public's concerns and interests by maintaining a dialogue with all potentially affected parties and (2) carrying out its programs with an emphasis on working to enhance the quality of life for all Americans by lending MMS assistance and expertise to economic development and environmental protection.