Embed Size (px)
Citation preview

Economic Impact Assessment of a NOX Emission Control Area in the North Sea Environmental Project no. 1427, 2012

2 Economic Impact Assessment of a NOX
Emission Control Area in the North Sea
Title:
Economic Impact Assessment of a NOX
Emission Control Area in the North Sea
Authors & contributors:
Incentive Partners & Litehauz
Publisher:
Miljøstyrelsen
Strandgade 29
1401 København K
www.mst.dk
Photo:
Illustration:
Year:
2012
Map:
ISBN no.
978-87-92903-20-4
Disclaimer:
The Danish Environmental Protection Agency will, when opportunity offers, publish reports and contributions relating to
environmental research and development projects financed via the Danish EPA. Please note that publication does not
signify that the contents of the reports necessarily reflect the views of the Danish EPA. The reports are, however,
published because the Danish EPA finds that the studies represent a valuable contribution to the debate on
environmental policy in Denmark.
May be quoted provided the source is acknowledged.
3
Table of contents
PREFACE 7
LIST OF ABBREVIATIONS 8
SAMMENFATNING OG KONKLUSIONER 9
SUMMARY AND CONCLUSIONS 13
1 INTRODUCTION 16
1.1 BACKGROUND 16 1.2 OBJECTIVES 16 1.3 APPROACH 17 1.4 STRUCTURE OF THE REPORT 18 1.5 PARAMETERS AND ASSUMPTIONS 18
2 THE NORTH SEA FLEET 19
2.1 INTRODUCTION 19 2.2 THE NORTH SEA FLEET 20
2.2.1 Number of ships and distances travelled 20 2.2.2 ‘Other’ ships 22 2.2.3 Ship sizes of the North Sea fleet 22
2.3 OPERATING PATTERNS 23 2.4 ENGINE CHARACTERISTICS AND FUEL CONSUMPTION 25
3 THE FUTURE NORTH SEA FLEET 27
3.1 INTRODUCTION 27 3.2 APPROACH 27 3.3 ASSUMPTIONS FOR PROJECTIONS 2009-2030 28
3.3.1 Fleet renewal rates 28 3.3.2 Growth rates in shipping activities 28 3.3.3 Operating speed 29 3.3.4 Efficiency improvements 29 3.3.5 LNG in shipping in the North Sea 29
3.4 PROJECTIONS 2009-2030 31
4 NOX ABATEMENT TECHNOLOGIES 34
4.1 TECHNOLOGY REVIEW 34 4.1.1 Existing technologies 34
4.2 REVIEW OF TIER II AND III TECHNOLOGIES 34 4.2.1 Tier II technologies 34 4.2.2 Tier III technologies 35 4.2.3 Selective Catalytic Reduction (SCR) 36 4.2.4 Exhaust Gas Recirculation (EGR) 37 4.2.5 Liquefied natural gas engines (LNG) 37
4.3 COSTS OF INSTALLING AND OPERATING TIER III SYSTEMS 37 4.3.1 Challenges to Tier III technologies 38
5 COST-EFFECTIVENESS 40
5.1 INTRODUCTION 40 5.2 APPROACH 40 5.3 KEY ASSUMPTIONS AND INPUT PARAMETERS 40

4
5.4 COST COMPOSITION 42 5.5 COST-EFFECTIVE TECHNOLOGY CHOICE 44
5.5.1 2-stroke main engines 44 5.5.2 4-stroke main engines 45 5.5.3 4-stroke auxiliary engines 45 5.5.4 Technology choices 45
5.6 SIZE CLASS AND COST 46 5.7 EXAMPLES 47
6 TOTAL DIRECT COSTS 49
6.1 APPROACH 49 6.2 ESTIMATION OF TOTAL DIRECT COST 49
7 COST-BENEFIT ANALYSIS 51
7.1 APPROACH 51 7.2 SCENARIOS 51 7.3 COSTS TO STAKEHOLDERS 51
7.3.1 Type approval certificates 51 7.3.2 Port state control and flag state control 52
7.4 TOTAL COSTS 52 7.5 ENVIRONMENTAL IMPACT ASSESSMENT 52
7.5.1 Health benefits 53 7.6 COST-BENEFIT ASSESSMENT 54 7.7 COMPARISON TO OTHER STUDIES 56
7.7.1 Centre for Maritime Studies, University of Turku (2010) 57 7.7.2 Entec UK Limited (2005) 58 7.7.3 Marine Environment Protection (2009) 58 7.7.4 U.S. Environmental Protection Agency (2009) 58
7.8 SENSITIVITY TESTS 58 7.9 SENSITIVITY RESULTS 60
7.9.1 Sensitivity: Total cost in 2030 60 7.9.2 Sensitivity: Net benefit in 2030 62 7.9.3 Sensitivity: Benefit-cost ratio in 2030 62
7.10 NORTH SEA SECA 63
8 INDIRECT ECONOMIC IMPACTS 65
8.1 SUMMARY 65 8.2 EFFECT ON FREIGHT RATES 65
8.2.1 About the competition model 66 8.2.2 Results from the competition model 66 8.2.3 Comparisons to other studies 67
8.3 MODAL SHIFTS 67 8.3.1 Modal shift potential 68 8.3.2 Cases: Short-sea ro/ro routes 69 8.3.3 Cases: Long distance container routes to Europe 72 8.3.4 New routes – avoiding the NECA 73
8.4 IMPACT ON DECISION TO INVEST IN NEW SHIPS 74 8.4.1 Historical scrappings 75 8.4.2 Drivers for shipowners’ replacement decisions 75 8.4.3 The costs of keeping a ship in operation 76 8.4.4 Change in decisions on when to invest in new ships 77
9 REFERENCES 78
10 APPENDIX A: TECHNOLOGY TODAY AND OUTLOOK 80
10.1 TECHNOLOGY TODAY AND OUTLOOK TOWARDS 2030 80

5
10.1.1 The marine engine and its fuels 80
11 APPENDIX B: ABATEMENT TECHNOLOGY REVIEW 83
11.1 TECHNOLOGY TODAY AND OUTLOOK TOWARDS 2030 83 11.1.1 NOx abatement technology outlook 83
11.2 INFORMATION SEARCH WITH TECHNOLOGY MANUFACTURERS 86 11.3 GENERAL AIR EMISSION ISSUES 87 11.4 REVIEW OF TIER II TECHNOLOGIES 88 11.5 REVIEW OF TIER III TECHNOLOGIES 90 11.6 SELECTIVE CATALYTIC REDUCTION (SCR) 92
11.6.1 Technical description 92 11.6.2 Feasibility 93 11.6.3 Costs 95
11.7 EXHAUST GAS RECIRCULATION (EGR) 97 11.7.1 Technical description 97 11.7.2 Feasibility and cost 98
11.8 LIQUEFIED NATURAL GAS ENGINES 100 11.8.1 Dual fuel systems 101 11.8.2 Technical description 102 11.8.3 Feasibility and Costs 102
11.9 TIER III APPLICABLE TECHNOLOGIES SUMMARY 103
12 APPENDIX C: SENSITIVITY TESTS 106

6

7
Preface
The project Economic Impact Assessment of a NOx emission control area in the North Sea was conducted for and funded by The North Sea Consultation Group. The Danish Environmental Protection Agency contracted the project to Incentive Partners in association with Litehauz. The project’s main tasks were to estimate:
The cost-effectiveness of different NOx-reducing technologies on sea shipping in order to meet the International Maritime Organizations (IMO) NOX emission control area (NECA) requirements in the North Sea.
The economic impacts of a NECA in the North Sea, including total NOx abatement costs in the period up to 2030.
The indirect economic impacts of a NECA, including potential modal shift and the economic impacts on the shipping companies.
The basis for a decision on whether or not to establish a NOx emission control area (NECA) is a comparison of the environmental and economic consequences. Two separate reports assess the two sides:
The environmental impact assessment report was conducted by PBL Netherlands Environmental Assessment Agency Netherlands, in the following referred to as PBL, in association with a range of contributors.
The economic impact assessment, which is this report, was conducted by Incentive Partners in association with Litehauz who provided the expert opinion on the available abatement technology.
The environmental impact assessment report thoroughly presents the background and motivation for considering establishing a North Sea NECA. This will not be touched upon in this report. Instead, we refer to the report by PBL. The two reports are aligned in terms of assumptions, and throughout this report multiple references to the environmental impact assessment are made. The results of the two reports are compared and analysed in this report. In preparation of the two reports there has been continuous contact between PBL, Incentive Partners and Litehauz in order to ensure alignment. The Finnish Meteorological Institute provided information on shipping patterns and the North Sea fleet in 2009. We are grateful for the contributions from BSR Innoship & Baltic Institute of Finland for procuring the data. During the study, the project teams have been in contact with a number of industry experts and other stakeholders in the maritime service sector. The willingness to provide information and share considerations is greatly appreciated and has been a prerequisite for the quality of the report.

8
List of abbreviations
AIS Automatic identification systemCAPEX Capital expenditure CO2 Carbon dioxide CH4 Methane CO Carbon monoxide ECA Emissions control area EGCS Exhaust gas cleaning systemEGR Exhaust gas recirculation FMI Finnish Meteorological InstituteGT Gross tonnageHFO Heavy fuel oilIMO International Maritime Organization LNG Liquefied natural gas MCR Maximum continuous ratingNECA NOx emission control areaNOx Oxides of nitrogen N2O Nitrous oxide OPEX Operating expenditurePM Particulate matter SCR Selective catalytic reduction SECA SOx emission control areaSFOC Specific fuel oil consumptionSO2 Sulphur dioxide SOx Oxides of sulphur VOC Volatile organic compounds

9
Sammenfatning og konklusioner
I 2008 vedtog den International Maritime Organisation (IMO) deres reviderede MARPOL Appendix VI, som dikterer strengere regulering af udledninger af luftemissioner fra skibe. Kravene gælder blandt andet udledninger af svovldioxid og nitrogenoxider. I 2010 besluttede Nordsø-landende at sætte en proces i gang, der indebærer studier af de miljømæssige og økonomiske konsekvenser af et kontrolområde for udledninger (ECA) af NOx i Nordsøen, inklusiv i den Engelske Kanal, i det følgende kaldet NECA. Grundlaget for beslutningen om, hvorvidt der skal etableres et NECA i Nordsøen, er en sammenligning af de miljømæssige og økonomiske konsekvenser. Denne rapport dækker den økonomiske konsekvensanalyse og er blevet udarbejdet af Incentive Partners i samarbejde med Litehauz. Rapporten, der dækker den miljømæssige konsekvensanalyse, blev udarbejdet af PBL i samarbejde med en række bidragsydere; se den miljømæssige konsekvensanalyse for detaljer. De to rapporter er afstemt med hinanden mht. antagelser og refererer i stort omfang til hinanden. I 2009 blev 20.400 skibe registret for at have opereret i Nordsø-området. Data for 2009 er leveret af FMI. Hvis Nordsøen bliver etableret som et NECA, skal skibe, der er bygget efter 2015, leve op til Tier III-standarderne. Tilgangen af nye skibe er estimeret på baggrund af den forventede fremtidige efterspørgsel efter søtransport, hvor aldersprofilen for den nuværende flåde og levetiden for skibe er taget i betragtning. Antagelserne er konsistente med antagelserne i IMO’s studie om drivhusgasser. I projiceringen af den fremtidige flåde er der taget højde for adskillige effekter, inklusiv teknologisk udvikling og øget specialisering af flåden pga. NECA-kravene. Det forventes, at der i 2030 vil være 21.600 skibe, der opererer i Nordsøen, hvis der etableres et NECA. Heraf forventes 19% at have installeret LNG, og yderligere 42% vil være bygget efter NECA kravene er blevet introduceret og vil derfor overholde NECA standarderne.

10
En detaljeret teknologisk gennemgang viser, at der er tre tilgængelige teknologiske muligheder for hovedmotorer:
SCR (Selective Catalytic Reduction). Motorens udstødning ledes gennem en katalysator, der reducerer nitrogenoxiderne til nitrogen og vand ved at bruge ammoniak som reduktionsmiddel.
EGR (Exhaust Gas Recirculation). Teknologien er baseret på at omdirigere en del af udstødningsgassen tilbage ind i forbrændingskammeret og derved mindske forbrændingstemperaturen og følgelig også NOX udledningen.
LNG (Liquefied Natural Gas). Fuldstændig erstatning af konventionelt brændstof med LNG.
Cost-effectiveness-analysen viser, at skibsoperatørernes mest omkostningseffektive valg af teknologi er EGR for 2-takts-motorer, SCR for 4-takts-motorer og SCR for 4-takts-hjælpemotorer. Den fremtidige markedspenetration af LNG er drevet af SOX ECA-kravene og er derfor upåvirket af etableringen af et NECA. Den årlige omkostning ved at overholde kravene er i størrelsesordenen 6.500-400.000 euro pr. skib med et samlet gennemsnit på 52.000 euro pr. skib. Det dækker de samlede direkte omkostninger for skibsejerne. Omkostningerne ved at overholde NECA-standarderne er domineret af kapitaludgifterne ved at købe og installere den påkrævede teknologi. Den anden store omkostningskomponent er driftsudgifterne. Brændstofudgifter er kun en mindre omkostningskomponent. De samlede omkostninger i 2030 ved at etablere et NECA er estimeret til 282 millioner euro. De miljømæssige gevinster er vurderet til mellem 443 millioner euro og 1.928 millioner euro af PBL i den miljømæssige konsekvensvurdering. Beløbet er afhængigt af den anvendte vurderingsmetode og afspejler usikkerheden i vurderingen. Den samlede samfundsmæssige nettogevinst vil være mellem 161 millioner euro og 1.928 millioner euro. Det er ækvivalent til et benefit-cost-forhold på 1,6-6,8. På gevinstsiden er der en række gevinster, som ikke er værdisat, hvilket implicerer et endnu bedre benefit-cost-forhold.

11
Vi undersøgte også de indirekte omkostninger af et NECA. De overordnede konklusioner mht. de indirekte økonomiske effekter er:
Den estimerede stigning i samlede omkostninger for skibsoperatører er mindre end 2%.
Den konkurrencemæssige situation mellem sø- og landbaseret transport gør det optimalt for skibsoperatørerne at absorbere en stor del af omkostningsstigningen for at minimere risikoen for trafikoverflytning fra sø- til landbaseret transport.
Det er usandsynligt, at de omkostninger, der pålægges skibsoperatørerne, medfører overflytninger til andre transportformer.
Stigningen i fragtraterne er estimeret til 1% - 2% på nærskibsfart. Stigningen i fragtraterne er estimeret til 0,2% - 0,6% for langdistance
skibsfart. Det er meget usandsynligt, at der sker en omdirigering af skibsruterne. Beslutningen om at investere i nye skibe forventes kun at blive påvirket
svagt, hvis overhovedet. Potentielle ændringer i beslutningen, om at investere i nye skibe, vil
ikke påvirke den samfundsøkonomiske vurdering, da omkostninger og gevinster vil blive udskudt parallelt.
Det er gennemført flere følsomhedsanalyser, der undersøger en situation, hvor en stor del af flåden i Nordsøen er udstyret med teknologier, der er kompatible med NECA. Det afspejler en situation, hvor der etableres flere NECA’er i internationale farvande. Omkostningen for det enkelte skib ved at anvende teknologien bliver ikke påvirket, men de socioøkonomiske omkostninger, der medregnes i den samfundsøkonomiske konsekvensvurdering af fremtidige potentielle NECA’er, aftager. Med andre ord vil kapitaludgifterne forbundet med et ekstra NECA falde, jo flere NECA’er der bliver etableret. Effekten er ganske stærk, da kapitalomkostningerne er en dominerende parameter i vurderingen af omkostningerne. Analysen viser, at omkostningerne ved at etablere et NECA i Nordsøen, er signifikant lavere end værdien af gevinsterne. En bred række af følsomheds- og scenarieanalyserne understøtter denne konklusion. Den overordnede konklusion, baseret på den miljømæssige konsekvensvurdering og den økonomiske konsekvensvurdering, er derfor, at det vil være et samfundsøkonomisk omkostningseffektivt tiltag at etablere et NECA i Nordsøen, svarende til, at gevinsterne overstiger omkostningerne. Reduktionsomkostningerne pr. ton NOX er estimeret til 1.878 euro, hvilket er i tråd med resultaterne i de økonomiske studier af det Baltiske NECA og det Nordamerikanske NECA/ECA.

12

13
Summary and conclusions
In 2008, the International Maritime Organization (IMO) adopted their revised MARPOL Appendix VI, which outlines stricter regulation of air pollutant emissions from ships. Amongst others, the requirements apply to emissions of sulphur dioxide and nitrogen oxides. In 2010, the North Sea countries decided to initiate a process that entails studies of environmental and economic implications of an emission control area (ECA) for NOx in the North Sea, including the English Chanel, in the following referred to as NECA. The basis for the decision whether or not to establish a NECA in the North Sea is a comparison of the environmental and economic consequences. This report covers the economic impact assessment and has been conducted by Incentive Partners in association with Litehauz. The environmental impact assessment report was conducted by PBL in association with a range of contributors; see the environmental impact assessment for details. The two reports are aligned in terms of assumptions, and often referenced. In 2009, 20,400 ships were registered as having operated in the North Sea area. Data for 2009 is provided by FMI. If the North Sea is established as a NECA, ships built after 2015 will have to comply with the Tier III standards. The inflow of new ships has been estimated based on the expected future demand for sea transport, taking the age profile of the current fleet and life expectancy of ships into consideration. The assumptions are consistent with the IMO assumptions in the IMO greenhouse gas study. In projecting the future fleet, numerous effects are taken into account, including technological developments and increased specialisation of the fleet due to NECA requirements. It is projected that in 2030, a total of 21,600 ships will operate in the North Sea if a NECA is established. Of those, 19% are expected to have LNG installed and an additional 42% will be built after the introduction of the NECA requirements and therefore comply with the NECA standards. A detailed technological review shows that for main engines three technological options are available:
SCR (selective catalytic reduction). The exhaust from the engine is led through a catalyst, which reduces nitrogen oxides to nitrogen and water by using ammonia as the reducing agent.
EGR (exhaust gas recirculation). The technology is based on redirecting a part of the exhaust gas back into the combustion chamber, thereby lowering the combustion temperature and consequently the NOx emission.
LNG (liquefied natural gas). Complete substitution of conventional fuel with LNG.

14
The cost-effectiveness analysis shows that the cost-effective technology choices of the ship operators are EGR for 2-stroke main engines, SCR for 4-stroke main engines and SCR for 4-stroke auxiliary engines. The future market penetration of LNG in the fleet is driven by the SOx ECA requirements and unaffected by the establishment of a NECA. The annual cost of compliance is in the range of €6,500-€400,000 per ship, with an overall average of €52,000 per ship. This covers total direct costs for shipowners. The cost of complying with the NECA standards is dominated by the capital expenditure of purchasing and installing the required technology. The other major cost component is the operating expenditure. Fuel cost is only a minor cost component. The total cost in 2030 of establishing a NECA is estimated to be €282 million. The environmental impact is assessed in the environmental impact assessment report by PBL at between €443 million and €1,928 million, depending on the applied assessment method and also reflecting the uncertainty of the assessment. The total net benefits to society will equal between €161 million and €1,928 million. This is equivalent to a benefit-cost ratio of 1.6-6.8. On the benefit side a range of benefits are not monetised, which implies an even better benefit-cost ratio. The indirect economic effects of a NECA were also examined. These are the main conclusions regarding the indirect economic effects:
The estimated increase in total costs for ship operators is less than 2%. The competitive situation between sea- and land-based transportation
makes it optimal for the ship operators to absorb a large share of the cost increase and thereby minimise the risk of a modal shift from sea- to land-based transportation.
The costs imposed on the ship operators are unlikely to facilitate modal shifts.
The increase in freight rates is estimated to be 1%-2% for short-sea shipping.
The increase in freight rates is estimated to be 0.2%-0.6% for long distance shipping.
A rerouting of the shipping patterns is very unlikely. The decision to invest in new ships is expected to be influenced only
vaguely if at all. Potential changes in the decision to invest in new ships will not affect
the socio-economic assessment, since the costs and benefits are postponed accordingly.
Sensitivity analyses explore a situation in which major parts of the North Sea fleet are equipped with NECA-compatible technologies. This reflects a situation in which multiple NECAs are established in international waters. The cost of applying the technology to the individual ship is not affected; however, the socio-economic costs allocated to the economic impact assessments of future potential NECAs diminishes. In other words, the more new NECAs that are established, the lower the capital expenditure associated with an extra NECA will be. This effect is quite strong, as the capital costs are a dominating parameter in the cost assessment.

15
The analysis shows that the costs of establishing a North Sea NECA are significantly lower than the value of the benefits. A large number of sensitivity and scenario analyses support this conclusion. The overall conclusion, based on the environmental impact assessment and the economic impact assessment, is that establishing a North Sea NECA is a socio-economic cost-efficient measure with benefits exceeding costs. The abatement cost per ton of NOx is estimated to be €1,878, which is in line with the findings in the economic studies of the Baltic NECA and the North American NECA/ECA.

16
1 Introduction
1.1 Background In 2008, the International Maritime Organization (IMO) adopted their revised MARPOL Appendix VI, which outlines stricter regulation of air pollutant emissions from ships. Amongst others, the requirements apply to emissions of sulphur dioxide and nitrogen oxides. The regulation includes the possibility of the appointment of emission control areas (ECAs) where emissions must be reduced even further. The basis for a decision on whether or not to establish a NOx emission control area (NECA) is a comparison of the environmental and economic consequences. Two separate reports assess the two sides:
The environmental impact assessment report was conducted by PBL Netherlands Environmental Assessment Agency in association with a range of contributors.
The economic impact assessment, which is this report, was conducted by Incentive Partners in association with Litehauz who gathered and structured the expert knowledge on the available abatement technologies.
The environmental impact assessment report thoroughly presents the background and motivation for considering establishing a North Sea NECA. This will not be touched upon in this report. Instead, we refer to the report by PBL. The two reports are aligned in terms of assumptions, and throughout this report multiple references to the environmental impact assessment are made. The results of the two reports are compared and analysed in this report. PBL examines 4 different scenarios for NOx standards of ships. The basis of this analysis is the scenario labelled NECA-1. Throughout the preparation of the two reports PBL, Incentive Partnes and Litehauz have had a close cooperation and have continuously shared and discussed data, methods and results to ensure alignment. In 2010, the North Sea countries decided to initiate a process that entails studies of environmental and economic implications of an ECA of NOx (NECA) in the North Sea. In 2006, the North Sea was designated as a sulphur oxides control area (SECA). The basis of the analysis is the establishment of NECA requirements in the existing SECA in the North Sea.
1.2 Objectives This report presents the results of the economic impact assessment of a North Sea NECA.

17
The project’s main tasks were to estimate: The cost-effectiveness of different NOx-reducing technologies on sea
shipping in order to meet the NECA requirements in the North Sea. The economic impacts of a NECA in the North Sea, including total
NOx abatement costs in the period up to 2030. The indirect economic impacts of a NECA, including the potential
modal shift and the economic impacts on the shipping companies.
1.3 Approach The economic impact assessment is based on a range of shipping data as well as a series of assumptions. Throughout the report the assumptions used are aligned with the assumptions used in the environmental impact assessment conducted by PBL. PBL has to the widest extent possible based its assumptions on the IMO greenhouse study. The basis for the economic impact assessment is an overview of the current traffic patterns in the North Sea and the current North Sea fleet. The Finnish Meteorological Institute (FMI) has provided these on the basis of the messages provided by the automatic identification system (AIS). The information on each individual ship was obtained by IHS Fairplay and various other sources. The assessment of the current situation forms the basis for projecting the future fleet. The projection outlines the magnitude of the NECA-complying fleet. In the environmental impact assessment the emission inventory is based on data provided by Maritime Research Institute Netherlands (MARIN) on the shipping activities of the North Sea and on emission factors from TNO. The economic impact assessment is based on data provided by the Finnish Meteorological Institute (FMI). The different data sources have been coordinated and corrections have been made to ensure consistency. New ships will be subject to the NECA standards and face mandatory technological investments and increased operational costs when operating inside the North Sea NECA. The unit cost estimates for all relevant technologies complying with Tier III NOx emission standards have been derived on the basis of interviews with key industry experts and existing studies. If a ship is operating in another NECA area, it will have the required technologies installed and no additional investments are required. Two other NECAs are assumed to be in effect before or simultaneously with the North Sea NECA: the North American NOX and SOX ECA, in the following called US ECA, is expected to be fully active from 2016 and the coastal states of the Baltic Sea are currently in the process of finalizing an application to the IMO on designation of the Baltic Sea as a NECA. A range of sensitivity analyses examine the role of other NECAs including situations in which more or less NECAs are designated. From the unit costs, the most cost-efficient technology choice is identified for different ship types and size classes. The cost of the optimal technology choice and the size of the NECA-complying fleet form the basis for assessing the total direct costs of establishing a North Sea NECA. The socio-economic effect of establishing a NECA is assessed in a cost-benefit analysis comparing the total direct costs with the environmental

18
impacts. The cost-benefit analysis compares the cost and benefits associated with establishing a NECA (the project situation) with a situation where the NECA is not established (the baseline situation). In addition to the direct effects of establishing a North Sea NECA, a range of indirect effects are studied. The effect of increased costs for the ship operators on freight rates is assessed. The economic incentive to change the ship operating patterns is analysed using case studies. And the ship operators’ incentive to reconsidering their ship renewal strategy and either expediting or postponing the purchase of new ships is analysed. In the report, a main project scenario of a situation with a North Sea NECA is analysed. A considerable number of assumptions are made to set up the main project scenario. Numerous sensitivity analyses were conducted to identify the decisive parameters and assumptions – and elucidate the robustness of the results.
1.4 Structure of the report The current North Sea fleet and the shipping patterns are described in section 2. In section 3 the projection of the future North Sea fleet is presented. A review of the technological options is given in section 4. Based on the ship profiles in section 2 and the available technologies in section 4, the cost-effective technology choices are identified for different ship profiles in section 5. The total direct cost of a North Sea NECA is presented in section 6. The total cost is compared to the positive health effects due to cleaner air in a cost-benefit analysis in section 7. In section 8, indirect economic effects are considered. In section 9, references can be found. Supplementary information is provided in appendices A-B.
1.5 Parameters and assumptions In Table 1-1, the key assumptions and parameters are shown. Table 1-1: Key assumptions and parameters Parameter/element Approach/assumption/requisite Calculations period end 2030Price level 2012Discount rate 4%NECA opening year 2016Fleet projection See section 3Technology cost estimates See section 4Environmental impact assessment See section 7.5

19
2 The North Sea fleet
2.1 Introduction This chapter provides an overview of the current shipping patterns in the North Sea and the existing North Sea fleet. This forms the basis of the projection of the North Sea fleet. The projection, together with the technological costs, form the basis of the assessment of the direct costs of establishing a NECA in the North Sea. The Finnish Meteorological Institute (FMI) has processed the raw data for the overview on the basis of the messages provided by the automatic identification system (AIS). Information for 2009 on each individual ship was obtained from IHS Fairplay and various other sources by FMI. Data has been compared and consistency has been validated. It was necessary to make minor corrections to ensure maximal consistency. See also the environmental impact assessment for information on the background data used. Two main characteristics of the fleet are essential for the analysis:
1. The number of ships requiring new technology installed in order to meet the Tier III requirements.
2. The number of travelled kilometres within the North Sea NECA area, since establishing a NECA will impose additional operating costs.
The fleet description is based on year 2009 only. It is central to the analysis that 2009 is a representative year for the ship operations in the North Sea and does not reflect aberrant circumstances. The current fleet was used as a basis for the projection, and if year 2009 is not representative, it could lead to biased estimates. By analysing port statistics, we have tried to clarify whether 2009 is indeed a representative year. There are indications that the global crisis around year 2009 have implied a lower shipping activity this is handled in the sensitivity analyses. The geographical area referred to as the North Sea in the report is formally defined as the area marked as North Sea Zone in Figure 2-1 below. Note that the area includes the English Channel, which formally is not included in the geographical area generally defined as the North Sea.

20
Figure 2-1: The North Sea Source: AtoBviaC Plc
2.2 The North Sea fleet
2.2.1 Number of ships and distances travelled The current fleet of ships in the North Sea is the basis for the projection of the fleet. During 2009, a total of 20,400 ships were registered as having operated in the North Sea. Some ships sailed only a few kilometres in the North Sea. If these ships do not require NECA-compatible technologies installed due to operation activities in other NECA areas, it is not plausible that these ships will be replaced with ships with NECA-compatible technology. A logical consequence of a NECA would be some degree of specialisation of the fleet. In other words, ships equipped with the required technology will take over operations in the North Sea from other ships moving to operate in non-NECAs elsewhere and thereby avoid installing the required technology. A sensitivity analysis explores a situation in which the shipping activities are taken over by ships built prior to the establishment of a NECA. Consequently, the main project scenario of the analysis is based on the assumption that operations handled by ships operating outside the North Sea NECA and not entering another NECA which are sailing less than 3,000 kilometres per year in the North Sea are overtaken by other ships. A similar type of correction for the relevant pool of ships is made in the analysis of a Baltic NECA. The figure of 3,000 kilometres is merely a qualified guess. A sensitivity analysis is conducted in which the full North Sea fleet is equipped with NECA-complying technology; this resembles a scenario with no specialization. In addition to the group of ships not affected by the establishment of a NECA due to specialisation, there is another group of ships which will not be

21
affected. The Danish Maritime Authority has conducted a special analysis of the North Sea data provided by FMI and estimates that approximately 6% of the ships of the type “other” are not subject to complying with the NECA standards, as they do not fall within the boundaries of the NECA ship profiles requiring compliance. See section 2.2.2 for more information on the ship type ‘other’. This reduces the number of relevant ships by 15%, from 20,400 to 17,372 ships. Note that the number of travelled kilometres is unchanged, due to the fact that the trips are overtaken by other ships. The 17,372 ships travelled a total of 184 million kilometres in 2009. In addition, the 3,028 ships expected not to operate in the North Sea anymore if a NECA is established, travelled only 4.5 million kilometres, or around 2.5% of the total covered distance. More than 40% of these ships are of the type ‘other’. The rest of the 3,028 are a broad selection of all ship types. Figure 2-2 shows the distribution of ships and kilometres travelled by ship type for the 17,372 ships.
0%
10%
20%
30%
40%
Bulk carrier
Chem. +
Gas tanker
Container ship
Fishing
Gen
eral dry cargo
Misc
Non m
erchant
Oil tanker
Passenger
Reefer
RoRo Cargo
/vehicle
Tug/supply
Other
Share of ships
Share of km
Figure 2-2: Distribution of ships and distribution of km in the North Sea travelled by ship type The ship type “other” is the largest group in the North Sea. It is however a collective name for a range of minor ship types, see Figure 2-3. General dry cargo is the most common ship type in the North Sea both in terms of number of ships (16%) and kilometres travelled (23%). Passenger ships cover a relatively large share of kilometres travelled in the North Sea compared to the number of ships. One important reason for this is that a large share of the passenger ships is operating strictly within the North Sea NECA. Despite the fact that ships categorised as ‘other’ account for a third of the entire fleet, they account for less than 10% of the kilometres travelled.

22
2.2.2 ‘Other’ ships The information on the ‘other’ ships is limited. In Figure 2-3 below, the composition of ships categorised as ‘other’ is shown.
20%
11%
9%
8%
8%
5%
5%
5%
4%
4%
4%
3%
3%
2%
2%
Fishing
Cargo
Other type
Not available or no ship
Pleasure craft
Military operations
Pilot Vessel
Search and Rescue vessel
Sailing
Tanker
Undefined
Passenger
Tugs
Dredging or underwater operations
Law enforcement vessels
Figure 2-3: Composition of ship type ‘other’, % Source: The ship types are provided by the Danish Maritime Authority and are a generalisation of the original AIS message. Note: Ship types constituting less than 2% are not shown. The composition is not based on perfect information. The required information was available on only a fraction of the ships, so there is a great risk of bias in the estimates. Therefore the estimates should be interpreted tentatively. As mentioned, the Danish Maritime Authority estimates that approximately 6% of the pool of ‘other’ ships is not subject to the NECA standards, as they do not fall within the boundaries of the NECA ship profiles requiring compliance. In the analysis, the ship type ‘other’ is treated as tug supply-size class-1 ships, as they share many characteristics.
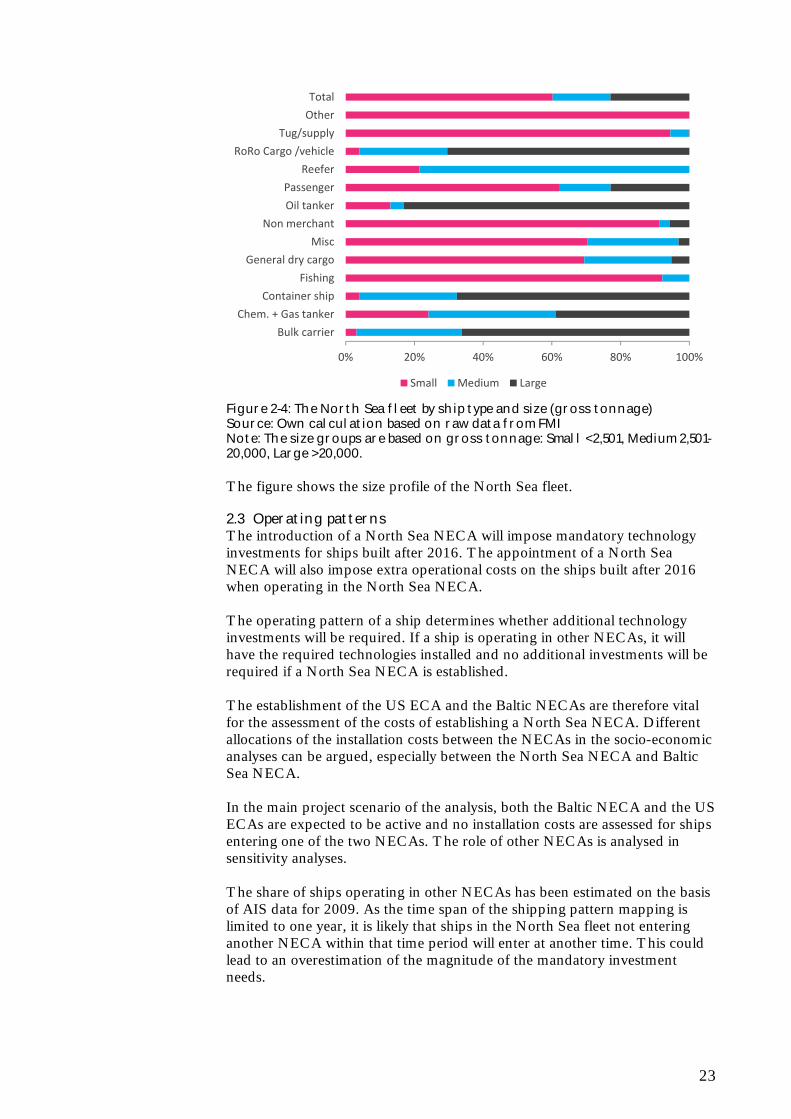
2.2.3 Ship sizes of the North Sea fleet Ships of the same type differ greatly in size. In Figure 2-4, the relative size distribution for each ship type is presented.
23
0% 20% 40% 60% 80% 100%
Bulk carrier
Chem. + Gas tanker
Container ship
Fishing
General dry cargo
Misc
Non merchant
Oil tanker
Passenger
Reefer
RoRo Cargo /vehicle
Tug/supply
Other
Total
Small Medium Large
Figure 2-4: The North Sea fleet by ship type and size (gross tonnage) Source: Own calculation based on raw data from FMI Note: The size groups are based on gross tonnage: Small <2,501, Medium 2,501-20,000, Large >20,000. The figure shows the size profile of the North Sea fleet.
2.3 Operating patterns The introduction of a North Sea NECA will impose mandatory technology investments for ships built after 2016. The appointment of a North Sea NECA will also impose extra operational costs on the ships built after 2016 when operating in the North Sea NECA. The operating pattern of a ship determines whether additional technology investments will be required. If a ship is operating in other NECAs, it will have the required technologies installed and no additional investments will be required if a North Sea NECA is established. The establishment of the US ECA and the Baltic NECAs are therefore vital for the assessment of the costs of establishing a North Sea NECA. Different allocations of the installation costs between the NECAs in the socio-economic analyses can be argued, especially between the North Sea NECA and Baltic Sea NECA. In the main project scenario of the analysis, both the Baltic NECA and the US ECAs are expected to be active and no installation costs are assessed for ships entering one of the two NECAs. The role of other NECAs is analysed in sensitivity analyses. The share of ships operating in other NECAs has been estimated on the basis of AIS data for 2009. As the time span of the shipping pattern mapping is limited to one year, it is likely that ships in the North Sea fleet not entering another NECA within that time period will enter at another time. This could lead to an overestimation of the magnitude of the mandatory investment needs.

24
Ships operating in other NECA areas will fulfil all technological requirements without additional investments. Of the total 17,372 ships in the North Sea fleet, 40% operated in both the Baltic Sea and North NECA, but no other NECAs. The establishment of the Baltic NECA is therefore central to the magnitude of the required technological investments. Only 4% of the North Sea fleet entered the US ECA as the only additional ECA. Both US ECA and Baltic NECA were entered by 5% of the North Sea fleet. In total, approximately 50% of the North Sea fleet entered another NECA in 2009 and will therefore not need to install additional technology to comply with the NECA regulations in the North Sea. One-third of the ships are operating strictly within the North Sea. Approximately one-sixth are operating inside and outside the North Sea NECA but do not enter another NECA area. Both groups will need to make investments in new technology if a North Sea NECA is established. In Figure 2-5, the operating pattern is shown for the different ship types.
0%
25%
50%
75%
100%
Bulk carrie
r
Chem. +
Gas tan
ker
Contain
er ship
Fishing
Gen
eral dry cargo
Misc
Non m
erchant
Oil tan
ker
Passe
nger
Reefer
RoRo Cargo
/vehicle
Tug/su
pply
Other
Total
Left North Sea NECA and did not enter another NECA
Inside North Sea NECA only
Entered both US and Baltic NECA
Entered US NECA and not Baltic NECA
Entered Baltic NECA and not US NECA
Figure 2-5: Operating pattern by ship type Figure 2-5 shows that there are substantial differences between the shipping patterns of the different ship types. The majority (80%) of the general dry cargo ships, which is the dominant ship type in the North Sea, have entered another NECA. For ships of another dominant ship type in the North Sea, chemical and gas tankers, 72% entered another NECA. More than 70% of the bulk carriers, oil tankers and reefer ships are operating in other NECAs, while only 15% of the non-merchant ships and 37% of the passenger ships are.

25
Container ships, roro cargo/vehicle and fishing vessels have the largest share of ships operating outside the North Sea NECA without entering another NECA. The fleet of ships navigating strictly within the North Sea NECA is dominated by non-merchant, passenger and tug/supply ships - and ships of the type ‘other’.
2.4 Engine characteristics and fuel consumption The operating pattern determines which ships need investments in additional technology. The engine type and engine power will determine the optimal choice of technology and hence the costs of meeting the Tier III standards. Key characteristics for installed main engines and auxiliary engines are summarised for ship types in Table 2-1 and Table 2-2. Table 2-1: Main engine characteristics Ship type Share of 2-
stroke main engines
Average number of main engines
Average main engine power per ship (kW)
Main engine fuel consumption (g/kWh)
Bulk carrier 94% 1.0 8,605 177
Chem. + gas tanker 64% 1.1 6,884 182
Container ship 77% 1.0 32,013 177
Fishing 6% 1.1 2,368 194
General dry cargo 19% 1.1 3,095 193
Misc 15% 2.3 4,337 199
Non-merchant 2% 2.0 2,947 204
Oil tanker 84% 1.1 12,590 176
Passenger 11% 2.5 10,972 196
Reefer 77% 1.0 7,918 183
Roro cargo/vehicle 63% 1.2 11,887 183
Tug/supply 5% 2.3 4,608 195
Other 4% 1.2 1,072 205
Total fleet 34% 1.3 6,657 192
It is evident from Table 2-1 that bulk carriers and oil tankers primarily have 2-stroke engines whereas non-merchant ships, passenger vessels, general dry cargo vessels and tug/supply ships have 4-stroke engines. Along with the average number of engines, the engine type determines the compatible technologies required to be installed to meet the Tier III standards. The average engine power determines the operating costs associated with the installed technology. The larger the engine power, the higher the costs. For all ship types, main engine fuel consumption is in the range of 171-237 g/kWh. When the installed technology is active, the fuel consumption per kWh is increased 1-2%. The trend is that the g/kWh is decreasing with increased engine power.

26
Table 2-2: Auxiliary engine characteristics Ship type Average
number of auxiliary engines
Average auxiliary engine power per ship (kW)
Bulk carrier 2.2 1,142 Chem. + gas tanker 2.6 1,910 Container ship 3.2 5,560 Fishing 1.7 1,067 General dry cargo 2.3 731 Misc 1.6 1,259 Non-merchant 1.9 651 Oil tanker 2.5 1,991 Passenger 2.0 2,027 Reefer 3.3 2,294 Roro cargo/vehicle 2.7 2,471 Tug/supply 2.2 1,267 Other 2.0 365 Total fleet 2.3 1,371 No detailed information is available on the make or model of the auxiliary engines. Therefore fuel consumption of auxiliary engines cannot be determined using the method used for main engines. Instead, an educated guess is used as an estimate. Most auxiliary engines are (small) 4-stroke engines with an SFOC of 190-250 g/kWh. It is assumed that fuel consumption is 220 g/kWh for auxiliary engines for all ship types and size classes. Also it is assumed that all auxiliary engines are 4-stroke engines.

27
3 The future North Sea fleet
3.1 Introduction In order to assess the economic impacts of appointing the North Sea as a NECA, a projection of the future shipping activities on the North Sea is required. The NECA requirements apply to ships built after 2015 only. To estimate the cost of installing and operating the required technology on the future fleet, it is necessary to project the number of new ships built and operated during the time period of 2016 to 2030. The projection is, of course, associated with uncertainty, and a considerable number of sensitivity analyses are conducted. Note that the shipping activity in the North Sea in the future is not expected to be influenced by the establishment of a NECA; grounds for this are given in chapter 8. This implies that if the size of the fleet is overestimated both the cost side and the benefit side will be overestimated. In other words, an under or overestimation of the number of new ships is associated only with a shifting in the total cost and benefit levels leaving the benefit-cost ratio unchanged . Numerous sensitivity analyses elucidate changes in the costs for a given benefit assessment.
3.2 Approach The underlying basis for the fleet projection is assessing the demand for shipping activity measured as the demand for ton-kilometres. The shipping activity is converted to the number of ships required to meet the shipping activity demand taking the development in the profiles of ships into consideration. The current North Sea fleet is used as the underlying basis of the projection. Based on the age profile of the current fleet, the renewal process and overall growth of the fleet is projected. In the projection, a number of elements are taken into consideration:
The profile of the current North Sea fleet Fleet renewal rates Growth rates in shipping activities Operating speed Efficiency improvements The expected future share of LNG ships
The assumptions are used retrospectively to map the profile of the fleet of ships built before 2010 - and to map the changes in profile as the oldest ships are scrapped over time. Likewise, the assumptions are used to project the profiles of the ships built in the future to replace scrapped ships and meet the increasing demand for shipping activity. The data and assumptions used to derive the projections are briefly described in section 3.3. The data and assumptions used here are aligned to the largest possible extent with the environmental impact assessment.

28
3.3 Assumptions for projections 2009-20301
3.3.1 Fleet renewal rates The age of the 2009 fleet combined with assumptions on the average life expectancy are the basis of estimating renewal rates. In Table 3-1, the life expectancies for all ship types and size classes used in the projections can be found. Table 3-1: Average life expectancy, years
Central case Lower bound Upper boundLife expectancy 28.5 24 33
Source: MIDN (2007) Two sensitivity analyses are made in which the life expectancy age is lower/higher. The life expectancies are not based on data for ships operating in the North Sea region but apply to the global fleet. Service life in the North Sea fleet is likely to be shorter. Based on the age profile of the current fleet, ‘age conditional scrap probabilities’ are estimated to assess the future rate of renewal. The age profile of the North Sea fleet shows that the replacement need for container ships, oil tankers, and chemical and gas tankers is limited for the next 15 years, as the fleet is relatively young; see Figure 3-1. At the other end of the spectrum, a large share of the fleet, e.g. passenger and reefer, could be due for replacement over the next 10 years.
8
6 7
15
10
15
76
12
16
8 7
18
12
Bulk carrier
Chem. +
gas tanker
Container ship
Fishing
Gen
eral dry cargo
Misc
Non‐m
erchant
Oil tanker
Passenger
Reefer
Roro cargo/vehicle
Tug/supply
Other
Total
Figure 3-1: Average age by ship type in the North Sea fleet
3.3.2 Growth rates in shipping activities The projection is based on the growth rates in shipping activities shown in the table below.
1 Input is based on descriptions from Terms of Reference for the Environmental impact assessment of a NOx emission control area in the North Sea. April 2011.

29
Table 3-2: Annual average growth rates in shipping activities (ton-kilometres) in the North Sea 2009-2030, %
Central case Lower bound Upper boundContainer shipping 3.5% 2.0% 5.0%Other ship types 1.5% 0.5% 2.5%
Source: The environmental impact assessment by PBL The demand for shipping activity is assessed as the demand for ton-kilometres. For detailed information on the growth rates, see the environmental impact assessment report.
3.3.3 Operating speed Speed reduction is expected to be a key mechanism to reduce fuel consumption in the future. The table below shows the expected average speed reduction for the North Sea fleet. Table 3-3: Assumptions on speed reduction 2007-2030 (fleet average), %
Central case Lower bound Upper boundSpeed change -7% 0% -17%
Source: The environmental impact assessment by PBL Reducing speed will reduce the ton-kilometres a given ship can produce.
3.3.4 Efficiency improvements The assumptions on future improvements of transport efficiency by North Sea shipping are shown in Table 3-4 below. These are used to estimate the improved efficiency of the individual ship. The improved efficiency is assessed based on ton- kilometres. Each ship will become more efficient over time and be able to produce more ton-kilometres. The efficiency improvement is assessed as the total efficiency gain per ship excluding changes in operating speed. Table 3-4: Expected annual efficiency improvement in ton-kilometres per ship (fleet averages)
Central case Lower bound Upper boundAnnual efficiency improvement
1% 0% 2%
Source: Based on data from the environmental impact assessment by PBL The interpretation of the parameter is that new ships built compared to ships built the previous year will be 1% more efficient in terms of produced ton-kilometres in the central case. The estimates are based on the efficiency improvements described in the environmental impact assessment report.
3.3.5 LNG in shipping in the North Sea The establishment of a North Sea NECA is not expected to significantly influence the future market penetration of LNG ships. More specifically it is assumed in the analysis that the increase in future market penetration of LNG is motivated by the SECA requirements. Already the North Sea is established as a SECA well in advance of the NECA, and unpublished studies show that the establishment of a SECA is much more costly for ship operators than the

30
establishment of a NECA, when the NECA is established in coherence with an existing SECA. The economic incentive for ship operators to use LNG is motivated by application of the much more costly SECA requirements, not the NECA requirements, when the NECA is established on top of a SECA. It is therefore assumed in the report that the establishment of a North Sea NECA will not affect the future market penetration of LNG. In the Terms of Reference of the environmental impact assessment report, it was stated: A literature review shows that any current assumption on future market penetration of LNG in North Sea shipping is very uncertain. It is therefore proposed to use in the base case assumptions on market penetration based on the IMO greenhouse gas study (Buhaug et al. 2009) in combination with a broad bandwidth. The report is based on the assumption that the future market penetration of LNG in the North Sea shipping will be between 0% and 25% (central case) as indicated in the Table 3-5. Table 3-5: Assumptions on market penetration of LNG for North Sea shipping in 2030
Central case Lower bound Upper bound GT: 0-10,000 10,000+ 0-10,000 10,000+ 0-10,000 10,000+Size class: 1-4 5-8 1-4 5-8 1-4 5-8Bulk carrier 25% 0% 5% 0% 50% 0%
Chem. + gas tanker 25% 10% 5% 0% 50% 20%
Container ship 25% 0% 5% 0% 50% 0%
Fishing 25% 0% 5% 0% 50% 0%
General dry cargo 25% 0% 5% 0% 50% 0%
Misc 25% 0% 5% 0% 50% 0%
Non-merchant 25% 0% 5% 0% 50% 0%
Oil tanker 25% 10% 5% 0% 50% 20%
Passenger 25% 25% 5% 5% 50% 50%
Reefer 25% 0% 5% 0% 50% 0%
Roro cargo/vehicle 25% 25% 5% 5% 50% 50%
Tug/supply 25% 0% 5% 0% 50% 0%
Other 25% 0% 5% 0% 50% 0%Source: The environmental impact assessment by PBL Majority of ships using LNG do not require additional technological investments to operate in a NECA. In the analysis no additional cost are imposed on LNG ships as a consequence of the NECA requirements. Furthermore, their operating costs and fuel consumption are not influenced whilst operating inside a NECA; see section 4.2.5 for more on LNG. The future market penetration of LNG is very uncertain especially for larger ships. The more ships equipped with LNG the cheaper the establishment of a NECA will be. A conservative estimate is used to ensure that the costs are not underestimated. For more information on the growth rate estimates, see the environmental impact assessment report.

31
3.4 Projections 2009-2030 The growth in shipping activity and the replacement of old ships with new, improved ships are the driving forces in the fleet projection. The reduction of speed over time will, all things being equal, imply a need for a larger fleet of ships to meet the demand for ton-kilometres. The improved efficiency of new ships compared to old will imply a smaller North Sea fleet, all things being equal. The projection of the number of ships is central as the cost of complying with the NECA requirements is a per-ship cost. First, the future demand for ton-kilometres is assessed, and based on this, the number of ships in the fleet is assessed. The total number of ton-kilometres is expected to increase by 54% from 2009 to 2030, or approximately 1,500 billion ton-kilometres; see Figure 3-2.
0
500
1,000
1,500
2,000
2,500
3,000
3,500
4,000
4,500
2009
2010
2011
2012
2013
2014
2015
2016
2017
2018
2019
2020
2021
2022
2023
2024
2025
2026
2027
2028
2029
2030
Figure 3-2: Total shipping activity projection 2009-2030, billion ton-kilometres Based on the expected growth in shipping activity and the underlying assumptions on the future development in the profiles of ships presented in section 3.3, the number of ships in the future fleet is estimated.

32
0
5,000
10,000
15,000
20,000
25,000
2009
2010
2011
2012
2013
2014
2015
2016
2017
2018
2019
2020
2021
2022
2023
2024
2025
2026
2027
2028
2029
2030
Old ships LNG ships New ships built 2010‐2015 New ships built 2016‐2030
Figure 3-3: Fleet projection 2009-2030, number of ships The total number of ships in the fleet is expected to increase by a little more than 4,300 ships from 2009 to 2030. This is equal to an annual average growth rate in the number of ships of a little over 1%. The increase in the size of the fleet over time reflects that the effect of increased shipping activity and the need for more ships due to speed reduction are dominating the effect of increased efficiency. New ships expected to operate in other NECAs do not require additional technology to be installed due to a North Sea NECA, although their operation costs whilst in the NECA are affected. Note that the operating cost of LNG ships is not affected whilst operating inside a NECA. Ships not operating in other NECAs will face mandatory technological investments in addition to the increased operating costs. During the time period 2016 to 2030, a total of 9,200 new ships that are not LNG will be built for the North Sea fleet - on average, 610 per year. These are the ships required to comply with NECA standards. Some will operate in other NECAs and therefore have the required technology installed but will face the higher operating expenditure. The process of replacing old ships with new is evident from Figure 3-3. From 2009 to 2030, around 12,500 ships will be scrapped – equivalent to approximately 600 ships per year, on average. In 2030, ships built before 2010 will form around one-fifth of the total fleet of ships. The existing fleet will be gradually replaced by new ships, so the technology installation expenditure will be spread out over the period. Over time the fleet of ships built after 2016 will increase, which means that the fleet of NECA-compatible ships subject to higher operating expenditure will increase. In other words, the closer to 2030 we come, the higher the total annual operating expenditure will be. The projection of LNG ships is based on the underlying assumption that in 2030 LNG ships are expected to form 0%-25% of the fleet, depending on ship type; see section 3.3.5. LNG is assumed to compose a constant annual

33
share of the new ships built during the period. On average, 25% of all new ships are expected to be LNG ships. The share of LNG ships in the fleet is driven by the SECA requirements and not affected by the establishment of a NECA.

34
4 NOX abatement technologies
4.1 Technology review The updated information on NOx abatement technologies was generated during interviews with manufacturers carried out as part of the present study2 and from the information available in the public domain, including technical reports and company information.
4.1.1 Existing technologies The technologies for reducing NOx emissions in maritime transport are to some extent well known from land-based industrial applications and yet under development or modification to suit the particular characteristics of the maritime industry. Several major reviews of NOx abatement technologies have been carried out earlier (e.g. Entec 2005; Artemis 2005, US EPA 2009), and MEPC will in 2012-2013 prepare a review of the technologies specifically meeting Tier III as required in MARPOL Appendix VI (MEPC 62/4/9). In general, for reducing NOx emissions the main technological tracks are:
Selective catalyst reduction exhaust after-treatment Exhaust gas recirculation Water introduction methods Internal engine modifications Use of alternative fuel (LNG) for propulsion
The Tier III NOx abatement technologies briefly described here are related to modifications of the diesel-type engines currently installed in new ships. However, in particular, the option for short sea shipping, ferries and other local traffic within a NECA to use LNG as a fuel for propulsion is assessed. It is noted that there is a considerable range in the reported reduction efficiencies and ability of technologies to achieve Tier III compliance, partly due to the rapid evolution of the field over the last five years3 and partly caused by the limited range of applications as several technologies have still only been tested in few vessels. Energy sources such as nuclear power, hydrogen fuel cells, wind-assisted propulsion, solar power, biodiesel, etc. are not considered relevant for a Tier III-induced change in fuel choice in the time frame of the study (up to 2030).
4.2 Review of Tier II and III technologies
4.2.1 Tier II technologies The NOx emissions of a diesel engine can be controlled through engine design and calibration of, e.g. fuel delivery and valve timing. As mentioned earlier, the control of diesel emissions by modifying the combustion involves trade-
2 It is the intention of the review not to provide details of the technical operation of the abatement technologies, which are well described elsewhere, but to focus on the cost implications of selecting, installing and operating the different technologies. 3 The background documentation for the Economic Assessment of the Baltic NECA lists, e.g. only two Tier III technologies: SCR and conversion to gas (Kali et al. 2010).

35
offs in NOx emission control versus other parameters, in particular fuel consumption. These methods readily meet the Tier II reduction target:
Internal engine modifications Direct water injection Water in fuel Air intake humidification
The findings are that major players currently do not further develop DWI, WIF emulsions and air humidification methods as stand-alone technologies for Tier III, as the methods may not achieve the required 80% reduction of Tier I emission level. The technologies may, however, be used in combination with Tier III methods and further reduce NOx levels. The review of technologies is provided in Appendix B. Table 4-1: Tier II NOx reduction technology overview (information primarily from low-medium speed engines) Technology Short description Max % NOx
reduction Primary (before or on engine)Direct Water Injection (DIW)
DWI technology reduces NOx emissions through the injection of a high-pressure fine-water mist into the combustion chamber.
Up to 50-60%
Water in Fuel (WIF) Systems
WIF systems or fuel-water emulsions (FWE) reduce NOx formation in marine diesel engines by mixing water into the fuel oil.
Up to 55%
Humid Air Motors (HAM)
The HAM system uses combustion air almost entirely saturated with water vapour (humid air) in a marine diesel engine.
Up to 70%
Other intake air humidification methods
Adding water to the charge air is a relatively simple method of reducing NOx and particulate emissions without engine modifications. A fine freshwater mist is injected directly into the hot compressed air of the turbocharger outlet.
Up to 30-45%
4.2.2 Tier III technologies During the last 3-4 years, all major engine manufacturers have developed and tested engines or announced their intention to do so in order to meet market demand for Tier III compliance. This is the case for the 2-stroke engine manufacturers MAN, Wärtsilä and Mitsubishi (MAN Diesel and Turbo 2011; Wärtsilä 2008a; Mitsubishi 2011) and also manufacturers of 4-stroke engines, in addition to those already mentioned, have published their strategic choices, e.g. Caterpillar and Rolls-Royce (Caterpillar 2010; Rolls-Royce 2011), including SCR and LNG (dual fuel).

36
Table 4-2: Brief NOx reduction technology overview (information primarily from low-speed engines) Technology Short description % NOx
reduction Primary (before or on engine)Exhaust Gas Recirculation (EGR)
EGR technology uses engine exhaust gases that have been cooled after the turbocharger. This reduces the combustion temperature and increases the mass flow rate and pressure to reduce NOx formation.
80%*
Secondary (after engine) Selective Catalyst Reduction (SCR)
SCR is the only technology that controls NOx emissions in the exhaust gas after they have been generated. SCR reduces NOx emissions by reacting NOx with ammonia (from a urea solution) over a catalyst in the hot exhaust gases of marine engines.
Up to 95%
Other Liquefied Natural Gas (LNG)
Complete substitution of conventional fuel with LNG is considered a feasible solution for meeting air emission targets. The engines are available for both 4-stroke dual fuel and exclusive gas operation.
80-90%
* With HFO currently only for 2-stroke engines The technological developments may not be completed and feasible on-board technical solutions may not have been tested fully, but the abovementioned methods SCR and EGR and the alternative fuel choice LNG stand out as the ones preferred publicly by the world’s major engine manufacturers (please see Appendix B for details). Due to the long track record of SCR in land applications, a number of independent providers already offer the technology for marine applications, whereas the EGR and LNG solutions are offered mainly through the engine manufacturers. With the combination of some of the Tier III technologies with Tier II technologies, e.g. EGR with WIF,4 it is possible to further reduce NOx emissions, which may be relevant in waters with additional regulatory constraints on nitrogen emissions. This may be associated with a further increase in specific fuel oil consumption (SFOC). No matches between two Tier II methods in combination appear to allow meeting Tier III levels.
4.2.3 Selective Catalytic Reduction (SCR) SCR is a proven technology, and the solutions developed for marine applications show that NOx emissions can be reduced significantly and beyond Tier III. In SCR the exhaust from the engine is led through a catalyst, which reduces nitrogen oxides to nitrogen and water by using ammonia as the reducing agent. Since usage of ammonia itself entails safety hazards, urea is usually chosen as the base chemical. SCR is the only technology that controls NOx emissions in the exhaust gas after they have been generated. According to the International Association for the Catalytic Control of Ship Emissions to Air (IACCSEA), more than 500 SCR systems have been installed on marine vessels (IACCSEA 2011b). SCR is a mature technology for 4-stroke engines, whereas SCR for 2-stroke engines (pre-turbo) is still at a pilot testing stage. It is anticipated by the industry that this engine subset will be served with commercially available SCR solutions by 2014 (IACCSEA 2011b).
4 MAN Diesel and Turbo (2010) have showed a reduction to 2.0 g NOx/kWh at 2.5% specific fuel oil consumption (SFOC) by combining 28% WIF and 37% EGR.

37
4.2.4 Exhaust Gas Recirculation (EGR) EGR is a proven technology for diesel engines in land-based applications. The technology is based on redirecting a part of the exhaust gas back into the combustion chamber and lowering the combustion temperature. Currently, MAN has tested and also installed an EGR system on a low-speed 2-stroke engine on board the Maersk Line container ship MV Alexander Maersk. EGR reduces peak combustion temperature and hence NOx formation when a non-combustible gas is added to the combustion process. The exhaust gas is typically routed from the exhaust system via a scrubber to neutralise the effect of sulphur in the fuel and finally mixed with the incoming combustion air. The recycled exhaust gas has lower oxygen content and also absorbs some of the heat energy during combustion, both of which reduce the peak temperatures (US EPA 2009). As part of the oxygen in the scavenge air is replaced by CO2 from the combustion, the peak temperature of the combustion is reduced and the amount of NOx generated is reduced. There is a minor increase in fuel consumption associated with the technology. It appears from a review of current data and interviews that EGR should now be counted as Tier III compliant.5
4.2.5 Liquefied natural gas engines (LNG) The LNG technology is used particularly on ferries and offshore supply vessels and the associated infrastructure is slowly maturing. The major costs incurred directly by the ship owner are from the purchase and installation of the engine (assumed dual fuel), LNG storage tanks and necessary special piping. Dual-fuel engines run on gas with 1% diesel (gas mode) or alternatively on diesel (diesel mode). Dual-fuel 4-stroke engines running in gas mode comply with the Tier III rules without any additional technology being required (Wärtsilä 2008b). For 2-stroke engines, the efficiency of dual-fuel engines is improving, and recently Wärtsilä reported Tier III compliance for their 2-stroke dual fuel test engine in gas mode although not without modification for a wider range of conditions (Wärtsilä 2011b). Although many new LNG-fuelled engines are automatically Tier III compliant the dual-fuel (high-pressure engines) aimed at the larger 2-stroke vessels will need additional abatement technology (EGR or SCR). Although an estimate is very uncertain they are expected to take a global market share of 5-10% of the number of LNG engine installations, most of them on LNG carriers and other large vessels on high seas trade. LNG applications are mainly found in the short sea shipping and have yet to find widespread application in the oceangoing merchant fleet. The latter is reportedly considered by major shipowners for fixed trades but it is not expected to exert a substantial impact on the North Sea fleet during the project period (up to 2030).
4.3 Costs of installing and operating Tier III systems EGR systems need to be installed during the building of the engine and cannot be retrofitted. Newly built engines can, however, be prepared for an EGR system for retrofit. EGR in general entail a penalty on the fuel consumption and a cost to an internal scrubber. It has been stated by MAN that the negative effect on the specific fuel oil consumption (SFOC) is much
5 As published by a major engine manufacturer (MAN Diesel and Turbo).

38
less (nearly zero) for the 2-stroke than for the 4-stroke engine (MAN Diesel and Turbo 2010). There is an inherent conflict between lowering the combustion temperature to reduce NOx formation and maintaining efficient combustion, which mostly results in a higher combustion temperature (‘the diesel dilemma’). An additional CO2 emission is therefore often seen with NOx abatement technology and the associated rise in fuel consumption is an important part of the market’s assessments of the technology. Table 4-3: Technology costs summary.* It is emphasised that the EGR data for 4-stroke engines are preliminary and subject to change.
EGR (2s) <130 rpm
SCR (2s) <130 rpm
SCR (4s) Medium
rpm range
EGR (4s) 400-1,600 rpm
Capital expenditure;
€/kW 37-45 28-56 25-62 46-55
Equipment 32-39 18-46 20-50 36-45
Installation 5-6 6-10 5-12.5 10
Operational expenditure;
€/MWh 2-3 4.3-10 2.7-7.2
5%-8% of fuel costs
SFOC; g/kWh 0.6 0 1-2 See
Operational expenditure
Capital expenditure based on installed effect;
Y=
-0.20x + 47.0 -0.71x + 59.5 0.03x2 -
1.82x + 57.1 -0.53x + 57.6
* Cost estimates for LNG are not included, as the driving force for installation of LNG is assumed to be 2015/2020 MARPOL Appendix VI sulphur requirements.
4.3.1 Challenges to Tier III technologies The available information and interviews with engine manufacturers point to three technologies that comply with Tier III: SCR, EGR and engines driven by LNG. In general, all major engine manufacturers are working on marketing more than technology to enable the ship owners to select the most cost-effective technology for their ships, depending on market prices of fuel and chemicals. The major engine manufacturers claim to have market-ready technologies or that their development systems will be ready for Tier III in 2016. Some of the technical challenges still to be met are listed here:
Compatibility with sulphur requirements Both SCR and EGR will require changes to the standard design to accommodate high-sulphur fuel (HFO currently 2.7% on average). For SCR, the 2-stroke engine technology is the least mature, while for EGR, the 4-stroke technology is under development.
Compatibility with distillate fuels Shifting to distillate fuels has an impact on the viscosity of the fuel oil, which in turn has a significant influence on the oil film thickness, promoting scuffing behaviour between the plunger and the barrel. Also, low-sulphur fuels tend to have shorter hydrocarbon chains,

39
providing lower lubricity.
One abatement system for main and auxiliary engines On a general basis, it is expected that each auxiliary engine will require abatement technology, and presently the SCR reactors appear to be the most relevant choice. It is possible to design and produce SCR systems that can be class approved for the combined exhaust from main engine and auxiliary engines, but it is not expected to be common practice.
Bunker facilities for LNG Large obstacles for operating on LNG are the fuel logistics and availability of refuelling stations. There are, however, no technical obstructions for a wider implementation of gas as a fuel for propulsion.
Dual-fuel engines Dual-fuel compliance with Tier III criteria is available for 4-stroke engines. For 2-stroke dual-fuel engines, compliance with Tier III has been reported recently.
Other issues Currently, no major manufacturer of abatement technology for diesel engines targets the >2,000 rpm market. SCR and LNG should be feasible technologies for this segment, depending on the actual engine effect and expected operation pattern. Operation modes A Tier III engine will operate in Tier II mode outside NECAs and in Tier III mode inside. The manufacturers anticipate delivering their abatement systems with different pre-settings for maximum reduction, e.g. for operating in Norwegian waters or elsewhere with restrictive regulation, for Tier III compliance, and for Tier II compliance. This requires application of additional engine components and auxiliary systems. A direct comparison of Tier II to Tier III compliance cost for both SCR and EGR estimates the extra cost of a Tier III engine to be an additional 45 €per kW of installed engine power (MAN Diesel and Turbo 2011b). A brief summary of technologies and their approximate NOx reduction potential is given in Table 4-2.

40
5 Cost-effectiveness
5.1 Introduction In this section, the costs of meeting the Tier III standard are assessed for each relevant technology choice. LNG technology is not considered since the future market penetration of LNG is driven by SECA requirements and unaffected by the establishment of a NECA. The result is presented as a ranking of the technological options for each ship type, size class and engine type by ‘annual cost’. The annual cost is calculated from the change in capital expenditure (CAPEX), operating expenditure (OPEX) and specific fuel oil consumption (SFOC). The ship’s operating life expectancy is taken into consideration when the CAPEX is estimated. Throughout the section, a benchmark approach is followed. For each ship type and size class, the most cost-effective technology choice is identified. The technologies SCR and EGR complying with the NECA standards are presented in section 4 and thoroughly described in Appendix B: Abatement technology review.
5.2 Approach The annual cost per ship has been estimated on the basis of the technology review and the shipping patterns in the North Sea (see Appendix B for details). The cost formulas presented in Table 4-3 are applied to the engine sizes of the ships. Note that an upper and lower bound are applied to avoid extrapolation. This is particularly important for SCR technology applied to ships with 4-stroke main engines since the cost function is of second degree. The CAPEX is treated as an annuity in order to handle the issue of residual value in 2030. The central estimate for OPEX is a simple average of the upper and lower bounds presented in Table 4-3. The cost is based on year 2016 alone. It is only the SFOC that is not constant over time, due to the fuel price fluctuating over time and because fuel consumption is expected to be lowered over time. The last effect will diminish the role of SFOC and hence fuel over time as the fuel consumption is lowered. The first effect, however, enhances the role of fuel, since fuel prices are expected to increase over time. A sensitivity analysis is conducted to analyse the role of fuel prices. In order to ensure consistency between the economic and the environmental impact assessments, the assumptions on total fuel oil consumption have been aligned; see the environmental impact assessment report for details.
5.3 Key assumptions and input parameters For ships not sailing in other NECAs, the appointment of the North Sea as a NECA will impose both extra technology investments and operating costs.

41
For ships sailing in other NECAs, the appointment of the North Sea as a NECA will impose only extra operating costs, as these ships will have a technology installed which complies with the Tier III standards. To convert the CAPEX to an annuity, a real discount rate of 4% as recommended by the European Commission6 is used. Since private companies normally have higher requirements for the rate of return, a sensitivity test is conducted using a real discount rate of 8%. In the North Sea, a sulphur emission reduction requirement is already in place and will be made stricter in 2015 (SECA). The operators’ choices of means to reduce sulphur and comply with the SECA standards will affect the type of technological options available for compliance with NECA Tier III requirements. Ship operators have three ways of complying with the SECA requirements. One option is to use low-sulphur 0.1% fuel, another is to use LNG, and a third is to install a scrubber and use heavy fuel oil. In the analysis, low sulphur is priced as marine gas oil (MGO) and heavy fuel as IFO380. Since the future market penetration of LNG is driven by the SECA requirements and not affected by the establishment of a NECA, the LNG technology is not considered in the cost effectiveness analysis.. The market penetrations of the low-sulphur and of the scrubber and heavy fuel solution are highly uncertain, and we have found no industry experts capable of providing robust estimates. The analysis is therefore based on an assumption of an equal 50%-50% use of the two fuel options for non-LNG ships. It is assumed that the composition is constant over time and that it is the same for all ship types and size classes. Two sensitivity analyses are conducted on the two extreme compositions of the two options: 0%-100% and 100%-0%, respectively. In addition, a sensitivity analysis is conducted on a scenario where the price of low-sulphur fuel increases relatively. This reflects a situation where increased demand for low-sulphur fuel induces a price rise for this particular fuel type. The cost assessment of the change in SFOC is made on the basis of the fuel price developments reflected in Figure 5-1 and the change in fuel consumption over time. The forecasting of fuel prices is based on the predicted crude oil prices from 2009 to 2030 by the Danish Energy Agency.
6 European Commission (2009)

42
0
200
400
600
800
1,000
1,200
2011
2012
2013
2014
2015
2016
2017
2018
2019
2020
2021
2022
2023
2024
2025
2026
2027
2028
2029
2030
MGO IFO380
Figure 5-1: Fuel price forecast, central case, { per metric ton In Figure 5-1, the expected increases in fuel prices are displayed. For both fuel types, the fuel price in 2030 is expected to be 20% higher than the 2016 price. This will enhance the importance of fuel costs in the cost-effective technology decision of the ship operators. The effect is countered by the falling fuel consumption of ships over time. During the period of 2009-2030, fuel consumption is expected to fall 10%. The net effect on the fuel costs, however, is that in 2030, the SFOC is expected to be 7% higher than the 2016 level, which is the basis for the cost-effectiveness analysis. The falling fuel consumption is analysed in a sensitivity analysis. Given the uncertainty of the cost estimates of the technologies, basing the analysis on year 2016 alone is considered a robust approach. From the assessment of total costs in section 7.3, it is evident that changing the assumptions on fuel only very vaguely influences the result of the economic analysis. The assumptions on fuel are therefore less important. It is assumed that the abatement technology is chosen independently for main and auxiliary engines. It is recognised that in certain cases all engines can be coupled to one system only, but the number of cases will be small and not significant for the overall analysis. The simplification will cause an overestimation of the installation costs and thereby an overestimation of the total cost of establishing a NECA.
5.4 Cost composition The most cost-efficient technology is identified based on the annual cost. The relative composition of the cost components is presented in Figure 5-2.

43
72%
57% 56% 59%
20%
38% 33%
8% 7% 9%
43%
EGR 2s EGR 4s SCR 2s SCR 4s
OPEX+SFOC
SFOC
OPEX
CAPEX
Figure 5-2: Annual cost composition per main engine in 2016, 2- and 4-stroke, %. Note: The annual cost is calculated as a simple average of the annual cost for all ship types and size classes. The absolute level is meaningless, but the relative size of the components identifies the dominant cost components. The EGR cost estimates are very uncertain. The cost composition is very similar for 2- and 4-stroke engines for SCR technology. SFOC is slightly higher for 4-stroke and OPEX slightly lower. The sum of the two is basically the same, which the level of CAPEX also shows. In relation to the EGR cost estimates, it is emphasised that the estimates are associated with great uncertainty. For EGR technology, the picture is mixed. For 2-stroke, CAPEX is very dominant. The SFOC constitutes 8%, as was the case for SCR technology. OPEX, however, is relatively lower for EGR 2-stroke than was the case for SCR. For 4-stroke, no distinction on SFOC and OPEX is possible and they are treated as one. Together they account for around 43% of the annual costs and CAPEX around 57%. It is evident that CAPEX is the main cost component for both EGR and SCR technology. For SCR, it makes up around 56%-59% of the total annual cost, whereas for EGR, it makes up 57% of the total cost for 4-stroke and 72% for 2-stroke. The minor role of SFOC indicates that the analysis is not very sensitive towards changes in fuel prices and towards the assumptions made on fuel consumption. This will be elaborated in a series of sensitivity analyses. The cost compositions for auxiliary engines are shown in Figure 5-3. Note that only SCR technology and 4-stroke auxiliary engines are considered.

44
67%
26%
7%
SCR 4s
SFOC
OPEX
CAPEX
Figure 5-3: Annual cost composition for 4-stroke auxiliary engines using SCR technology in 2016, % Note: The annual cost is calculated as a simple average of the annual cost for all ship types and size classes. The absolute level is meaningless, but the relative size of the components identifies the dominant cost components. CAPEX accounts for 67% of the total expenses, OPEX a fourth and SFOC only 7%.
5.5 Cost-effective technology choice The aim of the cost-effectiveness analysis is to map the cheapest technological option complying with Tier III standards for each ship type and size class. The ranking is based on the annual total cost. To conduct the mapping, the cheapest technological option for both main engine and auxiliary engine must be identified. It is not required that the same technology be applied to main and auxiliary engines. The cheapest technologies for 2-stroke main engine and 4-stroke main engine are identified. Of the 17,372 ships in the pool, two-thirds have 4-stroke main engines and one-third have 2-stroke main engines. Regarding fuel consumption, the proportion is opposite. From the environmental assessment, it is evident that ships with 2-stroke main engines account for two-thirds of the fuel consumption. It is thus ships with 2-stroke main engine which represent the largest emission reduction potential. The composition of the fleet on 2- and 4-stroke main engine vessels is expected not to be influenced by the establishment of a NECA, but may change over time for other reasons.
5.5.1 2-stroke main engines For ships with 2-stroke main engines, EGR technology is the most cost-efficient choice for all ship types and size classes. EGR is cheaper both when looking at CAPEX isolated and when comparing the total of OPEX and SFOC. A cost comparison of SCR and EGR technologies is made in Figure 5-4.

45
100%92%
68%
41%
Total cost Maximum Average Minimum
SCR EGR
Figure 5-4: Cost of EGR relative to SCR, SCR cost = 100%, 2-stroke main engines On average, EGR costs are only 68% of the SCR costs. The cost of EGR is between 41% and 92% of the cost of SCR. At all times, the cost difference is evident.
5.5.2 4-stroke main engines For 4-stroke main engines, SCR is the preferred technology for all ship types and size classes. The cost difference is quite notable. A cost comparison of SCR and EGR technologies is made in Figure 5-5.
100% 95%83%
63%
Total cost Maximum Average Minimum
EGR SCR
Figure 5-5: Cost of SCR relative to EGR, EGR cost = 100%, 4-stroke main engines For all size classes, SCR costs are on average 83% of the EGR costs, and never exceed 95% of the EGR cost. SCR is generally somewhat cheaper on CAPEX, but OPEX is the dominant cost component, making SCR the superior technology.
5.5.3 4-stroke auxiliary engines Only 4-stroke auxiliary engines are considered. EGR technology is currently not developed for 4-stroke auxiliary engines. It might be in the future, but at this stage the technology is not available and therefore not an option for the ship owners. Therefore all 4-stroke auxiliary engines are equipped with SCR technology in the analysis.
5.5.4 Technology choices The most cost-efficient applications of the technologies:
All 2-stroke main engines are equipped with EGR. All 4-stroke main engines are equipped with SCR. All 4-stroke auxiliary engines are equipped with SCR regardless of the
technology applied to the main engine.
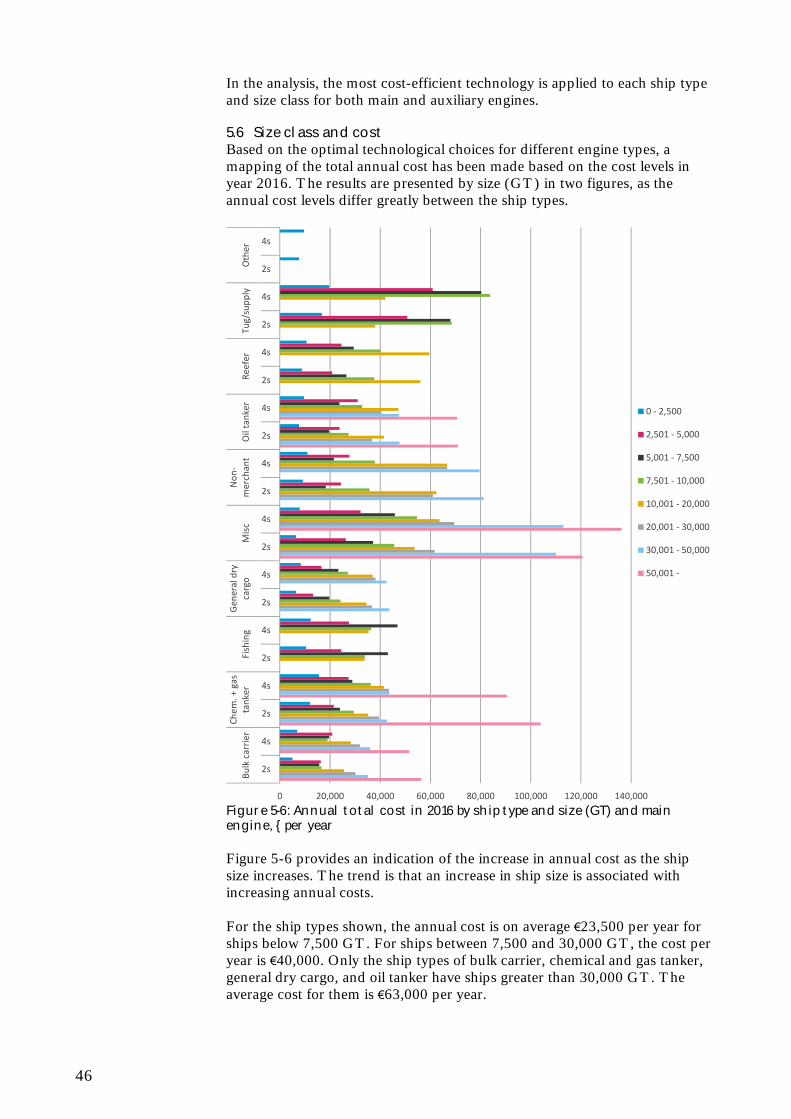
46
In the analysis, the most cost-efficient technology is applied to each ship type and size class for both main and auxiliary engines.
5.6 Size class and cost Based on the optimal technological choices for different engine types, a mapping of the total annual cost has been made based on the cost levels in year 2016. The results are presented by size (GT) in two figures, as the annual cost levels differ greatly between the ship types.
0 20,000 40,000 60,000 80,000 100,000 120,000 140,000
2s
4s
2s
4s
2s
4s
2s
4s
2s
4s
2s
4s
2s
4s
2s
4s
2s
4s
2s
4sBulk carrier
Chem. +
gas
tanker
Fishing
Gen
eral dry
cargo
Misc
Non‐
merchant
Oil tanker
Reefer
Tug/supply
Other
0 ‐ 2,500
2,501 ‐ 5,000
5,001 ‐ 7,500
7,501 ‐ 10,000
10,001 ‐ 20,000
20,001 ‐ 30,000
30,001 ‐ 50,000
50,001 ‐
Figure 5-6: Annual total cost in 2016 by ship type and size (GT) and main engine, { per year Figure 5-6 provides an indication of the increase in annual cost as the ship size increases. The trend is that an increase in ship size is associated with increasing annual costs. For the ship types shown, the annual cost is on average €23,500 per year for ships below 7,500 GT. For ships between 7,500 and 30,000 GT, the cost per year is €40,000. Only the ship types of bulk carrier, chemical and gas tanker, general dry cargo, and oil tanker have ships greater than 30,000 GT. The average cost for them is €63,000 per year.

47
The cost levels for the ship types of container, passenger and roro cargo/vehicle are higher than for the other types. These are shown in a separate figure. Note the different unit on the vertical axis.
0 50,000 100,000 150,000 200,000 250,000 300,000 350,000 400,000
2s
4s
2s
4s
2s
4s
Container ship
Passenger
Roro
Cargo
/vehicle
0 ‐ 2,500
2,501 ‐ 5,000
5,001 ‐ 7,500
7,501 ‐ 10,000
10,001 ‐ 20,000
20,001 ‐ 30,000
30,001 ‐ 50,000
50,001 ‐
Figure 5-7: Annual total cost in 2016 by ship type and size (GT) and main engine, { per year There are two explanations for high annual costs. Firstly, ships with larger engines have higher CAPEX. Secondly, ships operating inside the NECA area a lot will have higher operating costs. For 2-stroke container ships, the largest ships (GT >50,000) face an annual cost of €200,000, the smaller ones between €55,000 and €120,000. The 4-stroke ships dominate the passenger ships. For ships above 30,000 GT, the cost is around €340,000-€415,000 per year. For passenger ships of 2,500-20,000 GT, the cost is €75,000-€120,000. For roro cargo/vehicle ships, the average annual cost for both 2-stroke and 4-stroke ships is around €65,000.
5.7 Examples To illustrate the cost levels and the cost composition, four examples have been selected. All ships are equipped with the cost-optimal technology for main engines. Figure 5-8 presents the annual cost for the four chosen ship types.

48
29
35
24
27
151
207
36
47
0
25
50
75
100
125
150
175
200
225
2s 4s 2s 4s 2s 4s 2s 4s
ME = EGR ME = SCR ME = EGR ME = SCR ME = EGR ME = SCR ME = EGR ME = SCR
GT = 7,501 ‐ 10,000 GT = 7,501 ‐ 10,000 GT = 20,001 ‐ 30,000 GT = 7,501 ‐ 10,000
Size class 4 Size class 4 Size class 6 Size class 4
Chem. + gas tanker General dry cargo Passenger Roro cargo/vehicle
SFOC
OPEX
CAPEX
Figure 5-8: Annual cost composition in 2016 for four selected examples, {1,000 per year Note: All auxiliary engines are 4 strokes - hence the stroke indication in the figure applies to the main engines. The label ME refers to the main engine. The label is followed by the applied technology. The cost levels should not be compared across ship types, as the ships have very different characteristics. The figure does, however, give an indication of the general cost level and composition the ship operators will be facing if a NECA is established in the North Sea. The numbers represent the extra annual cost for the ship operators if a NECA is established in the North Sea. The magnitude of the annual cost imposed on ship operators should be seen in the light of the total annual cost for ship operators. In section 8 the indirect economic effects will be analysed. A general dry cargo ship of a size between 7,501 GT and 10,000 GT is expected to incur an annual cost of around €24,000-€27,000 depending on the main engine type. The major cost components are OPEX and CAPEX. SFOC is 7% for chemical and gas tankers, 3% for general dry cargo, and around 10% for passenger and roro cargo/vehicle. The cost for passenger ships strikes out as high compared to the opthers. The explanation is that they are large ships equipped with larges engines and importantly they operate a lot inside the NECA. The comparison of the NECA compliance cost relative to the total costs for ship operators are dealt with in section 8.

49
6 Total direct costs
In section 5, the most cost-efficient technologies for different ship and engine types were identified. In this section, the total direct cost of applying the cost-efficient technologies to the projected fleet of the North Sea is estimated.
6.1 Approach The total direct costs are estimated as all the additional costs imposed on ships. Costs include CAPEX, OPEX and SFOC. It is the additional costs that are at issue, meaning it is the costs associated with the establishment of the North Sea NECA which would not have been defrayed had a NECA not been established. CAPEX is a one-time initial cost for each ship that installs additional technology. The total CAPEX cost, however, is linked to the number of new ships built. Due to the issue of residual value in 2030, the one-time cost is converted to an annual cost using an annuity approach. Ships operating in other NECAs will have NECA-compliant technology installed and will therefore not be facing a CAPEX expenditure. OPEX and SFOC are both operating costs and are treated as annual costs. They are therefore associated with the size of the fleet of NECA-complying ships.
6.2 Estimation of total direct cost From the projection of the fleet presented in section 3 and the cost parameters of applying and using the technologies presented in section 5, the total direct cost has been estimated. In Figure 6-1, the total direct cost is shown by year.
14 29 45 61 78 97 116 136 157 179 200 221 242 262 282
2016 2017 2018 2019 2020 2021 2022 2023 2024 2025 2026 2027 2028 2029 2030
SFOC
OPEX
CAPEX
Figure 6-1: Total direct cost by cost type, 2016–2030, { million The total cost of establishing a NECA is estimated to be €282 million in 2030. The continuous replacement of old ships with new and the overall growth in shipping activity throughout the period will roughly result in a constant

50
absolute growth in the number of NECA-complying ships. On average, the costs rise €19 million per year. The relative composition of the cost components is almost constant over time. As both CAPEX and OPEX are constant per ship over time, a constant absolute growth in CAPEX and OPEX will therefore also be found over time. Due to changing fuel prices and continuous efficiency improvements in fuel consumption, SFOC varies over time. From the figure, it is evident that the magnitude of SFOC compared to the other two cost components is roughly unchanged over time. SFOC constitutes between 12% and 14% of the total costs throughout the period. CAPEX is very constant around 58%-59%, and OPEX is between 27% and 30%. The changing fuel price over time is therefore not central to the analysis, especially since SFOC is a minor cost component. The costs in year 2030 were analysed to display the cost composition between main and auxiliary cost components. The costs related to main engines account for 78% of the total cost and auxiliary engines 22%. Of the total CAPEX, the main engines account for 80%, which reflects the larger size of main engines. OPEX and SFOC for main engines account for 74% and 78%, respectively, of the total OPEX and SFOC costs.

51
7 Cost-benefit analysis
7.1 Approach The focus of the cost-effectiveness analysis in section 5 was on one ship and the optimal technology choice for a given ship profile. In the cost-benefit analysis, the focus is on the total cost to the North Sea fleet of establishing a NECA and on the benefits achieved compared to a situation without a NECA. The cost-benefit analysis has been made based on the costs and benefits in year 2030. The assessment of the costs as an annual cost implies that a one-year time horizon is sufficient to conduct a socio-economic analysis. Note that the annual cost is of course dependent on the NECA compatibility of the North Sea fleet profile in the relevant year. The benefit side is of course also assessed based on an annual time frame. On the benefit side, the positive health effect caused by the reduction in emissions is estimated. The health benefit is independent of the technological choice, as the reductions in emissions are the same for all the technological choices. For more information on the benefits see the environmental impact assessment. Costs to manufacturers and authorities on certificates and port control are described but do not enter into the formal cost-benefit analysis, as the costs are expected to be very limited.
7.2 Scenarios The economic impact assessment is based on a comparison of two scenarios:
Baseline scenario: The current legislation (for NOx, sulphur content in fuels, and NECAs in the Baltic Sea and in US ECA waters).
Main project scenario : The baseline scenario plus the North Sea assigned as a NECA.
In the main project scenario both the Baltic NECA and the US ECA are assumed to be active. In a range of sensitivity analyses the role of other ECAs are examined.
7.3 Costs to stakeholders All equipment on board ships is certified according to IMO regulations and renewed at certain intervals – typically every five years. The certificates under MARPOL Appendix VI are issued and inspected by a country’s maritime authority or a class society on its behalf (a ‘responsible organisation’).
7.3.1 Type approval certificates Type approval certificates are issued to the engine and/or abatement technology producers on the technology’s MARPOL VI compliance. This type of certificate may cost €15,000 and up per technology, depending on the technical complexity, but the added cost of going from Tier II to Tier III is difficult to assess. For related technologies, there is a reduced cost for each configuration. It is assumed that the NOx abatement technology on engines is certified by the manufacturer to the relevant level, Tier I, II or III.

52
There will be a minor cost for renewal every five years. The cost of type approval is included as a part of the equipment cost. The installation of a particular (certified) technology must also be verified on the ship and by checking the type approval certificates. Such inspections’ costs are included in the price of the ship from the yard. Relevant certificates are routinely controlled during five-year surveys and are renewed every five years. The cost is similar to Tier II and not considered an added cost for Tier III.
7.3.2 Port state control and flag state control Port state control of ships under foreign flags in NECA areas and flag state control of vessels’ certificates will inspect the International Air Pollution Prevention (IAPP) Certificate (MEPC 176(58)). There is no additional work associated with the inspection of a ship in a NECA, since the existing certificate is already prepared for Tier III compliance. Table 7-1: Activities of stakeholders related to surveys and certifications
Manufacturer Yard/Owner Authorities/ClassActivity One certification
per configuration per five years
Initial installation inspection and one
inspection of renewed certificate per ship per
five years
One inspection per port state control
event
Cost for abatement technology (EGR/SCR/ LNG)
Included in equipment cost
Included in five-year surveys (no extra cost
for Tier III)
No new certificates for Tier III
The LNG engines are certified like any other engine, and no additional survey or certification activity relative to Tier III is necessary.
7.4 Total costs The total costs of establishing a North Sea NECA were assessed in section 6. The costs are assessed as the change in costs as a result of the establishment of a North Sea NECA. Only the costs that are due to the establishment of a NECA which would not have been defrayed had a NECA not been established are included. The total cost is presented in Figure 6-1. It is evident that as the size of the NECA-compliant fleet increases over time, the annual total cost increases correspondingly. It is the total cost of €282 million in 2030 which is the basis of the cost side in the cost-benefit analysis.
7.5 Environmental impact assessment In the report by PBL, a comprehensive description of the environmental impacts can be found. The following section is a brief summary of the major effects. A reduction of the emission levels will have impact on
Air quality and deposition Health

53
Terrestrial ecosystem Marine ecosystem
Using an air quality model, the air concentration and deposition fields for major acidifying and eutrophying pollutants, ozone, and particulate matter are calculated. The health benefits are assessed based on the change in air quality, taking population density and demography into consideration and using exposure-response relationships. Health impacts are assessed using ‘years of life lost’ and a number of other health impacts due to emissions (ozone and PM2.5). Restricted-activity days, chronic bronchitis and lower respiratory distress are examples of some of the effects assessed. Impacts on the terrestrial system are not assessed monetarily. A qualitative assessment is made based on the amount of exposure in excess of an ecosystem’s ability to buffer the input. In addition, risks of changes in the biodiversity are assessed using dose-response curves. A qualitative assessment is made of the eutrophication and accelerated growth of algae resulting in a range of undesirable disturbances in the marine ecosystem. Among the disturbances are shifts in composition of flora and fauna, which have multiple impacts on habitats and biodiversity and can cause death to fish as well as other species.
7.5.1 Health benefits The health benefits from an improved environmental situation are monetised based on
Costs of medication and medical care Lost productivity Cost of pain, suffering, aversion to the risk of ill health or premature
death
The first element is quantified using costs, and the second using business data. The third element is quantified using willingness-to-pay studies. In Table 7-2 the key unit prices used in the assessment are shown. Table 7-2: Key unit prices, { per case, day, etc Parameter Cost. Mortality (life years lost, VOLY valuation: low, mid, high)
47,120 / 67,150 / 156,670
Mortality (deaths, VSL valuation: low and high) 1,280,490 / 2,613,980Infant mortality (1 – 12 months: low and high) 1,920,700 / 3,920,970New incidence of chronic bronchitis 245,024 Respiratory and cardiac hospital admissions 2,615 Restricted activity days, working age population, per day
108
Respiratory medication use, per day 1Days of minor restricted activity 49Lower respiratory symptoms, per day 49Source: The environmental impact assessment by PBL

54
For more information on the values used in the assessment of benefits see the environmental impact assessment report. Lower mortality is the dominant element among the monetised benefits. The total for monetised health benefits in 2030 if a NECA is established in the North Sea are shown in Figure 7-1.
443564
1,112 1,033
1,928
Low Mid High Low High
VOLY VSL
Figure 7-1: Benefits in 2030, million { Source: The environmental impact assessment by PBL. Table 4.5. Note: The data presented is adjusted by PBL to adjust for differecnes in fleet projection. The total benefits are in the environmental impact report assessed at between €443 million and €1,928 million in year 2030. The uncertainty is not linked to the estimated NOx abatement but to the monetisation of it. Two different methods for the valuation of health impacts are used, resulting in different estimates. PBL uses the methods VOLY (Value of a Life Year) and VSL (Value of Statistical Life) in the assessment. The results of both methods are shown in the figure.
7.6 Cost-benefit assessment The total direct costs in 2030 presented in section 6 and briefly summarised in section 7.4 and the 2030 benefits in terms of positive health effects presented in section 7.5 form the basis for the cost-benefit assessment of a North Sea NECA. In Figure 7-2, the results of the cost-benefit analysis in year 2030 are presented. On the benefit side, the range of estimates is shown; see Figure 7-1. On the cost side only the main project scenario cost estimate for 2030 is shown; see Figure 6-1. For each of the five benefit assessments, the ‘net benefit’ is calculated as the benefit estimate minus the main project scenario cost estimate. It is important to remember that the indirect economic effects are not included in the cost-benefit assessment; see section 8. Furthermore on the benefit side a range of benefits are not monetized and therefore do also not enter in the cost-benefit assessment; see section 7.5 and the environmental impact assessment.

55
161
443
‐282
282
564
830
1,112
751
1,033
1,646
1,928
‐400
0
400
800
1,200
1,600
2,000
Net benefits Benefit estimates Main project scenario costestimate
Figure 7-2: Costs and benefits in 2030, million { Note: The ‘net benefits’ equal ‘benefit estimates’ minus ‘main project scenario cost estimate’. The costs presented in the figure originate from the costs for the ship operators to comply with the NECA standards. The benefits originate from the improved health for all the people benefiting from a reduction in the NOx emission in the North Sea region. The socio-economic criterion of the recommendation is that the benefits exceed the cost, corresponding to a net benefit greater than zero. From Figure 7-2, it is evident that this is the case for all five benefit estimates. The cost-benefit analysis shows that the cost of €282 million will imply associated benefits to society of €443 million to €1,928 million and the total net benefits to society will equal between €161 million and €1,646 million. Note that this is based on the costs and benefits of year 2030 alone. However, the assessment method ensures that the result is not subject to the selected time period. Any chosen time period will produce the same result of benefits exceeding costs. Another way of assessing the socio-economic value of establishing a NECA is the benefit-cost ratio. The ratio shows how large a monetary gain is achieved for each euro of cost. A ratio larger than 1 corresponds to the benefits outweighing the costs. The benefit-cost ratio is shown in figure Figure 7-3.

56
1.62.0
3.9 3.7
6.8
Low Mid High Low High
VOLY VSL
Figure 7-3: Benefit-cost ratio in 2030 Note: The ‘benefit-cost ratio’ equals ‘benefit’ divided by ‘cost’. The benefit-cost ratios are based on the relative magnitude of the benefits presented in Figure 7-1 and the main project scenario cost estimate of year 2030 presented in Figure 6-1. From Figure 7-3 it is evident that the benefit-cost ratio is between 1.6 and 6.8, which means that the benefits are between 1.6 and 6.8 times as large as the costs. The cost-effectiveness of establishing a North Sea NECA can be assessed as the total cost per ton of abatement in 2030. Establishing a NECA is estimated to imply an abatement cost of €1,878 per ton.
7.7 Comparison to other studies A range of reports exist on the abatement cost of establishing a NECA. It is not a straightforward process to compare the studies, as local conditions and assumptions are pivotal for the estimated costs and benefits. In Figure 7-4, the abatement cost per ton of NOx is presented for a range of selected studies. This report stands out from the others as being the only one considering technologies other than SCR.

57
1,382
641
1,984
493
1,878
1,074
470
(SCR) (SCR) (SCR) (SCR) (SCR and EGR)
Centre forMaritime Studies,University of Turku
(2010)
Entec UK Limited(2005)
MarineEnvironment
Protection (2009)
U.S. EnvironmentalProtection Agency
(2009)
North Sea NECA
Figure 7-4: Abatement cost for different studies, { per ton (2012 prices) Note: To compare the estimates, corrections for currency and price level have been made. Lower abatement costs typically reflect that the studies are considering ships characterised by operation mainly within the potential NECA. In the studies finding higher abatement costs, ships typically operate inside and outside the NECA. The latter is the case for the North Sea. Given the geographical layout of the North Sea, a high share of transit shipping is likely, which will imply a high abatement cost.
7.7.1 Centre for Maritime Studies, University of Turku (2010) The report from Centre for Maritime Studies, University of Turku (2010), focuses on the economic impacts of imposing a NECA in the Baltic Sea, which is a situation quite similar to the North Sea situation. The study considers a change from Tier II to Tier III standards. When a NECA is imposed, it is expected that the ships sailing in the Baltic Sea only a few days a year will refrain from operating in the Baltic Sea. To counter this, two scenarios based on two different numbers of ships are used throughout the study. In the first scenario, it is assumed that all new engine power is fitted with SCR. In the second scenario, it is assumed that SCR is installed on the share of engine power that represents 95% of the NOx emissions. Furthermore, the abatement costs in the two scenarios are each calculated with interest rates of 5% and 10%. The abatement cost listed in Figure 7-4 is based on the second scenario, and the bottom of the column represents the cost with the 5% interest rate while the top represents the cost calculated with the 10% interest rate. The estimated abatement cost is lower than found in the analysis of a North Sea NECA. This could be due to differences in the share of the Baltic fleet operating outside of the NECA area compared to the North Sea.

58
7.7.2 Entec UK Limited (2005) The abatement cost from the report made by Entec is among the lowest found in the studies considered. In Figure 7-4, the cost interval €470-€641 per ton reflects the additional costs per ton for NOx abatement of a new-build ship being built with technology that complies with the NECA requirements instead of the SECA requirements. The Entec report was made in 2005, and stronger regulations have come into force since (for example, sulphur content in fuel); therefore, a lower estimate is expected.
7.7.3 Marine Environment Protection (2009) Another one of the studies mentioned in Figure 7-4 is the study made by the Marine Environment Protection (2009). This is a proposal to designate specific portions of the coastal waters of the United States and Canada as an ECA in accordance with MARPOL Annex VI. It should be noted that the abatement cost found in the proposal is based on regulation of nitrogen oxides, sulphur oxides and particulate matter. The cost analysis is based on the use of urea-based SCR and therefore meets the Tier III NOx standards. The abatement cost in this study is a bit higher than our result. It is not possible to compare operational costs between the two reports, but the CAPEX per kW is generally a bit higher than in our study.
7.7.4 U.S. Environmental Protection Agency (2009) The regulatory impact analysis made by the U.S. Environmental Protection Agency in 2009 estimates the costs of the finalized Clean Air Act, which specifies that all U.S.-flagged ships follow Tier II and Tier III emission standards while all foreign-flagged ships follow the global Tier II and Tier III emission regulations. In their calculations, OPEX is included for both U.S.- and foreign-flagged ships, while CAPEX is included only for U.S.-flagged ships. They find a much lower abatement cost than we do, which can partly be explained by the fact that the CAPEX for foreign-flagged ships is not included in the cost assessment.
7.8 Sensitivity tests The robustness of the results is elucidated and the decisive parameters are identified by a series of sensitivity tests. In Table 7-3, the full list of sensitivity analyses is presented. The sensitivity analyses are grouped in four categories:
1. Cost assessment 2. Projection of fleet 3. Indirect economic effects 4. Scenarios.
The sensitivity analyses are based on the classical principle of “all things being equal”. In each test, only a single parameter is changed, all things being equal. In the sensitivity analysis “2. Capex, Low” presented in Table 7-3 the

59
CAPEX is reduced to 75% of the main project scenario estimate all things being equal. In the last category scenarios, the all things being equal method is relaxed. A combination of sensitivity analysis is combined to illustrate a scenario of i.e. high or low cost estimates. The sensitivity results presented here are also presented in Appendix C: Sensitivity tests. The data presented in the appendix is identical to the data in the report. Only the form is different. Table 7-3: Sensitivity analysis overview Sensitivity analysis Description1. Main project scenarioCost assessment 2. CAPEX, Low CAPEX cost is 75% of main project
scenario estimate. 3. CAPEX, High CAPEX cost is 125% of main project
scenario estimate. 4. OPEX, Low See Table 4-3. Lower bound estimate is
used. 5. OPEX, High See Table 4-3. Upper bound estimate is
used. 6. SFOC, Low See Table 4-3. Lower bound estimate is
used. 7. SFOC, High See Table 4-3. Upper bound estimate is
used. 8. Fuel price, Low Low price estimates are used. 9. Fuel price, High High price estimates are used. 10. Fuel price: IFO +25% The price of IFO rises 25%. The price of
MGO is unchanged. 11. Fuel use: MGO = 100% Only MGO fuel is used. 12. Fuel use: IFO380 = 100% Only IFO380 fuel is used. 13. Decrease in fuel use, Low Decrease in fuel consumption over time is
0%. 14. Decrease in fuel use, High Decrease in fuel consumption over time is
20%. 15. No other NECAs No reduction in CAPEX is given to ships
operating in other NECAs. 16. No Baltic NECA No reduction in CAPEX is given to ships
operating in the Baltic NECA. 17. Shared CAPEX with Baltic Half of the CAPEX expenditure defrayed
due to Baltic NECA is calculated as a cost. 18. NECA prevalence 75% The prevalence of NECAs is such that 75%
of the ships in the North Sea are NECA compatible. In main project scenario 49% of the North Sea fleet operate in other NECAs.
19. NECA prevalence 90% The prevalence of NECAs is such that 90% of the ships in the North Sea are NECA compatible. In main project scenario 49% of the North Sea fleet operate in other NECAs.
20. One SCR per ship (auxiliary engine) Only one SCR unit is applied to ships regardless of number of auxiliary engines.
21. Interest rate annuity, High In converting CAPEX to an annuity, an 8% discount rate is used instead of 4%.

60
Sensitivity analysis DescriptionProjection of fleet 22. Shipping activity, Low See section 3.3.2 23. Shipping activity, High See section 3.3.2 24. Speed decrease, Low See section 3.3.3 25. Speed decrease, High See section 3.3.3 26. Efficiency assumptions, Low See section 3.3.4 27. Efficiency assumptions, High See section 3.3.4 28. LNG market penetration, Low See section 3.3.5 29. LNG market penetration, High See section 3.3.5 30. Low fleet scrap age See section 3.3.1 31. High fleet scrap age See section 3.3.1 32. No reduction in North Sea fleet No reduction in the North Sea fleet due to
specialization. All ships currently operating in the North Sea will continue to do so when they are replaced by new ships.
33. Old ships undertake specialized operations
The operations of the ships reduced from the North Sea fleet due to specialization are undertaken by ships built prior to 2016
Indirect economic effects34. No ships built 2016 All ships due for replacement in 2016 are
replaced in 2015. 35. No ships built 2016 and 2017 All ships due for replacement in 2016 and
2017 are replaced in 2015. Scenarios 36. Cost estimates, Low Combines sensitivity analysis 2, 4, 6, 837. Cost estimates, High Combines sensitivity analysis 3, 5, 7, 9
7.9 Sensitivity results The results of the sensitivity analyses are presented using
Total cost in 2030 Net benefit in 2030 Benefit-cost ratio in 2030
For definition of the terms, see section 7.6.
7.9.1 Sensitivity: Total cost in 2030 In Figure 7-5, the total cost in 2030 for the range of sensitivity analyses is shown.

61
391389387
369354352
325323323322321
311311
298297293
284284282280279278276270269267
259253252252
238229
216203
178136127
15. No other NECAs37. Scenario: All cost estimates, High
23. Shipping activity, High26. Efficiency assumptions, Low21. Interest rate annuity, High
16. No Baltic NECA3. CAPEX, High
17. Shared CAPEX with Baltic28. LNG market penetration, Low
25. Speed decrease, High33. Old ships undertake specialized operations
30. Low fleet scrap age5. OPEX, High
11. Fuel use: MGO = 100%9. Fuel price, High
7. SFOC, High13. Decrease in fuel use, Low
10. Fuel price: IFO +25%1. Main project scenario
32. No reduction in North Sea fleet14. Decrease in fuel use, High
20. One SCR per ship (auxiliary engine)12. Fuel use: IFO380 = 100%
6. SFOC, Low8. Fuel price, Low
34. No ships built 201624. Speed decrease, Low
4. OPEX, Low35. No ships built 2016 and 2017
31. High fleet scrap age2. CAPEX, Low
29. LNG market penetration, High27. Efficiency assumptions, High
22. Shipping activity, Low18. NECA prevalence, 75%19. NECA prevalence, 90%
36. Scenario: All cost estimates, Low
Figure 7-5: Sensitivity analyses, total cost 2030, million { From the sensitivity analyses, it is evident that the cost estimate is within the range of €127 million to €391million. The greater the prevalence of NECAs the lower the costs will be since more ships will have the required technology installed. The reduction in total cost is very strong, €104-€146 million. It must be emphasized that the absolute cost reduction is dependent on where the other NECAs are established. However the positive cost synergi of a vast prevalence of NECAs is evident nonetheless. The shipping activity level is among the sensitivity analyses with the greatest impact on the estimated cost in 2030. Note however that higher shipping activity will be associated with higher benefits. If the speed decrease is high, the required fleet size to meet the shipping demand will be higher and the cost therefore greater. Likewise, low efficiency improvement of ships results in a higher total cost. The analyses are based on 2009 data for the North Sea fleet. Due to the global crisis the shipping volume in 2009 are lower than an average year. This has been validated by historical port statistics and an extra sensitivity analysis has been carried out analysing a situation with higher shipping activity. Regarding the cost-benefit analysis this is not critical as higher cost due to more ships will lead to a higher abatement and thereby higher benefits. The numerous sensitivities on fuel prices and consumption all only vaguely influence the estimated total cost in 2030. This underlines that fuel is not pivotal for the cost estimate.

62
7.9.2 Sensitivity: Net benefit in 2030 In Figure 7-6, the net benefits in 2030 for the range of sensitivity analyses are shown. On the benefit side, the upper and lower bounds presented in Figure 7-1 are used. Therefore the net benefit is shown as intervals.
525456748991118120120121122132132145146150159159161163164165167173174176184190191191205214227240265307316
1,5371,5391,5411,5591,5741,5761,6031,6051,6051,6061,6071,6171,6171,6301,6311,6351,6441,6441,6461,6481,6491,6501,6521,6581,6591,6611,6691,6751,6761,6761,6901,6991,7121,7251,7501,7921,801
15. No other NECAs37. Scenario: All cost estimates, High
23. Shipping activity, High26. Efficiency assumptions, Low21. Interest rate annuity, High
16. No Baltic NECA3. CAPEX, High
17. Shared CAPEX with Baltic28. LNG market penetration, Low
25. Speed decrease, High33. Old ships undertake specialized operations
30. Low fleet scrap age5. OPEX, High
11. Fuel use: MGO = 100%9. Fuel price, High
7. SFOC, High13. Decrease in fuel use, Low
10. Fuel price: IFO +25%1. Main project scenario
32. No reduction in North Sea fleet14. Decrease in fuel use, High
20. One SCR per ship (auxiliary engine)12. Fuel use: IFO380 = 100%
6. SFOC, Low8. Fuel price, Low
34. No ships built 201624. Speed decrease, Low
4. OPEX, Low35. No ships built 2016 and 2017
31. High fleet scrap age2. CAPEX, Low
29. LNG market penetration, High27. Efficiency assumptions, High
22. Shipping activity, Low18. NECA prevalence, 75%19. NECA prevalence, 90%
36. Scenario: All cost estimates, Low
Figure 7-6: Sensitivity analyses, net benefit in 2030, million { For all sensitivity analyses, the net benefit is greater than zero. The benefits are greater than the costs for all the sensitivity analyses and very importantly also for the full span of the estimated interval of the benefits. Even when the value of the abatement is monetised at the lowest bound and the cost estimated is the highest, the net benefit is still positive, €52 million in 2030. This indicates that the cost-benefit analysis is robust towards the uncertainty in the parameter values. In addition, on the benefit side a range of benefits were not assessed monetarily, which will further improve the net benefit of establishing a North Sea NECA; see section 7.5. All the sensitivity analyses are made for a fixed abatement level of NOx. Some of the analyses, however, are per definition correlated with the abatement level, and therefore one should not interpret the results rigidly. If, for instance, the shipping activity is higher than the main project scenario estimate, the cost will be higher than the main project scenario estimate, but that will also be the case for the abatement estimate and thereby the estimated benefits.
7.9.3 Sensitivity: Benefit-cost ratio in 2030 In Figure 7-7, the benefit-cost ratios in 2030 for the range of sensitivity analyses are shown.

63
1.11.11.11.21.31.31.41.41.41.41.41.41.41.51.51.51.61.61.61.61.61.61.61.61.61.71.71.81.81.81.91.92.02.22.5
3.33.5
4.95.05.05.25.45.55.96.06.06.06.06.26.26.56.56.66.86.86.86.96.96.97.07.17.27.27.57.67.67.78.18.48.99.5
10.814.2
15.1
15. No other NECAs37. Scenario: All cost estimates, High
23. Shipping activity, High26. Efficiency assumptions, Low21. Interest rate annuity, High
16. No Baltic NECA3. CAPEX, High
17. Shared CAPEX with Baltic28. LNG market penetration, Low
25. Speed decrease, High33. Old ships undertake specialized operations
30. Low fleet scrap age5. OPEX, High
11. Fuel use: MGO = 100%9. Fuel price, High
7. SFOC, High13. Decrease in fuel use, Low
10. Fuel price: IFO +25%1. Main project scenario
32. No reduction in North Sea fleet14. Decrease in fuel use, High
20. One SCR per ship (auxiliary engine)12. Fuel use: IFO380 = 100%
6. SFOC, Low8. Fuel price, Low
34. No ships built 201624. Speed decrease, Low
4. OPEX, Low35. No ships built 2016 and 2017
31. High fleet scrap age2. CAPEX, Low
29. LNG market penetration, High27. Efficiency assumptions, High
22. Shipping activity, Low18. NECA prevalence, 75%19. NECA prevalence, 90%
36. Scenario: All cost estimates, Low
Figure 7-7: Sensitivity analyses, benefit-cost ratio in 2030 From Figure 7-7, it is evident that the benefits at all times are at least 1.1 times as large as the cost, even when the lowest estimate of the benefits is applied at the highest cost estimate. The benefits not assessed monetarily will imply an even greater benefit-cost ratio. From the sensitivity analyses, it is clear than the benefits are greater than the costs of establishing a North Sea NECA. The socio-economic recommendation to establish a North Sea NECA is quite strong, as the costs are significantly lower than the benefits in all of the sensitivity analyses carried out.
7.10 North Sea SECA The costs of appointing the North Sea a NECA are reduced when the North Sea is also a SECA, since SECA requirements are expected to lead to a large increase in LNG-powered ships, which also comply with NECA requirements. The importance of this factor is assessed in a scenario analysis where future LNG share is reduced to 0%. The sensitivity analysis ‘LNG market penetration, Low’ resulted in a total cost of €323 million, which is 15% higher than the main project scenario cost estimate; see Figure 7-5. From the figure it is also evident not only that the LNG share is relevant to the analysis but also that other factors have a larger impact on the estimated total costs. On the other hand, the extra fuel consumption, which arises from the installation of EGR and SCR technology, is more costly when the North Sea is also a SECA. The reason for this is that SECA requirements lead to the use

64
of more expensive fuels or the use of a scrubber that increases fuel consumption. In the main project scenario it is assumed that 50% of the fleet use MGO as the result of SECA requirements (the remaining 50% use a scrubber which allows the ships to sail on heavy fuel oil). Two sensitivity analyses are conducted to assess the importance of this factor: if no ships sailed on low-sulphur fuels and if all ships did. In addition, several other sensitivity analyses are made on fuel consumption and price. From Figure 7-5 it is evident that fuel is not a central element of the cost assessment. All the fuel sensitivities produce results in the interval €269 million to €298 million in 2030, which lies within ±6% of the main project scenario estimate of €282 million.

65
8 Indirect economic impacts
The appointment of the North Sea as a NECA will, as described in previous sections, lead to increased costs of shipping in the North Sea. In this section, particular attention is paid to potential indirect effects of establishing a NECA, including:
Effects on freight rates and changed service Modal shifts The impact on the decision to invest in new ships
Since the appointment of the North Sea as a NECA will have a very limited effect on the operations of ships sailing to/from other NECAs, the conclusions presented in this section mainly apply to ships operating strictly within the North Sea NECA and to ships operating between the North Sea NECA and non-NECA areas.
8.1 Summary These are the main conclusions regarding the indirect economic effects if a NECA is established:
The estimated increase in total costs for ship operators is less than 2%. The competitive situation between sea- and land-based transportation
makes it optimal for the ship operators to absorb a large share of the cost increase and thereby minimise the risk of a modal shift from sea- to land-based transportation.
The costs imposed on the ship operators are unlikely to facilitate modal shifts.
The increase in freight rates is estimated to be 1%-2% for short-sea shipping.
The increase in freight rates is estimated to be 0.2%-0.6% for long distance shipping.
A rerouting of the shipping patterns is very unlikely. The decision to invest in new ships is expected to be influenced only
vaguely if at all. Potential changes in the decision to invest in new ships will not affect
the socio-economic assessment, since the costs and benefits are postponed accordingly.
8.2 Effect on freight rates In this section, we look more closely at the impact of increased costs from a North Sea NECA on freight rates. Knowing how the establishment of a NECA will affect freight rates is essential when estimating the change in the competitiveness of sea-based transport compared to land based. This in turn is pivotal in assessing the likelihood of modal shifts from sea-based to land-based transportation. The increased costs of shipping can lead to two different outcomes:

66
1. The operators absorb some of the extra costs and margins are reduced.
2. Some of the extra costs are passed on to the customers through higher freight rates, which reduces the attractiveness of shipping and results in volume losses.
From competition economics, we know that if competition between companies is strong, margins are low. An increase in costs will therefore lead to higher prices to avoid selling at a loss. If competition is weak, the companies are not forced to sell at a low price and margins are high. If the company increases the price, volume will go down and the company will lose profit from the lost volume. Therefore, companies with high margins will be less prone to increase prices. Hence, the stronger the competition, the larger the effect on freight rates due to increased costs. The degree of competition from road haulage is pivotal for determining the extent to which higher costs are converted into higher freight rates in the shipping market.
8.2.1 About the competition model To assess the share of the extra costs which are passed on to customers through higher freight rates, we have developed and used a standard competition model. The market simulations are used to determine the pass-through rate of cost changes under different degrees of competition. The simulation is based on a standard Cournot competition model in which a number of firms (shipping firms and road transportation firms) seek to maximise profits. In this setup, it is possible to estimate pass-through rates for different types of routes, e.g. routes with strong competition from road transport, monopoly routes with no competition from road transport, etc.
8.2.2 Results from the competition model The results of the modelling assessment are shown in Table 8-1. Table 8-1: Share of cost increase which is converted into higher freight rates in the long term; approximately 30 years
Competition in freight markets None Weak StrongCompetition from road transport
Strong - 30%-40% 35%-50%Weak - 40%-50% 70%-80%None 40% 50%-60% 90%-100%
When competition is strong in freight markets and there is no competition from road transport, almost all cost increases will be converted into higher freight rates in shipping markets. This could be the case for overseas transport, e.g. from Asia to Europe. At the other end of the spectrum, only 30%-40% of the extra costs will be converted into higher freight rates in shipping markets when competition in freight markets is weak and the competition from road haulage is strong. This could be the case, e.g. for shipping routes sailing from Scandinavia to Belgium/the Netherlands and routes from the west coast of France to Belgium/the Netherlands.

67
Since NECA requirements apply only to new ships, the full effect on freight rates will not appear until all competing ships have installed the required Tier III technologies, i.e. up to approximately 30 years after 2016. In the first years after 2016, it will be hard for shipowners to channel any increased costs through to customers, since NECA requirements impose extra costs on only a small share of the fleet. Hence, for many years, it must be expected that the operators will absorb the largest share of the cost increases. The results of the modelling exercise confirm that shipowners facing competition from land-based transport will be less inclined to increase freight rates. This reduces the risk of modal shift from sea- to land-based transportation.
8.2.3 Comparisons to other studies A number of studies7 have addressed the issue of how and to what extent increased costs for shipowners due to new regulation are channelled on to transport buyers via freight rates. According to the Ministry of Transport and Communications of Finland (2009), increased (fuel) costs will most probably be channelled to the sea freight charges. The Swedish Maritime Administration (2009) suggests that it would be difficult to channel cost increases to freight rates, as industries within ECAs are competing with industries in regions that are not ECAs and do not have corresponding fuel requirements. The ECSA study (ECSA, 2010) is mainly in line with the latter. The argument is that due to the competition with road transport, the shipping sector will find it difficult to charge their customers for the fuel cost increase. The ECSA study looked at the implications of low-sulphur fuel requirements, i.e. a shift from HFO (1.5%) to MGO (0.1%). The study showed that cost increases of 25.5% on average translate into increases in freight rates of 10%-34% for short-sea vessels, with an average of 16% for such vessels. The effect on freight depends, among other things, on the degree of competition from road transport and the ship types. On average, the results of the ECSA study indicate that approximately 60%-65% of the increased costs are passed on to the customers, which appears to be slightly higher than the results indicated in Table 8-1, since the majority of the 30 origin/destination routes examined in the study all face potential competition from road haulage.
8.3 Modal shifts Higher freight rates in shipping markets could potentially lead freight forwarders and logistics firms to optimise their route schedules according to the new prices. Where competition between road and sea transport exists, this could, all things being equal, potentially lead to increased road transport volume. If operators find that the increased shipping costs change the cost-efficient mode of transport from sea based to land based transport, a substitution can occur.
7Based on information from the European Maritime Safety Agency (2010)

68
8.3.1 Modal shift potential Shifting routes or eventually modes of transportation due to a rise in costs will affect different types of transport and different commodity groups in different ways. As a rule of thumb, long distance transports and transports of goods with low values will in most instances be kept on the mode and route already chosen. In simple terms, this means that transport of bulk products such as crude oil and petroleum is less likely to be affected by a NECA, due to a combination of long sailing distances, relatively low-value cargo and a limited number of ports at which ships can call. It is the same case for products such as grain, fruits and similar categories, which, due to both their large amounts and relatively low value, will stay on the already chosen routes, as a shift to another route (port) will most likely incur much longer pre- and post-haulage by trucks, at a much higher cost. For trucks operating within the bulk segment, a further problem is the lack of loads to return to the port. The common scenario is that these trucks are operated over shorter distances than trucks in general. In most European countries, trucks operate with a total weight limit of 40 tonnes,8 meaning that the weight limitations on the truck are much more of a restraining factor for these commodity groups compared with unitised goods. Looking at products that are being shipped short distances (short-sea shipping) or have a high value, the scenario will most likely be the same. A somewhat more obvious change in routing and modality could be realised through a shift in modality from lo/lo feeder to container trucks. Such a shift could imply that due to higher costs on the feeder route, trucks might become more competitive. This could result in minor changes with respect to competitive distances travelled by trucks, e.g. rising from 350 kilometres to 360 or 370 kilometres. On the other hand, the cost of trucking may continue to increase based on higher fuel prices, higher wages and especially road taxes/tolls in more and more countries in the upcoming years. Based on these assumptions, the effect of a NECA is most likely very limited. With respect to the ro/ro tonnage, the scenario is somewhat the same. The major difference when comparing ro/ro and lo/lo services is related not necessarily to the types of goods being transported, but much more to the total distances which the goods travel. Most ro/ro lines are servicing routes of shorter distances, linking (major) European conurbations with each other through carefully selected ports. Quite a number of routes have been designed in a way in which they can ‘cut corners’ compared to the road alternative, thereby being rather cost efficient compared to the road. Ro/ro transports are in most instances carried out in the form of semitrailers being rolled on and off the ship by a tractor. The goods within these trailers are, in most instances, so-called consolidated goods made up of all kinds of consumer and factory goods, consolidated in one unit. The value of these goods differs, but in most cases these goods are of a rather high value, and quite many deliveries are integrated in ‘just in time’ concepts with specific time windows for each delivery. A change in logistic patterns is therefore rather unlikely as a consequence of a minor change in cost structure, as the incurred cost due to such a change will most likely be much higher.
854 tons in Denmark and up to 60 tonnes in Sweden and Finland

69
In recent years, a number of shifts with respect to which ports ships are calling at have occurred within the ro/ro market. But in most if not all instances, these shifts have been related to the development of new markets or access to new and better port services or facilities. A transfer to truck seems to be a vague possibility, also taking into account likely cost increases for road transport due to more congestion; more road taxes; and the rising costs of fuel, salaries, etc. A number of cases have been developed in order to shed light on the reactions that can be expected from freight customers. For each case, a ‘by land only’ route has been compared with the alternative of a combined sea and overland route. In the comparison of the costs the expected increase in road transport due to congestion, road taxes, increasing fuel costs etc are not included. Correspondingly, no increases in shipping costs are included due to future SECA compliance costs etc. This is done to isolate the effect of a NECA since correcting for the expected future cost developments would imply great uncertainty and blur the effect of a NECA. The cases are divided into short-sea and long distance routes.
8.3.2 Cases: Short-sea ro/ro routes How exposed a given route is to modal shifts in case of changes in the relative cost functions of ‘truck only’ and ‘truck and short sea’ depends on a set of route-specific characteristics.
1. The geographical layout. The shorter the ‘truck only’ route is compared to the ‘truck and short sea’ route, the stronger a competitive position it holds.
2. Freight rates. The share of the cost increase which is converted into higher freight rates. The more cost that is converted, the stronger a competitive position the ‘truck only’ solution will hold.
3. Costs ‘truck only’. The lower the expected future cost is, the stronger a competitive position the ‘truck only’ solution holds.
The case analyses were conducted using a set of assumptions on the route-specific characteristics, all biased towards making the modal shift as likely as possible. The assumptions are then discussed and the extent to which modal shifts are likely to occur is assessed. The cases for short-sea routes are shown in Figure 8-1 below. It includes the following routes:
1. Brussels–Taulov (Overland or by Zeebrugge-Esbjerg)
2. Rotterdam–Manchester (Overland by the Channel Tunnel or by Rotterdam–Hull)
3. Düsseldorf–Tilbury (Overland by the Channel Tunnel or by Rotterdam–Harwich)
4. Rotterdam–Oslo (Overland by the Great Belt and Öresunds Links or by Hirtshals–Larvik)
5. Hamburg–Le Havre

70
Figure 8-1: Map of short-sea ro/ro case routes The cost is based on the ECSA study’s (ECSA, 2010) estimation of the typical cost for ro/ro and overland transport with the addition of updated road tolls for freight users (the Channel Tunnel, the German MAUT, the Great Belt Link, etc.). The cost to shipping companies of the introduction of a NECA is based on the cost effectiveness of technologies calculated in section 5 and the costs reported in section 6. The cost has been calculated per truck assuming an average ro/ro ship load factor of 75%. The five cases analysed all share the following characteristics:
A short route is utilised for ‘truck only’ compared to the route length for ‘truck and short sea’.
The cost increase for ship operators is 100% converted into higher freight rates.
The future cost of land-based transport is assumed not to increase over time.
The cost of the ‘truck only’ and the cost of ‘truck and short sea’ in a situation with and without a NECA are shown in Figure 8-2.

71
295
344
408
784
376
297
345
411
785
381
615
453
571
1,120
658
Rotterdam‐Manchester
Düsseldorf‐Tilbury
West Europe‐Scandinavia ***
Taulov‐Brussels
Rotterdam‐Oslo
English Channel
West Europe ‐Scandinavia
Truck only Truck/short sea with NECA Truck/short sea without NECA
Figure 8-2: NECA customer cost of options ‘truck only’ and ‘truck and short sea’ with and without a NECA, { per TEU (one way) It is evident that the establishment of a NECA only marginally affects the cost of sea-based transport. The estimated increase in total cost as a result of establishing a NECA is less than 2%. To be exact, the estimated increase in total customer cost for the five selected cases is between 0.1% and 1.4%. For all five cases, the cost of ‘truck only’ exceeds the cost of ‘truck and short sea’ by far. The cost difference between the two modes is so pronounced that the slight increase in the cost of sea-based transport does not in any way change that. If a NECA is established, the cost of ‘truck/short sea’ is between 48.3% and 76.2% of the cost of ‘truck only’. Without a NECA, the cost is between 48.0% and 75.9%. The analysis shows that the costs imposed on the ship operators if a NECA is established are not of a magnitude that is likely to facilitate modal shifts. This is supported by the fact that the cases analysed are hypothetical scenarios to illustrate situations in which modal shifts are most likely to occur. The assumption that 100% of the cost increase is converted to increased shipping cost rates is an absolute extreme. The actual pass-through will depend on the level of competition, as described in section 8.2.2. A plausible estimate is around 35%-50% where competition from road haulage is strong. This implies a cost increase of less than half of the estimates presented in Figure 8-2. The assumption that the cost of future road transportation will be constant is empirically not plausible. The assumption is made as part of the hypothetical scenario. In the future, several major cost components in road transport are expected to rise. The cost of salary will increase, and since salary is a larger part of the total cost of transport over land than over sea, this will strengthen the relative competitiveness of sea transport. Over time, congestion on roads is expected to increase and thereby further hamper the competitiveness of land transport relative to sea transport. The increase in freight rates when considering the costs associated with only the sea-leg part is around 1%-2% if a NECA is established in the North Sea.

72
The result is in line with the same type of assessment made in the Baltic NECA impact assessment. Here it was concluded that “the potential for modal shift from sea transport to road or rail transport caused solely by the NOx regulations will be very small or non-existent.” It was estimated that freight rates will increase by 2.0% to 4.6%, depending on ship type and size, if the Baltic Sea is appointed a NECA.9
8.3.3 Cases: Long distance container routes to Europe The cases of long distance sea routes include the following:
Rio de Janeiro–Rotterdam Shanghai–Düsseldorf
o Via Rotterdam (inside NECA area) o Via Genoa (outside NECA area)
Shanghai-Frankfurt am Main o Via Rotterdam (inside NECA area) o Via Genoa (outside NECA area)
The transport from the via-point to end destination is by truck. The route through Genoa is included to give an idea of the financial viability of avoiding the NECA by using Mediterranean ports instead. The customer cost is based on current freight rates of 1,000 USD/TEU (780 EURO/TEU) between Shanghai and Rotterdam and 1,250 USD/TEU (975 EURO/TEU) between Rio de Janeiro and Rotterdam. For Shanghai-Genoa, it is assumed that the time saving compared to the longer route to Rotterdam directly translates into the same relative saving in freight rates. This could lead to an underestimation of the cost of this route. The cost to shipping companies of establishing a NECA is based on the cost-effective technology choices presented in section 5 and the costs reported in section 6. The case studies are based on actual solutions, i.e. container ships fitted with 2-stroke engines and being of a size of 14,000 TEU for the Rotterdam-Shanghai route, 8,400 TEU for the Shanghai-Genoa route and 5,700 TEU for the Rio de Janeiro-Rotterdam route. The value of changes in travel time has not been included in the cost estimates. The results presented in Figure 8-3 show only marginal increases in total transport costs for long distance container shipping after the NECA has been introduced. The Shanghai-Genoa route does not constitute a viable alternative for the Shanghai-Düsseldorf or the Shanghai-Frankfurt am Main route after the introduction of the NECA.
9University of Turku (2010)

73
2,049
1,778
1,149
1,421
980
1,147
1,419
975
Shanghai‐Düsseldorf
Shanghai‐Frankfurt am Main
Rio de Janeiro‐Rotterdam
Current trade pattern without NECA, through Rotterdam
Current trade pattern with NECA, through Rotterdam
Alternative route through Genoa (unaffected by NECA)
Figure 8-3: Total transport cost of long distance container shipping with and without a NECA, { per TEU (one way) The increase in freight rates is estimated to be 0.2%-0.6% for all cases. The marginal increase is much too small to position the alternative route as an economically profitable choice. A rerouting of the shipping patterns due to the establishment of a NECA is very unlikely as the cost of a NECA is simply too small. The cost of shipping is the dominating cost component for all the selected cases. This implies that freight rates when considering only the costs relating to sea transport are basically unchanged at increases of 0.3%-0.6%. The reported results assume that shipping companies will be able to pass through all cost increases to the freight customers. This is likely, as the container routes analysed have a high degree of competition and there is no alternative overland transport; see section 8.2.2. for more information on absorbing vs. passing on the increased cost. The conclusion is the same for long distance routes as for short-sea routes. The results show that the cost increases are small and that significant reactions are most unlikely.
8.3.4 New routes – avoiding the NECA The development of new routes is especially relevant on the fringe of the NECA, where there is the possibility of avoiding the NECA. This is especially relevant for routes passing through the English Channel (inside the NECA) and either the Celtic Sea or Bay of Biscay (both outside the NECA). Ro/ro routes from England to Spain (Portsmouth-Bilbao, Portsmouth-Santander and Plymouth-Santander) could potentially reroute to Swansea or other ports in the Bristol Channel, thereby avoiding the NECA area. In the same way, ferries from Cork and Rosslare in Ireland to Roscoff in France could avoid the NECA area by using the port of Brest or another port in western France. Whether such route changes will happen depends not only on the cost associated with the NECA, but also on the cost of using these alternative ports. If port expansions or alterations are needed to accommodate these ro/ro ships, the extra costs associated with this can quickly outweigh the extra cost

74
of sailing in the NECA area. A detailed business case of each potential route alteration needs to be carried out in order to assess this. Long distance routes to France could avoid the NECA by docking in western France instead of at a port in the English Channel (for example, Saint-Nazaire instead of Le Havre). In the same way, long distance routes to Great Britain could call at a port in the Bristol Channel or the Irish Sea, such as Felixstowe or Hull, instead of a port in the NECA. For long distance routes, there is the additional complication of carriers operating a hub-and-spoke network with shorter lo/lo feeder lines, which would lead to larger alterations in their route networks and a possible need for new investments in harbour capacity. As an illustration of this, one could point to an example where a deep-sea port in the North Sea (Hamburg) were substituted with a port in the Irish Sea (Liverpool) in order to service Gothenburg, Copenhagen and ports in the Baltic States by a connecting short-sea service. Due to much longer sailing distances for the feeder ships, which have higher costs per unit, this is not a likely scenario. Furthermore, the total sailing distances would rise, which in itself would raise both the cost and the transit time. These rises in cost would have to be less than the cost implied by the NECA, which seems most unlikely. Operating costs are higher inside the NECA. The larger the part of a ship’s journey that is inside the NECA, the greater the benefit of an alternative route outside the NECA would be. On the basis of this, as well as the other effects presented above, rerouting is more likely to happen for the ro/ro routes Great Britain–Spain and Ireland-France than for long distance routes from the NECA area to destinations outside Europe. Given the fact that the cost increase is only marginal, it is very doubtful that it will facilitate any changes to the shipping route pattern. As no re-routing is expected the ports in the North Sea are likewise expected to only experience marginal changes if any at all.
8.4 Impact on decision to invest in new ships The appointment of the North Sea as a NECA could potentially delay investments in new ships or more likely make shipowners order more new ships just before NECA rules go into effect in 2016. All things being equal, this will delay both the increase in costs and the realisation of benefits from appointing the North Sea a NECA. As the realisation of both costs and benefits are postponed, the benefit-cost ratio is unaffected and the socio-economic assessment unchanged. In other words, should shipowners decide to alter their investment strategy, the socio-economic assessment of establishing a NECA is not affected. To assess the impact with a large degree of accuracy is very difficult. Three indicators are examined to assess the effect of establishing a NECA on the decision to invest in new ships:
Historical scrappings Drivers for shipowners’ replacement decisions The costs of keeping a ship in operation

75
These three indicators are described below. Furthermore, extra scenario analyses were conducted to assess the impact on the costs of establishing a NECA in the North Sea. The overall picture is quite clear: the decision to invest in new ships is expected to be influenced only vaguely if at all. Potential changes in the investment strategies will not affect the socio-economic assessment.
8.4.1 Historical scrappings The first indicator suggesting that the impact on shipowners’ decisions to invest in new ships is limited is historical developments in ship-scrapping markets. From Figure 8-4 it is evident that the average age of vessels when sent to scrap is relatively constant over time. The figure shows that the average age at scrapping fluctuated at a level of around 25-28 years from 1994 to 2003. In recent years, the economic crisis has most likely led to a decline in the average age at scrapping. However, in 2010 the average age at scrapping for tankers was still 26 years. Hence, it appears that no other major change in market conditions has had a large impact on shipowners’ decisions to replace older vessels with new ones, including the decline in earnings in 1999 due to a large influx of new ships and the 2001 post-dot-com crisis.
Figure 8-4: Average age at scrapping by year of scrapping Source: COWI (2004)
8.4.2 Drivers for shipowners’ replacement decisions This view is supported by a second indicator: detailed studies on the drivers for shipowners’ decisions to replace older vessels. In one study,10 it is concluded that: Freight rates appear to be the most important driver for the ship owner’s decision on when to supply vessels to the ship scrapping industry. Furthermore, the costs of keeping the vessel in operation (including the 5th special survey of vessels more than
10COWI (2004)

76
25 years old) and regulatory issues, as for instance phase out schemes, are important regulators for the supply of vessels to the ship scrapping industry. This view apparently is supported by Clarksons (2011): Demolition volume is driven by surveys, earnings and cash. The 5th special survey at 25 years often calls for heavy repairs which in a weak market are not really worth undertaking. Or the cash may not be available. So the ship is scrapped.
8.4.3 The costs of keeping a ship in operation The third indicator is the few data which are publicly available on the costs of keeping a ship in operation depending on the age of the ship. An example for large (capesize) bulkers is shown in Figure 8-5. There is no doubt that the figures are different for other ship types and size groups and that the actual figures depend on a number of factors. The figures do, however, give an impression of the order of magnitude of cost differences between new and older vessels. The data reflect that a modern ship is cheaper to run than an old ship because of lower operating costs, a smaller crew, less maintenance and higher fuel efficiency.
0
10
20
30
40
50
60
70
80
90
100
5 years 20 years
Maintenance
Voyage costs
Operating costs
Figure 8-5: Costs of keeping a ship in operation depending on the age of the ship (excluding capital costs). Index, 100=total costs for 5-year-old vessel including capital costs Source: Stopford Maritime Economics If the total cost of keeping a vessel in operation including capital costs is, e.g. €12,000 per day, the cost difference for a 5-year-old and a 20-year-old ship could be in the region of €3,000 per day. In the cost-effectiveness assessments in section 5, the average extra costs of NECA compliance per ship are shown per year in Figure 5-3. The cost per day for the NECA compliance, per ship, is found to be between €18 and €1,139. On average for all ship types and size classes, the cost is €146 per day. Again, this indicates that NECA requirements will most likely be of relatively little importance in shipowners’ decisions on ship replacements, as the

77
difference in operating costs is much larger than the costs of NECA compliance.
8.4.4 Change in decisions on when to invest in new ships The above-mentioned three indicators suggest that the impact of a NECA on the shipowners’ decisions to invest in new ships is limited. However, it cannot be ruled out that NECA requirements could have some impact on the decisions of individual shipowners. Therefore, two extra sensitivity analyses were conducted to analyse the impact on the total direct costs if shipowners do react.
a) All ships due for replacement in 2016 are replaced in 2015 (sensitivity analysis 34, see Table 7-3).
b) All ships due for replacement in 2016 and 2017 are replaced in 2015 (sensitivity analysis 35, see Table 7-3).
The results are shown in Table 8-2. Table 8-2: Sensitivity analyses. Change in shipowners’ decisions on when to invest in new ships, change in total costs compared to main project scenario, million { Change in total costa) All ships due for replacement in 2016 are replaced in 2015. -12b) All ships due for replacement in 2016 and 2017 are replaced in 2015.
-25
If all ships due for replacement in 2016 are replaced in 2015, the cost reduction is €12 million, and if all ships due for replacement in 2016 and 2017 are replaced in 2015, the reduction is €25 million. It is important to remember that not building any ships in 2016 and instead replacing the old ships before the NECA requirements come into effect is equivalent in the analysis to simply establishing the NECA one year later. If no NECA-compliant ships are built in 2016 or in 2016 and 2017, no costs will be defrayed in that period. The abatement will be postponed accordingly, and the socio-economic assessment is not affected. The difference in year 2030 total-cost estimates compared to the main project scenario cost estimate of €282 million is simply the cost of equipping the ships built in 2016 or in 2016 and 2017, respectively, with NECA-compliant technology.

78
9 References
Aarhus University, National Environmental Research Institute;. (2009). Ship emmissions and air pollution in Denmark.
AEA. (2009). Cost Benefit Analysis to Support the Impact Assessment accompanying the revision of Directive 1999/32/EC on the Sulphur Content of certain Liquids Fuels.
AirClim. (2009). Market-based instrument for NOx abatement in the Baltic Sea. Artemis. (2005). Sea transport emission modeling. Caterpillar. (2010). Caterpillar Poised to Reach IMO III Requirements for MaK
Marine. Clarksons. (2011). World Fleet Demolition – Clearing Out The Old Rubbish. COMPASS. (2010). The COMPetitiveness of EuropeAN Short sea freight
Shipping compared with road and rail transport. COWI. (2004). Study on the implications of the accelerated phase out scheme of
single hull tankers. COWI. (2011). Draft report to Danish EPA. DK-EPA. (2010). Natural gas as propulsion for the shipping sector in Denmark. ECSA. (2010). Analysis of the Consequences of Low Sulphur Fuel Requirements. ENTEC. (2005). Service contract on ship emmissions: Assignment, abatement
and market-based intruments. ENTEC. (2010). Study to review assessments undertaken of the revised
MARPOL Annex VI regulations. Entec UK Limited. (2005). Service Contract on Ship Emissions: Assignment,
Abatement and Market-based Instruments. European Commission. (2009). Impact assessment guidelines. European Maritime Safety Agency. (2010). The 0.1% sulphur in fuel
requirement as from January 2015 in SECAs. German Shipowners� Association and Association of German Seaport
Operators. (2010). Reducing the sulphur content of shipping fuels further to 0.1 % in the North Sea and Baltic Sea in 2015: Consequencs for shipping in this area.
Glosten Associates. (2011). Exhaust Gas Cleaning Systems Selection Guide Prepared for Ship Operations Cooperative Program (SOCP).
IACCSEA. (2011). Consolidated response to questionnaire. IACCSEA. (2011). Presentation to Norweigian Shipowners. International Institute for Applied Systems Analysis. (2010). Baseline emission
projections anf further cost-effective reductions of air pollution impacts in Europe.
International Maritime Organization. (2009). Second IMO Greenhouse Gas Study 2009.
Jalkanen, J.-P. e. (2011). Extension of an assessment model of ship traffic exhaust emissions for particulate matter and carbon monoxide.
Kali, Repkan, & Karvonen. (2010). Baltic NECA – economic impacts. MAN-DIESEL. (undated). Economical aspect of EGR system. MAN-DIESEL, & Turbo. (2010). Tier III Compliance - Low Speed Engines. MAN-DIESEL, & Turbo. (2011). Current status of Tier III engines. MAN-DIESEL, & Turbo. (2011). World's First Tier-III Compliant, Two-
Stroke Engine Unveiled in Japan. MAN-DIESEL, Turbo, & DANISCO. (2011). Water-in-fuel emulsion as
marine engine fuel for reduced NOx and particulate emissions.

79
MARINE ENVIRONMENT PROTECTION. (2009). INTERPRETATIONS OF, AND AMENDMENTS TO, MARPOL.
Marine Insight. (2010). 10 Technologies/Methods for Controlling NOx & SOx Emissions from Ships.
Maritime Coast Guard Agency. (2009). Impact Assessment for the revised Annex VI of MARPOL.
MECP. (2011). Possible approach for the review of the status of technological developments to implement the Tier III NOx emissions standards.
MIDN. (2007). Inerdepartmental Committee on the Dismantling of Civilian and Military End-of-Life Ships.
Ministry of Transport and communications Finland. (2009). Sulphur content in ships bunker fuel in 2015, A Study on the impacts of the new IMO regulation on transportation costs.
Mitsubishi. (2011). World's First SCR NOx Removal System Installed on Coal Bulker Built by Oshima Shipbuilding - Aiming to Meet the IMO's Tier III NOx Emission Controls.
Navayuga Engineering Company Limited. (2010). Assessment of the impact of the application of new sulphur limits to the Mediterranean and the Atlantic European Seas.
PBL Netherlands Environmental Assessment Agency. (2012). Environmental benefits of a nitrogen oxides emission control area of the North Sea.
Rolls-Royce. (2011). Rolls-Royce wins first order for award-winning Environship.
Shipowner association of Belgium, Finland, Germany, Holland, Sweden and UK and endorsed by the wider membership of ECSA and ICS. ((2010)). Study to Review Assessments Undertaken of The Revised MARPOL Annex VI Regulations.
SKEMA. (2010). Task 2 and 3 Impact Study on the future requirements of Annex VI of the MARPOL Convention on Short Sea Shipping.
Swedish Maritime Administration. (2009). Consequences of the IMO�s new marine fuel sulphur regulations.
Transport Canada, T. (2000). Cost-benefit study of marine engine NOx emmissions control systems.
Transport Development Centre of Transport Canada. (2000). Cost-Benefir Study of Marine Engine Nox Emissions Control Systems.
University of Antwerp & Transport Mobility Leuven. (2010). Analysis of the consequences of low sulphur fuel requirements.
University of Turku, C. (2010). Baltic NECA - economic impacts. University of Turku, Centre for Maritime Studies . (2010). Baltic NECA -
economic impacts. US-EPA. (2009). Regulatory Impact Analysis: Control of Emissions of Air
Pollution from Category 3 Marine Diesel Engines - Chapter 4 Technological Feasibility.
Wärtsilä. (2008). Meeting and exceeding regulations. Wärtsilä. (2008). Wärtsilä wins first order for new Nitrogen Oxides Reducers. Wärtsilä. (2010). Environmental Product Guide 2010. Wärtsilä. (2011). IMO Tier III Solutions For Wärtsilä 2-Stroke Engines –
Selective Catalytic Reduction (SCR) . Wärtsilä. (2011). Wärtsilä successfully tests new 2-stroke dual-fuel gas engine
technology to comply with IMO Tier III emission limits. Yim, Kim, Baik, & Nam. (2004). Decomposition of Urea into NH3 for the SCR
Process.

80
10 Appendix A: Technology today and outlook
10.1 Technology today and outlook towards 2030
10.1.1 The marine engine and its fuels The global merchant fleet is overwhelmingly powered by diesel engines fuelled by residual fuel oil, also known as heavy fuel oil, a viscous refinery end-product generated after the distillation of lighter hydrocarbon fractions. Ships while berthed in ports in a number of countries and ships operating in emission control areas use the distillate fuels such as marine diesel oil or marine gas oil, and a minority of ships operate continuously on these low-sulphur fuels, gas or nuclear fuels. The widespread use of HFO as a fuel for propulsion of ships is currently challenged by the decisions of the IMO to introduce first a regulation to reduce vessels’ emissions of sulphur oxides (already partly implemented), and second a regulation to reduce the emissions of nitrogen oxides (NOx), to be implemented over the coming years. The implementation schedules for emission control areas are shown in the figure below.
Figure 10-1 Stepwise implementation of the air emission targets applicable in emission control areas (ECAs). Regional regulation is not included. Ship owners intending to build new vessels over the next five-year period therefore are already considering their options for complying with global sulphur regulation coming into play in 202011 and how to cope with the Tier
11 A review of the implementation of the final 0.5% sulphur global target by IMO will take place in 2018, and the date of introduction may be changed from 2020 to 2025.

81
III NOx requirements of 2016,12 if the intended trading areas include possible NECAs in northern America, northern Europe or Japan. The 2- or 4-stroke marine diesel engine is a proven technology classed as low-, medium- or high-speed. Generally for the merchant fleet, low-speed engines are 2-stroke large-bore engines for oceangoing vessels, whereas the medium-speed 4-stroke engines are installed on a wide variety of vessels. The high-speed engines (>2,000 rpm category) are typically found in smaller vessels (pilots, coast guard) and in high-speed craft such as ferries. The NOx reduction implementation scheme for each engine category is shown below. Introduction of fuel oil maximum sulphur content (by weight %) as loaded, bunkered and subsequently used on board. The limits do not apply for exhaust gas cleaning systems, which operate by water washing the exhaust gas stream prior to discharge to the atmosphere, and ships with these systems may use HFO. Table 10-1 NOx reduction implementation scheme
Implementation (on and after date)
Inside a SOx ECA Outside a SOx ECA
Current 2012 1.0%
3.5%
1 January 2015
During 2018 0.1% Review of 2020 fuel
availability 1 January 2020* 0.5%
1 January 2025 Possible extension
of 0.5% introduction
* Depending on the outcome of a review to be concluded in 2018 as to the availability of the required fuel oil, this date could be deferred to 1 January 2025. (IMO 2012) The implementation of the NOx reduction from 2016 will require newly built ships to meet the 80% Tier III criteria when operating in a NECA. Abatement technologies have therefore been under development for the maritime market for several years based on technologies from the energy utility industry and transport sector.
12 The US will introduce legislation based on four tiers largely coinciding with the IMO’s.
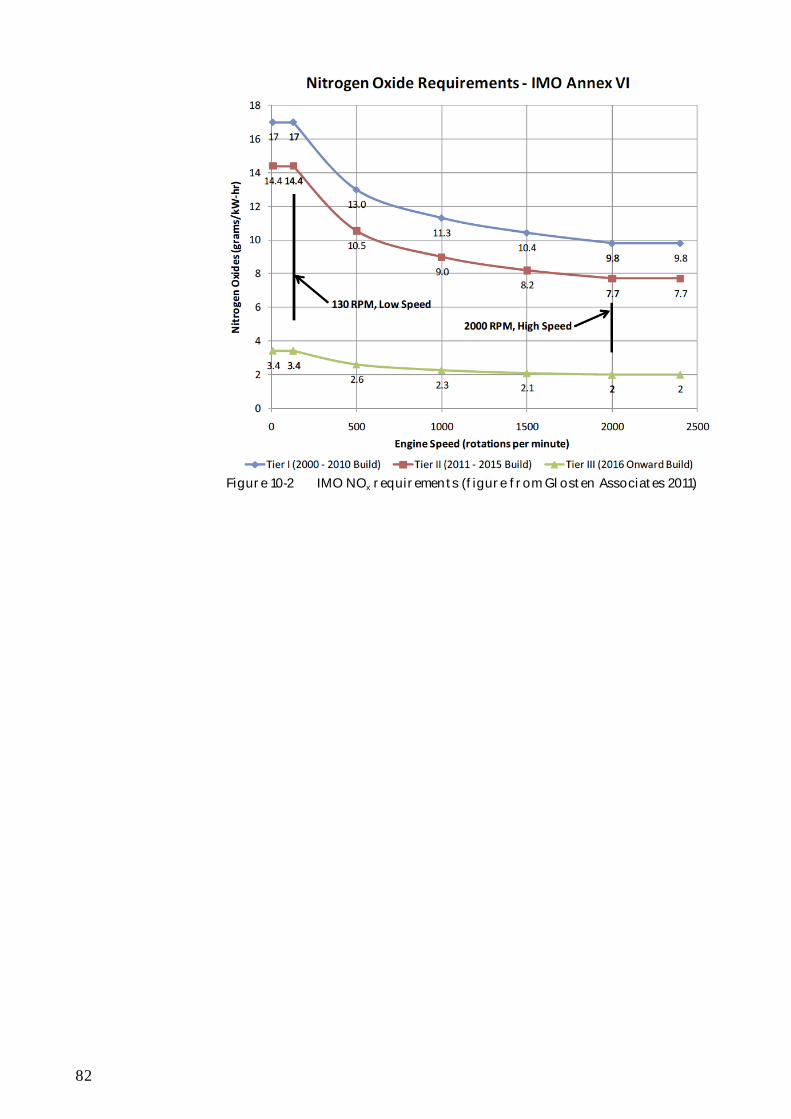
82
Figure 10-2 IMO NOx requirements (figure from Glosten Associates 2011)

83
11 Appendix B: Abatement technology review
11.1 Technology today and outlook towards 2030 The diesel engine is a proven technology classed as low-, medium- or high-speed and either 2 or 4 strokes. The marine diesel engine accepts heavy fuel oils, which currently are a considerably cheaper product than distilled fuels. Low-speed engines are mostly 2-stroke large-bore engines, whereas the medium- and high-speed engines are 4-stroke. Although vessels are purpose built in small series and to highly individual specifications, for the fleet as a whole and on a generalised basis, the lower category of the MARPOL Appendix VI regulation for NOx (<130 rpms) is the 2-stroke large oceangoing vessels, and the medium category of 130-<2,000 includes the majority of the rest of the merchant fleet. Only the high-speed engines fit the >2,000 rpm category typically found in smaller vessels (pilots, coast guard) and in high-speed craft such as ferries. Two-stroke diesel engines have better fuel efficiency, fewer cylinders and therefore fewer moving parts than 4-stroke engines. The largest engines have an output of more than 85 MW and run at low rpm (60-130). The downsides of 2-stroke engines are the initial installation costs and reduced manoeuvrability (Marine Insight 2011). Four-stroke engines are cheaper to install than 2-stroke engines. Most of the medium (130-2,000 rpm) and high-speed (>2,000 rpm) engines are 4-stroke with effects up to 20 MW. Four-stroke engines are often installed in roro ships, ferries, supply vessels and ships that often have to change the power settings during port operations (Marine Insight 2011). Less than 2% of the global fleet is turbine powered, and of those ships, 13% use gas turbines, while the remaining 87% use steam turbines (US EPA 2009). The gas turbine and steam system - combined cycle - is increasingly considered for LNG-driven vessels as reductions of emissions become an imminent issue. The limited number of merchant ships not powered by oil is typically fuelled by gas, e.g. the LNG carriers traditionally have steam turbine machinery with gas-burning boilers installed.13 However, the marine LNG-fuelled engines emerging during the last decade are mostly dual-fuel units, although ferries have been fitted with gas engines with mechanical power transmission or have gas turbine units with electrical transmission.
11.1.1 NOx abatement technology outlook The technologies for reducing NOx emissions in maritime transport are to some extent well known from land-based applications and yet under development or modification to the particular characteristics of the maritime industry. Several major reviews of NOx abatement technologies have been carried out earlier (e.g. Entec 2005; Artemis 2005, US EPA 2009). MEPC
13 Friis et al. (2002) Ship Design Part I & II, p. 420-421. DTU Press ISBN 978-87-707-800-49
84
will in 2012-2013 prepare a review of the technologies specifically meeting Tier III requirements as required in MARPOL Appendix VI (MEPC 62/4/9). Over the next decades, it is expected that NOx-reducing engine types such as the dual-fuel engine (LNG and diesel) and fuel cells will gain a wider impact in new builds for trading in the areas expected to become NECAs. Nevertheless, the classic sturdy diesel engine will undoubtedly remain the choice for propulsion power among ship owners and shipyards for a foreseeable future, at least up to the year 2030, and the majority of the fleet equipped for Tier III compliance will utilise the modifications designed for this engine rather than completely changing to new engine types utilising new fuel. For that reason, the Tier III NOx abatement technologies briefly described here are related to modifications of the diesel type engines currently installed in new ships. However, in particular, the option for short sea shipping, ferries and other local traffic within a NECA to use LNG as a fuel for propulsion should not be ignored and will also be assessed. The technologies involve the use of SCR exhaust after-treatment, water-introduction approaches (e.g., fuel-water emulsification, intake air humidification and direct water injection); dual fuel; and EGR to reduce NOx emissions. The technologies listed in the table below include both the latest technologies and some of the well proven existing technologies. It must be noted that there is a considerable range in the reported reduction efficiencies and the ability of technologies to achieve Tier III compliance, partly due to the rapid evolution of the field over the last five years. In particular, the entry into force of MARPOL VI and the potential NECAs in the Baltic Sea, North America and the North Sea have spurred technological development. The data reported in and quoted from milestone publications from the mid-2000s should be assessed in relation to newer data.14 In particular,
selective catalyst reduction exhaust after-treatment, exhaust gas recirculation, water introduction methods and use of alternative fuel (LNG) for propulsion
are the main technological tracks for which recent developments have provided some new insights. There is no doubt that the SCR qualifies as a Tier III methodology, which is hardly surprising given its track record in land-based applications and the existing applications in vessels. Today, it appears from a review of current data that the previously disqualified EGR should now be counted as Tier III compliant.15 In contrast, the water introduction technologies appear not to be able to achieve Tier III compliance as stand-alone technologies but must with the current knowledge be seen as methods primarily for achieving Tier II compliance. In particular, the humid air motor (HAM) has not yet been demonstrated to reach the final 10% reduction in NOx levels, despite early optimism and considerable efforts based on its readily achieved 60%-70% reduction. A brief summary of technologies and their approximate NOx reduction potential is given in Table 11-1 and Table 11-2. 14 The background documentation for the Economic Assessment of the Baltic NECA Lists, e.g. only two Tier III technologies: SCR and conversion to gas (Kali et al. 2010) 15 As published by one major engine manufacturer (MAN Diesel and Turbo)

85
LNG appears likely to become a preferred fuel for high-speed turbo gas engines and dual-fuel engines on vessels in fixed routings such as ferries and local operations such as supply vessels and possibly short-shipping Ro-Ros. The impact of LNG in other ship types and trades is not readily foreseen and is estimated to be dependent on infrastructure development, regulatory regimes and any widening of the gap in costs compared to conventional fuels. Other energy sources such as nuclear power, hydrogen fuel cells, wind-assisted propulsion, solar power, biodiesel, etc. are not considered relevant for a major change in fuel choice in the time frame of the study (up to 2030). Table 11-1 NOx reduction technology overview Tier II (information primarily from low-medium speed engines)
Tier II Technology
Short description Max % NOx reduction
Primary (before or on engine) Direct Water Injection (DIW)
DWI technology reduces NOx emissions through the injection of a high-pressure fine-water mist into the combustion chamber.
Up to 60%
Water in Fuel (WIF) Systems
WIF systems or fuel-water emulsions (FWE) reduce NOx formation in marine diesel engines by mixing water into the fuel oil.
Up to 55%
Humid Air Motors (HAM)
The HAM system uses combustion air almost entirely saturated with water vapour (humid air) in a marine diesel engine. The charge air is humidified by water vapour produced in a humidification vessel by evaporating freshwater or seawater directly into the charge air using the heat from the engine or its exhaust gases.
Up to 70%
Other methods of intake air humidification
Adding the water to the charge air is a relatively simple method of reducing NOx and particulate emissions without engine modifications. A fine freshwater mist is injected directly into the hot compressed air of the turbocharger outlet.
30-45%
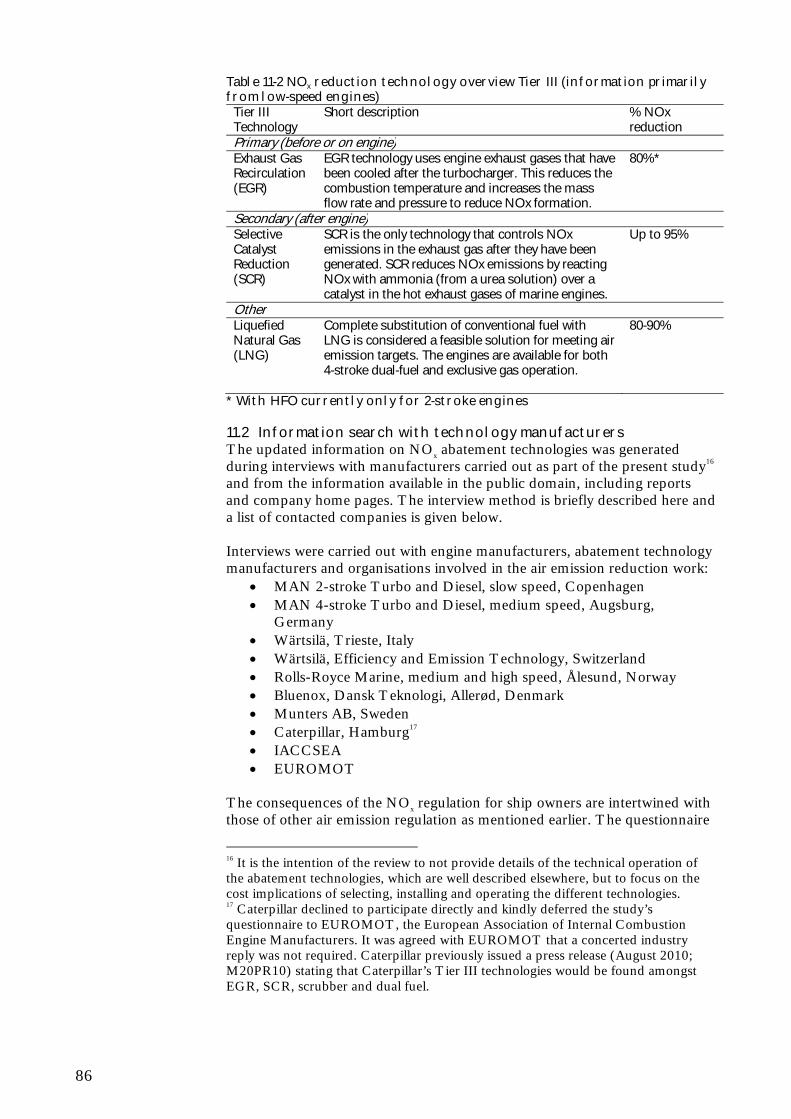
86
Table 11-2 NOx reduction technology overview Tier III (information primarily from low-speed engines)
Tier III Technology
Short description % NOx reduction
Primary (before or on engine) Exhaust Gas Recirculation (EGR)
EGR technology uses engine exhaust gases that have been cooled after the turbocharger. This reduces the combustion temperature and increases the mass flow rate and pressure to reduce NOx formation.
80%*
Secondary (after engine) Selective Catalyst Reduction (SCR)
SCR is the only technology that controls NOx emissions in the exhaust gas after they have been generated. SCR reduces NOx emissions by reacting NOx with ammonia (from a urea solution) over a catalyst in the hot exhaust gases of marine engines.
Up to 95%
Other Liquefied Natural Gas (LNG)
Complete substitution of conventional fuel with LNG is considered a feasible solution for meeting air emission targets. The engines are available for both 4-stroke dual-fuel and exclusive gas operation.
80-90%
* With HFO currently only for 2-stroke engines
11.2 Information search with technology manufacturers The updated information on NOx abatement technologies was generated during interviews with manufacturers carried out as part of the present study16 and from the information available in the public domain, including reports and company home pages. The interview method is briefly described here and a list of contacted companies is given below. Interviews were carried out with engine manufacturers, abatement technology manufacturers and organisations involved in the air emission reduction work:
MAN 2-stroke Turbo and Diesel, slow speed, Copenhagen MAN 4-stroke Turbo and Diesel, medium speed, Augsburg,
Germany Wärtsilä, Trieste, Italy Wärtsilä, Efficiency and Emission Technology, Switzerland Rolls-Royce Marine, medium and high speed, Ålesund, Norway Bluenox, Dansk Teknologi, Allerød, Denmark Munters AB, Sweden Caterpillar, Hamburg17 IACCSEA EUROMOT
The consequences of the NOx regulation for ship owners are intertwined with those of other air emission regulation as mentioned earlier. The questionnaire
16 It is the intention of the review to not provide details of the technical operation of the abatement technologies, which are well described elsewhere, but to focus on the cost implications of selecting, installing and operating the different technologies. 17 Caterpillar declined to participate directly and kindly deferred the study’s questionnaire to EUROMOT, the European Association of Internal Combustion Engine Manufacturers. It was agreed with EUROMOT that a concerted industry reply was not required. Caterpillar previously issued a press release (August 2010; M20PR10) stating that Caterpillar’s Tier III technologies would be found amongst EGR, SCR, scrubber and dual fuel.

87
therefore included a number of issues regarding implementation of the technology: • Technology readiness date MARPOL Appendix VI operates with an introduction date of 2011 for Tier II (20% NOx reduction) and 2016 for Tier III (80% NOx reduction) in NECAs. In consequence, ship owners are expected to consider the value of direct compliance with Tier III for new builds. • Ship and engine particulars The regulation has several implementation levels with regards to construction dates of vessels (keel laying) and engine revolutions (rpms). In general, response on performance is provided at 75% maximum continuous rating (MCR). • Air emission reduction regulation on sulphur Although the task at hand is focused exclusively on the consequence of a NECA in the North Sea, the SECA is already in effect and the choice for SOx reduction can have repercussions on the NOx abatement options. • Secure supply and alternative energy sources In addition to the issues on sulphur, radical switches in energy sources are also in play, with the least radical being a switch to gas, in particular, LNG. The alternative energy sources are for the most part not relevant as major game-changers. Only LNG appears relevant in selected trades. The available technologies for NOx reduction do to some extent affect the freedom of choice regarding SOx emissions, and the impact solely from NECA will be investigated here. The data on fuel and consumables consumption refer to 75% load situations, where possible. For some systems, the technology is still young and the information is provided with relatively large margins.
11.3 General air emission issues The formation of NOx is based on the reaction between atmospheric oxygen and nitrogen and is strongly temperature dependent: the higher the combustion temperature, the more NOx is formed. Most NOx-reducing technologies work on reducing the combustion temperature before NOx formation reaches its peak exponential stage; see figure below.

88
Figure 11-1 Formation of NOx during an engine cycle18 There is an inherent optimisation contradiction between lowering the combustion temperature to reduce NOx formation and maintaining efficient combustion, which mostly results in a higher combustion temperature (‘the diesel dilemma’); see Figure 11-2. An additional CO2 emission is often seen with NOx abatement technology, and the underlying increased fuel consumption is not disregarded in the manufacturers’ assessments. Finally, the choice of technology is not entirely disconnected to the strategy chosen to meet sulphur reduction targets. Also, some abatement methods may increase or decrease emissions of particulate matter depending on the engine load. For the purpose of the assessment here it is assumed that particulate matter emissions are not a driving force for the ship owners choice.
)
Figure 11-2 Optimisation of the combustion processes to reduce fuel consumption and CO2 emission increases the NOx emissions and vice versa. Source: IACCSEA 2011a
11.4 Review of Tier II technologies The NOx emissions of a diesel engine can be controlled through engine design and calibration of, e.g. fuel delivery and valve timing. As mentioned earlier, the control of diesel emissions by modifying the combustion involves trade-offs in NOx emission control versus other parameters, in particular, fuel consumption. These methods readily meet the Tier II reduction target but are currently not expected to meet Tier III as stand-alone methods. They may, however, be used in combination with other methods to achieve Tier III. Internal engine modifications
18 From http://www.mandiesel-greentechnology.com/0000488/Technology/Primary-Measures.html

89
Turbocharging, slide valves, fuel delivery strategies and combustion chamber optimisation have the potential to reduce NOx by up to 20% but not necessarily without adversely affecting fuel consumption. Miller valve timing in combination with turbocharging can be used to reduce NOx emissions without increasing fuel consumption (US EPA 2009). In common rail fuel injection technology, a computer system controls fuel injection timing and injection pressure. Injection of a small quantity of fuel (pilot fuel) early in the compression stroke and other flexibility in engine settings such as fuel feed rates and valve timing allows emissions to be reduced. Water-based NOx abatement A number of methodologies reduce the combustion temperature by introducing water into the cylinders. This can be through mixing water into the fuel (water in fuel, WIF), injection of water directly into the cylinder or introducing moisture with the charge air. The addition of water to the HFO by emulsification increases viscosity. To keep the viscosity at the engine inlet at 10-15 cSt, max. 20 cSt, it may become necessary to raise the temperature to more than the 150°C which is standard today (max. 170°C at 50% water) and, accordingly, to raise the fuel oil loop pressure in order to avoid boiling of water. Water used for the emulsification must be demineralised to comply with fuel quality standards, as the sodium can react with vanadium in the fuel oil. This leads to accumulating deposits of vanadium on the valve spindles and valve seats. For each 0.7% to 1% of water added to the fuel, a 1% reduction in NOx emissions can be realised, and engine manufacturers have demonstrated NOx reductions of up to 50% through the use of fuel-water emulsions alone (US EPA 2009). For HFO the emulsification is uncomplicated, but WIF is not yet possible for distillate fuels, e.g. marine gas oil (MGO) or marine diesel oil (MDO), without using an appropriate emulsifying agent. Distillate fuels have a lower density than water, i.e. the water droplets will have a much higher tendency for sedimentation, and the lower viscosity of the distillate fuels fails to maintain dispersal of the water droplets (MAN/DANISCO 2011). As the air emission target for sulphur is tightening, the usage of distillate fuels is expected to increase, notably in ECAs, and the emulsification of distillates is one of several key challenges for WIF. In direct water injection (DWI), a controlled quantity of water is injected into the cylinders of both 2-stroke and 4-stroke engines before combustion. When water is injected directly into the cylinder independent of the fuel, control over the injection timing and the quantity of water is possible and water can be injected when it provides the optimum NOx reduction while minimising the impact on other criteria pollutants (US EPA 2009). Engine manufacturers have reported that DWI, when using a water-to-fuel proportion of 40% to 70%, is capable of reducing NOx emissions by 50% to 60%, without affecting engine power (US EPA 2009). Intake air humidification can be carried out in different ways, but a well known is the humid air motor (HAM) which was developed by Munters Europe AB. This system has undergone trials for 4,000 hours on the MS

90
Mariella of the Viking Line. The HAM system uses charge air enriched with evaporated seawater to reduce NOx emissions during the combustion process. The HAM system is used to replace the conventional engine air intercooler. Since it uses engine heat to heat the seawater, additional boiler capacity may be needed for other ship needs. The principle is to humidify the hot charge air from the compressor in a water spray chamber, which increases the heat capacity of the charge air on the one hand, allowing it to absorb more heat, while at the same time reducing the oxygen content of the air. The result is a lower combustion temperature in the engine – one of the key factors for NOx content in exhaust gas. Since untreated seawater can be used to generate the steam, running the HAM system incurs only very limited operating costs. HAM motors can reduce NOx up to 70%. This is also the conservative figure set in the Entec (2005) report, but as mentioned earlier, hopes were higher for HAM since first tests reported 70%-80% reduction of NOx and the Viking Line reported a 75%-85% reduction (Entec 2009). However, the present study has not been able after consultation with the industry to confirm recent Tier III compliance by HAM. Quite similar to HAM, but for 2-stroke engines, is scavenge air moistening (SAM), where the hot charge air from the compressor is humidified and cooled by the injection of seawater. This increases the heat capacity of the charge air on the one hand, allowing it to absorb more heat, while at the same time reducing the oxygen content of the air. The results are a lower combustion temperature in the engine and lower NOx emissions from the engine. Wetpac H is a technology in the same family also delivering a water mist to the intake air. Studies have shown that 30- 45% reduction is possible with these methods. According to our interviews, HAM, DWI and WIF emulsions are currently not further developed as stand-alone methods by major players for Tier III, as the methods are considered incapable of reaching 80% reduction of Tier I. A major engine manufacturer stated in mid-2011 that “confirmation is still pending for whether the target NOx reduction level for Tier III can be achieved by means of DWI alone” (Wärtsilä 2011a). A recently developed unique technology should be mentioned although still not fully tested, since significant reductions are claimed concerning SOx, NOx and CO2 emissions. The CS NOx technology of Ecospec Marine in Singapore reports 98%-100% sulphur dioxide removal, 77% CO2 removal and 66% NOx reduction. CS NOx continues to undergo verification testing, and further information substantiating the efficiency of the technology may become available.
11.5 Review of Tier III technologies During the last 3-4 years, the major engine manufacturers have developed and tested engines or announced their intention to do so in order to meet market demand for Tier III compliance. This is the case for the 2-stroke engine manufacturers MAN, Wärtsilä and Mitsubishi:
Wärtsilä wins first order for new Nitrogen Oxides Reducers; Wärtsilä Corporation, Trade & Technical press release. Wärtsilä (2008a).
91
MAN Diesel & Turbo confirms that MAN B&W 6S46MC-C8 engine with integrated SCR fulfils the IMO’s strictest emission standards. MAN Diesel and Turbo (2011).
World’s First SCR NOx Removal System Installed on Coal Bulker Built by Oshima Shipbuilding - Aiming to Meet the IMO’s Tier III NOx Emission Controls. Mitsubishi (2011).
Several manufacturers of 4-stroke engines, in addition to those mentioned above, have also published their strategic choices on SCR and LNG, e.g.:
Caterpillar Poised to Reach IMO III Requirements for MaK Marine. Caterpillar (2010). Rolls-Royce wins first order for award-winning Environship. Rolls-Royce (2011).
The engine manufacturers, when it comes to abatement technologies, currently focus on SCR, EGR and, for some, the alternative fuel choice LNG. For example, MAN states:
When bringing two-stroke engine performance up to Tier-III standard, MAN Diesel & Turbo considers both SCR (Selective Catalytic Reduction) and EGR (Exhaust Gas Recirculation) techniques. (MAN 2011).
Wärtsilä is leaning towards SCR as mentioned above and dual-fuel engines:
The new RTX5 2-stroke test engine is part of Wärtsilä’s 2-stroke dual-fuel gas engine technology development programme. This is an important part of the company’s strategy to lower emissions, increase efficiency and to develop its low-speed engine portfolio to include dual-fuel gas engines alongside its medium-speed dual-fuel engines. (Wärtsilä 2011b).
The technological developments may not be completed and feasible on-board technical solutions may not be tested fully, but the abovementioned methods SCR, EGR and LNG are the ones preferred publicly by the world’s major engine manufacturers. Due to the long track record of SCR in land applications, a number of independent providers already offer the technology for marine applications, whereas the EGR and LNG solutions are offered mainly through the engine manufacturers. The combination of some of the Tier III technologies with Tier II technologies, e.g. EGR with WIF,19 are possible, but at present no other clear matches are evident from the information collected through the interviews performed. Shifting to distillate fuels has an impact on the viscosity of the fuel oil, which in turn has a significant influence on the oil film thickness, promoting scuffing behaviour between the plunger and the barrel. Also, low-sulphur fuels tend to have shorter hydrocarbon chains, providing lower lubricity. These issues (with roots in the sulphur reduction regulation, not the NOx reduction) are currently under scrutiny by the engine manufacturers. The issues are of primary concern for Tier II water injection technologies, and for the purpose of the current economic assessment, it is assumed that any challenges
19 MAN Diesel and Turbo (2010) has shown a reduction to 2.0 g NOx/kWh at 2.5% SFOC by combining 28% WIF and 37% EGR.
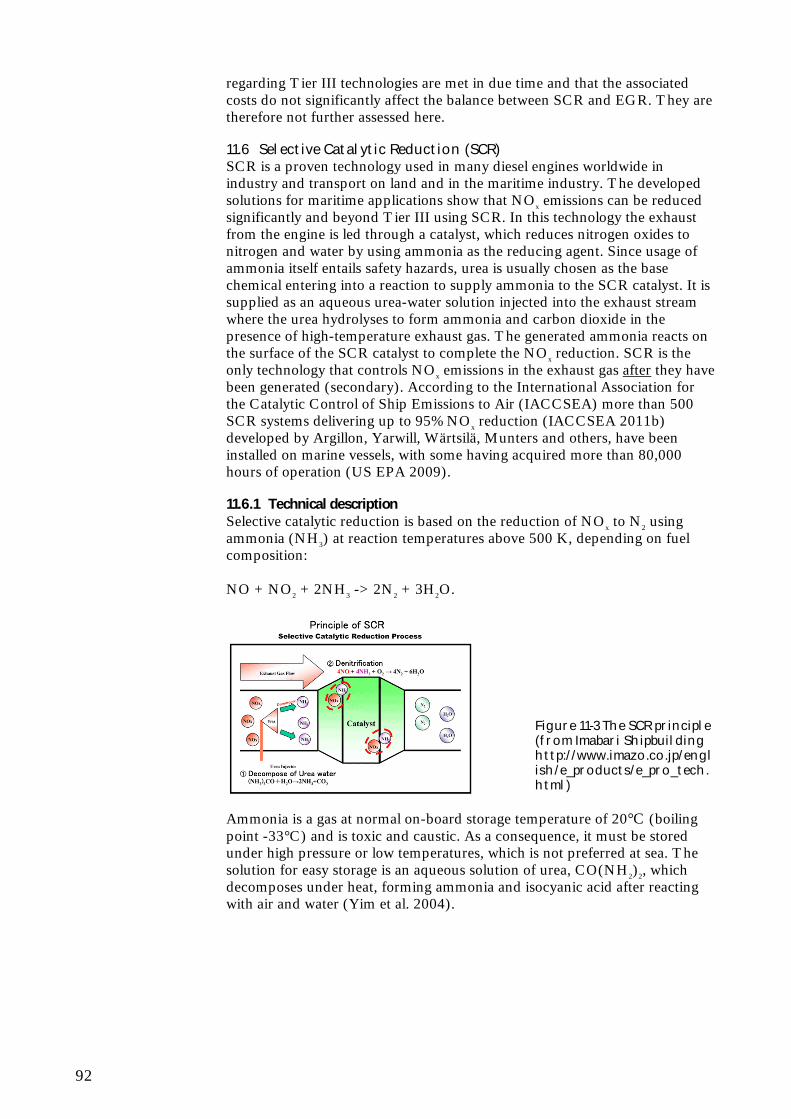
92
regarding Tier III technologies are met in due time and that the associated costs do not significantly affect the balance between SCR and EGR. They are therefore not further assessed here.
11.6 Selective Catalytic Reduction (SCR) SCR is a proven technology used in many diesel engines worldwide in industry and transport on land and in the maritime industry. The developed solutions for maritime applications show that NOx emissions can be reduced significantly and beyond Tier III using SCR. In this technology the exhaust from the engine is led through a catalyst, which reduces nitrogen oxides to nitrogen and water by using ammonia as the reducing agent. Since usage of ammonia itself entails safety hazards, urea is usually chosen as the base chemical entering into a reaction to supply ammonia to the SCR catalyst. It is supplied as an aqueous urea-water solution injected into the exhaust stream where the urea hydrolyses to form ammonia and carbon dioxide in the presence of high-temperature exhaust gas. The generated ammonia reacts on the surface of the SCR catalyst to complete the NOx reduction. SCR is the only technology that controls NOx emissions in the exhaust gas after they have been generated (secondary). According to the International Association for the Catalytic Control of Ship Emissions to Air (IACCSEA) more than 500 SCR systems delivering up to 95% NOx reduction (IACCSEA 2011b) developed by Argillon, Yarwill, Wärtsilä, Munters and others, have been installed on marine vessels, with some having acquired more than 80,000 hours of operation (US EPA 2009).
11.6.1 Technical description Selective catalytic reduction is based on the reduction of NOx to N2 using ammonia (NH3) at reaction temperatures above 500 K, depending on fuel composition: NO + NO2 + 2NH3 -> 2N2 + 3H2O.
Figure 11-3 The SCR principle (from Imabari Shipbuilding http://www.imazo.co.jp/english/e_products/e_pro_tech.html)
Ammonia is a gas at normal on-board storage temperature of 20°C (boiling point -33°C) and is toxic and caustic. As a consequence, it must be stored under high pressure or low temperatures, which is not preferred at sea. The solution for easy storage is an aqueous solution of urea, CO(NH2)2, which decomposes under heat, forming ammonia and isocyanic acid after reacting with air and water (Yim et al. 2004).

93
Figure 11-4 The SCR layout (Artemis 2005)
11.6.2 Feasibility SCR is a mature technology for 4-stroke engines, whereas SCR for 2-stroke engines (pre-turbo) is still at a pilot testing stage. A few plants have been running for many years, and it is anticipated by the industry that this engine subset will be served with commercially available SCR solutions by 2014 (IACCSEA 2011b). A challenge of the SCR NOx abatement technology is sulphur in the fuel. For an unmodified noble metal SCR unit to function effectively, the engine must burn fuel with low sulphur content, since increasing sulphur concentrations leads to excessive formation of sulphates and damage to the oxidation catalyst of the SCR unit (MEPC 62/4/2). The SCR systems must be installed where the exhaust gas temperature is sufficiently high to ensure the chemical reaction efficiency. For 2-stroke engines, where exhaust gas temperatures are generally lower than for 4-stroke engines, the SCR must be placed in front of the turbochargers. In this case, the SCR systems can be combined with a wet scrubber for SOx removal and thus operated with high-sulphur fuels. With a dry scrubber, the SCR can be placed after the scrubber. When operating on marine distillate fuel with 0.1% sulphur in fuel, the minimum exhaust temperature for effective reductions through a current SCR system would be on the order of 270°C. On typical heavy fuel oils, which have sulphur concentrations on the order of 2.5%, the exhaust temperature would need to be about 300°C, due to high sulphur concentrations (US EPA 2009). This is somewhat lower than the temperature requirements of 300°C to >350°C reported by Wärtsilä and shown in figure below for a sulphur range from 0% to 4%, where the figure indicates the trade-off between the minimum recommended exhaust gas temperature and the sulphur content of the fuel in order to achieve good efficiency and durability (Wärtsilä 2010).

94
Figure 11-5 Recommended minimum catalyst operating temperature for continuous operations vs. sulphur content (%) in fuel oil (Wärtsilä 2010).
According to Wärtsilä (2011a), the temperature of the exhaust gas is “thereby subject to constraints both on the upper side (in order to avoid oxidation of the reductant) and the lower side (for preventing the formation of undesired by-products such as ammonium sulphates, which may subsequently clog and deactivate the catalyst). The latter is particularly an issue with fuels containing higher fractions of sulphur, such as those present in typical heavy fuel oil (HFO) qualities available today, which calls for even higher minimum temperatures in the catalyst.” The lower exhaust gas temperature therefore potentially limits the efficiency of SCR for 2-stroke engines and dual-stage turbo engines, and consequently the SCR is placed before the turbo systems. This means that the SCR needs to be installed in the engine room and not in the funnel. It is, however, still a challenge to meet the required temperature at lower loads where the temperature may be well below 300°C. For 4-stroke engines, the exhaust gas temperature is higher; thus this problem does not influence the installation of the SCR. As SCR is an after-engine technology, it is a challenge to keep temperatures sufficiently high when operating vessels at low loads, i.e. 15% to 50% engine load, unless measures are taken to increase exhaust heat. This may include reducing the level of charge air cooling or modifying the injection timing. Another approach to increase the exhaust temperature would be to use burner systems during low-power operation (US EPA 2009). According to MAN Diesel and Turbo (2010), the SCR system is best suited for steady high-load conditions, i.e. SCR is less suited for low-load operation and manoeuvring in coastal and harbour areas. When operating on HFO, the requirement for scrubbing the exhaust can be met by a wet or a dry scrubber:20
20 From presentation of D. Thum, MAN Diesel and Turbo 27.09.11

95
The dry exhaust gas cleaning systems require storage of consumables and gypsum granulate. According to Glosten (2011), some sulphur scrubbers are not compatible with NOx abatement strategies, i.e. SCR, that target the IMO Tier III and US EPA Tier 4 NOx requirements. Glosten (2011) states that SCRs work best with hot, dry, low-sulphur exhaust streams and, also, that the combined EGCS and SCR use will require fan use to avoid excessive backpressure on the engines. A key advantageous feature of the SCR is that it allows switching between on and off modes for altered emission performance inside and outside of NECAs. SCR can be operated at all engine loads �25% MCR. The SCR can also be operated at higher NOx reduction rates than Tier III, e.g. in Norwegian waters under local NOx regulation.
11.6.3 Costs Engine producers estimate SCR technologies to range between 20 and 63 €/kW, and the larger the engine, the less expensive the installation costs per kW. SCR modules are offered in many sizes: one manufacturer provides 6 different sizes of equipment, each relevant to 2-5 engine sizes (4-stroke), and another 12 module sizes (see below).
Figure 11-6 Modular SCR systems (from MAN 2011)
It is assumed that the Tier III NOx abatement to be installed on auxiliary engines will be SCR based. In this respect, data for installation costs vary considerably. In the interviews with manufacturers, the installation costs for smaller engines are expected to be relatively uniform per effect unit whereas in a recent draft report on air emissions from ships, an exponential increase is reported for engines less than 5 MW:
For small engines the cost of installation amounts to approximately 20,000 EUR per MW (MCR). For large engines the installation amounts to approximately 5,000 EUR per MW (MCR) (COWI 2011).
In the interviews performed here, installation costs are reported from 5,000 EUR/MW to 12,500 EUR/MW, but without a clear relation to installed effect.

96
��C��
�A�
��A�
y�=�‐0.7143x�+�59.5�
y�=�‐0.7429x�+�51.5�
y�=�0.0286x�+�8�
0�
10�
20�
30�
40�
50�
60�
0� 5� 10� 15� 20� 25� 30� 35� 40� 45�
Unit�price�in
�€/kW�
Engine�effect�(MW�)�
CAPEX�(€/kW)�
Equipment�(€/kW)�
Installa on�(€/kW)��
Figure 11-7 Installation cost of SCR technology to MW installed in new-build 2-stroke engines. Letters denote different manufacturers. Operating costs in €/MWh for the SCR systems are independent of engine size, according to estimates from producers. Running costs, which are mainly for urea, range between 4 and 10 €/kWh for 2-stroke engines and 3 and 7 €/kWh for 4-stroke engines.
Figure 11-8 Installation cost of SCR technology to MW installed in new-build 4-stroke engines. For installations larger than 40 MW, no prices were supplied. Letters denote different manufacturers.

97
Table 11-3: Technology costs summary
SCR (2s) <130 rpm
SCR (4s) 200 to <1,600 rpm
CAPEX
€/kW 28-56 25-62
Equipment 18-46 20-50
Installation 6-10 5-12.5
OPEX*
€/MWh 4.3-10 2.7-7.2
CAPEX; Y = -0.71x + 59.5 0.027x2 -1.823x + 57.084
SFOC 0
1%-2% if wet scrubber
1-2 g/kWh <40% load
2-3 g/kWh if scrubber
* Highly dependent on market price for urea The operation costs (OPEX) show arithmetic means of 5 and 7 €/MWh for 2- and 4-stroke engines for SCR systems. The expenses derive from additional chemical consumption (mainly urea).
11.7 Exhaust Gas Recirculation (EGR) EGR must be considered a proven technology for diesel engines in land-based vehicles. The technology is based on redirecting a part of the exhaust gas back into the combustion chamber and lowering the combustion temperature. As the only major engine manufacturer, MAN includes the EGR in their Tier III compliance programme after successful tests on their experimental 4T50ME-X 2-stroke engine achieving 80% NOx reduction:
The achieved NOx cycle value with EGR confirmed that the IMO Tier III level (3.4 g/kWh) was obtainable with EGR as the only remedy to reduce NOx even with the engine in a normal Tier I configuration as reference. (MAN Diesel and Turbo 2010).
This manufacturer has also installed the first application of an EGR system on a slow-speed 2-stroke engine on board the Maersk Line container ship MV Alexander Maersk, a 1,092 TEU vessel with a MAN B&W 7S50MC Mk6 main propulsion engine rated at 10,126 kW at 127 rpm. The EGR was installed in March 2010 and is undergoing testing and evaluation as the vessel plies its normal routes in the Mediterranean (MAN Diesel and Turbo 2010).21
11.7.1 Technical description Exhaust gas recirculation (EGR) reduces peak combustion temperature and hence NOx formation when a non-combustible gas is added to the combustion process. The exhaust gas is typically routed from the exhaust system and mixed with the incoming combustion air. The recycled exhaust gas has lower oxygen content and also absorbs some of the heat energy during combustion, both of which reduce the peak temperatures (US EPA 2009).
21 MAN maintains based on their experience with the on-board installation that EGR will be part of their portfolio for Tier III compliance. (MAN Diesel and Turbo 2011)

98
The following paragraphs are from MAN Diesel and Turbo (2011b) with reference to the figure shown below:
Part of the exhaust gas is diverted from the exhaust gas receiver through a wet scrubber, which cleans the gas and reduces the temperature of the exhaust gas. The gas flows through a cooler and water mist catcher and finally through the EGR blower which lifts the pressure to the scavenge air pressure. A water handling system supplies the scrubber with recirculating fresh water with the addition of NaOH to neutralise the effect of sulphur in the fuel. The effect of this system will be that a minor part of the oxygen in the scavenge air is replaced by CO2 from the combustion. The heat capacity of the scavenge air will be slightly increased and the temperature peaks of the combustion will be reduced. Accordingly, the amount of NOx generated in the combustion chamber is reduced but it is also followed by a minor fuel penalty. The NOx reduction value is dependent on the ratio of recirculating gas.
Figure 11-9 Principal components and flow of EGR, exhaust gas recirculation, system (MAN Diesel and Turbo 2011b)
11.7.2 Feasibility and cost EGR systems need to be installed during the building of the engine and cannot be retrofitted. New-build engines can however be prepared for an EGR system for retrofit. EGR has not yet been fully tested for 4-stroke engines, but according to MAN, the expectations are that it will be slightly more expensive to install and operate EGR systems on 4-stroke engines than on 2-stroke engines.22 The fuel options for 4-strokes are currently limited by the sulphur content to DM-grade fuels (max. 1% S). In an ECA after 2020, the fuel must be maximum 0.1% sulphur, i.e. MGO, or a scrubber must be in operation when using HFO (currently HFO has 2.7% sulphur content on average). This leads to added costs for running the EGR
22 Communication with Dr. D. Thum. MAN Augsburg.

99
alone (MGO option) or the EGR and the EGCS (HFO option) of approximately 2.4 and 3.5 €/MWh, respectively.23 EGR does not dramatically change the emission of air pollutants from ships. The SOx levels decrease slightly due to the internal scrubber, but the particulate matter level may increase due to lower combustion temperatures. The wet scrubber can be substituted with a dry scrubber. This will still require storage of consumables and granulate and is slightly more expensive to purchase, install and operate. Table 11-4 Cost of installing and operating EGR on 2-stroke engines and expected costs related to 4-stroke engines (data from questionnaires). It is emphasised that the data for 4-stroke engines are preliminary and subject to change.
EGR (2s)
<130 rpm
EGR (4s)
400-1,200 rpm**
CAPEX
€/kW
37-45 55 at 5 MW and 46 at 22 MW
Equipment 32-39 36-45
Installation 5-6 10
OPEX €/MWh
2-3 5%-8% of fuel costs
CAPEX; Y = -0.2x + 47 -0.5x + 58
SFOC 1-2 g/kWh* See OPEX
* MAN Diesel and Turbo (2010) reports 0.6 g/kWh at 75% load. ** Actual reported range. Assumed valid as medium range. EGR in general entail a penalty on fuel consumption and a cost to the internal scrubber. The installation costs range between 37 and 45 €/kW installed power and expected running costs of 2-3 €/MWh mainly due to running an internal scrubber with NaOH neutralisation. In comparison, MAN has stated that the negative effect on SFOC, CO and PM is much less (nearly zero) for 2-stroke engines than for the high-speed 4-stroke engine (MAN Diesel and Turbo 2010).
23 E-mail from J. Stubkjær, Danish EPA, 22 June 2011.

100
��C��
�C�
y�=�‐0.2x�+�47�
y�=�‐0.175x�+�40.75�
y�=�‐0.025x�+�6.25�
0�
5�
10�
15�
20�
25�
30�
35�
40�
45�
50�
0� 10� 20� 30� 40� 50� 60�
Unit�price�in
�€/kW�
Engine�effect�(MW�)�
CAPEX�(€/kW)�
Equipment�(€/kW)�
Installa on�(€/kW)�max�
Figure 11-10 EGR cost estimates related to installed power for 2-stroke engines
��C��
�C�
y�=�‐0.5294x�+�57.647�
y�=�‐0.5294x�+�47.647�
y�=�10�
0�
10�
20�
30�
40�
50�
60�
0� 5� 10� 15� 20� 25�
Unit�price�in
�€/kW�
Engine�effect�(MW�)�
CAPEX�(€/kW)�
Equipment�(€/kW)�
Installa on�(€/kW)�max�
Figure 11-11 EGR cost estimates related to installed power for 4-stroke engines
11.8 Liquefied natural gas engines The Norwegian NOx tax spurred a considerable interest in the shipping industry in using LNG as a fuel for propulsion, not only on the LNG carriers but also on vessels operating locally in Norwegian waters. The technology is used particularly on ferries and offshore supply vessels, and the associated bunkering infrastructure is slowly maturing. The major costs incurred directly by the ship owner are for the purchase and installation of the engine (assumed dual fuel), LNG storage tanks and necessary special piping. Fuel saving costs can be considerable, and large vessels may save up to $1 million per year on fuel costs. At the current costs of MGO, the comparable fuel, LNG, will be beneficial over the long term economically and environmentally (DK EPA 2010). The emissions are also reduced by more than 80% to more than 90%24, making it one of the cleanest fossil fuels that can be used to produce energy – the actual level met is dependent on the amount of pilot fuel used and the cycle mode. The new LNG engines are built to meet the shipowner’s requirement for lower fuel consumption (i.e. lower GHG emissions), lower SOx emissions and
24 Not all LNG engines are designed to meet Tier III requirements. The current assessment relates only to Tier III engines.

101
lower NOx emissions. The spark ignited lean burn gas engine and the dual-fuel (low pressure) engine both meet Tier III requirements without modifications, whereas the dual-fuel (high pressure) engine will need NOx abatement technology to meet Tier III. The largest obstacles for LNG engines are the fuel logistics and availability of refuelling stations, still making the LNG carriers the primary consumers of LNG. There are, however, no technical obstructions for a wider implementation of gas as a fuel for propulsion.
11.8.1 Dual fuel systems Dual-fuel engines run on gas with 1% diesel (gas mode) or alternatively on diesel (diesel mode): In gas mode the combustion of a gas and air mixture is triggered in the Otto cycle by pilot diesel injection, and this would be the mode of operation in a NECA. Alternatively, combustion of a fuel and air mixture in diesel mode will be used outside a NECA.
Figure 11-12 Dual fuel engine combustion cycle
According to Wärtsilä, their dual-fuel 4-stroke engines running in gas mode comply with the Tier III rules without any additional technology being required (Wärtsilä 2008b). For 2-stroke engines, the efficiency of dual-fuel engines is improving, and recently Wärtsilä reported Tier III compliance for their 2-stroke dual-fuel test engine in gas mode (Wärtsilä 2011b), but also that additional development may be needed to comply with Tier III under a range of operating conditions. As mentioned above MAN reports that the need for abatement technology is still the case for the high-pressure dual-fuel engine. Gas engine manufacturers are refining the mechanisms to eliminate emissions of gas during the combustion cycle, since a potential drawback of LNG engines is gas leakage of un-combusted methane, which as a greenhouse gas is much stronger (22 times) than CO2.

102
11.8.2 Technical description LNG engines of today are 4-stroke engines in the dual-fuel version with an option to use MDO, but the latest developments are directed towards 2-stroke engines. LNG engines in principle differ only at the injector part to enable gas or fuel oils to enter the engine cylinder. The following figures show the 4- and 2-stroke injector systems.
Figure 11-13 Dual-fuel 4-stroke engine (LNG and distillate fuels)
Figure 11-14 2-stroke dual-fuel LNG engine
11.8.3 Feasibility and Costs Installation of LNG engines have costs similar to those of other engine types, in the range of 150 to 250 €/kW, again, smaller engines being more expensive than larger engines per kW installed. Running costs are related to the price of natural gas, which again correlates with fuel prices in general. In general, fuel savings of 5%-10% are reported, as compared to conventional fuel oils. It is the objective to identify the added cost of Tier III compliance (NECA) compared to Tier II compliance (no NECA), but many new LNG-fuelled engines are automatically Tier III compliant and the Tier II level alone does not exist. However, the dual-fuel high-pressure engines aimed at the larger 2-stroke vessels will need additional abatement technology (EGR or SCR).

103
Although an estimate is very uncertain they are expected to take a global market share of 5-10% of the number of LNG engine installations, most of them on LNG carriers and other large vessels on high seas trade. It has been stated that the cost of gas driven engine, fuel systems and arrangements amounts to 9-15% compared to diesel engines (example for ro-ro).25 Here, it is assumed that the cost of the gas engine itself may not be much different (within 10%) in the future compared to that of Tier III diesel engines. In this case, the difference on equipment costs should be similar to Tier II diesel engines, i.e. from 25-62 €/kWh (excluding the storage tanks). However, a recent Dutch assessment of current experience with an LNG engine suggests a factor of 1.5-2 in price differences between a standard diesel engine with SCR and an LNG engine (TNO 2011).26 LNG must be stored under the same conditions it is transported at, -161°C, in specially designed tanks, and it is not pumpable over long distances. These requirements make converting the current use of HFO, diesel or gasoil in the shipping industry to operation on LNG more than just installing a different engine. A string of supply chain facilities and services is required in addition to the investments needed directly on the vessels. Table 11-5 Unit cost for LNG
130-1,999 rpm 2 MW
130-1,999 rpm 10 MW
CAPEX €/kW* 30-74 30-74
Equipment** 25-62 25-62
Installation*** 5-10 5-10
OPEX €/MWh
There are no costs for consumables.
There are no costs for consumables.
Running cost €/MWh N.A. N.A.
Specific fuel oil consumption (SFOC) g/kWh
-2.5 - 5 g/kWh
-2.5 -5 g/kWh
% fuel penalty Gain 5%-10% Gain 5%-10%
* Total costs for engines are given as 150-250 {/kW. ** Tier III extra cost set is similar to diesel engines plus 20%. *** Installation costs are for the entire engine including safety measures (double sides and tubing) but excluding LNG storage tanks. For the larger LNG engines, the installation price is roughly the same as for diesel engines.
11.9 Tier III applicable technologies summary Technology availability In general, all major manufacturers are working on several technologies to enable the ship owners to select the most cost-effective technology, depending
25 Gas fuelled ships. Dag Stenersen, Marintek. GTS Technical seminar series 28.09.2011 26 It should be noted that since the environmental model operates with a fixed number of LNG-driven vessels in a NECA future, the actual economic cost estimates do not affect the difference between NECA and no NECA.

104
on market prices of fuel and chemicals and also options to design engines to comply with Tier III. The major engine manufacturers have market-ready or demonstration technologies available and maintain that outstanding technological issues will be solved for Tier III in 2016. Abatement technologies do not come with the same price tag, but from the available information it appears that the basic costs of purchasing, installing and operating at least one system for a given type of engine are available. Thus, summarised from the interviews with engine manufacturers, the three technologies that comply with Tier III are EGR, SCR and LNG-driven engines. Compatibility with sulphur requirements The market forces drive engine manufacturers to design engines accepting several fuel options and also to allow variable use of the NOx-reducing technology, depending on the regulatory requirements and on the costs of chemicals and fuel. All interviewed manufacturers assert that their abatement technology eventually will be able to handle fuels with high sulphur levels, albeit with technical modifications of their systems. Obviously, the most cost-effective Tier III technology regarding both installation and running costs is most likely to be selected by the ship owners. However, actual best choice will be dependent on the pros and cons of each technology for the specific ship type, trade or expected load regime and hence may be quite individual for ship owners. Both SCR and EGR will require changes to the standard design to accommodate high-sulphur fuel (HFO is currently 2.7% on average). For SCR the 2-stroke engine technology is the least mature, while for EGR the 4-stroke technology is under development. An SCR engine will require injection of urea solution. It must have a mechanism to maintain a high catalyst temperature, if running on 2-stroke engines and with >1% sulphur fuels. An EGR engine will have increased fuel oil consumption when operating in Tier III mode. If the engine is to be operated on fuel with high sulphur content, use of a NaOH solution is required in the internal EGR scrubber. Auxiliary engines On a general basis it is expected that each auxiliary engine will require abatement technology, and presently the SCR reactors appear to be the most relevant choice. It is possible to design and produce SCR systems that can be class approved for the combined exhaust from main engine and auxiliary engines, such as was done for the SCR retrofit of the Swedish Scandica, combining a main engine and 2 auxiliary engines. It is, however, not expected by industry experts that this will be a common phenomenon for new ships, since the shipyards and engine manufacturers will prefer prefabricated and class-approved solutions rather than custom-made solutions. Abatement technologies require additional power for proper operation under all loads and hence entail a fuel penalty. A cost for instalment of additional auxiliary engine power has not been included in the estimations, since Tier III compliance relates to new builds only, and it is estimated that the added installed effect is not significant in terms of instalment costs.

105
LNG Liquefied natural gas turbine options are increasingly popular, as the Tier III levels can be reached with no further measures. The primary challenges are related to infrastructure availability, on-board storage tank footprint, the call for a combined cycle engine and the price of fuel. Dual-fuel engines compliant with Tier III criteria are available for 4-stroke engines. For 2-stroke dual-fuel engines, compliance with Tier III has been reported very recently from Wärtsilä (September 2011). Other issues Currently, no major manufacturer of abatement technology for diesel engines appears to be targeting the >2,000 rpm market. SCR and LNG should be feasible technologies for this segment, depending on the actual engine effect and expected operation pattern. Operation modes A Tier III engine will operate in Tier II mode outside NECAs and in Tier III mode inside. The manufacturers anticipate delivering their abatement systems with different pre-settings for maximum reduction, e.g. for operating in Norwegian waters or elsewhere with restrictive regulation, for Tier III compliance, and for Tier II compliance. This requires application of additional engine components and auxiliary systems. A direct comparison of Tier II to Tier III compliance cost for both SCR and EGR estimates the extra cost of a Tier III engine to be an additional 45 euros per kW installed engine power (MAN Diesel and Turbo 2011b).

106
12 Appendix C: Sensitivity tests
The sensitivity results presented here are also presented in section 7.9 in the report. The data presented here is identical to the data in the report. Only the form is different For explanation and discussion of the sensitivity results please see section 7.9 in the report. The numbers in parenthesis after the labels refer to the relevant sensitivity analysis presented in Table 7-3. The figure should be read as follows: If a low estimate is used for CAPEX (capital expenditure) the estimated cost in 2030 is €238 million. This is lower than the cost estimate of the main project scenario of €282 million and also strictly lower than the benefits ranging from €443-€1,928 million. The span of the benefits reflects different means of estimation and uncertainty, see section 7.5.
238 325 253 311 270 293 269 297 284 298 276 284 279 278 354
Benefits 443‐1,928
Main project scenario282
Low
(2)
Hig
h (3
)
Low
(4)
Hig
h (5
)
Low
(6)
Hig
h (7
)
Low
(8)
Hig
h (9
)
IFO
+25
% (
10)
MG
O =
100
% (
11)
IFO
380
= 10
0% (
12)
Low
(13
)
Hig
h (1
4)
One
SC
R (a
ux.)
(20
)
Hig
h (2
1)CAPEX OPEX SFOC Fuel price Fuel type Decrease in fuel Technology Interest
rate
Figure 12-1: Sensitivy tests - Cost estimates, million { 2030

107
391 352 323 178 136
Benefits 443‐1,928
Main project scenario282
No other NECAs(15)
No Baltic NECA(16)
Shared CAPEX withBaltic (17)
NECA prevalence,75% (18)
NECA prevalence,90% (19)
Figure 12-2: Sensitivy tests – Other NECAs, million { 2030
203 387 259 322 369 216 323 229 311 252 321 280
Benefits 443‐1,928
Main project scenario282
Low (22) High (23) Low (24) High (25) Low (26) High (27) Low (28) High (29) Low (30) High (31)
Shipping activity Speed decrease Efficiency assumptions LNG market penetration Scrap age No reductionin North Sea
fleet (32)
Old shipsundertakespecializedoperations
(33)
Figure 12-3: Sensitivy tests – Projection of fleet, million { 2030
267 252 127 389
Benefits 443‐1,928
Main project scenario282
No ships built 2016(34)
No ships built 2016and 2017 (35)
Scenario: All costestimates, Low (36)
Scenario: All costestimates, High (37)
Figure 12-4: Sensitivy tests – Indirect effects and scenarios, million { 2030

Strandgade 29 DK - 1401 København K Phone: (+45) 72 54 40 00
www. mst.dk
Substantial benefits for health and environment by reducing nitrogen oxide emissions
from ships in the North Sea.
This is the main conclusion from two new studies lead by the Danish Environmental Protection Agency
and the PBL Netherlands Environmental Assessment Agency. The eight North Sea countries have jointly
investigated the costs and benefits of creating a nitrogen emission control area (NECA) in the North Sea
and the English Channel, from 2016 onwards. The two studies are required by the International Maritime
Organization, which can designate a NECA and thereby require new ships from 2016 onwards to emit 75
percent less nitrogen oxides than required today. And the message of the studies is clear – a NECA would
be a cost efficient way to reduce the emissions.
Reduktion af skibenes udslip af NOX i Nordsøen giver markante gevinster for sundhed og
miljø.
Det er hovedkonklusionen i to nye studier fra Miljøstyrelsen og det hollandske miljøvurderings-institut
PBL. De otte Nordsølande er gået sammen om at undersøge de økonomiske og miljømæssige
konsekvenser ved at udpege et ”NOX Emission Control Area” (NECA) i Nordsøen og den Engelske Kanal
fra 2016. Studierne er nødvendige for, at FN’s søfartsorganisation IMO kan udpege Nordsøen som NECA,
hvilket vil betyde krav til alle nye skibe fra 2016 og fremad om 75 % lavere NOX-udslip, end der kræves i
dag. Og konklusionen er klar – tiltaget vil være en effektiv og billig måde at reducere udslippene på.