Embed Size (px)
Citation preview

Access to Microfinance & Improved Implementation of Policy Reform(AMIR Program)
Funded By U.S. Agency for International Development
Economic Impact and Implications for Jordanof the U.S. – Jordan Free Trade Agreement
Final Report
Deliverable for BAI Component, Task No. 2.2.6 JTA Issues AnalysisContract No. 278-C-00-98-00029-00
February 2001

This report was prepared by Montague Lord in collaboration with Hana Uraidi-Hammudeh andunder the direction of Zaki Ayoubi and Chemonics International Inc., prime contractor to theU.S. Agency for International Development for the AMIR Program in Jordan.

Economic Impact and Implications for Jordan of the Jordan-U.S. FTA Final Report
AMIR Program iii
Table of Contents
Table of Contents............................................................................................................... iiiTables and Boxes ................................................................................................................ vAcronyms and Abbreviations ............................................................................................. vi
Executive Summary......................................................................................................... viii
Chapter 1: Introduction....................................................................................................1
A. Study Objective ............................................................................................1B. Approach and Organization of the Study.....................................................1
Chapter 2: Trade Agreements .........................................................................................3
A. The U.S.–Jordan Free Trade Agreement ......................................................3B. WTO Accession and Commitments .............................................................5C. The Euro-Mediterranean Association Agreement ........................................6D. Other Regional and Bilateral Arrangements.................................................6
Chapter 3: Structure of Trade .........................................................................................8
A. Trade Structure and Flows............................................................................8B. Trade with the United States.........................................................................9
Chapter 4: Tariff Structures...........................................................................................11
A. Jordan’s Tariff Schedule .............................................................................11B. Jordan’s Free Zones....................................................................................12C. U.S. Preferential Tariffs..............................................................................16
Chapter 5: International Competitiveness...................................................................19
A. Comparative Advantage .............................................................................19B. International Competitiveness ....................................................................20
Chapter 6: Export Compatibility with the U.S. Market ...............................................27
A. Emerging Exports and Imports....................................................................27B. U.S. Tariffs on Jordan’s Exports .................................................................33
Chapter 7: Potential FTA Impact on Exports...............................................................38
A. FTA-Related Tariff Liberalization ................................................................38B. U.S. Market Access Regulations ....................................................................40

Economic Impact and Implications for Jordan of the Jordan-U.S. FTA Final Report
AMIR Program iv
Chapter 8: Potential FTA Impact on Imports ...............................................................42
A. Trade Complementarities. ...........................................................................42B. Nominal and Effective Protection...............................................................44
Chapter 9: Potential FTA Impact on Trade in Services..............................................49
A. Jordan’s Service Sector ...............................................................................49B. FTA and GATS Commitments....................................................................49C. Liberalization of Services............................................................................52
Chapter 10: Conclusions................................................................................................59
Annex A: Methodological Notes...............................................................................61
Annex B: U.S.-Jordan FTA and GATS Service Commitments ...............................65
Annex C: Meetings Conducted..................................................................................77
Annex D: References ..................................................................................................79
Economic Impact and Implications for Jordan of the Jordan-U.S. FTA Final Report
AMIR Program v
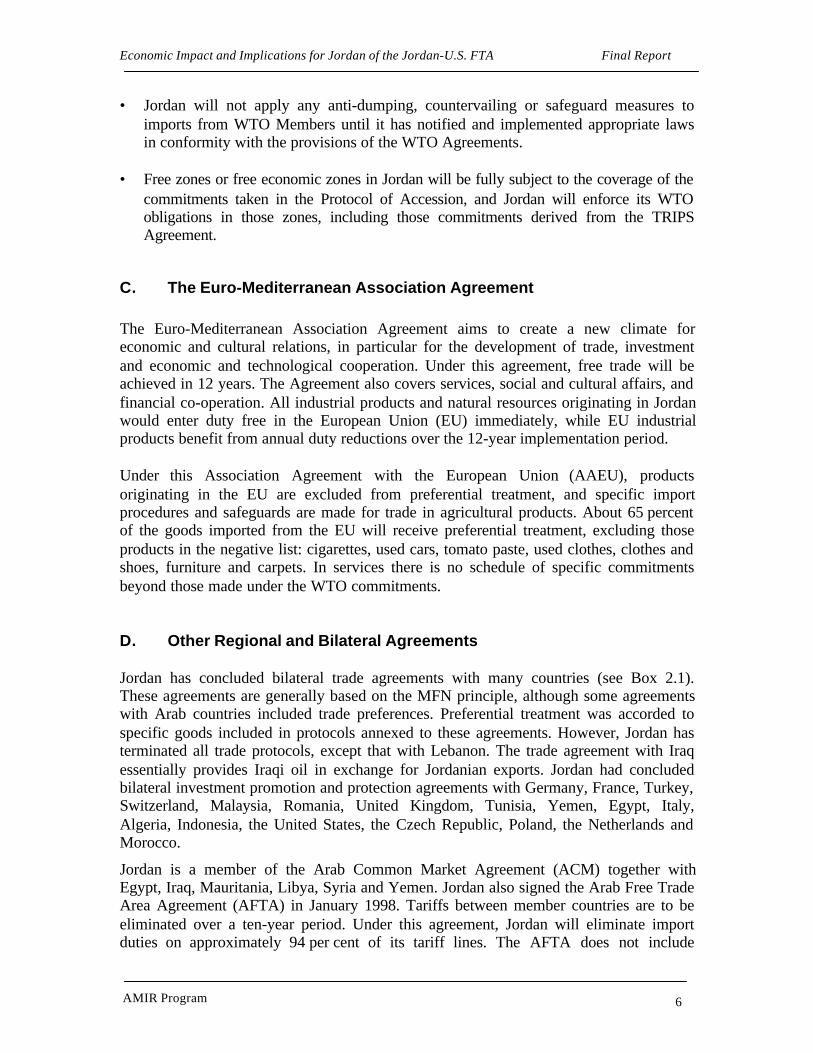
List of Tables
3.1 Jordan’s Structure of Trade with World and United States by HS Chapter, 1999..83.2 Jordan’s Geographic Distribution of Exports, 2000................................................93.3 Jordan’s Major Merchandise Exports to the United States, 1999.........................104.1 Jordan’s 2001 MFN Applied Tariffs.....................................................................114.2 Economic Activity of QIZs, as of September 2000 ..............................................144.3 U.S. Tariffs by MFN Rates and Preferential Schemes, 2000................................185.1 Revealed Comparative Advantage of Jordan and Other Middle East Countries
in World Market ...................................................................................................215.2 Revealed Comparative Advantage of Jordan and Other Middle East Countries
in U.S. Market ......................................................................................................225.3 Real Cross-Rate Indices of Selected Middle East Currencies with
U.S. Dollar, 1991-2000 .........................................................................................235.4 International Competitiveness of Selected Middle East Countries in
U.S. Market, 1991-2000........................................................................................245.5 Comparative Competitive Indicators of Jordan and Other Middle East
Countries: Macro Dynamics..................................................................................255.6 Comparative Competitive Indicators of Jordan and Other Middle East
Countries: Infrastructure and Investment Climate ................................................266.1 Indices of Trade Compatibility..............................................................................296.2 U.S. Tariffs on Selected Jordanian Exports ..........................................................347.1 Impact of U.S.-Jordan FTA on Sample of Jordan's Exports .................................398.1 Jordan: Top Imports from the United States .........................................................438.2 Tariffs and Two-Way Trade in Jordan's Major Imports from the United States..478.3 Jordan's Exports of Furniture by Type, 1994-99...................................................488.4 Jordan’s Effective Rate of Protection in the Furniture Industry...........................489.1 Jordan’s Services Account in the Balance of Payments, 1995-2000....................519.2 Jordan and U.S. GATS Commitments, by Sector.................................................55B.1 Jordan and U.S. GATS Commitments, by Sector.................................................65B.2 U.S. Jordan FTA Commitments versus Jordan’s GATS Commitments...............69
List of Boxes
2.1 Preferential Treatment Granted Under Jordan’s Bilateral Agreement ....................74.1 Options for Meeting Value-Added Requirement in QIZs.....................................134.2 Main Differences Between QIZs and the US-Jordan FTA...................................156.1 Export and U.S. Market Performance of Jordan’s Large-Size Exports ................306.2 Export and U.S. Market Performance of Jordan’s Medium-Size Exports ...........316.3 Export and U.S. Market Performance of Jordan’s Small-Size Exports ................326.4 Export and U.S. Market Performance of Jordan’s Emerging Exports..................32

Economic Impact and Implications for Jordan of the Jordan-U.S. FTA Final Report
AMIR Program vi
Acronyms and Abbreviations
AAEU Association Agreement with the European UnionAFTA Arab Free Trade AgreementAMIR Access to Microfinance and Improved Implementation of Policy
Reform (Program)ATC Agreement on Textiles and ClothingBAI Business Association InitiativeBDV Brussels Definition of ValueCBI Caribbean Basin InitiativeEPZ Export processing zoneERP Effective rate of protectionEU European UnionFOB Free on boardFDI Foreign direct investmentFEER Fundamental equilibrium exchange rateFTA Free trade agreementFTAA Free Trade Agreement of the AmericasFTZ Free trade zoneGATS General Agreement on Trade in ServicesGATT General Agreement on Tariffs and TradeGDP Gross domestic productGDP Gross domestic productionGSP Generalized System of PreferencesHS Harmonized SystemIATA International Air Travel AssociationIMF International Monetary FundIPR Intellectual property rightsIT Information technologyITA Information Technology AgreementMFA Multi-Fibre ArrangementMFN Most Favored NationNAFTA North American Free Trade AgreementNRP Nominal rate of protectionNTBs Non-tariff barriersNTMs Non-tariff measuresPTA Preferential trade arrangementsPTMs Para-tariff measuresQIZ Qualified Industrial ZoneRCA Revealed comparative advantageREER Real effective exchange rateSEZ Special Economic ZoneSITE Society of Incentive Travel ExecutivesSMEs Small and medium size enterprisesSOEs State-owned enterprises

Economic Impact and Implications for Jordan of the Jordan-U.S. FTA Final Report
AMIR Program vii
TCMs Trade control measuresTRIPS Trade-Related Intellectual Property RightsTRQ Tariff-rate quotaUNDP United Nations Development ProgramUSAID United States Agency for International DevelopmentUSDA US Department of AgricultureUSITC US International Trade CommissionUSFDA US Food and Drug AdministrationWATA World Air Transport AssociationWIPO World Intellectual Property Rights OrganizationWTO World Trade Organization

Economic Impact and Implications for Jordan of the Jordan-U.S. FTA Final Report
AMIR Program viii
Executive Summary
Background
On October 24, 2000, the Hashemite Kingdom of Jordan (Jordan) and the United Statessigned the U.S.-Jordan Free Trade Agreement (FTA). The Jordanian business communityand the Government of Jordan are eager to encourage exports of goods and services tothe United States and attract foreign direct investment (FDI) and its accompanyingtechnological transfer. In response to this interest, the Jordan Trade Association (JTA)and the Jordanian American Business Association (JABA) have planned a series ofeconomic impact assessments and awareness campaigns aimed at the educating thebusiness community on the U.S.-Jordan FTA. In support of these initiatives and those ofthe Government of Jordan in promoting trade and investment, the Access to Microfinanceand Improved Implementation of Policy Reform (AMIR) project has undertaken thepresent study in consultation with USAID. The objective is to review the U.S.–JordanFTA and assess its impact on trade in goods and services of the Hashemite Kingdom ofJordan (Jordan), with a view to examining the following specific areas:
(1) The comparative advantage of Jordan in exports of goods and services tothe U.S. market, relative to other countries in the Middle East region.
(2) The effect of FTA-related tariffs, rules of origin, and other market accessconditions on Jordanian exporting companies.
(3) The impact of the FTA on the bilateral trade in services between Jordanand the United States.
The study was conducted during January–February 2001 and is based on fieldwork thatincluded interviews with private and public sector officials in Jordan. It also draws on theextensive literature on the current wave of preferential trade arrangements, particularlythat dealing with the impact of free trade agreements on participating countries.
Jordan’s Trade and Tariff Structure
Jordan’s major exports are in the form of natural resource based products, of whichchemical products and mineral products together account for nearly one-half of totalexport revenue. In contrast, imports are heavily concentrated in transportation equipment,machinery and electrical equipment and mineral products, mainly in the form of iron andsteel. Overall, the magnitude of these imports is twice as large as those of exports.Jordan’s structure of trade with the United States is considerably different from that withthe rest of the world, which reflects each country’s comparative advantage in the other’smarket. Jordan’s major export to the U.S. is transport equipment (60 percent of the total),which mainly reflects the re-export of aircraft and parts. Articles of jewelry plated with

Economic Impact and Implications for Jordan of the Jordan-U.S. FTA Final Report
AMIR Program ix
gold make up the second largest export category (9 percent of the total), followed byarticles of apparel and carpets (7 percent of the total) in the third largest category.
On the import side, cereals represent the largest U.S. import of Jordan, representingnearly one-fourth its total imports. Two other important categories are transportequipment, mainly in the form of aircraft parts, and machinery and electrical equipment,primarily in the form of machinery parts and data processing equipment. Othersignificant, albeit smaller, categories include prepared foods and tobacco, chemicalproducts, vegetable fats and oils and optical equipment.
In April 2000 Jordan became a member of the WTO and committed to bind most of itstariffs at a 20 percent ceiling by the year 2010. Jordan’s current tariff schedule is fairlytransparent at the Harmonized System (HS) section level with relatively few tariff rates,but it has widely varying rates within each product category. The schedule has six advalorem rates of 0, 5, 10, 20, 30 and 40 percent, with a mean unweighted average rate of16 percent. The rates will be gradually reduced over the present decade to meet the WTOcommitments. In services, Jordan commitments covered the majority of services sectors,but there are a number of exemptions in each sector that represent legal and regulatorybarriers to trade.
U.S. Tariff Preferences and QIZs
The United States MFN tariff schedule comprises nearly 14,000 tariff lines having anunweighted average of 6 percent. In practice, however, the actual tariff rates applied byindustrialized countries to products originating from Jordan and other developingcountries are usually less than the MFN rate because of tariff preference schemes like theGeneralized System of Preferences (GSP) and other preferential trade arrangements(PTAs). The United States currently extends duty-free treatment to imports under theNorth American Free Trade Agreement (NAFTA), the US-Israeli Free Trade Agreement,the Caribbean Basin Initiative (CBI), the Andean Initiative, and the upcoming U.S.-Jordan Free Trade Agreement. Plans for other regional arrangements, including one inthe Asia Pacific region, are underway.
The other important tariff preference for Jordan is that provided by the QualifyingIndustrial Zone (QIZ) scheme, which was formalized by the United States-Israel FreeTrade Area Implementation Act (IFTA) of 1985. The system allows articles to beimported duty free into the United States that are produced in the West Bank, Gaza Stripand QIZs between Israel and Jordan and between Israel and Egypt. The Jordanian-IsraeliJoint Committee, created under the first zone, identifies businesses located within theQIZs that involve substantial economic cooperation between those two countries. It alsoidentifies goods processed in the zones for duty-free and quota-free entry into the UnitedStates if the products meet the requirement of adding value in the zones, Israel, the WestBank and Gaza Strip of no less than 35 percent of the total appraised value of the product.

Economic Impact and Implications for Jordan of the Jordan-U.S. FTA Final Report
AMIR Program x
At first glance, it might appear that the establishment of the FTA would compete with theQIZs and the free zones in attracting investments. One of the key differences betweenQIZs and the FTA is the duty-free and quota-free status (see Boxes S1). Under the QIZ,exported goods (as long as they meet the local content requirement) are duty-free andquota-free; under the FTA, some products will enjoy immediate elimination of duties andothers will have to wait ten years. Therefore, some companies could find an investment tobe more attractive under the QIZ concept rather than waiting until the FTA is ratified.
Input requirements are another key issue in examining the differences between QIZs andthe FTA. Under the QIZ, production of goods is subject to an 11.7 percent Jordanianinput; under current negotiations of the FTA, Jordanians alone should provide theminimum 35 percent value added for each product. The input requirement thereforeallows investors a choice, which in part may be influenced by political considerations.Lastly, the QIZ is a designated area with existing infrastructure, while the FTA iscountry-wide, a distinction that can influence investor preferences in determining whatpreferential system to adopt.
Jordan’s Comparative Advantage
Jordan’s endowment of natural resources and human capital has allowed exporters todevelop a relatively high productivity in natural resource and human resource-intensiveproducts. However, Jordan and other Middle East countries generally have a comparativeadvantage in similar product categories, implying a low level of complementaryopportunities that could induce a strong expansion in intra-regional trade within the MiddleEast. In trade with the United States, Jordan and the selected other Middle East countrieshave a similar pattern of comparative advantage. For example, in natural resource-intensiveproducts, Jordan continues to have a clear comparative advantage in manufacturedfertilizers, as do Morocco, Tunisia and, to a lesser extent, Israel and Egypt. Among unskilledlabor-intensive products, Jordan and all other Middle East countries have a comparativeadvantage in footwear, clothing and textile yarn. Jordan is the only country in the regionwith a comparative advantage in furniture in the U.S. market. Among the human capital andtechnology-intensive products, Jordan again shares a comparative advantage with otherMiddle East countries in all but one product.
The similarity of export performances across product divisions for Jordan and other MiddleEast countries suggests that, by developing cross-border production facilities and benefitingfrom economies of scale, exporters could improve their export performance in the worldmarket, and the U.S. market in particular. For this expansion to happen, however, problems
Box S1Main Differences Between QIZs and the US-Jordan FTA
QIZs FTADuty and Quota-Free Status Exported goods are duty and quota-free Schedule of elimination of duties to be
completed over 10 yearsActivities Covered Only industrial activities Industrial activities and servicesLegal Framework US-Israel FTA US-Jordan FTAInput Requirements 11.7% Jordanian 35% Jordanian under current
negotiationsDesignated areas Defined areas within the country Entire country

Economic Impact and Implications for Jordan of the Jordan-U.S. FTA Final Report
AMIR Program xi
of sufficient capital required to upgrade processing techniques will need to be overcome.The ability and willingness of businesses to enter into joint ventures will naturally dependon comparative production costs between the countries, economic policies and theregulatory environment, and p olitical issues.
Jordan’s International Competitiveness
Jordan’s export competitiveness depends on its exchange rate competitiveness, labor andinfrastructure costs, financial conditions, and trade policies. Unfortunately, Jordan’sexchange rate policies and a gradually widening differential between inflation rates inJordan and the United States have driven up the real cross rate of the dinar (JD) againstthe dollar.1 The real cross rate rose by nearly 6 percent between 1995 and 1998, whilethat of most other Middle East countries fell. Despite the subsequent stabilization of theJD between 1999 and 2000, the real cross-rates of Israel, Tunisia and Morocco havecontinued to fall in the last three years, which has further weakened the competitiveposition of Jordan relative to those countries in the U.S. market (Table S1).
The loss of Jordan’s export competitiveness has been especially severe in WesternEurope and Asia, since the Euro and most of the currencies in Asia have depreciatedrelative to the US dollar. In addition to the loss of export competitiveness, theappreciation of the JD has stimulated imports, and undermined a recovery in domesticproduction, employment and fiscal revenue because of the loss of domestic profitabilityof production.
Our attempt to compare factor costs of Jordan with other Middle East countries washampered by the lack of data. We have therefore used information from the WorldBank’s World Development Indicators for Jordan and other selected Middle Eastcountries. Not surprisingly, Jordan is not competitive in its exports relative to most otherMiddle East countries, but its macro dynamics are favorable and there are mixed resultson its infrastructure, investment climate and human resource capacity.
1 The real cross rate is the nominal bilateral exchange rate adjusted for relative movements in the nationalprices of Jordan and a partner country (the United States). As such, an increase in the index reflects anappreciation or revaluation and a decline denotes a devaluation or depreciation.
Table S1International Competitiveness of Selected Middle East Countries in U.S. Market, 1991-2000(1995 = 100)
1991 1992 1993 1994 1995 1996 1997 1998 1999 2000
Jordan 98.9 97.8 99.4 99.3 100.0 97.8 97.2 94.5 94.8 94.5
Egypt 131.8 126.5 117.3 112.3 100.0 96.0 93.8 91.4 90.9 90.2
Israel 103.9 103.1 110.1 107.0 100.0 98.0 99.5 105.6 111.7 113.4
Morocco 113.1 108.0 115.2 111.2 100.0 102.0 113.1 112.5 116.6 120.5
Tunisia 107.0 99.6 112.0 110.5 100.0 102.1 114.6 116.2 118.9 119.7
Turkey 89.1 89.0 88.1 118.2 100.0 101.3 104.2 98.4 97.9 97.9Note: An increase in the index reflects an improvement in the competitiveness; a fall reflects a loss of competitiveness.Source: Calculated from the inverse of the real cross exchange rates for each country.

Economic Impact and Implications for Jordan of the Jordan-U.S. FTA Final Report
AMIR Program xii
Jordan’s Export Compatibility with the U.S. Market
Comparative advantage analysis is limited to static concepts since in reality countries likeJordan alter their situations by adopting new technologies either internally throughresearch and development, or externally through FDI and the development of cross-border production facilities. We have therefore used an alternative approach adoptedfrom business economics that explains cross-country differences based on the degree ofconcentration or so-called agglomeration of industries. By changing the manufacturingproduction base of countries, PTAs at the regional level and FTAs at the bilateral levelcan help to alter and accelerate the development process of countries.
In the context of the U.S.-Jordan FTA, the central indicator of Jordan’s ability to shift itscomparative advantage is the degree of trade compatibility between its export structureand that of the United States. Having established compatibility of traded products, we canthen invoke performance indicators to reveal the extent to which firms competeeffectively in world and regional market. Success in export markets – measured byrapidly expanding exports and rising market shares – indicates the extent to which aneconomy is willing and able to achieve global integration and alter its comparativeadvantage in the global marketplace.
We have examined Jordan’s trade compatibility with the United States from the point ofview of its exports, and use a set of performance indicators to identify those products thatcould benefit from the U.S.-Jordan FTA. In particular, we used the following criteria toselect the products with growth potential in the US market: (a) the degree of tradecompatibility between Jordan and the United States, (b) Jordan’s recent export growthrecord, and (c) the trend growth rate of Jordan’s product market share.
The analysis of trade compatibility and export performance concentrates on the followingtypes of products: (1) domestic exports of Jordan (excludes re-exports); (2) productaggregation at the 4-digit HS level (disaggregation at the HS 6-digit level yieldedexcessively high year-to-year variations and therefore poor trend performanceindicators); and (3) data analysis based on the period 1994-99, with the product selectionprocedure based on 1997-99 data. Jordan’s exports were divided into the following fourtypes of product exports: Large traditional product domestic exports, defined as thoseproducts that in 1999 represented at least JD5 million (there were 41 products in thisrange); medium-size domestic exports, whose product export value represented betweenJD1 million and JD5 million (53 products in this range); small-size domestic exports ofbetween JD500,000 and JD1 million (44 products in this range); newly emergingdomestic exports of between JD250,000 and JD500,000 (38 products in this range).Using these value ranges, the total number of products in the sample consisted of 176products out of a total of 613 products.
The trade compatibility index measures the degreeof compatibility between Jordan’s exportedproducts and those products imported by the UnitedStates. The index approaches zero when Jordan
Table S2Indices of Trade Compatibility
Jordan Exports Index
Large-Size 0.33
Medium-Size 0.42
Small-Size 0.34
Emerging Exports 0.63

Economic Impact and Implications for Jordan of the Jordan-U.S. FTA Final Report
AMIR Program xiii
exports none of what the United States imports, and it approaches unity when the exportshare of a product of Jordan is identical to the import share of that product by the UnitedStates. Overall, the unweighted average of the four product categories for Jordan’sexports and U.S. imports equals 0.43, which lies between the index of trade betweenLatin American countries and that of trade between the developed countries (Table S2).
Within these four categories, it is the emerging export products of Jordan that have thehighest degree of trade compatibility with the United States. This category includes abroad set of products that ranges from Dead Sea cosmetics to batteries, orthopedicappliances, blankets and travel rugs, and machinery for sorting and screening mineralsubstances. Jordan’s traditional exports are generally less compatible with U.S. foreignneeds, but at the product level there are a number of products that are compatible withU.S. import requirements: apparel and clothing accessories, aluminum bars and rods,animal feed, and insecticides. There are also a large number of products that are highlycompatible with U.S. import requirements among the small and medium size exports ofJordan: olive oil, luggage, pharmaceuticals, household appliances, ceramic sinks andwash basins, paints and varnishes, articles of jewelry, tarpaulins and awnings, machineryfor plant or laboratory equipment, tableware and kitchenware, electric accumulators, fruitand vegetable juices, chocolate and antibiotics.
Potential FTA Impact on Jordan’s Exports
Jordan’s ability to affect its market position based on the competitiveness of its productsin the U.S. market has been measured by the trend growth rate of product exports and theratio of product exports relative to U.S. imports of those products. The competitiveness offirms and industries in the world market and in that of the U.S. market in particular isreflected in high rates of export growth and rising market shares. Following the approachused by the World Bank, the export performance of Jordan has been classified into thefollowing four categories: (1) rising stars, i.e., products in which Jordan has a risingmarket share and U.S. imports are expanding; (2) falling stars, i.e., products in whichJordan has a rising market share but U.S. imports are contracting; (3) missedopportunities, i.e., products in which Jordan has a falling market share despite expandingU.S. imports; and (4) retreat, i.e., products in which Jordan’s market share is falling andU.S. imports are contracting.
The results of the analysis show that for Jordan the most desirable products are the risingstars and missed opportunity products, and most of Jordan’s exports in our sample fallwithin these two categories. These are the nearly 100 Jordanian products whose marketshares have been rising at the same time that U.S. imports have been expanding (i.e., therising stars), or those products whose market shares have been falling despite expandingU.S. imports (i.e., the missed opportunities). Of these products, none have tariffs in theUnited States that exceed 20 percent. Thirteen products have U.S. tariffs in the 10-20percent range; 18 products have tariffs in the 5-10 percent range; 42 products have tariffsunder 5 percent; and 21 products have no tariffs.
We have calculated the hypothetical impact on US$100,000 worth of exports from Jordanto the US market for each of the 94 products that are either rising stars or have

Economic Impact and Implications for Jordan of the Jordan-U.S. FTA Final Report
AMIR Program xiv
experienced missed opportunities in recent years. As expected, the largest gains wouldaccrue to those products that currently face relatively high tariffs. The gain in exportrevenue from these products currently facing tariffs of 10 to 20 percent ranges from 3 to 5percent a year over the 5-year period of tariff reductions, and it averages 3.7 percent ayear for the increased export value of all of these products during that period. For thoseproducts currently facing tariffs in the range of 5 to 10 percent, the export revenue gainwould equal 2 to 3.5 percent a year over a four year period, and average 2.5 percent ayear for their combined value during that period. Finally for those products currentlyfacing tariffs in the 0 to 5 percent range, the annual gain in revenue would range between0.1 to 3.6 percent over a two-year period.
Given the timeline of the tariff reduction schedule, export revenue changes from tariffs inthe 10 to 20 percent range are likely to be more beneficial to Jordan than if confrontedwith tariffs in excess of 20 percent in any of the 94 products. Sensitivity analysis on theselected products showed that the net present value of the potential flow of futurerevenue from the FTA would be higher for the medium-to-low tariff products having ashorter implementation period than those products with high-tariffs having a longerimplementation period. For example, the estimated net present value of the additionalrevenue for Jordanian cheese and curd exports to the United States under the existing 19percent tariff was nearly 20 percent higher than for a hypothetical export facing a 25percent tariff in the U.S. market. The fact that the FTA will eliminate tariffs on arelatively fast track for the types of products exported by Jordan will therefore be morebeneficial to exporters than if they faced high tariffs in the United States.
Rules of Origin
Jordan’s exports to the U.S. market under the FTA are subject to rules of origin thatrequire that the sum of the cost or value of the materials produced in Jordan plus theirdirect processing costs be no less than 35 percent of the value of the product exported tothe United States. The Industrial Development Department of the Ministry of Industryand Trade study on the rules of origin of the U.S.-Jordan FTA demonstrated that mostJordanian businesses qualify for preferential treatment. In the short run, these rules oforigin can raise the cost of industries trying to meet the requirements by shifting to highercost inputs from domestic sources. The FTA may therefore be trade diverting if there is ashift from lower to higher cost sources of supply, rather than having the desired effect ofbeing trade creating by shift production from higher to lower cost sources of supply. Inthe long run the effects are highly dependent on the form of the structure of the industryand its market.
In addition to these requirements, there are regulations affecting access to the U.S.market. These regulations cover product standards and testing and certificationprocedures in general, phytosanitary requirements for agricultural products, and U.S.Food and Drug Administration (USFDA) requirements for pharmaceutical products.

Economic Impact and Implications for Jordan of the Jordan-U.S. FTA Final Report
AMIR Program xv
Potential FTA Impact on Jordan’s Imports
Jordan currently obtains about 10 percent of its total imports from the United States, andthose imports are concentrated in a relatively few number of products. The top 36products account for over two-thirds of total imports from the United States and, of these,14 products account for one-half of all imports. The extent to which Jordanian businesseswill be affected by the U.S.-Jordan FTA impact will depend on the magnitude of existingprotection from foreign competition, as well as the effect that bilateral trade liberalizationwill have on the cost of their inputs.
For Jordan about one-half of its major imports from the United States occurs in productsin which it has significant two-way trade. This so-called intra-industry trade (IIT) ishighest in cigarettes, vegetable fats and oils, tractor parts, refrigerators, sunflower seedand oil, dryers, furniture and orthopedic appliances. There is no two-way trade in wheat,aircrafts and their parts, rice, corn, chemical wood pulp, automated data processingmachines and automobiles. Of those products having high IIT indices, vegetable fats andoil imports from the United States are not expected to increase significantly, since exportshave been entering Jordan under U.S. Government export assistance program GSM102/103 (U.S. credit Guarantee programs) and Public Law 480 (food aid).
The United States International Trade Commission (USITC) has also identified specificU.S. exports that might increase their penetration of the Jordanian market as a result ofthe FTA. Of the other products examined by the USITC, little if any penetration into theJordanian market is expected for crude petroleum, fertilizers, jewelry, phosphates andpotash. Negligible penetration is expected in citrus fruit and juices, vegetables, liveanimals, nuts, and textile and apparel (mainly in the form of artificial filament and cottonand manmade fiber fabrics).
To the extent that the U.S.-Jordan FTA eliminates tariffs on inputs and their finalproducts, it will tend to favor more efficiently produced goods whether produceddomestically or in the United States, and it will raise consumer welfare. Perhaps moreimportantly, it will liberate valuable resources from less productive sectors for use inJordan’s true comparative advantage industries. Under these circumstances, it is useful toexamine the magnitude of protection of industries and their value added under bothexisting levels of protection and bilateral free trade with the United States. The extent ofthis protection can be measured by the effective rate of protection (ERP).
In contrast to the nominal rate of protection (NRP) that measures the extent of protectionby the difference between the border price of foreign-made products and the price ofdomestic import-substitutes made by local producers, the ERP measures the increase invalue-added of the protected industry over value added of that same industry measured interms of border prices. Analysis of ERPs across industries can show how Jordan’s presenttariff structure influences the production and the distribution of benefits and costs amongthe Jordanian industries and consumers, as well as the extent to which the U.S.-JordanFTA is likely to shift the existing tariff-induced bias away from import substitution toexport expansion and investment in the production of non-tradables. The analysis,

Economic Impact and Implications for Jordan of the Jordan-U.S. FTA Final Report
AMIR Program xvi
however, requires the application of technical coefficients of production derived frominput-output (IO) tables to the total value of the tradable material inputs. Since an IOtable for Jordan does not exist, we have limited the present analysis to an illustrativeproduct (furniture) for which technical coefficients of production can be constructed fromother available IO tables.
The ERP calculations for Jordan’s wood furniture industry demonstrate the extent towhich the industry will be susceptible to foreign competition when protection to theindustry is eliminated. Although tariffs on the industry’s two major inputs, sawn woodand veneer wood and plywood, are zero, there are high tariffs on the more processedcarpentry wood, paints and hardware, woven fabrics and textiles, and moderate tariffs onchemicals, tools, leather and oils. Overall, the trade-weighted average of these tariffs isover 5 percent for inputs. As a result, the estimated ERP for furniture is nearly 50 percentin Jordan, which is somewhat less than in the example where the industry was subject toa 30 percent tariff on the final good but there were no tariffs on inputs. Still, the industryin Jordan is heavily protected and it probably diverts resources away from the country’strue comparative advantage industries.
Potential FTA Impact on Jordan’s Services Trade
The service sector contributes over 70 percent of Jordan’s total output, measured by thegross domestic product (GDP). Within this sector, the leading industries are finance,insurance, real estate and business services, contributing over 20 percent of the country’stotal output, and transport and communications, contributing 18 percent. The tradeindustry, which covers tourism, hotels and restaurants, contributes another 12 percent.Demand for all these services tends to be highly income-elastic since consumption ofservices such as tourism, education and health has expanded more rapidly than demand formanufacturing goods and agricultural products. While the share of services in Jordan’sforeign trade has also risen rapidly, its share relative to total trade has been smaller than indomestic production and employment. Overall, services trade contribute one-half of totalreceipts from goods and services, and account for one-third of total payments for goodsand services. The services balance has been positive and growing, which has helped tooffset the large merchandise trade deficit.
Under the U.S.-Jordan FTA, negotiations have been facilitated by the mutual recognitionagreements for trade liberalization in services under the General Agreement on Trade inServices (GATS). Unlike the Euro-Mediterranean Partnership agreement between the EUand Jordan that simply makes reference to the multilateral obligations of participatingcountries under the GATS, under the U.S.-Jordan FTA a broad range of services will beliberalized on the basis of the U.S. and Jordan’s existing commitments to the GATS. Inthe U.S. schedule there are relatively few exemptions on specific service sectors and, as aresult, Jordan already enjoys near complete access to the U.S. services market.
Jordan, however, has limited access under its GATS commitments in all of its servicesectors. Of the sectors where Jordan has made GATS commitments, it has a total of 222

Economic Impact and Implications for Jordan of the Jordan-U.S. FTA Final Report
AMIR Program xvii
exemptions across both horizontal commitments and sector-specific commitments forlimitations on both market access and national treatment. In contrast, the United Stateshas 93 exemptions in these areas and most of these are related to the temporary entry andstay of persons in the United States under its horizontal commitments. These exemptionsare time-bound, lasting no longer than ten years after joining the WTO, and are subject toperiodic review and negotiation in subsequent trade liberalizing rounds.
Under the FTA, Jordan will expand its commitments to liberalize services trade with theUnited States by amending its laws and regulations over a three-year period. Under theseconditions, there will be little distinction between international and domestic liberalizationsince external and internal market openings will parallel one another to ensure thatpersisting internal barriers do not contravene the potential benefits of more liberal accessconditions. Since the FTA covers liberalization of all trade in services, the changes willopen the Jordanian service industries to U.S. companies, especially in tourism, transportservices, health and financial services – the largest service sectors, as well conventionservices, printing and publishing, courier services, audiovisual, education andenvironmental.
The impact on Jordan’s economy is expected to be substantial. While the costs associatedwith great U.S. access to the Jordanian service sectors will be reflected in the servicesaccount of the balance of payments, there are more widespread benefits anticipated fromimprovements in the quantity of investment and the expertise required to up-grade andoperate Jordan’s services sectors such as telecommunications. Moreover, earlyliberalization under the FTA will contribute substantially to the country's locationattractiveness for new investment in modern services industries, and the globalisation ofJordan’s service sectors.
In the United States, service imports are generally free of tariffs, quotas, and othercommon trade barriers. Import impediments instead take the form of prohibitions orrestrictions on market access, which typically include licensing requirements andinvestment regulations, particularly in the transport, basic telecommunication andfinancial service industries. Fewer restraints are imposed on professional serviceindustries such as the accountancy, legal, architecture, and engineering service industries.For Jordan at least four or five sectors may prove relevant: tourism, softwaredevelopment, transport and, possibly, health services. In these areas, Jordan may a havea strong interest in expanding its access to the U.S. market through the FTA.
Summing Up
There are three central findings. First, the FTA will open many opportunities of Jordan toexpand its exports to the U.S. market. The greatest opportunities will occur in theemerging export products that have the highest degree of trade compatibility with theUnited States. These products include Dead Sea cosmetics, orthopedic appliances, rugsand machinery. Although Jordan’s traditional exports are somewhat less compatible withU.S. foreign needs, there are nevertheless opportunities in such products as apparel andclothing accessories, aluminum bars and rods, animal feed and insecticides. Among thesmall and medium size exports, there will be opportunities in such wide-ranging products

Economic Impact and Implications for Jordan of the Jordan-U.S. FTA Final Report
AMIR Program xviii
as olive oil, luggage, pharmaceuticals, household appliances, ceramic sinks and washbasins, paints and varnishes, jewelry, awnings, kitchenware, fruit and vegetable juices,chocolate and antibiotics. Jordan’s ability to exploit these opportunities will depend onseveral key factors determining its international competitiveness. Its macro dynamics arefavorable to investment, but there are mixed reviews on its factor and infrastructure costs,and recent movements in the real exchange rate has undermined Jordan’s competitivenessrelative to nearly all other Middle Eastern countries.
Second, U.S. exports to Jordan are expected to grow substantially as a result of the FTA.Since there is a large amount of two-way trade in many traded products, the eliminationof trade barriers between Jordan and the United States will favor the most efficientproducers. In Jordan, inefficient industries with particularly high levels of protection willbe most vulnerable, and the FTA will liberate valuable resources from less productivesectors for use in Jordan’s true comparative advantage industries. These industries can beidentified from the two-way trade calculations provided by this study, along withestimates of each industry’s effective rate of protection. Our estimate of the ERP for thefurniture demonstrates that the level of protection in this one industry is larger thansimple nominal rates of protection would reveal. This type of information would bevaluable to both the private and public sectors in adjusting to the FTA.
Third, expectations about the FTA effects on services trade are supported by the findingsof this study. Calculations of the proportion of market access constraints on individualservice sectors show that Jordan’s sectors are considerable more protected. The FTA willtherefore open more new opportunities for U.S. businesses in Jordan than for Jordanianbusinesses in the United States. While these service inflows will lower Jordan’s currentsurplus in the services account, they will bring with them much needed FDI associatedtechnological transfers and provide other types of externalities to the Jordanian economy.Recognition of these changes will help Jordanian businesses adjust and exploit these newopportunities under the FTA.
Finally, the present study has pointed to a number of areas that should be examined ingreater detail by the Jordanian business community:
Jordan’s International Competitiveness – Comparative factor and infrastructure cost datafor Jordan and other Middle East countries are essential for gauging the competitivenessof industries in the U.S. and global markets. While the limited timeframe of the presentstudy hampered data collection, such data would be useful to both the public sector informulating policies and the private sector in determining investment opportunities.Moreover, it would help to identify likely areas of FDI inflows into the country.
FTA Impact on Jordan’s Effective Rates of Protection – In order to gauge the impact ofthe FTA on Jordan’s import-competing industries, the analysis of effective rates ofprotection conducted in this study for furniture could be extended to other Jordanianindustries. It is possible to derive the technical coefficients of production from selectiveinterviews with businesses in the leading industries that are likely to compete with U.S.

Economic Impact and Implications for Jordan of the Jordan-U.S. FTA Final Report
AMIR Program xix
imports and benchmarking the results with other IO tables. Future work in this areawould be valuable to Jordanian businesses in gauging their competitiveness.
Export Revenue Gains from the FTA and Output and Employment Effects – The exportrevenue gains to Jordan from the FTA calculated in the present study are intended to beprimarily illustrative. Further detailed estimates of the potential revenue gains usingstatistically estimated price elasticities would provide more realistic estimates of possiblerevenue gains, as would economy-wide estimates of the dynamic effects of the FTA onoutput and employment of industries.
FTA Rules of Origin and Their Trade-Creating and Trade-Diverting Effects – In the shortrun, the rules of origin can raise the cost of industries trying to meet the requirements byshifting to higher cost inputs from domestic sources. The FTA may therefore be tradediverting if there is a shift from lower to higher cost sources of supply, rather than havingthe desired effect of being trade creating by shift production from higher to lower costsources of supply. In the long run, the effects are highly dependent on the form of thestructure of the industry and its market. Future work should examine these effects at theindustry level.
Regulatory Constraints in U.S. Market for Jordanian Service Exports – Although servicesimports into the United States are generally free of tariffs, quotas, and other commontrade barriers, import impediments in the form of prohibitions or restrictions on marketaccess will inhibit Jordan’s ability to access that market. The impediments typically takethe form of licensing requirements and investment regulations at the federal, state andlocal levels. Jordan’s interest in tourism, software development, transport and healthservices suggests the need for more detailed analysis of existing impediments in the U.S.market for these industries.

Economic Impact and Implications for Jordan of the Jordan-U.S. FTA Final Report
AMIR Program 1
Chapter 1: Introduction
A. Study Objective
This document represents the study conducted by the Business Association Initiative(BAI) component of the AMIR program to analyze the economic impact of the U.S.–Jordan Free Trade Agreement (FTA) on Jordanian business sectors. It assesses theeconomic impact on trade in goods and services of the Hashemite Kingdom of Jordan(Jordan) from the U.S.–Jordan FTA, with a view to addressing the following specificareas:
(1) The comparative advantage of Jordan in exports of goods and services to the U.S.market, relative to other countries in the Middle East region;
(2) The effect of FTA-related tariff loads, rules of origin, and other market accessconditions on Jordanian exporting companies, compared with other U.S. marketaccess agreements and mechanisms; and
(3) The impact of the FTA on the bilateral trade in services between Jordan and theUnited States.
The study was conducted in Jordan during January–February 2001 and is based onfieldwork that included extensive interviews with private and public sector officials in thecountry (see Annex C for a list of meetings conducted). It also draws on extensiveliterature of the current wave of preferential trade arrangements, particularly thosedealing with the impact of free trade agreements on participating countries.2
B. Approach and Organization of the Study
♦ Chapter 1 describes the objective and coverage of the study.
♦ Chapter 2 reviews Jordan’s existing multilateral, regional, and bilateral tradeagreements in the context of the U.S.–Jordan FTA.
♦ Chapter 3 describes the structure and geographic composition of Jordanian trade, andthe country’s commodity trade with the United States.
2 For a recent review of recent theoretical and empirical analysis of free trade agreements and otherpreferential trade arrangements, see Panagariya (2000).

Economic Impact and Implications for Jordan of the Jordan-U.S. FTA Final Report
AMIR Program 2
♦ Chapter 4 examines the tariff schedules of Jordan and United States, and Jordan’spreferential rates in its Qualifying Industrial Zones, and the United States’preferential tariffs.
♦ Chapter 5 analyzes the comparative advantage of Jordan and other Middle Easterncountries, and assesses key factors affecting Jordan’s overall competitiveness in termsof macroeconomic conditions, factor input costs, financial costs, and trade policies.
♦ Chapter 6 identifies high-growth Jordanian exports and their U.S. import growthrates, the U.S. import demand for selected products of Jordan, the anticipated effectof FTA-related tariff liberalization on Jordanian exports, and the rules of origin andother U.S. market regulations likely to affect Jordan’s penetration of the U.S. market.
♦ Chapter 7 examines the likely effect of the FTA on Jordan’s exports of services.
♦ Chapter 8 assesses the impact of the FTA on import competing industries byidentifying trade complementarities between Jordan and the United States, andmeasuring the effective rates of protection on those products.
♦ Annex A contains information on the methodology used in the empirical analysis.
♦ Annex B presents information on the U.S. and Jordanian commitments under both theFTA and the GATS.
♦ Annex C lists the meetings conducted.
♦ Annex D provides the references.

Economic Impact and Implications for Jordan of the Jordan-U.S. FTA Final Report
AMIR Program 3
Chapter 2: Trade Agreements
A. The U.S.–Jordan Free Trade Agreement
The U.S.-Jordan Free Trade Agreement (FTA), signed on October 24, 2000, willeliminate duties and commercial barriers to bilateral trade in goods and services betweenJordan and the United States. The FTA also includes separate sets of substantiveprovisions addressing trade and the environment, trade and labor, and electroniccommerce. Other provisions address intellectual property rights protection, balance ofpayments, rules of origin, safeguards and procedural matters such as consultations anddispute settlement.
Under the FTA, tariffs will be eliminated on virtually all trade between the two countrieswithin 10 years. Tariff reductions will occur in four stages: (i) current tariffs of less than5 percent will be phased out in two years, (ii) those that are now between and 5 and 10percent will be eliminated in four years, (iii) those between 10 and 20 percent will begone in five years, and (iv) those that are now more than 20 percent will be eliminated in10 years. Although there is no negative list, special arrangements exist for tariffreductions on sensitive products such as apples, poultry, tobacco and some tobaccocategories, cars and alcohol.
In services, Jordan already enjoys near complete access to the U.S. market, whereas itmaintains a number of restrictions in its own service market. Jordan’s commitmentsunder the GATS cover the majority of services sectors: from a total of 155 sub-sectors,classified within 12 sectors, Jordan made commitments in 144 sub-sectors. However,Jordan maintains a number of exemptions in all service sectors. Under the FTA, specificliberalization has been achieved in many key sectors in which Jordan had madecommitments, and new ones were introduced in the rail and internal waterways transportsub-sectors.
Electronic commerce is explicitly covered in the FTA. Jordan and the United Statescommitted to promoting a liberalized trade environment for electronic commerce thatshould encourage investment in new technologies and stimulate the innovative uses ofnetworks to deliver products and services. Both countries agreed to avoid imposingcustoms duties on electronic transmissions, imposing unnecessary barriers to marketaccess for digitized products, and impeding the ability to deliver services throughelectronic means.
The U.S.-Jordan FTA adopts the U.S.-Israel FTA rules of origin, whereby duty freeaccess to the U.S. market is allowed when the value of the product is at least 35 percent,of which up to 15 percent can be from the United States. Within six months of the entryinto force of the FTA, Jordan and the United States will enter into discussions on theextent to which the cost or value of materials that are products of a territory neighboring

Economic Impact and Implications for Jordan of the Jordan-U.S. FTA Final Report
AMIR Program 4
Jordan may be counted in the appraised value of a product when determining the 35percent content requirement.
The FTA provides protections for trademarks, copyrights, and patents, and specificallymentions the protection of software and pharmaceuticals, two categories of productswhose copyrights and patents are especially prone to violation. Among other things,Jordan has undertaken to ratify and implement the World Intellectual PropertyOrganization (WIPO) Copyright Treaty, and WIPO Performances and PhonogramsTreaty within two years.3 These treaties establish several critical elements for theprotection of copyrighted works in a digital network environment, including creator’sexclusive right to make their creative work available online.4
The FTA includes in the body of the agreement key provisions that reconfirm that freetrade and the protection of the rights of workers can go hand in hand. These provisionsreaffirm the parties' support for the core labor standards adopted in the 1998 InternationalLabor Organization's Declaration on Fundamental Principles and Rights at Work. Thecountries also reaffirmed their belief that is inappropriate to lower standards to encouragetrade, and agreed in principle to strive to improve their labor standards. Each side agreedto enforce its own existing labor laws and to settle disagreements on enforcement of theselaws through a dispute settlement process.
The FTA also includes a separate set of substantive provisions on trade and theenvironment, and trade and labor. Specifically, each country agreed to avoid relaxingenvironmental laws to encourage trade. The United States and Jordan affirmed theirbelief in the principle of sustainable development, and agreed to strive to maintain highlevels of environmental protection and to improve their environmental laws. Each sidealso agreed to a provision on effective enforcement of its environmental laws, and tosettle disagreements on enforcement of these laws through a dispute settlement process.Both countries are conducting environmental reviews, which were extremely useful indeveloping some of the provisions of the agreement.
The FTA contains safeguard measures to ensure that if the implementation of theagreement leads to “a substantial cause of serious injury, or threat thereof” to a domesticindustry, either country may temporarily suspend further tariff reductions on the affectedgoods. If either country decides to enact a safeguard measure, its duration cannot exceed4 years or the 10-year transitional period, and no measure shall be maintained “except tothe extent and for such time as may be necessary to prevent or remedy serious injury andto facilitate adjustment.” The FTA also recognizes the special challenges faced by “infantindustries” during a period of trade liberalization and that therefore neither countryshould create obstacles to “infant industries” that seek the imposition of safeguardmeasures.
3 For legal text and other IPR issues, see http://www.wipo.org
4 From the U.S.-Jordan FTA Fact Sheet at http://www.usembassy-amman.org

Economic Impact and Implications for Jordan of the Jordan-U.S. FTA Final Report
AMIR Program 5
Finally, the FTA provides for dispute settlement panels to issue legal interpretations ofthe FTA, but only if the countries have first consulted and failed to resolve thedispute. The process includes strong provisions on transparency. As in the Israel FTA, thereport of such dispute settlement panels is non-binding, and the affected country isauthorized to take appropriate measures if the parties are still unable to resolve a disputeonce a panel has issued its recommendations.
B. WTO Accession and Commitments
Jordan became a member of the WTO in April 2000. In addition to liberalizing trade ingoods and services, Jordan committed itself to comply with the WTO MultilateralAgreements on Trade Related Aspects of Intellectual Property Rights (TRIPS), CustomsValuation, Import Licensing Procedures, Technical Barriers to Trade, and Sanitary andPhytosanitary Measures.5
Tariffs are to be bound at a 20 percent ceiling by the year 2010, with the exception ofcertain items that are to be bound at 35 percent. Jordan’s tariff schedule has six advalorem rates: 0 percent, 5 percent, 10 percent, 20 percent, 30 percent and 35 percent.Tariff reductions will be implemented in March of every year. In services, Jordan’scommitments covered the majority of services sectors. From a total of 155 sub-sectors,classified within 12 sectors, Jordan made commitments in 128 sub-sectors.
Some of the key elements of Jordan’s accession commitments are as follows:
• Jordan will gradually remove price and profitability control measures placed on somecommodities with a view for eventual liberalization of all prices at the retail level.
• Provisions of international treaties or agreements will prevail if contradictions withJordanian laws arise.
• Jordan will levy no duties and charges on imports other than ordinary customs dutiesand fees and charges for services rendered.
• Exemptions on customs duties for certain imports by the ten state trading companieswill not be renewed once they expire.
• Jordan will not apply quantitative restrictions on imports.
• The engagement of a pre-shipment inspection service provider meeting therequirements of the Agreement on Pre-shipment Inspection would be ensured.
• Jordan will eliminate export subsidies by the end of 2002.
5 Jordan is currently negotiating commitments in the Government Procurement Agreement.
Economic Impact and Implications for Jordan of the Jordan-U.S. FTA Final Report
AMIR Program 6
• Jordan will not apply any anti-dumping, countervailing or safeguard measures toimports from WTO Members until it has notified and implemented appropriate lawsin conformity with the provisions of the WTO Agreements.
• Free zones or free economic zones in Jordan will be fully subject to the coverage of thecommitments taken in the Protocol of Accession, and Jordan will enforce its WTOobligations in those zones, including those commitments derived from the TRIPSAgreement.
C. The Euro-Mediterranean Association Agreement
The Euro-Mediterranean Association Agreement aims to create a new climate foreconomic and cultural relations, in particular for the development of trade, investmentand economic and technological cooperation. Under this agreement, free trade will beachieved in 12 years. The Agreement also covers services, social and cultural affairs, andfinancial co-operation. All industrial products and natural resources originating in Jordanwould enter duty free in the European Union (EU) immediately, while EU industrialproducts benefit from annual duty reductions over the 12-year implementation period.
Under this Association Agreement with the European Union (AAEU), productsoriginating in the EU are excluded from preferential treatment, and specific importprocedures and safeguards are made for trade in agricultural products. About 65 percentof the goods imported from the EU will receive preferential treatment, excluding thoseproducts in the negative list: cigarettes, used cars, tomato paste, used clothes, clothes andshoes, furniture and carpets. In services there is no schedule of specific commitmentsbeyond those made under the WTO commitments.
D. Other Regional and Bilateral Agreements
Jordan has concluded bilateral trade agreements with many countries (see Box 2.1).These agreements are generally based on the MFN principle, although some agreementswith Arab countries included trade preferences. Preferential treatment was accorded tospecific goods included in protocols annexed to these agreements. However, Jordan hasterminated all trade protocols, except that with Lebanon. The trade agreement with Iraqessentially provides Iraqi oil in exchange for Jordanian exports. Jordan had concludedbilateral investment promotion and protection agreements with Germany, France, Turkey,Switzerland, Malaysia, Romania, United Kingdom, Tunisia, Yemen, Egypt, Italy,Algeria, Indonesia, the United States, the Czech Republic, Poland, the Netherlands andMorocco.
Jordan is a member of the Arab Common Market Agreement (ACM) together withEgypt, Iraq, Mauritania, Libya, Syria and Yemen. Jordan also signed the Arab Free TradeArea Agreement (AFTA) in January 1998. Tariffs between member countries are to beeliminated over a ten-year period. Under this agreement, Jordan will eliminate importduties on approximately 94 per cent of its tariff lines. The AFTA does not include

Economic Impact and Implications for Jordan of the Jordan-U.S. FTA Final Report
AMIR Program 7
provisions on the application of non-tariff measures, but the implementation programprohibits the use of non-tariff measures such as quantitative restrictions and importlicensing for non-exempt and non-prohibited products.
Box 2.1Preferential Treatment Granted Under Jordan's Bilateral Agreements
Bilateralagreement with: Preferences Granted
Bahrain Free Trade Agreement.Algeria Free Trade Agreement.Egypt Free trade area by 2005. Customs duties and other equivalent
taxes are to be reduced by 10 per cent annually. Some 48products, representing 1,450 tariff lines at the six-digit level, aretemporarily excluded from the agreement. Agricultural productsalso will benefit from the tariff reductions, except for certain fruitsand vegetables, which are subject to seasonal restrictions.
Israel Ten per cent tariff reduction for 66 products originating in Israel.
Kuwait
Free movement for agricultural and livestock products. Customsduties and equivalent taxes reduced by 20 per cent annually forspecific industrial products
Libya Free movement for all products originating in both countries.Oman Free movement for agricultural, livestock and fish products.PalestinianAuthority
Duty free access for 60 products originating in the PalestinianTerritories.
Qatar
Mutual exemptions from customs duties for agricultural productsand natural resources. Lists of duty free industrial products to beestablished.
Saudi Arabia Duty free treatment for 166 products.
SudanCustoms duties exemptions for agricultural, livestock andindustrial products.
SyriaCustoms duties exemptions for agricultural, natural resourcesand industrial products.

Economic Impact and Implications for Jordan of the Jordan-U.S. FTA Final Report
AMIR Program 8
Chapter 3: Structure of Trade
A. Trade Structure and Flows
Jordan’s major exports are in the form of natural resource based products. Table 3.1 liststhe major export products by Harmonized System (HS) category in 1999. Ranked interms of export value to the world, chemical products (HS VI) and mineral products (HSV) together account for nearly one-half of the country’s export revenue. Machinery andelectrical equipment (HS XVI), vegetable products (HS II), transport equipment (HSXVII), textile and textile products (HS 11) each contribute between 5 and 10 percent ofthe total value of exports. Other important export categories that contributed between 2and 5 percent of the total export value are animal and vegetable fats and oils (HS III),base metals and their articles (HS XV), plastics (HS VII), and foodstuff preparations (HSIV). We will examine these exports in considerably more detail in Chapter 6.
Table 3.1Jordan’s Structure of Trade with World and United States by HS Chapter, 1999(Thousands of US dollars)
Exports Imports Balance
HS Description World U.S.A. World U.S.A. World U.S.A.
I Live animals; animal products 54,437 355 145,717 1,775 -91,280 -1,421
II Vegetable products 121,494 110 380,071 88,585 -258,577 -88,476
III Animal or vegetable fats and oils 69,594 267 63,908 18,670 5,685 -18,404
IV Prepared foodstuffs; beverages, spirits and vinegar; tobacco 51,083 994 223,555 25,310 -172,472 -24,316
V Mineral products 207,272 299 487,319 1,318 -280,046 -1,019
VI Products of the chemical or allied industries 677,577 1,071 381,417 23,250 296,160 -22,179
VII Plastics and articles thereof; rubber and articles thereof 56,434 201 155,440 4,540 -99,006 -4,339
VIII Raw hides and skins, leather, fur skins and articles thereof 7,903 2,568 2,532 72 5,371 2,496
IX Wood and articles of wood 2,054 7 38,357 1,296 -36,304 -1,290
X Pulp of wood or of other fibrous cellulosic material 63,195 15 92,507 10,850 -29,312 -10,835
XI Textiles and textile articles 103,176 3,078 197,364 8,322 -94,188 -5,244
XII Footwear, headgear, umbrellas 6,609 11 11,833 164 -5,224 -153
XIII Articles of stone, plaster, cement 24,688 57 49,477 1,120 -24,788 -1,064
XIV Natural or cultured pearls, precious or semi-precious stones 7,656 3,621 28,940 749 -21,284 2,871
XV Base metals and articles of base metals 61,193 1,352 265,819 9,616 -204,625 -8,264
XVI Machinery and mechanical appliances; electrical equipment 167,976 1,582 493,734 68,406 -325,758 -66,824
XVII Vehicles, aircraft, vessels and other transport equipment 105,633 25,276 517,320 73,411 -411,687 -48,135
XVIIIOptical, precision, medical instruments and apparatus 24,192 737 89,595 15,065 -65,403 -14,328
XX Miscellaneous manufactured articles 17,269 266 51,513 5,131 -34,244 -4,864
XXI Works of art, collectors' pieces and antiques 632 50 392 13 240 37
Unspecified 1,691 22 39,985 8,564 -38,294 -8,541
Total 1,831,759 41,936 3,716,794 366,227 -1,885,035 -324,291Source: Department of Statistics.

Economic Impact and Implications for Jordan of the Jordan-U.S. FTA Final Report
AMIR Program 9
The major export markets for these exports are theMiddle East and Asian regions, particularly India,Saudi Arabia, Iraq and the United Arab Emirates(Table 3.2). The North American and EuropeanUnion markets each absorb only 3 percent ofJordan’s exports. In contrast, Jordan’s majorforeign suppliers are the European Union (31percent of the total), Asia (24 percent), and otherArab countries (22 percent). The United Statesprovides about 10 percent of Jordan’s imports.
Jordan’s imports are heavily concentrated intransportation equipment (HS XVII), machineryand electrical equipment (HS XVI), and mineralproducts (HS V) that were mainly in the form of iron and steel. Together these threecategories account for 40 percent of total import expenditures. Other important importcategories are chemical and vegetable products (HS VI and 2 respectively), which eachrepresent 10 percent of total imports, and base metals (HS XV), prepared foodstuffs andbeverages (HS IV), textile and textile articles (HS XI) and plastic and rubber articles (HSVII). Overall, the magnitude of these imports is twice as large as those of exports.Despite the importance of Jordan’s major export categories, imports of mineral productsare 2.4 times larger than exports, that of machinery and electrical equipment andvegetable products are both 3 times larger than exports, and imports of transportequipment are 5 times larger than exports.
B. Trade with the United States
Jordan’s structure of trade with the United States is considerably different from that withthe rest of the world, which reflects each country’s comparative advantage in the other’smarket (Table 3.3). Jordan’s major export category to the U.S. market is transportequipment (60 percent of the total), which mainly reflects the re-export of aircraft andparts. Articles of jewelry plated with gold make up the second largest export category (9percent of the total), followed by articles of apparel and carpets (7 percent of the total) inthe third largest category. The other significant export categories are machinery andelectrical appliances (4 percent of the total, mainly in the form of air conditioners), basemetal articles (3 percent, mainly in the form of aluminum waste and scrap), chemicalproducts (3 percent, mainly cosmetics and pharmaceuticals), prepared foodstuffs (3percent, mainly tobacco and food preparations), and optical equipment (2 percent).
On the import side, cereals and wheat in particular represent the largest import of Jordan,representing nearly one-fourth of total imports from the United States. Two other majorcategories are transport equipment (HS XVII), mainly in the form of aircraft parts, andmachinery and electrical equipment (HS XVI), primarily in the form of machinery partsand data processing equipment. Other significant, albeit smaller, categories are preparedfoods and tobacco (HS IV), chemical products (HS VI), vegetable fats and oils (HS III),and optical equipment (HS XVIII).
Table 3.2Jordan’s Geographic Distribution of Exports, 2000
Percent
Middle East 40.6%
Asia 35.4%
North America 3.1%
European Union 3.1%
Other Europe 0.4%
South America 0.4%
Others 17.1%
Total 100.0%Source: Department of Statistics.

Economic Impact and Implications for Jordan of the Jordan-U.S. FTA Final Report
AMR Program 10
Table 3.3Jordan's Major Merchandise Exports to the United States, 1999(Thousands US dollars and percent)
DomesticExports Re-Exports Total Exports
HS Description Value Percent Value Percent Value Percent Main Products
I Live animals; animal products - 0.0% 355 1.2% 355 0.8%Frozen turkey and fish
II Vegetable products 102 0.8% 7 0.0% 110 0.3%Thyme and bay leaves
III Animal or vegetable fats and oils 267 2.0% - 0.0% 267 0.6%Vegetable fats from hydrogenated palm oil
IV Prepared foodstuffs; beverages, spirits and vinegar; tobacco 388 2.9% 606 2.1% 994 2.4%Tobacco and food preparations
V Mineral products 299 2.3% - 0.0% 299 0.7%Sodium chloride and marble and travertine
VI Products of the chemical or allied industries 604 4.6% 467 1.6% 1,071 2.6%Cosmetics, pharmaceuticals and organic chemicals
VII Plastics and articles thereof; rubber and articles thereof 196 1.5% 5 0.0% 201 0.5%Plastic packaging
VIII Raw hides and skins, leather, fur skins and articles thereof 2,549 19.4% 19 0.1% 2,568 6.1%Suitcases and handbags
IX Wood and articles of wood 7 0.0% - 0.0% 7 0.0%Wood frames
X Pulp of wood or of other fibrous cellulosic material 15 0.1% - 0.0% 15 0.0%Paper and printed books
XI Textiles and textile articles 3,069 23.4% 8 0.0% 3,078 7.3%Articles of apparel and carpets
XII Footwear, headgear, umbrellas 11 0.1% - 0.0% 11 0.0%Footwear
XIII Articles of stone, plaster, cement 57 0.4% - 0.0% 57 0.1%Worked stone and ceramic products
XIV Natural or cultured pearls, precious or semi-precious stones 3,621 27.5% - 0.0% 3,621 8.6%Articles of jewelry plated with gold
XV Base metals and articles of base metals 851 6.5% 501 1.7% 1,352 3.2%Aluminum waste and scrap, and tools
XVI Machinery and mechanical appliances; electrical equipment 876 6.7% 706 2.5% 1,582 3.8%Air conditioning machines
XVII Vehicles, aircraft, vessels and other transport equipment - 0.0% 25,276 87.8% 25,276 60.3%Re-exports of aircraft and parts thereof
XVIII Optical, precision, medical instruments and apparatus - 0.0% 737 2.6% 737 1.8% Cameras and projectors
XX Miscellaneous manufactured articles 177 1.3% 89 0.3% 266 0.6%Wooden furniture
XXI Works of art, collectors' pieces and antiques 50 0.4% - 0.0% 50 0.1%Works of art
Unspecified 6 0.0% 16 0.1% 22 0.1%
Total 13,143 100.0% 28,792 100.0% 41,936 100.0%Source: Department of Statistics.

Economic Impact and Implications for Jordan of the Jordan-U.S. FTA Final Report
AMIR Program 11
Chapter 4: Tariff Structures
A. Jordan’s Tariff Schedule
Jordan’s tariff schedule is fairly transparent at the Harmonized System (HS) section levelwith relatively few tariff rates, but it has widely varying rates within each productcategory (Table 4.1). The schedule has an average most favored nation (MFN) rate of 16percent. A minimum tariff of 0 percent is applied in 17 of the 21 HS sections and amaximum tariff of 30 percent is applied in all by one of the HS sections. The tariff peakof 180 percent is applied to certain liquor and tobacco products (HS Section 4). Otherimports that are taxed at higher than average rates include footwear (HS Section 12), artsand antiques (HS Section 21), miscellaneous manufactured articles (HS Section 20) andarms and munitions (HS Section 19).
Table 4.1Jordan’s 2001 MFN Applied Tariffs
Tariff Rates by Section
HS Section/Description
Number ofTariff Lines Minimum Maximum Average a/
1 Live Animals/Products 215 0% 30% 18%
2 Vegetable Products 303 0% 30% 20%
3 Animal/Vegetable Fats 67 5% 30% 18%
4 Processed Foods/Tobacco 239 0% 180% 34%
5 Mineral Products 160 0% 30% 13%
6 Chemical/Industrial Products 942 0% 30% 10%
7 Plastics/Rubber 280 0% 30% 16%
8 Animal Hides/Skins 74 0% 30% 15%
9 Wood/Wood Articles 104 0% 30% 13%
10 Paper/Cellulose Material 230 0% 30% 18%
11 Textiles 862 0% 30% 17%
12 Footwear/Misc. Articles 56 0% 30% 28%
13 Stone/Glassware 174 0% 30% 22%
14 Precious/Semiprec. Mat. 58 1% 30% 16%
15 Base Metals 736 0% 30% 15%
16 Machinery/Electrical Equip. 1,082 0% 30% 12%
17 Motor Vehicles/Vessels 197 0% 30% 15%
18 Precision Instruments 461 0% 30% 18%
19 Arms/Munitions 21 5% 30% 25%
20 Misc. Manufactured Articles 142 0% 30% 26%
21 Art/Antiques 8 10% 30% 28%
Overall 6,411 0% 180% 16%a/ The unweighted estimated average of the complete Most Favored Nation (MFN) applied tariff (viz., includes advalorem, specific and other portions of MFN tariff).Source: Customs Authority.

Economic Impact and Implications for Jordan of the Jordan-U.S. FTA Final Report
AMIR Program 12
B. Jordan’s Free Zones
1. Traditional Free Zones
The concept of free zones was initiated in 1973 in Jordan under the Aqaba PortCommercial Free Zone.6 Success of the zone was hindered by competition in the JebelAli Free Zone in Dubai, which allowed complete foreign ownership of zone-basedcompanies. Ten years later Jordan launched the Zarqa Commercial and Industrial FreeZone, which despite the fact that it is land-locked without access to sea ports or railways,has become the most popular free zone investment site in Jordan for companies interestedin exporting to Iraq. Other zones include the Sahab Industrial Estate Free Zone, QueenAlia International Airport Free Zone. Plans are currently underway to convert Aqaba intoa Special Economic Zone (SEZ), which would streamline bureaucracy, lower taxes andfacilitate customs handling. In the SEZ the private sector would be involved in thedevelopment of transportation and communication services, tourism, and high value-added activities.
Both Jordanian and foreign investors are permitted to invest in trade, services andindustrial projects in free zones. Industrial projects must have the followingcharacteristics:
(a) New industries depending on advanced technology,(b) Industries requiring raw material and/or locally manufactured parts which are
locally available,(c) Industries that complement domestic industries,(d) Industries that enhance labor skills and promote technical know-how, and(e) Industries providing consumer goods and that contribute to reducing market
dependency on imported goods.
The benefits provided to companies operating in these designated free zones aresubstantial, as exemplified by the following incentive list (U.S. Department of State,2001):
6As summarized by Atlas Investment Group (2000a), several types of free zones exist throughout theworld. The ‘first-generation’ free zones are made up of commercial, industrial and cargo free zones.Commercial zones house retailers with heavily taxed products that store materials in the zone to avoidpaying duties before dispatching products into the country. Industrial zones are mainly established formanufacturing companies that rely on export markets and want to avoid duties and taxes under theirproducts are ready to enter the country. Cargo free zones are usually established in air and sea ports and areheavily used by re-exporters.
The ‘second-generation’ free zones include media, information technology parks and qualifying industrialzones. Media free zones is a new concept that offers censorship on and regulation-free press, radio andtelevision broadcasting. Information technology parks provide hi-tech communication infrastructure aimedat computer-based industries. Lastly, qualifying industrial zones permit qualifying exports to the UnitedStates tax free.

Economic Impact and Implications for Jordan of the Jordan-U.S. FTA Final Report
AMIR Program 13
(a) Profits are exempt from income and social services taxes for a period of 12 years,with the exception of profits generated from storage services that involve goodsreleased to the domestic market;
(b) Salaries and allowances payable to non- Jordanian employees are exempt fromincome and social services taxes;
(c) Goods imported to and/or exported from free zones are exempt from import taxesand custom duties, with the exception of goods released to the domestic market;
(d) Industrial goods manufactured in free zones enjoy partial custom dutiesexemption once released to the domestic market, depending on the proportion ofthe value of local inputs and locally incurred production costs;
(e) Construction projects are exempt from licensing fees and urban and propertytaxes; and
(f) Free transfer of capital invested in free zone, including profits.
2. Qualifying Industrial Zones
Qualifying Industrial Zones (QIZs) came about as a result of the attempt to revive thefree zone industry in Jordan, which had become saturated along with those in othercountries of Middle East region. Unlike export processing zones (EPZs), whose mainobjective is usually to promote non-traditional exports, or the other types of traditionalfree zones mentioned above, the QIZ program was established to stimulate economiccooperation between countries in the Middle East.
QIZs were formalized by the UnitedStates-Israel Free Trade AreaImplementation Act (IFTA) of 1985,which allows articles to be imported dutyfree into the United States that wereproduced in the West Bank, Gaza Stripand QIZs between Israel and Jordan andbetween Israel and Egypt.
In 1998 Israel and Jordan established theIrbid Industrial Park as the first QIZ, andin 1999 the United States designated asadditional QIZs the Al-Kerak IndustrialEstate, the Al- Dulayl Industrial Park, theAl-Tajamouat Industrial City and theGateway Industrial Park. In late 2000 theMushatta International Complex, the ElZay Duty Free Area and the Al QastalIndustrial Zone were included in the listof Israel-Jordan QIZs.
The Irbid zone, formally known as the al-Hassan Industrial Estate, is currently the largestof the QIZs in terms of number of businesses. It houses 82 factories, most of which are
Box 4.1Options for Meeting Value-Added Requirement in QIZs
Option 1: Of the 35% value added, at least:• 11.7% (or one-third) must come from a Jordan QIZ• 8% must come from Israel (7% for high tech goods)• Balance of 15.3% (or 16.3% if high tech goods are
involved) must be filled by content from a Jordan QIZ,Israel, USA or West Bank/Gaza.
Option 2: Jordanian and Israel manufacturers must eachcontribute at least 20% of the total production cost ofmanufacturing the QIZ good. Production costs may includematerials, wages and salaries, design, R&D, depreciationof capital investment and overhead).
Option 3: A combination of Option 1 and 2,viz., one partnercan provide at least 20% of the total production cost, whilethe other partner contributes the minimum contentrequirement as long as the total cost of production plus thecost of material makes up at least 35% of the appraisedvalue of the product.
Source: Jordan Investment Board(www.jordaninvest.com).

Economic Impact and Implications for Jordan of the Jordan-U.S. FTA Final Report
AMIR Program 14
involved in the engineering, chemicals, cotton and weaving, and plastics and rubbersectors. More than one-half of the 4,470 jobs created in this estate are in the cotton andweaving sector. The largest QIZ in terms of employment is the Al-Dulayl Industrial Park,owned by a private agricultural and trading company. The ten factories operating in thatpark employ about 9,000 people (Federal Register, 1999; USTR, 1999; USTR, 2000;Ruebner, 2001).
The Jordanian-Israeli JointCommittee, created under the firstzone, identifies businesses locatedwithin the QIZs that involvesubstantial economic cooperationbetween those two countries. Italso identifies goods processed inthe zones for duty-free and quota-
free entry into the United States if the products meet the requirement of adding value inthe zones, Israel, the West Bank and Gaza Strip of no less than 35 percent of the totalappraised value of the product 7 (for details on alternative ways to meet this value-addedrequirement, see Box 4.1).
This import duty relief, coupled with the exemption of income taxes and social servicetaxes on export earnings and the exemption from customs duties on imported rawmaterials, fixed assets and spare parts, makes investment in a QIZ particularly attractiveto industries whose products are assessed high tariffs in the United States. For example,industries involved in garment and footwear manufacturing are well positioned to takeadvantage of the QIZ concept. According to various Jordanian press reports, between sixand ten products have received QIZ status and another five products were to be added tothe list by the end of 2000 (Ruebner, 2001). When fully operational, the QIZs are likelyto expand Jordan’s Jordanian exports to the United States, create job opportunities inJordan and increase foreign direct investment (FDI) flows into Jordan (Table 4.2).
3. Jordan-U.S. FTA
If the U.S. Congress ratifies the U.S.-Jordan FTA this year, Jordan will become the fourthcountry to establish such an agreement with the United States after Canada, Mexico andIsrael. According to Atlas Investment Group (2000b), negotiations between the twocountries thus far have led Jordan to agree to the following:
• Customs tariffs: GSP preferences will remain in effect.
• Customs barriers: Goods subject to a five percent customs duty will be duty freewithin two years; goods subject to a 10 percent duty will be duty free within four
7Appraised value of the product includes the cost of content plus direct costs of production operations.Examples of direct costs of processing include: rent for equipment used in manufacturing processes,employee group insurance, labor costs of shipping and receiving employees, payroll taxes for direct labor,utilities, royalty payments and costs of supervision and training of workers (Atlas Investment Group,2000a).
Table 4.2Economic Activity of QIZs, as of September 2000
QIZNo. of Factorieswith QIZ status
FDI(US$ millions)
Employment(No.of Jobs)
Al-Hassan 11 68 7,429Al-Dulayl 10 70 9,000Al-Tajamouat 9 28 4,625Al-Kerat 2 21 2,800Total 32 187 23,854Source: Adapted from Al-Dustour (Amman), September 11, 2000 asreported in Ruebner, 2001.

Economic Impact and Implications for Jordan of the Jordan-U.S. FTA Final Report
AMIR Program 15
years and those subject to 15 and 20 percent duty will be duty free within fiveyears; any goods subject to 30 percent duty or greater will be duty free within 10years.
• Services: Jordan will be given a three-year grace period to amend intellectualproperty laws.
• Environment: Discussions are underway on Jordanian environmental laws andregulations and they relate to trade, which will likely be revised to reflect those inNAFTA.
Box 4.2Main Differences Between QIZs and the U.S.-Jordan FTA
QIZs FTADuty and Quota-Free Status Exported goods are duty and quota-
freeSchedule of elimination of duties tobe completed over 10 years
Activities Covered Only industrial activities Industrial activities and servicesLegal Framework U.S.-Israel FTA U.S.-Jordan FTAInput Requirements 11.7% Jordanian 35% Jordanian under current
negotiationsDesignated areas Defined areas within the country Entire countrySource: Adapted from Atlas Investment Group, 2000b.
At first glance, it seems that the establishment of a new FTA would create competitionbetween the QIZs and the free zones in attracting investments. The free zones cover awider scope of activities, and could present a threat to the success of the QIZs. One of thekey differences between QIZs and the FTA is the duty-free and quota-free status (Box4.2). Under the QIZ, exported goods (as long as they meet the local content requirement)are duty-free and quota-free; under the FTA, some products will enjoy immediateelimination of duties and others will have to wait ten years. Therefore, some companiescould find an investment to be more attractive under the QIZ concept than waiting untilthe FTA is ratified.
Input requirements are another key issue in examining the differences between QIZs andthe FTA. Under the QIZ, production of goods is subject to an 11.7 percent Jordanianinput; under current negotiations of the FTA, Jordanians alone should provide theminimum 35 percent value added for each product. The input requirement thereforeallows investors a choice, which in part may be influenced by political considerations.Lastly, the fact that a QIZ is a designated area complete with existing infrastructure isalso an important difference between a QIZ and the FTA.
Under the FTA, the entire country of Jordan in effect becomes a free zone, therebyallowing companies to set up operations in any location. Nonetheless, the Government ofJordan has promoted QIZs based on proximity to water, electricity and labor supplies,thereby suggesting that start-up companies will likely choose those zones over areas nothaving existing infrastructure. In the final analysis, the choice of whether or not to investin a QIZ will likely depend on the timeliness of the investment, investor personalpreferences and attitudes and certain industry-specific issues (Atlas Investment Group,2000b and 2000c).

Economic Impact and Implications for Jordan of the Jordan-U.S. FTA Final Report
AMIR Program 16
The economic impact of the FTA, with an eventual across-the-board zero-tariff, isexpected to be significant in terms of the expansion of the overall volume of Jordanianexports to the United States (see Chapter 6 for details). The FTA is expected to have anespecially large impact on the textile and apparel sector of Jordan, since few firms havequalified their products for QIZ status and therefore face substantial tariffs whenexporting to the United States. According to the USITC, U.S. imports of QIZ-designatedproducts amount only to $159,000 in 1999, all of which were classified under HSChapters 61 and 62 (apparel products). Nonetheless, as all QIZs become operations andmore product lines become eligible for QIZ status in upcoming years, U.S. duty-freeimports of products under the QIZ are expected to increase.
C. U.S. Preferential Tariffs
GSP - - Outside the duty-free rates that are part of the QIZ arrangement specific to theUnited States, the actual tariff rates applied by industrialized countries to productsoriginating from Jordan and other developing countries are usually less than the MFNrate because of tariff preference schemes like the Generalized System of Preferences(GSP) and other preferential trade arrangements (PTAs). Countries offering the GSPapply low or zero-rate tariffs to certain commodities originating from developingcountries eligible for participation in the scheme. The GSP scheme is unilateral, viz.,developing countries are not required to extend reciprocal tariff reductions. The programis intended to give preferential tariff treatment to developing countries until theirexporters are able to compete on world markets with normal, non-preferential tariffs.8
The United States, Japan, Australia, Scandinavia and other non-EU countries offer Jordanbeneficial access to their markets under GSP arrangements. An assessment of the effectof the GSP and other PTAs on the average tariff level applied to developing countriesthat are eligible beneficiaries is complex because of the variety of schemes that are inplace and the fact that goods can be included or excluded from time to time over the lifeof the program (Michalopolus, 1999). For example, under the current United States GSP,most imports of minerals (HS Section 5) from least-developing countries are eligible forpreferences, although most imports of plastic and rubber (HS Section 7) of all GSPbeneficiary countries (e.g., developing and least developed) are eligible for GSPpreferences (Table 4.3).
Moreover, it is clear that recent patterns in world trade are diminishing the intendedeffects of the GSP. First, as multilateral trade agreements reduce tariffs worldwide, themargin between the GSP preferential rates and MFN rates becomes smaller. For example,U.S. tariff rates, which averaged 5.4 percent on industrial products before the Uruguay 8The preferential and unilateral nature of GSP appears to be in violation of several principles of the GeneralAgreement on Tariffs and Trade (GATT), which state that trade must be conducted on a nondiscriminatory(or MFN) basis, that members of the World Trade Organization (WTO) must extend any tariff concessionsto all trading partners, and that tariff reductions must be reciprocal. Since 1971, however, a GATT waiverhas allowed the industrial countries to extend preferential tariff treatment for developing countries(Holliday, 1998).

Economic Impact and Implications for Jordan of the Jordan-U.S. FTA Final Report
AMIR Program 17
Round, will be reduced to 3.5 percent when the new reductions are completed. Second,the growing number and size of other preferential tariff arrangements are alsodiminishing the value of tariff relief under GSP.
The United States, for example, extends duty-free treatment to imports under the NorthAmerican Free Trade Agreement (NAFTA), the U.S.-Israeli Free Trade Agreement, theCaribbean Basin Initiative (CBI), the Andean Initiative, and the upcoming U.S.-JordanFree Trade Agreement. Plans for other regional arrangements, including on in the AsiaPacific region, are underway. Likewise, the EU is also expanding its preferential tradingarrangements in Africa, Central and Eastern Europe, and elsewhere. Therefore,beneficiaries of GSP are increasingly either participating in alternative preferentialarrangements or competing with producers who enjoy preferential treatment under otherarrangements (Holliday, 1998).
MFN tariff rates nonetheless serve as a base with which to assess duty on imports and tocompare tariff rates under various PTAs. The United States MFN tariff schedule iscomprised of nearly 14,000 tariff lines having an unweighted average of 6 percent. Thehighest average tariff of 18 percent appears in footwear (HS Section 12); the lowestaverage of 0 percent appears in art and antiques (HS Section 21). The schedule is alsocharacterized by having a minimum tariff of 0 percent, which is applied to certainproducts in all HS sections and a maximum tariff of 350 percent, which is applied tocertain processed foods and tobacco products (HS Section 4). Products defined in the‘other’ category (HS Section 99) make up more than 10 percent of the tariff lines and areassessed prohibitive tariffs. Many of these so-called sensitive products are excluded frompreferential agreements, as for example those with Israel, Mexico and Canada thatinclude certain types of textiles and related products.
Tariff preferences of the United States vary widely under NAFTA, the CBI, the IsraelFTA and the U.S.-Jordan FTA. In general, however, the share of tariff lines (by HSsection) eligible for tariff preferences under the NAFTA and Israel FTA are similar, withmost differences occurring in tariff preferences accorded to CBI countries (viz., fewernumber of tariff lines generally enjoy fewer preferences when compared with NAFTAand Israel FTA). For example, about 90 percent of all U.S. imports of footwear (HS 12)originating from Canada and Mexico under NAFTA and Israel under the FTA with thatcountry receive tariff preferences, yet only 8 percent of footwear imports originatingfrom CBI countries are taxed at preferential rates. In contrast, more than one-half (57percent) of U.S. imports of paper and cellulose (HS 10) originating from Israel and CBIcountries receive preferential treatment, compared with only 8 percent of imports of thoseproducts from Canada and Mexico.

Economic Impact and Implications for Jordan of the Jordan-U.S. FTA Final Report
AMIR Program 18
Table 4.3US Tariffs by MFN Rates and Preferential Schemes, 2000
NAFTA CBI IsraelFTA
MFN Tariff Rates by Section GSP Share of Tariff Lines Eligible for…
HS Section/Description Numberof TariffLines
MinimumMaximum
Averagea/
DominantIndicator
b/
Shareof TariffLines
CanadaPreferences
MexicoPreferences
DominantIndicator
c/
Share ofTariffLines
Shareof TariffLines
1 Live Animals/Products 737 0% 117% 11% A+ 64% 70% 59% E 62% 69%2 Vegetable Products 648 0% 164% 5% A+ 42% 79% 79% E 79% 79%3 Animal/Vegetable Fats 93 0% 19% 5% A+ 58% 80% 78% E 80% 80%4 Processed Foods/Tobacco 943 0% 350% 13% A+ 43% 72% 74% E 69% 72%5 Mineral Products 211 0% 13% 1% A+ 19% 28% 28% E 12% 28%6 Chemical/Industrial Products 2,078 0% 15% 5% A+ 40% 76% 76% E 76% 76%7 Plastics/Rubber 381 0% 14% 4% A 56% 78% 78% E 76% 78%8 Animal Hides/Skins 211 0% 20% 6% A 17% 82% 82% E 82% 82%9 Wood/Wood Articles 205 0% 18% 3% A 20% 44% 44% E 41% 44%
10 Paper/Cellulose Material 223 0% 7% 1% A 56% 8% 8% E 57% 57%11 Textiles 1,579 0% 33% 10% A 4% 94% 94% E 14% 94%12 Footwear/Misc. Articles 342 0% 59% 18% A 8% 87% 87% E 8% 90%13 Stone/Glassware 354 0% 38% 6% A 34% 70% 70% E 67% 70%14 Precious/Semiprec. Mat. 110 0% 14% 3% A 36% 57% 57% E 5% 57%15 Base Metals 1,291 0% 22% 3% A+ 49% 86% 86% E 86% 86%16 Machinery/Electrical Equip. 1,512 0% 15% 2% A 36% 47% 47% E 47% 47%17 Motor Vehicles/Vessels 279 0% 25% 3% A+ 29% 57% 57% E 57% 57%18 Precision Instruments 753 0% 32% 4% A 29% 75% 75% E 75% 75%19 Arms/Munitions 39 0% 13% 2% A 33% 44% 44% E 44% 44%20 Misc. Manufactured Articles 294 0% 36% 4% A 41% 55% 55% E 54% 55%21 Art/Antiques 166 0% 0% 0% --- --- 22% 22% E 3% 22%
d/, e/ Other 1,494 0% -- -- A+ 1% 0.5% 34% E 1% 1%Overall
3,9430% 350% 6% A+ 24% 64% 68% E 52% 64%
a/ The unweighted estimated average of the complete Most Favored Nation (MFN) applied tariff (viz., includes ad valorem,
specific and other portions of MFN tariff.
b/ 'A+' indicates that only imports from least-developing beneficiary countries are eligible for GSP tariff preferences under certain
subheadings; 'A' indicates that imports from all GSP beneficiary
Countries are eligible for GSP tariff preferences under certain subheadings.
c/ 'E' indicates that imports from all CBI beneficiary countries are eligible for CBI tariff preferences under certain subheadings.
d/ Refers to HS Chapter 99 and includes tariffs applied to 'sensitive products'.
e/ Calculations for minimum, maximum and average tariff rates are based on ad valorem portion of tariff rate; MFN specific rates and other

Economic Impact and Implications for Jordan of the Jordan-U.S. FTA Final Report
AMIR Program 19
Chapter 5: International Competitiveness
A. Comparative Advantage
Jordan’s exports are made up of types of goods in which there is a relatively high level ofproductivity (the Ricardian model), and those in which the exported goods are intensivein the factors with which the country is abundantly endowed (the Heckscher-Ohlinmodel). Jordan is endowed with natural resources, and exporters have developed arelatively high productivity level in those natural resource-intensive products, which hasgenerally made them competitive in the world markets for those types of products. Tables5.1 and 5.2 show the comparative advantages of export product divisions of Jordan andother selected Middle East countries in three factor-intensity categories: natural-resourceintensive products, unskilled labor-intensive products, and human capital and technology-intensive products. The indices measure the ‘revealed’ comparative advantage (RCA) of thecountries in each factor-intensity category: when the value of the index is greater than one, itimplies a measurable degree of comparative advantage in a product category; when it is lessthan one, it suggests a comparative disadvantage.9 Table 5.1 shows the comparativeadvantages of Jordan and the other selected countries in the world market, and Table 5.2shows their comparative advantage in the U.S. market.
Jordan and other Middle East countries generally have strong export performances in similarproduct categories, implying a low level of complementarity opportunities that could inducea strong expansion in intra-regional trade within the Middle East. In the natural resource-intensive products, Jordan has a clear comparative advantage in manufactured fertilizers, asdo Morocco, Tunisia and, to a lesser extent, Israel and Egypt. Jordan also has a strongcomparative advantage in animal and vegetable oils, as do Tunisia and Morocco, and it has aunique comparative advantage in crude materials. Jordan also has a comparative advantagein food and live animals, paper and paperboard, non-metallic mineral manufactures, albeitmuch smaller than Israel.
Among the human capital and technology-intensive products, Jordan shares a comparativeadvantage with other Middle East countries in all but one product:
§ Inorganic chemicals (Jordan, Egypt, Israel, Tunisia, Morocco)§ Essential oils, perfume materials (Jordan, Egypt and Turkey)§ Medicinal and pharmaceutical products (Jordan and Egypt)§ Plastic materials, regenerated cellulose (Jordan and Israel)§ Dyeing, tanning, and coloring materials (only Jordan)
9For a discussion on the conceptual issues and problems of measuring the comparative advantage ofcountries and regions, see Greenaway and Milner (1993). For comparative RCA indices for theindustrialized countries and developing regions, see Lord (1991, 1999).

Economic Impact and Implications for Jordan of the Jordan-U.S. FTA Final Report
AMIR Program 20
Among unskilled labor-intensive products, the data do not reflect Jordan’s recent expansionof garments and travel goods, since the information for those products is based on 1998 and1999 trade data.
In trade with the United States, Jordan and the selected other Middle East countries have asimilar pattern of comparative advantage. In natural resource-intensive products, Jordancontinues to have a clear comparative advantage in manufactured fertilizers, as do Morocco,Tunisia and, to a lesser extent, Israel and Egypt. Jordan also has a strong comparativeadvantage in animal and vegetable oils, as do Tunisia and Morocco. In the case of crudematerials, however, it shares a comparative advantage with Morocco. Jordan also has acomparative advantage in food and live animals (along with Morocco and Egypt), paper andpaperboard, non-metallic mineral manufactures, albeit much smaller than Israel, and similarto that of Turkey, Egypt and Tunisia.
Among unskilled labor-intensive products, Jordan and all other Middle East countriesemerge with a comparative advantage in footwear, clothing and textile yarn. Jordan is theonly country in the region with a comparative advantage in furniture in the U.S. market.Among the human capital and technology-intensive products, Jordan again shares acomparative advantage with other Middle East countries in all but one product: inorganicchemicals (Jordan, Egypt, Israel, Tunisia, Morocco); essential oils, perfume materials(Jordan, Egypt and Turkey); medicinal and pharmaceutical products (Jordan, Egypt andIsrael); plastic materials, regenerated cellulose (Jordan and Israel); and dyeing, tanning,and coloring materials (only Jordan).
The similarity of export performances across product divisions for Jordan and other MiddleEast countries suggests that, by developing cross-border production facilities and benefitingfrom economies of scale, exporters could improve their export performance in the worldmarket, and the U.S. market in particular. For this expansion to happen, however, problemsof sufficient capital required to upgrade processing techniques will need to be overcome.The ability and willingness of businesses to enter into joint ventures will naturally dependon comparative production costs between the countries, infrastructure and transportationfacilities, market prospects, economic policies and the regulatory environment.
B. International Competitiveness
Jordan’s export competitiveness is based on five broad categories: (a) exchange ratecompetitiveness, (b) labor and infrastructure costs, (c) financial conditions and (d) tradepolicies.10 We examine these categories under in the following two sub-sections of thischapter.
10 An alternative categorization by the World Bank consists of (a) overall performance, (b) macroeconomicand market dynamism, (c) financial dynamism, (d) infrastructure and investment climate, and (e) humanresources. See http://fpsi.worldbank.org/fpsiweb/frame/compet.html.

Economic Impact and Implications for Jordan of the Jordan-U.S. FTA Final Report
AMIR Program 21
Table 5.1
Revealed Comparative Advantage of Jordan and Other Middle East Countries in World Market
Category/Product Division Jordan Egypt Israel Turkey Tunisia Morocco
Natural Resource-Intensive: 2.44 2.32 1.48 1.05 1.00 2.37
Food and Live Animals 1.39 1.77 0.56 2.10 0.72 4.40
Beverages and Tobacco 0.59 0.07 0.06 2.37 1.08 0.19
Crude Materials, Inedible (ex.fuels) 7.07 1.96 0.64 0.66 0.39 4.02
Mineral Fuels 0.01 4.77 0.08 0.15 1.01 0.31
Animal and Vegetable Oils 14.49 0.53 0.03 2.08 8.11 2.83
Fertilizers, Manufactured 35.98 4.61 6.16 0.18 17.69 25.16
Wood and Cork Manufactures 0.03 0.11 0.06 0.26 0.44 1.25
Paper and Paperboard 1.73 0.26 0.13 0.31 0.23 0.09
Non-Metallic Mineral Manufactures 1.39 0.87 13.59 1.55 0.73 0.33
Non-Fuel Minerals 0.25 2.27 0.35 0.70 0.15 0.95
Unskilled Labor-Intensive: 0.78 2.79 0.55 4.42 5.41 2.31
Leather and Manufactures 0.00 1.63 0.07 0.72 1.09 2.96
Textile Yarn 0.78 5.51 0.79 5.17 0.85 1.12
Furniture 0.81 0.40 0.15 0.39 0.27 0.11
Travel Goods and Handbags 0.08 0.04 0.04 0.38 0.81 0.72
Clothing 0.85 2.68 0.70 6.61 10.77 3.87
Footwear 0.97 0.19 0.14 0.69 4.21 1.83
Human Capital/Technology-Intensive: 0.48 0.20 0.76 0.42 0.32 0.25
Chemical Elements and Compounds 0.03 0.05 1.65 0.13 0.02 0.02
Inorganic Chemicals 5.11 3.47 3.18 0.26 8.51 18.32
Dyeing, Tanning, and Coloring Materials 1.36 0.17 0.20 0.63 0.28 0.12
Medicinal and Pharmaceutical Products 5.87 1.13 0.95 0.25 0.18 0.11
Essential Oils, Perfume Materials, Etc. 6.16 2.28 0.90 1.86 1.00 0.61
Explosives, Pyrotech Products 0.73 0.11 0.61 0.20 0.05 0.01
Plastic Materials, Regenerated Cellulose 1.57 0.09 2.47 0.80 0.21 0.06
Chemical Materials and Products 1.21 0.63 1.42 0.19 0.12 0.07
Rubber Manufactures 0.04 0.42 0.55 1.49 0.37 0.59
Iron and Steel 0.08 1.34 0.05 2.51 0.45 0.15
Manufactures of Metal 0.60 0.50 1.36 1.04 0.39 0.16
Non-Electrical Machinery 0.26 0.03 0.58 0.36 0.17 0.04
Electrical Machinery and Appliances 0.06 0.02 1.12 0.37 0.48 0.09
Transport Equipment 0.06 0.01 0.29 0.34 0.06 0.05
Plumbing, Heating, Lighting Equipment 0.24 2.35 0.06 1.50 0.55 1.23
Professional and Scientific Instruments 0.06 0.02 1.20 0.08 0.17 0.06
Miscellaneous Manufactured Goods 0.56 0.33 0.89 0.50 0.17 0.13
Notes: (1) All calculations are for 2-digit SITC product categories, derived from unweighted averages of productcomponents at the 3-digit SITC level using 1998 data.(2) Factor-intensity category calculations are unweighted averages of individual product divisions.Source: COMTRADE database.

Economic Impact and Implications for Jordan of the Jordan-U.S. FTA Final Report
AMIR Program 22
Table 5.2
Revealed Comparative Advantage of Jordan and Other Middle East Countries in U.S. MarketCategory/Product Division Jordan Egypt Israel Turkey Tunisia Morocco
Natural Resource-Intensive: 3.40 3.23 2.07 1.46 1.39 3.30
Food and Live Animals 1.54 1.96 0.62 2.33 0.80 4.87
Beverages and Tobacco 0.49 0.06 0.05 1.96 0.90 0.15
Crude Materials, inedible (ex.fuels) 6.59 1.82 0.60 0.62 0.36 3.74
Mineral Fuels 0.04 18.62 0.31 0.60 3.94 1.19
Animal and Vegetable Oils 13.89 0.50 0.03 1.99 7.78 2.71
Fertilizers, Manufactured 20.07 2.57 3.44 0.10 9.87 14.03
Wood and Cork Manufactures 0.07 0.22 0.13 0.54 0.90 2.57
Paper and Paperboard 1.95 0.30 0.15 0.35 0.26 0.10
Non-Metallic Mineral Manufactures 3.41 2.12 33.28 3.80 1.78 0.82
Non-Fuel Minerals 0.43 3.93 0.60 1.21 0.26 1.64
Unskilled Labor-Intensive: 1.86 6.66 1.32 10.54 12.90 5.50
Leather and Manufactures 0.01 3.24 0.15 1.43 2.18 5.88
Textile Yarn 1.37 9.64 1.38 9.04 1.49 1.96
Furniture 1.19 0.59 0.22 0.58 0.41 0.16
Travel Goods and Handbags 0.56 0.31 0.29 2.73 5.86 5.17
Clothing 2.44 7.70 2.01 18.99 30.93 11.11
Footwear 8.33 1.59 1.21 5.92 36.08 15.71
Human Capital/Technology-Intensive: 0.40 0.20 0.74 0.40 0.30 0.23
Chemical Elements and Compounds 0.02 0.04 1.48 0.12 0.02 0.02
Inorganic Chemicals 4.46 3.03 2.77 0.23 7.44 16.00
Dyeing, Tanning, and Coloring Materials 1.46 0.19 0.21 0.68 0.30 0.13
Medicinal and Pharmaceutical Products 6.80 1.31 1.10 0.29 0.21 0.13
Essential Oils, Perfume Materials, Etc. 5.63 2.09 0.82 1.70 0.91 0.56
Explosives, Pyrotech Products 0.63 0.10 0.53 0.18 0.05 0.01
Plastic Materials, Regenerated Cellulose 1.34 0.08 2.12 0.69 0.18 0.05
Chemical Materials and Products 0.78 0.40 0.91 0.12 0.08 0.04
Rubber Manufactures 0.05 0.44 0.57 1.56 0.39 0.62
Iron and Steel 0.25 3.90 0.14 7.32 1.31 0.44
Manufactures of Metal 0.63 0.52 1.42 1.08 0.40 0.17
Non-Electrical Machinery 0.19 0.02 0.41 0.26 0.12 0.03
Electrical Machinery and Appliances 0.05 0.02 0.98 0.32 0.42 0.08
Transport Equipment 0.04 0.01 0.20 0.23 0.04 0.03
Plumbing, Heating, Lighting Equipment 0.40 4.00 0.10 2.56 0.93 2.09
Professional and Scientific Instruments 0.04 0.01 0.77 0.05 0.11 0.04
Miscellaneous Manufactured Goods 0.54 0.32 0.86 0.48 0.16 0.13
Notes: (1) All calculations are for 2-digit SITC product categories, derived from unweighted averages of productcomponents at the 3-digit SITC level using 1998 data.(2) Factor-intensity category calculations are unweighted averages of individual product divisions.Source: COMTRADE database.

Economic Impact and Implications for Jordan of the Jordan-U.S. FTA Final Report
AMIR Program 23
1. Exchange Rate Competitiveness
The dinar (JD) has historically exhibited relative stability, and has been supported bylarge capital inflows in the form of foreign aid and worker remittances. During a periodof considerable instability in 1986-92, the JD was de-linked from the U.S. dollar in 1989and tied to a trade-weighted basket of currencies. A two-tier exchange rate system wasestablished, comprising official and free market exchange rates. The official exchangerate was applied to the public sector’s imports of essential goods and transfers toJordanians studying abroad. The dual exchange system was terminated in 1990, and theexchange rates were unified at a sharply devalued exchange rate. While significantrestrictions remained on bank foreign exchange transactions, the JD was formally peggedto the U.S. dollar in 1995. Being pegged to the U.S. dollar, the cross-rate of the JDagainst the Euro and other broader baskets of currencies like the SDR has caused thecross-rate of the JD against the Euro to appreciate sharply in recent years. As a result, theCentral Bank has recently considered pegging the JD to a basket that would combine theU.S. dollar with other currencies.11
The combination of Jordan’s exchange rate policies and a gradually widening differentialbetween inflation rates in Jordan and the United States has driven up the real cross ratesof the JD against the dollar.12 The real cross rate is the nominal bilateral exchange rateadjusted for relative movements in the national prices of Jordan and a partner country(the United States). As such, an increase in the index reflects an appreciation orrevaluation and a decline denotes a devaluation or depreciation. Using this measure, weestimate that the real cross rate of the JD relative to the dollar rose by nearly 6 percentbetween 1995 and 1998 (Table 5.3). In contrast, the real cross-rates of currencies of mostother selected Middle East countries fell against the U.S. dollar during this period. Onlythe Egyptian pound appreciated by a greater amount than the Jordanian dinar.
11 For an analysis of the extent of exchange rate overvaluation in Jordan, Egypt, Morocco and Tunisia priorto 1995, see Domaq and Shabsigh (1999).
12 The real cross-rate is defined as R = Pe/( RnPf), where Pe is in the price of domestic goods, Pf is the priceof the partner country’s goods, and Rn is the nominal bilateral exchange rate.
Table 5.3Real Cross-Rate Indices of Selected Middle East Currencies with U.S. Dollar, 1991-2000(1995 = 100)
1991 1992 1993 1994 1995 1996 1997 1998 1999 2000
Jordan 101.1 102.2 100.6 100.7 100.0 102.2 102.9 105.8 105.5 105.8
Egypt 75.9 79.0 85.3 89.0 100.0 104.2 106.6 109.4 110.1 110.8
Israel 96.3 97.0 90.8 93.4 100.0 102.0 100.5 94.7 89.5 88.2
Morocco 88.4 92.6 86.8 89.9 100.0 98.0 88.4 88.9 85.8 83.0
Tunisia 93.5 100.4 89.3 90.5 100.0 97.9 87.3 86.1 84.1 83.6
Turkey 112.2 112.4 113.5 84.6 100.0 98.7 96.0 101.7 102.1 102.1Note: An increase in the index reflects an appreciation; a fall reflects a depreciation.Sources: Derived from data from International Monetary Fund, International Financial Statistics, and World EconomicOutlook database.

Economic Impact and Implications for Jordan of the Jordan-U.S. FTA Final Report
AMIR Program 24
Despite the subsequent stabilization of the JD, the real cross-rates of Israel, Tunisia andMorocco have continued to fall in the last three years, which has further weakened thecompetitive position of Jordan relative to those countries in the U.S. market (Table 5.4).This definition of competitiveness in terms of the real cross-rate provides a good index ofthe degree of international competitiveness of Jordan’s tradables sector in the U.S.market. In Table 5.4, an increase in the real cross-rate reflects an increase in the domesticcost of producing tradable goods, and therefore a deterioration of Jordan’s internationalcompetitiveness.
The loss of Jordan’s export competitiveness has been especially severe in WesternEurope and Asia, since the Euro and most of the currencies in Asia have depreciatedrelative to the U.S. dollar. In addition to the loss of export competitiveness, theappreciation of the JD stimulated imports, and undermined a recovery in domesticproduction, employment and fiscal revenue because of the loss of domestic profitabilityof production. 13
2. Comparative Competitive Indicators
Our attempt to obtain comparative factor cost data for Jordan and other Middle Eastcountries was hampered by the limited timeframe of the present study. We have thereforeadopted the World Bank’s World Development Indicators for the competitiveness offirms and industries in Jordan and the other selected Middle East countries. While recentdata are often lacking, the information provides some insight into Jordan’scompetitiveness relative to other countries. The indicators are organized in five broadcategories: Table 5.5 covers overall performance and macro and market dynamism, andTable 5.6 covers infrastructure and investment climate and human resources.
13 From a trade policy perspective, Jordan could use the exchange rate as an equilibrating instrument for thecurrent account by using it to replace trade restrictions as an instrument with which to achieve a sustainablemedium-term internal and external balance. Internal balance in this context refers to the condition neededto achieve equilibrium in the non-tradable goods market, while external balance refers to the condition needto achieve equilibrium in the current account, a condition that implies compatibility with sustainable long-term capital inflows.
Table 5.4International Competitiveness of Selected Middle East Countries in U.S. Market, 1991-2000(1995 = 100)
1991 1992 1993 1994 1995 1996 1997 1998 1999 2000
Jordan 98.9 97.8 99.4 99.3 100.0 97.8 97.2 94.5 94.8 94.5
Egypt 131.8 126.5 117.3 112.3 100.0 96.0 93.8 91.4 90.9 90.2
Israel 103.9 103.1 110.1 107.0 100.0 98.0 99.5 105.6 111.7 113.4
Morocco 113.1 108.0 115.2 111.2 100.0 102.0 113.1 112.5 116.6 120.5
Tunisia 107.0 99.6 112.0 110.5 100.0 102.1 114.6 116.2 118.9 119.7
Turkey 89.1 89.0 88.1 118.2 100.0 101.3 104.2 98.4 97.9 97.9Note: An increase in the index reflects an improvement in the competitiveness; a fall reflects a loss of competitiveness.Source: Calculated from the inverse of the real cross exchange rates for each country.

Economic Impact and Implications for Jordan of the Jordan-U.S. FTA Final Report
AMIR Program 25
Table 5.5Comparative Competitive Indicators of Jordan and Other Middle East Countries: Macro Dynamics
Jordan Egypt Israel Turkey Morocco Tunisia
I. Overall Performance:GNP per capita (US$) 1996 $1,650 $1,080 $15,870 $2,830 $1,290 $1,930
Average Annual Growth of GNP per capita (%) 1965-96 -0.3% 4.0% 1.3% 1.7% 2.1% 2.7%
II. Macro and Market Dynamism
Investment and Productivity GrowthGross Domestic Investment (% of GDP) 1996 35% 17% 24% 24% 21% 24%
Average annual growth of Gross Domestic Investment (%) 1990-1996 12% 0% 12% 4% 0% 2%
Private Investment (% of Gross Domestic Fixed Investment) 1996 77% 59% N/A 81% 58% 51%
Net Foreign Direct Investment FDI (% of GDP) 1996 0.2% 0.9% 1.7% 0.4% 0.8% 1.6%
Overall Trade Dimensions
Trade Surplus/Deficit (% of GDP) 1995% -24% -3% -10% -5% -8% -4%
Export Share of World Trade (%) 1994 0.00% 0.20% 0.40% 0.50% 0.10% 0.10%
Average Annual Growth in Export Share (%) 1989-95 -1.8% -3.1% 0.8% 2.6% 0.1% 2.0%
Export Competitiveness
Average Annual Nominal Export Growth (%) 88-89 to 93-94 -2.8% 7.5% 7.5% 7.4% 7.1% 9.8%
Export Growth from World Demand (%) 88-89 to 93-94 5.3% 5.2% 8.2% 5.9% 6.4% 5.8%
Export Structure
Manufactured Exports (% of total exports) 1996 49% 32% 91% 74% 50% 80%
Percent Change in Share of Manufactured Exports (%) 1980-93 50% 200% 11% 167% 138% 108%
High Tech. Exports (% of manufactured exports) 1996 26% 9% 30% 8% 24% 10%
Trade Policy
Mean Tariff (%) 1990-93 14% 28% 8% 14% 25% 30%
Standard Deviation of Tariff Rates (%) 1990-93 N/A 29% 11% 25% 13% 13%
Government Involvement in the EconomyGovernment Consumption (% of GDP) 1996 23% 10% 29% 12% 16% 16%
Average Annual Growth of Government Consumption (%) 1990-96 7% 2% 3% 3% 1% 4%
Government Surplus/Deficit (% of GDP) 1995 1.1% 0.3% -4.7% -4.1% -1.4% -3.2%Source: World Bank.

Economic Impact and Implications for Jordan of the Jordan-U.S. FTA Final Report
AMIR Program 26
Table 5.6Comparative Competitive Indicators of Jordan and Other Middle East Countries: Infrastructure andInvestment Climate
Jordan Egypt Israel Turkey Morocco Tunisia
Information and Communication Network
Phone Lines (Number per 1000 people) 1996 60 50 446 224 43 64
Phone Faults (Number per 100 lines) 1992 89 N/A 21 27 84 113
Waiting Time for a Line (Years) 1996 9.9 5 0.1 0.7 0.7 1.5
Average Price per Call (US$ per 3 minutes call) 1996 9.44 6.19 3.43 4.37 8.36 6.47
Televisions (Number per 1000 people) 1996 175 126 303 309 145 156
Internet Hosts (Number per 1000 people) 1997 0.38 0.31 104.79 3.6 0.13 0.02
Personal Computers (Number per 1000 people) 1996 7.2 5.8 117.6 13.8 1.7 6.7
Fax Machines (Number per 1000 people) 1995 7.3 0.4 25 1.6 0.3 2.8
Newspaper Circulation (newspapers per 1000 people) 1994 48 64 281 44 13.2 46
Physical Infrastructure
Paved Road Density (Km of paved road per million people) 1995 1241 719 2611 1416 1126 1992
Air City Pairs 1996 102 164 186 168 68 66
Electric Power System Losses (% of total power output) 1995 9% 0% 3% 15% 4% 11%
Human Capital
Literacy Rate (%) 1995 87% 51% 100% 82% 44% 67%
Growth in Literacy Rate 1970-95 85% 46% N/A 58% 100% 116%
Primary School Enroll. (% of school-aged children) 1995 94% 100% 99% 105% 83% 116%
Secondary School Enroll. (% of school-aged children) 1992 53% 74% 89% 56% 39% 61%
Tertiary School Enroll. (% of school-aged children)1992 19% 18% 41% 18% 11% 13%
Secondary Technical Enroll. (% sec.enroll.) Average 1988-1991 23% 21% N/A 25% 2% 4%
Life Expectancy at Birth (Years) 1996 71 65 77 69 66 69
Growth in Life Expectancy (%) 1960-1994 49% 16% 5% 13% 14% 13%Source: World Bank, World Development Indicators.

Economic Impact and Implications for Jordan of the Jordan-U.S. FTA Final Report
AMIR Program 27
Chapter 6: Export Compatibility with the U.S. Market
A. Emerging Exports and Imports
The comparative advantage analysis in the previous chapter is limited to static concepts.In reality, countries alter their situations by adopting new technologies either internallythrough research and development, or externally through foreign direct investment (FDI)and the development of cross-border production facilities. These new technologies allowcountries to change their comparative advantage, exploit new markets and, in the case ofdeveloping countries, to converge to levels of income and economic structures similar tothose of developed economies. The comparative advantage analysis therefore needs to bemodified to encompass the effects of changing technological situations and changingworker skills on production patterns of countries.
One alternative approach adopted from business economics by both the World Bank andthe United Nations Economic Commission for Latin America (TradeCan, 2000) is toassume that there are few natural resource and technological differences betweencountries. Under these conditions, the degree of concentration or so-called agglomerationof industries helps to accounts for developmental differences between countries. Theconcentration of industrial activity in particular locations has allowed some countries toadvance more quickly than those countries without industrial agglomeration. Bychanging the manufacturing production base of countries, preferential trade arrangements(PTAs) at the regional level and FTAs at the bilateral level can help to alter andaccelerate the development process of countries. Hanson (1994), for example, has shownthat the recent agglomeration of industries in Mexico has been associated with increasingreturns to scale. In a subsequent study, Hanson (2000) illustrated that the PTA with theUnited States has strongly influenced the degree of industrial agglomeration in Mexico,as industries have increasingly shifted to locations with easy access to the U.S. marketand thereby generated growing employment and incomes in those areas.
In the context of bilateral trade arrangements of FTAs and regional trade arrangementsunder PTAs, the central indicator of a country’s ability to alter its comparative advantageis the degree of trade compatibility between its export structure and that of its tradingpartner. Having established compatibility of traded products, one can then invokeperformance indicators to reveal the extent to which firms compete effectively in theworld and regional markets. Success in export markets – measured by rapidly expandingexports and rising market shares – indicates the extent to which an economy is willingand able to achieve global integration and alter its comparative advantage in the globalmarketplace. In the remainder of this section, we examine Jordan’s trade compatibilitywith the United States from the point of view of its exports, and use a set of performanceindicators to identify those products that could benefit from the U.S.-Jordan FTA. Inparticular, we used the following criteria to select the products with growth potential in

Economic Impact and Implications for Jordan of the Jordan-U.S. FTA Final Report
AMIR Program 28
the U.S. market: (a) the degree of trade compatibility between Jordan and the UnitedStates, (b) Jordan’s recent export growth record, and (c) the trend growth rate of Jordan’sproduct market share.
1. Product Selection Procedure
The analysis of trade compatibility and export performance concentrates on thefollowing: (1) domestic exports of Jordan (excludes re-exports); (2) product aggregationat the 4-digit HS level (disaggregation at the HS 6-digit level yielded excessively highyear-to-year variations and therefore poor trend performance indicators); and (3) dataanalysis based on the period 1994-99, with the product selection procedure based on1997-99 data.
The analysis of Jordan’s exports was divided into the following four types of productexports:
(1) Large traditional product domestic exports, defined as those products that in 1999represented at least JD5 million. There were forty-one (41) products in this range.
(2) Medium-size domestic exports, whose product export value represented betweenJD1 million and JD5 million. There were fifty-one (53) products in this range.
(3) Small-size domestic exports of between JD500,000 and JD1 million. There wereforty-four (44) products in this range
(4) Newly emerging domestic exports of between JD250,000 and JD500,000. Therewere thirty-eight (38) products in this range
Using these value ranges, the total number of products in the sample consisted of 176products out of a total of 613 products. (Exports of the remaining 437 products were eachunder JD250,000.)
2. Trade Compatibility Measure
The trade compatibility index measures the degree of compatibility between Jordan’sexported products and those products imported by the United States. The index ofcompatibility (Cx/m) is computed using the following formula:
Cx/m = 1 – (Σ|xjd - mus|)/2
where xjd is Jordan’s share of good i exports relative to its total exports, and mus is theshare of U.S. good i imports relative to its total imports. The index approaches zero whenJordan exports none of what the United States imports, and it approaches unity when theexports share of product i of Jordan is identical to the import share of that product by theUnited States. According to Michaely (2000), the index of compatibility is usually

Economic Impact and Implications for Jordan of the Jordan-U.S. FTA Final Report
AMIR Program 29
between 0.50 and 0.60 for trade between industrialized countries, and it averages about0.20 for trade between Latin America countries.14
Overall, the unweighted average of the four productcategories for Jordan’s exports and U.S. importsequals 0.43, which lies between the index of tradebetween Latin American countries and that of tradebetween the developed countries (Table 6.1). Withinthese four categories, it is the one of emergingexport products of Jordan that have the highestdegree of trade compatibility with the United States.This category includes a broad set of products thatrange from Dead Sea cosmetics to batteries,
orthopedic appliances, blankets and travel rugs, and machinery for sorting and screeningmineral substances. Jordan’s traditional (large-size) exports are generally less compatiblewith U.S. foreign needs, but at the product level there are a number of products that arecompatible with U.S. import requirements: apparel and clothing accessories, aluminumbars and rods, animal feed and insecticides. There are also a large number of productsthat are highly compatible with U.S. import requirements among the small and mediumsize exports of Jordan: olive oil, luggage, pharmaceuticals, household appliances, ceramicsinks and wash basins, paints and varnishes, articles of jewelry, tarpaulins and awnings,machinery for plant or laboratory equipment, tableware and kitchenware, electricaccumulators, fruit and vegetable juices, chocolate and antibiotics.
3. Trend Growth of Jordan’s Exports and Market Shares
Jordan’s ability to affect its market position based on the competitiveness of itsproducts in the U.S. market has been measured by the trend growth rate ofproduct exports in the four product categories and the ratio of product exportsrelative to U.S. imports of those products. The competitiveness of firms andindustries in the world market and that of the U.S. market in particular arereflected in high rates of export growth and rising market shares. Following theapproach used by the World Bank and others (TradeCan, 2000), the exportperformance of Jordan has been classified into the following four categories:
♦ Rising Stars: Products in which Jordan has a rising market share and U.S.imports are expanding.
♦ Falling Stars: Products in which Jordan has a rising market share but U.S.imports are contracting.
♦ Missed Opportunities: Products in which Jordan has a falling market sharedespite expanding U.S. imports.
14 The index was originally developed by Michaely (1994) and has recently been applied by Rajapatirana(1997) and Michaely (2000) for Latin American trade.
Table 6.1Indices of Trade Compatibility
Jordan Exports Index
Large-Size 0.33Medium-Size 0.42Small-Size 0.34Emerging Exports 0.63Note: See text for definition of exportcategories by size.

Economic Impact and Implications for Jordan of the Jordan-U.S. FTA Final Report
AMIR Program 30
♦ Retreat: Products in which Jordan’s market share is falling and U.S. arecontracting.
Boxes 6.1 through 6.4 show the classification of Jordan’s exports according toproduct size groupings. Clearly, the most desirable products for Jordan are therising star and missed opportunity products, and most of Jordan’s exports in oursample fall within these two categories. There are, however, a number of otherproducts that would have been listed under the falling stars and retreat categoriesthat were not included in the sample. These were the products in each export-sizecategory that have a negative export growth trend in 1997-1999, and which wouldhave been likely to have experience a declining market share during that periodhad they been included in the sample.
Box 6.1Export and U.S. Market Performance of Jordan’s Large-Size Exports
Jordan'sMarketShare U.S. Imports
Expanding Contracting
Rising
Rising Stars:Aluminum bars and rodsTubes, hoses, and fittingsArticles of apparelAnimal feedWomen's vestsVegetable fats and oilsSacks and bagsCartons and boxesAmmonium carbonatePrinted books and brochuresAir conditioning machinesSoapMedicamentsDiphosphours pentaoxideTelevision receiversFurniture and parts
Falling Stars:Salt and pure sodium chlorideMolding boxes for metal foundry
Falling
Missed Opportunities:Aluminum waste and scrapInsecticidesPacking productsTomatoes, fresh or chilledChemical fertilizers
Retreats:(None) a/
a/ Jordan’s exports with negative growth rates were excluded from the sample; otherwise they would appear in the retreat andmissed opportunities product lists.

Economic Impact and Implications for Jordan of the Jordan-U.S. FTA Final Report
AMIR Program 31
Box 6.2Export and U.S. Market Performance of Jordan’s Medium-Size Exports
Jordan'sMarketShare U.S. Imports
Expanding Contracting
Rising
Rising Stars:Track suits and ski suitsPaints and varnishesArticles of jewelryTarpaulins and awningsWashing machinesMachines cleaning, grading seedNatural sands of all kindsTrunks and suitcasesOlive oilLiquid pumpsPolymers of vinyl chlorideBoards, panels and cabinetsParts suitable for machineryMen's underpants and briefsAluminum casks and similar containersWadding of textile materialsSeats
Falling Stars:Soybean oil
Falling
Missed Opportunities:Ceramic sinks; wash basinsMachinery and laboratory equipmentYeastsSynthetic filament yarnRefrigerators and freezersNon-woven garmentsFood preparations nesRegisters and notebooksCabbages, cauliflowers and kaleInsulated wire cableMotor vehicles parts and accessories
Retreat:(None) a/
a/ Jordan’s exports with negative growth rates were excluded from the sample; otherwise they would appear in theretreat and missed opportunities product lists.

Economic Impact and Implications for Jordan of the Jordan-U.S. FTA Final Report
AMIR Program 32
Box 6.3Export and U.S. Market Performance of Jordan’s Small-Size Exports
Jordan's Market ShareU.S. Imports
Expanding Contracting
Rising Stars:Safety glassElectric accumulatorsUncoated craft paper and paperboardFruit and vegetable juicesAntibioticsWomen's or girls' overcoatsMen's or boys' suitsOptical fibers and optical fiber bundlesOnions, shallots, garlic and leeksStoppers, caps and lidsTrailers and semi-trailersBaths, shower- baths, and wash basinsCheese and curdLead waste and scrapMineral or chemical fertilizers, phosphatesMen's vestsMarble and other building stoneApricots, cherries and peachesElectronic integrated circuits
Falling Stars:Glycerol (glycerin)
Falling
Missed Opportunities:Tableware and kitchenwareUncoated paper and paperboardChocolateSugar confectioneryPaper and paperboardInterchangeable tools for hand toolsGelatinInstruments used in medical sciencesElectrical apparatus for line telephony
Retreat:(None) a/
a/ Jordan’s exports with negative growth rates were excluded from the sample; otherwise they would appear in the retreat andmissed opportunities product lists.
Box 6.4Export and U.S. Market Performance of Jordan’s Emerging Exports
Jordan's Market ShareU.S. Imports
Expanding ContractingRising Stars:BatteriesBlankets and travel rugsGarments, not knitted or crochetedPerfumes and toilet watersCellulose and its chemical derivativesEmbroidery in the pieceEnvelopes and correspondence cardsWire of base metal with flux materialMen's overcoats
Falling Stars:Articles of apparel and clothingaccessories
Falling
Missed Opportunities:Vegetables prepared or preservedOrthopedic appliancesMechanical appliancesMachinery for screening mineralsYarn of synthetic staple fibersAluminum structuresGlazed ceramic flags and pavingPolishes for footwear and furniture
Retreat:(None) a/
a/ Jordan’s exports with negative growth rates were excluded from the sample; otherwise they would appear in the retreat andmissed opportunities product lists.

Economic Impact and Implications for Jordan of the Jordan-U.S. FTA Final Report
AMIR Program 33
B. U.S. Tariffs on Jordan’s Exports
Under the U.S.-Jordan FTA, tariffs on virtually all trade between Jordan and the UnitedStates are to be eliminated within 10 years. The tariff reductions are set to take place infour stages:
; Tariffs of less than 5 percent will be phased out in two years; Tariffs that are between and 5 and 10 percent will be eliminated in four years; Tariffs that are between 10 and 20 percent will be removed in five years; Tariffs that are more than 20 percent will be eliminated in 10 years
Table 6.2 shows the current U.S. tariffs on Jordan’s products identified as either risingstars and those that have experienced lost opportunities in recent years. Some of theseproducts already enter the United States under preferential duty-free access under theGSP. For example, precious metal (other than silver) articles of jewelry enters the U.S.market duty-free under the GSP (Ruebner, 2000).
These are the nearly 100 Jordanian products whose market shares have been rising at thesame time that U.S. imports have been expanding (i.e., the rising stars), or those productswhose market shares have been falling despite expanding U.S. imports (i.e., the lostopportunities). Of these products, none have tariffs in the United States that exceed 20percent. Thirteen (13) products have U.S. tariffs in the 10-20 percent range; eighteen (18)products have tariffs in the 5-10 percent range; forty-two (42) products have tariffs under5 percent; and twenty-one (21) products have zero-rate tariffs.
1. Textiles and Apparel15
Unlike many other U.S. manufacturing sectors, imports of textiles and apparel are subjectto relatively high ad valorem tariffs. A large portion of trade in these products takes placeunder bilateral and multilateral agreements that allowed for the use of bilateral quotas tocontrol import flows. Most U.S. imports from Mexico and Canada qualified forpreferential duty treatment under NAFTA. Imports from Israel under the U.S.-Israel FreeTrade Agreement also qualify. In addition, duty-free treatment under the Caribbean BasinEconomic Recovery Act (CBERA) is applied to textiles and apparel made of silk andnon-cotton vegetable fibers. Finally, imports from a number of countries qualify forreduced duty treatment under heading 9802.00.80 of the Harmonized Tariff Schedule ofthe United States. Although the majority of imports covered by these quotas correspondto specific textile and apparel industry categories, a small percentage corresponds toproduction of other types of goods such as man-made fibers, luggage and handbags, andboot and shoe cut stock and findings. Under its WTO commitments, the United Stateswill reduce its tariffs on textile and apparel products by January 1, 2004.
15 The material in this and subsequent sub-sections draws from the comprehensive study on U.S. importbarriers by the USITC (1999).

Economic Impact and Implications for Jordan of the Jordan-U.S. FTA Final Report
AMIR Program 34
Table 6.2U.S. Tariffs on Selected Jordanian Exports
0406 Cheese and curd . 18.7%6103 Men's or boys' suits 15.8%2106 Food preparations not elsewhere specified 15.3%1806 Chocolate and other food preparations with cocoa 14.6%6102 Women's or girls' overcoats 14.2%6908 Glazed ceramic flags and paving 13.3%2009 Fruit and vegetable juices 13.2%1704 Sugar confectionery 12.0%0704 Cabbages, cauliflowers and kale 11.6%6201 Men's or boys' overcoats 11.6%5509 Yarn of synthetic staple fibers 11.5%4202 Trunks, suit-cases, vanity-cases and brief-cases 10.9%2309 Animal feed 10.6%6301 Blankets and travel rugs 9.4%6208 Women's or girls' vests 9.3%6107 Wen's or boys' underpants and briefs 8.9%6207 Men's or boys' vests 8.7%5402 Synthetic filament yarn 8.1%0703 Onions, shallots, garlic and leeks 8.0%5810 Embroidery in the piece 8.0%6305 Sacks and bags 6.6%6210 Garments, not knitted or crocheted 6.5%3922 Baths, shower- baths, and wash basins 6.3%7113 Articles of jewelry and parts thereof 6.2%5601 Wadding of textile materials 5.9%6306 Tarpaulins and sun blinds 5.8%6910 Ceramic sinks; wash basins 5.8%7610 Aluminum structures 5.7%3912 Cellulose and its chemical derivatives 5.3%7007 Safety glass 5.0%3904 Polymers of vinyl chloride 5.0%2005 Other vegetables prepared or preserved 4.9%3503 Gelatin 4.4%8207 Interchangeable tools for hand tools 4.4%3924 Tableware and kitchenware 4.1%3808 Insecticides 4.0%3923 Packing products 3.7%702 Tomatoes, fresh or chilled 3.5%3208 Paints and varnishes 3.5%8528 Television receivers 3.4%1515 Other fixed vegetable fats and oils 3.4%8507 Electric accumulators 3.3%2102 Yeasts 3.2%3917 Tubes, hoses, and fittings 3.1%7604 Aluminum bars, rods and profiles 3.0%9001 Optical fibers and optical fiber bundles 2.8%
Continued

Economic Impact and Implications for Jordan of the Jordan-U.S. FTA Final Report
AMIR Program 35
Table 6.2 (Continued)U.S. Tariffs on Selected Jordanian Exports
8544 Insulated wire cable 2.7%7612 Aluminum casks, drums and similar containers 2.7%8506 Primary cells and primary batteries 2.7%8537 Boards, panels, consoles, desks, and cabinets 2.7%2836 Carbonates and commercial ammonium carbonate 2.3%8450 Washing machines 2.2%1509 Olive oil and its fractions 1.9%4823 Paper, paperboard, and cellulose wadding 1.7%4818 Articles of apparel; clothing accessories 1.7%4817 Envelopes, letter cards and correspondence cards 1.7%4819 Cartons and boxes 1.6%2515 Marble and other building stone 1.5%4820 Registers, account books, and notebooks 1.4%8309 Stoppers, caps and lids 1.3%8415 Air conditioning machines 1.3%8708 Motor vehicles parts and accessories 1.3%8716 Trailers and semi-trailers 1.2%8419 Machinery, plant or laboratory equipment 0.9%3302 Mixtures of odoriferous substances and mixtures 0.8%8424 Mechanical appliances 0.7%4804 Uncoated craft paper and paperboard 0.7%4802 Uncoated paper and paperboard 0.6%8413 Pumps for liquids. 0.5%2941 Antibiotics 0.3%8418 Refrigerators and freezers 0.2%5603 Non-woven garments 0.1%809 Apricots, cherries and peaches 0.1%2505 Natural sands of all kinds 0.0%2809 Diphosphours pentaoxide; polyphosphoric acids 0.0%3003 Medicaments 0.0%3103 Mineral or chemical fertilizers, phosphates 0.0%3104 Mineral or chemical fertilizers, potassic. 0.0%3303 Perfumes and toilet waters 0.0%3401 Soap, organic 0.0%3405 Polishes and creams for footwear and furniture 0.0%4901 Printed books and brochures 0.0%7602 Aluminum waste and scrap 0.0%7802 Lead waste and scrap 0.0%8311 Wire and others of base metal coated with flux material 0.0%8431 Parts suitable for machinery 0.0%8437 Machines for cleaning, sorting or grading seed 0.0%8474 Machinery for sorting or screening mineral substances 0.0%8517 Electrical apparatus for line telephony 0.0%8542 Electronic integrated circuits 0.0%9018 Instruments used in medical sciences 0.0%9021 Orthopedic appliances 0.0%9401 Seats 0.0%9403 Other furniture and parts. 0.0%
Source: USITC.

Economic Impact and Implications for Jordan of the Jordan-U.S. FTA Final Report
AMIR Program 36
Under the Agreement on Textiles and Clothing (ATC) that went into effect on January1995 as a part of the WTO agreements, the United States and the three other WTOmembers with MFA quotas (the EU, Canada, and Norway), agreed to eliminate the textileand apparel quotas over a 10-year period that ends on January 1, 2005. At that time, alltrade in textiles and apparel among WTO members will have been integrated into theGATT regime and thus will be subject to the same trade rules as goods of other sectors.
The ATC calls for quotas to be phased out in four stages:
(1) Stage 1: Beginning in January 1995, the WTO members integrated 16 percent ormore of their textile and apparel trade into the GATT regime, based on theirrespective 1990 import volumes, and countries implement accelerated annualgrowth rates for the remaining quotas, with an increase of 16 percent for themajor supplier countries and 25 percent for small suppliers.
(2) Stage 2: Beginning in January 1998, an additional 17 percent of trade wasintegrated into the GATT regime and quota growth rates were increased by 25percent and 27 percent, respectively, for the major and small supplier countries.
(3) Stage 3: Beginning in January 2002, an additional 18 percent of trade will beintegrated into the GATT regime and annual growth rates for the remainingquotas will be increased by 27 percent.
(4) Stage 4: As of January 2005, the remaining 49 percent of textiles and appareltrade will be integrated into the GATT regime.
2. Cheese and Other Dairy Products
The United States imposes tariff-rate quotas (TRQs) on several dairy products (e.g.,cheese, nonfat dry milk, and fluid milk). For these products to receive the in-quota rate,importers must obtain a license issued by the U.S. Department of Agriculture (USDA).The import license identifies the product, the country from which it may be imported, andthe maximum quantity that can be imported. The license can be renewed as long as theimporter has met the requirements of the regulation. In addition to these licensingrequirements, U.S. imports of dairy products are also subject to health and sanitaryregulations. The magnitude of these import restrictions on cheese and other dairyproducts is substantial. A recent USITC (1999) recently found that trade liberalizationwould have the greatest impact on the cheese sector.
3. Confectionary Sugar
Confectionary sugar in the United States is regulated by a system of TRQs is used torestrict the volume of sugar imports. These quotas are applied to five categories ofproducts: (1) blended syrups containing sugar, not in retail containers; (2) ediblepreparations containing over 65 percent sugar, not in retail containers; (3) sweetenedcocoa powder; (4) flour mixes and dough containing over 10 percent sugar, except dough

Economic Impact and Implications for Jordan of the Jordan-U.S. FTA Final Report
AMIR Program 37
in retail containers; and (5) edible preparations containing over 10 percent sugar. TheTRQ for refined sugar is on a global first-come, first-served basis.
4. Tobacco and Tobacco Products
In the United States, a TRQ applies to imports of leaf tobacco and manufactured tobaccoused in the production of cigarettes for domestic consumption, mainly flue-cured andburley tobacco. Under a Presidential Proclamation that became effective in September1995, TRQ allotments were negotiated with supplier countries based on production levelsand market share. These TRQ specify the maximum quantity that can be imported at alow tariff rate during the quota-year. The U.S. Customs Service tracks the quantity ofimports from the countries of origin on a first-come, first-served basis.

Economic Impact and Implications for Jordan of the Jordan-U.S. FTA Final Report
AMIR Program 38
Chapter 7: Potential FTA Impact on Exports
A. FTA-Related Tariff Liberalization
Expenditure-switch policies in the form of tariffs create a ‘price wedge’ between thedomestic price to the consumer in the United States and the world market price of theproduct. This wedge effectively imposes a tax on the consumer. The tax rate, denoted t,raises the price of the product to (1+t)P in the United States. The relative prices of Jordanand its competitors to the U.S. market remain unaltered: that of Jordan (denoted i) is Pi/Pand that of its competitors (denoted k) is Pk/P. In the case of a small market like that ofU.S.-Jordan trade flows, the effect of trade liberalization is simply determined by theamount of the reduction in the price wedge (i.e., the magnitude of the tariff reduction)and by the responsiveness of consumers to price changes (i.e., the price elasticity ofimport demand). A change in the quantity demanded of the product because ofprotectionist measures in the U.S. market would therefore bring about a proportionalchange in the demand for the product supplied by Jordan and other foreign suppliers tothe U.S. market. As such, we can calculate the effect of a tariff reduction in the U.S.market on Jordan’s exports of each product from the estimate of the import demandschedule.
Although the approach includes the imperfect-competition features of the ‘new tradetheory’, the small market response to trade liberalization is similar to that which wouldoccur under perfect competition: tariff reductions in a sector cause domestic buyers offinal and intermediate products to substitute toward imports, thereby causing domestic-competing industries to contract production while Jordanian exporters expand theirshipments.16 Annex A describes the econometric model used to measure the effect oftariff reductions for individual products on U.S. imports and Jordanian exports.
Table 7.1 shows the hypothetical impact on US$100,000 worth of exports from Jordan tothe U.S. market for each of the 94 products that are either rising stars or haveexperienced lost opportunities in recent years. As expected, the largest gains wouldaccrue to those products that currently face relatively high tariffs. The gain in exportrevenue from these products currently facing tariffs of 10 to 20 percent ranges from 3 to 5percent a year over the 5-year period of tariff reductions, and it averages 3.7 percent ayear for the increased export value of all of these products during that period. For thoseproducts currently facing tariffs in the range of 5 to 10 percent, the export revenue gainwould equal between 2 and 3.5 percent a year over a four-year period, and average 2.5percent a year for their combined value during that period. Finally for those productscurrently facing tariffs in the 0 to 5 percent range, the annual gain in revenue would equalbetween 0.1 and 3.6 percent over a two-year period.
16 The new theory of trade incorporates increasing returns to scale, imperfect competition, and productvariety to explain trade. For a description of its theory and dynamic specification, see Lord (1991).

Economic Impact and Implications for Jordan of the Jordan-U.S. FTA Final Report
AMIR Program 39
Table 7.1Impact of U.S.-Jordan FTA on Sample of Jordan's Exports
Percent Change in Export Revenue from
Previous Year
HS Code Commodity Description Tariff Yr 1 Yr 2 Yr 3 Yr 4 Yr 5
NPV of 5-Year
AdditionalRevenue on
$100,000Initial
Exports
0406 Cheese and curd 18.7% 4.7% 4.9% 5.0% 5.2% 5.4% $ 61,756
6103 Men's or boys' suits 15.8% 4.1% 4.2% 4.3% 4.5% 4.6% $ 52,693
2106 Food preparations not elsewhere specified 15.3% 4.0% 4.1% 4.2% 4.3% 4.4% $ 50,993
1806 Chocolate and food preparations with cocoa 14.6% 3.8% 3.9% 4.0% 4.1% 4.3% $ 48,989
6102 Women's or girls' overcoats 14.2% 3.7% 3.8% 3.9% 4.0% 4.1% $ 47,691
6908 Glazed ceramic flags and paving 13.3% 3.5% 3.6% 3.7% 3.8% 3.9% $ 44,621
2009 Fruit and vegetable juices 13.2% 3.5% 3.6% 3.7% 3.8% 3.9% $ 44,458
1704 Sugar confectionery 12.0% 3.2% 3.3% 3.4% 3.4% 3.5% $ 40,522
0704 Cabbages, cauliflowers and kale 11.6% 3.1% 3.2% 3.2% 3.3% 3.4% $ 39,215
6201 Men's or boys' overcoats 11.6% 3.1% 3.2% 3.2% 3.3% 3.4% $ 39,115
5509 Yarn of synthetic staple fibers 11.5% 3.1% 3.2% 3.2% 3.3% 3.4% $ 38,950
4202 Trunks, suit-cases and brief-cases 10.9% 3.0% 3.0% 3.1% 3.1% 3.2% $ 37,094
2309 Animal feed 10.6% 2.9% 2.9% 3.0% 3.0% 3.1% $ 35,882
6301 Blankets and travel rugs 9.4% 3.2% 3.3% 3.4% 3.5% - $ 37,880
6208 Women's or girls' vests 9.3% 3.2% 3.2% 3.3% 3.4% - $ 37,228
6107 Men's or boys' underpants and briefs 8.9% 3.1% 3.1% 3.2% 3.3% - $ 35,872
6207 Men's or boys' vests 8.7% 3.0% 3.0% 3.1% 3.2% - $ 34,902
5402 Synthetic filament yarn 8.1% 2.8% 2.9% 2.9% 3.0% - $ 32,745
0703 Onions, shallots, garlic and leeks 8.0% 2.8% 2.8% 2.9% 2.9% - $ 32,306
5810 Embroidery in the piece 8.0% 2.8% 2.8% 2.9% 2.9% - $ 32,148
6305 Sacks and bags 6.6% 2.3% 2.3% 2.4% 2.4% - $ 26,632
6210 Garments, not knitted or crocheted 6.5% 2.3% 2.3% 2.3% 2.4% - $ 26,188
3922 Baths, shower- baths, and wash basins 6.3% 2.2% 2.3% 2.3% 2.3% - $ 25,571
7113 Articles of jewelry and parts thereof 6.2% 2.2% 2.2% 2.3% 2.3% - $ 25,266
5601 Wadding of textile materials 5.9% 2.1% 2.1% 2.1% 2.2% - $ 23,843
6306 Tarpaulins and awnings 5.8% 2.0% 2.1% 2.1% 2.1% - $ 23,392
6910 Ceramic sinks; wash basins 5.8% 2.0% 2.1% 2.1% 2.1% - $ 23,377
7610 Aluminum structures 5.7% 2.0% 2.0% 2.1% 2.1% - $ 23,177
3912 Cellulose and its chemical derivatives 5.3% 1.9% 1.9% 2.0% 2.0% - $ 21,748
7007 Safety glass 5.0% 1.8% 1.8% 1.8% 1.9% - $ 20,534
Total of 94 Products - 2.2% 2.2% 1.3% 1.3% 0.7% $ 1,581,464of which a/:
13 Products with 10-20% Tariffs: 10-20% 3.5% 3.6% 3.7% 3.8% 3.9% $ 581,979
18 Products with 5-10% Tariffs: 5-10% 2.5% 2.6% 2.4% 2.4% - $ 509,274
42 Products with Under 5% Tariffs: 0-5% 1.6% 1.6% - - - $ 490,212Notes: Calculations based on actual US tariffs, and uniform initial Jordanian export levels of US$100,000 to the US market, anduniform price elasticities of import demand to allow for cross-product comparisons.a/ There are an additional 21 products in the sample with 0% tariffs in the United States.

Economic Impact and Implications for Jordan of the Jordan-U.S. FTA Final Report
AMIR Program 40
Given the timeline of the tariff reduction schedule, export revenue changes from tariffs inthe 10 to 20 percent range are likely to be more beneficial to Jordan that if it confrontedtariffs in excess of 20 percent in any of the 94 products. Sensitivity analysis on theselected products showed that the net present value of the potential flow of futurerevenue from the FTA would be higher for the medium-to-low tariff products having ashorter implementation period than those products with high-tariffs having a longerimplementation period. For example, the estimated net present value of the additionalrevenue for Jordanian cheese and curd exports to the United States under the existing 19percent tariff was nearly 20 percent higher than for a hypothetical export facing a 25percent tariff in the U.S. market. The fact that the FTA will eliminate tariffs on arelatively fast track for the types of products exported by Jordan will therefore be morebeneficial to exporters than if they faced high tariffs in the United States. The exportrevenue gains to Jordan from the FTA are intended to be primarily illustrative since weused the same price elasticity across products to allow for comparison of the effects ofdifferent tariff reduction schedules under the FTA. Also, we have not captured theeconomy-wide effects of dynamic changes in efficiency and economic growth. Theseeffects would include not only direct U.S.-Jordan bilateral trade, but also output andemployment in the goods and services sectors of the Jordanian economy. 17
B. U.S. Market Access Regulations
The U.S.-Jordan FTA is supported by rules of origin that ensure that exporters do notimport goods from outside to re-export them within the FTA. The rules of origin of theU.S.-Jordan FTA are specified in Annex 2.2 of the Agreement and require that the sum ofthe cost or value of the materials produced in Jordan plus their direct processing costs beno less than 35 percent of the value of the product exported to the United States.18 Indetermining the 35 percent domestic content requirement, the cost of materials used inthe production of a product in Jordan, and which are products of the United States, can becounted in an amount up to 15 percent of the appraised value of the product. That is, theproducts can be manufactured in either Jordan or the United States, but the contributionof materials by the United States cannot exceed 15 percent of the value of the product. 19
17 For comparable economy-wide analyses of the FTA of Morocco with the EU under the Euro-MedAgreements (EMAs), see Rutherford, Ruström, and Tarr (1993); for the FTA of Tunisia with the EU, seeBrown, Deardorff, and Stern (1997); for the FTA of Egypt with the EU, see Konan and Maskus (1997) andDessus and Suwa-Eisenmann (1998).18 From a legal point of view, there appear to be four types of rules of origin. These are (a) requirements interms of domestic content, (b) requirements in terms of a change in tariff heading (CTH), (c) requirementsin terms of specified processes that must be performed within the FTA, and (d) requirements that theproduct has been substantially transformed (Krishna and Krueger, 1995). The U.S.-Jordan FTA rules oforigin refer to domestic content and substantial transformation of products.
19 Though the rules of origin have been criticized for their protectionist effects, especially by Krueger(1999), they can lead to an improvement in efficiency by reversing the trade-diverting effect of a tariffpreference on the final good. Falvey and Reed (1997) and Ju and Krishna (1996) offer further discussion ofthe analytic aspects of the rules of origin.

Economic Impact and Implications for Jordan of the Jordan-U.S. FTA Final Report
AMIR Program 41
The Industrial Development Department of the Ministry of Industry and Trade hasrecently completed a useful study on the rules of origin of the U.S.-Jordan FTA and theQIZs (Industrial Development Department, 2001). Based on a survey of ten companiesthat were considered to be representative of the pharmaceutical, garment, carpet,electrical products, vegetable oil and gold industries, the study estimated the contributionof the representative companies to the value added of their products. Following the FTAand QIZ rules of origin, the study calculated the domestic contribution as the combinedsum of domestic production costs and direct industrial expenses relative to the free onboard (fob) value of the final product exported.20
Of the ten companies, eight met or nearly met the rules of origin requirements underregulations governing both the FTA and QIZs. Only the pharmaceutical and jewelrycompanies fell considerably short of the 35 percent requirement because of the largeshare of their raw material inputs originating from foreign sources. Those companies withdomestic value added shares that well exceeded the rules of origin requirements wererepresentatives of the garment, carpet and vegetable oil industries, while those companiesthat fell somewhat short of the rules of origin requirements were part of the electricalmachinery industry. In the short run, these rules of origin requirements can raise theproduction cost of industries by forcing a shift to higher cost inputs from domesticsources. The FTA may therefore be trade diverting if there is a shift from lower to highercost sources of supply, rather than having the desired effect of being trade creating byshifting production from higher to lower cost sources of supply. In the long run theeffects are highly dependent on the form of the structure of the industry and its market.21
In addition to these requirements, there are a number of regulations affecting access tothe U.S. market. These regulations cover product standards and testing and certificationprocedures in general, phytosanitary requirements for agricultural products, and U.S.Food and Drug Administration (USFDA) requirements for pharmaceutical products.
20 The fob price of the final product includes material inputs plus direct and indirect industrial expensesplus profits. Direct industrial expenses include the cost of labor, depreciation of machinery, productinspection, design costs, research and development, and utilities.
21 See, for example, Krishna and Krueger (1995). For further analysis of rules of origin of FTAs and theirwelfare effects on developing countries, see Ju and Krishna 1996). Also, Falvey and Reed (1997) assess theequivalence of rules of origin and commercial policy instruments.
Economic Impact and Implications for Jordan of the Jordan-U.S. FTA Final Report
AMIR Program 42
Chapter 8: Potential FTA Impact on Imports
A. Trade Complementarities
Jordan currently obtains about 10 percent of its total imports from the United States, andthose imports are concentrated in a relatively few number of products. The top 36products account for over two-thirds of total imports from the United States and, of these,14 products account for one-half of all imports (Table 8.1). The extent to which Jordanianbusinesses will be affected by the U.S.-Jordan FTA will depend on the magnitude ofexisting protection from foreign competition, as well as the effect that bilateral tradeliberalization will have on the cost of their inputs.
Table 8.2 shows the nominal MFN tariffs currently applied to the top 36 productsimported from the United States. That table also shows the extent to which these productsare both exported and imported by Jordan. This intra-industry trade (IIT), or two-waytrade, is generally associated with the existence of product differentiation between similartypes of goods.22 The measure of intra-industry trade compares the proportion of acountry’s exports and imports of goods originating from the same industry with thatcountry’s overall trade. The IIT indices that are near zero imply that little or no intra-industry trade exists, since either Jordan’s exports or imports of that industry approach zero.In contrast, IIT indices that approach 100 imply that Jordan’s exports of products from anindustry are nearly the same as the amount of imports from that same industry, and thereforeall trade is intra-industry trade.
About one-half of Jordan’s major imports from the United States occurs in products inwhich significant two-way trade exists. This intra-industry trade is highest in cigarettes,vegetable fats and oils, tractor parts, refrigerators, sunflower seed and oil, dryers,furniture and orthopedic appliances. There is no two-way trade in wheat, aircraft andtheir parts, rice, corn, chemical wood pulp, automated data processing machines andautomobiles. Of the products with high IIT indices, vegetable fats and oil imports fromthe United States are not expected to increase significantly since exports have beenentering Jordan under U.S. Government export assistance program GSM 102/103 (U.S.credit Guarantee programs) and Public Law 480 (food aid) (ITC, 2000).
The USITC (2000) has also identified specific U.S. exports that might increase theirpenetration of the Jordanian market as a result of the FTA. Of the 16 products examined,about one-half were products with high IIT indices listed in Table 8.2. The productsexamined were the following:
22 Two-way trade provides a good indication of inward FDI opportunities since foreign companies can achieveeconomies of scale through cross-border joint ventures. For an analysis of two-way trade and FDI growthopportunities, see Lord (1999).

Economic Impact and Implications for Jordan of the Jordan-U.S. FTA Final Report
AMIR Program 43
Table 8.1Jordan: Top Imports from the United States
HS Code DescriptionValue
(‘000 US$) Percent of Total
1001 Wheat and Muslin 26,803 9.9%
8803 Airplanes and Parts 25,641 9.5%
1006 Rice 14,330 5.3%
1005 Corn (Maize) 10,926 4.0%
1515 Vegetable Fats And Oils 10,583 3.9%
2403 Tobacco Manufactures 9,308 3.4%
8431 Machinery Parts 6,353 2.4%
4703 Chemical Wood Pulp 6,099 2.3%
1507 Soybean Oil 5,738 2.1%
8471 Automatic Data Processing Machines 4,040 1.5%
9018 Medical Instruments 3,672 1.4%
8414 Air Or Vacuum Pumps 3,657 1.4%
8703 Motor Cars 3,601 1.3%
1512 Sunflower Seed and Oil 3,501 1.3%
9301 Military Weapons 3,367 1.2%
9306 Munitions 3,323 1.2%
8418 Refrigerators 2,998 1.1%
1502 Fats Of Bovine Animals, Sheep Or Goats 2,983 1.1%
8412 Engines Motors and Parts Thereof 2,845 1.1%
8421 Centrifuges, including Dryers 2,685 1.0%
8536 Electrical Switches Electrical Circuit Protectors 2,555 0.9%
9403 Furniture 2,454 0.9%
3004 Medicaments 2,450 0.9%
1209 Seeds 2,387 0.9%
9021 Orthopedic Appliances 2,274 0.8%
9032 Automatic Controlling Instruments 2,221 0.8%
9802 Articles Donated For Relief Or Charity 2,028 0.8%
0802 Nuts , Fresh Or Dried 2,018 0.7%
8802 Aircraft 1,938 0.7%
7303 Tubes and Pipes of Cast Iron 1,918 0.7%
2402 Cigars and Cigarettes 1,883 0.7%
6309 Worn Clothing 1,626 0.6%
8708 Parts And Accessories for Tractors 1,622 0.6%
8525 Transmission Apparatus for Radiotelephony 1,603 0.6%
1901 Malt Extract; Food Preparations of Flour 1,575 0.6%
8413 Pumps For Liquids 1,511 0.6%
Total 184,516 68.3%Source: Derived from data of Department of Statistics and USITC.

Economic Impact and Implications for Jordan of the Jordan-U.S. FTA Final Report
AMIR Program 44
§ Animal and vegetable fats and oils§ Cereals (wheat, rice and corn)§ Citrus fruit and juices§ Crude petroleum§ Electronics§ Fertilizers§ Iron and steel mill products§ Jewelry§ Live animals§ Machinery and transportation equipment§ Nuts§ Pharmaceuticals§ Phosphates§ Potash§ Textiles and apparel§ Vegetables
Of the other products examined by the USITC, little if any penetration into the Jordanianmarket is expected for crude petroleum, fertilizers, jewelry, phosphates and potash.Negligible penetration is expected in citrus fruit and juices, vegetables, live animals, nuts,and textile and apparel (mainly in the form of artificial filament, cotton and manmadefiber fabrics).
Three of these categories were examined by the USITC study in detail: cereals (otherthan wheat), electric machinery, and machinery and transport equipment. The findingsindicated that U.S. exports of cereals to Jordan could increase by 14 percent, that exportsof electrical machinery could double, and that machinery and transport equipment couldexpand by nearly 40 percent. While these increases are insignificant relative to total U.S.exports in those categories, they are important for Jordan. Also, the removal of tariffs onJordanian imports of U.S. steel could divert imports of low-quality Russian andUkrainian steel to U.S. suppliers.
B. Nominal and Effective Protection
Tariffs have been an important source of government revenue and they have served toprotect the local market for domestic industries. The existence of tariff escalation has alsopromoted the production of final goods in place of intermediate and capital goods, othermaterial inputs, and non-traded commodities, which is typical of the now-disfavoredimport-substitution policy. To the extent that the U.S.-Jordan FTA eliminates tariffs oninputs and their final products, it will tend to favor more efficiently produced goodswhether produced domestically or in the United States, and it will raise consumerwelfare. Perhaps more importantly, it will liberate valuable resources from lessproductive sectors for use in Jordan’s industries having true comparative advantage.Under these circumstances, it is useful to examine the magnitude of protection of

Economic Impact and Implications for Jordan of the Jordan-U.S. FTA Final Report
AMIR Program 45
industries and their value added under both existing levels of protection and bilateral freetrade with the United States.
The extent of this protection can be measured by the effective rate of protection (ERP). Incontrast to the nominal rate of protection (NRP) that measures the extent of protection bythe difference between the border price of foreign-made products and the price ofdomestic import-substitutes made by local producers, the ERP measures the increase invalue-added of the protected industry over value added of that same industry measured interms of border prices.23 For an industry or firm, the value added is the differencebetween the total value of output and the cost of the intermediate inputs used in theproduction of the final product. Since the value added measures the return to capital andlabor used in the industry or firm, the larger the proportion of low-tariff imports used inthe production of the product the higher the ERP, and therefore the more attractive theindustry is for investment. Similarly, the magnitude of ERP rises steeply as the amount ofvalue-added components becomes smaller relative to inputs. For this reason, low value-added production that simply mixes imported materials, packages or assembled productsare potentially high ERP industries.
Analysis of ERPs across industries can show how Jordan’s present tariff structureinfluences the production and the distribution of benefits and costs among the Jordanianindustries and consumers, as well as the extent to which the U.S.-Jordan FTA is likely toshift the existing tariff-induced bias away from import substitution to export expansionand investment in the production of non-tradables. The analysis, however, requires theapplication of technical coefficients of production derived from input-output tables to thetotal value of the tradable material inputs. Since an input-output table for Jordan does notexist, we have limited the present analysis to an illustrative product (furniture) for whichtechnical coefficients of production can be constructed from other available IO tables.
In the case of Jordan’s production of furniture, we can first consider an example wherefurniture is produced using only one tradable input, wood (for an overview of recentexport performance of Jordan’s furniture products, see Table 8.3). Let US$100 worth offurniture require US$55 worth of wood without any tariff distortions.24 Under free trade,the value added would be US$45. With an existing tariff of 30 percent applied to the final
23 In practice, calculation of the ERP is based on the measurement of the difference between the observedvalue added with the existing tariff structure and that estimated for the industry under free trade. The valueadded under free trade is calculated by deducting from the observed value added the revenue equivalent ofthe tariff on the industry’s output and the cost equivalent of the tariffs affecting intermediate inputs used inproduction. Specifically, the ERP for a product is the percentage excess of domestic value added, V, overthe international market value added, W, that value added that would have been realized in the absence ofthe existing tariff structure. The difference between V and W, expressed as a percentage of W is the ERP,i.e. ERP = (V - W) / W.
24 In practice, the observed technical coefficients in Jordan include the effects of tariff distortions. We canrecover the technical coefficients that would exist without the tariff distortions by eliminating thosedistortions from the domestic price of the product and its inputs (see Annex A).

Economic Impact and Implications for Jordan of the Jordan-U.S. FTA Final Report
AMIR Program 46
product, then furniture would now sell for US$130 in the domestic market.25 However,using the ERP formula, we would find the value-added available for profits and non-tradable inputs to be much higher at 66 percent (the 30 percent tariff divided by the 45percent domestic value added). Naturally, this profit would be eroded if the tradable inputwere also subject to a tariff. For input tariffs of 10, 20 and 30 percent the ERP wouldsuccessively fall to 54, 42 and 30 percent. Thus the ERP shows the extent to which anindustry is afforded a relative advantage because of a graduated tariffs structure over onethat is uniform.
25 The current nominal tariff of 30 percent applies to imports of nearly all types of furniture listed in Table8.3. Imports for modernization and renewal of hotels and hospitals, however, are exempt from duties andtaxes on furniture once every seven years (U.S. Department of State, 2001).

Economic Impact and Implications for Jordan of the Jordan-U.S. FTA Final Report
AMIR Program 47
Table 8.2Tariffs and Two-Way Trade in Jordan's Major Imports from the United States
HS Code Description MFN TariffIntra-IndustryTrade Index
2402 Cigars and Cigarettes 100% 94.8
1515 Vegetable Fats And Oils 5% 83.3
8708 Parts And Accessories for Tractors 30% 81.7
8418 Refrigerators 30% 80.4
1512 Sunflower Seed and Oil 5-10% 66.7
8421 Centrifuges, including Dryers 0-30% 53.9
9403 Furniture 30% 48.1
9021 Orthopedic Appliances 0% 46.6
1507 Soybean Oil 5% 39.5
9018 Medical Instruments 0% 38.5
8431 Machinery Parts 30% 37.2
8413 Pumps For Liquids 5-30% 36.2
8414 Air Or Vacuum Pumps 10% 14.4
2403 Tobacco Manufactures 70% 12.4
1901 Malt Extract; Food Preparations of Flour 0-30% 10.4
8536 Electrical Switches Electrical Circuit Protectors 30% 8.9
1209 Seeds 5% 7.9
3004 Medicaments 5% 5.0
6309 Worn Clothing 30% 3.8
8412 Engines Motors and Parts Thereof 0% 1.8
9032 Automatic Controlling Instruments 30% 1.2
802 Nuts , Fresh Or Dried 30% 0.8
8525 Transmission Apparatus for Radiotelephony 30% 0.2
1001 Wheat And Meslin 0% -
8803 Airplanes Parts 10% -
1006 Rice 5% -
1005 Corn (Maize) 5% -
4703 Chemical Woodpulp 5% -
8471 Automatic Data Processing Machines 0% -
8703 Motor Cars 15-30% -
9301 Military Weapons 30% -
9306 Munitions 30% -
1502 Fats Of Bovine Animals, Sheep Or Goats 5% -
9802 Articles Donated For Relief Or Charity 0% -
8802 Aircraft 0% -
7303 Tubes and Pipes of Cast Iron 30% -Source: Calculated from data of the Department of Statistics and USITC.

Economic Impact and Implications for Jordan of the Jordan-U.S. FTA Final Report
AMIR Program 48
Table 8.4 shows the ERP calculations for Jordan’s wood furniture industry. Althoughtariffs on the industry’s two major inputs, sawn wood and veneer wood and plywood, arezero, high tariffs are applied to the more processed carpentry wood, paints and hardware,woven fabrics and textiles, and moderate tariffs are applied to chemicals, tools, leather,and oils. Overall, the trade-weighted average of these tariffs is over 5 percent for inputs.As a result, the estimated ERP for furniture in Jordan is nearly 50 percent, which issomewhat less than in the example where the industry was subject to a 30 percent tariffon the final good but there were no tariffs on inputs. Still, the Jordanian furniture industryis heavily protected and it probably diverts resources away from the country’s industrieshaving a true comparative advantage.
In order to gauge theimpact of the FTA at theindustry-level, this type ofanalysis could easily beextended to otherindustries in Jordan. Sincean IO table for Jordan doesnot exist, it is possible toderive the technicalcoefficients of productionfrom selective interviewswith businesses in theleading industries that arelikely to compete withU.S. imports andbenchmark the results withother IO tables. Futurework in this area would bevaluable to Jordanianbusinesses in gauging theircompetitiveness in theU.S. and globalmarketplaces.
Table 8.3Jordan's Exports of Furniture by Type, 1994-99(JD)HS Code Product Description 1994 1995 1996 1997 1998 1999
940360 Other wooden furniture 702,942 701,344 873,221 2,150,091 1,881,336 2,191,283
940340 Wooden furniture used in kitchen 122,156 255,947 354,340 721,873 706,179 1,275,009
940370 Furniture of plastics 4,290 99 34,015 54,448 508,131 805,175
940320 Other metal furniture 70,438 93,168 160,091 107,057 405,467 420,123
940330 Wooden furniture used in offices 6,680 28,923 6,580 46,176 87,085 325,680
940310 Metal furniture used in offices 9,204 33,835 30,775 114,362 85,239 147,057
940350 Wooden furniture used in bedroom 36,577 40,058 57,760 23,036 176,669 91,066
940380 Furniture of other materials 9,440 8,370 - 6,900 60,860 85,652
Source: Department of Statistics.
Table 8.4Jordan’s Effective Rate of Protection in the Furniture Industry
NominalRate of
Protection
InputCoefficientwith Tariff
InputCoefficient
without Tariff
Finished Product 30%
Tradable material inputs
Sawn wood, polishing pads 0% 0.182 0.236
Veneer and plywood 0% 0.150 0.195
Wood and carpentry wood 30% 0.078 0.078
Paints and hardware 30% 0.069 0.069
Industrial chemicals 10% 0.027 0.032
Petroleum oils and residues 5% 0.021 0.026
Tools and saw blades 10% 0.011 0.013
Industrial machinery 0% 0.004 0.005
Woven fabrics 30% 0.004 0.004
Woodworking machinery 0% 0.002 0.003
Leather, abrasive products 10% 0.002 0.002
Textile goods 30% 0.001 0.001
Plastics products 0% 0.001 0.002
Effective Rate of Protection (%) 49%
Note: See Annex A for methodology and input-output coefficient sources.

Economic Impact and Implications for Jordan of the Jordan-U.S. FTA Final Report
AMIR Program 49
Chapter 9: Sector Impact of FTA on Services
A. Jordan’s Service Sector
The service sector contributes over 70 percent of Jordan’s total output, measured by thegross domestic product (GDP). Within this sector, the leading industries are finance,insurance, real estate and business services, contributing over 20 percent of the country’stotal output, and transport and communications, contributing 18 percent. The tradeindustry, which covers tourism, hotels and restaurants, contributes another 12 percent.Demand for all these services tends to be highly income-elastic since consumption ofservices such as tourism, education and health has expanded more rapidly than demand formanufacturing goods and agricultural products.
While the share of services in Jordan’s foreign trade has also risen rapidly, its share relativeto total trade has been smaller than in domestic production and employment. Overall,services trade contributes one-half of total receipts from goods and services, and accountsfor one-third of total payments for goods and services. The services balance has beenpositive and growing, which has helped to offset the large merchandise trade deficit(Table 7.1). Nevertheless, the ongoing international embargo on Iraq, which wasformerly Jordan’s largest trading partner, has negatively impacted tourism and otherservices receipts. Tourism is the largest non-factor services export, followed by transportservices composed of shipping, passenger and other transport services.
B. FTA and GATS Commitments
Despite a number of similarities between services trade and merchandise trade, there areimportant differences in their trade barriers and cross-border movements.26 First, manycross-border service activities require physical presence in the foreign market, in whichcase liberalization is required of both the movement of the service and the serviceprovider (for example, travel agents) or consumer (for example, tourists). Second,barriers to trade in services are often in the form of regulations, which are easier toenforce when foreign service providers (for example, insurance firms) are located in thehost country. Finally, trade in services tends to generate more movements in foreigndirect investment (FDI) and cross-border networks than does merchandise trade. Theresulting networks and FDI activities can generate economies of scale in such sectors astelecommunications and information services that would otherwise not be possible forsmall size countries like Jordan.
26 For a survey of analytical issues facing services trade, see Hoekman and Braga (1997).

Economic Impact and Implications for Jordan of the Jordan-U.S. FTA Final Report
AMIR Program 50
Under the U.S.-Jordan FTA, negotiations have been facilitated by the mutual recognitionagreements for trade liberalization in services under the General Agreement on Trade inServices (GATS). 27 28 The GATS provides the multilateral framework under the WTOfor regulating trade in services under two sets of obligations: (1) a set of generalconcepts, principles and rules that apply to all measures affecting trade in services; and(2) specific negotiated obligations that constitute commitments that apply to those servicesectors and sub-sectors that are listed in a member country's schedule. These sectorscover the following29:
§ Business (including professional and computer) services;§ Communication services;§ Construction and engineering services;§ Distribution services;§ Educational services;§ Environmental services;§ Financial (insurance and banking) services;§ Health services;§ Tourism and travel services;§ Recreational, cultural and sporting services;§ Transport services;§ Other services not included elsewhere.
The GATS applies to four "modes of supply:" (1) cross-border supply of a service (i.e.,not requiring the physical movement of supplier or consumer); (2) services involvingmovement of the consumer to the location of the supplier; (3) services sold in theterritory of a country by entities that have established a presence there but originate in theterritory of another country; and (4) services requiring the temporary movement ofnatural persons. The total value of services traded through modes (3) and (4) is probablymuch greater than that of the trade in services taking place through modes (1) and (2).However, the lack of statistics makes any concrete estimate difficult to make.
Market access is not defined in the GATS. Instead, agreement has been reached on a listof six measures that in principle are prohibited. These consist of limitations on: (1) thenumber of service suppliers allowed, (2) the value of transactions or assets, (3) the totalquantity of service output, (4) the number of natural persons that may be employed, (5)
27 The United States of America Schedule of commitments can be found at the following address:http://www.ustr.gov. Jordan’s schedule of commitments can be found at the http://www.wto.org andhttp://www.mit.gov.jo.
28 In contrast to the U.S.-Jordan FTA, NAFTA provides for general obligations on market access or theright of non-establishment (i.e. the right to provide cross-border services without an established presence),which are not general obligations under the GATS. Moreover, NAFTA uses a negative list approach tocoverage so that all services are covered unless they are explicitly excluded, in contrast to the positive listused by the GATS, which is less transparent because governments do no reveal non-conforming measuresand excluded sectors (Hoekman and Braga, 1997).
29These 12 sectors are further divided into 155 sub-sectors.

Economic Impact and Implications for Jordan of the Jordan-U.S. FTA Final Report
AMIR Program 51
the type of legal entity through which a service supplier is permitted to supply a service(e.g., branches versus subsidiaries for banking), and (6) participation of foreign capital interms of a maximum percentage limit of foreign share holding or the absolute value offoreign investment.
Commitments are made in a manner that is both transparent and clarifies whether anymarket access or national treatment limitations exist (i.e. GATS, Article XVI, and XVIIrespectively)30. Moreover, exemptions to the Article II Most Favored NationsTreatment31 must be included. This includes areas where specific favorable treatment isextended to nationals of a specific country compared to another. Areas where reciprocityin treatment is a condition are also included here (e.g., to allow certain professionals orinsurance companies to establish commercial presence and practice in Jordan, areciprocal treatment is required).
30 For the full legal text of General Agreement on Trade in Services (GATS) see http://www.wto.org.
31 The MFN principle refers to the concept of non-discrimination among countries. Exceptions to the ruleare members of regional trade agreements, which are subject to preferential treatment of some form oranother.
Table 9.1Jordan’s Services Account in the Balance of Payments, 1995-2000 2000 2000
1995 1996 1997 1998 1999 1st Qt 2nd Qt
Services (Net) 952 1,321 1,345 1,191 1,217 300 329
Receipts 2,150 2,483 2,581 2,549 2,600 635 699
Workers' Remittances 872 1,095 1,174 1,094 1,180 281 333
Investment Income 81 79 176 218 214 78 81
Travel 463 527 549 549 564 117 123
Transportation 293 267 273 218 209 49 53
Government, n.i.e. 14 11 14 11 9 9 2
Other 429 504 395 461 424 102 107
Payments 1,198 1,162 1,236 1,359 1,383 335 370
Workers' Remittances 75 71 142 147 145 36 36
Investment Income 276 293 324 316 323 63 115
Interest Payments 265 269 248 257 268 45 95
Profits on Investment 11 23 76 58 56 18 20
Travel 298 270 282 250 252 64 66
Tourism and Medical Care 239 218 230 198 199 50 52
Education 59 53 53 53 53 14 14
Transportation 274 236 224 181 171 41 45
Government, n.i.e. 161 177 210 139 151 36 42
Other 113 115 54 327 342 95 67Source: Central Bank of Jordan.

Economic Impact and Implications for Jordan of the Jordan-U.S. FTA Final Report
AMIR Program 52
C. Liberalization of Services
In some cases like the Euro-Mediterranean Partnership agreement concluded between theEU and Jordan and a number of other Mediterranean countries, the FTAs simply makereference to the multilateral obligations of participating countries under the GATS.32 Butin the case of the U.S.-Jordan FTA, a broad range of services will be liberalized on thebasis of the U.S. and Jordan’s existing commitments to the GATS. Annexes 3.1 and 3.2of the FTA address services. Annex 3.2 states that:
“the delegations representing Jordan and the United States of America (UnitedStates) discussed Jordan’s requirements for reciprocal treatment in certainservices sectors. Jordan has listed in its schedule of specific commitments underthe General Agreement on Trade in Services (GATS) exemptions from most-favored-nation (MFN) treatment that are based on a reciprocity requirement.The Government of Jordan hereby confirms the United States satisfies thereciprocity requirements with respect to access for duly qualified auditors,pharmacists, and geologists/geological engineers; licensing of medical testingand laboratory administration professionals; and publication of newsletters byforeign news agencies. Both Jordan and the United States will provide access inthe above-mentioned sectors to each other’s suppliers consistent with theirrespective commitments under the GATS.”
Annex 3.1 contains the complete schedule of commitments by Jordan and the UnitedStates.33 In the U.S. schedule there are relatively few exemptions on specific servicesectors and, as a result, Jordan already enjoys near complete access to the U.S. servicesmarket.34 Jordan, however, has limited access under its GATS commitments in all of itsservice sectors. Of the sectors where Jordan has made GATS commitments, it has a totalof 222 exemptions across both horizontal commitments and sector-specific commitments
32 For a comprehensive review of the services provisions in other FTAs, see Stephenson (undated).
33 The schedules are configured in matrix form, with horizontal issues and individual service sectors listedalong the vertical axis and commitments to provide market access, national treatment, and additionalcommitments along the horizontal axis. Each cell of the matrix records the existence or absence ofcommitments. Also in each cell numbered one to four represents the four modes of supply: (1) lmitationson cross-border supply; (2) limitations on consumption abroad, (3) limitations on commercial presence, and(4) limitations on presence of natural persons. Where commitments exist, details regarding the limitationsappear after the corresponding number of the cell. The words ‘Unbound’ and ‘None’ appear in cells toeither convey that a measure inconsistent with market access or national treatment may be introduced in thesector for a specific mode of supply without penalty. Unbound measures may grow more restrictive in thefuture, or convey that no sector-specific limitations apply for a specific mode of supply. Where all modesof supply are "Unbound" and no additional commitments have been undertaken for a given service sector,the sector does not appear in the schedule. Since the GATS covers 155 sectors and 4 modes of supply, thereare 620 sector-mode supply combinations on which offers could be made.
34 The U.S. schedule comprises the initial schedule finalized in April 1994, plus two supplementalschedules. Supplement 1 lists U.S. commitments on financial services, finalized on July 1995; supplement2 lists U.S. commitments on basic telecommunication services, finalized on February 1997.

Economic Impact and Implications for Jordan of the Jordan-U.S. FTA Final Report
AMIR Program 53
for limitations on both market access and national treatment (see Table 7.2).35 In contrast,the United States has 93 exemptions in these areas and most of these are related to thetemporary entry and stay of persons in the United States under its horizontalcommitments. These exemptions are time-bound, lasting no longer than ten years afterjoining the WTO, and are subject to periodic review and negotiation in subsequent tradeliberalizing rounds.
1. Impact on Jordan Service Imports
Under the FTA, Jordan will expand its commitments to liberalize services trade with theUnited States by amending its laws and regulations over a three-year period.36 Underthese conditions, there will be little distinction between international and domesticliberalization since external and internal market openings will parallel one another toensure that persisting internal barriers do not contravene the potential benefits of moreliberal access conditions. This approach is also reflected in the scope of market accesscommitments assumed by Jordan under the GATS. As underscored by the WTO (1997),those commitments extend to both discriminatory and non-discriminatory restrictions,covering measures targeted specifically against foreign suppliers as well as others affectingall market participants.
According to the Atlas Investment Group (2000b), the major legal and regulatorychanges will take place in the following four areas:
(1) Improving laws and regulations on intellectual property;(2) Raising allowable foreign investment;(3) Allowing non-Jordanian majority representation on company executive boards for
a number of sectors; and(4) Eliminating government support of service companies.
Since the FTA covers liberalization of all trade in services, the changes will open theJordanian service industries to U.S. companies, especially in tourism, transport services,health and financial services – the largest service sectors, as well convention services,printing and publishing, courier services, audiovisual, education and environmental.
35 Market access commitments relate to the following areas: (1) maximum foreign ownership limitations:e.g. a maximum percentage limit on foreign shareholding or the total value of individual or aggregateforeign investment; (2) restrictions on the establishment of some kind of local representation; (3) limitationon the total number of service operations or on the total quantity of service output; (4) limitations on thetotal number of service personnel that may be employed in a particular service sector; (5) restrictions on theability of service suppliers to choose the business form (e.g. company, partnership) in which they want tooperate; and (6) limitations on the overall number of service suppliers allowed operating in the market,because of quota system or a monopoly situation.
36 According to the working party report of Jordan’s accession to the WTO (WTO, 1999), Jordan’s trade inservices is primarily regulated by the Investment Promotion Law No. 16 for 1995, the Companies Law No.1 for 1989, the Foreign Investment Regulation No. 39 for 1997, the Central Bank Law No. 19 for 1979, theForeign Exchange Law No. 95 for 1966, the Banks' Law No. 24 for 1971, the Money Exchange DealingsLaw No. 37 for 1992, the Labor Law No. 37 for 1988, and the Residency and Foreigners Affairs Law No. 5for 1991.

Economic Impact and Implications for Jordan of the Jordan-U.S. FTA Final Report
AMIR Program 54
The impact on Jordan’s economy is expected to be substantial. While the costs associatedwith great U.S. access to the Jordanian service sectors will be reflected in the servicesaccount of the balance of payments, there are more widespread benefits anticipated fromimprovements in the quantity of investment and the expertise required to upgrade andoperate Jordan’s services sectors such as telecommunications. Moreover, earlyliberalization under the FTA will contribute substantially to the attractiveness of thecountry's location for new investment in modern services industries, and the globalizationof Jordan’s service sectors.

Economic Impact and Implications for Jordan of the Jordan-U.S. FTA Final Report
AMIR Program 55
2. Impact on Jordan Service Exports
Services imports into the United States are generally free of tariffs, quotas and othercommon trade barriers. Import impediments instead take the form of prohibitions orrestrictions on market access, which typically include licensing requirements andinvestment regulations. They exist at the federal, state and local levels, and are consistent
Table 9.2Jordan and U.S. GATS Commitments, by Sector
No. of MarketAccess
Limitations
No. of NationalTreatment
Limitations
No. of MarketAccess
Limitations
No. of NationalTreatment
LimitationsHorizontal Commitments 2 3 1 2
Sector-Specific Commitments, of which: 139 78 73 171. BUSINESS SERVICES 41 21 15 4A. Professional Services 18 9 9 3B. Computer and Related Services 1 1 1 -C. Research and Development Services 4 2 - -D. Real Estate Services 2 1 1 1E. Rental/Leasing Services without Operators 2 1 - -F. Other Business Services 14 7 4 -2. COMMUNICATION SERVICES 7 4 4 2A. Courier services - - 1 -B. Telecommunication services 5 3C. Audiovisual services 2 1 3 23. CONSTRUCTION AND ENGINEERING 2 - 4 -A. General construction work for buildings - - 1 -B. General construction work for civil engineering - - 1 -C. Installation and assembly work 1 - 1 -D. Building completion and finishing work 1 - 1 -4. DISTRIBUTION SERVICES 5 2 4 -A. Commission agents' services 3 1 1 -B. Wholesale trade services - - 1 -C. Retailing services - - 1 -D. Franchising 2 1 1 -5. EDUCATIONAL SERVICES 6 4 3 -A. Secondary education services 1 1 - -B. Higher education services 1 1 - -C. Adult education 2 1 2 -D. Other education services 2 1 1 -6. ENVIRONMENTAL SERVICES 2 2 4 -A. Sewage services - - 1 -B. Refuse disposal services - - 1 -C. Sanitation and similar services 1 1 1 -D. Other 1 1 1 -7. FINANCIAL SERVICES 22 15 23 10A. All insurance and insurance-related services 7 4 9 3B. Banking and other financial service 15 11 14 78. HEALTH RELATED AND SOCIAL SERVICES 4 2 1 1A. Hospital services - - 1 1B. Other Human Health Services 2 1 - -C. Social Services 2 1 - -9. TOURISM AND TRAVEL RELATED SERVICES 10 5 4 -A. Hotels and restaurants (incl. catering) 6 3 1 -B. Travel agencies and tour operators services 3 1 2 -C. Tourist guides services 1 1 1 -10. RECREATIONAL, CULTURAL SERVICES 6 5 5 -A. Entertainment services 3 2 1 -B. News agency services 1 1 1 -C. Libraries, archives, museums and others 1 1 1 -D. Sporting and other recreational services 1 1 2 -11. TRANSPORT SERVICES 34 18 6 -A. Maritime Transport Services 10 6 - -B. Internal Waterways Transport 10 5 - -D. Rail Transport Services 8 4 2 -D. Road Transport Services 6 3 4 -
Note: - Denotes either unbound or not included in the commitment schedule.Source: Derived from each country’s GATS commitment schedule.

Economic Impact and Implications for Jordan of the Jordan-U.S. FTA Final Report
AMIR Program 56
with “national treatment” obligations under multilateral trade agreements if both U.S. andforeign firms face the same degree of restriction. Other U.S. service markets featurerelatively few import restraints, mainly in the form of limitations on market access ornational treatment. The United States does, nevertheless, restrict imports in certainservice industries, especially transport, basic telecommunication and financial serviceindustries. Fewer restraints are imposed on professional service industries such as theaccountancy, legal, architecture, and engineering service industries.
For Jordan at least four sectors may prove relevant to a number of economies: tourism,software development, transport and, possibly, health services. In these areas, Jordanmay a have a strong interest in expanding its access to the U.S. market through the FTA.
Tourism and Travel-Related Services - Tourism is the largest single source of foreignexchange earnings from non-factor services for Jordan, although year-to-year variationsare large because of foreign travelers’ high responsiveness to the degree of politicalinstability in the Middle East region. 37 In the last five years, for example, the growth inthe number of tourists arriving in Jordan ranged from –3.0 to 7.5 percent a year, andarrivals from the United States varied even more from year to year.
All travel-related purchases by visitors to Jordan (e.g., transportation, lodging, and diningexpenses) are counted as exports, as are sales of royalties and licensing fees (such as formanufacturing processes). Tour companies are an important component of tourism, andforeign-owned companies will increasingly dominate this sub-sector. Overseas touroperators based in and out of the country often handle tourists visiting Jordan. Owing torecognition and registration by such international bodies as the International Air TravelAssociation (IATA), World Air Transport Association (WATA) and the Society ofIncentive Travel Executives (SITE), these large tour companies have a major advantageover local competitors. Moreover, affiliation to some of the major hotels enables them toprovide a chain of integrated export services including tours, car hire, accommodationsbookings and air ticketing.
Because of the structure of the tourism industry in Jordan, the FTA will likely affectsmall businesses that are not operating at international standards. Large-size companieswill likely be better able to face this challenge through mergers and acquisitions. Alreadylarge travel agencies are discussing mergers or some type of alliance with multilateralcompanies to operate as sub-agents of the recognizable larger companies. Nonetheless, inthe tourism sector, trading conditions were already liberal before the conclusion of theUruguay Round. Like other countries, the United States and Jordan made a high numberof commitments in major tourism sectors, notably hotels and restaurants.
Software Development and IT Services - Jordan’s national strategy for the developmentof its information technology (IT) services sector is contained in the REACH Initiative(2000). The strategy aims to bolster the country's IT sector to compete in local, regional,and global markets, particularly in certain software development and IT service niches.
37 Travel encompasses all expenditures of non-resident individuals, including expenditures for goods aswell as for services. For issues related to the recording of travel and other service categories, see Whichard(undated).

Economic Impact and Implications for Jordan of the Jordan-U.S. FTA Final Report
AMIR Program 57
The services most often delivered to foreign clients include systems integration, 38
outsourcing39 and custom programming.40 At present, Jordan’s comparative advantage inthis sector lies in its human capital resources, and its greatest potential lies in the MiddleEast region rather than the global market, particularly in the areas of softwaredevelopment from customization (Arabization), testing, implementation andmaintenance. There is, nonetheless, a relatively strong potential for high-end remoteprocessing and data management activities (REACH Initiative, 2000).
The FTA will open opportunities for foreign investment in Jordan’s IT industry throughboth direct foreign investment and investments in support industries such astelecommunications. Development of Jordan’s IT export potential will be closely tied, onthe one hand, to the growth and globalization of its telecommunications and educationsectors and, on the other, to increased foreign collaboration, technical assistance, andventure capital from foreign investment in the sector.41 All these areas will be enhancedby the U.S.-Jordan FTA and will likely provide a convergence of telecommunications,computer technology and software development in Jordan. At the same time, regulatoryand administrative improvements in intellectual property rights under the FTA will reducesoftware piracy and encourage U.S. companies to consider Jordan as a softwaredevelopment center.
The FTA will provide an opportunity to Jordan to exploit the tight U.S. market for laborwith the necessary skills for the IT industry. As noted by the REACH Initiative (2000),the United States is currently facing labor shortages in the IT sector. As a result, U.S.firms are outsourcing software development to India, Israel, Sri Lanka, Pakistan, Egypt,Russia, Ukraine, Poland, Hungary and other countries possessing capable IT workforcesand infrastructure.
Jordan has no sector-specific limitations on (a) consultancy services related to theinstallation of software, (b) software implementation services, (c) data processingservices and (d) ‘other’ computer services, except as they relate to Jordan’s horizontalexemption on the entry and temporary stay of persons. This restriction is in line withmost other countries, where the proportion of full commitments on market access forpresence of natural persons is only two percent when, like Jordan, horizontal limitationsare taken into account (WTO, 1998). The sector-specific limitations listed under presenceof natural persons usually concern quantitative limitations on the number of persons. 38 Systems integration comprises the development, operation, and maintenance of computer networks.Tasks involve all phases of systems design, including planning, coordinating, testing, and scheduling ofprojects; analysis and recommendation of hardware and software; system installation; softwarecustomization; and end-user training.
39 Outsourcing describes the practice of contracting out internal functions, ranging from low-skill servicessuch as data entry to more complex functions such as managing a company’s telecommunication andcomputer networks.
40 Custom programmers create or modify software to perform tasks that are unique to client companies.
41 It is important to recognize, however, that venture capital is ‘hot money’ that is highly mobile. For thisreason, foreign direct investment is often preferred over portfolio investments in an industry.

Economic Impact and Implications for Jordan of the Jordan-U.S. FTA Final Report
AMIR Program 58
The IT industry also includes companies which not only use, but, more importantly,design, build and supply the means for electronic commerce. Assemblage of computers,networks, software, and related computer services makes electronic commerce possible.Jordan has done little so far to integrate its IT into the fast growing business-to-business(B2B) electronic commerce, which has been one of the major channels by whichcompanies have been able to overcome their distance to market limitations. Still, incomputer services, proximity to the customer is essential because the best way to clearlyidentify market opportunities is through familiarity with cultural, administrative andregulatory issues that clients need to address. As a result, most service companiesconcentrate on regional and national markets, implying that commercial presence, invarious forms, is an important mode.42
While the GATS directly addresses the progressive liberalization of computer servicesand other IT-related service sectors, it should be born in mind that the WTO agreementsto eliminate tariff and non-tariff barriers on information and communication technologyproducts are also of great importance to these services. The Information TechnologyAgreement and the Mutual Recognition Agreements on conformity assessment areexpected to help reduce the cost of equipment essential to trade in computer and otherservices. They are also forecast to stimulate the growth of the IT industry and electroniccommerce generally, and computer services in particular.
Transport Services43 - International air transport is governed by (1) a network of bilateralagreements that regulate entry or directly restrict the competitiveness of foreign airlines,(2) domestic regulatory systems that effectively restrict entry of foreign carriers, (3)restrictions on ancillary domestic markets that impair a foreign carrier’s ability tocompete, and (4) subsidization and state ownership of competing foreign airlines.44 TheWTO does not cover this sector and has no effect on the operation of these non-tariffbarriers (NTBs) to trade.
Most U.S. regulation of air travel is through bilateral agreements or so-called Open Skiesagreements that enable airlines from one country to fly to any city in the other country,extend flights to third countries (“beyond rights”) and jointly market their services incode-sharing arrangements. To date, the United States has signed 33 full Open Skiesagreements and a number of partial air service agreements. These agreements tend toincrease competition, lower fares and freight rates, and expand trade and tourism insignatory countries. Nevertheless, the USITC (1999) has suggested that the benefits ofthe Open Skies agreements are likely to be less significant in countries like Jordan thathave a small number of dominant carriers that control a substantial number of takeoff andlanding slots. 42 For details on the global IT service industry, see WTO (1998).
43 For an analysis of international shipping, transport, and related logistical services in the context of theGATS framework, see Francois and Wooton (2000).
44 See Findlay (1999) for an analysis of the existing regulatory environment in the industry and its impacton the competitiveness of developing countries in the market.

Economic Impact and Implications for Jordan of the Jordan-U.S. FTA Final Report
AMIR Program 59
Chapter 10: Conclusions
The present study has examined the U.S.–Jordan FTA and assessed its impact on trade ingoods and services of Jordan. It has specifically addressed three issues: (1) thecomparative advantage of Jordan in exports of goods and services to the U.S. marketrelative to other countries in the Middle East region; (2) the effect of FTA-related tariffs,rules of origin, and other market access conditions on Jordanian exporting companies;and (3) the impact of the FTA on bilateral trade in services between Jordan and theUnited States.
There are three central findings. First, the FTA will open many opportunities for Jordanto expand its exports to the U.S. market. The greatest opportunities will occur in theemerging export products that have the highest degree of trade compatibility with theUnited States. These products include Dead Sea cosmetics, orthopedic appliances, rugsand machinery. Although Jordan’s traditional exports are somewhat less compatible withU.S. foreign needs, there are nevertheless opportunities in such products as apparel andclothing accessories, aluminum bars and rods, animal feed and insecticides. Among thesmall and medium size exports, there will be opportunities in such wide-ranging productsas olive oil, luggage, pharmaceuticals, household appliances, ceramic sinks and washbasins, paints and varnishes, jewelry, awnings, kitchenware, fruit and vegetable juices,chocolate and antibiotics. Jordan’s ability to exploit these opportunities will depend onseveral key factors determining its international competitiveness. Its macro dynamics arefavorable to investment, but there are mixed reviews on its factor and infrastructure costs,and recent movements in the real exchange rate has undermined Jordan’s competitivenessrelative to nearly all other Middle Eastern countries.
Second, U.S. exports to Jordan are expected to grow substantially as a result of the FTA.Since there is a large amount of two-way trade in many traded products, the eliminationof trade barriers between Jordan and the United States will favor the most efficientproducers. In Jordan, inefficient industries with particularly high levels of protection willbe most vulnerable, and the FTA will liberate valuable resources from less productivesectors for use in Jordan’s true comparative advantage industries. These industries can beidentified from the two-way trade calculations provided by this study, along withestimates of each industry’s effective rate of protection. Our estimate of the ERP for thefurniture demonstrates that the level of protection in this one industry is larger thansimple nominal rates of protection would reveal. This type of information would bevaluable to both the private and public sectors in adjusting to the FTA.
Third, expectations about the FTA effects on services trade are supported by the findingsof this study. Calculations of the proportion of market access constraints on individualservice sectors show that Jordan’s sectors are considerably more protected. The FTA willtherefore open more new opportunities for U.S. businesses in Jordan than for Jordanianbusinesses in the United States. While these service inflows will lower Jordan’s currentsurplus in the services account, they will bring with them much needed FDI associatedwith technological transfers and provide other types of externalities to the Jordanian

Economic Impact and Implications for Jordan of the Jordan-U.S. FTA Final Report
AMIR Program 60
economy. Recognition of these changes will help Jordanian businesses adjust and exploitthese new opportunities under the FTA.
Finally, the present study has pointed to a number of areas that should be examined ingreater detail by the Jordanian business community:
Jordan’s International Competitiveness – Comparative factor and infrastructure cost datafor Jordan and other Middle East countries are essential for gauging the competitivenessof industries in the U.S. and global markets. While the limited timeframe of the presentstudy hampered data collection, such data would be useful to both the public sector informulating policies and the private sector in determining investment opportunities.Moreover, it would help to identify likely areas of FDI inflows into the country.
FTA Impact on Jordan’s Effective Rates of Protection – In order to gauge the impact ofthe FTA on Jordan’s import-competing industries, the analysis of effective rates ofprotection conducted in this study for furniture could be extended to other Jordanianindustries. It is possible to derive the technical coefficients of production from selectiveinterviews with businesses in the leading industries that are likely to compete with U.S.imports and benchmarking the results with other input-output tables. Future work in thisarea would be valuable to Jordanian businesses in evaluating their competitiveness.
Export Revenue Gains from the FTA and Output and Employment Effects – The exportrevenue gains to Jordan from the FTA calculated in the present study are intended to beprimarily illustrative. Further detailed estimates of the potential revenue gains usingstatistically estimated price elasticities would provide more realistic estimates of possiblerevenue gains, as would economy-wide estimates of the dynamic effects of the FTA onoutput and employment of industries.
FTA Rules of Origin and Their Trade-Creating and Trade-Diverting Effects – In the shortrun, the rules of origin can raise the cost of industries trying to meet the requirements byshifting to higher cost inputs from domestic sources. The FTA may therefore be tradediverting if there is a shift from lower to higher cost sources of supply, rather than havingthe desired effect of being trade creating by shifting production from higher to lower costsources of supply. In the long run, the effects are highly dependent on the form of thestructure of the industry and its market. Future work should examine these effects at theindustry level.
Regulatory Constraints in U.S. Market for Jordanian Service Exports – Although servicesimports into the United States are generally free of tariffs, quotas, and other commontrade barriers, import impediments in the form of prohibitions or restrictions on marketaccess will inhibit Jordan’s ability to access that market. The impediments typically takethe form of licensing requirements and investment regulations at the federal, state andlocal levels. Jordan’s interest in tourism, software development, transport and healthservices suggests the need for more detailed analysis of existing impediments in the U.S.market for these industries.
Economic Impact and Implications for Jordan of the Jordan-U.S. FTA Final Report
AMIR Program 61
Annex A: Methodological Notes
A. Modeling Price and Income Effects
Expenditure-switch policies in the form of tariffs create a ‘price wedge’ between thedomestic price to the consumer in the United States and the world market price of theproduct. These measures effectively impose a tax on the consumer. The effective tax rate,denoted t, raises the price of the product to (1+t)P in the United States. We can expressthe demand for imports (M) of the United States as related to that tariff-adjusted price{[(1+t)P/D}, as well as income (Y) in the following expression:
M = k1Yε [(1+t)P/D]γm (A.1)
The incidence on the consumer of the effective price rise of the product by [(1+t)P – Pwould be to reduce the quantity of the product demanded.
The relative prices of Jordan and its competitors to the U.S. market remain unaltered: thatof Jordan (denote i) is Pi/P and that of its competitors (denoted k) is Pk/P. The demandfunction for Jordan is therefore:
X = k2M[Pi/P]γx (A.2)
A change in the quantity demanded of the product because of protectionist measures inthe U.S. market would cause a proportional change in the demand for the productsupplied by Jordan and other foreign suppliers to the U.S. market.
Equation (A. 1) shows that the effect of trade liberalization in the U.S. market forJordanian goods will depend on the price elasticity of import demand γm and the tariffrate t of protection in that market.
The dynamic specification of import demand, M, in terms of income, Y, and the price ofthe product, P, relative to the general price index, D, can be expressed as:
mt = a0 + a 1mt-1 + β1yt + β2yt-1 + γ1(p-d)t + γ2(p-d)t-1 + ut ...(A.3)
where lower case letters denote logarithms of corresponding capital letters, e.g., (p-d) =ln(P/D), and the expected signs of the coefficients are 0 < a 1 < 1; β1 and β2 >0; γ1 and γ2
< 0. Income is treated as (weakly) exogenous for the parameters of interest.
The use of the logarithmic specification in equation (A.3) provides a means by which theelasticity can be calculated directly from the estimated equation; the results are consistent

Economic Impact and Implications for Jordan of the Jordan-U.S. FTA Final Report
AMIR Program 62
when the elasticities remain constant over time. Tests of parameter constancy provide ameans of validating that hypothesis.45
On a steady-state growth path, the long-run dynamic equilibrium relationship implicit inequation (A.8) is:
M = k1Yε [(1+t)P/D]γm ...(A.4)
where ε = (β1 + β2)/(1-a 1) and γm = (γ1 + γ2)/(1-a 1).
B. Effective Rate of Protection
The Concept of Effective Rate of Protection - Countries such as Jordan apply tariffs togenerate fiscal revenue and to protect industries from foreign competition. The measureof that protection is given by the nominal rate of protection (NRP), which accounts forthe extent to which output prices can be raised by domestic firms relative to border pricesunder protection from foreign competition. In addition to the resource pull into protectedsectors, there may be offsetting effects from tariffs on tradable inputs that artificially raisethe input prices and the associated costs to firms in the protected sectors. The measure ofthe net effect of the resource pull and higher costs associated with a tariff schedule isgiven by the effective rate of protection (ERP). The ERP measures the effect of acountry’s tariff schedule on the incentives to producers in an industry to expand orcontract their activities relative to a situation of free trade. In contrast to the NRP,therefore, the ERP measures the effect on the value added derived from both the benefitof protection to an industry and the cost to it from the tariffs applied to its inputs.
Measuring the Effective Rate of Protection – The ERP for a product j is the percentageexcess of domestic value added, V, over the international market value added, W, i.e., thatvalue added that would have been realized in the absence of the existing tariff structure:ERPj = (Vj - Wj) / Wj.. This measure is intuitively appealing insofar as it allows us toexpress the ERP in terms of border and domestic price equivalents for specific industriesin Jordan.
Alternatively, we can measure the ERP as the difference between the tariff on the finalproduct and the weighted sum of tariffs on inputs to the product. Formally, we denote theoutput tariff for industry j by tj, the input tariff for tradable input i by ti, and the amount ofinput i in a unit of product j by aij. The NRP is given by tj (or in percentage, tj x 100),while the ERP is given by (tj - Σi ti aij)/(1 - Σi aij) , where Σi denotes “summation” over iand the aij in the numerator corresponds to the tariff situation and that in the denominatorto free trade situation.
45 For details on the specification and estimation of import and export demand equations, see Lord (1991).

Economic Impact and Implications for Jordan of the Jordan-U.S. FTA Final Report
AMIR Program 63
Ideally, the input-output coefficients would be measured with and without the currenttariff distortions. As a practical matter, of course, free trade is not observable and so someadjustments must be made. This is done by recognizing that the observed unit-valueinput-output coefficient aij’ – where “ ’ “ denotes the tariff distorted situation – reflectsthe border price of input i inflated by a factor of (1 + ti) in the numerator and the borderprice of output j inflated by a factor of (1 + tj) in the denominator. Thus, the free tradevalue of aij is recovered by multiplying the observable coefficient aij’ by the adjustmentfactor (1 + tj)/(1 + ti).
Using this alternative methodology, we can calculate the ERP in the following manner:
Let Wj = Pj(1 - Σiaij’)Vj = Pj[(1+tj) - Σiaij’ (1+ti)]
where:aij = technical coefficient of input in activity j, i.e., the value of input i per unit value
of output in activity j;tj = nominal rate of protection of production of j;ti = nominal rate of protection of input i.
Then we can express the level of effective protection as follows:
ERPj = {Pj[(1+tj) - Σiaij’ (1+ti)] / Pj(1 - Σiaij’)} – 1 (A.5)
Rearranging terms yields the formula used to estimate the level of effective protection:
ERPj = (tj - Σiaij’ti)/(1 - Σiaij’) (A.6)
= {(1 - Σ aij’)/([1/(1 + tj)] – [Σ[aij’/(1 + ti)]]} – 1 (A.7)
The ERP can exceed, equal, or fall short of the NRP depending on whether input tariffsare lower or higher relative to the output tariff. A negative ERP suggests that an industryis being taxed more heavily on its inputs than its final product.
C. Revealed Comparative Advantage (RCA) Index
The index of revealed comparative advantage (RCA) used in this study is specified asfollows:
RCAij = (Xij / Xj) / (Xi / X) (A.8)
where,
Xij = exports of product i from country j.Xi = exports of product i from the world.

Economic Impact and Implications for Jordan of the Jordan-U.S. FTA Final Report
AMIR Program 64
Xj = exports of all goods from country j.X = exports of all goods from the world.
The RCA index compares a country's exports of a product (normalized with respect to thevalue of its total exports) to the share of that product in world trade. The normalizationwith respect to the value of total exports adjusts for country size. In this way small countryoutput can be compared with that of the large countries in the region. The index also scalesfor product significance as a way of accounting for the importance of trade in one goodrelative to that of all goods.
The interpretation of the RCA index is as follows: an RCA value greater than one implies acomparative advantage since the nation's ratio of product exports to total exports of allgoods is greater than the comparable ratio for the world. In contrast, an RCA value of lessthan one implies a comparative disadvantage.
The index takes into consideration several market ratios when adjusting for country sizeand product significance, and gives useful information depending on how the terms in theformula are arranged. In the formula above, the index is expressed as the share of theproduct division with respect to total exports for the specific country or region (Xij/Xj),given the same world's share (Xi/X). This interpretation is useful when analyzingcountries’ RCA indices since it shows the degree of export concentration across products.

Economic Impact and Implications for Jordan of the Jordan-U.S. FTA Final Report
AMIR Program 65
Annex B: U.S.-Jordan FTA and GATS Service Commitments
Table B.1Jordan and U.S. GATS Commitments, by Sector
Jordan United States
No. of MarketAccess
Limitations
No. ofNational
TreatmentLimitations
No. of MarketAccess
Limitations
No. ofNational
TreatmentLimitations
Horizontal Commitments 2 3 1 2Sector-Specific Commitments, of which: 139 78 73 171. BUSINESS SERVICES 41 21 15 4A. Professional Services 18 9 9 3a. Legal Services 1 2 1 1b. Accounting, auditing and bookeeping services 4 1 2 1c. Taxation Services 1 1 1 -d. Architectural services 3 - 2 -e. Engineering services 2 - - -f. Integrated engineering services - 2 1 1g. Architectural services 2 - 2 -h. Medical and dental services 2 1 - -i. Veterinary services - - - -j. Services provided by midwives, nurses 1 1 - -k. Other 2 1 - -B. Computer and Related Services 1 1 1 -a. Consultancy services related to hardware - - - -b. Software implementation services - - - -c. Data processing services 1 1 - -d. Data base services - - 1 -C. Research and Development Services 4 2 - -a. R&D services on natural sciences 2 1 - -b. R&D services on social sciences and humanities - - - -c. Interdisciplinary R&D services 2 1 - -D. Real Estate Services 2 1 1 1a. Involving own or leased property - - 1 1b. On a fee or contract basis 2 1 - -E. Rental/Leasing Services without Operators 2 1 - -a. Relating to ships - - - -b. Relating to aircraft - - - -c. Relating to other transport equipment - - - -d. Relating to other machinery and equipment 2 1 - -F. Other Business Services 14 7 4 -a. Advertising services 2 1 1 -b. Market research and public opinion polling services - - 1 -c. Management consulting service - - 1 -d. Services related to man. consulting 1 1 1 -e. Technical testing and analysis services 2 1 1 -f. Services incidental to agriculture, hunting and forestry 1 - 1 -g. Services incidental to fishing 1 1 1 -h. Services incidental to mining - - 1 -i. Services incidental to manufacturing - - - -j. Services incidental to energy distribution - - 1 -k. Placement and supply services of personnel - - 2 -

Economic Impact and Implications for Jordan of the Jordan-U.S. FTA Final Report
AMIR Program 66
Table B.1 (Continued)Jordan and U.S. GATS Commitments, by Sector
Jordan United States
No. of MarketAccess
Limitations
No. of NationalTreatmentLimitations
No. of MarketAccess
Limitations
No. of NationalTreatmentLimitations
l. Investigation and security - - 2 1m. Related scientific and technical consulting 2 1 1 -n. Maintenance and repair of equipment - - 1 -o. Building-cleaning services 1 1 1 -p. Photographic services - - 1 -q. Packaging services - - 1 -r. Printing, publishing 2 - 2 -s. Convention services 2 1 1 -
2. COMMUNICATION SERVICES 7 4 4 2A. Postal services - - - -B. Courier services - - 1 -C. Telecommunication services 5 3a. Voice telephone services 1 1 - -b. Packet-switched data transmission services - - - -c. Circuit-switched data transmission services 1 - - -d. Telex services 2 - - -e. Telegraph services - 1 - -f. Facsimile services - - - -g. Private leased circuit services - - - -h. Electronic mail 1 - - -i. Voice mail - - - -j. On-line information and data base retrieval - 1 - -k. Electronic data interchange (EDI) - - - -l. Enhanced/value-added facsimile services - - - -m. Code and protocol conversion - - - -n. On-line information and/or data processing - - - -D. Audiovisual services 2 1 3 2a. Motion picture and video tape production - - 1 2b. Motion picture projection service - - 1 -c. Radio and television services 2 1 1 -
3. CONSTRUCTION AND ENGINEERING 2 0 4 -A. General construction work for buildings - - 1 -B. General construction work for civil engineering - - 1 -C. Installation and assembly work 1 - 1 -D. Building completion and finishing work 1 - 1 -
4. DISTRIBUTION SERVICES 5 2 4 -A. Commission agents' services 3 1 1 -B. Wholesale trade services - - 1 -C. Retailing services - - 1 -D. Franchising 2 1 1 -E. Other - - - -
5. EDUCATIONAL SERVICES 6 4 3 -A. Primary education services - - - -B. Secondary education services 1 1 - -C. Higher education services 1 1 - -D. Adult education 2 1 2 -

Economic Impact and Implications for Jordan of the Jordan-U.S. FTA Final Report
AMIR Program 67
Table B.1 (Continued)Jordan and U.S. GATS Commitments, by Sector Jordan United States
No. of MarketAccess
Limitations
No. of NationalTreatmentLimitations
No. of MarketAccess
Limitations
No. of NationalTreatmentLimitations
6. ENVIRONMENTAL SERVICES 2 2 4 -A. Sewage services - - 1 -B. Refuse disposal services - - 1 -C. Sanitation and similar services 1 1 1 -D. Other 1 1 1 -
7. FINANCIAL SERVICES 22 15 23 10A. All insurance and insurance-related services 7 4 9 3a. Life, accident and health insurance services 1 1 2 1b. Non-life insurance services 2 1 2 1c. Reinsurance and retrocession 2 1 4 1d. Services auxiliary to insurance 2 1 1 -B. Banking and other financial service 15 11 14 7a. Acceptance of deposits and other repayable - 1 2 1b. Lending of all types - 1 2 1c. Financial leasing - - 2 1d. All payment and money transmission services 2 1 2 1e. Guarantees and commitments - - 2 1f. Trading for own account or for account of customers 4 1 2 1g. Participation in issues of all kinds of securities - - 2 1h. Money broking 1 1 - -i. Asset management 3 2 - -j. Settlement and clearing services for financial assets 2 2 - -k. Advisory and other auxiliary financial services 2 1 - -l. Provision and transfer of financial information 1 1 - -
8. HEALTH RELATED AND SOCIAL SERVICES 4 2 1 1A. Hospital services - - 1 1B. Other Human Health Services 2 1 - -C. Social Services 2 1 - -
9. TOURISM AND TRAVEL RELATED SERVICES 10 5 4 -A. Hotels and restaurants (incl. catering) 6 3 1 -B. Travel agencies and tour operators services 3 1 2 -C. Tourist guides services 1 1 1 -
10. RECREATIONAL, CULTURAL SERVICES 6 5 5 -A. Entertainment services 3 2 1 -B. News agency services 1 1 1 -C. Libraries, archives, museums and others 1 1 1 -D. Sporting and other recreational services 1 1 2 -
11. TRANSPORT SERVICES 34 18 6 -A. Maritime Transport Services 10 6 - -a. Passenger transportation - - - -b. Freight transportation 4 2 - -c. Rental of vessels with crew 1 1 - -d. Maintenance and repair of vessels 5 3 - -e. Pushing and towing services - - - -f. Supporting services for maritime transport - - - -
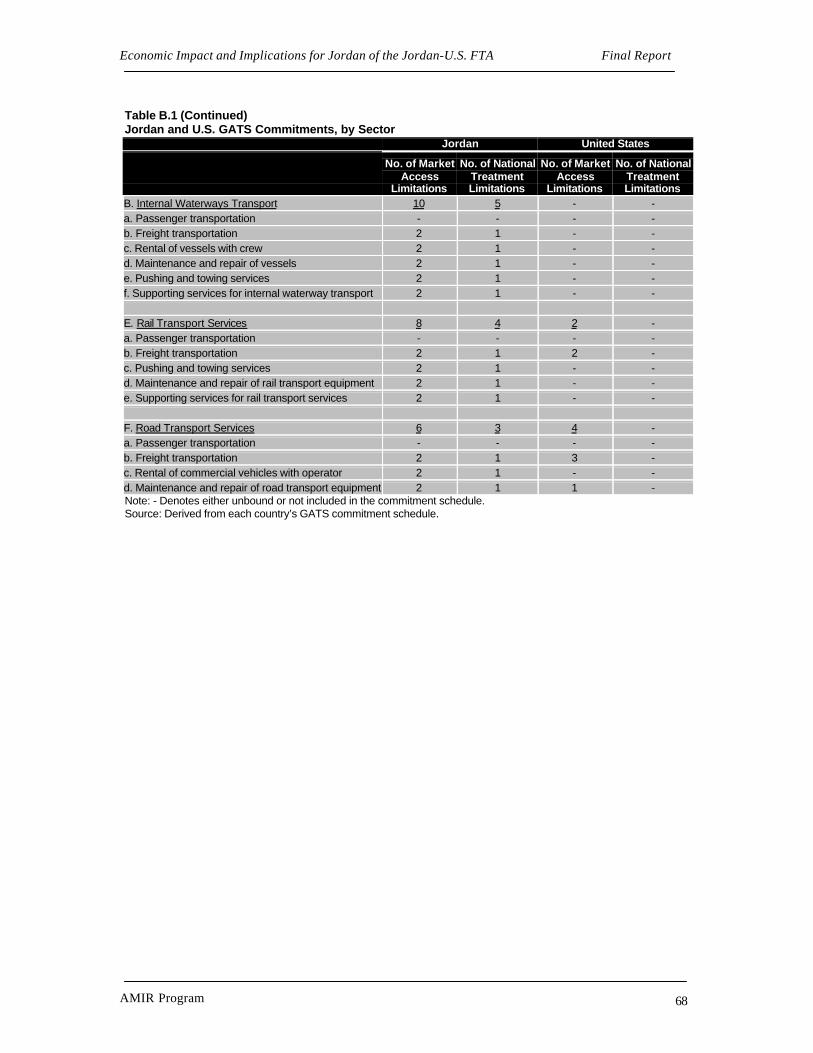
Economic Impact and Implications for Jordan of the Jordan-U.S. FTA Final Report
AMIR Program 68
Table B.1 (Continued)Jordan and U.S. GATS Commitments, by Sector Jordan United States
No. of MarketAccess
Limitations
No. of NationalTreatmentLimitations
No. of MarketAccess
Limitations
No. of NationalTreatmentLimitations
B. Internal Waterways Transport 10 5 - -a. Passenger transportation - - - -b. Freight transportation 2 1 - -c. Rental of vessels with crew 2 1 - -d. Maintenance and repair of vessels 2 1 - -e. Pushing and towing services 2 1 - -f. Supporting services for internal waterway transport 2 1 - -
E. Rail Transport Services 8 4 2 -a. Passenger transportation - - - -b. Freight transportation 2 1 2 -c. Pushing and towing services 2 1 - -d. Maintenance and repair of rail transport equipment 2 1 - -e. Supporting services for rail transport services 2 1 - -
F. Road Transport Services 6 3 4 -a. Passenger transportation - - - -b. Freight transportation 2 1 3 -c. Rental of commercial vehicles with operator 2 1 - -d. Maintenance and repair of road transport equipment 2 1 1 -Note: - Denotes either unbound or not included in the commitment schedule.Source: Derived from each country’s GATS commitment schedule.

Economic Impact and Implications for Jordan of the Jordan-U.S. FTA Final Report
AMIR Program 69
Table B. 2U.S.-Jordan FTA Commitments versus Jordan’s GATS CommitmentsGATS Commitment FTA Commitments (Extra Liberalization
to the WTO)Remarks
HorizontalsNo Change has been instituted to WTO commitments.In Mode (4): Presence of Natural Persons Intra-corporate transferees who are executives, managers and
specialists (as defined) are not subject to the economic needstest requirements excluding those in the fields of financialservices (insurance, banking and other financial services) andservices incidental to energy distribution.
However, intra-corporate transferees in the field of financialservices (insurance, banking and other financial services) whoare executives, managers and specialists (as defined) arepresumed to meet the economic needs test requirements.
Temporary work and residency permits are required. Suchpermits are issued for a maximum period of one year, but arerenewable automatically as long as the work or residency permitholder continues to maintain his/her status within the juridicalentity employinghim/her.
MFN reciprocity RequirementsBoth Parties integrated the WTO Accession agreed uponMemorandum of Understanding in which Jordan confirmed thatthe United States satisfies the reciprocity requirements withrespect to access for duly qualified auditors, pharmacists, andgeologists/geological engineers; licensing of medical testing andlaboratory administration professionals; and publication ofnewsletters by foreign news agencies.
Both countries will provide access in the above-mentioned sectorsto each other’s suppliers consistent with their respectivecommitments under the GATS.
B. Sector Specific Commitments1. Business ServicesA. Professional Services(a) Legal services (advisory services on foreign law only(excluding Jordanian Law) (part of CPC 861)(b) Auditing (part of CPC 862)(b) Accounting and bookkeeping services (part ofCPC862)(c) Taxation services (CPC 863)(d) Architectural services (CPC 8671)(e) Engineering services (CPC 8672)(g) Urban planning and landscape architectural services(CPC 8674)(h) Medical services (excluding Dental services) (CPC9312)(j) Services provided by midwives, nurses,physiotherapists(CPC 93191)(k) Other
(i) Veterinary Services (CPC 93201). No Commitment was made in mode (1) & (2). In Mode (3) Accessrestricted to veterinarians who must be Jordanian nationals.Nationality requirement for the Veterinarians.

Economic Impact and Implications for Jordan of the Jordan-U.S. FTA Final Report
AMIR Program 70
B. Computer and Related Services
(a) Consultancy services related to the installation ofcomputer hardware (CPC 841)(b) Software implementation services (CPC 842)(c) Data processing services(CPC 843)(d) Data base services (CPC 844)(e) Maintenance and repair services of office machineryand equipment including computers (CPC 845)(f) Other computer services(CPC 849)
No Change has occurred. Originally a liberal sector.
C. Research and Development Services
(a) R & D services on natural sciences (CPC 851)excluding geology related sciences(b) R & D services on social sciences and humanities(CPC 852)(c) Inter disciplinary R & D services (CPC 853)
(a) R & D services on naturalSciences (CPC 851) excluding geology related sciences
At the WTO, Mode (3) was subject to 50% foreign equitylimitation. FTA allows a 100% foreign equity ownership.Mode (4) Director of research center must be a Jordaniannational.
D. Real Estate Services
(a) Real estate services involving own or leasedproperty(CPC 8210)(b) On a fee or contract basis (CPC 822)
No ChangeMode (3) Access restricted to Jordanian natural persons. Juridicalentities are not allowed. Real estate agents and licensedsurveyors must be Jordanian nationals.
E. Rental/leasing service without operators(a) Leasing or rental services concerning ships withoutoperators (CPC 83103)(d) Relating to other machinery and equipment (CPC83106-83109)
(a) Leasing or rental services concerning ships withoutoperators (CPC 83103)(3) Subject to 60% foreign equity limitation. Starting no later than1 January 2002, 100% foreign equity will be permitted.(d) Leasing or rental services relating to other machinery andequipment, specifically agricultural machinery and equipment(CPC 83106)(3) Subject to 50% foreign equity limitation. Starting no later than1 January 2002, 100% foreign equity will be permitted.(d) Leasing or rental services relating to other machinery andequipment (excluding engines and turbines) (CPC 83107-83109)(3) Subject to a 50% percent equity limitation.
At the WTO, sub-sectors under (CPC 83106 – 83109) were allgrouped together with a Mode (3) equity limitation of 50%.
In the FTA, extra liberalization occurred in rental and leasingservices of agricultural machinery and equipment.

Economic Impact and Implications for Jordan of the Jordan-U.S. FTA Final Report
AMIR Program 71
F. Other business services
(a) Advertising services (CPC 871)(b) Market research (CPC 86401)(c) Management consulting service (CPC 865)(d) Services related to management consulting (CPC866)(q) Packaging services (CPC 876)
(a) Advertising services (CPC 871) In Mode (3) a maximum of 50% foreign equity, is committed.Director of advertising agency must be a Jordanian national.
(b) Public Opinion Polling Services (CPC 86402) No Change Director of public opinion bureau must be a Jordanian national.
(e) Technical testing and analysis services (CPC8676) No Change
Mode (3) 50% Foreign Equity allowed. Cabinet authorization isrequired. Geologists/ geological engineers must be Jordaniannationals.
(f) Services incidental to agriculture (CPC 8811)(f) Services incidental to animal husbandry, onlyadvisory and consultancy services (part of CPC 8812)(i) Services incidental to manufacturing (CPC 884 &885)
(g) Services Incidental to fishing (CPC 882)
(j) Services Incidental to energy distribution (CPC 887)
(k) Placement and supply services of personnel (CPC 872)
At the WTO, Mode (3) was subject to 50% foreign equitylimitation. In the FTA a 100% foreign equity is permitted.In the services incidental to animal husbandry, it was maintainedthat Supervisor must be a Jordanian veterinarian.(g) Extra Service commitment that is fully liberalized.(j) Extra Service commitment with Mode (3)Subject to Cabinet authorization or concession agreements areprovided on a national treatment basis. Number of servicesproviders and concessions may be restricted.(k) Extra Service commitment with Mode (3) Subject to 50%foreign equity limitation and to any other limitations on legal formprovided by the Jordanian law.
(m) Related scientific and technical consulting services(part of CPC 8675) excluding prospecting, surveying,exploration, exploitation and map making(n) Maintenance and repair of equipment (not includingmaritime vessels, aircraft, or other transport equipmentand television and radio transmitters and apparatus forline telephony or telegraphy; and radio broadcastequipment) (CPC 633, 8861-8866)(o) Building/ Cleaning services (CPC 874)(p) Photographic services (excluding military portraitsand aerial photography of the territory of the HashemiteKingdom of Jordan) (CPC 875)
No Change
(s) Convention services (CPC 87909)
(s) Convention services(CPC 87909)
At the WTO, Mode (3) was subject to 50% foreign equitylimitation. FTA permits a 100% foreign equity.
(r) Printing and Publishing(CPC 88442)
(r) Printing and Publishing(CPC 88442)
The FTA commitment increased the foreign equity allowed inMode (3) from a 50% foreign equity limitation, at the WTO, to60%.Director of printing and publishing house must be a Jordaniannational.

Economic Impact and Implications for Jordan of the Jordan-U.S. FTA Final Report
AMIR Program 72
2. COMMUNICATION SERVICESA. Postal Services A. Postal Services No Commitments were made in both Agreements.B. Courier services(CPC 7512)
B. Courier services(CPC 7512) (3) Subject to 60% foreign equity limitation. Starting no laterthan 1 January 2002, 100% foreign equity will be permitted.
At the WTO, Mode (3) was subject to 51% foreign equitylimitation. Starting no later than 1 January 2004, 100% foreignequity will be permitted.
C. TELECOMMUNICATION SERVICES No ChangeNo Change
D. Audio Visual Services
(a) Motion picture and video-tape production anddistribution services (CPC 9611)(b) Motion picture projection service (CPC 9612)(c) Sound recording
(c) Radio and television services (CPC 9613)(1) & (2) None, except unbound for transmission,(3) None, subject to Cabinet approval provided approval is notbased on market access or national treatment restrictions.(d) Radio and television transmission services (CPC 7524)(1) & (2) Unbound(3) None, subject to Cabinet approval provided approval is notbased on market access or national treatment restrictions.
(a) & (b) No Change, however, distribution outside Jordan is notsubject to a foreign equity limitation, as is the case in the WTOcommitment.(i.e.)Mode (3) None, except motion picture and videotapedistribution services is subject to 50% foreign equity limitation.Director of retail outlet must be a Jordanian national.(c) Extra Service commitment(d) Extra Service commitment
5. EDUCATIONAL SERVICESCommercial presence (in mode 3) is subject to 51%foreign equity limitation. Starting no later than 1January 2004 , 100% foreign equity will bepermitted.A. Primary educational services(CPC 921)B. Secondary educational services(CPC 922)C. Higher educational services(CPC 923)D. Adult education Services(CPC 924)E. Other education services (CPC 929), specificallycultural centers
Commercial presence (in mode 3) is subject to 60% foreignequity limitation. Starting no later than 1 January 2002,100% foreign equity will be permitted.
Extra liberalization in foreign equity limitation and a 2 yearearlier date for a 100% foreign equity to be allowed.
Mode (4) Director of adult education center and cultural centermust be a Jordanian national.
6. ENVIRONMENTAL SERVICESA. Sewage Services A. Sewage Services No commitment was made at the WTO or FTA.
B. Refuse Disposal Services B. Refuse Disposal Services:collection and treatment of solid waste services (part of CPC9402) excluding collection and treatment of hazardous waste.
No commitment was made at the WTO.Mode (3) Subject to 50% foreign equity limitation and to any otherlimitations on legal form provided by the Jordanian law.Establishment and provision of services are subject to Cabinetauthorization and to an agreement with the JordanianGovernment. Number of service providers may be restricted.Service providers are not allowed to import or to useimported garbage, trash, rubbish and waste for the purposeof providing these services.
7. FINANCIAL SERVICESA. Insurance and insurance-related services (CPC 812)

Economic Impact and Implications for Jordan of the Jordan-U.S. FTA Final Report
AMIR Program 73
(a) Life, insurance services including health insuranceservices (CPC 81211) and (CPC 81212) excludingpension fund management.(b) Non- life insurance services (including accidentinsurance) (CPC 8129)( c ) Reinsurance and retrocession (CPC 81299)
No Change
Mode (3) Access is restricted to public share holding companiesconstituted in Jordan and to branches of foreign insurancecompanies.
(d) Auxiliary Services (CPC 8140)Agency services (CPC 81401) Agency services (CPC 81401) At the WTO, Mode (3) Access restricted to Jordanian natural
persons, Jordanian general partnerships with majority ownershipby Jordanians, and limited liability companies with Jordanians asmajority in board of directors. Insurance agent or director of agentcompany must be a Jordanian national.In the FTA a maximum of 50 percent foreignEquity was committed for general partnerships.
B. Banking and Other Financial Services (excluding insurance)The establishment of a commercial presence (in mode 3 only) or the conduct of new activities is restricted to Public Shareholding companies constituted in Jordan, and to branches andsubsidiaries of foreign banks, unless otherwise stated in the specific sub-sector.Furthermore, it is noted that only Banks may undertake activities involving the acceptance of deposits and other repayable funds from the public (CPC 81115-81119 excluding CPC 81117) andextend guarantees and commitments services (CPC 81199**) and money broking (CPC 81339**). Financial service companies as seen in sub-sector entries below may provide all other financialactivities. Financial service companies are licensed to undertake Investment Trusteeship, Investment Management, Financial Consultations Financial Brokerage, Depository, and Management ofPrimary Issues.(a) Acceptance of deposits and other repayable fundsfrom the public (CPC 81115-81119 excluding CPC81117)(e) Guarantees and Commitments ( CPC 81199**)(h) Money broking(CPC 81339**)(b) Lending of all types including consumer credit,factoring, mortgage credit, and financing of commercialtransaction (CPC 8113)(c) Financial leasing (CPC 8112)(d) All payment and money transmission services(CPC 81339)(f) Trading for own account or for account of customers,whether on an exchange, in an over-the-counter marketor otherwise, the following: • Money market instruments (checks, bills and
certificates of deposits) (CPC 81339**) • Foreign Exchange (CPC 81333) • Derivative products incl., but not limited to, futures
and options (CPC 81339**) • Exchange rate and interest rate instruments,
including products such as swaps and forward rateagreements (CPC 81339**)
• Transferable securities • (CPC 81321)
(d) All payment and moneytransmission services, credit,charge and debit cards, travelers’ checks and bankers drafts.
(k) Intermediation services have been included.
(l) “suppliers of other financial services”
Reference to (CPC 81339**) has been deleted and all relatedservices have been incorporated in the FTA (with the currentlimitations),i.e. Mode (3) Service must be provided through banksand specialized financial companies.Details of service (d) to be allowed have been spelled out: e.g. ,credit, charge and debit cards, travelers’ checks and bankersdrafts.Limitations have not changed in FTA
National Treatment LimitationMode (1) Real property in Jordan may not be mortgaged to banksoutside Jordan.Mode (4) Unbound, except as indicated in the horizontal section.Branches of foreign banks are required to have a resident regionalmanager.Mode (1) and (2) None, except for derivative products, unbound.Mode (3) Access restricted to:a. Banksb. Financial services companies constituted in Jordan, in the formof public shareholding company, limited liability company or alimited partnership in shares company. (g) Mode (1) Unbound.Mode (2) Unbound, except for issuance and public offer ofsecurities outside Jordan by foreign service providers abroad, and

Economic Impact and Implications for Jordan of the Jordan-U.S. FTA Final Report
AMIR Program 74
• Other negotiable instruments and financial assets,including bullion (CPC 81339**)
(g) Participation in issues of all kinds of securities, incl.under-writing and placement as agent (whether publiclyor privately) and provision of service related to suchissues.(i) Asset management, such as cash or portfoliomanagement, all forms of collective investmentmanagement, custodial, depository, trust services, andpension fund management.(j) Settlement and clearing services for financial assetsincluding securities, derivative products and othernegotiable instruments.(k) Advisory and other auxiliary financial services on allthe activities (a - l) , incl. credit reference and analysis,investment and portfolio research and advice, advice onacquisitions and on corporate restructuring and strategy (l) Provision and transfer of financial information asrelated to financial data processing and related softwareby providers of other financial services
for management by service suppliers outside Jordan of assetsthat are not traded on Amman Financial Market or otherwisetraded in Jordan.Mode (3) Access restricted to:a. Financial services companies constituted in Jordan, in the formof public shareholding company, limited liability company or alimited partnership in shares company.b. Licensed banks through affiliated companies or separateaccounts.(j) Mode (1) Unbound *, Mode (2) NoneMode (3) Access restricted to the Depository Center at theAmman Bourse for securities and to the Central Bank of Jordanfor all other financial instruments.(k) Intermediation is defined as acting as an intermediary betweenpersons or parties including as an agent, finder (one whoidentifies business opportunities) or mediator.Limitations have been maintained. Mode (1) & (2) None, whileMode (3) Access restricted to:a. Financial services companies constituted in Jordan, in the formof a public shareholding company, limited liability company or alimited partnership in shares company.b. Banks.(l) The technical difference between a service provider andsupplier is targeted. No change in limitations, Mode (1), (2) & (3)None.
8. HEALTH RELATED & SOCIAL SERVICES (other than those listed under 1.A.)Commercial presence (in mode 3) is subject to 51%foreign equity limitation. Starting no later than 1January 2004, 100% foreign equity will be permitte d.A. Hospital services (CPC 9311)C. Social services (CPC 933).Specifically, these are nursinghomes, convalescent homes,rehabilitation centers B. Other human health services, specifically medicallabs (CPC 93199)
Commercial presence (in mode 3) is subject to 60% foreignequity limitation. Starting no later than 1 January 2002,100% foreign equity will be permitted.
Extra liberalization in foreign equity limitation and a 2 yearearlier date for a 100% foreign equity to be allowed.Mode (3) One of the owners must be a physician except in apublic limited company.Mode (4) Unbound, except as indicated in the horizontal section.At least 3/4 of physicians in any hospital or nursing orconvalescent homes must be Jordanian nationals; at least 1/2 ofall staff must be Jordanian nationals.Mode (1), (2) and (3) None.Mode (4) Lab. director must be a Jordanian national.
9. TOURISM AND TRAVEL RELATED SERVICESA. Hotel & motel lodging services, excludingcasinos(CPC 6411 & 6412)Meal serving services with fullrestaurant services (excludingtransport facilities) (CPC 6421)Meal serving services in self-serving facilities(cafeterias) (CPC 6422)Beverage serving services forconsumption on the premises,
Mode (3) Subject to 50 percent foreign equity limitation. Jordanianjuridical entity is required for franchising. Foreign equity limitationdoes not apply to these services when operated in hotels, motels“or tourist classified restaurants” is added for the purposesof the FTA.

Economic Impact and Implications for Jordan of the Jordan-U.S. FTA Final Report
AMIR Program 75
excluding casinos (CPC 643)Caterer services providing meals to outside (CPC6423). Institutional Food Service caterers (with theexception of Airport and airline catering facilities whichare confined only to the national air carriersB. Travel Agencies and tour operator services (CPC7471) Tourist Guide services (CPC 7472)
No Changes were made to the commitments at the WTO. Mode (1) Foreign travel agencies must implement their tours inJordan through a local service provider.Mode (3) Service may be provided through Jordanian natural orjuridical entities with maximum 50 % foreign equity. Serviceprovider must be a specialized tourist firm. Director must be aJordanian national.
10. Recreational, Cultural and Sporting Services (other than audio-visual services)
11. Transport Services
A. Maritime Transport Services
Transport services by Sea going vessels (CPC 721)
a. Passenger transportationb. Freight transportationc. Pushing and towing servicesd. Maintenance and repair of rail transport equipmente. Supporting services for rail transport services
(a) Passenger transportation (CPC 7211)(b) Freight transportation (CPC 7212) (c) Rental services of sea-going vessels with operator (CPC7213)(d) Maintenance and repair of vessels (CPC 8868)Storage and warehousing services (CPC 742)Shipping AgentsMaritime Freight Forwarding Services (CPC 748)Maritime Freight Inspection services (CPC 749)Food Supply Catering (Provisioning)
No change in foreign Equity allowed.(a) & (b) Mode (3):(a) Establishment of registered company for the purpose ofoperating a fleet under the national flag of Jordan: Subject to 50%foreign equity limitation except none for ships owned andoperated at the same time by a non-Jordanian.(b) Other forms of commercial presence for the supply ofinternational maritime transport services: Subject to 50% foreignequity limitation except none for ships owned and operated at thesame time by a non-Jordanian.Mode (4) Unbound, except as indicated in horizontal section. 1/5of crew on Jordanian ships must be Jordanian.
National Treatment LimitationMode (3) Service fees for pilot age, berthing and docking are 10%less for Jordanian ships.Jordanian ships are exempt from any Port dues when anchoringin Jordanian territorial waters. Jordanian ships enjoy preferentialtreatment in prices of bunker provided at the Aqaba Port.(c) No Change(d) Mode (3): An increase of foreign equity allowed, from 50% (asin WTO) to a 60% foreign equity limitation. Access restricted toJordanian natural or juridical entities.No Change: Mode (3) Subject to 50% foreign equity limit. As aPublic utility, a concession or licensing procedures may apply incase of occupation of the public domain
B. Internal Waterways Transporta. Passenger transportation (a) Passenger transportation (CPC 7221) (a) & (b) Mode (3) Subject to 50% foreign equity limitation.

Economic Impact and Implications for Jordan of the Jordan-U.S. FTA Final Report
AMIR Program 76
b. Freight transportationc. Rental of vessels with crewd. Maintenance and repair of vesselse. Pushing and towing servicesf. Supporting services for maritime transport
No commitment was made in this Sub-sector.
(b) Freight transportation (CPC 7222)(c) Rental of vessels with crew (CPC 7223)(d) Maintenance and repair of vessels (part of CPC 8868)(e) Pushing and towing services(CPC 7224)
Starting no later than 31 December 2003, 100% foreign equity willbe permitted.( c ) Mode (3) Subject to 50% foreign equity limitation.(d) Mode (3) Subject to 60% foreign equitylimitation.(e) Mode (3) Subject to 50% foreign equity limitation.Establishment and provision of services are subject to anagreement with theJordanian government. Number of service providers may berestricted.
C. Air Transport Services (as defined in the Annex on Air Transport)Maintenance and repair of Aircraft (part of CPC 8868)Computer Reservation Systems(CRS): Sales and Marketing,Maintenance and Repair
Maintenance and repair of Aircraft (part of CPC 8868)(3) Subject to 60% foreign equity limitation. Number of serviceproviders may be restricted.(3) Subject to 50% foreign equity limitation.
Mode (3) No commitment had been made at the WTO.
Mode (3) No change to 50% foreign equity limitation.
Air Auxiliary Services
Freight forwarding services (part of CPC 748)Packing and crating and de-packing and de-cratingservices (part of CPC 749)
Freight forwarding services (part of CPC 748)(3) Access restricted to Jordanian natural or juridical entities.Director must be a Jordanian national. Subject to 50% foreignequity limitation
Packing and crating and de-packing and de-crating services(part of CPC 749)(3) Access restricted to Jordanian natural or juridical entities.Subject to 50% foreign equity limitation.
Freight inspection services (part of CPC 749) excluding pre-shipment inspection for customs valuation purposes on imports.(1) None, Jordan does accept pre-shipment inspection forcustoms valuation purposes on imports.(2) None, Jordan does accept pre-shipment inspection forcustoms valuation purposes on imports.(3) Subject to 50% foreign equity limitation. Access restricted tofreight forwarders in the form of Jordanian natural or juridicalentities. Director must be a Jordanian national. Once issuance ofspecialized licenses for provision of freight inspection services isregulated, access will also be granted to inspection firms in theform of Jordanian natural or juridicalentities.(4) Unbound, except as indicated in the horizontal section.Director must be a Jordanian national.
Mode (3) No change to 50% foreign equity limitation.
Was not present in WTO commitments.

Economic Impact and Implications for Jordan of the Jordan-U.S. FTA Final Report
AMIR Program 77
Annex C: Meetings Conducted
Dr. Zaki Ayoubi Business AssociationsInitiative (BAI) ComponentLeader
Dr. Steve Wade Chief of PartyDr. Andrew Griminger Project Administrator
AMIR Program
Dr. Brian O’Shea Policy Component LeaderU.S. Embassy Mr. Ian Campbell Economic Officer
Mr. Jon Lindborg Director, EconomicOpportunities Office
Mr. Jamal Al-Jabiri Project ManagementSpecialist – Private Sector
USAID
Mr. Jonathan Addleton Program OfficerMr. Samih Darwazah ChairmanMr. Halim Abu-Rahmeh Managing Director
Jordan Trade Association(JTA)
Mr. Fareez Barakat Marketing & MembershipDevelopment Manager
JTA and Jordanian AmericanBusiness Association (JABA)
Joint Committee on FTA
Mr. Fawaz Shalan ChairmanJABAMs. Salwa Bamieh, Ms.Fareez Barakat, Mr.Abdelnour Abdelnour, andMs. Lina Hundaileh
Executive Directors
Atlas Investment Group(Financial Services)
Mr. Omar Al-Masri CEO
Al-Hikma Pharmaceuticals Mr. Sa’id DarwazahMr. Samih Darwazah
CEOChairman
Jordan Investment Bureau Mr. Hussein Dabbas Deputy Director GeneralMinistry of Industry and Trade Mr. Samer Tawil
Dr. Ahmad Thogan HindawiSecretary GeneralAssistant Secretary General
Int@j (Information TechnologyAssociation)
Mr. Ra’ed BilbessiMe. Ahmad Tantash
CEOHead, Marketing Division
Jordan International for Travel &Tourism
Mr. Hala Ayoubi General Manager
Irbid Chamber of Industry, Al-Hassan Industrial Estate,Qualified Industrial Zone (QIZ)
Ms. Muyassar Azzam Manager
Jordan Exporters and ProducersAssociation for Fruits andVegetables
Mr. Khair Al-Din Shukri Chairman

Economic Impact and Implications for Jordan of the Jordan-U.S. FTA Final Report
AMIR Program 78
Today Philadelphia ChocolateManufacturing Co.
Ms. Lina Hundaileh General Manager
Amin Kawar & Sons Co. Mr. Amin Kawar Dept. General ManagerNCR Corporation Aazzam Shweihat General ManagerScientific & Medical SuppliesCo.
Maher Mouasher CEO
Nuqul Group Mr. Ghassan NuqulMr. Abdelnour Abdelnour
Vice-ChairmanBudgeting Section in-Charge
MMIS Management Consultants Mr. Salwa Bamieh Director/PartnerAl-Faiha Engineering Products Mr. Azzam Annab General ManagerAl-Tewfik Automobile &Equipment Co.
Mr. Hasan Tabbaa Managing Director
Al-Hasan Industrial Estate Mr. Mohammed Abu-Atmeh ManagerAl-Haramain ApparelManufacturing Co. Ltd
Mr. M. M. Khawaja General Manager
Jordanian Industrial Estate Corp. Mr. Abdalla Al-Jahmani Chief, Investors ServiceBureau QIZ
H. Zananiri & Sons Ms. Hanna Zananiri DirectorSpecialized InvestmentCompounds Co. PLC
Mr. Kamil Fakhoury Manager BusinessDevelopment
Jordan Wood Industries Co. Eng. Anwar Haddad Head, Projects Sales Dept.

Economic Impact and Implications for Jordan of the Jordan-U.S. FTA Final Report
AMIR Program 79
Annex D: References
Atlas Investment Group (2000a), ‘Sector Analysis: Third Generation Free Zones’. June 14,Mimeo.
Atlas Investment Group (2000b), ‘The Free Trade Agreement with the US: The FourthInception’. Mimeo.
Atlas Investment Group (2000c), ‘Alphabet Soup: Making the most of the QIZs and the FTA’.Mimeo.
Brown, D. K., A.V. Deardorff and R.M. Stern (1997), “Some Economic Effects of the FreeTrade Agreement between Tunisia and the European Union”. In A. Galal and B.Hoekman, Regional Partners in Global Markets: Limits and Possibilities of the Euro-Med Agreements. London and Cairo: Centre for Economic Policy Research (CEPR) andThe Egyptian Centre for Economic Studies (ECES).
Dessus, S. and A. Suwa-Eisenmann (1998), “Trade Integration with Europe, ExportDiversification and Economic Growth in Egypt”. OECD Development Centre TechnicalPaper No. 1938 and CEPR Discussion Paper No. 1938.
Domaq, I. and G. Shabsigh (1999), “Real Exchange Rate Behavior and Economic Growth:Evidence from Egypt, Jordan, Morocco, and Tunisia”. Washington, DC: InternationalMonetary Fund, Working Paper WP/99/40.
Falvey, R. and G. Reed (1997), “Rules of Origin as Commercial Policy Instruments”.Nottingham, United Kingdom: Department of Economics, University of Nottingham.
Federal Register (1999). Vol. 64, No. 199, October 15. Washington, DC.
Findlay, C. (1999), “ Air Transport”. Manila, Philippines. Paper prepared for East AsiaConference on Options for the WTO 2000 Negotiations. PECC/TPF and World Bank.
Francois, J. and I. Wooton (2000), “Trade in International Transport Services”. TinbergenInstitute Discussion Paper TI 2000-057/2. Erasmus University Rotterdam, TinbergenInstitute.
Ghesquiere, H. (1998), “Impact of European Union Association Agreements on MediterraneanCountries”. Washington, DC. International Monetary Fund. IMF Working PaperWP/98/116.

Economic Impact and Implications for Jordan of the Jordan-U.S. FTA Final Report
AMIR Program 80
Hanson, G.H. (1994), ‘Regional Adjustment to Trade Liberalization’. National Bureau ofEconomic Research. Working Paper No. 4713.
Hanson, G.H. (2000), ‘Increasing Returns, Trade, and the Regional Structure of Wages.’Economic Journal.
Hoekman, B. and C.A.P. Braga (1997), “Protection and Trade in Services: A Survey”Washington, DC: The World Bank, International Economics Department, InternationalTrade Division. Policy Research Working Paper 1747.
Holliday, G. (1998), ‘Generalized System of Preferences’. Congressional Research Service,Library of Congress, May 20.
Industrial Development Department (2001), “The Effect of the Qualified Industrial Zone and theFree Trade Agreement with the U.S.A. on Domestic Industry”. Amman, Jordan:Industrial Development Department of the Ministry of Industry and Trade of theHashemite Kingdom of Jordan.
Jordan Investment Board (undated), ‘Jordan’s Exclusive Qualifying Industrial Zone: A GoldenOpportunity’. Mimeo.
Ju, J. and K. Krishna (1996), “Market Access and Welfare Effects of Free Trade AreasWithout Rules of Origin”. Cambridge, MA: National Bureau of Economic Research.Working Paper 5480.
Konan, D.E. and K.E. Maskus (1997), “A Computable General Equilibrium Analysis ofEgyptian Trade Liberalization Scenarios”. In A. Galal and B. Hoekman, RegionalPartners in Global Markets: Limits and Possibilities of the Euro-Med Agreements.London and Cairo: Centre for Economic Policy Research (CEPR) and The EgyptianCentre for Economic Studies (ECES).
Krishna, K. and A. Krueger (1995), “Implementing Free Trade Areas: Rules of Origin andHidden Protection”. Cambridge, MA: National Bureau of Economic Research. WorkingPaper No. 4983
Krueger, A.O. (1999), “Free Trade Agreements as Protectionist Devices: Rules of Origin.” In J.Melvin, J. Moore, and R. Riezman, eds, Trade Theory and Econometrics: Essays inHonor of John S. Chipman. NY: Routledge.
Lord, M. (1991), Imperfect Competition and International Commodity Trade: Theory, Dynamics,and Policy Modelling. Oxford: Clarendon Press.
Lord, M. (1999), The Handbook of Latin American Trade in Manufactures (ed.). Edward ElgarPublishing.

Economic Impact and Implications for Jordan of the Jordan-U.S. FTA Final Report
AMIR Program 81
Michaely, M. (1994), “Preferential Trade Agreements in Latin America: An Ex AnteAssessment”. Mimeo. World Bank.
Michaely, M. (2000), “Trade Expansion in the Andean Group”. Mimeo. World Bank.
Michalopolus, C. (1999). “Trade Policy and Market Access Issues for Developing Countries:Implications for the Millennium Round”. Washington, DC: The World Bank. PolicyResearch Working Paper.
Panagariya, A. (2000), “Preferential Trade Liberalization: The Traditional Theory and NewDevelopments”. Journal of Economic Literature 38:287-331.
Rajapatirana, S. (1997), “Evaluating Integration Choices: The Case of Bolivia”. Journal ofEconomic Integration 12(3): 298-324.
REACH Initiative (2000), “Launching Jordan’s Software and IT Industry: A Strategy and ActionPlan for H.M. King Abdullah II”. Amman, Jordan.
Ruebner, J. (2000), “U.S.-Jordan Free Trade Agreement”. Washington, DC: Library of Congress.Congressional Research Service. CRS Report for Congress.
Ruebner, J. (2001), ‘United States-Israel Free Trade Area: Jordanian-Israeli Qualifying IndustrialZones’. CRS Report for Congress, Congressional Research Service, The Library ofCongress.
Rutherford, T.F., E.E. Rutström and D. Tarr (1993), “Morocco’s Free Trade Agreement with theEuropean Community: A Quantitative Assessment”. Policy Research Working Papers,WPS 1173, Policy Research Department, The World Bank.
Stephenson, S.M. (undated), “Approaches to Liberalizing Services”. Washington, DC: TradeUnit, Organization of American States (OAS).
TradeCan (2000), TradeCan Database and Software for a Competitiveness Analysis of Nations.Washington, DC: The World Bank and Economic Commission for Latin American andthe Caribbean (ECLAC).
United States Department of State (2001), “FY 2001 Country Commercial Guide: Jordan”.Amman, Jordan.
United States International Trade Commission (USITC, 1999), “The Economic Effects ofSignificant Import Restraints”. Washington, DC. Investigation Number 332-325. SecondUpdate 1999. Publication N. 3201.
United States International Trade Commission (USITC, 2000), “Economic Impact on the UnitedStates of the U.S.-Jordan Free Trade Agreement. Washington, DC. Investigation No.332-418. Publication 3340.

Economic Impact and Implications for Jordan of the Jordan-U.S. FTA Final Report
AMIR Program 82
United States Trade Representative (USTR, 1999), “U.S. Trade Representative Designates ThreeNew Duty-Free Zones in Jordan and Israel”. Press Release October 13.
United States Trade Representative (USTR, 2000), “USTR Barshefsky Designates Three NewJordan-Israeli Qualifying Industrial Zones”. Press Release December 12.
Whichard, O.G. (undated), “Measurement, Classification, and Reporting of Services Activities:An International Perspective”. Washington, DC: Bureau of Economic Analysis, U.S.Department of Commerce.
World Trade Organization (WTO, 1998), “Computer and Related Services: Background Note bythe Secretariat”. Council for Trade in Services S/C/W/45.