Embed Size (px)
Citation preview

Economic History Association
Railroads, American Growth, and the New Economic History: A CritiqueAuthor(s): Peter D. McClellandSource: The Journal of Economic History, Vol. 28, No. 1 (Mar., 1968), pp. 102-123Published by: Cambridge University Press on behalf of the Economic History AssociationStable URL: http://www.jstor.org/stable/2116358Accessed: 10/02/2010 16:47
Your use of the JSTOR archive indicates your acceptance of JSTOR's Terms and Conditions of Use, available athttp://www.jstor.org/page/info/about/policies/terms.jsp. JSTOR's Terms and Conditions of Use provides, in part, that unlessyou have obtained prior permission, you may not download an entire issue of a journal or multiple copies of articles, and youmay use content in the JSTOR archive only for your personal, non-commercial use.
Please contact the publisher regarding any further use of this work. Publisher contact information may be obtained athttp://www.jstor.org/action/showPublisher?publisherCode=cup.
Each copy of any part of a JSTOR transmission must contain the same copyright notice that appears on the screen or printedpage of such transmission.
JSTOR is a not-for-profit service that helps scholars, researchers, and students discover, use, and build upon a wide range ofcontent in a trusted digital archive. We use information technology and tools to increase productivity and facilitate new formsof scholarship. For more information about JSTOR, please contact [email protected].
Cambridge University Press and Economic History Association are collaborating with JSTOR to digitize,preserve and extend access to The Journal of Economic History.
http://www.jstor.org

Railroads, American Growth, and the New Economic History: A Critique
R OBERT Fogel' and Albert Fishlow2 have attempted in recent studies to measure the net contribution of the railroad to
American economic growth in two specific years: 1890 and 1859. Both their methods and conclusions have confused, if not dismayed, more conventional historians. This article has two objectives: The first is to provide a simplified guide to the analytical framework underlying their calculations3 and the second is to suggest to both old and new economic historians that the measurements employed by Fogel and Fishlow bear no direct relationship to what they claim to measure-the benefits to the nineteenth-century economy from the existence of the railroad.
When an historian writes that factor X was "a cause" of economic growth, what he generally means is that somehow X made a differ- ence to the growth process. How much of a difference is quite an- other matter. If one desires to answer the latter question, the pros- pective intellectual exercise is usually appalling. One must mentally remove factor X from the economy, speculate on the total impact of that removal on aggregate growth, and then compare those hy- pothetical results with the growth that actually was achieved. For most historians all counterfactual propositions are about as welcome as the Hydra, and for similar reasons. No issue, they suspect, can be attacked separately without encountering at its side and to the rear a host of other variables relevant to the causal process under study. There is therefore a pronounced unwillingness in the profes- sion to consider those questions beginning with the words "What ff. . .
4
This article has benefited greatly from the incisive criticisms of Alexander Gerschenkron, Elmer and Philip Schaefer, and the members of the Economic History Workshop: Stefano Fenoaltea, Charles Harley, Donald McCloskey, and Richard Sylla.
1 Robert William Fogel, Railroads and American Economic Growth: Essays in Econometric History (Baltimore: Johns Hopkins Press, 1964).
2 Albert Fishlow, American Railroads and the Transformation of the Ante-Bellum Economy (Cambridge: Harvard University Press, 1965).
3 With this objective in mind, the discussion of more technical issues will be con- fined to footnotes.
4 The caution of historians has not entirely eradicated from their writings such words as "decisive" or "indispensable." When used to connote the contribution of a
102

Railroads and Growth 103
Fogel and Fishlow recognize the dangers but deliberately assail the monster. The factor to be removed is railroads; the objective is to measure the impact of that removal on American economic growth of the nineteenth century. Their courage would seem above dispute. What must be challenged is the credibility of their final estimates. Part I will seek to question the adequacy of their data and Part II to establish (quite independent of data considerations) the conceptual inadequacies of their analytical framework. The im- plications of such criticisms will then be briefly considered in Part III.
I
"Social saving" has been defined by Fogel as
the difference between the actual level of national income in 1890 and that level of national income that would have prevailed if the economy had made the most efficient possible adjustment to the absence of the . . . railroad.5
In practice his efforts to measure this saving are devoted primar- ily to estimating what Albert Fishlow calls "direct benefits."
What is required is the additional cost of transporting the commodities and persons actually conveyed by railroad in 1859 by the least expensive alterna- tive means.6
This measure has two components. If goods had been shifted from railways to (say) canals, part of the increased cost would have been in the form of higher transport prices charged by canals. Over and above these charges, shippers would also have had to pay ad- ditional costs because of slower deliveries, higher insurance rates from shipping by water, etc. Thus, if:
Pr= the price per ton-mile charged by railways Pa-the price per ton-mile charged by the alternative carrier (wagon or water
transportation companies) R = the total ton-miles carried by the railways in a given year In= the costs per ton-mile (in addition to Pa) incurred because alternative
carriers deliver more slowly, have higher insurance rates, etc.,
given factor to aggregate growth, such words would seem to imply the sort of counterfactual speculation outlined above. If such is not the case, it is difficult to understand what they do imply, other than the unrestrained enthusiasm of the writer for his subject.
5 Fogel, Railroads, p. 20. For three other possible definitions of social saving re- jected by Fogel, see ibid., pp. 20-21.
6 Fishlow, American Railroads, p. 63.

104 Peter D. McClelland
then the total social saving is the sum of7
(Pa-Pr)R + (In)R.
The above measure suggests that each writer must secure the following data :8 (a) the prices actually charged by railways (Pr) in the year in question (1859 or 1890); (b) the ton-miles carried by railways in that year (R); (c) how those ton-miles would have been divided among canal, river, lake, and wagon carriers in the event that no railways had been built; and (d) what the costs of movement would have been on each of the alternatives (Pa + In) had they been called upon to carry the diverted tonnage. Clearly this is a tall order. Given the shortage of available data, the results cannot be expected to be correct to the third decimal point. The question is whether they are acceptable as a rough indication of the gains to the economy from having the railroad.
To begin with Robert Fogel: His goal is to estimate, for the year 1890, the social saving achieved by the railroads in the transporta- tion of agricultural produce, and then the social saving for all com- modities (agricultural plus nonagricultural). The movement of agricultural produce is broken down into interregional trade and intraregional trade.
"interregional distribution" is defined as the process of shipping commodities from the primary markets of the Midwest to the secondary markets of the East and South. For all other shipments, those from farms to primary markets and from secondary markets to the points immediately surrounding them, the term "intraregional distribution" is used.9
Estimation of social saving in interregional trade requires some knowledge of the average transit distances and the average freight rates charged by both water and rail carriers.'0 Various assumptions
7 If the subscripts c and w refer to water and wagon transportation, respectively, then
(Pa-Pr)R would be comprised of
(Pc-Pr)Rc + (Pw-Pr)Rw where R. indicates the ton-miles heretofore carried by railroads and now diverted to water transportation.
8 Fishlow actually calculates three measures of social saving. An appendix criticiz- ing the other two is available from the writer on request.
9 Fogel, Railroads, p. 19. 10 ". . . averages that cannot reliably be calculated until the linear programming

Railroads and Growth 105 are made, such as "the New York to Chicago all-water rate per ton- mile on wheat equalled the average all-water rate (per ton-mile) on all grains over all the relevant routes.""- These rates are then ad- justed to allow for those real costs that are incurred when shipping by water but are not included in freight rates quoted by water car- riers; namely,
cargo losses in transit, transshipment costs, wagon haulage from water points to secondary markets not on water routes, the cost resulting from the time lost when using a slow medium of transportation, the cost of being unable to use water routes for five months out of the year, and finally, capital costs not re- flected in water rates.'2
The difference between these adjusted water rates and quoted rail- way rates in 1890 is then termed the social saving per unit from the interregional transportation of agricultural produce.
The dominance of grain shipments in interregional trade suggests the importance of measuring accurately the costs of moving grains without the railroad. As indicated above Fogel assumes that the freight rate charged by alternative carriers would have been equal to the Chicago to New York all-water rate on wheat. His justification is simple: "Casual examination of the available data suggests that these figures are approximately the same as those applying to all grains on this and other routes."'3 Two references are given in sup- port of this statement: a Congressional Report14 and a private publi- cation by the Louisville and Nashville Railroad.15 Only the former was available to this writer. Its evidence suggests that Fogel's rate is anything but representative. The Chicago to New York freight rate understates alternative costs, partly because it includes a large component of low-cost lake transportation which most other routes
problems are solved." (Ibid., p. 38). These problems are never solved. However, the failure to find the least-cost solution is not serious, provided alternative proce- dures give estimates that exclude serious downward biases. (Without such an exclu- sion one has no assurance that the final measure is an upper bound.)
11 Ibid., p. 38. The rate on pork from St. Louis to New Orleans is relied upon to provide a similar estimate for all meat products on all routes. (Ibid., p. 40).
12 Ibid., p. 41. 13 Ibid., p. 38. 14 U.S. Congress, Senate, Preliminary Report of the Inland Waterways Commis-
sion (60th Cong., 1st Sess., 1908), Doc. 325, pp. 205-9 (hereafter cited as Water- ways Commission). The page citation is apparently incorrect. What evidence is available in this report is discussed below.
15 Southwestern Freight Tariff, No. 9 (November 16, 1890).

106 Peter D. McClelland
could not duplicate, and partly because it includes no canal tolls whatsoever. (All tolls on the Erie Canal were discontinued after 1882.) Even on New York canals, the average freight rate per ton- mile in 1890 was 0.26 cents,'6 almost twice as high as the figure of 0.139 cents used by Fogel.17 The contrast with costs on western rivers is also unfavorable. To move wheat by barge from St. Louis to New Orleans in 1890 cost 0.19 cents per ton-mile;'8 to move grain in sacks by steamer, 0.27 cents per ton-mile.19 Casual examination of available sources therefore suggests that the cost of water alter- natives has been understated, thereby giving a strong downward bias to the final estimate of social saving in interregional trade.
Tenuous as these results are, they are by far the least controver- sial of Fogel's three main estimates. The second of these concerns the intraregional trade of agricultural produce. Scarcely any data are available to indicate the actual costs of shipment by rail, how railroad tonnage would have been divided among alternative car- riers, or what those carriers would have charged to move the re- allocated tonnage. Fogel pursues all available clues with a host of impressive cerebral and statistical manipulations. The question is whether the final results are believable. They ultimately depend on such devices as estimations of water rates in 1890 for 29 commodi- ties from a 1912 study of 12 commodities,2' and estimations of average wagon hauls in 1890 from "a random sample in which mod- ern highway distances were compared with straight line distances drawn on maps."22 Whatever their merits as an intellectual exercise, such results will undoubtedly leave with most readers a credibility gap of the first magnitude.23
Even if one could accept at face value both of these estimates- namely, the social saving provided by the railroad in the inter-
f16 Waterways Commission, p. 236. A footnote states: "From 1883 to 1899 canal rates are based on rates on wheat from Buffalo to New York."
17 Fogel, Railroads, p. 38. 18 Waterways Commission, p. 344. This calculation is based on the assumption
that 1 bushel of wheat weighed 60 pounds. The distance by water from St. Louis to New Orleans (1161 miles) was obtained from U.S. Bureau of the Census, Eleventh Census of the United States, 1890. Transportation, II, 420-22.
19 Waterways Commission, p. 344. 20 For a definition of "intraregional," see footnote 9. 21 Fogel, Railroads, p. 70. 22 Ibid., p. 67. 23 Even Fogel admits (p. 55) that the final results contain a number of upward
and downward biases, with the ultimate effect unclear.

Railroads and Growth 107
regional and intraregional transportation of agricultural produce- what about nonagricultural goods and passenger traffic? Without comparable estimates of social saving for these two no statement can be made about the total reduction in GNP that would have re- sulted in 1890 from a complete absence of the railroad. The case of passenger traffic receives no consideration at all. The necessity for including an estimate for nonagricultural goods is recognized,24 but no serious attempt is made to derive the relevant numbers. Despite this, after a few cursory observations on the geographical concentration of coal and iron production25 (a concentration that would have facilitated the substitution of canals for railroads), Fogel is still prepared to hazard the guess that "careful study will yield an [upper bound estimate of social saving] for all commodi- ties that is well below 5 percent of gross national product."26 In Fogel's own words, "magnitudes can only be determined by mea- surement."27 With no serious measurements attempted the question of total benefits to all commodities is perhaps better excluded from a work that is confined essentially to estimating the gains from shipping agricultural produce by rail.
The estimation techniques of Albert Fishlow are also suspect. He too confronts a serious data shortage; in this case, the "meager supply of information relating to transportation services in the pre- Civil War decades."28 Consider, for example, the problem of pas- senger traffic. The superiority of railways was such that alternative competitors were virtually wiped out by 1859. (Small wonder that Fogel avoided the problem.) An absence of competitors implies an absence of rate schedules to compare with the prices actually charged by railways. Fishlow must therefore resort to the roughest of estimation techniques29 to derive a number that is to account for over 40 percent of his final measure of total direct benefits of $175 million.30
Freight calculations also encounter considerable difficulties. Ap- proximately 2.5 billion ton-miles of freight3' are to be reallocated;
24 Ibid., pp. 219-21. 25 Ibid., pp. 221-22. 26 Ibid., p. 223. 27 Ibid., p. 243. 28 Fishlow, American Railroads, p. 32. 29 See ibid., p. 92. 30 Ibid., p. 52. 31 Ibid., p. 32.

108 Peter D. McClelland
almost one billion to wagon transportation.32 The price that wagons would have charged for such shipments is assumed to be 15 cents per ton-mile. Fishlow's only justification for using that number is a reference to Taylor's Transportation Revolution.33 Taylor himself concedes:
Any summary of the cost of land transportation presents unusual difficulties because charges depended on many factors, including the condition of the road, the season of the year, the presence or absence of back haul, the level of wages and prices, and competitive conditions.34
Despite these reservations, Taylor is still prepared to assert that "By the fifties, 15 cents was considered the usual rate on 'ordinary high- ways.'"35 In support of this statement he gives six references. Three of these contain the following information on wagon transportation rates: (a) a rate of 13 1/8 cents per ton-mile reported by a single member to a convention in Baltimore in the year 1825;36 (b) a minimum rate of 20 cents per ton-mile "in some parts of the coun- try" for a time period that remains unspecified;37 and (c) a rate of 10 cents to 15 cents per ton-mile on macadam roads and 15 cents to 20 cents on common turnpikes, reported by an engineer on the James River and Kanawha Canal and Railroad in the year 1839.38 Of the three remaining sources, two39 present an identical table showing variations in total cost as wheat and corn are transported by wagon at a rate of 15 cents per ton-mile. The first of these, pub- lished in 1853, gives no source; the second, published in 1857, re- ports that the information was "cut from a Chicago newspaper."40 At best, these two would seem to constitute a single reference, with
32 Ibid., p. 93. 33 Ibid., p. 73. Fishlow incorrectly gives the reference as Appendix B in Taylor's
book. The relevant data may be found in George Rogers Taylor, The Transportation Revolution, 1815-1860 (New York: Holt, Rinehart and Winston, 1951), Appendix A, p. 442.
34 Taylor, Transportation Revolution, p. 133. 35 Ibid., p. 134. 36 Caroline E. MacGill et al., History of Transportation in the United States Before
1860 (Washington, D.C.: Carnegie Institution, 1917), p. 223. 37 Logan G. McPherson, Railroad Freight Rates in Relation to the Industry and
Commerce of the United States (New York: Henry Holt and Company, 1909), pp. 148-49.
38 Hunt's Merchants' Magazine, V (Sept. 1841), 284. 39 George L. Vose, Handbook of Railroad Construction: For the Use of American
Engineers (Boston: James Monroe and Company, 1857), p. 3; U.S. Congress, Senate, Andrews Report (32d. Cong., 1st Sess., 1853), Sen. Exec. Doc. 112, p. 380.
40 Vose, Handbook, p. 3.

Railroads and Growth 109 the ultimate source unclear. Taylor's sixth and final reference is to a book by J. L. Ringwalt4' which in turn relies on Seaman's esti- mate42 that (circa 1852) the average price for transporting by teams in the United States was 15 cents per ton-mile for grain and 18 cents for merchandise. Ringwalt presents these freight rates as representative only of the "Northern and North-Western States." For the period 1850 to 1870 he suggests higher transportation rates for the south, and rates up to 38 cents per ton-mile on the plains.
To know how representative a given transportation rate is, one needs some information on the size of the sample on which it is based and the nature of the selection process used to get the obser- vations. The above sources appear to give, at best, two unsubstan- tiated opinions that wagon rates were on the average 15 cents per ton-mile at some time during the 1850's. This does not inspire con- fidence in estimates based on such rates, particularly when those estimates are to account for 40 percent of a total freight reallocation of 2.5 billion ton-miles. (If 20 cents per ton-mile is a more reason- able estimate of wagon freights, Fishlow's total social savings esti- mate of $175 million43 is increased by $50 million, or by 29 percent.)
II
Even if all of the numbers presented by Fogel and Fishlow were correct to the third decimal place, one would still tend to reject their findings as an accurate portrayal of the real social savings created by the railroads in 1859 and 1890. No clear relationship exists between those numbers and the true social saving unless one accepts certain assumptions about the behavior of, and cost condi- tions in, transportation industries of the nineteenth century. These assumptions must be challenged.
Suppose that a proposal has been made to build one mile of rail- road track to link two urban centers. Assume further that: (a) a canal already exists between those two centers; (b) the railroad will cost $1000 to build, and will wear out at the rate of 5 percent per year; (c) wheat is the only product to be transported; and (d) the costs of shipping one ton of wheat for one mile are as follows:
41 Development of Transportation Systems in the United States (Philadelphia: J. L. Ringwalt, 1888), p. 28.
42 Ezra C. Seaman, Essays on the Progress of Nations (New York: Charles Scrib- ner, 1852), p. 363.
43 Fishlow, American Railroads, p. 52.

110 Peter D. McClelland Shipping Costs Per Ton-Mile
(in cents)
Canal Railway Railway Not Built
Prices charged to shippers 20 Marginal costs44 of moving wheat 5
Railroad Built Prices charged to shippers 10 10 Marginal costs of moving wheat 5 2
Two further assumptions are needed: (e) The marginal cost structure in both railroads and canals will be assumed to be con- stant. That is, irrespective of how much wheat is carried, one less ton-mile carried on the railroad will cut 2 cents from its total costs of operation; one additional ton-mile carried by the canal will add 5 cents to its costs.45 (f) Once the railroad is built, it will offer a service identical to that offered by the canal (that is, such considera- tions as the greater speed of the railroad will be ignored). Railroad competition will therefore force the canal to lower its shipment price to match exactly that price charged by the railroad, namely, 10 cents per ton-mile.
The term "direct financial saving" will be used to refer to the total money saved by shippers of wheat once the railroad is built. In the above example, it is46
($0.20 - $0.10)Q
where Q is the quantity of wheat shipped, in ton-miles.47 If:
44 A few words of explanation may be necessary for those unfamiliar with this terminology. Marginal cost is defined as the increment to total cost from carrying one more ton of wheat one mile. Before the railroad is built, the canal receives, per ton-mile of wheat moved, 20 cents, while the incremental cost of moving that wheat is only 5 cents. Thus, 15 cents has been earned to put toward profits and to defray such fixed costs as canal maintenance. For a further discussion of the differences between marginal costs, variable costs, and fixed costs see Paul A. Samuelson, Eco- nomics: An Introductory Analysis (4th ed.; New York: McGraw-Hill, 1958), ch. xxiv.
45 This is not equivalent to assuming constant returns to scale, insofar as the existence of fixed costs will cause average total costs to fall continually, ultimately approaching the marginal cost curve asymptotically.
46 If the general price level has changed in the interim, further adjustments would be necessary to make the two prices comparable.
47 The reader familiar with the concept of consumer surplus will recognize the standard bias problems, depending on the elasticity of demand and which quantity one uses (the smaller shipments when prices were high or the larger shipments after prices have fallen). Such refinements can be ignored here insofar as this measure will have little bearing on subsequent analysis. For further discussion, see Fishlow, American Railroads, pp. 23-32.

Railroads and Growth 111
Pt1 = the shipment price for wheat before railways are built, and
Pt2 = the shipment price charged by both railways and canals after the railway is built,
then the general formula for total direct financial savings is:
(Pt -Pt2)Q.
This measure bears no necessary relationship to what will be termed "real social savings"-the total gain in community output from the fact that fewer resources are being used by the more efficient transportation device. Every ton carried one mile on the canal uses 5 cents worth of resources; every ton carried by the rail- road uses only 2 cents worth of resources. The total gain in released resources from moving R ton-miles on the railroad is therefore:48
($0.05 - $0.02) R. If:
MCC = the marginal cost of carrying 1 ton-mile of wheat on canals, and
MCr = the marginal cost of carrying 1 ton-mile of wheat on the railroad,
then the general formula for real resource saving in any given year is:49
(MCC - MCr)R.
This in turn indicates the potential gain in total output, as released resources are put to work creating goods and services in alternative occupations.50
Two costs are involved in building the railway. Recall the assump- tion that depreciation on the railroad, once built, was 5 percent per annum (that is, 5 percent of $1000 or $50). Assume that each year just enough is spent (namely, $50) to maintain the railroad at its original value ($1000). Then clearly one cost to be deducted from the above gains is $50, or more generally
dKr
48 Bias problems also enter here. One may wish to consider only that proportion of traffic heretofore carried by canals and now carried by railroads (= Qtl- [Qt2 -
R]) or the total traffic now carried by railroads (R). In subsequent discussion, the latter formulation will be used to simplify the analysis.
49 The validity of this measure depends on the assumption that marginal costs remain constant for both carriers as wheat is shifted from railroads to canals.
50 If perfect competition prevails in those alternatives and resource shifts are small, then the value of resources saved will exactly equal the value of the output which they create in those alternatives (see Fishlow, American Railroads, p. 26).
112 Peter D. McClelland where d = the annual depreciation rate (5 percent), and
Kr = the value of the railway at the beginning of the year ($1000).
In addition if the railway had not been built at all, $1000 worth of resources could have been employed in an alternative invest- ment. If capital markets are reasonably competitive, the potential annual return on a $1000 investment elsewhere is indicated by:
$1000 (i)
where: i the market rate of interest.5' This represents the fore- gone return, or opportunity cost, from committing investment resources to railway building. In any given year the total gains from having the railroad are
($0.05 - $0.02)R
and the total costs are
$50 + $1000(i).
The net real social saving is the difference between the two:
( $0.05- $0.02)R - [$50 + $1000(i)]
or in more general terms:
(MCC - MCr)R - [dKr + iKr]. (1)
This contrasts sharply with the direct financial gains to shippers:
($0.20 - $0.10)Q
or in more general terms
(Pt,-Pt2)Q. (2)
Equations (1) and (2) will provide the basis for subsequent criticism of the measure of social saving used by Fogel and Fish- low. Two changes must first be made in equation (1). Alternative carriers for railroad traffic included canal, river, lake, and wagon transportation. For the subscript c the more general subscript a
51 The relevant interest rate would be that on riskless securities, insofar as the desired comparison is with what one could have been certain of making in the next best alternative. The necessity for including a depreciation allowance should now be clear. Suppose that $1000 is invested either in securities yielding 7 percent or in building a railroad that wears out completely in one year. If securities are bought, at the end of the year one would have $70 plus the original $1000 worth of assets. The relevant comparison with railroads therefore includes an expenditure on railroads to offset depreciation, thereby guaranteeing that one is contrasting two choices, both of which will keep the value of assets invested ($1000) intact.

Railroads and Growth 113
can be used to designate a range of alternatives that includes, but is not confined to, transportation by canal. Railroad traffic (R) must then be apportioned to these alternatives, and separate calculations made for the real social savings in each case. The formula
(MCa - MCr)R - [dKr + iKr]
will represent the summation of these separate calculations.52 This measure still underestimates the gains from the railway if rates charged by alternative carriers do not reflect all the costs of using those alternatives (such as higher insurance rates, slower deliveries, etc.). In previous discussion the symbol In was used to designate such costs, per ton-mile of freight shipped.53 The final measure of real social saving therefore becomes
(MCa - MCr) R - [dKr + iKr] + (In) R.
This contrasts sharply with the measure used by Fogel and Fish- low, namely,54
(Pa-Pr)R + (In)R.
One is immediately struck by the absence of the term
[dKr + iKr].
Both writers can hardly be faulted for this omission. If a measure that excludes a negative term is sufficiently small to discount the importance of the railways, then the correct measure will hardly revise that conclusion.
The central issue is the relationship between
(Pa -Pr)R and
(MCa - MCr) R.
52 Consider a case of only two alternatives-canals and wagons-denoted by the subscripts c and w, respectively. Then
(MCa - MCr)R - [dKr + iKr]
would represent
(MCC - MCr)Re + (MCw - MCr)Rw - [dKr + iKrI
where Re = the railway tonnage diverted to canals, Rw = the railway tonnage diverted to wagons, and
Rc + Rw = R.
53 See Sec. I, par. 2. 54 See Sec. I, par. 2.

114 Peter D. McClelland
The first of these will give an accurate indication of the saving created by railways if, in 1859 and 1890, (a) for all carriers (rail- ways and alternatives) the price charged to move goods (P) was equal to the marginal cost of moving those goods (MC), and (b) the marginal cost structure for all carriers was constant (that is, if railway tonnage had been rediverted to alternatives the marginal costs of both railways and those alternatives would have remained constant as that diversion was effected).
The assumption that price must have equaled marginal cost for all carriers is never made explicit by Fogel, let alone justified.55 The necessity for this assumption is conceded by Fishlow but accepted as valid given the severity of competition within the transportation industry.56 That industry was dominated by railways and canals, the services of which in a given area were controlled by a small number of firms. A market structure characterized by few partici- pants is generally assumed not to effect the equalization of prices with marginal costs.57 Indeed, a major objection of economists to such a market structure is the tendency for prices and marginal costs to diverge. What intense competition should have assured was little divergence among the prices charged by different partici- pants.58 Any measure that is based on a divergence of prices, such as
(Pa-Pr)R + (In)R,
is therefore virtually assured of a small result.59
55 His one relevant observation is that "even if water rates in 1890 equalled marginal cost . . ." (Fogel, Railroads, pp. 27-28), but at no point is it explicitly stated that such was indeed the case.
56 Fishlow, American Railroads, p. 29. 57 In any oligopoly the relationship between average revenue and marginal cost
is indeterminate, barring further assumptions about the behavior of the firms. For examples of determinate solutions based upon unrealistic assumptions, see Edward Hastings Chamberlin, The Theory of Monopolistic Competition (8th ed.; Cambridge: Harvard University Press, 1962), ch. iii.
58 The increased competition from railways forced many canals to cut their prices, thereby passing on to the public some of the benefits achieved from earlier techno- logical advances in transportation. The possibility that canals, if left unchallenged, would have charged monopoly prices is one reason why the earlier measure of "direct financial benefits"
( Ptj - Pt2 ) Q
cannot be equated to the Fogel-Fishlow measure
(Pa - Pr)R.
The greater the monopoly power, the more would Pt1 diverge from the price charged by alternative carriers (Pa) when railways were actually competing.
59 The same point has been stressed by Stanley Lebergott, "United States Trans-

Railroads and Growth 115
The other assumption required by Fogel and Fishlow to give validity to their measure of social saving is a constancy in the marginal cost structure of all transportation firms. Only the cost structure in water transportation is considered by Fogel.60 His con- clusion is that for such carriers "it seems quite reasonable to assume that marginal costs were constant or declining.""6 Three reasons are offered in support of this assumption: (a) Most water routes did have excess capacity in 1890;62 (b) "there is no reason to assume that the cost of producing or operating additional boats would have risen unless bottlenecks developed along water routes;"63 and (c) if more tonnage had been moved on water routes, certain operating costs such as dredging, repairing locks, and supplying water "would have increased only slightly as tonnage carried rose."64
Fishlow also neglects the problems of the cost structure in rail and wagon transportation.65 Like Fogel, he assumes a constancy in the marginal cost of water carriers because of the observed excess capacity in that industry.66 Reference is also made to the fact that the increase in tonnage carried by New York canals between 1859
port Advances and Externalities," JOURNAL OF ECONOMIC HISTORY, XXVI (Dec. 1966), 439. This applies, of course, only to the extent that railways did compete directly with alternative carriers. When that competition was not severe, a close similarity between railroad prices and those of alternative carriers would have been unlikely. Even more unlikely, however, would have been an identity of price with marginal costs within all transportation companies.
60 ". . . using the 1890 rates [for water transportation] is equivalent to assuming that the marginal cost of water transportation was constant over the relevant range" (Fogel, Railroads, p. 28). If water carriers now transport C ton-miles and are to acquire an additional R, ton-miles as railways disappear, the relevant range through which marginal costs must be constant is from C to C + R,.
61 Fogel, Railroads, p. 28. 62 Ibid. 63 Ibid. 64 Ibid. No attention will be given to Fogel's suggestion that water transportation
may have been a declining cost industry. Those interested in problems of market structure will nevertheless be struck by the difficulty of achieving a stable equilibrium in an oligopoly where one firm has falling costs. One reservation might be noted. If boat building in 1890 was a highly competitive industry, most scale economies would have already been exploited, thereby removing the most obvious source for the pecuniary external economies hinted at by Fogel on p. 28.
65 One brief aside is made by Fishlow (p. 93) on the possibility of rising costs in wagon transportation under the additional burden of one billion ton-miles of freight. Difficulties thereby created are dismissed by the use of geometry that ap- pears to be incorrect (Fishlow's Fig. 4, p. 95). This becomes apparent when one adjusts the diagram for the existence of two markets, the one lacking access to railroads and the other ignoring wagon transportation as long as the railroads are available.
66 Fishlow, American Railroads, pp. 33-34.

250
200 Index of N. Y. Canal Freight Rates a
150 /
100 E I
, '\! \v~~~~~~~hO~Whleale PriceI
80 1859 1860 1861 1862 1863
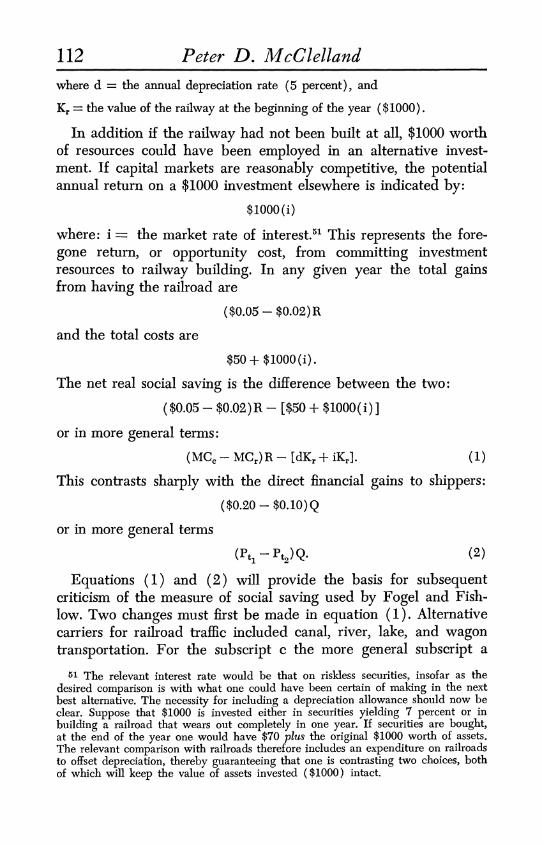
CHART 1. Indexes of wholesale prices and freight rates on New York canals, May through November, 1859-1863 (May through November 1859 = 100) Sources: Freight rates, see Table 2.
Wholesale prices, calculated from George F. Warren and Frank A. Pearson, -Prices (New York: John Wiley and Sons, 1935), p. 12.
116

Railroads and Growth 117
and 1863 was roughly equivalent to the total ton-miles carried by the four main trunk railway lines in 1859.67
Changes in canal tonnage during this period are given in Table 1. In 1859 the four trunk railway lines in question carried almost 400 million ton-miles of freight.68 By 1863, New York canals were carry-
TABLE 1 NEW YORK CANAL TRAFFIC
Total Tonnage Moved Tons Moved 1 Mile Year (in thousands) (in thousands)
1859 3,782 544,309 1860 4,650 809,525 1861 4,508 863,624 1862 5,599 1,123,548 1863 5,558 1,034,130
Sources: New York (State), Auditor of Canal Department, Annual Report on the Tolls, Trade and Tonnage of the Canals of the State of New York, 1862, pp. 19, 32; ibid., 1865, pp. 32, 35.
ing almost 500 million ton-miles more than they had in 1859. These canals would therefore have been physically capable of handling a total rediversion of railroad traffic in 1859. The relevant question is what that rediversion would have done to the operating costs of water transportation companies.
Under the increased pressure of Civil War traffic, prices on New York canals skyrocketed (see Chart 1).69 Increases in canal tolls70 and an expanded supply of boats71 ultimately moderated the net gains of boat operators. Prices paid by shippers nevertheless did not begin to return to 1859 levels until 1863, and even then the harvest months continued to witness a tremendous upsurge in shipping charges.
Price increases per se indicate nothing about the trend in costs in an industry characterized by few competitors. The exercise of monopoly power as well as the lagged response in the supply of boats undoubtedly help to explain the movements depicted in Chart 1. Fragmentary evidence nevertheless does suggest some up-
67 Ibid., p. 33. *68 Ibid., p. 64. 69 The data on freight rates used in Chart 1 refer to flour shipped, per barrel of
216 pounds. Comparable data were not available for the food products that domi- nated eastbound canal traffic, namely, wheat and corn. Such information as could be found does indicate a similar pattern of wildly gyrating freight charges (see Table 3).
70 See Table 2. 71 See Table 4.

118 Peter D. McClelland
ward pressures in operating costs in response to the extraordinary pressures of Civil War traffic. Complaints of overcrowding on the Erie Canal were frequently made, most of them by vested interests bemoaning the loss to society from "vexatious delays" at over- crowded locks, particularly between Buffalo and Montezuma.72
TABLE 2 CANAL FREIGHT RATES, BUFFALO TO ALBANY, 1859-1863
(PER BARREL OF 216 LB.)
1859 1860 1861 1862 1863 Month (cents) (cents) (cents) (cents) (cents)
May 27 30 39 40 43 June 28 30 32 38 43 July 30 31 32 43 43 August 28 39 35 46 41
September 31 46 49 52 40 October 36 50 59 55 48 November 37 68 76 60 60
Note: Includes tolls as follows (in cents): 1859, 15; 1860, 15; 1861, 19; 1862, 23; and 1863, 23. Source: New York (State), Auditor of Canal Department, Annual Report on the
Tolls, Trade and Tonnage of the Canals of the State of New York, 1865, p. 20.
The net contribution of such pressures to recorded price increases cannot be assessed until more adequate data are uncovered. But what has been conclusively demonstrated by Chart 1 is the impos- sibility of asserting both that prices were equal to marginal costs and that marginal costs were constant.
The validity of the assumed constancy in all marginal cost struc- tures can be challenged by more general arguments. Earlier dis- cussion indicated that an assessment of the net contribution of any innovation to aggregate growth necessarily involved the mental
72 "The locks on the Erie Canal from Troy to Montezuma are all double. From Montezuma to Buffalo the locks are all single, with the exception of the five com- bination locks at Lockport. The eastern section of the Erie Canal is taxed with the business of the lateral canals, including the Oswego, Black River, Chenango, Seneca and Cayuga, and Chemung, in addition to the movement through the main trunk from Buffalo." Buffalo Board of Trade, Annual Statement of the Trade and Com- merce of Buffalo for the Year Ending December 31, 1865 (Buffalo: Matthews and Warren, 1866), p. 17. For complaints of overcrowding on the Erie during the Civil War, see ibid.; also New York Chamber of Commerce, Sixth Annual Report for the Year 1863-64 (New York: John W. Ameriman, 1864), pp. 145-53; U.S. Congress, Senate, Memorial of the Chamber of Commerce of the State of New York Praying the Enlargement of the Erie and Oswego Canals (37th Cong., 3d Sess., 1862-63), Sen. Misc. Doc. 12; City of Chicago, Report of the Committee on Statistics, Sub- mitted to the National Convention at Chicago, June 2, 1863 (Chicago: Chicago Tribune Company, 1863), pp. 23-25.

00 00 0 0t- 00 '-I '11 COCO r- 10 a
o000 10i- 0 0 t t O CO 1 0o o c
00 o
. - 0 000 00 C) 00 00 - ' dq %) Q
0OC 0100 o
00 C
I00 6ac enC
oo 00 ':
r-
a a 0 C M CO 001 0 o0, Co. CO 00 t 00 'Hco 00 10t''C 0 v
0~~~~~~~~1 Q
0O~~~i 6 ct 6 oO i o6 8 8 6 6 00 C
4.? ; O O C ? CY di 0 0 U) ce1 0
co o
OO > a) ms~ o o, m
00 v c0 0 0' ) c v10 r-4C)1Co) 0 - H Ca X0 0 CO 0 O 0 V q t
n ~~~~ O C) t- 10 ( :? - 6
> m a aC) Co C) (M C in c) I. Cs in Cs
Ht - C 0 c) ;0a
0 t) c6 ~6 c6,.4 6 i6 ci i6 r C ) C
?~~~~~0t 0 , C 1 00O XXX
0 Ca
a) n 0 0Co 0 00010 i 00 -4Co M ~ c C~O) ) -41 00000l C Co00 Co
' 10C0O0 C 00 t-4 0c0 a)m
c- i6 o6 t- ;i vX GD o6 c6 c6 D D
r- P-q -q c CI
d0 C? r-i Cl CO, r- 1 O rqC1C
loomo mo ?Oo P 'Z
CYa)
- > ..- .
119~~~~~~~~9~
a) CL)
Cd
Ca0 0.4 Ca
00
00 CaD
0 0~~~~~0 4-j
.b.s CIS C 0 0 Ca~~~~~~~~~~~~~~'
119

120 Peter D. McClelland TABLE 4
BOATS ON THE NEW YORK CANALS: AVERAGE CARGO AND TONNAGE OF NEWLY BUILT BOATS, 1850-1865
Boats Built and Registered (tonnage) Average Cargo
Year Total Average per Boat (tons)
1850 12,260 80 76 1851 18,450 87 78 1852 23,945 88 80 1853 57,280 97 84 1854 80,365 105 94
1855 48,220 102 92 1856 38,990 107 100 1857 37,510 114 100 1858 27,830 109 126 1859 20,150 98 143
1860 48,355 120 140 1861 95,230 154 157 1862 142,470 168 167 1863 119,170 177 177 1864 56,235 141 150
1865 28,795 144 160
Source: New York (State), Auditor of Canal Department, Annual Report on the Tolls, Trade and Tonnage of the Canals of the State of New York, 1866, pp. 49-50.
removal of that innovation from the economy and the hypothetical reallocation of all goods and productive factors affected. What then is a reasonable reallocation? The economic effects of such changes can only be estimated from surviving price and cost data for the years 1859 and 1890. These data at best indicate only the relation- ship that prevailed between small shifts in productive activity and associated costs. (In more technical language, prices and costs indicate only the nature of prevailing economic relationships at the margin.) The larger the resource shift proposed, the less likely are surviving cost data to give a reasonable approximation to the actual costs that would have been incurred had that shift taken place. Fishlow is attempting to reallocate 2.5 billion ton-miles of freight and over 1.5 billion passenger-miles.73 Fogel must redistribute 79.2 billion ton-miles of freight and (for a complete measure of social saving) 12.0 billion passenger-miles.74 That either can extrapolate
73 Fishlow, American Railroads, p. 32. 74 U.S., Bureau of the Census, Eleventh Census of the United States, 1890. Trans-
portation, I, 593.

Railroads and Growth 121
readily from surviving cost data would therefore seem highly doubt- ful.75
III
The conclusions of Robert Fogel have often been attacked for reasons quite distinct from those outlined above. A single measure of cost differences between transportation devices, so this argument runs, cannot presume to assess the overall contribution of the rail- way to the American economy. By 1890 railroads had affected such developments as the increased mobility of the populace, technolog- ical advances in the iron industry, and the international migration of labor and capital to America. If such changes are judged to have had a significant bearing on economic growth, and if one cannot know how each would have developed in the absence of the rail- road, then a complete assessment of the railroad's contribution to American economic growth cannot be made. To ask "What if there had been no railroads in 1890?" is to ask too much.
Such criticism would seem less applicable to the work of Albert Fishlow. By 1859 railroads were still a relatively new invention, their contributions to development far less complex than those achieved by 1890. Fishlow's measure of social saving might there- fore be a good approximation of the overall benefit wrought by a single transportation innovation as of 1859.76 Even if this is deemed unreasonable-even if the gap between this single measure and the total contribution of the railroad in 1859 or 1890 is judged to be so wide that all generalizations about net benefits from a single mea- sure are unpalatable-the measurements of both Fogel and Fish- low might still be of value. If both men did little more than ac- curately approximate the savings in the transport sector achieved through railroads, that single measure would surely justify their labors. As a first step toward understanding the impact of the railroad on the development process, such a calculation would seem both logical and highly instructive. The purpose of this article has been to suggest that such a step has not been made. The social savings estimates of both men cannot be accepted even as a first
75 For a similar criticism of Fogel's work, see Marc Nerlove, "Railroads and American Economic Growth," JOURNAL OF ECONOMIC HISTORY, XXVI (Mar. 1966), 112.
76 Fishlow himself makes no such claim. Indeed, much of his book is devoted to elaborating various other effects wrought by the railroads through backward and forward linkages to the manufacturing and agrarian sectors of the economy.

122 Peter D. McClelland
approximation to the less ambitious measure: the total resource saving achieved in the transport sector through the use of railways. This conclusion follows from the dual thrust of Parts I and II above. Much of their key data was found to be of dubious accuracy, while those assumptions central to their analysis were shown to be at variance with reality.
The conclusions of Part II have wider implications. What Fogel and Fishlow wanted was a measure of the railroad's contribution to economic growth through its use of fewer resources in the transport sector. What they lacked was detailed information on the cost func- tions of the carriers concerned. These difficulties were circumvented by assuming that for all carriers prices were equal to marginal costs and marginal costs were constant. Price data could then be used to make inferences about real resource saving.77 Once these assump- tions are rejected, the analyst who would measure real resource saving is again confronted with the necessity of estimating varia- tions in cost functions as railroad traffic is hypothetically rediverted to alternative carriers. Given how little is known about the cost conditions in question, the end result is likely to be tenuous in the extreme. Surviving price data could still be used to quantify a dif- ferent benefit of the railroad. This measure is what has been termed "direct financial savings," or
(Pt-PO)Q.
If applied to a period shortly before and after the railroad was in- troduced into a given area, such a measure should indicate the financial gains to transport users attributable to the arrival of the iron horse. (Whether prices fell because of lower costs or a reduc- tion in monopoly power would be immaterial.) Given the unaccep- tability of the Fogel-Fishlow assumptions and the limited data available on cost functions, this latter measure would seem to be a more logical place to begin future efforts to quantify the impact of a given innovation on economic growth.
What then remains? As noted at the outset, the courage of both Fogel and Fishlow would seem above dispute. Each has produced a book that will undoubtedly remain a landmark in the application of economic theory and statistical techniques to the problems of
7t " . . the key to measuring the direct benefits of railroads lies in the identity of the reduction in financial cost with the reduction in real inputs required per unit of transport output." (Fishlow, American Railroads, p. 23).

Railroads and Growth 123
economic history. In both works can be found a wealth of informa- tion concerning railroads and the multitude of strands that run between this single innovation and the fabric of American develop- ment. Their central question, however-the net benefit to the economy from the existence of the railroad in 1859 or 1890-re- mains essentially as they found it: an unsolved mystery.
PETER D. MCCLELLAND, Harvard University