Embed Size (px)
Citation preview

Economic Growth
The Production FunctionProduction PossibilitiesGrowth PoliciesU.S. Economic Growth

FIGURE 2: Actual and Potential GDP in the United States
Copyright © 2003 South-Western/Thomson Learning. All rights reserved.
1957 –1958Recession
1960 –1961Recession
1960sBoom
1974 –1975Recession
1982 –1983Recession
Actual GDP
Potential GDP
1955 1959 1963 1967 1971 1975 1979 1983 1987 1991 1995 1999 2004
10,000
2,500
3,000
3,500
4,000
4,500
5,000
5,500
6,000
6,500
7,000
8,000
9,000
Year
7,500
8,500
9,500
11,000
10,500
2,000
Billion
s o
f 2
00
0 D
ollars
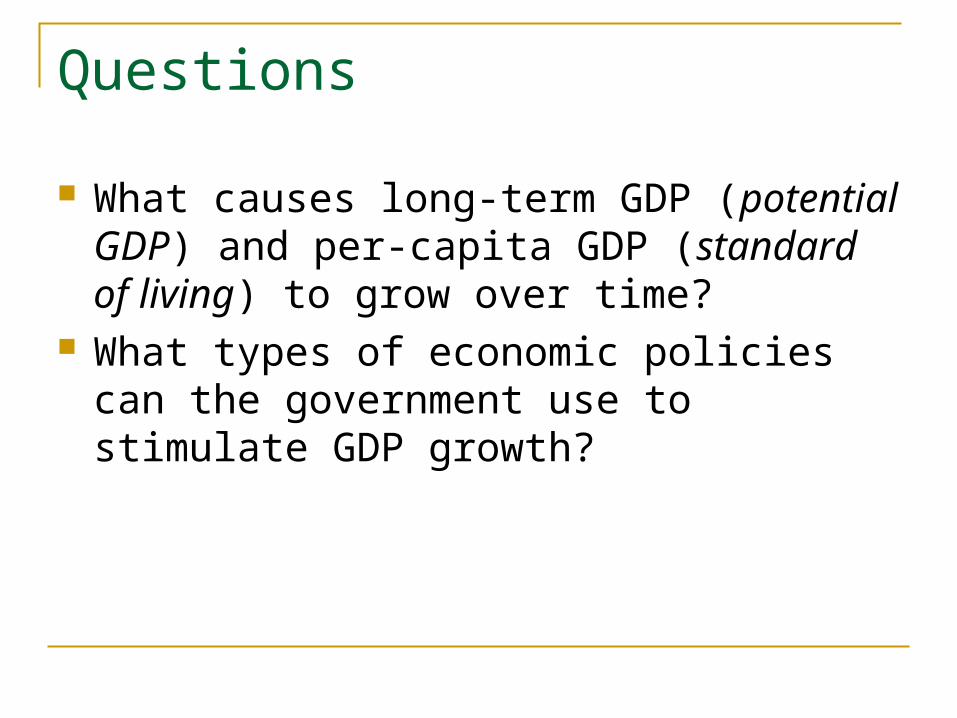
Questions
What causes long-term GDP (potential GDP) and per-capita GDP (standard of living) to grow over time?
What types of economic policies can the government use to stimulate GDP growth?

Growth and Production Function The key to growth in potential GDP is growth
in labor/worker productivity:
Yp = L* x (Y/L*)
= (Hours of work) x (Labor productivity) What drives labor productivity growth?

Three Pillars of Productivity Growth:
(i) Capital (K)
(ii) Technology (TFP)
(iii) Human capital (HK)
- One measure is educational attainment.
Productivity Growth and shifts in the production function.

Growth Accounting in US
1948-73 73-95 94-02
Labor Productivity2.8% 1.4% 2.8%
Capital 0.9% 1.0% 1.7%
Technology 1.9% 0.4% 1.1%

TABLE 4: Average Years of Schooling for Selected Countries

Growth and Production Possibilities Goods can be classified into two types:
(i) Consumption goods – to be consumed (not used to make goods).
(ii) Capital goods – to be used in the manufacturing of other goods (may include human capital)
GDP must be divided between consumption and capital goods.

GDP and Society’s Choices Today
Cap
ital
Goo
ds c
PPF0
b
a
Consumption Goods

GDP and Society’s Choices: Tomorrow (if No Capital Depreciation): Choice a
Cap
ital
Goo
ds c
Consumption Goods
b
a
PPF0 = PPFa

GDP and Society’s Choices Tomorrow: Choice b
Cap
ital
Goo
ds c
Consumption Goods
b
a
PPFa
PPFb

GDP and Society’s Choices Tomorrow: Choice c
Cap
ital
Goo
ds c
Consumption Goods
b
a
PPFa
PPFcPPFb

For a given level of technology investment in physical or human capital is necessary for economic growth.
Increases in TFP can increase economic growth for any given capital-consumption combination.
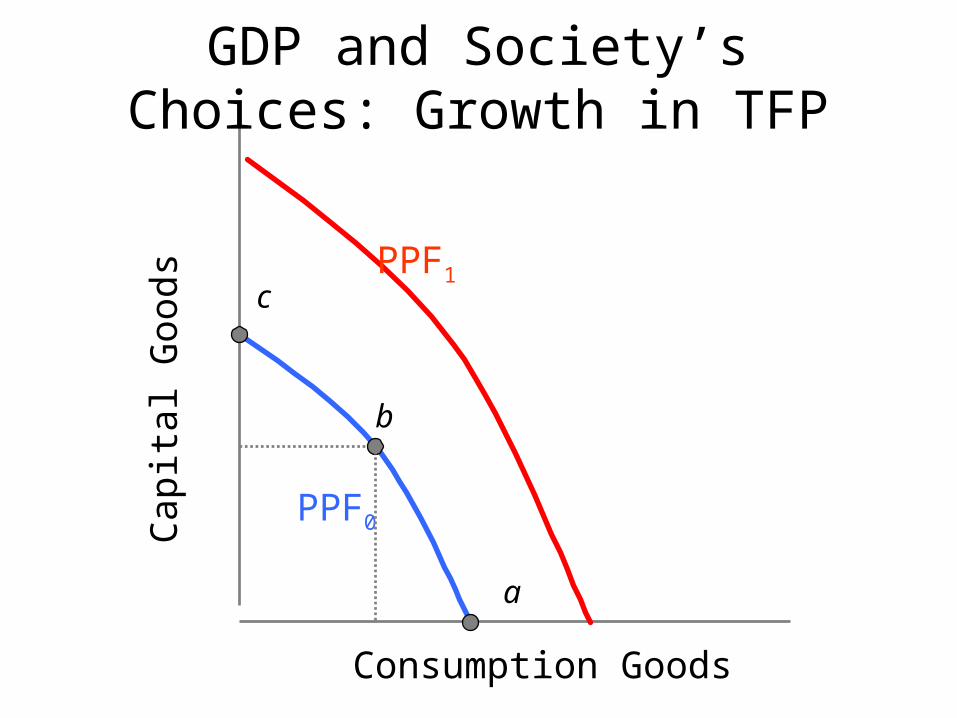
GDP and Society’s Choices: Growth in TFP
Cap
ital
Goo
ds c
PPF0
b
a
Consumption Goods
PPF1

International Comparisons
What explains international differences in standard of living? How have these differences changed over time?
Poorer countries low per-capita GDP
Richer countries high per-capita GDP

Productivity and Growth in Selected Countries
GDP/Hour
1998
Country (% of US) Growth
US 100 1.5
France 98 2.5
UK 79 2.2
Germany 77 2.4

The convergence hypothesis: Productivity growth of poorer countries tend to be higher than richer countries. Per-capita GDP among countries tend to converge.
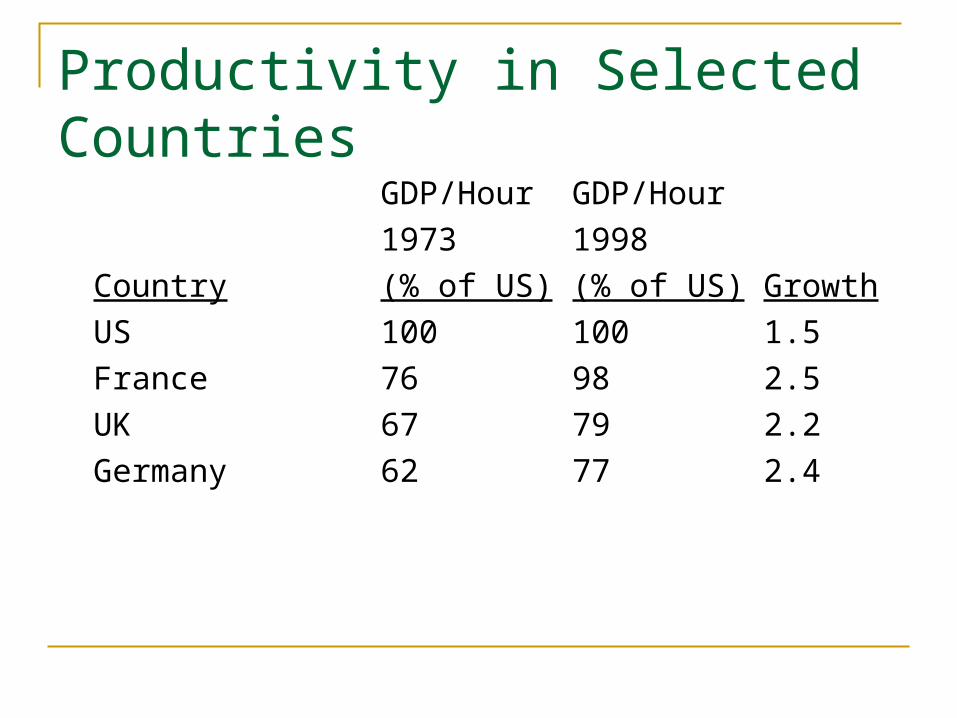
Productivity in Selected Countries
GDP/Hour GDP/Hour
1973 1998
Country (% of US) (% of US) Growth
US 100 100 1.5
France 76 98 2.5
UK 67 79 2.2
Germany 62 77 2.4
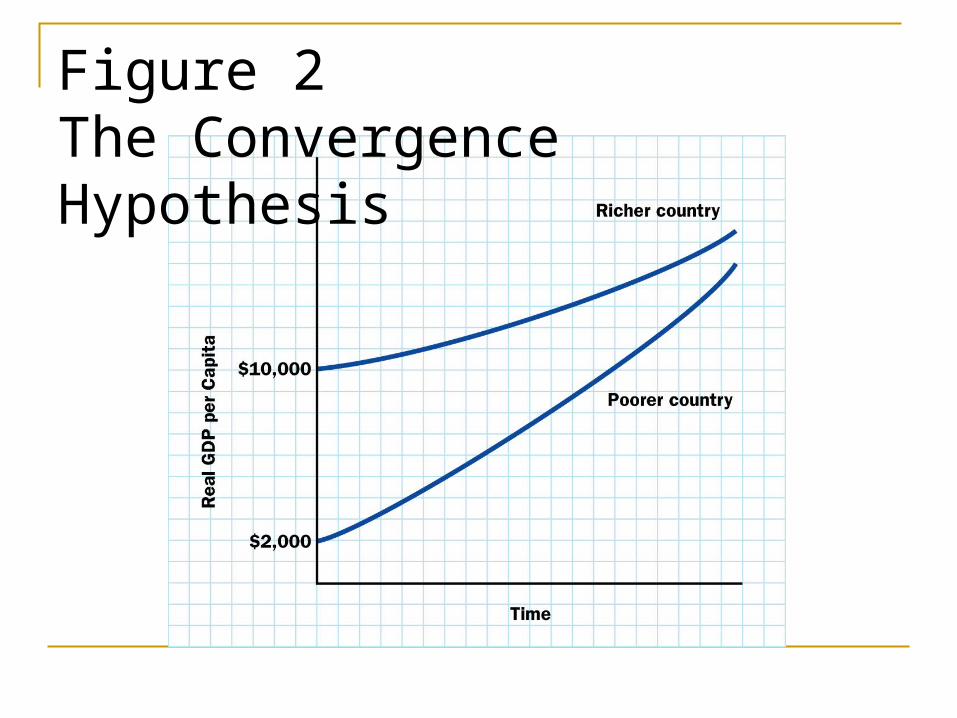
Figure 2The Convergence Hypothesis
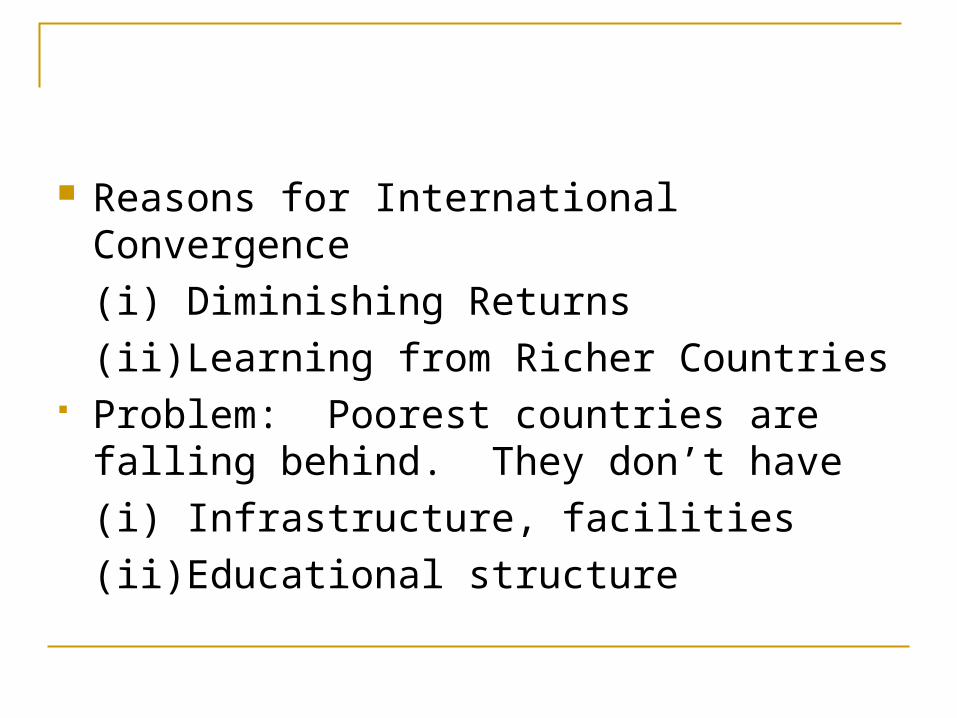
Reasons for International Convergence
(i) Diminishing Returns
(ii) Learning from Richer Countries Problem: Poorest countries are falling
behind. They don’t have
(i) Infrastructure, facilities
(ii) Educational structure

Productivity in Selected Countries
GDP/Hour GDP/Hour
1973 1998
Country (% of US) (% of US) Growth
US 100 100 1.5
France 76 98 2.5
UK 67 79 2.2
Germany 62 77 2.4
Argentina 45 39 0.9
Mexico 38 29 0.5
Peru 26 15 -0.7

Growth Policies
Capital Formation Policies:
* Lower Interest Rates
* Tax Provisions (capital gains/corporate)
* Political Stability/Property Rights
* Direct Government Investment Education and Training Helping Developing Countries
(foreign direct investment, World Bank Aid)


FIGURE 5: Average Productivity Growth Rates in the U.S.
Copyright © 2006 South-Western/Thomson Learning. All rights reserved.
1948–1973 1973–1995 1995–2004
Per
cent
per
Yea
r
2.8
1.4
3.0

Historical Record of U.S. Productivity Post WWII: 1948-73
* Confidence and business optimism high
* Low Interest Rates
* High government spending on infrastructure
Productivity Slowdown: 1973-1995
* High energy prices
* Slow pace of technical progress?
1995-present
* Lower energy prices
* Peace Dividend
* Computing and Information Technology