Embed Size (px)
Citation preview
Economic freedom and cross-border venture capital performance
Lanfang Wang a,⁎, Susheng Wang b
a Institute of Accounting and Finance, Shanghai University of Finance and Economics,Chinab Hong Kong University of Science and Technology, Hong Kong
a r t i c l e i n f o a b s t r a c t
Article history:Received 15 September 2010Received in revised form 16 October 2011Accepted 21 October 2011Available online 30 October 2011
We investigate the determinants of cross-border venture capital (VC) performance using alarge sample of 10,205 cross-border VC investments by 1906 foreign VC firms (VCs) in 6535domestic portfolio companies. We focus on the impact of a domestic country's economic free-dom on the performance of both VC investments and portfolio companies using a probit modeland the Cox hazard model. After controlling for other related factors of domestic countries,portfolio companies, VCs and the global VC market, as well as year and industry fixed effects,we find that a domestic country's economic freedom is crucial to cross-border VC performance.In particular, in a more economically free country, as measured by the raw values of, quartilesof or the ranking in the index of economic freedom (IEF), a foreign VC-backed portfolio com-pany is more likely to pull off a successful exit through an IPO (initial public offering) or anM&A (merger and acquisition), and a foreign VC firm is likely to spend a shorter investmentduration in the portfolio company. We also identify interesting evidence on the impact ofmany other level factors of domestic countries, portfolio companies, VCs and the global VCmarket on cross-border VC performance.
© 2011 Elsevier B.V. All rights reserved.
JEL classification:G15G24G34
Keywords:Cross-border VCEconomic freedomLegalityEntrepreneurial activity
1. Introduction
Venture capital (VC) is widely regarded as an active driving force in fostering entrepreneurship, financing startups, creatingpublic companies and encouraging innovations in the U.S. over the past several decades (Barry et al., 1990; Kaplan andStrömberg, 2003; Kortum and Lerner, 2000; Lerner, 1994; Sahlman, 1990). It is widely believed that VC is instrumental in bringinginnovations to markets at a rapid pace, thereby enhancing economic growth. VC has been increasingly internationalized, asmarked by an increasing number of cross-border entries of VCs starting from the mid-1990s. Cross-border VC is crucial togrowth-oriented but high-risk new ventures, especially in countries where the domestic supply of private equity is limited.
Our focus is to examine the impact of a domestic country's economic freedom on cross-border VC performance. The idea thateconomic freedom is essential for economic efficiency has been a cornerstone in economic theory since Smith (1776), who arguesfor the role of “the invisible hand” in well-functioning markets. In theory, a free economy is defined as the so-called “Arrow–
Debreu world,” where economic efficiency is guaranteed in general equilibrium (Arrow and Debreu, 1954; Hart, 1980;McKenzie, 1959). In empirical studies, economic freedom has been widely observed to be important to economic growth(Gwartney et al., 1999; Haan and Sturm, 2000; Heckelman, 2000; Wu and Davis, 1999), income equality (Berggren, 1999;Scully, 2002) and employment (Feldmann, 2007, 2008).
For VC investments, the role of economic freedom lies in two aspects. On the one hand, free markets are widely believed toprovide more opportunities for early stage and mostly not-yet-profitable companies, which is essential to VC investments(BjØrnskov and Foss, 2008; Kreft and Sobel, 2005; Nyström, 2008; Sobel et al., 2007; Wennekers et al., 2002). The more
Journal of Empirical Finance 19 (2012) 26–50
⁎ Corresponding author.E-mail addresses: [email protected] (L. Wang), [email protected] (S. Wang).
0927-5398/$ – see front matter © 2011 Elsevier B.V. All rights reserved.doi:10.1016/j.jempfin.2011.10.002
Contents lists available at SciVerse ScienceDirect
Journal of Empirical Finance
j ourna l homepage: www.e lsev ie r .com/ locate / jempf in
constraints there are on the allocation of resources in production and consumption, the fewer growth opportunities and chancesof success for VCs. On the other hand, the government is more likely to act as a “helping hand” instead of a “grabbing hand” in freemarkets, which is also essential for the survival and success of VCs. In an economically free market, the burden of bureaucracy andcorruption would be smaller and the government would try to provide a steady and reliable monetary environment, a free andopen investment environment and a transparent and open financial system. Contract enforcement and investor protection, espe-cially regarding private properties, also tend to be better in free markets. For cross-border VC investments, economic freedom isparticularly important since investment risk, transaction costs, asymmetric information and agency problems are much more se-vere, which makes these types of investments more sensitive to the domestic country's economic environment (Cumming et al.,2006; Gompers et al., 2003; Jeng and Wells, 2000).
Using a large sample of 10,205 cross-border VC investments from 1906 foreign VCs in 6535 domestic portfolio companiescovering 35 countries, we investigate the impact of a domestic country's economic freedom on cross-border VC performance.We provide analysis of both VC investments and portfolio companies using both a probit model and the Cox hazard model.After controlling for other related factors of domestic countries, portfolio companies, VCs and the global VC market, as well asindustry and year fixed effects, we find that a domestic country's economic freedom is crucial to the performance of cross-border VC. In particular, in an economically free country, as measured by either the raw values of, quartiles of or the ranking ineconomic freedom over the investment period, a foreign VC-backed portfolio company is more likely to pull off a successfulexit through an IPO (initial public offering) or an M&A (merger and acquisition), and a foreign VC firm is likely to spend a shorterinvestment duration in a portfolio company. Specifically, a one standard deviation increase in our measure of economic freedom—
Index of Economic Freedom, Economic Freedom Quartile or Ranking in Economic Freedom—at the mean level increases the likelihoodof a successful exit by 2.02%, 2.76% or 3.02%, and the hazard of a successful exit by 5.35%, 12.59% or 13.69%, respectively.
Our main findings are robust to many tests, including tests on a change in economic freedom, tests on exit choices (IPO versusM&A), tests on decomposed effects of economic freedom, tests considering domestic country fixed effects and tests using subsam-ples and alternative measures.
We further find several interesting results from other related factors of domestic countries, portfolio companies, VCs and theglobal VC market. For example, we find legal quality to be positively related to the likelihood of a successful exit through an IPO oran M&A, which is consistent with the empirical work by Cumming et al. (2006). GDP per capital is found to be negatively relatedto cross-border VC performance, which is somewhat consistent with the well-known convergence hypothesis in the exogenousgrowth literature (Barro, 1991, 1996). Also, a domestic country's entrepreneurial activity as measured by the number of VCdeals and the number of patents granted over the investment period is positively associated with the likelihood of a successfulexit through an IPO or an M&A. Further, our results provide evidence confirming the positive impact of portfolio company qualityand local VCs' participation and the negative impact of early stage investments and VCs' portfolio size on cross-border VC perfor-mance, which has been examined in previous studies (Cumming, 2006; Cumming and Dai, 2010, 2011; Dai et al., 2010; Mäkeläand Maula, 2008; Tykvová and Schertler, 2011). In particular, our finding that market conditions have a strong impact on theexit choice between an IPO and an M&A sheds light on the exit timing of cross-border VCs.
There are few studies on cross-border VC performance that are closely related to ours.1 Wang and Wang (2011) investigatethe determinants of cross-border VC performance in China using a small sample of 495 VC investments in 243 portfolio compa-nies by 84 foreign VCs. They document that foreign VCs' human capital has little importance to the likelihood of successful exits.In contrast, the domestic entrepreneurs' experience is crucial to VC performance. Our study differs significantly from that of Wangand Wang (2011) in that we provide an international study on cross-border VC performance covering 35 domestic countries,while Wang andWang (2011) focus on one domestic country, China. Also, we investigate the impact of a domestic country's eco-nomic freedom on cross-border VC performance after controlling for many other level factors of domestic countries, portfoliocompanies, VCs and the global VC market, while Wang and Wang (2011) focus on foreign VCs' human capital and domesticentrepreneurs' experience.
Dai et al. (2010) partially address cross-border VC performance using a sample of 4254 rounds of VC financing by 468 VCs in sixAsian countries. They suggest a positive role of local VCs; that is, cooperation with local VCs helps mitigate information asymmetryand contributes to the likelihood of a portfolio company's successful exit through an IPO. Different fromDai et al. (2010),we emphasizethe role of a country-level factor, namely the domestic country's economic freedom, in cross-border VC performancewhile controllingfor many other factors including local VCs' participation which is also examined in their study. Our results on the impact of local VCs'participation are quite consistent with those of Dai et al. (2010), and provide supporting evidence to their finding.
Another closely related study is that of Watson and George (2010), who examine the influence of several country-level factors,such as the size of the economy, business freedom, trade protection, burden of taxation, government size, price stability, open-ness, corruption and cultural distance, on the rate of return in 72 foreign acquisitions from 144 transactions in 24 different coun-tries. Even though the research question addressed byWatson and George (2010) is similar to ours, there are substantial differencesbetween the two studies. First, they use a small sample consisting of only foreign acquisitions of private equity, which cannot repre-sent the bulk of cross-border VC investments. We use a large sample of 10,205 cross-border VC investments by 1906 foreign VCs in
1 For a comparison of VC investment characteristics in different countries, see Black and Gilson (1998), Lockett et al. (2002), Cumming and MacIntosh (2003),Bruton et al. (2004), Lerner and Schoar (2005), Mayer et al. (2005), Ahlstrom and Bruton (2006), Cumming et al. (2006), Schwienbacher (2008), Cumming et al.(2010), etc. For other aspects of cross-border VC investments (such as economic factors in attracting funding from foreign VCs and the role of local investors), seeMäkelä and Maula (2008), Balcarcel et al. (2009), Schertler and Tykvová (2011), Chemmanur et al. (2011), Tykvová and Schertler (2011), etc. For determinants ofdomestic VC performance, see Hochberg et al. (2007), Zarutskie (2007), Bottazzi et al. (2008), Gompers et al. (2008), Nahata (2008), etc.
27L. Wang, S. Wang / Journal of Empirical Finance 19 (2012) 26–50
6535 domestic portfolio companies during 1995–2005 covering 35 domestic countries. Second, their model is quite simple. Manyrelated factors of countries, investors, investees and the global market that have been examined in existing studies are not con-sidered. Also, they put all nine country-level factors into a regression at the same time, which may result in multicollinearity.Lastly, most of the country-level factors they estimate are captured by the economic freedom variable in our paper. We havedone a robustness study on the decomposed effects of economic freedom (Section 5.3) and our findings confirm some oftheir results.
Our study is also related to studies on economic freedom. Economic freedom is widely investigated in macroeconomicanalyses, especially those on long-term economic development across countries. The general equilibrium theory shows thateconomic efficiency can be achieved in the Arrow–Debreu world, where the market is complete, perfect and competitive.Economic freedommeasures the degree to which an economy is consistent with these underlying assumptions. Empirical studieshave found that economic freedom indeed contributes significantly to economic growth. In a study of 98 countries for the pe-riod 1960–1985, Barro (1991) suggests that economic growth is inversely related to market distortions. Barro (1996) furtherfinds that economic freedom has a favorable impact on economic growth. Using an augmented Solow model with cross-sectional data, Vanssay and Spindler (1994) also find that economic freedom has a significant and substantial effect on econom-ic growth.
Over the last decade or so, a number of indicators on economic freedom have become available and they have subsequentlybeen applied to empirical growth models. Wu and Davis (1999) identify the role of economic freedom in enhancing economicgrowth after controlling for political freedom. In contrast, Gwartney et al. (1999) and Haan and Sturm (2000) find that the level ofeconomic freedom does not contribute significantly to economic growth; instead, a positive change in economic freedom does.Also, Heckelman (2000) suggests that the average level of freedom in a nation, aswell asmany of the specific underlying componentsof freedom, precedes economic growth, after addressing the possibility of reverse causality with a series of Granger-causality tests.
The existing studies also explore the role of economic freedom in income equality, employment and welfare. Berggren (1999)finds that during the period 1975–1985, the higher the degree of economic freedom, the higher the degree of income equality in acountry. Scully (2002) uses a structural model and a reduced-form model to show that economic freedom is beneficial to botheconomic growth and income equality. Feldmann (2007, 2008) confirms a positive role of economic freedom in employment.Esposto and Zaleski (1999) conclude that the quality of life is positively associated with economic freedom.
However, the empirical literature on economic freedom has focused on its long-term macroeconomic consequences. Thispaper investigates the impact of economic freedom on cross-border VC performance at the VC investment level and the portfoliocompany level. The theoretical link between economic freedom and cross-border VC performance, as implied by the general equi-librium theory, is that an economically free economy ensures free markets for early stage companies and in turn improves theeconomic efficiency of resource allocation. More specifically, a more economically free country can provide better growth oppor-tunities, greater chances of success, and more protection with less grabbing from the government for cross-border VCs. Indeed,we find a positive association between a domestic country's economic freedom and cross-border VC performance after controllingfor other related factors of domestic countries, portfolio companies, VCs and the global VC market.
We contribute to the literature in several ways. First, we investigate the role of a domestic country's economic freedom oncross-border VC performance. This is our main contribution. The literature on economic freedom has focused on long-term effects,typically economic growth, at the macro level. We provide an analysis of economic freedom at the micro level, specifically onindividual cross-border VC investments and domestic portfolio companies. Such an analysis has policy implications for fosteringcross-border VC investments. Second, our study deepens the understanding of cross-border VC investments around the world andenriches the literature on the internationalization of VC. Studies on cross-border VC investments are rare. With rapid globalizationin recent years, cross-border VC investments have become a significant phenomenon. Such investments can have a huge impacton the countries involved in innovations, technology transfers and entrepreneurship. Third, we also document the effects of othercountry-level factors on cross-border VC performance, especially such factors as economic development, stock market capitaliza-tion, stock market performance, legal quality and entrepreneurial activity. Our results also address the influence of many otherrelated factors of portfolio companies, VCs and the global VC market.
The remainder of this paper is organized as follows. Section 2 describes the sample and the research methodology. Sec-tions 3 and 4 provide analyses of cross-border VC performance at the VC investment level and at the portfolio companylevel, respectively. Section 5 conducts extensive robustness tests. Section 6 concludes the paper with a summary of ourmain results.
2. Sample and methodology
2.1. Sample
For cross-border VC investments, we rely primarily on the SDC VentureXpert database from Thomson Financial.2 We focus onthe cross-border VC investments made by foreign VCs in domestic portfolio companies. Here, the VCs and portfolio companies are
2 An advantage of using the SDC VentureXpert database is its comprehensive coverage. This database claims to cover over 2300 VC funds worldwide. Accordingto Kaplan et al. (2002), the SDC VentureXpert database captures around 85% of the financing rounds made by American VCs. Du and Vertinsky (2008) point outthat this database also includes most of the venture-related VC deals in Europe and most of the big VC deals in Asia. Aizenman and Kendall (2008) consider thisdatabase to be a comprehensive data source for VC deals worldwide, with over 30 years of historical data.
28 L. Wang, S. Wang / Journal of Empirical Finance 19 (2012) 26–50

located in different countries.3 The primary sample comprises all cross-border VC investments made during 1995–2005 inportfolio companies that received their initial VC funding in the same period. We have employed the following sample selectionprocedure to obtain the final sample of VC investments: (1) we exclude those investments made by angels and buyout funds andconcentrate on the investments made by VC funds; (2) we exclude those investments made in the buyout/acquisition stage or anunknown stage of portfolio companies; (3) we focus on the first investment made by each VC firm in a portfolio company,because the performance in later rounds depends heavily on investments in earlier rounds; and (4) we exclude those investmentsfor which we do not have matching data for our regression variables. We ended up with 10,205 cross-border VC investmentobservations involving 1906 foreign VCs in 6535 domestic portfolio companies. The sample covers 35 domestic countries—Argentina, Australia, Austria, Belgium, Brazil, Canada, Chile, China,4 Denmark, Finland, France, Germany, Hong Kong, India,Indonesia, Ireland, Israel, Italy, Japan, Malaysia, Mexico, the Netherlands, New Zealand, Norway, Philippines, Portugal, Singapore,South Africa, South Korea, Spain, Sweden, Switzerland, Thailand, the U.K. and the U.S.
Table 1 presents the distribution of 10,205 VC investments by funding year and development stage of a portfolio company, thedistribution of 6535 portfolio companies by country and industry, and the distribution of 1906 VCs by global region and organi-zational type. The number of observations and the corresponding percentages (in parentheses) are given. As shown, the internetbubble in the late 1990s has affected the timing of cross-border VC investments. The cross-border VC investments peaked in 2000and then decreased during 2001–2003. Around 38.1% of VC investments occurred at the early or seed stage of development of aportfolio company. The U.S. is the most active in VC imports, constituting roughly 40.9% of our sample. Those countries followingthe U.S., with each constituting just over 3% of our sample, are the UK, Germany, France, Canada, China, and Israel in that order.Our sample spans the following six industries based on the Venture Economics Industry Classification: biotechnology, communi-cation and media, computer-related, medical/health/life science, semiconductors/other electronics, and non-high technology.Similar to the situation in the U.S., the majority of VC-backed portfolio companies belong to high-tech sectors, such as the com-munications and media sector and the computer-related sector, which constitute about 19.5% and 40.1% of our sample, respec-tively. As indicated in the table, VCs from Asia, Europe and North America constitute respectively 31.4%, 23.4% and 41.1% of thesample. VCs from other regions constitute only 4.1% of the sample. Following the literature on VC strategies (Bottazzi et al.,2008; Hellmann et al., 2008; Nahata, 2008), we identify four VC firm types: independent VCs, and VCs affiliated with financialinstitutions, corporations, or governments. For simplicity, we refer to them respectively as traditional VCs, institutional VCs,corporate VCs and government VCs. As presented in the table, around 58.5% of VCs are traditional VCs, whereas institutionalVCs, corporate VCs and government VCs constitute respectively 18.3%, 17.6% and 4.7% of the sample.
2.2. Methodology
Wemeasure VC performance using the likelihood of a successful exit by the end of 2009, and call this Investment Success. A portfoliocompany is treated as successful if it went public orwas acquired by the end of 2009.We conduct analyses of the likelihood and timing ofsuccessful exits at both theVC investment level and the portfolio company level. Specifically,we conduct a probit analysiswith InvestmentSuccess as the dependent variable and a survival analysis using a Cox hazard model with Investment Duration as the dependent variable.The Cox hazardmodel allows for right-censored data and time-varying variables, and it is a semi-parametric model in which the hazardfunction is not dependent on a specific distribution of the survival time. A positive (or negative) coefficient indicates that the variable in-creases (or decreases) the hazard of a successful exit and shortens (or lengthens) the expected duration.We take three alternative mea-sures of a domestic country's economic freedom during the investment period—Index of Economic Freedom, Economic Freedom Quartileand Ranking in Economic Freedom—as our primary explanatory variables.
Following the literature and taking into account the characteristics of cross-border VC markets, we further control for otherrelated factors of domestic countries, portfolio companies, VCs and the global VC market, as well as industry and year fixed effects.Specifically, the domestic country-related factors are GDP per Capital, Market Capitalization, Market Return, Legality, Foreign Coun-try Legality, Same Legal Indicator, VC Deals and Patents. The portfolio company-related factors are Total VC Funding, ValuationDisclosure Indicator, Early Investment Indicator and Distance. The VC firm-related factors are Local VC Ratio, VC Experience, VCSize, VC Size Squared, VC Portfolio Size, Institutional VC Indicator, Corporate VC Indicator, Asia VC Indicator and Europe VC Indicator.The global VC market-related factors are VC Industry Competition, IPO Market Conditions and M&A Market Conditions.
The Appendix provides a detailed discussion of our methods and the definitions of all regression variables. Appendix Tables 1–3describe the components of economic freedom, the measures of variables and the correlation matrix, respectively.
3 Since the SDC VentureXpert database only provides updated information on the location of portfolio companies and VCs, we use such information to identifycross-border VC investment observations, an approach that is consistent with existing studies on cross-border VC investments using public data sources(Balcarcel et al., 2009; Dai et al., 2010; Schertler and Tykvová, 2011; Wang and Wang, 2011; Watson and George, 2010). We do not have historical informationfor each portfolio company at the time of VC funding and the time of exit. Therefore, we cannot define cross-border VC investments as investments by foreign VCsin domestic portfolio companies at the time of investment. There might be a bias here since Cumming et al. (2009) find that relocation to the U.S. implies muchgreater returns to Asia-Pacific VCs than investing in companies already based in the U.S. at the time of VC investment using a hand-collected sample of 468 port-folio companies. As suggested by Cumming et al. (2009) that most relocations (all but three in their sample) were moves to the U.S., we have tried to rule out theinfluence of relocation on our findings by excluding the U.S. portfolio companies in a robustness test.
4 La Porta et al. (1997, 1998) do not provide legality values for China. Considering China's importance in cross-border VC investments, and in line withCumming et al. (2006), we employ the average German legal origin values for China. These values are somewhat consistent with the legal index estimates forChina by Allen et al. (2005) and Durnev and Kim (2005). In a robustness test, after excluding China from our sample, all our results remain unchanged.
29L. Wang, S. Wang / Journal of Empirical Finance 19 (2012) 26–50
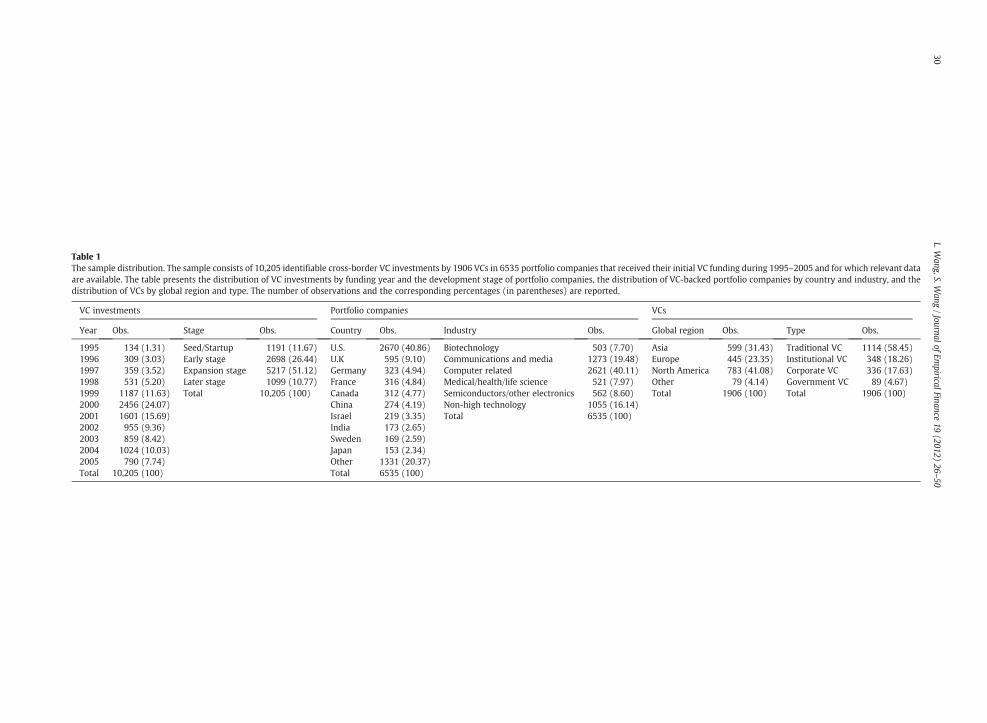
Table 1The sample distribution. The sample consists of 10,205 identifiable cross-border VC investments by 1906 VCs in 6535 portfolio companies that received their initial VC funding during 1995–2005 and for which relevant dataare available. The table presents the distribution of VC investments by funding year and the development stage of portfolio companies, the distribution of VC-backed portfolio companies by country and industry, and thedistribution of VCs by global region and type. The number of observations and the corresponding percentages (in parentheses) are reported.
VC investments Portfolio companies VCs
Year Obs. Stage Obs. Country Obs. Industry Obs. Global region Obs. Type Obs.
1995 134 (1.31) Seed/Startup 1191 (11.67) U.S. 2670 (40.86) Biotechnology 503 (7.70) Asia 599 (31.43) Traditional VC 1114 (58.45)1996 309 (3.03) Early stage 2698 (26.44) U.K 595 (9.10) Communications and media 1273 (19.48) Europe 445 (23.35) Institutional VC 348 (18.26)1997 359 (3.52) Expansion stage 5217 (51.12) Germany 323 (4.94) Computer related 2621 (40.11) North America 783 (41.08) Corporate VC 336 (17.63)1998 531 (5.20) Later stage 1099 (10.77) France 316 (4.84) Medical/health/life science 521 (7.97) Other 79 (4.14) Government VC 89 (4.67)1999 1187 (11.63) Total 10,205 (100) Canada 312 (4.77) Semiconductors/other electronics 562 (8.60) Total 1906 (100) Total 1906 (100)2000 2456 (24.07) China 274 (4.19) Non-high technology 1055 (16.14)2001 1601 (15.69) Israel 219 (3.35) Total 6535 (100)2002 955 (9.36) India 173 (2.65)2003 859 (8.42) Sweden 169 (2.59)2004 1024 (10.03) Japan 153 (2.34)2005 790 (7.74) Other 1331 (20.37)Total 10,205 (100) Total 6535 (100)
30L.W
ang,S.Wang
/JournalofEm
piricalFinance19
(2012)26
–50

We avoid an investigation using aggregate data at the country level, which is often subject to the simultaneous critique. It ismuch more sensible to examine data at the VC investment level and the portfolio company level where the environment is con-stant and much finer controls are available. For the analysis of VC investments, we focus only on each VC firm at the time of itsfirst investment in a portfolio company, with a sample size of 10,205; and likewise, for the analysis of portfolio companies, wefocus only on each portfolio company at the time of its receiving the initial VC funding, with a sample size of 6535. The reasonfor this treatment is that there is typically a substantial time gap between a VC firm's first investment and its exit, as well as be-tween a portfolio company's first VC funding and its exit. This methodology can effectively address concerns regarding reversecausality where better cross-border VC performance can conversely lead to more economic freedom in the domestic country.Similar approaches have been adopted by Hochberg et al. (2007), Nahata (2008), etc.
In the Cox hazard analysis, we further allow for time variation of the variables Index of Economic Freedom, Economic FreedomQuartile, Ranking in Economic Freedom, GDP per Capita, Market Capitalization, Market Return, VC Deals, Patents, IPO Market Condi-tions and M&A Market Conditions to alleviate the problem of measuring unsuccessful exits. The hazard framework has theadded advantage of being able to capture the market conditions at the time of a domestic country's macroeconomic developmentand exit to determine their impact on the likelihood of a successful exit, for which a simple probit model cannot do.
In summary, our basic regression models are:
The probit model:
Investment Success ¼ α0 þ α1 Economic Freedomþ α2 Country�related f actorsþ α3 Portf olio company�related f actorsþ α4VC f irm�related f actorsþ α5Global VC market�related f actorsþ Industry dummiesþ Year dummies: ð1Þ
The Cox hazard model:
Investment Duration ¼ β1 Economic Freedomþ β2 Country�related f actorsþ β3 Portf olio company�related f actorsþ β4 VC f irm�related f actorsþ β5Global VC market�related f actorsþ Industry dummiesþ Year dummies: ð2Þ
Here, “Economic Freedom” is either Index of Economic Freedom, Economic Freedom Quartile or Ranking in Economic Freedom.
2.3. Summary statistics and univariate analysis
Table 2 presents the summary statistics at the VC investment level.5 The quartiles, means, standard deviations and the numberof observations are presented. We have very similar data distributions at the portfolio company level (not reported).
Only 15.8% of the cross-border VC investments exit successfully through IPOs or acquisitions, a level that is much lower thanthe 33.5% reported by Nahata (2008) and the 41.8% reported by Cochrane (2005) for U.S. domestic VC investments. The averageInvestment Duration is 2826 days with a median of 3072 days.6 The means (medians) of Index of Economic Freedom, EconomicFreedom Quartile and Ranking in Economic Freedom are respectively 74.07 (78.57), 2.47 (2) and 0.65 (0.79).
The means (medians) of GDP per Capita, Market Capitalization, Market Return, Legality, Foreign Country Legality, VC Deals andPatents are respectively 33,593 (36,909) US dollars, 116.57% (127.2%), 1.9% (1.8%), 15.42 (16.45), 15.68 (16.08), 8.43 (9.95) permillion people and 0.42 (0.48) per thousand people. Around 48.2% of domestic countries' legal systems originate from thesame tradition as that of the corresponding foreign countries.
The total VC funding across all financing rounds in a portfolio company is 37.16 million US dollars on averagewith amedian of about17.50 million US dollars. About 29.1% of portfolio companies voluntarily disclose their market valuation after VCs' first investment inthem, which is slightly lower than the 34.4% reported by Cumming and Dai (2011) for the U.S. VC investments made during1991–2006. Further, 38.1% of first investments by a VC firm in a portfolio company occur at the seed or early stage of development,which is much lower than the 63.7% reported by Nahata (2008) and the 62% reported by Gompers et al. (2010) for the U.S. VC industry.The average geographical distance between a portfolio company and a VC firm is 7205 km with a median of 7837 km.
On average, 34.4% of VCs participating in the syndicate of a portfolio company are domestic VCs. The average VC age is about13.58 years old at the time of its first investment in a portfolio company with a median of about 8 years old. The aggregate amountof funds raised by a VC firm over the ten years prior to its first investment in a portfolio company is about 919 million US dollarswith a median of only 143 million US dollars. The mean (median) number of companies in a VC firm's portfolio is 257.43 (44). Thereported portfolio size is much larger than that suggested by Cumming (2006) since our unit of analysis is VC firm instead of VCfund. Around 15.4% and 16.8% of VCs are respectively institutional and corporate VCs; these percentages are slightly larger than
5 We report the original values for all the variables in Table 2, even though we have taken logarithms of some variables in our regressions (as indicated by “**”in Appendix Table 2).
6 The average Investment Duration of VC investments is only 1239 days for successful exits and is 2826 days for all VC investments (taking into account the factthat we do not know the exact time of unsuccessful exits and that Investment Duration of unsuccessful exits is right-censored at the end of 2009).
31L. Wang, S. Wang / Journal of Empirical Finance 19 (2012) 26–50
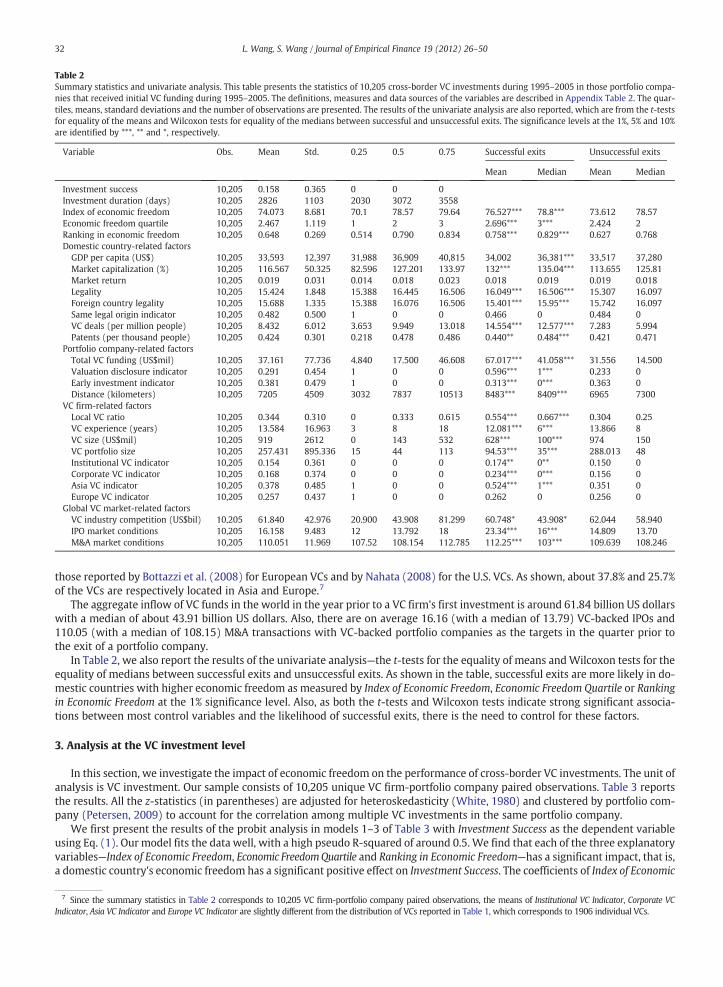
those reported by Bottazzi et al. (2008) for European VCs and by Nahata (2008) for the U.S. VCs. As shown, about 37.8% and 25.7%of the VCs are respectively located in Asia and Europe.7
The aggregate inflow of VC funds in the world in the year prior to a VC firm's first investment is around 61.84 billion US dollarswith a median of about 43.91 billion US dollars. Also, there are on average 16.16 (with a median of 13.79) VC-backed IPOs and110.05 (with a median of 108.15) M&A transactions with VC-backed portfolio companies as the targets in the quarter prior tothe exit of a portfolio company.
In Table 2, we also report the results of the univariate analysis—the t-tests for the equality of means andWilcoxon tests for theequality of medians between successful exits and unsuccessful exits. As shown in the table, successful exits are more likely in do-mestic countries with higher economic freedom as measured by Index of Economic Freedom, Economic Freedom Quartile or Rankingin Economic Freedom at the 1% significance level. Also, as both the t-tests and Wilcoxon tests indicate strong significant associa-tions between most control variables and the likelihood of successful exits, there is the need to control for these factors.
3. Analysis at the VC investment level
In this section, we investigate the impact of economic freedom on the performance of cross-border VC investments. The unit ofanalysis is VC investment. Our sample consists of 10,205 unique VC firm-portfolio company paired observations. Table 3 reportsthe results. All the z-statistics (in parentheses) are adjusted for heteroskedasticity (White, 1980) and clustered by portfolio com-pany (Petersen, 2009) to account for the correlation among multiple VC investments in the same portfolio company.
We first present the results of the probit analysis in models 1–3 of Table 3 with Investment Success as the dependent variableusing Eq. (1). Our model fits the data well, with a high pseudo R-squared of around 0.5. We find that each of the three explanatoryvariables—Index of Economic Freedom, Economic FreedomQuartile and Ranking in Economic Freedom—has a significant impact, that is,a domestic country's economic freedom has a significant positive effect on Investment Success. The coefficients of Index of Economic
Table 2Summary statistics and univariate analysis. This table presents the statistics of 10,205 cross-border VC investments during 1995–2005 in those portfolio compa-nies that received initial VC funding during 1995–2005. The definitions, measures and data sources of the variables are described in Appendix Table 2. The quar-tiles, means, standard deviations and the number of observations are presented. The results of the univariate analysis are also reported, which are from the t-testsfor equality of the means and Wilcoxon tests for equality of the medians between successful and unsuccessful exits. The significance levels at the 1%, 5% and 10%are identified by ***, ** and *, respectively.
Variable Obs. Mean Std. 0.25 0.5 0.75 Successful exits Unsuccessful exits
Mean Median Mean Median
Investment success 10,205 0.158 0.365 0 0 0Investment duration (days) 10,205 2826 1103 2030 3072 3558Index of economic freedom 10,205 74.073 8.681 70.1 78.57 79.64 76.527*** 78.8*** 73.612 78.57Economic freedom quartile 10,205 2.467 1.119 1 2 3 2.696*** 3*** 2.424 2Ranking in economic freedom 10,205 0.648 0.269 0.514 0.790 0.834 0.758*** 0.829*** 0.627 0.768Domestic country-related factors
GDP per capita (US$) 10,205 33,593 12,397 31,988 36,909 40,815 34,002 36,381*** 33,517 37,280Market capitalization (%) 10,205 116.567 50.325 82.596 127.201 133.97 132*** 135.04*** 113.655 125.81Market return 10,205 0.019 0.031 0.014 0.018 0.023 0.018 0.019 0.019 0.018Legality 10,205 15.424 1.848 15.388 16.445 16.506 16.049*** 16.506*** 15.307 16.097Foreign country legality 10,205 15.688 1.335 15.388 16.076 16.506 15.401*** 15.95*** 15.742 16.097Same legal origin indicator 10,205 0.482 0.500 1 0 0 0.466 0 0.484 0VC deals (per million people) 10,205 8.432 6.012 3.653 9.949 13.018 14.554*** 12.577*** 7.283 5.994Patents (per thousand people) 10,205 0.424 0.301 0.218 0.478 0.486 0.440** 0.484*** 0.421 0.471
Portfolio company-related factorsTotal VC funding (US$mil) 10,205 37.161 77.736 4.840 17.500 46.608 67.017*** 41.058*** 31.556 14.500Valuation disclosure indicator 10,205 0.291 0.454 1 0 0 0.596*** 1*** 0.233 0Early investment indicator 10,205 0.381 0.479 1 0 0 0.313*** 0*** 0.363 0Distance (kilometers) 10,205 7205 4509 3032 7837 10513 8483*** 8409*** 6965 7300
VC firm-related factorsLocal VC ratio 10,205 0.344 0.310 0 0.333 0.615 0.554*** 0.667*** 0.304 0.25VC experience (years) 10,205 13.584 16.963 3 8 18 12.081*** 6*** 13.866 8VC size (US$mil) 10,205 919 2612 0 143 532 628*** 100*** 974 150VC portfolio size 10,205 257.431 895.336 15 44 113 94.53*** 35*** 288.013 48Institutional VC indicator 10,205 0.154 0.361 0 0 0 0.174** 0** 0.150 0Corporate VC indicator 10,205 0.168 0.374 0 0 0 0.234*** 0*** 0.156 0Asia VC indicator 10,205 0.378 0.485 1 0 0 0.524*** 1*** 0.351 0Europe VC indicator 10,205 0.257 0.437 1 0 0 0.262 0 0.256 0
Global VC market-related factorsVC industry competition (US$bil) 10,205 61.840 42.976 20.900 43.908 81.299 60.748* 43.908* 62.044 58.940IPO market conditions 10,205 16.158 9.483 12 13.792 18 23.34*** 16*** 14.809 13.70M&A market conditions 10,205 110.051 11.969 107.52 108.154 112.785 112.25*** 103*** 109.639 108.246
7 Since the summary statistics in Table 2 corresponds to 10,205 VC firm-portfolio company paired observations, the means of Institutional VC Indicator, Corporate VCIndicator, Asia VC Indicator and Europe VC Indicator are slightly different from the distribution of VCs reported in Table 1, which corresponds to 1906 individual VCs.
32 L. Wang, S. Wang / Journal of Empirical Finance 19 (2012) 26–50
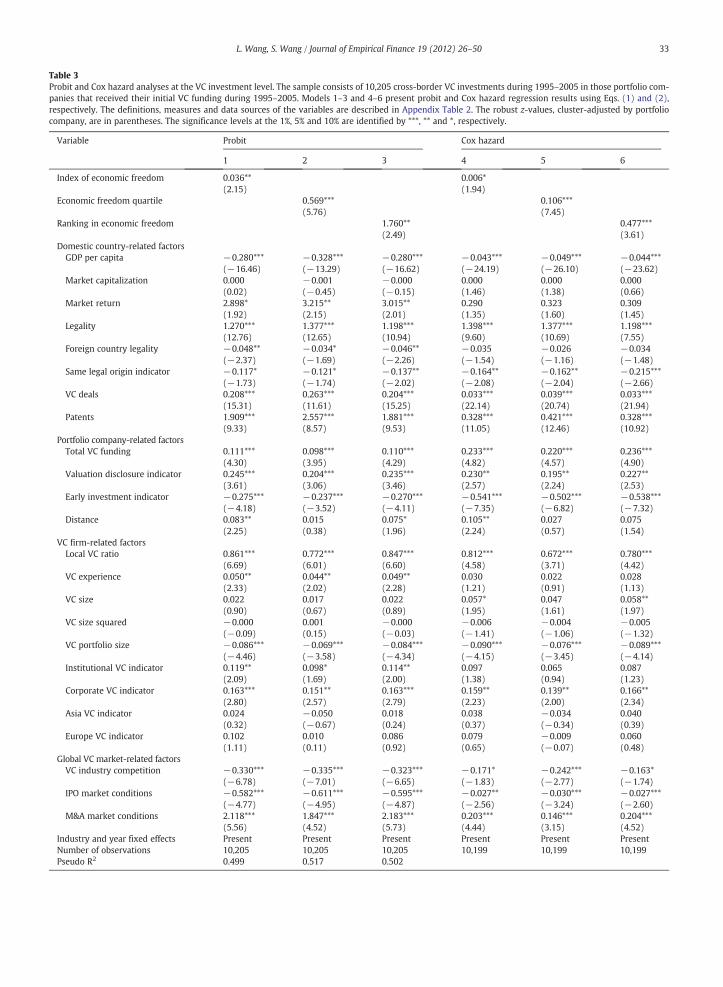
Table 3Probit and Cox hazard analyses at the VC investment level. The sample consists of 10,205 cross-border VC investments during 1995–2005 in those portfolio com-panies that received their initial VC funding during 1995–2005. Models 1–3 and 4–6 present probit and Cox hazard regression results using Eqs. (1) and (2),respectively. The definitions, measures and data sources of the variables are described in Appendix Table 2. The robust z-values, cluster-adjusted by portfoliocompany, are in parentheses. The significance levels at the 1%, 5% and 10% are identified by ***, ** and *, respectively.
Variable Probit Cox hazard
1 2 3 4 5 6
Index of economic freedom 0.036**(2.15)
0.006*(1.94)
Economic freedom quartile 0.569***(5.76)
0.106***(7.45)
Ranking in economic freedom 1.760**(2.49)
0.477***(3.61)
Domestic country-related factorsGDP per capita −0.280***
(−16.46)−0.328***(−13.29)
−0.280***(−16.62)
−0.043***(−24.19)
−0.049***(−26.10)
−0.044***(−23.62)
Market capitalization 0.000(0.02)
−0.001(−0.45)
−0.000(−0.15)
0.000(1.46)
0.000(1.38)
0.000(0.66)
Market return 2.898*(1.92)
3.215**(2.15)
3.015**(2.01)
0.290(1.35)
0.323(1.60)
0.309(1.45)
Legality 1.270***(12.76)
1.377***(12.65)
1.198***(10.94)
1.398***(9.60)
1.377***(10.69)
1.198***(7.55)
Foreign country legality −0.048**(−2.37)
−0.034*(−1.69)
−0.046**(−2.26)
−0.035(−1.54)
−0.026(−1.16)
−0.034(−1.48)
Same legal origin indicator −0.117*(−1.73)
−0.121*(−1.74)
−0.137**(−2.02)
−0.164**(−2.08)
−0.162**(−2.04)
−0.215***(−2.66)
VC deals 0.208***(15.31)
0.263***(11.61)
0.204***(15.25)
0.033***(22.14)
0.039***(20.74)
0.033***(21.94)
Patents 1.909***(9.33)
2.557***(8.57)
1.881***(9.53)
0.328***(11.05)
0.421***(12.46)
0.328***(10.92)
Portfolio company-related factorsTotal VC funding 0.111***
(4.30)0.098***(3.95)
0.110***(4.29)
0.233***(4.82)
0.220***(4.57)
0.236***(4.90)
Valuation disclosure indicator 0.245***(3.61)
0.204***(3.06)
0.235***(3.46)
0.230**(2.57)
0.195**(2.24)
0.227**(2.53)
Early investment indicator −0.275***(−4.18)
−0.237***(−3.52)
−0.270***(−4.11)
−0.541***(−7.35)
−0.502***(−6.82)
−0.538***(−7.32)
Distance 0.083**(2.25)
0.015(0.38)
0.075*(1.96)
0.105**(2.24)
0.027(0.57)
0.075(1.54)
VC firm-related factorsLocal VC ratio 0.861***
(6.69)0.772***(6.01)
0.847***(6.60)
0.812***(4.58)
0.672***(3.71)
0.780***(4.42)
VC experience 0.050**(2.33)
0.044**(2.02)
0.049**(2.28)
0.030(1.21)
0.022(0.91)
0.028(1.13)
VC size 0.022(0.90)
0.017(0.67)
0.022(0.89)
0.057*(1.95)
0.047(1.61)
0.058**(1.97)
VC size squared −0.000(−0.09)
0.001(0.15)
−0.000(−0.03)
−0.006(−1.41)
−0.004(−1.06)
−0.005(−1.32)
VC portfolio size −0.086***(−4.46)
−0.069***(−3.58)
−0.084***(−4.34)
−0.090***(−4.15)
−0.076***(−3.45)
−0.089***(−4.14)
Institutional VC indicator 0.119**(2.09)
0.098*(1.69)
0.114**(2.00)
0.097(1.38)
0.065(0.94)
0.087(1.23)
Corporate VC indicator 0.163***(2.80)
0.151**(2.57)
0.163***(2.79)
0.159**(2.23)
0.139**(2.00)
0.166**(2.34)
Asia VC indicator 0.024(0.32)
−0.050(−0.67)
0.018(0.24)
0.038(0.37)
−0.034(−0.34)
0.040(0.39)
Europe VC indicator 0.102(1.11)
0.010(0.11)
0.086(0.92)
0.079(0.65)
−0.009(−0.07)
0.060(0.48)
Global VC market-related factorsVC industry competition −0.330***
(−6.78)−0.335***(−7.01)
−0.323***(−6.65)
−0.171*(−1.83)
−0.242***(−2.77)
−0.163*(−1.74)
IPO market conditions −0.582***(−4.77)
−0.611***(−4.95)
−0.595***(−4.87)
−0.027**(−2.56)
−0.030***(−3.24)
−0.027***(−2.60)
M&A market conditions 2.118***(5.56)
1.847***(4.52)
2.183***(5.73)
0.203***(4.44)
0.146***(3.15)
0.204***(4.52)
Industry and year fixed effects Present Present Present Present Present PresentNumber of observations 10,205 10,205 10,205 10,199 10,199 10,199Pseudo R2 0.499 0.517 0.502
33L. Wang, S. Wang / Journal of Empirical Finance 19 (2012) 26–50
Freedom, Economic Freedom Quartile and Ranking in Economic Freedom are respectively 0.036, 0.569 and 1.760, with the z-statisticsrespectively at the 5%, 1% and 5% significance levels. For the marginal effects, a one standard deviation increase in Index of Econom-ic Freedom, Economic Freedom Quartile or Ranking in Economic Freedom at the mean level increases the likelihood of a successfulexit by 2.02%, 2.76% or 3.02%, respectively.
Some other variables also affect the performance of VC investments, mostly as expected. First, GDP per Capita is negativelyassociated with the likelihood of a successful exit, which is consistent with the well-known convergence hypothesis in the exog-enous growth literature (Barro, 1991, 1996). Market Return is found to be positively associated with the likelihood of a successfulexit, which is consistent with the studies on the impact of stock market performance on IPO volume (Loughran et al., 1994; Lowry,2003). Legality is found to be significantly positively related to VC performance, which is consistent with Armour and Cumming(2006), Cumming et al. (2006) and Cumming andWalz (2010). The higher legality is, the more protected an investor's legal rightsand the higher the likelihood of a successful exit. We also find that the coefficients of Foreign Country Legality and Same LegalOrigin Indicator are typically negative, suggesting that the legal qualities of a domestic country and a foreign country complementeach other. Also, we find a strong positive association between a domestic country's entrepreneurial activity and the likelihood ofa successful exit. The greater the number of VC deals or patents granted in a domestic country, the higher the likelihood of a suc-cessful exit. However, the relationship between a domestic country's stock market capitalization and the likelihood of a successfulexit is typically insignificant, which is inconsistent with the findings of Black and Gilson (1998) and Cumming (2008), but con-sistent with those of Cumming et al. (2006), who show that a country's stock market capitalization has no significant impacton exit choices in 12 Asia-Pacific countries.
Second, our results on the coefficients of portfolio company-related factors are quite consistent with our expectations. Total VCFunding and Valuation Disclosure Indicator positively affect cross-border VC performance at the 1% significance level. The better thequality of a portfolio company, the larger the VC investment amount, the higher the likelihood of a voluntary disclosure of post-investment valuation, and the higher the likelihood of a successful exit. Also, Early Stage Indicator is found to be strongly negatively as-sociatedwith the likelihood of a successful exit at the 1% significance level. Unexpectedly, the variableDistance is found to be positivelyassociated with the likelihood of a successful exit, but at a low significance level. In later estimations, we generally find insignificantresults on Distance at the portfolio company level. Later in Section 5.2, after a robustness check of the exit choices between an IPOand an acquisition, we further find a different role of Distance in exits through IPOs than in exits through acquisitions. 8
Third, Local VC Ratio is positively related to the likelihood of a successful exit at the 1% significance level. This is consistent withthe value-added view of domestic investors on cross-border VC investments (Dai et al., 2010; Mäkelä and Maula, 2008; Tykvováand Schertler, 2011). VC Experience is found to be positively related to the likelihood of a successful exit at the 5% significancelevel, which is consistent with the findings for the U.S. domestic market, such as those by Sorensen (2007), Gompers et al.(2008) and Nahata (2008). We find a significantly negative relationship between VC Portfolio Size and the likelihood of a successfulexit, which is quite consistent with the findings of Kanniainen and Keuschnigg (2003, 2004) and Cumming (2006). Also, InstitutionalVC Indicator and Corporate VC Indicator have positive effects on Investment Success, due possibly to the value-added services offered byVCs toportfolio companies. As shown, there is no statistically significant associationbetweenVC SizeorVC Size Squared and the likelihoodof a successful exit. Also, neither Asia VC Indicator nor Europe VC Indicator has a significant effect on the likelihood of a successful exit.
Fourth, the global VC market-related factor VC Industry Competition is negatively associated with Investment Success at the 1%significance level. The greater the worldwide inflow of VC funds, the more severe VC competition is in the international marketand the less likely it is for a successful exit to occur. However, the global market conditions affect the likelihood of a successfulexit in different ways. Specifically, IPO Market Conditions is negatively related to the probability of a successful exit, contrary toour expectations. M&A Market Conditions is positively related to the probability of a successful exit at the 1% significance level,consistent with our expectations. Later in Section 5.2, after a robustness check of the exit choices between an IPO and an M&A,we find that the negative coefficient of IPO Market Conditions arises from its other role in the choice between an IPO and an M&A.
We next turn to the Cox hazard analysis in models 4–6 of Table 3 with Investment Duration as the dependent variable usingEq. (2). We find that most results mirror the evidence reported in models 1–3. Taking the right-censored nature of the datainto account, we still find that the coefficients of Index of Economic Freedom, Economic Freedom Quartile and Ranking in EconomicFreedom are significantly positive. Specifically, a one standard deviation increase in Index of Economic Freedom, Economic FreedomQuartile or Ranking in Economic Freedom is associated with an increase of 5.35%, 12.59% or 13.69% respectively in the hazard of asuccessful exit. The results on the control variables are very similar to our earlier results with some changes in the significancelevel. Specifically, GDP per Capita, Same Legal Origin Indicator, Early Investment Indicator, VC Portfolio Size, VC Industry Competitionand IPO Market Conditions remain negatively associated with the hazard of a successful exit, while Legality, VC Deals, Patents, TotalVC Funding, ValuationDisclosure Indicator, Local VC Ratio,Corporate VC Indicator andM&AMarket conditions remain significantly positivelyassociated with the hazard of a successful exit. Further, we have stronger evidence on the impact of the size of a VC firm, with a positiveassociation between VC Size and the hazard of a successful exit. However, the effects of Market Return, Foreign Country Legality, VC
8 We have tried some alternative measures of Distance, including the geographical distance between the foreign country and the domestic country, the flightdistance between the VC firm and the portfolio company, etc. The coefficients of Distance are generally positive but not very significant. However, if we define“successful exits” as IPO exits only, as Tian (2011) does, we find a generally negative effect of Distance on the likelihood and hazard of IPO exits. By comparingour results with the two related studies focusing on the influence of the geographical distance on VC investments (Chemmanur et al., 2011; Tian, 2011), we con-clude that the coefficient of Distance is generally found to be positive in our primary regressions because Distance has a different effect on exits through IPOs thanon exits through acquisitions. Also, the inclusion of geographical distance may suffer from an endogeneity problem due to omitted variables. If we exclude thevariable Distance, our results remain very much unchanged. Since Distance is not the primary focus of our paper, we have not conducted a thorough investigationof it. It would be interesting and worth exploring in the future.
34 L. Wang, S. Wang / Journal of Empirical Finance 19 (2012) 26–50

Experience and Institutional VC Indicator on the hazard of a successful exit aremuchweaker comparedwith our earlier estimations. Othervariables, such asMarket Capitalization, VC Size Squared, Asia VC Indicator and Europe VC Indicator, remain insignificant as before.
4. Analysis at the portfolio company level
In this section,we conduct a performance analysis at the portfolio company level using the probitmodel and the Cox hazardmodelin Eqs. (1) and (2). The unit of analysis is portfolio company, with one observation for each portfolio company. The sample size is6535. Table 4 reports the results. All the z-statistics (in parentheses) are adjusted for heteroskedasticity (White, 1980) and clusteredby domestic country (Petersen, 2009) to account for correlation among multiple VC investments in the same portfolio company.
Models 1–3 in Table 4 report the results of our probit analysis of portfolio companies with Investment Success as the dependentvariable using Eq. (1). Our model fits the data well, with a high pseudo R-squared of greater than 0.53. The results on a domesticcountry's economic freedom are consistent with the earlier results on VC investments. In particular, a one standard deviation in-crease in Index of Economic Freedom, Economic Freedom Quartile or Ranking in Economic Freedom at the mean raises the probabilityof a successful exit by 1.38%, 10.06% or 4.72%, respectively.
The impact of the control variables on Investment Success is largely the same as that implied by the results in Table 3. We findsignificantly positive impacts from Legality, VC Deals, Patents, Total VC Funding, Valuation Disclosure Indicator, Local VC Ratio, Cor-porate VC Indicator and M&A Market Conditions, and significantly negative impacts from GDP per Capita, Foreign Country Legality,Same Legal Origin Indicator, Early Investment Indicator, VC Portfolio Size, VC Industry Competition and IPO Market Conditions. Othercontrol variables are generally insignificantly associated with Investment Success.
Models 4–6 in Table 4 report the results of our Cox hazard analysis of portfolio companies with Investment Duration as the de-pendent variable using Eq. (2). As in the previous section, a domestic country's economic freedom continues to be a good predic-tor of Investment Duration with a large marginal effect. Specifically, a one standard deviation increase in Index of EconomicFreedom, Economic Freedom Quartile or Ranking in Economic Freedom is associated with an increase of 1.73%, 10.96% or 12.33%respectively in the hazard of a successful exit. Taking the right-censored nature of the data into account, we further find thatLegality, VC Deals, Patents, Total VC Funding, Valuation Disclosure Indicator, Local VC Ratio, Corporate VC Indicator and M&A MarketConditions reduce Investment Duration and hence increase the hazard of a successful exit, while GDP per Capita, Same Legal OriginIndicator, Early Investment Indicator and VC Portfolio Size increase Investment Duration and hence decrease the hazard of a success-ful exit. Other control variables are generally insignificantly associated with the hazard of a successful exit.
In summary, the results of our analyses of VC investments and portfolio companies in Tables 3 and 4 indicate that the degree ofa domestic country's economic freedom is positively related to cross-border VC performance after controlling for other relatedfactors of domestic countries, portfolio companies, VCs and the global VCmarket, aswell as year and industry fixed effects. In addition,we provide interesting evidence on many level factors of domestic countries, portfolio companies, VCs and the global VC market thataffect cross-border VC performance. This is consistentwith existing studies on factors such as a domestic country's economic develop-ment, legal quality, entrepreneurial activity, portfolio company quality, local VCs' participation and VCs' portfolio size.
Our findings have policy implications for VC imports. One key implication is that a high degree of freedom is essential for suc-cessful investments in a country, especially for foreign investments.
5. Robustness checks
In the above analyses, a domestic country's economic freedom has emerged as a consistent predictor of cross-border VC per-formance. In this section, we conduct many robustness tests, other than those mentioned in prior sections, to ensure reliability ofour results. To save space, we report a selection of results only. Details of our other tests are available upon request.
5.1. Change in economic freedom
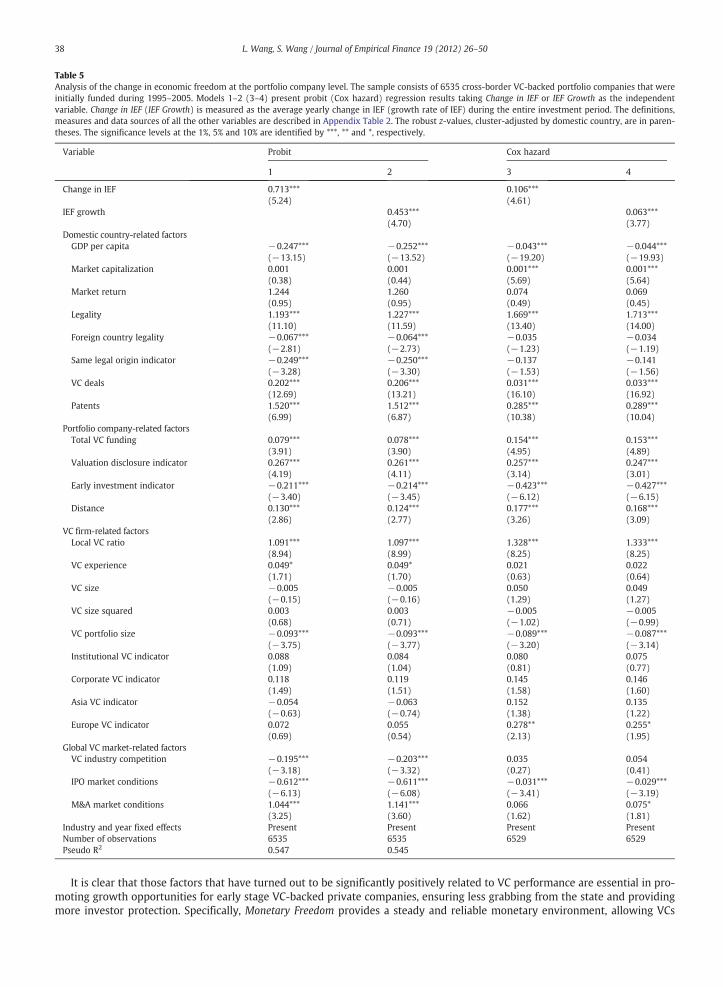
Up to now, we have applied a level model to investigate the impact of a domestic country's economic freedom on cross-borderVC performance. In other words, we have only focused on the cross-sectional difference. In this section, we provide further evi-dence on effects of a change in economic freedom to strengthen our findings. This exercise may mitigate the influence of missingfactors and self-selection concerns. We define two variables, Change in IEF and IEF Growth (%), to measure a change in economicfreedom, which are calculated in a similar way to the three primary independent variables, Index of Economic Freedom, EconomicFreedom Quartile and Ranking in Economic Freedom. Specifically, Change in IEF measures the average yearly change in IEF, and IEFGrowthmeasures the average yearly growth rate of IEF over the entire investment period. The means (and standard deviations) ofChange in IEF and IEF Growth (%) at the portfolio company level are respectively 0.233 (and 0.436) and 0.339 (and 0.628), whichare quite similar to those at the VC investments level.9 These statistics are consistent with our expectation that economic freedomtends to be persistent and does not change dramatically over our sample period.
9 Since IEF is only available before 1995, we assume that IEF in 1994 is the same as that in 1995. Hence, the change in IEF and the change in growth rate of IEF in1995 are both set to zero.
35L. Wang, S. Wang / Journal of Empirical Finance 19 (2012) 26–50
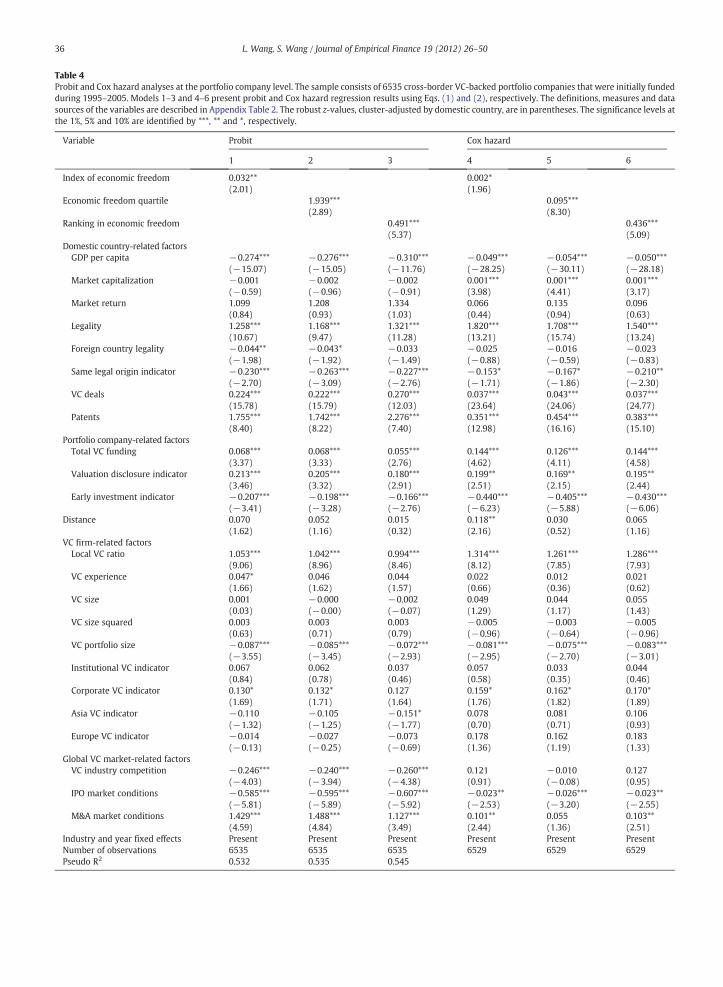
Table 4Probit and Cox hazard analyses at the portfolio company level. The sample consists of 6535 cross-border VC-backed portfolio companies that were initially fundedduring 1995–2005. Models 1–3 and 4–6 present probit and Cox hazard regression results using Eqs. (1) and (2), respectively. The definitions, measures and datasources of the variables are described in Appendix Table 2. The robust z-values, cluster-adjusted by domestic country, are in parentheses. The significance levels atthe 1%, 5% and 10% are identified by ***, ** and *, respectively.
Variable Probit Cox hazard
1 2 3 4 5 6
Index of economic freedom 0.032**(2.01)
0.002*(1.96)
Economic freedom quartile 1.939***(2.89)
0.095***(8.30)
Ranking in economic freedom 0.491***(5.37)
0.436***(5.09)
Domestic country-related factorsGDP per capita −0.274***
(−15.07)−0.276***(−15.05)
−0.310***(−11.76)
−0.049***(−28.25)
−0.054***(−30.11)
−0.050***(−28.18)
Market capitalization −0.001(−0.59)
−0.002(−0.96)
−0.002(−0.91)
0.001***(3.98)
0.001***(4.41)
0.001***(3.17)
Market return 1.099(0.84)
1.208(0.93)
1.334(1.03)
0.066(0.44)
0.135(0.94)
0.096(0.63)
Legality 1.258***(10.67)
1.168***(9.47)
1.321***(11.28)
1.820***(13.21)
1.708***(15.74)
1.540***(13.24)
Foreign country legality −0.044**(−1.98)
−0.043*(−1.92)
−0.033(−1.49)
−0.025(−0.88)
−0.016(−0.59)
−0.023(−0.83)
Same legal origin indicator −0.230***(−2.70)
−0.263***(−3.09)
−0.227***(−2.76)
−0.153*(−1.71)
−0.167*(−1.86)
−0.210**(−2.30)
VC deals 0.224***(15.78)
0.222***(15.79)
0.270***(12.03)
0.037***(23.64)
0.043***(24.06)
0.037***(24.77)
Patents 1.755***(8.40)
1.742***(8.22)
2.276***(7.40)
0.351***(12.98)
0.454***(16.16)
0.383***(15.10)
Portfolio company-related factorsTotal VC funding 0.068***
(3.37)0.068***(3.33)
0.055***(2.76)
0.144***(4.62)
0.126***(4.11)
0.144***(4.58)
Valuation disclosure indicator 0.213***(3.46)
0.205***(3.32)
0.180***(2.91)
0.199**(2.51)
0.169**(2.15)
0.195**(2.44)
Early investment indicator −0.207***(−3.41)
−0.198***(−3.28)
−0.166***(−2.76)
−0.440***(−6.23)
−0.405***(−5.88)
−0.430***(−6.06)
Distance 0.070(1.62)
0.052(1.16)
0.015(0.32)
0.118**(2.16)
0.030(0.52)
0.065(1.16)
VC firm-related factorsLocal VC ratio 1.053***
(9.06)1.042***(8.96)
0.994***(8.46)
1.314***(8.12)
1.261***(7.85)
1.286***(7.93)
VC experience 0.047*(1.66)
0.046(1.62)
0.044(1.57)
0.022(0.66)
0.012(0.36)
0.021(0.62)
VC size 0.001(0.03)
−0.000(−0.00)
−0.002(−0.07)
0.049(1.29)
0.044(1.17)
0.055(1.43)
VC size squared 0.003(0.63)
0.003(0.71)
0.003(0.79)
−0.005(−0.96)
−0.003(−0.64)
−0.005(−0.96)
VC portfolio size −0.087***(−3.55)
−0.085***(−3.45)
−0.072***(−2.93)
−0.081***(−2.95)
−0.075***(−2.70)
−0.083***(−3.01)
Institutional VC indicator 0.067(0.84)
0.062(0.78)
0.037(0.46)
0.057(0.58)
0.033(0.35)
0.044(0.46)
Corporate VC indicator 0.130*(1.69)
0.132*(1.71)
0.127(1.64)
0.159*(1.76)
0.162*(1.82)
0.170*(1.89)
Asia VC indicator −0.110(−1.32)
−0.105(−1.25)
−0.151*(−1.77)
0.078(0.70)
0.081(0.71)
0.106(0.93)
Europe VC indicator −0.014(−0.13)
−0.027(−0.25)
−0.073(−0.69)
0.178(1.36)
0.162(1.19)
0.183(1.33)
Global VC market-related factorsVC industry competition −0.246***
(−4.03)−0.240***(−3.94)
−0.260***(−4.38)
0.121(0.91)
−0.010(−0.08)
0.127(0.95)
IPO market conditions −0.585***(−5.81)
−0.595***(−5.89)
−0.607***(−5.92)
−0.023**(−2.53)
−0.026***(−3.20)
−0.023**(−2.55)
M&A market conditions 1.429***(4.59)
1.488***(4.84)
1.127***(3.49)
0.101**(2.44)
0.055(1.36)
0.103**(2.51)
Industry and year fixed effects Present Present Present Present Present PresentNumber of observations 6535 6535 6535 6529 6529 6529Pseudo R2 0.532 0.535 0.545
36 L. Wang, S. Wang / Journal of Empirical Finance 19 (2012) 26–50
Table 5 reports the probit and Cox hazard analyses at the portfolio company level as in Table 4 but taking Change in IEF orIEF Growth as the explanatory variable. We find positive coefficients on Change in IEF and IEF Growth in all the models with thez-statistics at the 1% significance level. For the marginal effects, a one standard deviation increase in Change in IEF or IEFGrowth at the mean level increases the likelihood of a successful exit by 1.58% or 1.45%, respectively. Also, a one standarddeviation increase in Change in IEF or IEF Growth is associated with an increase of 4.71% or 4.01% respectively in the hazardof a successful exit. These findings further strengthen our argument that economic freedom plays a vital role in cross-border VCsuccess.
5.2. IPOs versus acquisitions
In this section, we focus on the choice of exit between an IPO and an acquisition. IPOs and acquisitions are the two primarymethods by which privately-held firms can become public companies. Existing studies that focus on exit choices of entrepreneursand VCs include those of Brau et al. (2003), Cumming et al. (2006), Poulsen and Stegemoller (2008) and Bayar and Chemmanur(forthcoming). Using a much larger set of sample data that includes many more countries, we provide further empirical analysesof the determinants of whether to exit through an IPO or an acquisition.
For brevity, we report only the probit results on portfolio companies in Table 6. In models 1–3, we focus on the subsample con-sisting of successful portfolio companies only and analyze whether a domestic country's economic freedom has any impact on thechoice of exit between an IPO and an acquisition. The dependent variable is a dummy variable indicating whether a VC-backedportfolio company had gone public by the end of 2009. The number of observations in the subsample is 935. As shown, economicfreedom has no significant impact on the choice between an IPO and an acquisition. The coefficients of Index of Economic Freedom,Economic Freedom Quartile and Ranking in Economic Freedom are respectively 0.001, 0.164 and 0.143 with z-statistics 0.04, 0.18and 0.82. In other words, a domestic country's economic freedom has an almost equal influence on the decision to exit throughan IPO and the decision to exit through an acquisition.
In addition, the results on someof the other variables are interesting.We find that Total VC Funding,ValuationDisclosure Indicator,AsiaVC Indicator and IPO Market Conditions have a significantly positive impact on the choice between an IPO and an acquisition, while GDPper Capita, Legality, Same Legal Origin Indicator, Early Investment Indicator,Distance, Local VC Ratio andM&AMarket Conditions have a sig-nificantly negative impact. Most of these results make sense. One result that requires an explanation is the negative impact of Legality.Cumming et al. (2006) claim that Legality is positively related to the decision to exit through an IPO andnegatively related to the decisionto exit through a private exit. It seems that we have an opposite result. However, their sample is much smaller and covers only 12 Asia-Pacific countries. Further, the choice of “private exits” in their study includes acquisitions, secondary sales and buybacks. In contrast, wefocus on two successful exit routes only, namely IPOs and acquisitions, since our attention is on VC performance.
As a further robustness check, we have also investigated the likelihood of a portfolio company exiting through one of thethree major exit routes—IPOs, acquisitions and liquidations—in a multinomial probit model using the full sample. The depen-dent variable takes three discrete values corresponding to IPOs, acquisitions and liquidations. The results from models 4–6are consistent with those from models 1–3. We see a similar impact of economic freedom on the decision to exit through anIPO and the decision to exit through an acquisition. Specifically, the coefficients of Index of Economic Freedom (or Economic FreedomQuartile, or Ranking in Economic Freedom) are respectively 0.069 (or 0.792, or 3.396) and 0.033 (or 0.607, or 2.341) with z-statistics2.23 (or 5.31, or 2.44) and 1.73 (or 3.81, or 3.28) for exiting through IPOs and through acquisitions respectively. In addition, wesee a different role of IPO Market Conditions and Distance in the two exit choices. Specifically, IPO Market Conditions (Distance) is pos-itively (negatively) associated with exits through IPOs and negatively (positively) associated with exits through acquisitions,which may explain the negative (positive) and sometimes insignificant coefficients of IPO Market Conditions (Distance) inTables 3 and 4.
5.3. Decomposing the effects of economic freedom
We have provided evidence that economic freedom has a positive impact on cross-border VC performance. However, our anal-ysis is so far based on an integrated index of economic freedom (IEF). One drawback is that a single measure may not be able toproperly represent a complex economic environment, and a highly aggregated index makes it difficult to draw policy conclusions.In this section, we investigate the effects of the individual components of the IEF on cross-border VC performance.
The IEF consists of 10 different components—business freedom, trade freedom, fiscal freedom, government spending, mone-tary freedom, investment freedom, financial freedom, property freedom, freedom from corruption and labor freedom. A briefdescription of each component is presented in Appendix Table 1. Since labor freedom only became available after 2005, wefocus on the other nine components in this section. We define the nine variables in the same way as we did for Index of EconomicFreedom—by taking the average of the raw values of each variable over the investment period.
Table 7 reports the probit analysis of the decomposed economic freedom effects at the portfolio company level. The results ofthe Cox hazard analysis are quite similar. Not every component of the IEF has a positive impact on cross-border VC performance.Specifically, Trade Freedom, Fiscal Freedom, Government Spending and Freedom from Corruption are negatively but insignificantlyassociated with cross-border VC performance. Monetary Freedom, Investment Freedom, Financial Freedom and Property Freedomare significantly positively associated with cross-border VC performance, while Business Freedom is positively but insignificantlyassociated with cross-border VC performance.
37L. Wang, S. Wang / Journal of Empirical Finance 19 (2012) 26–50
It is clear that those factors that have turned out to be significantly positively related to VC performance are essential in pro-moting growth opportunities for early stage VC-backed private companies, ensuring less grabbing from the state and providingmore investor protection. Specifically, Monetary Freedom provides a steady and reliable monetary environment, allowing VCs
Table 5Analysis of the change in economic freedom at the portfolio company level. The sample consists of 6535 cross-border VC-backed portfolio companies that wereinitially funded during 1995–2005. Models 1–2 (3–4) present probit (Cox hazard) regression results taking Change in IEF or IEF Growth as the independentvariable. Change in IEF (IEF Growth) is measured as the average yearly change in IEF (growth rate of IEF) during the entire investment period. The definitions,measures and data sources of all the other variables are described in Appendix Table 2. The robust z-values, cluster-adjusted by domestic country, are in paren-theses. The significance levels at the 1%, 5% and 10% are identified by ***, ** and *, respectively.
Variable Probit Cox hazard
1 2 3 4
Change in IEF 0.713***(5.24)
0.106***(4.61)
IEF growth 0.453***(4.70)
0.063***(3.77)
Domestic country-related factorsGDP per capita −0.247***
(−13.15)−0.252***(−13.52)
−0.043***(−19.20)
−0.044***(−19.93)
Market capitalization 0.001(0.38)
0.001(0.44)
0.001***(5.69)
0.001***(5.64)
Market return 1.244(0.95)
1.260(0.95)
0.074(0.49)
0.069(0.45)
Legality 1.193***(11.10)
1.227***(11.59)
1.669***(13.40)
1.713***(14.00)
Foreign country legality −0.067***(−2.81)
−0.064***(−2.73)
−0.035(−1.23)
−0.034(−1.19)
Same legal origin indicator −0.249***(−3.28)
−0.250***(−3.30)
−0.137(−1.53)
−0.141(−1.56)
VC deals 0.202***(12.69)
0.206***(13.21)
0.031***(16.10)
0.033***(16.92)
Patents 1.520***(6.99)
1.512***(6.87)
0.285***(10.38)
0.289***(10.04)
Portfolio company-related factorsTotal VC funding 0.079***
(3.91)0.078***(3.90)
0.154***(4.95)
0.153***(4.89)
Valuation disclosure indicator 0.267***(4.19)
0.261***(4.11)
0.257***(3.14)
0.247***(3.01)
Early investment indicator −0.211***(−3.40)
−0.214***(−3.45)
−0.423***(−6.12)
−0.427***(−6.15)
Distance 0.130***(2.86)
0.124***(2.77)
0.177***(3.26)
0.168***(3.09)
VC firm-related factorsLocal VC ratio 1.091***
(8.94)1.097***(8.99)
1.328***(8.25)
1.333***(8.25)
VC experience 0.049*(1.71)
0.049*(1.70)
0.021(0.63)
0.022(0.64)
VC size −0.005(−0.15)
−0.005(−0.16)
0.050(1.29)
0.049(1.27)
VC size squared 0.003(0.68)
0.003(0.71)
−0.005(−1.02)
−0.005(−0.99)
VC portfolio size −0.093***(−3.75)
−0.093***(−3.77)
−0.089***(−3.20)
−0.087***(−3.14)
Institutional VC indicator 0.088(1.09)
0.084(1.04)
0.080(0.81)
0.075(0.77)
Corporate VC indicator 0.118(1.49)
0.119(1.51)
0.145(1.58)
0.146(1.60)
Asia VC indicator −0.054(−0.63)
−0.063(−0.74)
0.152(1.38)
0.135(1.22)
Europe VC indicator 0.072(0.69)
0.055(0.54)
0.278**(2.13)
0.255*(1.95)
Global VC market-related factorsVC industry competition −0.195***
(−3.18)−0.203***(−3.32)
0.035(0.27)
0.054(0.41)
IPO market conditions −0.612***(−6.13)
−0.611***(−6.08)
−0.031***(−3.41)
−0.029***(−3.19)
M&A market conditions 1.044***(3.25)
1.141***(3.60)
0.066(1.62)
0.075*(1.81)
Industry and year fixed effects Present Present Present PresentNumber of observations 6535 6535 6529 6529Pseudo R2 0.547 0.545
38 L. Wang, S. Wang / Journal of Empirical Finance 19 (2012) 26–50
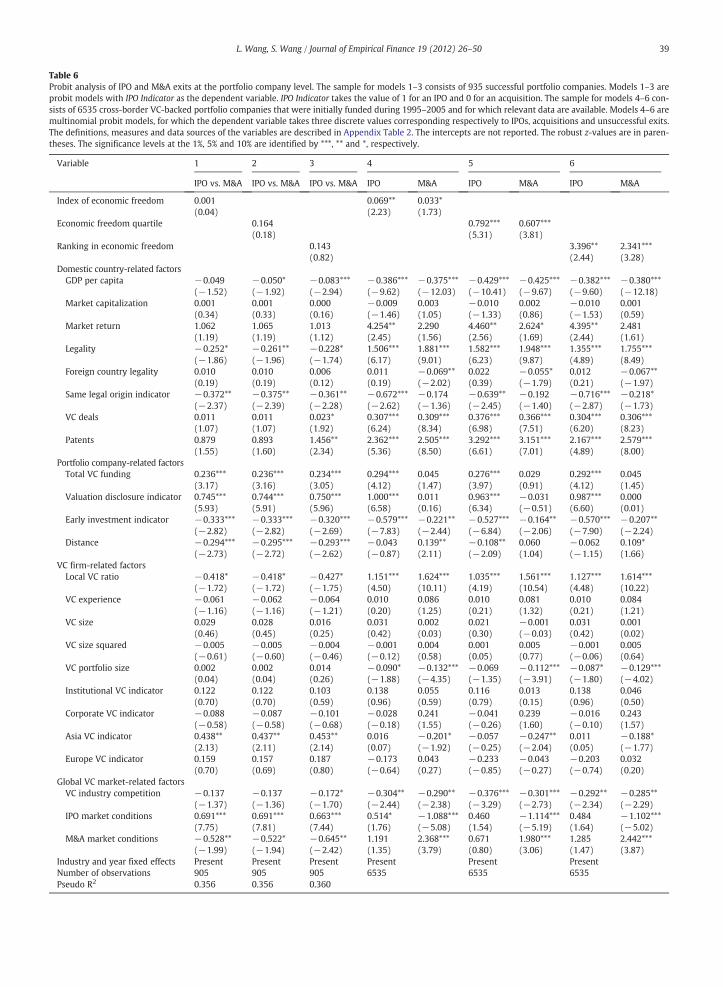
Table 6Probit analysis of IPO and M&A exits at the portfolio company level. The sample for models 1–3 consists of 935 successful portfolio companies. Models 1–3 areprobit models with IPO Indicator as the dependent variable. IPO Indicator takes the value of 1 for an IPO and 0 for an acquisition. The sample for models 4–6 con-sists of 6535 cross-border VC-backed portfolio companies that were initially funded during 1995–2005 and for which relevant data are available. Models 4–6 aremultinomial probit models, for which the dependent variable takes three discrete values corresponding respectively to IPOs, acquisitions and unsuccessful exits.The definitions, measures and data sources of the variables are described in Appendix Table 2. The intercepts are not reported. The robust z-values are in paren-theses. The significance levels at the 1%, 5% and 10% are identified by ***, ** and *, respectively.
Variable 1 2 3 4 5 6
IPO vs. M&A IPO vs. M&A IPO vs. M&A IPO M&A IPO M&A IPO M&A
Index of economic freedom 0.001(0.04)
0.069**(2.23)
0.033*(1.73)
Economic freedom quartile 0.164(0.18)
0.792***(5.31)
0.607***(3.81)
Ranking in economic freedom 0.143(0.82)
3.396**(2.44)
2.341***(3.28)
Domestic country-related factorsGDP per capita −0.049
(−1.52)−0.050*(−1.92)
−0.083***(−2.94)
−0.386***(−9.62)
−0.375***(−12.03)
−0.429***(−10.41)
−0.425***(−9.67)
−0.382***(−9.60)
−0.380***(−12.18)
Market capitalization 0.001(0.34)
0.001(0.33)
0.000(0.16)
−0.009(−1.46)
0.003(1.05)
−0.010(−1.33)
0.002(0.86)
−0.010(−1.53)
0.001(0.59)
Market return 1.062(1.19)
1.065(1.19)
1.013(1.12)
4.254**(2.45)
2.290(1.56)
4.460**(2.56)
2.624*(1.69)
4.395**(2.44)
2.481(1.61)
Legality −0.252*(−1.86)
−0.261**(−1.96)
−0.228*(−1.74)
1.506***(6.17)
1.881***(9.01)
1.582***(6.23)
1.948***(9.87)
1.355***(4.89)
1.755***(8.49)
Foreign country legality 0.010(0.19)
0.010(0.19)
0.006(0.12)
0.011(0.19)
−0.069**(−2.02)
0.022(0.39)
−0.055*(−1.79)
0.012(0.21)
−0.067**(−1.97)
Same legal origin indicator −0.372**(−2.37)
−0.375**(−2.39)
−0.361**(−2.28)
−0.672***(−2.62)
−0.174(−1.36)
−0.639**(−2.45)
−0.192(−1.40)
−0.716***(−2.87)
−0.218*(−1.73)
VC deals 0.011(1.07)
0.011(1.07)
0.023*(1.92)
0.307***(6.24)
0.309***(8.34)
0.376***(6.98)
0.366***(7.51)
0.304***(6.20)
0.306***(8.23)
Patents 0.879(1.55)
0.893(1.60)
1.456**(2.34)
2.362***(5.36)
2.505***(8.50)
3.292***(6.61)
3.151***(7.01)
2.167***(4.89)
2.579***(8.00)
Portfolio company-related factorsTotal VC funding 0.236***
(3.17)0.236***(3.16)
0.234***(3.05)
0.294***(4.12)
0.045(1.47)
0.276***(3.97)
0.029(0.91)
0.292***(4.12)
0.045(1.45)
Valuation disclosure indicator 0.745***(5.93)
0.744***(5.91)
0.750***(5.96)
1.000***(6.58)
0.011(0.16)
0.963***(6.34)
−0.031(−0.51)
0.987***(6.60)
0.000(0.01)
Early investment indicator −0.333***(−2.82)
−0.333***(−2.82)
−0.320***(−2.69)
−0.579***(−7.83)
−0.221**(−2.44)
−0.527***(−6.84)
−0.164**(−2.06)
−0.570***(−7.90)
−0.207**(−2.24)
Distance −0.294***(−2.73)
−0.295***(−2.72)
−0.293***(−2.62)
−0.043(−0.87)
0.139**(2.11)
−0.108**(−2.09)
0.060(1.04)
−0.062(−1.15)
0.109*(1.66)
VC firm-related factorsLocal VC ratio −0.418*
(−1.72)−0.418*(−1.72)
−0.427*(−1.75)
1.151***(4.50)
1.624***(10.11)
1.035***(4.19)
1.561***(10.54)
1.127***(4.48)
1.614***(10.22)
VC experience −0.061(−1.16)
−0.062(−1.16)
−0.064(−1.21)
0.010(0.20)
0.086(1.25)
0.010(0.21)
0.081(1.32)
0.010(0.21)
0.084(1.21)
VC size 0.029(0.46)
0.028(0.45)
0.016(0.25)
0.031(0.42)
0.002(0.03)
0.021(0.30)
−0.001(−0.03)
0.031(0.42)
0.001(0.02)
VC size squared −0.005(−0.61)
−0.005(−0.60)
−0.004(−0.46)
−0.001(−0.12)
0.004(0.58)
0.001(0.05)
0.005(0.77)
−0.001(−0.06)
0.005(0.64)
VC portfolio size 0.002(0.04)
0.002(0.04)
0.014(0.26)
−0.090*(−1.88)
−0.132***(−4.35)
−0.069(−1.35)
−0.112***(−3.91)
−0.087*(−1.80)
−0.129***(−4.02)
Institutional VC indicator 0.122(0.70)
0.122(0.70)
0.103(0.59)
0.138(0.96)
0.055(0.59)
0.116(0.79)
0.013(0.15)
0.138(0.96)
0.046(0.50)
Corporate VC indicator −0.088(−0.58)
−0.087(−0.58)
−0.101(−0.68)
−0.028(−0.18)
0.241(1.55)
−0.041(−0.26)
0.239(1.60)
−0.016(−0.10)
0.243(1.57)
Asia VC indicator 0.438**(2.13)
0.437**(2.11)
0.453**(2.14)
0.016(0.07)
−0.201*(−1.92)
−0.057(−0.25)
−0.247**(−2.04)
0.011(0.05)
−0.188*(−1.77)
Europe VC indicator 0.159(0.70)
0.157(0.69)
0.187(0.80)
−0.173(−0.64)
0.043(0.27)
−0.233(−0.85)
−0.043(−0.27)
−0.203(−0.74)
0.032(0.20)
Global VC market-related factorsVC industry competition −0.137
(−1.37)−0.137(−1.36)
−0.172*(−1.70)
−0.304**(−2.44)
−0.290**(−2.38)
−0.376***(−3.29)
−0.301***(−2.73)
−0.292**(−2.34)
−0.285**(−2.29)
IPO market conditions 0.691***(7.75)
0.691***(7.81)
0.663***(7.44)
0.514*(1.76)
−1.088***(−5.08)
0.460(1.54)
−1.114***(−5.19)
0.484(1.64)
−1.102***(−5.02)
M&A market conditions −0.528**(−1.99)
−0.522*(−1.94)
−0.645**(−2.42)
1.191(1.35)
2.368***(3.79)
0.671(0.80)
1.980***(3.06)
1.285(1.47)
2.442***(3.87)
Industry and year fixed effects Present Present Present Present Present PresentNumber of observations 905 905 905 6535 6535 6535Pseudo R2 0.356 0.356 0.360
39L. Wang, S. Wang / Journal of Empirical Finance 19 (2012) 26–50
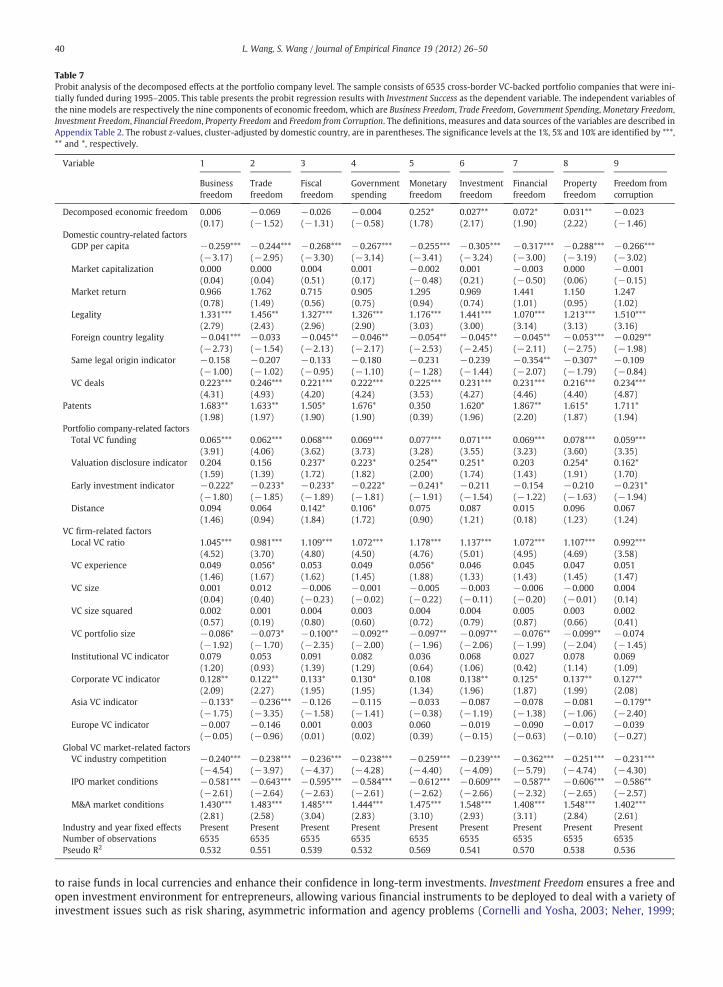
to raise funds in local currencies and enhance their confidence in long-term investments. Investment Freedom ensures a free andopen investment environment for entrepreneurs, allowing various financial instruments to be deployed to deal with a variety ofinvestment issues such as risk sharing, asymmetric information and agency problems (Cornelli and Yosha, 2003; Neher, 1999;
Table 7Probit analysis of the decomposed effects at the portfolio company level. The sample consists of 6535 cross-border VC-backed portfolio companies that were ini-tially funded during 1995–2005. This table presents the probit regression results with Investment Success as the dependent variable. The independent variables ofthe nine models are respectively the nine components of economic freedom, which are Business Freedom, Trade Freedom, Government Spending,Monetary Freedom,Investment Freedom, Financial Freedom, Property Freedom and Freedom from Corruption. The definitions, measures and data sources of the variables are described inAppendix Table 2. The robust z-values, cluster-adjusted by domestic country, are in parentheses. The significance levels at the 1%, 5% and 10% are identified by ***,** and *, respectively.
Variable 1 2 3 4 5 6 7 8 9
Businessfreedom
Tradefreedom
Fiscalfreedom
Governmentspending
Monetaryfreedom
Investmentfreedom
Financialfreedom
Propertyfreedom
Freedom fromcorruption
Decomposed economic freedom 0.006(0.17)
−0.069(−1.52)
−0.026(−1.31)
−0.004(−0.58)
0.252*(1.78)
0.027**(2.17)
0.072*(1.90)
0.031**(2.22)
−0.023(−1.46)
Domestic country-related factorsGDP per capita −0.259***
(−3.17)−0.244***(−2.95)
−0.268***(−3.30)
−0.267***(−3.14)
−0.255***(−3.41)
−0.305***(−3.24)
−0.317***(−3.00)
−0.288***(−3.19)
−0.266***(−3.02)
Market capitalization 0.000(0.04)
0.000(0.04)
0.004(0.51)
0.001(0.17)
−0.002(−0.48)
0.001(0.21)
−0.003(−0.50)
0.000(0.06)
−0.001(−0.15)
Market return 0.966(0.78)
1.762(1.49)
0.715(0.56)
0.905(0.75)
1.295(0.94)
0.969(0.74)
1.441(1.01)
1.150(0.95)
1.247(1.02)
Legality 1.331***(2.79)
1.456**(2.43)
1.327***(2.96)
1.326***(2.90)
1.176***(3.03)
1.441***(3.00)
1.070***(3.14)
1.213***(3.13)
1.510***(3.16)
Foreign country legality −0.041***(−2.73)
−0.033(−1.54)
−0.045**(−2.13)
−0.046**(−2.17)
−0.054**(−2.53)
−0.045**(−2.45)
−0.045**(−2.11)
−0.053***(−2.75)
−0.029**(−1.98)
Same legal origin indicator −0.158(−1.00)
−0.207(−1.02)
−0.133(−0.95)
−0.180(−1.10)
−0.231(−1.28)
−0.239(−1.44)
−0.354**(−2.07)
−0.307*(−1.79)
−0.109(−0.84)
VC deals 0.223***(4.31)
0.246***(4.93)
0.221***(4.20)
0.222***(4.24)
0.225***(3.53)
0.231***(4.27)
0.231***(4.46)
0.216***(4.40)
0.234***(4.87)
Patents 1.683**(1.98)
1.633**(1.97)
1.505*(1.90)
1.676*(1.90)
0.350(0.39)
1.620*(1.96)
1.867**(2.20)
1.615*(1.87)
1.711*(1.94)
Portfolio company-related factorsTotal VC funding 0.065***
(3.91)0.062***(4.06)
0.068***(3.62)
0.069***(3.73)
0.077***(3.28)
0.071***(3.55)
0.069***(3.23)
0.078***(3.60)
0.059***(3.35)
Valuation disclosure indicator 0.204(1.59)
0.156(1.39)
0.237*(1.72)
0.223*(1.82)
0.254**(2.00)
0.251*(1.74)
0.203(1.43)
0.254*(1.91)
0.162*(1.70)
Early investment indicator −0.222*(−1.80)
−0.233*(−1.85)
−0.233*(−1.89)
−0.222*(−1.81)
−0.241*(−1.91)
−0.211(−1.54)
−0.154(−1.22)
−0.210(−1.63)
−0.231*(−1.94)
Distance 0.094(1.46)
0.064(0.94)
0.142*(1.84)
0.106*(1.72)
0.075(0.90)
0.087(1.21)
0.015(0.18)
0.096(1.23)
0.067(1.24)
VC firm-related factorsLocal VC ratio 1.045***
(4.52)0.981***(3.70)
1.109***(4.80)
1.072***(4.50)
1.178***(4.76)
1.137***(5.01)
1.072***(4.95)
1.107***(4.69)
0.992***(3.58)
VC experience 0.049(1.46)
0.056*(1.67)
0.053(1.62)
0.049(1.45)
0.056*(1.88)
0.046(1.33)
0.045(1.43)
0.047(1.45)
0.051(1.47)
VC size 0.001(0.04)
0.012(0.40)
−0.006(−0.23)
−0.001(−0.02)
−0.005(−0.22)
−0.003(−0.11)
−0.006(−0.20)
−0.000(−0.01)
0.004(0.14)
VC size squared 0.002(0.57)
0.001(0.19)
0.004(0.80)
0.003(0.60)
0.004(0.72)
0.004(0.79)
0.005(0.87)
0.003(0.66)
0.002(0.41)
VC portfolio size −0.086*(−1.92)
−0.073*(−1.70)
−0.100**(−2.35)
−0.092**(−2.00)
−0.097**(−1.96)
−0.097**(−2.06)
−0.076**(−1.99)
−0.099**(−2.04)
−0.074(−1.45)
Institutional VC indicator 0.079(1.20)
0.053(0.93)
0.091(1.39)
0.082(1.29)
0.036(0.64)
0.068(1.06)
0.027(0.42)
0.078(1.14)
0.069(1.09)
Corporate VC indicator 0.128**(2.09)
0.122**(2.27)
0.133*(1.95)
0.130*(1.95)
0.108(1.34)
0.138**(1.96)
0.125*(1.87)
0.137**(1.99)
0.127**(2.08)
Asia VC indicator −0.133*(−1.75)
−0.236***(−3.35)
−0.126(−1.58)
−0.115(−1.41)
−0.033(−0.38)
−0.087(−1.19)
−0.078(−1.38)
−0.081(−1.06)
−0.179**(−2.40)
Europe VC indicator −0.007(−0.05)
−0.146(−0.96)
0.001(0.01)
0.003(0.02)
0.060(0.39)
−0.019(−0.15)
−0.090(−0.63)
−0.017(−0.10)
−0.039(−0.27)
Global VC market-related factorsVC industry competition −0.240***
(−4.54)−0.238***(−3.97)
−0.236***(−4.37)
−0.238***(−4.28)
−0.259***(−4.40)
−0.239***(−4.09)
−0.362***(−5.79)
−0.251***(−4.74)
−0.231***(−4.30)
IPO market conditions −0.581***(−2.61)
−0.643***(−2.64)
−0.595***(−2.63)
−0.584***(−2.61)
−0.612***(−2.62)
−0.609***(−2.66)
−0.587**(−2.32)
−0.606***(−2.65)
−0.586**(−2.57)
M&A market conditions 1.430***(2.81)
1.483***(2.58)
1.485***(3.04)
1.444***(2.83)
1.475***(3.10)
1.548***(2.93)
1.408***(3.11)
1.548***(2.84)
1.402***(2.61)
Industry and year fixed effects Present Present Present Present Present Present Present Present PresentNumber of observations 6535 6535 6535 6535 6535 6535 6535 6535 6535Pseudo R2 0.532 0.551 0.539 0.532 0.569 0.541 0.570 0.538 0.536
40 L. Wang, S. Wang / Journal of Empirical Finance 19 (2012) 26–50
Wang and Zhou, 2004). Financial Freedom provides a transparent and open financial systemwith efficient financial intermediationbetween VCs and entrepreneurs and ensures fairness in access to finance and entrepreneurship. Property Freedom ensures therights of individuals in acquiring private property and accumulating wealth, which gives VCs and entrepreneurs the confidencethey need to engage in entrepreneurial activities and make long-term plans.
The above positive components of the IEF emphasize the economic environment within a country. In contrast, Trade Freedom isabout competition in international trade. It reflects the openness of an economy to the imports of goods and services from all overthe world and the ability of citizens to interact freely as buyers and sellers in the international markets. Protection from internationalcompetition may benefit early stage private companies. Also, government protection is reflected by Fiscal Freedom, GovernmentSpending and Freedom from Corruption. These reasons may explain the negative, albeit weak, effects of these factors on cross-border VC performance.
In summary, Monetary Freedom, Investment Freedom, Financial Freedom and Property Freedom provide a transparent and openeconomic environment for foreign VCs and allow them to effectively mitigate many investment problems such as risk sharing,asymmetric information and agency problems between themselves and entrepreneurs, which benefits cross-border VC invest-ments. Less Trade Freedom, Fiscal Freedom, Government Spending and Freedom from Corruption may mean more government pro-tection for early stage private companies, which may also benefit cross-border VC investments. In fact, the negative effect of TradeFreedom, Fiscal Freedom and Government Spending on cross-border VC performance is consistent with the decomposed effects ofeconomic freedom on economic growth proposed by Carlsson and Lundstrom (2002).
5.4. Other robustness tests
We have also done several other robustness tests. Here we report a summary of these tests.First, we have conducted a robustness test using an alternative measure of cross-border VC performance. Following Hochberg
et al. (2007), we construct a different success indicator at the portfolio company level as the dependent variable, which equals 1 ifa portfolio company survives a financing round to receive another round of financing or if it exits via an IPO or an M&A, and 0 -otherwise. The sample size decreases from round to round. We use the same set of explanatory variables as before. The main re-sults remain the same. These results suggest that our findings are robust to different measures of success.
Second, we further include domestic country fixed effects in all our regressions. Even though we have tried to control formany factors affecting a domestic country's investment environment, we might have missed some factors that are unobser-vable or hard to measure. Therefore, we further include domestic country fixed effects to mitigate the influence of these miss-ing factors. The sample size is reduced to 9135 for VC investments and 5746 for portfolio companies. Our findings areconsistent with those from earlier regressions. The pseudo R-squared is substantially improved to above 0.75 in all regres-sions. The marginal effects of Index of Economic Freedom, Economic Freedom Quartile and Ranking in Economic Freedom onthe likelihood of a successful exit are respectively 0.031, 0.021 and 1.235 for VC investments and 0.026, 0.011 and 0.989 forportfolio companies.
Third, we consider alternative measures of Legality, named the Doing Business Indicators, which are provided by the WorldBank and are available at www.doingbusiness.org. Since these indicators only became available after 2004, we use the mostupdated information provided by the annual report Doing Business 2011, covering the period from June 2009 through May2010. For our purpose, we only focus on the factors relating to a country's legal quality, including Getting Credit, Protecting Inves-tors and Enforcing Contracts. Similar to earlier tests, we also control for these factors for each foreign country to capture thedifferences in the legal systems between domestic and foreign countries. We obtain very similar findings using these alternativemeasures.
One other concern of Legality is the potential problem of multicollearity. It is clear that the index of economic freedomalso captures some legal factors such as the protection of a country's private property rights, the independence of thejudiciary, the ability of individuals and businesses to enforce contracts, etc. We also find a somewhat high correlation be-tween Legality and Index of Economic Freedom or Legality and Ranking in Economic Freedom of about 0.54 or 0.57. Thevariance inflation factor (VIF) of Legality is also somewhat high at about 6.48. Although these values are acceptablein most cases, we have tried to rule out a possible influence of multicollinearity. The alternative measures of Legality,named the Doing Business Indicators, are also helpful in dealing with multicollearity. Further, we have also tried to usethe orthogonalized Index of Economic Freedom (or Ranking in Economic Freedom) and the original Legality, or the originalIndex of Economic Freedom (or Ranking in Economic Freedom) and the orthogonalized Legality, or the orthogonalized Indexof Economic Freedom (or Ranking in Economic Freedom) and the orthogonalized Legality in all our analyses. We obtain thesame results at even higher significance levels than before.
Fourth, as the U.S. portfolio companies constitute about 40.86% of our sample, we re-run all our regressions using a subsamplethat excludes these companies. The results are qualitatively unchanged. As suggested by Cumming et al. (2009), relocation to theU.S. implies much greater returns for Asia-Pacific VCs than investing in companies already based in the U.S. at the time of VCinvestment. Due to data limitation, we do not have information on the location of each portfolio company at the time of VCinvestments and at the time of exit. Hence, excluding the U.S. portfolio companies may be helpful in ruling out the influence ofthe relocations of portfolio companies in our findings.
Fifth, we have conducted further analyses on the potential problem of a time trend. In earlier analyses, we have already dealtwith the time trend problem by including year dummies to control for year fixed effects. But a number of big events occurredduring our sample period. We re-run all our regressions using a subsample that excludes the data in the period 1999–2000 to
41L. Wang, S. Wang / Journal of Empirical Finance 19 (2012) 26–50

rule out the influence of the NASDAQ bubble. The sample size is reduced respectively to 6562 and 4127 for the analyses of VCinvestments and portfolio companies. Also, the distribution of successful exits (not reported) suggests that the recent financialcrisis following year 2007 heavily affected the chances of a successful exit for cross-border VC investments. Although the meth-od may not be very convincing, we have tried to rule out the influence of the recent financial crisis by excluding those observa-tions that resulted in a successful exit during 2008–2009 as a robustness check. The sample size is decreased respectively to10,066 and 6451 for the analyses of VC investments and portfolio companies. Again, our results are qualitatively unchangedusing these subsamples.
Sixth, some write offs and liquidations are also recorded as acquisitions in the SDC VentureXpert database. Hence, it is noteasy to separate unsuccessful VC investments such as write offs from successful acquisitions. To rule out the possible influenceof this data limitation, we exclude those VC investments that exited through acquisitions with disclosed transaction values ofless than $50 million. The sample size is reduced respectively to 9447 and 6057 for the analyses of VC investments and portfoliocompanies. Alternatively, we exclude those VC investments that exited through acquisitions with disclosed transaction percent-ages of target portfolio companies less than 100%. The sample size is reduced respectively to 10,166 and 6510 for the analyses ofVC investments and portfolio companies. We re-run all our regressions using these subsamples. Our results again remain qual-itatively unchanged.
Seventh, as shown in Table 1, the computer-related and biotechnology industries make respectively the largest and smallestcontributions to our dataset. To examine whether the inclusion of these industries in our sample influences our results, we re-runall our regressions without these industries. Our results again remain qualitatively unchanged.
Finally, to investigate further whether our results are unduly influenced by outliers, we re-run all our regressions after winsor-izing the top and bottom 1%, 2% and 5% for each continuous variable. The results remain largely unchanged.
6. Conclusion
We investigate the determinants of cross-border VC performance using a sample of 10,205 cross-border VC investments by1906 foreign VCs in 6535 domestic portfolio companies covering 35 domestic countries. In particular, we investigate the impactof a domestic country's economic freedom on cross-border VC performance after controlling for other related factors of domesticcountries, portfolio companies, VCs and the global VC market, where economic freedom is measured by either the raw values of,quartiles of or the ranking in the IEF over the investment period. We provide both probit and Cox hazard analyses at both the VCinvestment and portfolio company levels.
We find that a domestic country's economic freedom is positively related to the likelihood of a successful exit and negativelyrelated to the expected investment duration. This finding is robust to domestic country fixed effects, subsamples, decomposedeconomic freedom, and alternative measures of performance, economic freedom and control variables.
We also find cross-border VC performance to be strongly associated with a number of other characteristics of a domestic coun-try. Specifically, the GDP per capita of a domestic country is found to be negatively related to the likelihood and hazard of asuccessful exit, which is consistent with the convergence hypothesis in the exogenous growth literature. As expected, legalityis found to be positively related to cross-border VC performance, which is quite consistent with the findings of Cumming et al.(2006). Also, a domestic country's entrepreneurial activity is found to be positively related to the likelihood and hazard of asuccessful exit. Our results also contribute to the literature on the role of many other level factors of portfolio companies, VCsand the global VC market in cross-border VC performance. For example, our findings demonstrate that portfolio company qualityand local VCs' participation have a positive impact, while early stage investments and VCs' portfolio size have a negative impact,on the likelihood and hazard of a successful exit. Also, we find that the global market conditions for IPOs and M&As affect thedecision to exit through an IPO and the decision to exit through an M&A differently.
This papermakes threemain contributions. First, this paper investigates the impact of an important country-level factor, name-ly a domestic country's economic freedom, on cross-border VC performance, which enriches the literature on economic freedom.Second, our analysis is helpful in understanding cross-border VC investments around theworld.We enrich the literature by explor-ing the determinants of cross-border VC performance. Third, we contribute more evidence to the literature on the influence ofmany other factors of domestic countries, portfolio companies, VCs and the global VC market on cross-border VC performance.
Acknowledgment
This project was sponsored by the National Natural Science Foundation of China (No. 71102134 and No. 71072036) and theMOE Project for Key Research Institutes of Humanities and Social Science in Universities (No. 10JJD630006). We gratefullyacknowledge helpful comments and suggestions from Weili Ge, Qinchuan Hou, Prem C. Jain, Qinglu Jin, Hong Xie, GuochangZhang, and the anonymous referees.
Appendix. Discussion of variable definitions
The performance measure
Ideally, we would measure performance directly using the rate of return. However, such information is not systematicallyavailable to the public since VCs generally disclose their performance only to their investors. The majority of observable VC
42 L. Wang, S. Wang / Journal of Empirical Finance 19 (2012) 26–50

returns are from successful exits through IPOs or M&As (Cochrane, 2005; Cumming and MacIntosh, 2003). Generally the moresuccessful exits a VC firm makes from its portfolio companies, the larger its internal rate of return from these investments.Hence, we measure VC performance indirectly using the likelihood of a successful exit by the end of 2009, and call this InvestmentSuccess. A portfolio company is treated as successful if it went public or was acquired by the end of 2009. We allow a minimum offour years for a successful exit by tracing the performance of a portfolio company until the end of 2009 after an initial investmentin or before 2005. A similar approach is adopted by Gompers and Lerner (2000), Hochberg et al. (2007), Sorensen (2007),Gompers et al. (2008), Nahata (2008), and Cumming and Dai (2010, 2011).
In addition, we also provide a survival analysis using a Cox hazard model. The dependent variable of the Cox hazard modelis called Investment Duration.10 For VC investments (or portfolio companies), Investment Duration is the logarithm of the num-ber of days from the date when a VC firm first invested in a portfolio company (or when a portfolio company received its firstVC funding) to the date of exit. It is right-censored at the end of 2009 for those investments (or portfolio companies) that hadnot yet exited successfully by the end of 2009. The Cox hazard model allows for right-censored data and time-varyingvariables and is a semi-parametric model in which the hazard function is not dependent on a specific distribution of thesurvival time.
The economic freedom measure
There are two popular measures of economic freedom: the economic freedom of the world (EFW) provided by the FraserInstitute at www.freetheworld.com, and the index of economic freedom (IEF) provided by the Wall Street Journal and HeritageFoundation (WSJ/HF) at www.heritage.org.
Although these two measures differ somewhat in their coverage, they show similar rankings for the countries in question. Thecorrelation of these two measures is shown to be around 0.85. In this paper, we make use of the IEF simply because of data avail-ability—the EFW is only available every 5 years for those years prior to year 2000, while the IEF is available annually for the wholeperiod of 1995–2009. Existing empirical analyses that use the IEF as a measure of economic freedom include Heckelman (2000),Goel and Nelson (2005), McGee (2008), McMullen et al. (2008), etc. The IEF is a composite index that indicates the degree towhich an economy is characterized by the free market principle. As described in Appendix Table 1, the IEF consists of ten compo-nents corresponding to ten aspects of economic freedom, each of which is assigned a grade from 0 to 100, where 100 representsmaximum freedom. The scores of the ten components are then averaged to give an overall score of economic freedom for eachcountry.
We take the average IEF over the investment period as our primary explanatory variable and name it Index of EconomicFreedom. Specifically, in the analysis of VC investments (or portfolio companies), Index of Economic Freedom is the average IEFover the investment period starting from the year when a VC firm first invested in a portfolio company (or the year when a port-folio company first received VC funding) to the year of exit. For unsuccessful VC investments (or portfolio companies), Index ofEconomic Freedom is the average IEF over the entire time period starting from the year when a VC firm first invested in a portfoliocompany (or the year when a portfolio company first received VC funding) to year 2009.
We also conduct analyses using two qualitative measures of economic freedom—Economic Freedom Quartile and Ranking inEconomic Freedom. The Economic Freedom Quartile is based on the Index of Economic Freedom, which takes the value of 1 ifIndex belongs to the lowest quartile, 2 if Index belongs to the second quartile, 3 if Index belongs to the third quartile, and 4 ifIndex belongs to the highest quartile. We have also tried some other grouping methods to qualitatively measure a country's eco-nomic freedom, such as adopting a high economic freedom dummy and economic freedom quintiles. All our findings are quitesimilar.
To calculate Ranking in Economic Freedom, we sort the IEF in each year for the 35 sample countries and construct a normalized IEFranking for each country by performing the calculation of oneminus the IEF ranking divided by 35. That is, the normalized IEF rankingtakes a value between 0 and 1. The greater the value of normalized IEF ranking, themore economically free a country is. For a success-ful VC investment (or a successful portfolio company), Ranking in Economic Freedom is the average normalized IEF ranking over theperiod starting from the year when the VC firm made the first investment (or the year when the portfolio company received thefirst VC funding) to the year of exit. For an unsuccessful VC investment (or an unsuccessful portfolio company), Ranking in EconomicFreedom is the average normalized IEF ranking over the entire period starting from the year when the VC firm made the first invest-ment (or the year when the portfolio company received the first VC funding) to year 2009.
Domestic country-related factors
We include country-specific macroeconomic variables from the WDI database to control for investment opportunities acrosscountries. Specifically, we include the GDP per capita (named GDP per Capita) to control for a country's economic development.
10 Giot and Schwienbacher (2007) and Cumming and Johan (2010) focus specifically on a survival analysis of VC investment duration. Giot and Schwienbacher(2007) analyze the time to IPO, trade sales and liquidations for 6000 VC-backed companies in the U.S., while Cumming and Johan (2010) relate VC investmentduration to the characteristics of portfolio companies, VCs, deals, and institutional and market conditions. We control for most of these factors which have beenshown to influence VC investment duration.
43L. Wang, S. Wang / Journal of Empirical Finance 19 (2012) 26–50
The size and development stage of financial markets are captured by the market capitalization of listed companies as a percentageof the GDP (namedMarket Capitalization). The measurements of these two variables are similar to Index of Economic Freedom andRanking in Economic Freedom. For a successful VC investment (or a successful portfolio company), the two variables are measuredby their respective averages over the period starting from the year when the VC firmmade the first investment (or the year whenthe portfolio company received the first VC funding) to the year of exit. For an unsuccessful VC investment (or an unsuccessfulportfolio company), the two variables are measured by their respective averages over the entire time period starting from theyear when the VC firm made the first investment (or the year when the portfolio company received the first VC funding) toyear 2009.
As suggested by Loughran et al. (1994) and Lowry (2003), we also include stock market performance (named Market Return),which is measured as a domestic country's stock market return over a period of three months prior to a VC firm's exit from a port-folio company. For unsuccessful exits, it is a domestic country's average lagged quarterly stock market return over the entire timeperiod starting from the date when a portfolio company received the initial VC funding to the end of 2009. We make use of thestock market index from the Global Insight database to calculate Market Return.
Another important factor influencing cross-border VC performance is the quality of legal institutions (Armour andCumming, 2006; Cumming and Walz, 2010; Cumming et al., 2006). We include a legality index Legality, which is measuredas the weighted sum of the legal factors mentioned in Berkowitz et al. (2003) and derived from La Porta et al. (1997, 1998).Specifically, Legality=0.381×(Efficiency of Judiciary)+0.5778×(Rule of Law)+0.5031×(Corruption)+0.3468×(Risk ofExpropriation)+0.3842×(Risk of Contract Repudiation). To control further for the difference in the legal systems between adomestic country and a corresponding foreign country, we also include the foreign country's legality index Foreign CountryLegality and a dummy variable Same Legal Origin Indicator to indicate whether the legal systems of the domestic country andthe corresponding foreign country originated from the same tradition, such as the traditions of the English, the French, theGermans or the Scandinavians.
To capture the difference between economic freedom and entrepreneurial activity, we also control for a domestic country'sentrepreneurial activity. In light of the study by Cumming and Li (2009), we use a domestic country's number of VC deals (VCDeals) and number of patents granted (Patents) over the investment period as proxies for its entrepreneurial activity. Informationon a country's VC activity is available from the SDC VentureXpert database. To avoid double counting, we consider only the initialVC deal in a portfolio company. Information on cross-country patents is provided by the WIPO (World Intellectual PropertyOrganization) database, which is available at www.wipo.int. We count the number of patents granted by the country of origin.The measurement of these two variables is similar to that for Index of Economic Freedom, Ranking in Economic Freedom, GDP perCapita and Market Capitalization. Specifically, for a successful VC investment (or a successful portfolio company), VC Deals is mea-sured as the average number of VC deals per million people in the domestic country over the investment period starting from theyear when a VC firmmade the first investment (or the year when a portfolio company received the first VC funding) to the year ofexit. For an unsuccessful VC investment (or an unsuccessful portfolio company), VC Deals is the average number of VC deals permillion people in the domestic country over the entire time period starting from the year when a VC firm made the first invest-ment (or the year when a portfolio company received the first VC funding) to year 2009. Similarly, for a successful VC investment(or a successful portfolio company), Patents is measured as the average number of patents granted per thousand people in thedomestic country over the investment period starting from the year when a VC firm made the first investment (or the yearwhen a portfolio company received the first VC funding) to the year of exit. For an unsuccessful VC investment (or an unsuccessfulportfolio company), Patents is the average number of patents granted per thousand people in the domestic country over the entiretime period starting from the year when a VC firm made the first investment (or the year when a portfolio company received thefirst VC funding) to year 2009.11
Portfolio company-related factors
The greater the total VC funding, the better a portfolio company's quality is likely to be, and in turn the higher the likelihood ofa successful exit. Following Nahata (2008), we use the total VC investment amount in a portfolio company across all financingrounds (Total VC Funding) as a proxy for company quality. Another variable we consider is whether a portfolio company disclosesits post-investment valuation. In the dataset, around 30% of the portfolio companies voluntarily report their market valuationafter an investment round, which is a good predictor of their quality. Therefore, we use the dummy variable Valuation DisclosureIndicator to indicate whether a portfolio company discloses its market valuation after a VC firm has made the first investment inour analysis of VC investments (or after the portfolio company has received the first VC funding in our analysis of portfoliocompanies) as one more proxy for portfolio company quality.
We also include the control variable Early Investment Indicator which indicates whether the first VC investment in a portfoliocompany occurs at the early or seed stage of development. Companies in their early stages of development are likely to be riskier,which may affect VC performance.
11 Since the cross-country patent data in 2009 was still unavailable at the end of 2010 (the time of writing), we regard the number of granted patents in 2009 asthe same as that in 2008 assuming that there is no substantial changes in the number of patents between these two years.
44 L. Wang, S. Wang / Journal of Empirical Finance 19 (2012) 26–50
Due to the information asymmetry, geographical distance may affect VCs' investment decision and their successful exit rates.Geographical distance influences VCs' ability in finding investment opportunities and VCs' monitoring cost in alleviating moralhazard problems. Existing studies (Chemmanur et al., 2011; Tian, 2011) have shown that the geographical distance betweenportfolio companies and VCs matters for the eventual performance of VC investments. To control for a possible influence ofgeographical distance, we also include geographical distance in our analysis. The variable Distance is measured as the logarithmof the geographical distance between a portfolio company and a VC firm.
VC firm-related factors
As suggested by Mäkelä and Maula (2008), Dai et al. (2010) and Tykvová and Schertler (2011), local VCs play an importantrole in boosting cross-border investment initiation and in alleviating information asymmetry and monitoring problems.Therefore, we control for the variable Local VC Ratio, which is defined as the proportion of domestic VCs participating in thesyndicate. Also, this variable captures the possible influence of syndication on VC performance, as theoretically suggestedby Casamatta and Haritchabalet (2007) and empirically documented by Brander et al. (2002). As a robustness test, we havealso used a dummy variable to indicate whether or not there are local VCs in a syndicate. Our results remain qualitativelyunaltered after controlling for this factor.
We also control for VCs' experience using the logarithm of a VC firm's age (VC Experience) as a proxy following Lee and Wahal(2004) and Nahata (2008). As a further robustness test, following Sorensen (2007), we use the cumulative number of investmentrounds as a proxy for VC experience. All our findings remain qualitatively unchanged. Further, we have also calculated a VC firm'snetwork based on Hochberg et al. (2007) and a VC firm's reputation based on Nahata (2008) as additional characteristics of VCsand find these two factors to be highly correlated with VCs' experience. Our results also remain unaltered when we further con-trol for these two factors.
The size of a VC firm may be a good proxy for its quality (Gompers, 1996; Gompers and Lerner, 1999; Kaplan and Schoar,2005). Cumming and Dai (2011) further document that there is a concave (inverse U-shape) relationship between fund sizeand a portfolio company's performance measured as the probability of a successful exit. We control for the logarithm of a VCfirm's aggregate fundraising over the ten years prior to its first investment in a portfolio company (VC Size) and the squaredterm (VC Size Squared). As a robustness check, we also use a VC firm's capital under management to measure VC Size andits corresponding squared term, which leads to a reduction of about 2000 investment observations in sample size due to dataavailability. The results are largely the same.
As suggested in the theoretical studies by Kanniainen and Keuschnigg (2003, 2004) and empirical studies by Cumming (2006)and Cumming and Dai (2011), there is a tradeoff between a VC firm's portfolio size and the intensity of managerial advice,which will in turn influence performance. Hence, we further control for a VC firm's portfolio size measured by the logarithm ofthe number of companies in a VC firm's portfolio (VC Portfolio Size).
In terms of organizational structure, there is a distinction between traditional VCs and the so-called captive VCs. The latter areowned by financial institutions, corporations or governments (Bottazzi et al., 2008; Hellmann et al., 2008; Nahata, 2008). Whiletraditional VCs aim to maximize the value of limited partnerships, captive VCs may emphasize the strategic objectives of theirparents, sacrificing at times opportunities to maximize the value of their investments. In order to control for the impact of thisdifference in objectives on cross-border VC performance, we include two indicator variables on whether a VC firm is a corporateVC firm (Corporate VC Indicator) or an institutional VC firm (Institutional VC Indicator). Since government VCs constitute only avery small proportion of our sample, there is no need to control for them. Also, VCs from different countries may have differentbusiness training, experience and sorting ability. To control for the effect of a VC firm's country of origin on its cross-borderperformance, we include two indicator variables on whether a VC firm is located in Asia (Asia VC Indicator) or in Europe(Europe VC Indicator).
For the analysis of VC investments, we control for the above VC firm-related factors for each VC firm at the time of its firstinvestment in a portfolio company. For the analysis of portfolio companies, these factors are based on the lead VC firm at thetime when a portfolio company received its initial VC funding. Following Nahata (2008), we identify the lead VC firm for eachportfolio company as the VC firm that participated in the first round of financing and made the largest total investment in theportfolio company across all rounds.
Global VC market-related factors
Following Hochberg et al. (2007) and Nahata (2008), competition in the VC industry is expected to be negatively relatedto VC performance. To control for the effect of competition in the global VC industry on cross-border VC performance,we include the variable VC Industry Competition measured by the aggregate worldwide inflow of VC funds prior to the fundingyear.
Lerner (1994) suggests that it is every VC firm's intention to choose a good time to exit, especially if it wants to exit through anIPO. Gompers et al. (2008) indicate that VCs actively react to IPO market signals measured by Tobin-Q or VC-backed IPO activities.Jeng andWells (2000) also find that IPOs are the strongest driver of cross-border VC investments. Considering the fact that manycross-border VCs try to exit through the international market, we expect the likelihood of a successful exit to be dependent on theconditions in the global IPO and M&A markets. We use the number of VC-backed IPOs (IPO Market Conditions) and the number ofM&As with VC-backed portfolio companies as the targets (M&A Market Conditions) over a period of three months prior to an exit
45L. Wang, S. Wang / Journal of Empirical Finance 19 (2012) 26–50
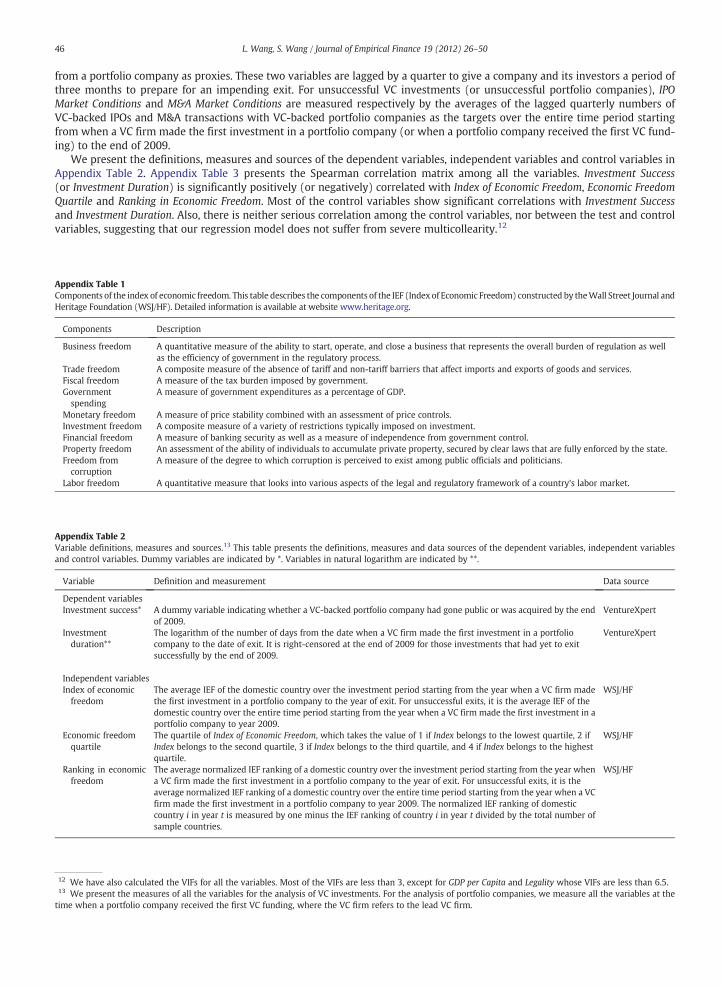
from a portfolio company as proxies. These two variables are lagged by a quarter to give a company and its investors a period ofthree months to prepare for an impending exit. For unsuccessful VC investments (or unsuccessful portfolio companies), IPOMarket Conditions and M&A Market Conditions are measured respectively by the averages of the lagged quarterly numbers ofVC-backed IPOs and M&A transactions with VC-backed portfolio companies as the targets over the entire time period startingfrom when a VC firm made the first investment in a portfolio company (or when a portfolio company received the first VC fund-ing) to the end of 2009.
We present the definitions, measures and sources of the dependent variables, independent variables and control variables inAppendix Table 2. Appendix Table 3 presents the Spearman correlation matrix among all the variables. Investment Success(or Investment Duration) is significantly positively (or negatively) correlated with Index of Economic Freedom, Economic FreedomQuartile and Ranking in Economic Freedom. Most of the control variables show significant correlations with Investment Successand Investment Duration. Also, there is neither serious correlation among the control variables, nor between the test and controlvariables, suggesting that our regression model does not suffer from severe multicollearity.12
Appendix Table 1Components of the index of economic freedom. This table describes the components of the IEF (Index of Economic Freedom) constructed by theWall Street Journal andHeritage Foundation (WSJ/HF). Detailed information is available at website www.heritage.org.
Components Description
Business freedom A quantitative measure of the ability to start, operate, and close a business that represents the overall burden of regulation as wellas the efficiency of government in the regulatory process.
Trade freedom A composite measure of the absence of tariff and non-tariff barriers that affect imports and exports of goods and services.Fiscal freedom A measure of the tax burden imposed by government.Governmentspending
A measure of government expenditures as a percentage of GDP.
Monetary freedom A measure of price stability combined with an assessment of price controls.Investment freedom A composite measure of a variety of restrictions typically imposed on investment.Financial freedom A measure of banking security as well as a measure of independence from government control.Property freedom An assessment of the ability of individuals to accumulate private property, secured by clear laws that are fully enforced by the state.Freedom fromcorruption
A measure of the degree to which corruption is perceived to exist among public officials and politicians.
Labor freedom A quantitative measure that looks into various aspects of the legal and regulatory framework of a country's labor market.
Appendix Table 2Variable definitions, measures and sources.13 This table presents the definitions, measures and data sources of the dependent variables, independent variablesand control variables. Dummy variables are indicated by *. Variables in natural logarithm are indicated by **.
Variable Definition and measurement Data source
Dependent variablesInvestment success* A dummy variable indicating whether a VC-backed portfolio company had gone public or was acquired by the end
of 2009.VentureXpert
Investmentduration**
The logarithm of the number of days from the date when a VC firm made the first investment in a portfoliocompany to the date of exit. It is right-censored at the end of 2009 for those investments that had yet to exitsuccessfully by the end of 2009.
VentureXpert
Independent variablesIndex of economicfreedom
The average IEF of the domestic country over the investment period starting from the year when a VC firm madethe first investment in a portfolio company to the year of exit. For unsuccessful exits, it is the average IEF of thedomestic country over the entire time period starting from the year when a VC firm made the first investment in aportfolio company to year 2009.
WSJ/HF
Economic freedomquartile
The quartile of Index of Economic Freedom, which takes the value of 1 if Index belongs to the lowest quartile, 2 ifIndex belongs to the second quartile, 3 if Index belongs to the third quartile, and 4 if Index belongs to the highestquartile.
WSJ/HF
Ranking in economicfreedom
The average normalized IEF ranking of a domestic country over the investment period starting from the year whena VC firm made the first investment in a portfolio company to the year of exit. For unsuccessful exits, it is theaverage normalized IEF ranking of a domestic country over the entire time period starting from the year when a VCfirm made the first investment in a portfolio company to year 2009. The normalized IEF ranking of domesticcountry i in year t is measured by one minus the IEF ranking of country i in year t divided by the total number ofsample countries.
WSJ/HF
12 We have also calculated the VIFs for all the variables. Most of the VIFs are less than 3, except for GDP per Capita and Legality whose VIFs are less than 6.5.13 We present the measures of all the variables for the analysis of VC investments. For the analysis of portfolio companies, we measure all the variables at thetime when a portfolio company received the first VC funding, where the VC firm refers to the lead VC firm.
46 L. Wang, S. Wang / Journal of Empirical Finance 19 (2012) 26–50
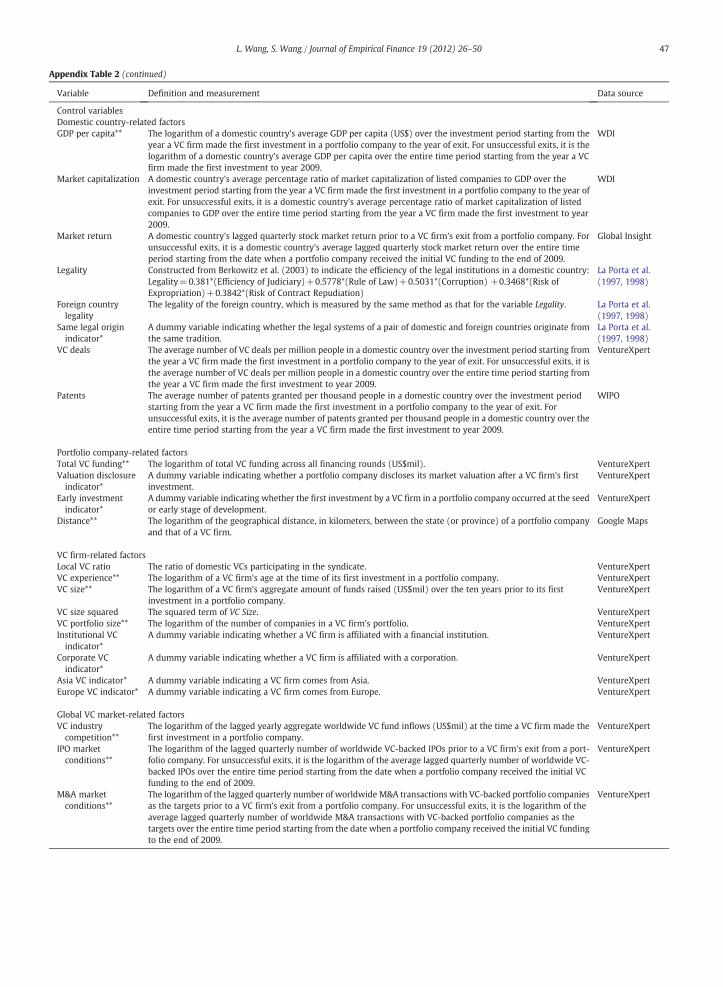
Appendix Table 2 (continued)
Variable Definition and measurement Data source
Control variablesDomestic country-related factorsGDP per capita** The logarithm of a domestic country's average GDP per capita (US$) over the investment period starting from the
year a VC firm made the first investment in a portfolio company to the year of exit. For unsuccessful exits, it is thelogarithm of a domestic country's average GDP per capita over the entire time period starting from the year a VCfirm made the first investment to year 2009.
WDI
Market capitalization A domestic country's average percentage ratio of market capitalization of listed companies to GDP over theinvestment period starting from the year a VC firm made the first investment in a portfolio company to the year ofexit. For unsuccessful exits, it is a domestic country's average percentage ratio of market capitalization of listedcompanies to GDP over the entire time period starting from the year a VC firm made the first investment to year2009.
WDI
Market return A domestic country's lagged quarterly stock market return prior to a VC firm's exit from a portfolio company. Forunsuccessful exits, it is a domestic country's average lagged quarterly stock market return over the entire timeperiod starting from the date when a portfolio company received the initial VC funding to the end of 2009.
Global Insight
Legality Constructed from Berkowitz et al. (2003) to indicate the efficiency of the legal institutions in a domestic country:Legality=0.381*(Efficiency of Judiciary)+0.5778*(Rule of Law)+0.5031*(Corruption) +0.3468*(Risk ofExpropriation)+0.3842*(Risk of Contract Repudiation)
La Porta et al.(1997, 1998)
Foreign countrylegality
The legality of the foreign country, which is measured by the same method as that for the variable Legality. La Porta et al.(1997, 1998)
Same legal originindicator*
A dummy variable indicating whether the legal systems of a pair of domestic and foreign countries originate fromthe same tradition.
La Porta et al.(1997, 1998)
VC deals The average number of VC deals per million people in a domestic country over the investment period starting fromthe year a VC firm made the first investment in a portfolio company to the year of exit. For unsuccessful exits, it isthe average number of VC deals per million people in a domestic country over the entire time period starting fromthe year a VC firm made the first investment to year 2009.
VentureXpert
Patents The average number of patents granted per thousand people in a domestic country over the investment periodstarting from the year a VC firm made the first investment in a portfolio company to the year of exit. Forunsuccessful exits, it is the average number of patents granted per thousand people in a domestic country over theentire time period starting from the year a VC firm made the first investment to year 2009.
WIPO
Portfolio company-related factorsTotal VC funding** The logarithm of total VC funding across all financing rounds (US$mil). VentureXpertValuation disclosureindicator*
A dummy variable indicating whether a portfolio company discloses its market valuation after a VC firm's firstinvestment.
VentureXpert
Early investmentindicator*
A dummy variable indicating whether the first investment by a VC firm in a portfolio company occurred at the seedor early stage of development.
VentureXpert
Distance** The logarithm of the geographical distance, in kilometers, between the state (or province) of a portfolio companyand that of a VC firm.
Google Maps
VC firm-related factorsLocal VC ratio The ratio of domestic VCs participating in the syndicate. VentureXpertVC experience** The logarithm of a VC firm's age at the time of its first investment in a portfolio company. VentureXpertVC size** The logarithm of a VC firm's aggregate amount of funds raised (US$mil) over the ten years prior to its first
investment in a portfolio company.VentureXpert
VC size squared The squared term of VC Size. VentureXpertVC portfolio size** The logarithm of the number of companies in a VC firm's portfolio. VentureXpertInstitutional VCindicator*
A dummy variable indicating whether a VC firm is affiliated with a financial institution. VentureXpert
Corporate VCindicator*
A dummy variable indicating whether a VC firm is affiliated with a corporation. VentureXpert
Asia VC indicator* A dummy variable indicating a VC firm comes from Asia. VentureXpertEurope VC indicator* A dummy variable indicating a VC firm comes from Europe. VentureXpert
Global VC market-related factorsVC industrycompetition**
The logarithm of the lagged yearly aggregate worldwide VC fund inflows (US$mil) at the time a VC firm made thefirst investment in a portfolio company.
VentureXpert
IPO marketconditions**
The logarithm of the lagged quarterly number of worldwide VC-backed IPOs prior to a VC firm's exit from a port-folio company. For unsuccessful exits, it is the logarithm of the average lagged quarterly number of worldwide VC-backed IPOs over the entire time period starting from the date when a portfolio company received the initial VCfunding to the end of 2009.
VentureXpert
M&A marketconditions**
The logarithm of the lagged quarterly number of worldwide M&A transactions with VC-backed portfolio companiesas the targets prior to a VC firm's exit from a portfolio company. For unsuccessful exits, it is the logarithm of theaverage lagged quarterly number of worldwide M&A transactions with VC-backed portfolio companies as thetargets over the entire time period starting from the date when a portfolio company received the initial VC fundingto the end of 2009.
VentureXpert
47L. Wang, S. Wang / Journal of Empirical Finance 19 (2012) 26–50
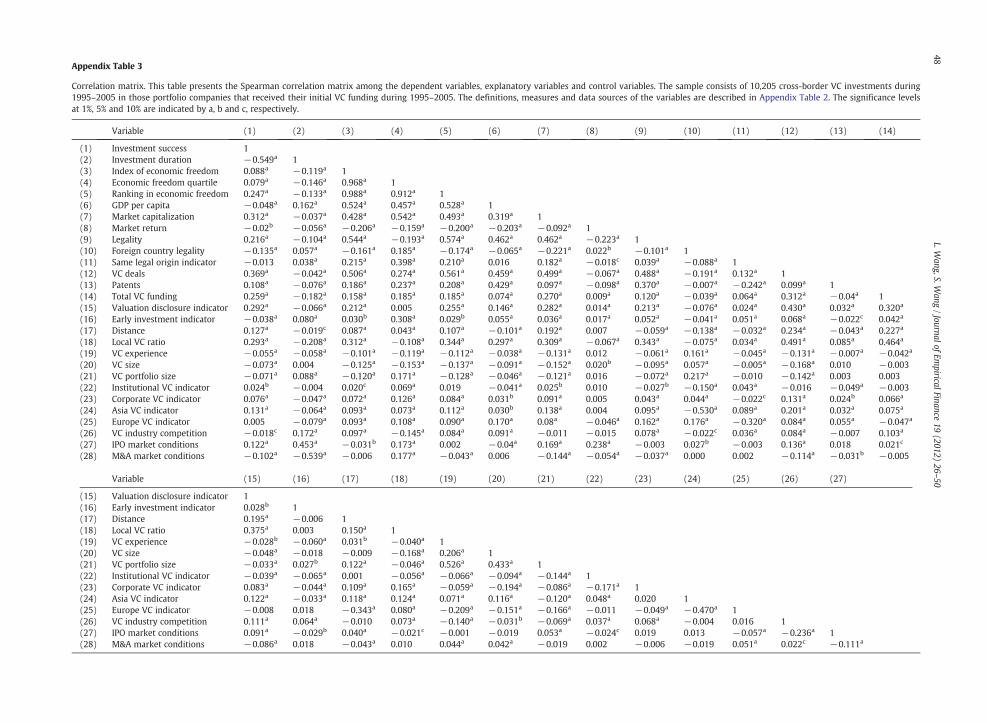
Correlation matrix. This table presents the Spearman correlation matrix among the dependent variables, explanatory variables and control variables. The sample consists of 10,205 cross-border VC investments during1995–2005 in those portfolio companies that received their initial VC funding during 1995–2005. The definitions, measures and data sources of the variables are described in Appendix Table 2. The significance levelsat 1%, 5% and 10% are indicated by a, b and c, respectively.
Variable (1) (2) (3) (4) (5) (6) (7) (8) (9) (10) (11) (12) (13) (14)
(1) Investment success 1(2) Investment duration −0.549a 1(3) Index of economic freedom 0.088a −0.119a 1(4) Economic freedom quartile 0.079a −0.146a 0.968a 1(5) Ranking in economic freedom 0.247a −0.133a 0.988a 0.912a 1(6) GDP per capita −0.048a 0.162a 0.524a 0.457a 0.528a 1(7) Market capitalization 0.312a −0.037a 0.428a 0.542a 0.493a 0.319a 1(8) Market return −0.02b −0.056a −0.206a −0.159a −0.200a −0.203a −0.092a 1(9) Legality 0.216a −0.104a 0.544a −0.193a 0.574a 0.462a 0.462a −0.223a 1(10) Foreign country legality −0.135a 0.057a −0.161a 0.185a −0.174a −0.065a −0.221a 0.022b −0.101a 1(11) Same legal origin indicator −0.013 0.038a 0.215a 0.398a 0.210a 0.016 0.182a −0.018c 0.039a −0.088a 1(12) VC deals 0.369a −0.042a 0.506a 0.274a 0.561a 0.459a 0.499a −0.067a 0.488a −0.191a 0.132a 1(13) Patents 0.108a −0.076a 0.186a 0.237a 0.208a 0.429a 0.097a −0.098a 0.370a −0.007a −0.242a 0.099a 1(14) Total VC funding 0.259a −0.182a 0.158a 0.185a 0.185a 0.074a 0.270a 0.009a 0.120a −0.039a 0.064a 0.312a −0.04a 1(15) Valuation disclosure indicator 0.292a −0.066a 0.212a 0.005 0.255a 0.146a 0.282a 0.014a 0.213a −0.076a 0.024a 0.430a 0.032a 0.320a
(16) Early investment indicator −0.038a 0.080a 0.030b 0.308a 0.029b 0.055a 0.036a 0.017a 0.052a −0.041a 0.051a 0.068a −0.022c 0.042a
(17) Distance 0.127a −0.019c 0.087a 0.043a 0.107a −0.101a 0.192a 0.007 −0.059a −0.138a −0.032a 0.234a −0.043a 0.227a
(18) Local VC ratio 0.293a −0.208a 0.312a −0.108a 0.344a 0.297a 0.309a −0.067a 0.343a −0.075a 0.034a 0.491a 0.085a 0.464a
(19) VC experience −0.055a −0.058a −0.101a −0.119a −0.112a −0.038a −0.131a 0.012 −0.061a 0.161a −0.045a −0.131a −0.007a −0.042a
(20) VC size −0.073a 0.004 −0.125a −0.153a −0.137a −0.091a −0.152a 0.020b −0.095a 0.057a −0.005a −0.168a 0.010 −0.003(21) VC portfolio size −0.071a 0.088a −0.120a 0.171a −0.128a −0.046a −0.121a 0.016 −0.072a 0.217a −0.010 −0.142a 0.003 0.003(22) Institutional VC indicator 0.024b −0.004 0.020c 0.069a 0.019 −0.041a 0.025b 0.010 −0.027b −0.150a 0.043a −0.016 −0.049a −0.003(23) Corporate VC indicator 0.076a −0.047a 0.072a 0.126a 0.084a 0.031b 0.091a 0.005 0.043a 0.044a −0.022c 0.131a 0.024b 0.066a
(24) Asia VC indicator 0.131a −0.064a 0.093a 0.073a 0.112a 0.030b 0.138a 0.004 0.095a −0.530a 0.089a 0.201a 0.032a 0.075a
(25) Europe VC indicator 0.005 −0.079a 0.093a 0.108a 0.090a 0.170a 0.08a −0.046a 0.162a 0.176a −0.320a 0.084a 0.055a −0.047a
(26) VC industry competition −0.018c 0.172a 0.097a −0.145a 0.084a 0.091a −0.011 −0.015 0.078a −0.022c 0.036a 0.084a −0.007 0.103a
(27) IPO market conditions 0.122a 0.453a −0.031b 0.173a 0.002 −0.04a 0.169a 0.238a −0.003 0.027b −0.003 0.136a 0.018 0.021c
(28) M&A market conditions −0.102a −0.539a −0.006 0.177a −0.043a 0.006 −0.144a −0.054a −0.037a 0.000 0.002 −0.114a −0.031b −0.005
Variable (15) (16) (17) (18) (19) (20) (21) (22) (23) (24) (25) (26) (27)
(15) Valuation disclosure indicator 1(16) Early investment indicator 0.028b 1(17) Distance 0.195a −0.006 1(18) Local VC ratio 0.375a 0.003 0.150a 1(19) VC experience −0.028b −0.060a 0.031b −0.040a 1(20) VC size −0.048a −0.018 −0.009 −0.168a 0.206a 1(21) VC portfolio size −0.033a 0.027b 0.122a −0.046a 0.526a 0.433a 1(22) Institutional VC indicator −0.039a −0.065a 0.001 −0.056a −0.066a −0.094a −0.144a 1(23) Corporate VC indicator 0.083a −0.044a 0.109a 0.165a −0.059a −0.194a −0.086a −0.171a 1(24) Asia VC indicator 0.122a −0.033a 0.118a 0.124a 0.071a 0.116a −0.120a 0.048a 0.020 1(25) Europe VC indicator −0.008 0.018 −0.343a 0.080a −0.209a −0.151a −0.166a −0.011 −0.049a −0.470a 1(26) VC industry competition 0.111a 0.064a −0.010 0.073a −0.140a −0.031b −0.069a 0.037a 0.068a −0.004 0.016 1(27) IPO market conditions 0.091a −0.029b 0.040a −0.021c −0.001 −0.019 0.053a −0.024c 0.019 0.013 −0.057a −0.236a 1(28) M&A market conditions −0.086a 0.018 −0.043a 0.010 0.044a 0.042a −0.019 0.002 −0.006 −0.019 0.051a 0.022c −0.111a
Appendix Table 3
48L.W
ang,S.Wang
/JournalofEm
piricalFinance19
(2012)26
–50
References
Ahlstrom, D., Bruton, G., 2006. Venture capital in emerging economies: networks and institutional change. Entrep. Theory Pract. 30 (2), 299–320.Aizenman, J., Kendall, J., 2008. The internationalization of venture capital and private equity. Working Paper. University of California.Allen, F., Qian, J., Qian, M., 2005. Law, finance, and economic growth in China. J. Financ. Econ. 77 (1), 57–116.Armour, J., Cumming, D., 2006. The legislative road to Silicon Valley. Oxf. Econ. Pap. 58 (4), 596–635.Arrow, K., Debreu, G., 1954. Existence of equilibrium for a competitive economy. Econometrica 22 (3), 265–290.Balcarcel, A., Hertzel, M., Lindsey, L., 2009. Contracting frictions and cross-border capital flows: evidence from venture capital. Working PaperArizona State University.Barro, R., 1991. Economic growth in a cross section of countries. Q. J. Econ. 106 (2), 407–443.Barro, R., 1996. Democracy and growth. J. Econ. Growth 1 (1), 1–27.Barry, C., Muscarella, C., Peavy, J., Vetsuypens, M., 1990. The role of venture capital in the creation of public companies: evidence from the going-public process.
J. Financ. Econ. 27 (2), 447–471.Bayar, O., Chemmanur, T., forthcoming. IPOs versus acquisitions and the valuation premium puzzle: a theory of exit choice by entrepreneurs and venture
capitalists. Journal of Financial and Quantitative Analysis.Berggren, N., 1999. Economic freedom and equality: friends or foes? Public Choice 100 (3–4), 203–223.Berkowitz, D., Pistor, K., Richard, J., 2003. Economic development, legality and the transplant effect. Eur. Econ. Rev. 47 (1), 165–195.BjØrnskov, C., Foss, N., 2008. Economic freedom and entrepreneurial activity: some cross-country evidence. Public Choice 134 (3), 307–328.Black, B., Gilson, R., 1998. Venture capital and the structure of capital markets: banks versus stock markets. J. Financ. Econ. 47 (3), 243–277.Bottazzi, L., Da Rin, M., Hellmann, T., 2008. Who are the active investors? Evidence from venture capital. J. Financ. Econ. 89 (3), 488–512.Brander, J., Amit, R., Antweiler, W., 2002. Venture capital syndication: improved venture selection versus the value-added hypothesis. J. Econ. Manag. Strateg.
11 (3), 423–452.Brau, J., Francis, F., Kohers, N., 2003. The choice of IPO versus takeover: empirical evidence. J. Bus. 76 (4), 583–612.Bruton, G., Ahlstrom, D., Yeh, K., 2004. Understanding venture capital in East Asia: the impact of institutions on the industry today and tomorrow. J. World
Bus. 39 (1), 72–88.Carlsson, F., Lundstrom, S., 2002. Economic freedom and growth: decomposing the effects. Public Choice 112 (3–4), 335–344.Casamatta, C., Haritchabalet, C., 2007. Experience, screening and syndication in venture capital investments. J. Financ. Intermed. 16 (3), 368–398.Chemmanur, T., Hull, T., Krishnan, K., 2011. Do local and international venture capitalists play well together? A study of international venture capital investments.
: Working PaperBoston College.Cochrane, J., 2005. The risk and return of venture capital. J. Financ. Econ. 75 (1), 3–52.Cornelli, F., Yosha, O., 2003. Stage financing and the role of convertible securities. Rev. Econ. Stud. 70 (1), 1–32.Cumming, D., 2006. The determinants of venture capital portfolio size: empirical evidence. J. Bus. 79 (3), 1083–1126.Cumming, D., 2008. Contracts and exits in venture capital finance. Rev. Financ. Stud. 21 (5), 1947–1982.Cumming, D., Dai, N., 2010. Local bias in venture capital investments. J. Empir. Financ. 17 (3), 362–380.Cumming, D., Dai, N., 2011. Fund size, limited attention and valuation of venture capital backed firms. J. Empir. Financ. 18 (1), 2–15.Cumming, D., Johan, S., 2010. Venture capital investment duration. J. Small Bus. Manage. 48 (2), 228–257.Cumming, D., Li, D., 2009. Public policy and business creation in the United States. Wording Paper. York University.Cumming, D., MacIntosh, J., 2003. A cross-country comparison of full and partial venture capital exits. J. Bank. Financ. 27 (3), 511–548.Cumming, D., Walz, U., 2010. Private equity returns and disclosure around the world. J. Int. Bus. Stud. 41 (4), 727–754.Cumming, D., Fleming, G., Schwienbacher, A., 2006. Legality and venture capital exits. J. Finance 12 (2), 214–245.Cumming, D., Fleming, G., Schwienbacher, A., 2009. Corporate relocation in venture capital finance. Entrep. Theory Pract. 33 (5), 1121–1155.Cumming, D., Schmidt, D., Walz, U., 2010. Legality and venture governance around the world. J. Bus. Ventur. 25 (1), 54–72.Dai, N., Jo, H., Kassicieh, S., 2010. Cross-border venture capital investments: selection and performance. Working Paper. State University of New York.Du, Q., Vertinsky, I., 2008. Risk mitigation strategies of foreign venture capitalists in China. Working Paper. University of British Columbia.Durnev, A., Kim, E., 2005. To steal or not to steal: firm attributes, legal environment and valuation. J. Finance 60 (3), 1461–1493.Esposto, A., Zaleski, P., 1999. Economic freedom and the quality of life: an empirical analysis. Constit. Polit. Econ. 10 (2), 185–197.Feldmann, H., 2007. Economic freedom and unemployment around the world. South. Econ. J. 74 (1), 158–176.Feldmann, H., 2008. Business regulation and labor market performance around the world. J. Regul. Econ. 33 (2), 201–235.Giot, P., Schwienbacher, A., 2007. IPOs, trade sales and liquidations: modelling venture capital exits using survival analysis. J. Bank. Finance 31 (3), 679–702.Goel, R., Nelson, M., 2005. Economic freedom versus political freedom: cross-country influences on corruption. Aust. Econ. Pap. 44 (2), 121–133.Gompers, P., 1996. Grandstanding in the venture capital industry. J. Financ. Econ. 42 (1), 133–156.Gompers, P., Lerner, J., 1999. An analysis of compensation in the U.S. venture capital partnership. J. Financ. Econ. 51 (1), 3–44.Gompers, P., Lerner, J., 2000. The determinants of corporate venture capital successes: organizational structure, incentives and complementarities. In: Morck, R.
(Ed.), Concentrated Corporate Ownership. University of Chicago Press for NBER, pp. 17–50.Gompers, P., Lerner, J., Desai, M., 2003. The two faces of entrepreneurship: evidence from Eastern and Western Europe. Working Paper. Harvard University.Gompers, P., Kovner, A., Lerner, J., Scharfstein, D., 2008. Venture capital investment cycles: the impact of public markets. J. Financ. Econ. 87 (1), 1–23.Gompers, P., Kovner, A., Lerner, L., Scharfstein, D., 2010. Performance persistence in entrepreneurship. J. Financ. Econ. 96 (1), 18–32.Gwartney, J., Lawson, R., Holcombe, R., 1999. Economic freedom and the environment for economic growth. J Inst. Theor. Econ. 155 (4), 1–21.Haan, F., Sturm, J., 2000. On the relationship between economic freedom and economic growth. Eur. J. Polit. Econ. 16 (2), 215–241.Hart, O., 1980. Perfect competition and optimal product differentiation. J. Econ. Theory 22 (2), 279–312.Heckelman, J., 2000. Economic freedom and economic growth: a short-run causal investigation. J. Appl. Econ. 3 (1), 71–91.Hellmann, T., Lindsey, L., Puri, M., 2008. Building relationships early: banks in venture capital. Rev. Financ. Stud. 21 (2), 513–541.Hochberg, Y., Ljungqvist, A., Lu, Y., 2007. Whom you know matters: venture capital networks and investment performance. J. Finance 62 (1), 251–301.Jeng, L., Wells, P., 2000. The determinants of venture capital funding: evidence across countries. J. Corp. Financ. 6 (3), 241–289.Kanniainen, V., Keuschnigg, C., 2003. The optimal portfolio of start-up firms in venture capital finance. J. Corp. Financ. 9 (5), 521–534.Kanniainen, V., Keuschnigg, C., 2004. Start-up investment with scarce venture capital support. J. Bank. Finance 28 (8), 1935–1959.Kaplan, S., Schoar, A., 2005. Private equity performance: returns, persistence and capital flows. J. Finance 60 (4), 1791–1823.Kaplan, S., Strömberg, P., 2003. Financial contracting theory meets the real world: an empirical analysis of venture capital contracts. Rev. Econ. Stud. 70 (2),
281–315.Kaplan, S., Sensoy, B., Strömberg, P., 2002. How well do venture capital databases reflect actual investments? Working Paper. University of Chicago.Kortum, S., Lerner, J., 2000. Assessing the contribution of venture capital to innovation. RAND J. Econ. 31 (4), 674–692.Kreft, S., Sobel, R., 2005. Public policy, entrepreneurship, and economic freedom. Cato J. 25 (3), 595–616.La Porta, R., Lopez-de-Silanes, F., Shleifer, A., Vishny, R., 1997. Legal determinants of external finance. J. Finance 52 (3), 1131–1150.La Porta, R., Lopez-de-Silanes, F., Shleifer, A., Vishny, R., 1998. Law and finance. J. Polit. Econ. 106 (6), 1113–1155.Lee, P., Wahal, S., 2004. Grandstanding, certification and the underpricing of venture capital backed IPOs. J. Financ. Econ. 73 (2), 375–407.Lerner, J., 1994. Venture capitalists and the decision to go public. J. Financ. Econ. 35 (3), 293–316.Lerner, J., Schoar, A., 2005. Does legal enforcement affect financial transactions? The contractual channel in private equity. Q. J. Econ. 120 (1), 223–246.Lockett, A., Wrights, M., Sapienza, H., Pruthi, S., 2002. Venture capital investors, valuation and information: a comparative study of the US, Hong Kong, India and
Singapore. Venture Cap.: Int. J. Entrep. Finance 4 (3), 237–252.Loughran, T., Ritter, J., Rydqvist, K., 1994. Initial public offerings: international insights. Pacific-Basin Finance J. 2 (2–3), 165–199.
49L. Wang, S. Wang / Journal of Empirical Finance 19 (2012) 26–50
Lowry, M., 2003. Why does IPO volume fluctuate so much? J. Financ. Econ. 67 (1), 3–40.Mäkelä, M., Maula, M., 2008. Attracting cross-border venture capital: the role of a local investor. Entrep. Reg. Dev. 20 (3), 237–257.Mayer, C., Schoors, K., Yafeh, Y., 2005. Sources of funds and investment activities of venture capital funds: evidence from Germany, Israel, Japan and the United
Kingdom. J. Corp. Financ. 11 (3), 586–608.McGee, R., 2008. Fiscal freedom in transition economies and the OECD: a comparative study. In: McGee, R. (Ed.), Taxation and public finance in transition and
developing economies. Springer Press, New York, pp. 93–118.McKenzie, L., 1959. On the existence of general equilibrium for a competitive market. Econometrica 27 (1), 54–71.McMullen, J., Bagby, D., Palich, L., 2008. Economic freedom and the motivation to engage in entrepreneurial action. Entrep. Theory Pract. 32 (5), 875–895.Nahata, R., 2008. Venture capital reputation and investment performance. J. Financ. Econ. 90 (1), 127–151.Neher, D., 1999. Staged financing: an agency prospective. Rev. Econ. Stud. 66 (2), 255–274.Nyström, K., 2008. The institutions of economic freedom and entrepreneurship: evidence from panel data. Public Choice 136 (3), 269–282.Petersen, M., 2009. Estimating standard errors in finance panel data sets: comparing approaches. Rev. Financ. Stud. 22 (1), 435–480.Poulsen, A., Stegemoller, M., 2008. Moving from private to public ownership: selling out to public firms versus initial public offerings. Finan. Manage. 37 (1), 81–101.Sahlman, W., 1990. The structure and governance of venture-capital organizations. J. Financ. Econ. 27 (2), 473–521.Schertler, A., Tykvová, T., 2011. Venture capital and internationalization. International Business Review 20 (4), 423–439.Schwienbacher, A., 2008. Venture capital investment practices in Europe and the United States. Finan. Mark. Portfolio Manage. 22 (3), 195–217.Scully, G., 2002. Economic freedom, government policy and the trade-off between equity and economic growth. Public Choice 113 (1–2), 77–96.Smith, A., 1776. An inquiry into the nature and causes of the wealth of nations. University of Chicago Press, Chicago.Sobel, R., Clark, J., Lee, D., 2007. Freedom, barriers to entry, entrepreneurship and economic progress. Rev. Aust. Econ. 20 (4), 221–236.Sorensen, M., 2007. How smart is smart money? A two-sided matching model of venture capital. J. Finance 62 (6), 2725–2762.Tian, X., 2011. The causes and consequences of venture capital stage financing. J. Financ. Econ. 101 (1), 132–159.Tykvová, T., Schertler, A., 2011. Cross-border venture capital flows and local ties: evidence from developed countries. Q. Rev. Econ. Financ. 51 (1), 36–48.Vanssay, X., Spindler, Z., 1994. Freedom and growth: do constitutions matter? Public Choice 78 (3–4), 359–372.Wang, L., Wang, S., 2011. Cross-Border venture capital performance: evidence from China. Pacific-Basin Finance J. 19 (1), 71–97.Wang, S., Zhou, H., 2004. Staged financing in venture capital: moral hazard and risks. J. Corp. Financ. 10 (1), 131–155.Watson, S., George, A., 2010. Host country effects on the success of international private equity investments. J. Priv. Equity 13 (4), 17–24.Wennekers, S., Uhlander, L., Thurik, R., 2002. Entrepreneurship and its conditions: a macro perspective. Int. J. Entrep. Educ. 1 (1), 25–65.White, H., 1980. A heteroskedasticity-consistent covariance matrix estimator and a direct test for heteroskedasticity. Econometrica 48 (4), 817–838.Wu, W., Davis, O., 1999. The two freedoms, economic growth and development: an empirical study. Public Choice 100 (1–2), 39–64.Zarutskie, R., 2007. Do venture capitalists affect investment performance? Evidence from first-time funds. Working Paper. Duke University.
50 L. Wang, S. Wang / Journal of Empirical Finance 19 (2012) 26–50