Embed Size (px)
Citation preview
Economic Evaluation of the Northern Pikeminnow Management Program
prepared by
Hans D. Radtke Christopher N. Carter
Shannon W. Davis
prepared for
Pacific States Marine Fisheries Commission
June 2004

i kco D:\Data\Documents\hr\PikeminnowRpt.doc
PREFACE
This report describes economic analysis results for the Northern Pikeminnow Management Program (NPMP). The northern pikeminnow is an indigenous species to the Columbia and Snake rivers that preys on outmigrating salmon and steelhead. The NPMP goal is to reduce the fish population's larger size class that does the predation. This has been accomplished with a variety of selective fishery methods of which a sport fishing catch's payment component has accounted for the highest proportion of the culling. The study purpose was to respond to the Northwest Power and Conservation Council's (NPCC's) Independent Scientific Review Panel's (ISRP's) comments about the lack of economic considerations in the program's evaluation and monitoring. The study was sponsored by the Pacific States Marine Fisheries Commission (PSMFC). Russell Porter, Program Director of the Pacific Fishery Management Council (PFMC) provided leadership and oversight for the study. The report's authors were Hans Radtke, Chris Carter, and Shannon Davis. Dr. Radtke is a freelance economist living in Yachats, Oregon. He is a past chairman of the PFMC and currently is a member of the PFMC Scientific and Statistical Committee (SSC). Dr. Carter is a recently retired economist from the Oregon Department of Fish and Wildlife (ODFW). Mr. Davis is a systems research specialist with 25 years of experience. His professional interests are in single/multiuse natural resource planning and management with a specialty in econometric modeling. Mr. Davis served two terms on the SSC. He has completed many projects involving natural resource user surveys. The following individuals provided valuable insight and perspective about the NPMP. They of course bear no responsibility for any misrepresentations in the authors' interpretations of the communication.
David G. Hankin, Chair, Department of Fisheries Biology, Humboldt State University Susan S. Hanna, Professor, Department of Agricultural and Resource Economics, Oregon
State University Terry H. Morlan, Manager, Economic Analysis, NPCC Jack Richards, Assistant Professor of Economics, Portland State University John Skidmore, Pikeminnow Program Manager, Bonneville Power Administration Dave Ward, Columbia River Investigations Program Leader, ODFW Eric Winther, Biological Project Leader, Washington Department of Fish and Wildlife
(WDFW)
PSMFC staff and cooperating agencies' representatives reviewed this report in draft form. The purpose of the review was to provide candid and critical comments that were to assist in making study results as sound as possible and to ensure that the report meets standards for objectivity, evidence, and responsiveness to the study charges. Although the reviewers have provided many useful comments and suggestions, they were not asked to endorse study findings and recommendations. The authors are solely responsible for making certain independent examination of this report was carried out in accordance with accustomed procedures and that review comments were carefully considered.

ii kco D:\Data\Documents\hr\PikeminnowRpt.doc
The authors' interpretations and conclusions should prove valuable for the project's purposes, but no absolute assurances can be given that the described results will be realized. Government legislation and policies, marketing circumstances, and other situations can affect the basis of assumptions in unpredictable ways and lead to unanticipated changes. The methodologies used to determine estimates were adopted with the understanding that technically sound and defensible approaches would be used. Where judgment was necessary, conservative interpretation was employed. Because this philosophy was strictly adhered to in all aspects of the report, the authors represent that the descriptions presented herein are reasonable. The information should not be used for investment or operational decision making. The authors do not assume any liability for the information and shall not be responsible for any direct, indirect, special, incidental, or consequential damages in connection with the use of the information. Authorization is granted for the study report's contents to be quoted either orally or in written form without prior consent of the authors. Customary reference to authorship, however, is requested.

iii kco D:\Data\Documents\hr\PikeminnowRpt.doc
TABLE OF CONTENTS
Page
Preface .............................................................................................................................................. i Table of Contents........................................................................................................................... iii Executive Summary .........................................................................................................................v I. INTRODUCTION
A. Program Definition ...............................................................................................I-1 B. Background...........................................................................................................I-4 C. Economic Analysis Approach...............................................................................I-9
II. ECONOMIC ANALYSIS A. Methods............................................................................................................... II-1
1. Net Economic Value 2. Regional Economic Impacts 3. Cost-Effectiveness Analysis
B. Results............................................................................................................... II-15 1. Net Economic Value 2. Regional Economic Impacts 3. Cost-Effectiveness Analysis
III. REWARD SYSTEM EVALUATION A. Participant Surveys ............................................................................................ III-1 B. Trial Survey Results........................................................................................... III-2 C. Angler Demand.................................................................................................. III-4
IV. SUMMARY AND DISCUSSION A. Previous Economic Studies' Recommendations ................................................ IV-1 B. Summary of the Present Study Economic Analysis .......................................... IV-2 C. Present Study's Recommendations .................................................................... IV-3
1. Findings 2. Conclusions
V. BIBLIOGRAPHY
LIST OF TABLES
Table I.1: Annual Catch, Effort, and Exploitation Rate ........................................................I-6 Table II.1: Modeling Assumptions for Economic Analysis Approaches by Program
Effects ................................................................................................................. II-2 Table II.2: Hatchery Release, Smolt-to-Adult Survival Rates, and Harvest Level
Assumptions for Three Alternatives Considered for Estimating Adult Salmonid Returns-to-Fisheries............................................................................ II-3
iv kco D:\Data\Documents\hr\PikeminnowRpt.doc
TABLE OF CONTENTS (CONT.) Page
LIST OF TABLES (CONT.)
Table II.3: Smolt-to-Adult Survival Rates for Columbia River Basin Hatchery Origin Fish by Areas of Releases for the Three Alternatives......................................... II-4
Table II.4: Anadromous Fish Net Economic Value and Regional Economic Impacts Modeling Factors ................................................................................................ II-5
Table II.5: Comparable Commercial Fishing Operation for Highliner Anglers in 2002 ... II-13 Table II.6: Northern Pikeminnow Fishery Angler Activity in 2002................................... II-17 Table II.7: Economic Analysis Results for Northern Pikeminnow Fishery Angler
Activity in 2002 ................................................................................................ II-17 Table II.8: Net Economic Value and Regional Economic Impacts From Harvests of
Columbia River Basin Produced Salmon and Steelhead Due to Increased Outmigration Survival ...................................................................................... II-18
Table II.9: Regional Economic Impacts From Program Administration at Columbia River Area Economies in 2002 ......................................................................... II-18
Table II.10: Effects of Northern Pikeminnow Management Program 1991 to 1996 ........... II-19 Table II.11: Northern Pikeminnow Management Program Costs and Harvests 1990 to
2004................................................................................................................... II-19 Table II.12: Cost-Effectiveness Analysis Using Selected Downstream Migration
Survival Improvement Actions ......................................................................... II-20 Table IV.1: Northern Pikeminnow Management Program Economic Evaluation in
2002.................................................................................................................... IV-3
LIST OF FIGURES
Figure I.1: Mid-Range Model Estimate for Percent Northern Pikeminnow Predation Reduction ..............................................................................................................I-7
Figure I.2: Sport Reward Catch by Tier Group in 1995 to 2003 ............................................I-8 Figure I.3: Sport Reward Catch, Effort, and Catch Per Unit Effort in 1991 to 2003 .............I-8 Figure II.1: The Fisheries Economic Assessment Model Process ....................................... II-12 Figure III.1: Angler Demand Curve for Reward Changes and Trip Cost Assumptions ........ III-5
LIST OF MAPS
Map I.1: Angler Registration Station Locations in 2004.....................................................I-2
APPENDICES
A. Questionnaire B. Increase in Harvestable Adults, Regional Economic Impacts, and Net Economic Values
of Anadromous Fishing Due to Increased Salmonid Juvenile Survival of the Northern Pikeminnow Management Program

v kco D:\Data\Documents\hr\PikeminnowRpt.doc
EXECUTIVE SUMMARY
The Northern Pikeminnow Management Program (NPMP) has been underway for the last 13 years. The purpose of the NPMP is to reduce predation by northern pikeminnow of downstream migrating juvenile salmonids. The NPMP is presently centered around a recreational reward fishery where anglers are compensated for catching and removing larger size class pikeminnow that do the predation. The annual budget has varied from $2.0 to $6.4 million, with an average of about $3.0 million. The NPMP has met one of its goals in every year but two in the last 13 years to attain a 10 percent exploitation rate on the larger size class pikeminnow. Two previous groups reviewed the NPMP for economic considerations. The earlier studies concluded that the sport-reward fishery was the most cost-effective fishery of all northern pikeminnow predation reduction techniques tried. Other techniques have included such methods as purse seining, longlining, site-specific gillnetting, and dam angling. All of these techniques have been discontinued after the 2002 season. The sport-reward program is popular with its participants, because it provides recreational opportunity, some financial payments, and a positive psychological reward for being involved in a salmon enhancement program. The earlier studies suggested that further investigation of the reward system should be undertaken. More information is needed to define the market and the response of potential anglers to incentives to take part in the NPMP. The earlier studies and other biological reviews discussed the limits of increasing the predator removal programs. The limit to the larger size class exploitation rate is probably at or close to the current program. (It is estimated that predation on juvenile salmonids was reduced by approximately 25 percent from the NPMP through Year 1996.) Any larger removal program would most likely be more expensive per predator removed and be no more cost effective on a linear scale. There are other factors, like fishing conditions (river flows and weather), that greatly affect harvest rates and confound using previous years' angler response to payment changes to predict the cost-effectiveness for expanding the program by increasing payment amounts. The earlier economic studies pointed to the difficulties in obtaining data and using relationships to accomplish an economic analysis. While the economic evaluation of the program itself is relatively straightforward, defining the relationship between northern pikeminnow predation, juvenile salmonid downstream survival, and increased harvestable adults is problematic. The present study makes some progress in showing these relationships using existing information and models. The present study shows the basic economic information that may be used to evaluate the NPMP in terms of net economic value (NEV), regional economic impacts (REI), and cost-effectiveness analysis (CEA) as compared to other external programs having similar objectives. Table ES.1 summarizes the results.
• The program's NEV creates an estimated $1.8 million in wealth to the nation because of the northern pikeminnow fishery and another $1.8 to $6.8 million from anadromous fish

vi kco D:\Data\Documents\hr\PikeminnowRpt.doc
Table ES.1 Northern Pikeminnow Management Program Economic Evaluation in 2002
Net Economic
Value
Regional Economic Impacts Cost-Effectiveness
NPMP budget $2.8 Northern pikeminnow fishery $1.8 $1.4 NPMP administration $2.1 Subtotal NPMP
$3.5
Anadromous fish fishing $1.8 to $6.8 $2.7 to $9.9 NPMP at existing program level $3.6 to $8.6 $6.2 to $13.4 $2.9 for one percent
increase in survival Notes: 1. Table values are in millions. Source: Study.
fishing. This does not include any measurement of passive use value for the increased salmonid adult returns or negative passive value associated with the exploitation of the northern pikeminnow.
• A program budget of $2.8 million will generate about $2.1 million in REI's and about $1.4 million in the regional economies where northern pikeminnow fishing takes place. Fishing for salmon and steelhead resulting from increased adults surviving to harvest will generate another from $2.7 million to $9.9 million in economies from Alaska to California on the West Coast and inland in the Columbia River Basin. In total, the act of fishing for northern pikeminnow and anadromous fish may create up to $13.4 million in REI. In terms of full time equivalent jobs at $30,000 each, this is equal to the employment of about 446 people. Since many of these jobs will be seasonal, the actual number of positions may be much higher than the stated full time equivalent job estimates.
• In terms of cost-effectiveness, NPMP budget and accomplishments during the 1991 to
1996 period costs an estimated $2.9 million per year per one percent increase in survival for juvenile salmonids. This compares favorably with other selected passage actions, such as improved screening at specific inriver sites.
This present economic analysis study used an approach to identify the factors that are critical to public investment decision making. Tailored to the NPMP, it was found that two major elements should be considered in investing in the NPMP. These are:
Biological Limits Research in predation of juvenile salmonids by northern pikeminnow has shown that relative benefits of a given exploitation rate decrease with time as the number of large northern pikeminnow is reduced. This latest research concludes that reduction in predation on juvenile salmon will most likely not be able to be reduced below the present
vii kco D:\Data\Documents\hr\PikeminnowRpt.doc
25 percent level. This research is more conservative than the pre-program estimate of a 50 percent reduction potential. Of greater influence is the decreased water velocity causing the northern pikeminnow to concentrate in near-dam areas. The predators would otherwise tend away from high flow locations, which would reduce salmonid encounter rates. Three biological issues have been addressed in previous research that appear to have lowered investment risk. They are: (1) whether predation only occurs on the dead, sick, and young that would not contribute to fisheries anyway, (2) whether there is northern pikeminnow or other species compensation, and (3) whether there is bycatch causing increased impacts to ESA-listed stocks. A single study showed that 85 percent of the estimated predation is on live smolts, thereby partly resolving the concern that predation is only on scavenged juveniles. Other studies showed that northern pikeminnow do not have density-dependent growth and other species (like small mouth bass and walleye) do not necessarily replace the predation, but these compensation studies assume that other fish (like Chinook salmon) feeding on smolts in estuaries and bird (like Caspian tern, double-crested cormorants, and western gulls) predation has a constant rate. Fishing techniques for northern pikeminnow are selective, but do generate incidentally caught salmonids and other game fish (white sturgeon, shad, etc.). Management agencies have incorporated these impacts into their harvest models. Social and Management Limits It was found that the NPMP has been very well publicly accepted as providing a recreational experience while allowing people to take part in salmon enhancement programs. This generates goodwill and well-being that participation is assisting a good cause. Other social limit concerns are for aggravating conflicts with other sport fisheries and increasing demands on enforcement programs. Exit interviews have not shown these concerns to be of enough significance to require alleviating actions. While there may be some opportunities to increase angler participation and therefore up the exploitation rate, more market information is needed to identify the factors that will affect angler demand. It could be that only training and promotion is needed. It could also be that the tiered reward system needs changing. However, controlled market response information is lacking at the present. Past information relating effort to changes in the reward amount has also been accompanied by changed fishing conditions. This clouds inferences that can be made about angler participation and program accomplishments.
The conclusion of the present study research is that:
1. An effective northern pikeminnow removal program is needed to mitigate for the increased predation brought about from the dams' generated slack water, i.e. the development of the existing hydrosystem has made this program necessary. The NPMP addresses this need without a parallel concern for eradicating the species by only targeting the larger offending size class.

viii kco D:\Data\Documents\hr\PikeminnowRpt.doc
2. The existing NPMP is as cost-effective as other example physical and operational
hydrosystem alteration programs being considered for increasing downstream migration survival. Based on available data, the present NPMP compares favorably with other selected passage actions, such as improved screening at specific inriver sites.
3. Except for the highliner anglers, participants will spend far more money than they realize
in rewards. This greatly multiplies the economic impacts per NPMP reward dollar. From a local economic development perspective, it is much better to have participation by low catch anglers than it is to have highliner type anglers. From a program cost-effectiveness perspective, it is better to encourage highliner participation.
4. There are biological and management limits to how much the NPMP can accomplish.
This latest research concludes that reduction in predation on juvenile salmon will most likely not be able to be reduced below the present 25 percent level.
5. Due to the uncertainty in predation modeling and lack of information about angler's
propensities to participate in the northern pikeminnow fishery, it is not clear that an increased budget for prompting more northern pikeminnow effort will calculate linearly to the CEA measure. Much more information is necessary to accurately model the angler response to payment levels and the relationship between increased effort, higher exploitation rates, and reduced predation levels.
6. To be useful in comparing the economic analysis to other programs with similar goals
and for use in ESA-listing program analysis, it is important that smolt origin differential mortality is known. It could be that wild production suffers more or less predation than hatchery origin smolts. It could be that some species released in some hatcheries could have different predation rates. Additional PIT tag system research would be needed for such studies.
7. The following are suggested ways to improve the sport fishing reward program
operations that were garnered from an informal survey of 2002 participants.
a. Increase number of "lottery" type tags and raise the prize amount. b. Make the "check in - check out" system easier to use by allowing multi-day
validation periods. c. Encourage new entrants and improve skills of past participants through training
programs. Perhaps a master angler program patterned after the master gardener or master hunter would work. These could also be the voluntary "eyes and ears" of the program. There seems to be a high level of awareness of the NPMP and generic advertising can probably be minimized. While Hankin and Richards (2000) advised against promotion costs, awareness and education should be viewed as necessary to expand the program.
d. Reduce the emphasis on discovering "cheaters." They are a small in number and, after all, they do reduce the northern pikeminnow population, even if it's from non-targeted stocks. There should be enforcement mechanisms, but if other

ix kco D:\Data\Documents\hr\PikeminnowRpt.doc
fisheries serve as an example, the best information about fraud comes from other anglers.
8. It appears the NPMP suffers from a very large turnover even among the core group of
highly successful fishers. Initial angler demand can probably be related to the financial rewards, but there is rapid attrition after discovering the work needed to catch even modest amounts of the larger size class. The trends show the highliner category is catching an increasing share. It is important to keep recruiting new anglers into this role.
9. There is insufficient market information to predict the effort response from changing the
tiered reward system and payment levels. Periodic participant economic preference surveys and non-participant market surveys should be reinstituted.
10. It is recommended that decision makers consider more than the short-term financial
values captured in the present study analysis. There are stakeholders and non-participants that hold social interests and non-economic values in the program.

I-1 kco D:\Data\Documents\hr\PikeminnowRpt.doc
I. INTRODUCTION A. Program Definition The Northern Pikeminnow Management Program (NPMP) has been underway for the last 13 years. The goal of the NPMP is to reduce predation on juvenile salmonids through sustained harvest of northern pikeminnow. The reduction of these predators increases the survival of juvenile salmonid while migrating downstream through the Columbia River system. This in turn increases adult salmonid abundances available for harvest and spawning. The NPMP harvest methods have evolved over the years; earlier programs involved commercial gear such as gillnets.1 The present program is now centered around a recreational reward fishery. Participating anglers are compensated for their catches by offering a payment for larger fish. The NPMP operates in the central Columbia River Basin (Map I.1). The anglers use single pole, hook and line techniques. Current angler regulations are as follows:
The angler must posses a valid fishing license from Washington or Oregon. The fishing areas are the "mainstem" Columbia River from the mouth up to the restricted zone below Priest Rapids Dam, and in the Snake River from the mouth up to the restricted zone below Hell's Canyon Dam. The mainstem includes backwaters, sloughs, and up tributaries 400 feet from the "tributary mouths." Tributary mouth is as defined by state fishing regulations. The season for the fishery starts from about the first of May and runs through September. For every northern pikeminnow nine inches or longer returned to a registration station, anglers receive $4 to $6. The more fish an angler catches, the more they're worth. There are three reward tiers: the first 100 in one season are worth $4 each; after 100, they're worth $5 each; and after 400 they're worth $6 each. Special tagged northern pikeminnow are worth $100. Fish less than nine inches total length are not eligible for reward payment. Anglers check into certain stations and fish must be returned to the same registration station where the angler registered. It must be on the same calendar day stamped on the registration form before that station closes for that day and the fish must have been caught subsequent to that day's registration.
The total annual budget for administration and funding of the NPMP and for evaluation of NPMP impacts has been approximately $3.0 million over the past five years of its operation. In 2002, the total reward dollars paid was $1,053,831. About one half of this money was paid to 125 (out of 2,465) top anglers. The balance of the budget is used for administration, operation, research, and monitoring.
1. Other technologies for removal of northern pikeminnow were tested from 1990 to 1993, including lure trolling,
purse seining, electrofishing, trap-netting, and commercial longlining; however, none proved effective. In 1994, a site-specific gillnet fishery to remove northern pikeminnow near hatchery release points and tributary mouths was implemented. Implementation of the test fisheries was discontinued after 1994, leaving sport-reward, dam-angling, and site-specific gillnet fisheries as the removal methods. The dam-angling and site-specific gillnet fisheries were discontinued after 2002.

I-2 kco D:\Data\Documents\hr\PikeminnowRpt.doc
Map I.1 Angler Registration Station Locations in 2004
1a. Cathlamet Marina 6a. Bonneville Trail Head 1b. Willow Grove Park 8. The Dalles Boat Basin 2a. Rainier Marina 9. Giles French 2c. Kalama Marina 10. Columbia Point Park 3. M. James Gleason Boat Ramp 11. Vernita Bridge Rest Area 3a. Chinook Landing 12. Greenbelt 4. Washougal Boat Ramp / Port of Camas 12a. Lyon's Ferry 5. The Fishery (at Covert's Landing) 12b. Boyer Park Source: NPMP (2004). The Bonneville Power Administration (BPA) pays the Pacific States Marine Fisheries Commission (PSMFC) to administer the program in association with the Washington Department of Fish and Wildlife (WDFW) and Oregon Department of Fish and Wildlife (ODFW). The WDFW provides on-ground management and record-keeping. The ODFW has responsibility for evaluation of program accomplishments.1 The Columbia River Inter-Tribal Fish Commission (CRITFC) and four Indian tribes had responsibility for administering the dam-angling and site-specific fisheries. Since these fisheries were discontinued after 2002, CRITFC and the tribes are not now associated with the program. The NPMP funding levels and methods were questioned by the Northwest Power and Conservation Council (NPCC) Independent Scientific Review Panel (ISRP) in a review dated August 2, 2002. The ISRP comments were from a rolling review schedule for the Columbia River Basin Fish and Wildlife Program (CRBFWP) Mainstem and Systemwide projects. The
1. ODFW evaluation of the program consists of (1) monitoring the exploitation rate and size of northern
pikeminnow harvested annually for each harvest method, and (2) monitoring the effects of observed exploitation rates on reductions in juvenile salmonid predation. Monitoring the effects of exploitation includes (1) comparing predation indices before and after sustained implementation of the program, (2) describing the response of northern pikeminnow to sustained removals, and (3) describing the response of other predators (walleye and smallmouth bass) to sustained removals of northern pikeminnow.

I-3 kco D:\Data\Documents\hr\PikeminnowRpt.doc
comments were considered by the NPCC for recommendations to the BPA for funding decisions on a three year package of improvement projects in the CRBFWP. The BPA in October 2, 2003 considered the NPCC June 11, 2003 recommendations for 50 percent reduced funding levels, but decided to go with a higher level of $2.2 million in Fiscal Year (FY) 2004 and $2.1 million in FY 2005 and FY 2006. This compares to the project sponsor request for $3.3 million in FY 2004 and about $3.5 million in following years. The BPA commented in its decision that it expected that the funding was adequate to achieve 90 percent of past years' predation reduction benefits or mid-term funding reallocations should be considered.1 The PSMFC wishes to respond to the ISRP comments about lack of monitoring the program for economic considerations by undertaking an economic analysis study. The study would address recommendations by the ISRP and those of a study completed by Hankin and Richards (2000). (The Hankin and Richards study was done on recommendation of the ISRP in a previous review of the NPMP project proposal.) The ISRP commented that there is no analysis of the cost-effectiveness of the pikeminnow removal on salmon or any discussion of economic tradeoffs for conducting this program. The ISRP points out that the Hankin and Richards (2000) study had two recommendations for improving the efficiency of the program that have not been carried out. These were to conduct further study of the tiered reward system and to explore possibilities to increase rewards by substituting funds spent for promotion. The PSMFC contracted with The Research Group, Corvallis Oregon for a workscope to undertake the economic analysis. The workscope was limited to using available data and information. This means any evaluation methods requiring new data collection, such as surveys of program participants, can only be recommended for implementation. The study used the following sequence of activities.
1. Describe the program's economic considerations. 2. Assess the program's economic contribution and compare the program to other
approaches for accomplishing program objectives. 3. Explain study findings and recommend future research.
The documentation of these activities' results is contained in three successive chapters of this report.
1. The BPA is considering reducing summertime water spills over dams in order to realize more revenues from
power generation and to compensate for expected low water flow levels. Mitigation actions to offset impacts from higher mortality to salmonid outmigration include increasing funds to the NPMP. The funds would be to increase the recreational fishing reward structure, thereby increasing angling activity, resulting in increased catches of the northern pikeminnow offending size class. The rewards would be increased: Tier 1 would increase to $5, Tier 2 would increase to $6 per fish, and Tier 3 would increase to $8 per fish. The tagged fish would increase from $100 to $500. Additional areas may be opened, such as for the lower reaches of the Yakima River. The estimated cost for the proposed action is $1.5 million.

I-4 kco D:\Data\Documents\hr\PikeminnowRpt.doc
B. Background Hankin and Richards (2000) discuss the biology as well as the economic justification for the NPMP. The following summary is selectively paraphrased from their report; other reports are referenced to substantiate the program description.1 The northern pikeminnow are a native species and have always preyed upon juvenile salmonids. The development of the Columbia River hydropower system has likely increased the level of predation. Dams have slowed water velocity and decreased turbidity, effects which have increased exposure time of juvenile salmonids to predators and probably also increased predation success. Development of the hydropower system has also resulted in increased water temperatures, and therefore increased predator activity and consumption. Dams concentrate prey in forebay and tailrace areas, further increasing the likelihood of predation. Juvenile salmonids in dam tailraces are likely disoriented from passage through or around turbines, spillways, or bypass systems, increasing their vulnerability to predation. In "natural-river" systems where northern pikeminnow or related pikeminnow species coexist with anadromous salmonids, Brown and Moyle (1981) found that predation by pikeminnow in streams was minimal. Buchanan et al. (1981) found that predation on salmonids by northern pikeminnow was minimal in free-flowing reaches of the Willamette River. Beamesderfer and Rieman (1991) and Ward et al. (1995) confirmed that northern pikeminnow densities were highest near dams, and Vigg et al. (1991) and Ward et al. (1995) confirmed that consumption rates are also highest near dams. Together, these studies suggest that the predation impact of northern pikeminnow in the Columbia and Snake rivers today is likely much greater than what it may have been prior to construction of dams. The concept of the NPMP can be directly traced to Rieman and Beamesderfer (1990) whose research suggested that relatively low annual exploitation rates (10 to 20 percent) applied to northern pikeminnow populations could, in principle, result in a reduction of approximately 50 percent in the total consumption of juvenile salmonids by northern pikeminnow. Northern pikeminnow apparently become a serious predator of juvenile salmonids only after they reach a size of approximately 250 mm or 9.8 inches fork length (approximately 279 mm or 11.0 inches total length); thereafter their importance (measured by daily consumption of juvenile salmonids) as a predator increases with their increasing size. Because northern pikeminnow are relatively long-lived (specimens have been aged up to 16 years in the Columbia River) and their annual natural mortality rates are believed to be relatively low (Rieman and Beamesderfer 1990, Parker et al. 1995), a relatively small increase in annual mortality rate can produce a substantial reduction in the number of larger, older northern pikeminnow. As these larger and older fish have greatest predation impact (i.e., consume the greatest numbers of juvenile salmonids), a substantial reduction in their numbers could have an important impact on total population predatory impact even though the overall population size is not dramatically reduced. Beamesderfer et al. (1996) have estimated that approximately 16.4 million outmigrating juvenile salmonids were consumed by northern pikeminnow annually in the Columbia and Snake rivers 1. Care has been taken to make sure the author's context has been preserved, however the reader is encouraged to
review the original sources to make sure meaning and intent are unchanged.

I-5 kco D:\Data\Documents\hr\PikeminnowRpt.doc
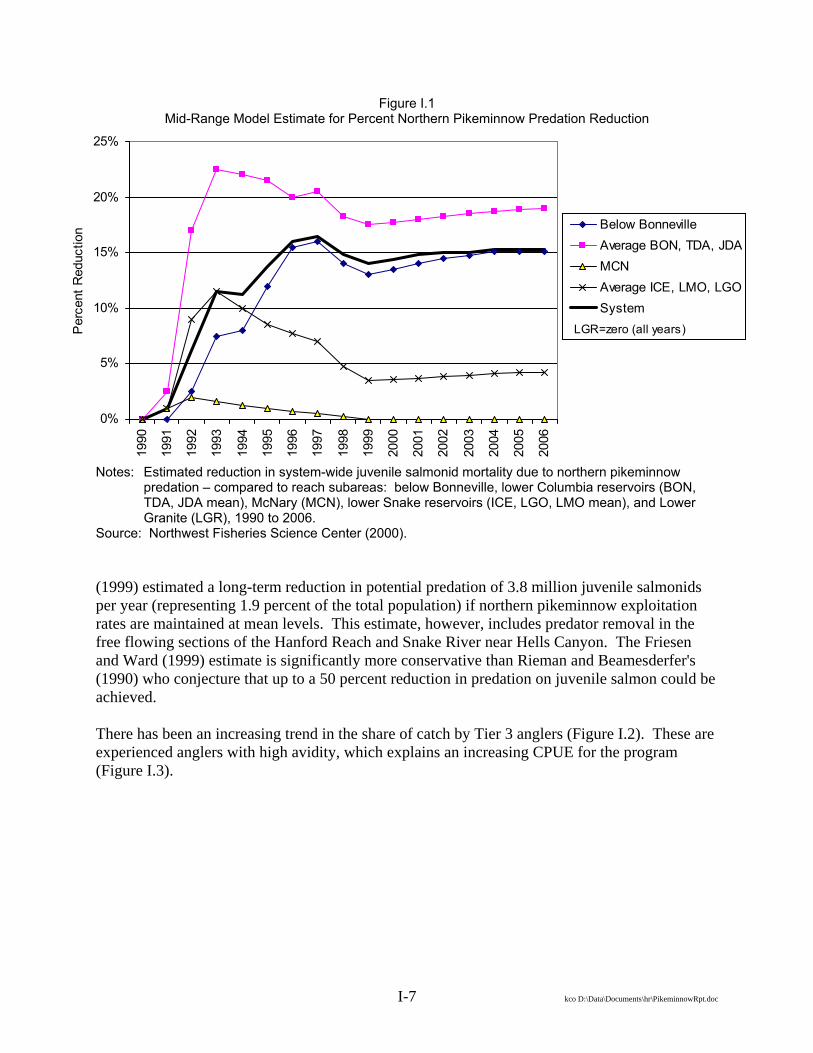
prior to the NPMP. Total systemwide impacts are not evenly distributed throughout the Columbia and Snake rivers, but are concentrated in the lower Columbia River below the Dalles Dam where approximately 13.0 million of the 16.4 million total salmonids are believed to have been consumed by northern pikeminnow (Beamesderfer et al. 1996). When compared to the estimated 200 million juvenile salmonids produced in these combined river systems, the northern pikeminnow are thus believed to have consumed approximately eight percent of all downstream migrants. At this level of outmigration, about 6.5 percent of these downstream migrants are consumed below The Dalles Dam. Ward, et. al. (October 24, 2002) addresses previous estimates of predation losses biases for consumption of juvenile salmonids killed by dam passage. Most salmonids consumed by northern pikeminnow were eaten alive, despite observed preferences for dead salmonids in laboratory and field tests (Gadomski and Hall-Griswold 1992; Petersen et al. 1994). Petersen et al. (1994) marked and released dead and live salmonids into a dam tailrace in a 10 percent dead proportion that simulated turbine mortality rate and observed that 22 percent of marked salmonids subsequently recovered from northern pikeminnow were dead before release. If dead fish constitute 22 percent of northern pikeminnow prey near a dam, dam effects extend 10 km upstream and downstream, and 69 percent of predation occurs in that zone (Petersen 1994), then 85 percent of the estimated predation would be on live fish (1 minus (0.69 times 0.22)). Rieman and Beamesderfer (1990) concluded that compensation by surviving northern pikeminnow was unlikely because (1) fecundity is much lower than fecundity of species considered resilient, (2) growth is slow and mortality low compared with other species, and (3) density-dependent growth was not obvious. Knutsen and Ward (1999) found no evidence to date of compensation by surviving northern pikeminnow, although there are still some outstanding questions about compensatory feeding by northern pikeminnow (Petersen 2001). Friesen and Ward (2000) and Ward and Zimmerman (1999) found no evidence to date of compensation by walleye or smallmouth bass for decreased populations of northern pikeminnow. The NPMP has resulted in a steady exploitation of the northern pikeminnow population over recent years at about 12 percent after an initial absolute catch was ramping up (Table I.1).1 Since implementation of the NPMP, annual harvest rates of fish larger than 250 mm fork length have averaged within the 10 to 20 percent stated target range, with the sport-reward fishery contributing over 90 percent of the total catch. In recent years, the dam-angling and gillnet fisheries combined have contributed less than one percent of the total catch. The dam-angling and gillnet fisheries were discontinued after 2002. Friesen and Ward (1999) estimate that as a result of northern pikeminnow harvest since 1990, predation on juvenile salmonids by northern pikeminnow has been reduced by as much as 25 percent annually. The relative benefits of a given exploitation rate decrease with time as the number of large northern pikeminnow is reduced; however, additional reductions in potential predation are possible if exploitation is maintained at mean levels (Figure I.1). Friesen and Ward
1. Any future decrease in the absolute numbers of fish caught would be due to the effectiveness of the ongoing
NPMP. In a setting like this, where a fishery is first imposed on a previously unexploited population of fish, catches would be expected to be greatest in the first few years of program operation and to thereafter decline to lower levels without a change in effort or catch per unit effort.

I-6 kco D:\Data\Documents\hr\PikeminnowRpt.doc
Table I.1 Annual Catch, Effort, and Exploitation Rate
Sport Reward Dam
Sport Reward
Exploitation
All Fisheries
Exploitation Year Catch Tier 1 Tier 2 Tier 3 Effort CPUE Angling Gillnet Other Total Rate Rate 1990 4,681 100.0% -- -- -- -- 11,001 -- 1,648 17,330 -- -- 1991 159,542 100.0% -- -- 67,317 2.37 39,196 -- 7,366 206,104 8.5% 10.7% 1992 185,468 100.0% -- -- 87,900 2.11 27,868 -- 8,766 222,102 9.3% 12.0% 1993 104,616 100.0% -- -- 50,055 2.09 17,210 1,772 1,688 125,286 6.8% 8.1% 1994 128,851 100.0% -- -- 40,647 3.17 16,097 9,024 -- 153,972 10.9% 13.2% 1995 199,788 36.0% 30.7% 33.3% 62,725 3.19 5,299 9,484 -- 214,571 13.4% 15.5% 1996 157,230 34.4% 30.7% 34.9% 35,485 4.43 5,455 6,165 -- 168,850 12.1% 12.9% 1997 119,488 34.6% 31.9% 33.5% 27,338 4.37 3,517 2,806 -- 125,811 8.9% 9.6% 1998 108,903 33.4% 31.3% 35.4% 21,959 4.96 3,480 3,035 -- 115,418 11.1% 11.5% 1999 114,687 34.3% 32.3% 33.5% 25,906 4.43 3,559 1,604 -- 119,850 12.5% 12.7% 2000 189,710 30.1% 27.6% 42.4% 30,337 6.25 423 557 -- 190,690 11.9% 11.9% 2001 244,032 30.2% 27.6% 42.1% 39,091 6.24 2,751 523 -- 247,306 16.2% 16.2% 2002 202,068 27.6% 28.0% 44.5% 30,521 6.62 7 712 -- 202,787 12.3% 12.3% 2003 196,977 28.5% 29.6% 41.9% 28,691 6.87 -- -- -- 196,977 13.0% 13.0%
Notes: 1. Minimum reward size decreased from 11 to 9 inches in 2000, but exploitation rates are only shown for ≥ 250 mm (or 9.8 inches) fork
length for comparison across years. 2. The program began in 1990 without a tired reward system at $1 per fish. This was increased to $3 per fish in July 1990 which lasted
through 1994. In 1995, the tiered reward system began with $3, $4, and $5 for total seasonal harvests of 1-100 fish, 101-400 fish and 400+ fish caught. In 1999, the tiered reward system increased to $4, $5, and $6. In July 2001 additional economic incentives were offered during drought/power emergencies. The catch and tag rewards by tier increased to $5, $6, and $8 and tag reward to $1,000. In 2002, the catch and tag rewards returned to $4, $5, and $6 by tier and the tag reward returned to $100.
3. Dam-angling and gillnet were discontinued after 2002. 4. Effort is measured by angler days. Source: Ward et. al. (October 24, 2002), NPMP personal communication March 2004, and Study.
I-7 kco D:\Data\Documents\hr\PikeminnowRpt.doc
Figure I.1 Mid-Range Model Estimate for Percent Northern Pikeminnow Predation Reduction
0%
5%
10%
15%
20%
25%19
90
1991
1992
1993
1994
1995
1996
1997
1998
1999
2000
2001
2002
2003
2004
2005
2006
Per
cent
Red
uctio
n Below BonnevilleAverage BON, TDA, JDAMCNAverage ICE, LMO, LGOSystem
LGR=zero (all years)
Notes: Estimated reduction in system-wide juvenile salmonid mortality due to northern pikeminnow
predation – compared to reach subareas: below Bonneville, lower Columbia reservoirs (BON, TDA, JDA mean), McNary (MCN), lower Snake reservoirs (ICE, LGO, LMO mean), and Lower Granite (LGR), 1990 to 2006.
Source: Northwest Fisheries Science Center (2000). (1999) estimated a long-term reduction in potential predation of 3.8 million juvenile salmonids per year (representing 1.9 percent of the total population) if northern pikeminnow exploitation rates are maintained at mean levels. This estimate, however, includes predator removal in the free flowing sections of the Hanford Reach and Snake River near Hells Canyon. The Friesen and Ward (1999) estimate is significantly more conservative than Rieman and Beamesderfer's (1990) who conjecture that up to a 50 percent reduction in predation on juvenile salmon could be achieved. There has been an increasing trend in the share of catch by Tier 3 anglers (Figure I.2). These are experienced anglers with high avidity, which explains an increasing CPUE for the program (Figure I.3).

I-8 kco D:\Data\Documents\hr\PikeminnowRpt.doc
Figure I.2 Sport Reward Catch by Tier Group in 1995 to 2003
Tier 1
Tier 2
Tier 3
0%
10%
20%
30%
40%
50%
60%
70%
80%
90%
100%
1995 1996 1997 1998 1999 2000 2001 2002 2003
Year
Per
cent
of C
atch
Source: Ward et. al. (October 24, 2002), NPMP personal communication March 2004, and Study.
Figure I.3 Sport Reward Catch, Effort, and Catch Per Unit Effort in 1991 to 2003
0
50,000
100,000
150,000
200,000
250,000
300,000
1991
1992
1993
1994
1995
1996
1997
1998
1999
2000
2001
2002
2003
Year
Cat
ch (F
ish)
and
Effo
rt (D
ays)
0
1
2
3
4
5
6
7
8
CP
UE
CatchEffortCPUE
Source: Ward et. al. (October 24, 2002), NPMP personal communication March 2004, and Study.

I-9 kco D:\Data\Documents\hr\PikeminnowRpt.doc
C. Economic Analysis Approach The study's overall goal is to evaluate the NPMP using economic considerations.1 There are three analysis approaches used: determining net economic value (NEV), calculating regional economic impact (REI), and undertaking a cost-effectiveness analysis (CEA).2 There are two 1. Most economic analysis will be incomplete because not all changes in long range values, nonfinancial values,
and external costs are addressed. Long range value changes are those that can be expected to occur after a plan's actions are absorbed. (When these future changes are included, the revenue or costs streams are reduced to annual net present values in order for them to be used in the analysis. The choice of the discount rate to use in calculating net present value is controversial [Hanley and Spash 1993].) Because of the uncertainty in knowing these adjustments, analysts generally assume the change in the short term will approximate what happens over the course of the long term. Short term value changes are the immediate gains or losses to be expected to occur if the status quo is changed.
Impacts on national, state, and local economies are usually analyzed only in terms of dollar flows. Economic
values can also be nonfinancial (no market information exists), as well as financial (prices exist from markets where traded goods are for well-defined property rights that are exclusive, transferable, and enforceable [Panayotou 1992]). For example, some people (termed non-users) who do not actually fish for salmonids may still place a value on the existence of the resource. Deriving this value must rely on expressed preference information (either real or hypothetical) gathered through surveys that address the particular setting and policy issues needing decisions. Because of lack of budget resources to do a more comprehensive analysis, the values of the non-users are generally either not included or are imputed from other studies. Such values can play a significant role in determining future programs related to the management of a natural resource and should be a criteria in any policymaking, but should be used carefully in the decision-making because of the difficulties in measuring such values.
Nonmarket values include livability considerations, and livability is becoming more important as Pacific
Northwest economies mature. Economies are becoming more dependent upon high-technology industries, which require a highly educated, highly skilled workforce. High technology firms do not have the usual locational requirements for being near markets or near manufacturing inputs, and as such, can decide to make capital investments based on other criteria. One of the competitive advantages in the Pacific Northwest is livability relative to other areas that makes it unnecessary to pay premium compensation for a degraded environment or for overcrowding. Scenic and productive river basins will play an important role in drawing the major components of economic growth: capital and a highly skilled work force.
External costs are also not usually evaluated. Prices of products or services sold in the open market often do not
reflect all the costs of making the product or providing the service. External costs are passed on to others in society, often in the form of dirty air, polluted water, or less biodiversity. External costs are difficult to identify and hard to quantify, but they can significantly decrease the value to society of commodity production. Although it would not be easy to allocate these costs to resource management plan strategies, they could make up a significant part of the costs of producing commodity outputs and should be evaluated along with market and nonmarket values.
2. Net economic value estimates utilized in this report should be viewed as general indicators. Specific
application of the models for certain program effects or in selective geographic areas may not be appropriate. The present study did not address substitution. It could be that a proportion of anglers would fish for other
target species anyway. Because these anglers turned in vouchers, it was assumed all of their economic impact was associated with the NPMP.
The present study also did not address whether the anglers were resident within the economies being analyzed.
Fishing expenditures can be considered as coming from disposable income, which would be spent on other local recreational opportunities if not spent on fishing. It can also be argued that if the NPMP was not available, residents might travel elsewhere in recreational pursuits, thereby taking money out of the economy.

I-10 kco D:\Data\Documents\hr\PikeminnowRpt.doc
aspects of the program that are included in the NEV: (1) the value for the recreational experience to fish for northern pikeminnow, and (2) the value realized from recreational and commercial fishing for the increased adult salmonids. The NEV is the sum of benefits minus costs. Benefits minus costs for recreational angling assume willingness-to-pay (WTP) estimates from other studies.1 The REI analysis has three components: (1) the economic activity from northern pikeminnow fishing itself, (2) the economic activity from administering the program, and (3) the economic activity stirred up in the local economies by fishing for the increased adult salmonids. The economic activity for pikeminnow fishing assumes that the higher volume anglers are more akin to a commercial fishery than a recreational fishery. All anglers that reach the third tier are treated as a commercial operation. Because adult salmon are harvested in ocean fisheries, the increased smolt survival will benefit economies at ocean communities from Alaska to California as well as inland communities of the Columbia Basin. All of these economies are included in the analysis. The CEA compares the NPMP to several other smolt downstream survival improvement programs designed to achieve the same objectives. Following chapters describe the methods and results for the different types of economic analysis approaches. Estimates of NEV and REI from recreational and commercial fishing are made using factors and procedures developed by management agencies, such as ODFW (Carter 1999), Pacific Fishery Management Council (PFMC) (2004), and the NOAA Fisheries (2000). The economic analysis relies heavily on the parameters and models developed by Radtke et al. (1999). Estimates for CEA use procedures developed by the NPCC Independent Economic Analysis Board (IEAB) (2004).
1. A literature search did not discover a benefit-cost analysis for recreational financial reward fishing, other than
for tournament fishing events, so it was necessary to assume that northern pikeminnow fishing willingness-to-pay estimates on a per day basis were the same as for trips when angler motivations are to fish for other Columbia River Basin target species.
II-1 kco D:\Data\Documents\hr\PikeminnowRpt.doc
II. ECONOMIC ANALYSIS A. Methods Fishery resources in the Pacific Northwest provide all types of values to society. This includes values that can be measured by those that use the resources as well as values for those that do not use the resources. Measuring values for the non-users is much more difficult because there are no traditional market exchanges. The non-users have to be asked their hypothetical WTP to have the resource. For the purpose of this study, values derived from the act of fishing (by both recreational and commercial interests) is assessed quantitatively and non-user values are only qualitatively discussed. The valuation is determined using two economic analysis approaches: NEV and REI. Both provide dollar estimates, but have quite different meaning, as explained in the following sections. A third economic analysis approach, called CEA, is also used. This type of analysis shows the cheaper way to accomplish an objective from a package of alternatives. The CEA method compares alternatives using the objective for increasing juvenile salmon downstream survival by one percent. The modeling assumptions and procedures for the economic analysis approaches are shown in Table II.1. The economic analysis is for three effects from the NPMP: (1) harvesting northern pikeminnow, (2) program administration, and (3) harvesting the increased adult salmonid returns. The economic measurement regarding the increased salmonid adult returns assumes Friesen and Ward (1999) predation reduction estimates. The small economic effects from northern pikeminnow disposition after catch that is rendered for fish meal or compost is included in the northern pikeminnow harvesting effects. The economic effects from harvesting the increased adult salmonids are dependent on assumptions used for estimating three variables: (1) downstream juvenile salmonid migration levels (including hatchery and wild), (2) smolt-to-adult survival rate (SAR), and (3) ocean and in-stream harvest management regimes. The estimates for these variables that rely on historical data will differ depending on the adopted period, or in the case of using policies for definitions, the assumed sideboard estimates for the policies. Table II.2 presents three alternatives to characterize the variables. The table's notes describe the historical periods used for averages and the other policy assumptions. At present, total downstream migrating smolts are most likely close to 200 million, as mentioned by Hankin and Richards (2000). However, the Artificial Production Review and Evaluation (APRE) projected hatchery related releases at 208 million for the 2004 year (APRE 2003). Depending on the number of estimated naturally spawning adults, the total amount of smolts that are entering the Columbia/Snake system according to the APRE estimate are about 330 million. The Columbia River Fish Passage Center (CRFPC) estimates the actual hatchery smolt releases at 143 million or 68.8 percent of planned (Sando 2003). Therefore, including the estimated natural produced smolts, the total smolt downstream migration would be an expected 226 million.

II-2 kco D:\Data\Documents\hr\PikeminnowRpt.doc
Table II.1 Modeling Assumptions for Economic Analysis Approaches by Program Effects
Program Effects
Economic Operation and Administration Increased Adult Salmonid Returns Analysis Angler Effort Fisheries
Approaches Highliner Recreational Administration Commercial Recreational NEV Method Use REI method for highliner
revenues; assume 70% revenues for value
Use REI method for angler days; assume northern pikeminnow fishing WTP per angler day is same as other target species (salmon, etc.); use benefit transfer values; assume zero passive use values
Opportunity costs for using budgeted funds on other fish and wildlife programs or returning funds to electricity rate base
Use REI method for commercial revenues; assume 70% revenues for value
Use REI method for recreational days; assume user WTP per angler day benefit transfer values; discuss passive use values for non-use of returning adults
Unit 70% x $4,325 $52 per day Not calculated Varies by geographic fishery - see Table II.4
Varies by geographic fishery - see Table II.4
Use NPMP exploitation rate effects on downstream survival improvements; assume SAR for that brood year; assume ocean and in-stream harvest rates
REI Method Use NPMP participation results for payments to Tier 3 anglers; use FEAM small salmon vessel category budget for expenditures; use IMPLAN sector multipliers
Use NPMP participation results for effort (angler days); assume Oregon Angler Survey expenditures per angler days; use IMPLAN sector multipliers
Use IMPLAN sector multipliers and budget labor and other cost line items
Assume allocation for commercial use; use ocean and in-stream per pound weight and ex-vessel price to develop revenues for ocean, lower river non-Indian, and upriver tribal fisheries; use FEAM salmon fisheries budgets for expenditures; use IMPLAN sector multipliers
Assume allocation for recreational use; assume CPUE to develop total angler days; assume Oregon Angler Survey per day expenditures; use IMPLAN sector multipliers
Unit $7.1 per fish that includes $0.25 per pound for pikeminnow disposition
$30 per day fishing without consideration for pikeminnow disposition
Actual expenditures and IMPLAN sector multipliers
Varies by geographic fishery - see Table II.4
Varies by geographic fishery - see Table II.4
CEA Method Compare NPMP costs to other passage improvement projects
Unit Per 1% downstream survival improvement
Notes: 1. The NPMP has in the past had other operational methods, such as dam angling and site-specific gillnet fishing. These methods were discontinued
after 2002, so effects' assumptions are not included in the table. 2. The REI table statements only describe how economic contribution measured by personal income is developed. REI can also be measured as jobs
and industry output. Source: Study.

II-3 kco D:\Data\Documents\hr\PikeminnowRpt.doc
Table II.2 Hatchery Release, Smolt-to-Adult Survival Rates, and Harvest Level Assumptions for
Three Alternatives Considered for Estimating Adult Salmonid Returns-to-Fisheries
Assumptions Alternatives Hatchery Production SAR Harvests Regime
I CRFPC Estimate 1970's-1990's Average 30-year average II APRE Estimate 1970's-1990's Average 1980's average III APRE Estimate Doubling the Runs Objective Double 1980's average
Notes: 1. Columbia River Fish Passage Center (CRFPC) estimate is 143 million. Hatchery production
Artificial Production Review and Evaluation (APRE) estimates are 208 million. 2. SAR is smolt-to-adult survival rates for hatchery and wild origin anadromous fish. Hatchery
origin adults are harvests and returns to hatcheries. Wild adults are harvests and spawners plus prespawning mortality.
3. Average brood year periods SAR used for "30 years" ended in 1993; and "1980's" was 1981 to 1989. SAR assumptions for the "Run Doubling Objective" case are the survival rates that would be required to meet the objectives.
4. Commercial harvests include ocean and inland treaty and non-treaty allocations from California to Alaska, and hatchery surplus sales. Recreational harvests includes ocean and inland (mainstem and tributary).
5. These three alternatives may be viewed as situations or goals for Columbia River anadromous fish management.
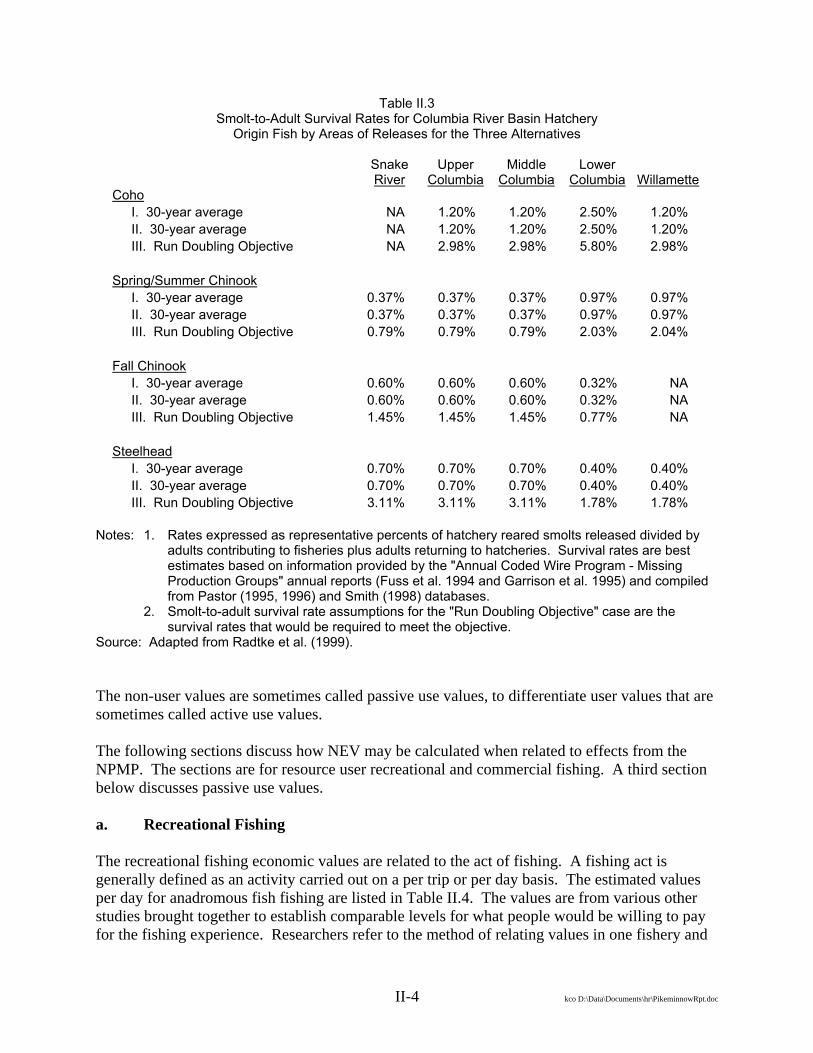
Source: Adapted from Radtke et al. (1999). SAR's have been increasing in the last few years, and reducing juvenile salmonid predation through the NPMP is just one small effect on the multiple causes of smolt mortality. It is difficult to adopt a SAR to use for a particular brood year in this study as reflective to what might happen as a result of ocean conditions, harvest management regimes, and other smolt mortality influences. Assumed average SAR's by hatchery release area and species are shown in Table II.3. Different periods used in calculating averages will have quite different results. Ocean and in-stream harvest management regimes are set by many overlapping jurisdictions that are responding to international and national treaties, as well as biological conservation concerns. Harvest levels will vary dramatically from year to year. Economic concerns for harvesters prompted the NPCC to set a goal for doubling the runs over 1980's level adult returns in order to support higher opportunities for inriver fisheries. The goal has now been abandoned in favor of more specific conservation objectives. Predicting how harvest management may change geographic fisheries is problematic and a wide range is used for this study to encompass how higher adult return may benefit economies through commercial and recreational fisheries. 1. Net Economic Value NEV attempts to measure the benefits received by those that use the fish less costs and the value people place on the fish resource without using it. In general, benefits are measured by willingness to pay and costs by opportunity costs. Opportunity costs reflect the foregone benefits from the use of the fish. The economic values to "nonusers" include existence values (knowledge of continual existence of the resource), bequest values (preserving the resource for future generations), and option values (users having the option to use the resource in the future).
II-4 kco D:\Data\Documents\hr\PikeminnowRpt.doc
Table II.3 Smolt-to-Adult Survival Rates for Columbia River Basin Hatchery
Origin Fish by Areas of Releases for the Three Alternatives
Snake River
Upper Columbia
Middle Columbia
Lower Columbia
Willamette
Coho I. 30-year average NA 1.20% 1.20% 2.50% 1.20% II. 30-year average NA 1.20% 1.20% 2.50% 1.20% III. Run Doubling Objective NA 2.98% 2.98% 5.80% 2.98%
Spring/Summer Chinook I. 30-year average 0.37% 0.37% 0.37% 0.97% 0.97% II. 30-year average 0.37% 0.37% 0.37% 0.97% 0.97% III. Run Doubling Objective 0.79% 0.79% 0.79% 2.03% 2.04%
Fall Chinook I. 30-year average 0.60% 0.60% 0.60% 0.32% NA II. 30-year average 0.60% 0.60% 0.60% 0.32% NA III. Run Doubling Objective 1.45% 1.45% 1.45% 0.77% NA
Steelhead I. 30-year average 0.70% 0.70% 0.70% 0.40% 0.40% II. 30-year average 0.70% 0.70% 0.70% 0.40% 0.40% III. Run Doubling Objective 3.11% 3.11% 3.11% 1.78% 1.78%
Notes: 1. Rates expressed as representative percents of hatchery reared smolts released divided by
adults contributing to fisheries plus adults returning to hatcheries. Survival rates are best estimates based on information provided by the "Annual Coded Wire Program - Missing Production Groups" annual reports (Fuss et al. 1994 and Garrison et al. 1995) and compiled from Pastor (1995, 1996) and Smith (1998) databases.
2. Smolt-to-adult survival rate assumptions for the "Run Doubling Objective" case are the survival rates that would be required to meet the objective.
Source: Adapted from Radtke et al. (1999). The non-user values are sometimes called passive use values, to differentiate user values that are sometimes called active use values. The following sections discuss how NEV may be calculated when related to effects from the NPMP. The sections are for resource user recreational and commercial fishing. A third section below discusses passive use values. a. Recreational Fishing The recreational fishing economic values are related to the act of fishing. A fishing act is generally defined as an activity carried out on a per trip or per day basis. The estimated values per day for anadromous fish fishing are listed in Table II.4. The values are from various other studies brought together to establish comparable levels for what people would be willing to pay for the fishing experience. Researchers refer to the method of relating values in one fishery and

II-5 kco D:\Data\Documents\hr\PikeminnowRpt.doc
Table II.4 Anadromous Fish Net Economic Value and Regional Economic Impacts Modeling Factors
Commercial Per Fish Recreational Per Day Days Recreational Per FishREI NEV REI NEV Per Fish REI NEV
Species: CohoOcean
Alaska 21.29 10.20 60.00 51.43 1.00 60.00 51.43British Columbia 18.15 8.70 60.00 51.43 1.00 60.00 51.43Washington ocean 12.49 5.99 60.00 51.43 1.00 60.00 51.43Washington Puget Sound 16.90 8.67 60.00 51.43 1.00 60.00 51.43Oregon 17.43 9.17 60.00 51.43 1.00 60.00 51.43California 20.65 9.35 60.00 51.43 1.00 60.00 51.43
Columbia Basin inlandFreshwater sport
Mainstem -- -- 60.00 51.43 1.00 60.00 51.43Tributary -- -- 60.00 51.43 1.00 60.00 51.43
Gillnet 15.15 8.99 -- -- -- --Tribal 15.15 8.99 -- -- -- --
Other -- -- -- -- -- --Hatchery surplus market 11.94 7.28 -- -- -- --Hatchery carcass 2.00 1.23 -- -- -- --
Species: Spring/Summer ChinookOcean
Alaska 69.15 33.83 60.00 51.43 1.00 60.00 51.43British Columbia 69.99 34.30 60.00 51.43 1.00 60.00 51.43Washington ocean 48.31 23.68 60.00 51.43 1.00 60.00 51.43Washington Puget Sound 41.22 21.19 60.00 51.43 1.00 60.00 51.43Oregon 42.05 21.65 60.00 51.43 1.00 60.00 51.43California -- -- 60.00 51.43 1.00 60.00 51.43
Columbia Basin inlandFreshwater sport
Mainstem -- -- 60.00 51.43 2.00 120.00 102.86Tributary -- -- 60.00 63.23 2.00 120.00 126.46
Gillnet 98.59 49.95 -- -- -- --Tribal 98.59 49.95 -- -- -- --
Other -- -- -- -- -- --Hatchery surplus market 49.12 26.87 -- -- -- --Hatchery carcass 2.00 1.23 -- -- -- --
Species: Fall ChinookOcean
Alaska 69.15 33.83 60.00 51.43 1.00 60.00 51.43British Columbia 69.99 34.30 60.00 51.43 1.00 60.00 51.43Washington ocean 48.31 23.68 60.00 51.43 1.00 60.00 51.43Washington Puget Sound 41.22 21.19 60.00 51.43 1.00 60.00 51.43Oregon 42.05 21.65 60.00 51.43 1.00 60.00 51.43California 53.80 22.53 60.00 51.43 1.00 60.00 51.43
Columbia Basin inlandFreshwater sport
Mainstem -- -- 60.00 51.43 1.50 90.00 77.15Tributary -- -- 60.00 63.23 2.00 120.00 126.46
Gillnet 41.22 23.53 -- -- -- --Tribal 41.22 23.53 -- -- -- --
Other -- -- -- -- -- --Hatchery surplus market 29.75 18.25 -- -- -- --Hatchery carcass 2.00 1.23 -- -- -- --
Species: Summer/Winter SteelheadOcean
Alaska -- -- 60.00 52.85 1.00 60.00 52.85British Columbia 22.28 11.44 -- -- -- --Washington ocean -- -- -- -- -- --Washington Puget Sound -- -- -- -- -- --Oregon -- -- 60.00 52.85 1.00 60.00 52.85California -- -- -- -- -- --
Columbia Basin inlandFreshwater sport
Mainstem -- -- 60.00 52.85 2.00 120.00 105.70Tributary -- -- 60.00 63.23 2.00 120.00 126.46
Gillnet -- -- -- -- -- --Tribal 16.89 9.99 -- -- -- --
Other -- -- -- -- -- --Hatchery surplus market 14.21 8.73 -- -- -- --Hatchery carcass 2.00 1.23 -- -- -- --
Notes: 1. Average 1998 dollars per fish. See text for an explanation on how REI and NEV are derived. 2. Hatchery sales include carcass and egg sales. 3. Two days per fish harvested include released wild and retained hatchery fish. For steelhead retained fish only, the CPUE is 0.17 fish
per day (or 5.88 days per fish). Source: Radtke et al. (1999).

II-6 kco D:\Data\Documents\hr\PikeminnowRpt.doc
setting to another as a benefit transfer approach. Each recreational fishing experience may create its own value based on the species, geographic area fished, and other variables. The value may or may not be similar to another experience. A review of studies in the Pacific Northwest supported the estimate of $52 per day as a general guideline for the NEV from the recreational fishing experience for both salmonids and northern pikeminnow fishing.1 b. Commercial Fishing To compute the NEV from commercial fishing, the costs of harvest (fuel, repairs, labor, etc.) should be subtracted from the gross revenues. Because the fishing season is of short duration, most fishing boats are not limited to salmon fishing. The investment in boat and gear is also used for other fisheries. Also, at low levels of total salmon harvest and with small incremental changes in salmon production, it is often argued that any increased harvest could be taken with almost the same amount of labor, fuel, ice, etc. as before. Since the current fisheries (both the harvesting sector and processing sector) are greatly overcapitalized, in use of fixed and operating capital as well as labor, this is a plausible assumption. This assumption implies that almost no additional costs are involved and gross benefits are close to net benefits. Generally, any valuation of salmon species involves a geographic area and a salmon species for which there are many substitutes. In such cases, the demand curve is relatively flat. That is, if consumers are faced with a rise in the price of one type of salmon in one area, they will simply shift their consumption to an alternative salmon product. In such cases, there are no extra benefits that could be counted resulting from consumers' willingness to pay different prices for a specific salmon product. Therefore, most economic valuations involving salmon will center on the benefits that a producer receives from the harvesting and processing of salmon. The assumption of full employment is implicit in most benefit and cost analysis. But unemployment and excess fishing capacity, both transitory and chronic, seem to prevail in many Pacific coastal communities dependent on commercial fishing. Changes in markets or fishing opportunities may make it necessary for people and capital to change occupations and/or locations. Various factors make it difficult for this to happen quickly enough to prevent a period of unemployment and idle capacity. The Water Resources Council (1979) suggests that when "idle boats" are available, the only incremental costs of increased harvest will be the operating costs.2 Rettig and McCarl (1984) make recommendations on the calculations of commercial fisheries NEV's. Their recommendations range from 50 to 90 percent of ex-vessel prices.3 Because
1 See Radtke et. al. (1999) for the review of these studies. 2. The estimates of "net value" of tribal harvest may be conservative. This conservative approach may be
balanced by assumption of ex-vessel prices that may be received by in-river tribal harvests (Water Resources Council 1979).
3. In many small coastal communities, there are no substitutes for the processor involved in the primary processing of salmon. Much of the salmon is partially processed on board the boat. For these reasons, the harvesting and primary processing is included. Wholesale and retail margins are not included. The basic reason is that demand curve is expected to be flat, thereby no appreciable "surplus." For retailers selling seafood, there are also a host of substitutes available.

II-7 kco D:\Data\Documents\hr\PikeminnowRpt.doc
primary processing is an integral part of producing salmon, a portion of the primary processor margins are also used to calculate the NEV of commercial fishing. Huppert and Fluharty (1996) utilized only the harvesting ex-vessel price and concluded that "All of these estimates are at or below the 50 percent net earnings rates suggested by Rettig or McCarl." (Rettig and McCarl 1984). (Processor margin is the difference between their purchase price, ex-vessel price, and their sales price.) In periods of reductions, the 90 percent rule would be appropriate. However, if the total salmon harvest increases, it might not be appropriate to use the 90 percent level. A more appropriate level might be the 50 percent level (the lower level recommended by Rettig and McCarl (1984)). In a situation where new resources (capital and labor) were needed to harvest and process a greater amount of salmon, the actual additional costs of harvesting and processing would have to be deducted from the ex-vessel price and the processors' margin in order to arrive at the NEV of additional salmon harvest.1 Because it is difficult to collect data on the commercial salmon fishing industry for specific areas and specific gears and almost impossible to compare such estimates on a wide geographic and industry basis, a general guidance may be to present information on ex-vessel basis (properly defined so as to be comparable) and on a first level primary processing basis. (This being the minimal amount of processing required to move the fish out of the region - dressing, icing, packing, etc.) The first level processor basis should be used because in many areas tendering costs and other costs and incentives of specific fisheries may not reflect the actual ex-vessel prices. It may also be argued that the first level processing in any area is inseparable from the harvesting component. A portion of the ex-vessel and ex-processor prices are therefore used as measures to facilitate guidelines in any of net value of commercial salmon fishing. Specific fisheries with acceptable data can be investigated to determine the net value of the fishery. For this analysis, in order not to complicate the presentation, a 70 percent margin is used to represent an "average" NEV for most commercial salmon harvested. The 70 percent margin is applied over a range of annual prices. The remaining 30 percent represents additional expenses of harvesting and primary processing required to produce a consumer product from Columbia River Basin anadromous fish runs. The above reasoning is also applied to the northern pikeminnow "commercial" fishery. These are the Tier 3 level anglers. Because there are no specific studies on this fishery, a very general rule and economic value approach is used in this report. c. Passive Use Values Economic value is very precisely defined as the relative value of a good or service, or what someone would be willing to give up (pay) in exchange for that good or service. This definition
1. Chronic underemployment of human and capital resources in rural areas on tribal lands may result in very low
incremental costs resulting from increased harvest opportunity. Other studies have suggested that the average cost increase with increased harvest opportunities may be two to nine percent (Barclay and Morley 1977). A two percent cost was utilized by Meyer in the Elwha Study (Meyer et al. 1995).

II-8 kco D:\Data\Documents\hr\PikeminnowRpt.doc
describes an anthropocentric view of value, that is, value to people (Goulder and Kennedy 1997). For a fishery resource to have economic value, people must be willing to give up other valuable resources (which can be represented by money) in order to have the fishery resource. Clearly this makes economic value a function of people's preferences and their ability to pay. When measuring economic value, it is not necessary to know why people value a resource (e.g., for nutritional, biological, or recreation reasons), but rather how much they value it relative to other things (Tietenberg 1996). This makes it clear that economics is the appropriate tool when the objective is to allocate scarce resources. (A scarce resource is defined as a resource that people desire and need and of which there is a limited amount. A resource such as air may not fit this definition unless clean air becomes polluted.) For example, if something of value must be given up to save native fish populations, society needs to know whether the native fish are worth more than what must be given up. Information about the biological, nutritional, or recreational value of fish will certainly affect people's willingness to pay for the resource, but the economist does not need to know the motives behind people's willingness to pay in order to make socially efficient resource allocations. The calculation for social efficiency requires information on the total value of resources, that value being the result of many different motives. While recognizing that total value is the goal, there are methodological issues related to the measurement of economic value that have led to distinctions among different types of economic value. People may value a particular resource such as the fishery because they either use the resource currently, or they intend to use it at some time in the future. Current and future use value can be either direct or indirect. An example of direct use value would be the willingness of anglers to pay for access to the salmon in ocean fisheries. This may be actual price paid, which may be market price or any price that may not signal a "market clearing" price; an angler may be willing to pay more than he is being charged on the market.1 An example of indirect use value would be the willingness of a reader to pay for a magazine account of a fishing trip to the Pacific Northwest. In both cases, someone had to actually use the site or resource in order for something of value to be produced. There are some people who are willing to pay for a resource, even though they never intend to use it. This type of non-use value is called existence value, because people are willing to pay to ensure that a resource exists, without knowing that they will ever actually use the resource. The motive for existence value may be that people want to ensure that a resource exists for future generations to enjoy. Some economists have separated this type of existence value into separate categories called bequest and option values, but they may be a subset of existence value. Some have described these values as a kind of insurance premium, to guarantee that the resource will be available when, and if, future use is desired by them or for others. Economists have defined and occasionally measured values associated with the simple presence of a fish population. The value is reckoned as the amount that people (defined appropriately) would be willing to pay to assure the existence of a fish stock, or to pay for a specified increase in the fish stock. For example, Olsen, Richards and Scott (1991) found that people who claimed
1. Panayotou (1992) showed that for ecosystem goods and services, commercial markets fail to adequately capture
the true value. Their common property nature prevents formation of efficient markets. The markets that do exist are fraught with imperfections that lead to undervaluation and/or over estimation.

II-9 kco D:\Data\Documents\hr\PikeminnowRpt.doc
no intention to catch or eat salmon from the Columbia River were still willing to pay on average $26.52 per year per household ($35.66 in 2003 dollars) to obtain a doubling of the salmon run size. Non-use values of this sort are non-exclusive, meaning that everyone who values the fish run obtains this value simultaneously (as contrasted with consumptive user values which accrue only to those catching fish in competition with others). Hence, assuming (1) that all households enjoy this non-use value, (2) that a doubling of the fish run means 2.5 million fish per year, and (3) that there are roughly 2.0 million households in the relevant region, that value of doubling the run would be $70.24 million/year.1 More recently, Layton, Brown and Plummer (1999) have estimated an individual value function for a variety of fish categories (including Columbia basin migratory fish) among Washington residents. Completed for the Washington Department of Ecology, that study developed a means of estimating WTP for any given increase in fish population from an assumed current level, and for two different "without program" fish population projections. For example, for a current fish population of two million and a projected stable future population of two million in the Columbia Basin, Layton, et al. find that the typical Washington household would be WTP $119.04 per year ($128.50 in 2003 dollars) for a 50 percent increase in the migratory fish population. This represents the total (use plus non-use) value for the fish population increase. With a total of two million households holding such values, the overall value per fish is a remarkable $268.08 ($289.38 in 2003 dollars). This particular estimate pertains to a rather broad class of fish, including all the salmon and steelhead stocks in the Columbia Basin. It is likely that the fishery resources including salmonids provide all of the above described use and non-use values to society. The decision about which ones to focus on for measurement is a function of the resource allocation question being asked. For example, if a particular fishery resource is not threatened with extinction, there is no need to measure the existence value of that resource. Since society would not be deciding whether to allocate scarce resources to save the fishery, the existence value is not relevant. If the policy decision under consideration is whether to invest resources to increase the fish populations, then the values which are measured must correspond to only the increase in fish numbers. In other words, total use value would not be the appropriate value to compare with the value of the resources necessary to increase the population by some incremental amount. Given the different types of policy decisions which might be relevant, as well as the fact that the existence of some Pacific Northwest fish populations may be in question, measurements of both total and marginal values are likely to be useful to decision makers. This discussion is included because some of these passive use values exist not only for salmonids, but also the northern pikeminnow. The northern pikeminnow has historical and cultural values that also should be considered in program designs having to do with exploitation. The present NPMP goals are to manage population levels and are not an extirpation program. 2. Regional Economic Impacts The NEV of the fishery resource has been defined as people's willingness to give up resources of value (money) to have the fishery resource. A common mistake that is often made in economic 1. Olsen, et al. take this as roughly the number of households in the Washington, Oregon, Idaho region in 1989.

II-10 kco D:\Data\Documents\hr\PikeminnowRpt.doc
analysis is to include the costs associated with using the fishery resource (e.g. travel costs, lodging costs, equipment) as part of the NEV from the resource. These associated costs, or expenditures, are instead the source of local or REI's associated with use of the fishery. The NEV must represent the value of the fishery resource itself, and not the value of the related travel and equipment items. For example, suppose the fishery was threatened by a hydropower development and policy makers wanted to know whether the anglers could "buy out" the hydropower interests. All of the money spent on travel and equipment is no longer available to be used to buy out the competing hydropower interests. However, the money that is left over, after all the costs of angling have been paid, is the net willingness to pay (consumer surplus) for the fishery resource (or fishing at the particular site). If extracted, this surplus could, in principle, be used to buy out the hydropower interests. Another way to view the difference between NEV and REI is to consider NEV as the net loss to society if the resource were no longer available. Suppose that a specific river fishery were no longer available to anglers, and they had to either fish somewhere else or engage in some other activity. The money spent on travel and equipment would not be lost to the financial economy - in fact it could be spent on travel and equipment or some other commodities in some other location. But the value anglers received from fishing that specific river would be lost. It must be assumed that one river's fishing was preferred over (had greater value than) those of the other rivers or activities, or the anglers wouldn't have chosen the original site in the first place. Their net willingness to pay for the chosen fishery versus other fisheries or activities would be a loss to society. Their expenditures or associated impacts on income or jobs would be a loss to the economy in the vicinity of the preferred river, but would be a gain to some other local economy. REI, therefore, describe the local or regional effects on jobs and income associated with any specific area chosen as the point of interest. The calculations for REI in this report are in personal income impacts. Corresponding measures for full time equivalent jobs may be developed by assuming the personal income is a person's average wage and salary or proprietors net income. It can be assumed in the Pacific Northwest that $30,000 is a reasonable estimate for a per job factor. The above example should make it clear why local economies are often more concerned about REI than NEV, especially when the economic values are in the form of consumer surplus. If anglers are willing to pay some amount of money over and above their costs, but don't actually have to pay, the consumers get to take that surplus or value home with them in the form of "unextracted" income. It is not immediately obvious to local businesses that the consumer surplus generated from any specific fishery has any impact on the local economy. On the other hand, money spent on lodging, food, supplies, guides, etc., has a direct impact on local businesses and on personal income in the local area. It is clear that NEV and REI are two distinct measures, and each is useful for different purposes. NEV's are important if the goal is to allocate society's resources efficiently. REI's are important in assessing the distributional impacts of the different allocation possibilities on the financial economies of areas. It may often be the case that society will want to invest in a less valuable resource because the local area or economy that holds the resource is in need of economic

II-11 kco D:\Data\Documents\hr\PikeminnowRpt.doc
development. Nevertheless, having the information on economic value will tell society how much they are giving up in order to achieve the redistribution of economic activity or development. Some of the REI may be new to an area, some of these may be considered a transfer from one region or industry to another. This issue is not considered in this study. For example, the expenditures on the NPMP for the sport fishing program may be a transfer from electricity paying consumers in Portland or California to anglers and businesses in eastern Oregon. These are allocation and equity issues and are not addressed. a. Input/Output Models Economic input/output (I/O) models are used to estimate the REI from resource changes or to calculate the contributions of an industry to a regional economy. The basic premise of the I/O framework is that each industry sells its output to other industries and final consumers and in turn purchases goods and services from other industries and primary factors of production. Therefore, the economic performance of each industry can be determined by changes in both final demand and the specific inter-industry relationships. The models developed for this project utilize one of the best known secondary I/O models available. The U.S. Forest Service has developed a computer system called IMPLAN which can be used to construct county or multi-county I/O models for any region in the U.S.1 The regional I/O models used by the Forest Service are derived from technical coefficients of a national I/O model and localized estimates of total gross outputs by sectors.2 IMPLAN adjusts the national level data to fit the economic composition and estimated trade balance of a chosen region. Areas that are any combination of single counties can be constructed using IMPLAN. The Fishery Economic Assessment Model (FEAM) uses the IMPLAN coefficients to generate the REI from ocean salmon harvests.3 The FEAM model process is outlined in Figure II.1. Estimates of REI from composite stocks harvested from California to Alaska are determined by the information made available on contributions of Columbia River stocks to the ocean fisheries. b. Regional Economic Impacts Model Application On the commercial side, representative budgets from the fish harvesting sector and the primary fish processing sector are used to estimate the impacts of changes. On the recreational side, charter operator budgets and recreational fishermen destination expenditures provide the basic data. The individual expenditure categories are used as input into the IMPLAN I/O model to estimate the total community income impacts. 1. The IMPLAN model is now being offered for general use by the Minnesota IMPLAN Group (Olson et al.
1993). 2. The available IMPLAN models are generally three to four years behind calendar years. This is due to data
availability and the time it takes to prepare the models. Unless very dramatic changes take place in a regional economy, the sector coefficients will not change dramatically from year to year.
3. The FEAM was developed for the West Coast Fisheries Development Foundation by Hans Radtke and William Jensen in 1986.

II-12 kco D:\Data\Documents\hr\PikeminnowRpt.doc
Figure II.1 The Fisheries Economic Assessment Model Process
• Based on IMPLAN • Build I/O coefficients for fishing related expenditures • Harvest data • Primary processing data • Economic impacts measured by personal income • Translate to full time job equivalents • Geographic areas
Source: Study. i. Commercial Fishing Regional Economic Impacts Representative budgets from the fish harvesting sector and the fish processing sector are used to estimate the REI from commercial salmon fishing. The commercial salmon fisheries budget data are from the FEAM. REI by species and geographic region used in this report are listed in Table II.4. Part of the carcass and hatchery surplus sales creates economic activity and the REI for this use is separately listed in Table II.4. The FEAM model approach was also used for estimating the northern pikeminnow REI for the high volume anglers (highliners). It was assumed these anglers acted more as a commercial fisherman than a recreational angler. Table II.5 shows an analogous commercial fisherman's annual budget. The economic multipliers for the budget expenditures are also shown. The total REI is summed over the expenditure categories. In 2002 for example, each of the 125 fisherman in this highliner category catches 709 fish and receives $4,254. The total REI for harvesting is $4,796 or $6.76 per fish. Fish meal or fish compost processing generally adds another $0.25 per pound and a northern pikeminnow average weight is about 1.1 pounds. Therefore, the total REI is estimated to be $7.04 per fish. ii. Recreational Fishing Regional Economic Impacts ODFW sponsored a comprehensive survey to compile information about angler characteristics, expenditures, and preferences of recreational anglers (The Research Group 1991). This study also estimated REI for seven management zones, eight species categories, and four water types. The REI estimates were completed with the same process of disaggregating the IMPLAN model and estimating impacts relating to specific expenditure categories, as is explained for commercial fisheries. This study has been used as the basis for showing the annual economic impacts of West Coast salmon fisheries (PFMC 2004). Assumptions from PFMC model are extended to calculating the impacts from salmon harvested in Alaska and British Columbia. The REI estimates associated with recreationally-fished ocean salmon are shown in Table II.4. Factors affecting these estimates include the means of fishing, expenditures patterns, and success ratios. (It is assumed there will be legal access to the fish during the time they become available in any specific area.) The REI per salmon/steelhead harvested recreationally varies considerably
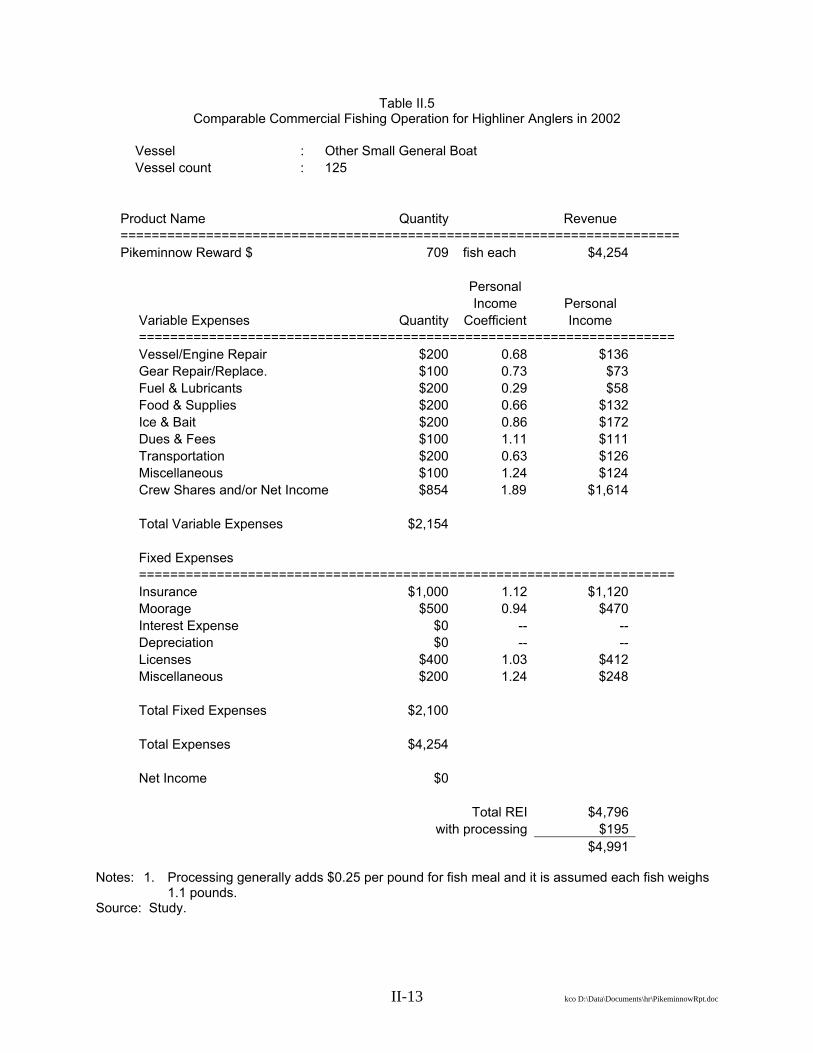
II-13 kco D:\Data\Documents\hr\PikeminnowRpt.doc
Table II.5 Comparable Commercial Fishing Operation for Highliner Anglers in 2002
Vessel : Other Small General Boat Vessel count : 125 Product Name Quantity Revenue ======================================================================== Pikeminnow Reward $ 709 fish each $4,254 Personal Income Personal Variable Expenses Quantity Coefficient Income ===================================================================== Vessel/Engine Repair $200 0.68 $136 Gear Repair/Replace. $100 0.73 $73 Fuel & Lubricants $200 0.29 $58 Food & Supplies $200 0.66 $132 Ice & Bait $200 0.86 $172 Dues & Fees $100 1.11 $111 Transportation $200 0.63 $126 Miscellaneous $100 1.24 $124 Crew Shares and/or Net Income $854 1.89 $1,614 Total Variable Expenses $2,154 Fixed Expenses ===================================================================== Insurance $1,000 1.12 $1,120 Moorage $500 0.94 $470 Interest Expense $0 -- -- Depreciation $0 -- -- Licenses $400 1.03 $412 Miscellaneous $200 1.24 $248 Total Fixed Expenses $2,100 Total Expenses $4,254 Net Income $0 Total REI $4,796 with processing $195 $4,991
Notes: 1. Processing generally adds $0.25 per pound for fish meal and it is assumed each fish weighs
1.1 pounds. Source: Study.

II-14 kco D:\Data\Documents\hr\PikeminnowRpt.doc
by geographic area whether a fishing trip was guided or used a boat. Both of these fishing modes have higher expenditures per day than bank fishing, and therefore have higher REI. Since estimating procedures usually start with catch numbers and REI's are based on expenditures per angler day, per day catch success rate is an important assumption. For ocean fishing, one fish per day success rates are used. This may range widely, depending upon area and species. Within the Columbia Basin, the success rates vary from species to species and by geographic area. Carter (1999) utilizes a one fish per day success rate for ocean fishing and up to two days per fish success rates for inland fishing. For tributaries above the Columbia/Snake confluence, two days per non-retained fish success rates are utilized (Bowler, July 1999). For steelhead retained, the fish per day success rate is 5.88 days. For the northern pikeminnow recreational fishery, study results from The Research Group (1991) were used to estimate expenditure patterns and resulting REI from recreational fishing per day. The estimated REI for fishing in the Columbia River adjusted to 2002 dollars is $30 per day. These are comparable to $15.11 to $17.65 per day expenditure and resulting REI reported in Hanna and Pampush (1990). An informal survey to test a possible survey tool explained in another chapter found the respondents listed expenditures between $7.50 and $40 per day. Based on this background information the $30 per day is probably a reasonable estimate for northern pikeminnow fishing expenditures. iii. Catch Utilization Hanna and Pampush (1990) analyzed the potential for using catch for human consumption and the carcass for fish meal and liquid fertilizer. Their conclusion was that there would be little food fish demand and insufficient quantities for any specialty market for the fish meal and liquid fertilizer. Oregon State statutes dictate that game fish have to be utilized, so at present the gathered northern pikeminnows are held in cold storage and then at year's end taken to a rendering plant where they are combined with other animal protein for use as feed or a fertilizer additive. The FEAM estimates the economic impacts for other types of fish by-products usage to be about $0.25 per pound. It was decided to use this same estimate as the measure for final disposition of the northern pikeminnow. 3. Cost-Effectiveness Analysis CEA compares the costs and results of alternative actions, or groups of actions, that could be taken to accomplish a specific quantifiable objective. The essential requirements are a measurable objective (or reasonable proxy) and the economic costs of various actions that could be taken to achieve that objective. A CEA is, fundamentally, a comparison of forecasts of what would happen under at least two alternative courses of action. An action scenario is an action or a group of actions that might be packaged together to accomplish the same objectives. CEA compares their costs and amount of accomplishment (effectiveness) to the status quo scenario.

II-15 kco D:\Data\Documents\hr\PikeminnowRpt.doc
CEA can be used to search for and identify scenarios that meet the cost-effectiveness criteria defined by the Northwest Power Planning Act (NPPA). The example analysis of predation of juvenile passage in this report seeks to identify scenarios that are expected to increase the objective (juvenile survival) and reduce net costs (power losses plus costs of actions). This criterion is intended to be consistent with the intent of the NPPA. The cost-effectiveness of the NPMP is compared to other suggested programs that seek to increase juvenile survival and reduce projected power loss due to summer spill. CEA has a number of inherent limitations. A particular limitation is where there are multiple objectives that cannot be measured in common units, and so cannot be compared on the same basis. In such cases, there is no definitive basis for choosing among scenarios based on cost-effectiveness unless one scenario happens to be the best for all the objectives. One of the most important limitations of CEA is that it does not consider whether the given objective has a value that is greater than its cost. CEA seeks to meet an objective, but it does not address the value of meeting the objective. The objective is taken as a given. CEA cannot identify the scenario with the most economic benefit because the economic benefit of the objective is not considered. CEA can be used, however, to identify efficiency improvements. If we are able to produce more fish at less cost, that is clearly an efficiency improvement, even if the most efficient result is to produce more fish at higher cost or fewer fish at lower cost. In many cases, it is not practical or even desirable to place dollar estimates on the objective, and CEA is the best tool for this situation. For example, most economists would agree that it is difficult to place a dollar value on wild salmon and steelhead. But for CEA, all that is needed is a measure of effectiveness. For this study, past studies, critiques, and reports are used to identify the expected increase in juvenile salmonid survival rates due to decreased predation by northern pikeminnow. The information provided is taken as given without an evaluation of the biological certainty of the information. The primary focus of this evaluation is to analyze the NPMP in relation to other programs as suggested by the IEAB. B. Results 1. Net Economic Value This study does not attempt to measure the program's total benefits over time in relation to its costs. It only provides simple one-time estimates of NEV from fishing for northern pikeminnow and anadromous fish due to the NPMP. Table II.6 describes the catch and reward payouts for the NPMP in 2002. The assumed expenditures for the highliners (all anglers in the Tier 3 category) evaluated as a commercial fishery are shown in Table II.5. The estimated NEV from northern pikeminnow fishing is $0.4 million for the highliners and $1.4 million for the recreational fishery, or a total of $1.8 million in 2002 (Table II.7). Depending on which alternative is used to estimate hatchery releases, SAR, and harvest levels, the NEV of the anadromous fish fisheries (recreational and commercial) ranges from $1.8 to $6.8 million (Table II.8). Passive use values are not quantitatively analyzed.

II-16 kco D:\Data\Documents\hr\PikeminnowRpt.doc
2. Regional Economic Impacts Expenditures in any region will create jobs and therefore personal income. I/O modeling estimates the final distribution of these impacts without regard to the source of the initial expenditure. In the case of the NPMP, there are three components for created expenditures. These are the expenditures related to pikeminnow angling, the administrative program itself, and the estimated increase in economic activity related to harvesting salmonids that survived to adulthood due to decreased predation on juveniles passing through the Columbia/Snake River systems. Each component was evaluated separately. a. Sport Fishing Reward Program A total of $1.0 million was paid out for a total of 199,220 fish in 2002 (Table II.6). The highliner category contains 125 anglers (five percent) that catch 44 percent or 88,630 fish. The REI of this highliner category is estimated to be $0.6 million (Table II.7). The estimated REI of the other 2,340 recreational anglers who fished 26,771 days is estimated to be $0.8 million. Therefore, the total pikeminnow fishing REI is estimated to be $1.4 million. b. Program Administration During 2002 the NPMP project was budgeted for a total of $2.8 million (Table II.9). The total REI was $3.5 million, with the assumption that the sport reward program was about $1.4 million. However, the sport reward money will be spent by anglers, which is counted separately. Also, the dam-angling and site-specific angling was discontinued after 2002. Therefore, the impact of administrative spending is $2.1 million. The actual program administration expenditures vary from year-to-year, so the choice for using the proposed budget in 1999 should be viewed as providing a representative REI for these types of expenditures. c. Increased Adult Salmonid Fishing The objective of the NPMP is to increase the downstream survival of juvenile salmonids produced in the Columbia Basin so that more are available to harvest and return to spawn. The expected increase in ocean and in-stream harvests ranges from 72,585 to 264,754, depending on the estimate for downstream salmonid migration numbers, SAR's, and harvest management regimes. The resulting REI ranges from $2.7 to $9.9 million (Table II.8). 3. Cost-Effectiveness Analysis a. Comparison With External Programs As previously explained, CEA differs from NEV and REI economic analysis approaches. CEA instead asks the question: given a particular objective, which is the least cost way of achieving it? Thus, it facilitates choice among options, but cannot answer whether or not any or all of the options are worth doing. CEA is used instead of NEV and REI analysis when there are difficulties in associating monetary values with outcomes, but where the outcomes can be defined or quantified in non-monetary fashion (Pearce 1992).

II-17 kco D:\Data\Documents\hr\PikeminnowRpt.doc
Table II.6 Northern Pikeminnow Fishery Angler Activity in 2002
Catch Rewards Tier 1 54,903 $219,612Tier 2 55,687 $278,435Tier 3 88,630 $531,780 199,220 $1,029,827
Tags returned ($100): 160 $16,000Coupons returned ($4): 2,001 $8,004Total fish paid: 199,380 Total reward dollars paid: $1,053,831 Total northern pikeminnow caught 202,068 including vouchers not submitted
Number of anglers @ Tier 1 2,153 Number of anglers with 10 fish or less: 1,536Number of anglers @ Tier 2 187 Number of anglers with 2 fish or less: 636Number of anglers @ Tier 3 125 Number of separate anglers 2,465 Total angler days: 30,521 CPUE: 6.62
Table II.7 Economic Analysis Results for Northern Pikeminnow Fishery Angler Activity in 2002
Assumptions
1) Anglers considered commercial operations numbered 125 receiving an average revenue of $4,254 per year and they catch 88,630 fish or 709 each. Use FEAM model for "Other Small General Boat" with $4,991 for REI and 70% revenues for NEV.
2) If Tier 3 (125 anglers) fished 30 days each and caught 88,630
fish, then Tier 1 (2,153 anglers) and Tier 2 (187 anglers) caught 144,317 fish (62 each) in 26,771 days at average of $213 per year. Use 1991 Oregon Angler Survey and Economic Study for Columbia River adjusted to 2002 at $30 per day for REI, and Radtke et al. (1999) adjusted to 2002 at $52 per day for NEV.
Results
NEV REI
Highliner $372,225 $623,875
Recreational $1,392,092 $803,130
Total $1,764,317 $1,427,005 Source: Study.
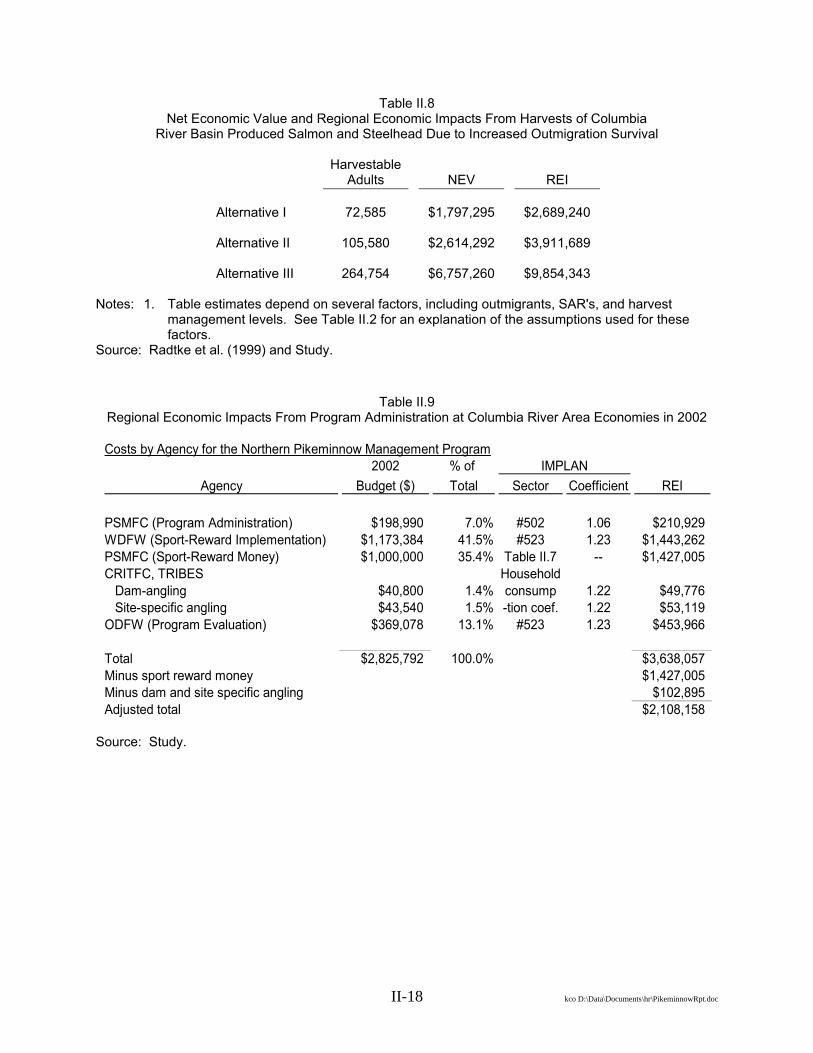
II-18 kco D:\Data\Documents\hr\PikeminnowRpt.doc
Table II.8 Net Economic Value and Regional Economic Impacts From Harvests of Columbia
River Basin Produced Salmon and Steelhead Due to Increased Outmigration Survival
Harvestable
Adults NEV REI Alternative I
72,585 $1,797,295 $2,689,240
Alternative II
105,580 $2,614,292 $3,911,689
Alternative III 264,754 $6,757,260 $9,854,343 Notes: 1. Table estimates depend on several factors, including outmigrants, SAR's, and harvest
management levels. See Table II.2 for an explanation of the assumptions used for these factors.
Source: Radtke et al. (1999) and Study.
Table II.9 Regional Economic Impacts From Program Administration at Columbia River Area Economies in 2002
Costs by Agency for the Northern Pikeminnow Management Program
2002 % of IMPLANAgency Budget ($) Total Sector Coefficient REI
PSMFC (Program Administration) $198,990 7.0% #502 1.06 $210,929WDFW (Sport-Reward Implementation) $1,173,384 41.5% #523 1.23 $1,443,262PSMFC (Sport-Reward Money) $1,000,000 35.4% Table II.7 -- $1,427,005CRITFC, TRIBES Household Dam-angling $40,800 1.4% consump 1.22 $49,776 Site-specific angling $43,540 1.5% -tion coef. 1.22 $53,119ODFW (Program Evaluation) $369,078 13.1% #523 1.23 $453,966
Total $2,825,792 100.0% $3,638,057Minus sport reward money $1,427,005Minus dam and site specific angling $102,895Adjusted total $2,108,158
Source: Study.

II-19 kco D:\Data\Documents\hr\PikeminnowRpt.doc
The Northwest Power Act requires that projects and approaches considered by the NPCC to achieve biological objectives be cost-effective. For example, some interests in the region are considering if it is possible to achieve targeted levels of juvenile salmonid survival with reduced spill offset by other techniques for reducing mortality (IEAB 2004). The estimated biological effects of the NPMP on juvenile salmonids are shown in Table II.10. Costs of the NPMP are shown in comparison to total northern pikeminnow harvest in Table II.11. The average annual cost for the period 1991 to 1996 covered in the Friesen and Ward (1999) analysis was $4.7 million; however, more recently in the 1997 to 2003 costs have been close to or under $3.0 million annually.
Table II.10 Effects of Northern Pikeminnow Management Program 1991 to 1996
Mean annual consumption of juvenile salmonids by northern pikeminnow:
Without NPMP 15.2 millionWith NPMP 11.4 millionReduction 3.8 millionPercentage 25%
Notes: 1. The modeling for this table is done on a five year rotation. ODFW is updating the model in
2004, but results were not available at the time of study publication. Source: Friesen and Ward (1999).
Table II.11 Northern Pikeminnow Management Program Costs and Harvests 1990 to 2004
Year NPMP Cost Total NPM
Harvest
Cost per NPM
Harvested 1990 $1,241,813 17,330 $71.66 1991 $5,259,629 200,070 $26.29 1992 $6,846,410 223,538 $30.63 1993 $4,253,600 125,286 $33.95 1994 $3,670,707 154,555 $23.75 1995 $4,311,186 214,383 $20.11 1996 $3,846,248 168,158 $22.87 1997 $3,730,347 125,370 $29.75 1998 $3,259,230 114,887 $28.37 1999 $3,306,000 119,850 $27.58 2000 $3,104,592 190,441 $16.30 2001 $2,779,992 244,168 $11.39 2002 $2,825,792 202,068 $13.98
2003 (estimated) $2,601,745 197,977 $13.14 2004 (preliminary BPA) $2,220,000 1991 to 1996 Average $4,697,963 180,998 $25.96 1997 to 2003 Average $3,090,692 170,562 $20.10 1991 to 2003 Average $4,033,449 175,379 $23.00
Source: Adapted from Hankin and Richards (2000)
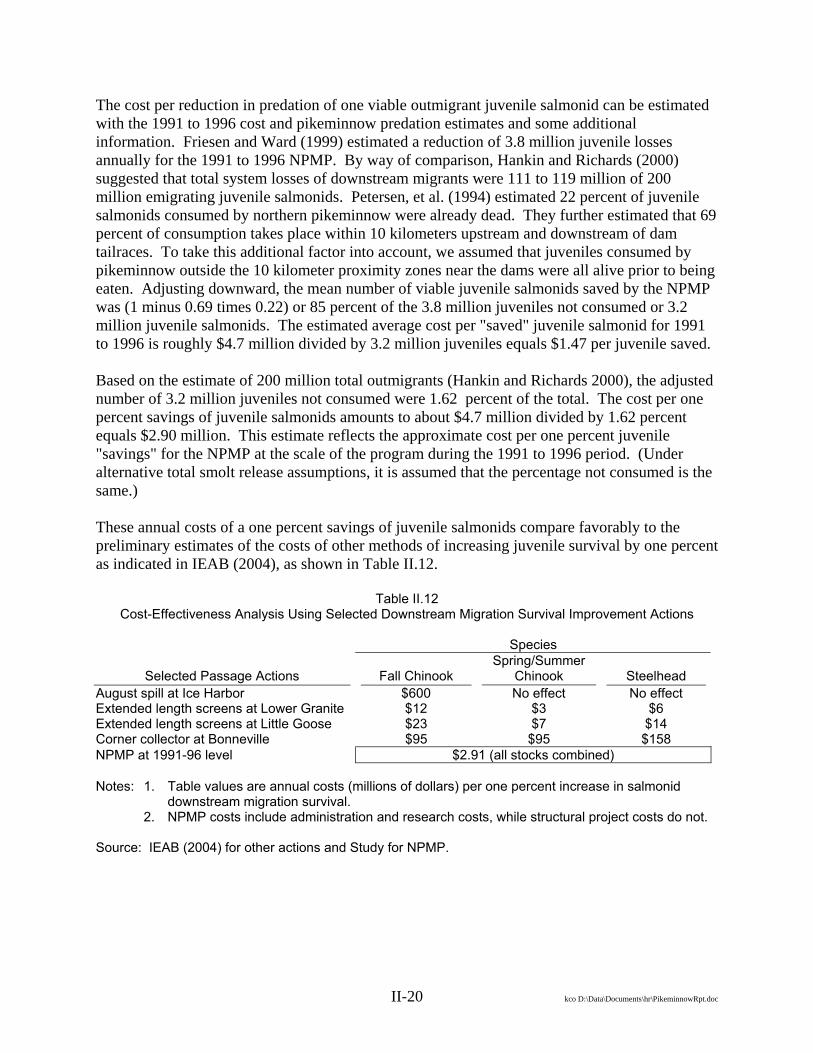
II-20 kco D:\Data\Documents\hr\PikeminnowRpt.doc
The cost per reduction in predation of one viable outmigrant juvenile salmonid can be estimated with the 1991 to 1996 cost and pikeminnow predation estimates and some additional information. Friesen and Ward (1999) estimated a reduction of 3.8 million juvenile losses annually for the 1991 to 1996 NPMP. By way of comparison, Hankin and Richards (2000) suggested that total system losses of downstream migrants were 111 to 119 million of 200 million emigrating juvenile salmonids. Petersen, et al. (1994) estimated 22 percent of juvenile salmonids consumed by northern pikeminnow were already dead. They further estimated that 69 percent of consumption takes place within 10 kilometers upstream and downstream of dam tailraces. To take this additional factor into account, we assumed that juveniles consumed by pikeminnow outside the 10 kilometer proximity zones near the dams were all alive prior to being eaten. Adjusting downward, the mean number of viable juvenile salmonids saved by the NPMP was (1 minus 0.69 times 0.22) or 85 percent of the 3.8 million juveniles not consumed or 3.2 million juvenile salmonids. The estimated average cost per "saved" juvenile salmonid for 1991 to 1996 is roughly $4.7 million divided by 3.2 million juveniles equals $1.47 per juvenile saved. Based on the estimate of 200 million total outmigrants (Hankin and Richards 2000), the adjusted number of 3.2 million juveniles not consumed were 1.62 percent of the total. The cost per one percent savings of juvenile salmonids amounts to about $4.7 million divided by 1.62 percent equals $2.90 million. This estimate reflects the approximate cost per one percent juvenile "savings" for the NPMP at the scale of the program during the 1991 to 1996 period. (Under alternative total smolt release assumptions, it is assumed that the percentage not consumed is the same.) These annual costs of a one percent savings of juvenile salmonids compare favorably to the preliminary estimates of the costs of other methods of increasing juvenile survival by one percent as indicated in IEAB (2004), as shown in Table II.12.
Table II.12 Cost-Effectiveness Analysis Using Selected Downstream Migration Survival Improvement Actions
Species
Selected Passage Actions Fall Chinook Spring/Summer
Chinook Steelhead August spill at Ice Harbor $600 No effect No effect Extended length screens at Lower Granite $12 $3 $6 Extended length screens at Little Goose $23 $7 $14 Corner collector at Bonneville $95 $95 $158 NPMP at 1991-96 level $2.91 (all stocks combined) Notes: 1. Table values are annual costs (millions of dollars) per one percent increase in salmonid
downstream migration survival. 2. NPMP costs include administration and research costs, while structural project costs do not. Source: IEAB (2004) for other actions and Study for NPMP.
II-21 kco D:\Data\Documents\hr\PikeminnowRpt.doc
b. Application for Evaluating External Program Alternatives The usefulness of CEA can be shown using the example for the NPMP being proposed as a tool to offset reduced spill at one or more hydroelectric dams. Several factors will influence the feasibility of this proposal. Among the factors is the cost-effectiveness of an expanded NPMP - the additional cost of an offsetting increase in juvenile salmon survival to maintain the overall survival rate should spill be reduced or eliminated. The additional cost per one percent increase in juvenile savings can be estimated using the information above, assuming that NPMP costs are linear with regard to program expansion and savings of juvenile salmonids. Assuming total outmigrants number about 200 million juvenile salmonids, a one percent increase in surviving outmigrants amounts to about two million (or more under alternative smolt release estimates) additional juveniles, compared to the projected number of 2,964,000 saved juveniles under the NPMP as indicated above. Based either on the cost per "saved" juvenile or the cost per percent increase in juvenile survival, expected annual costs would be about $2.90 million per one percent increase, provided the program can be expanded according to a linear cost function. As indicated above, this would compare favorably to the costs of some of the other methods of increasing juvenile survival by one percent or some portion thereof. The simple cost-effectiveness estimate of an NPMP expansion developed above depends critically upon the assumption that the costs of program expansion increase proportionally to the current cost per juvenile saved. Some costs may increase only moderately as program size increases, e.g., administrative costs. Further analysis of northern pikeminnow harvests for the different program structures and cost levels that have occurred since the program's inception may provide additional information on potential economies of scale. More recent program costs have been lower than in most years since 1991 to 1996. As noted in Friesen and Ward (1999), "A detailed cost analysis of removal efforts among the different fisheries and areas would further enhance evaluations of effectiveness." Research is needed to bring compensation mortality into the analysis of the alternatives. Using the lower average cost per harvested pikeminnow average for 1997 to 2003, an approximation of the more recent costs of producing a one percent increase in juvenile salmon can be calculated. It is assumed the program saved about the same number of juveniles as it did in 1991 to 1996. Under these assumptions, the cost per one percent annual increase in saved juveniles is about $1.91 million per year. This probably understates the cost somewhat because, as shown in Table II.11, about 10,000 fewer pikeminnow were harvested annually on average during the later period. None of the estimates of reductions in juvenile predation for particular programs and structural improvements seem to take into account the compensatory losses by other downstream sources of mortality. Hankin and Richards (2000) note that actual savings of juvenile salmonids from the NPMP depends not only on the reduction in the force of pikeminnow predation, but also on the intensity of all other forces of mortality.

II-22 kco D:\Data\Documents\hr\PikeminnowRpt.doc
It may be difficult to increase NPMP harvest of northern pikeminnow in direct proportion to an enhancement in program size or cost beyond a certain level. As noted in Takata and Ward (2002), "Although some modest reductions in predation have been achieved since 1999, further reductions are likely to be minimal if exploitation continues at mean 1995 to 2001 levels. Even if exploitation rates remain near the exceptionally high levels seen in 2001, relative predation will not decline to any significant extent. We assume that juvenile salmonid predation will probably not change much from 76 percent of the pre-program level." One aspect of the difficulty concerns the effectiveness of the sport reward system to encourage additional angler effort and associated catch. The 2001 reward increase allegedly led to a large increase in angler fraud, making it difficult to assess the actual effect of increased rewards on the pikeminnow catch and population in the project area (State, Federal and Tribal Fisheries Joint Technical Staff 2004). Increasing the reward per fish may not be effective in achieving the desired level of increased pikeminnow harvest. This suggests that large rewards for specially tagged fish in the project area may be the best way to significantly increase the scale of the sport reward fishery. Determining what the size and number of these rewards should be to produce the desired increase in northern pikeminnow removal would most likely require some adjustments as time progressed. More importantly, the major limitations of the CEA on reaching juvenile survival targets are numerous biological and cost uncertainties (IEAB 2004). The cost to increase juvenile salmonid survival will not be proportional to cost if there are significant interactions between spill and northern pikeminnow predation. Zimmerman and Ward (1999) indicated spill may reduce predation by about 50 percent. A report by the State, Federal and Tribal Fisheries Joint Technical Staff (2004) has suggested that reduced spill would probably tend to reduce the number of juvenile salmonids saved at current NPMP levels. The hypothesis that a one to two percent increase in the pikeminnow exploitation rate would result in savings of 0.7 to 1.4 million juvenile salmonids may be suspect in their view. According to the report, predation on juvenile salmonids by northern pikeminnow will likely increase in the absence of spill, adding to the number of salmonids required to be saved by any offset measure. If so, reducing spill would increase the cost of achieving the total desired increase in the number or percent of juveniles saved compared to the savings under the current spill and NPMP situation. The report has also expressed skepticism about basing the results of an expanded NPMP witnessed in the 2001 reward increases. Because of the wide confidence limits around estimates of the NPMP's exploitation rate on northern pikeminnow, the report indicated an increase of one to two percent in the pikeminnow exploitation rate is probably not substantial enough to realize any detectable reductions in predation on juvenile salmonids. In other words, it will probably be impossible to verify the efficacy of this offset under the existing monitoring programs.

III-1 kco D:\Data\Documents\hr\PikeminnowRpt.doc
III. REWARD SYSTEM EVALUATION A. Participant Surveys The Hanna and Pampush studies starting in 1989 through 1993 addressed social, regulatory, and enforcement issues related to the NPMP. Their studies provided monitoring data useful for evaluating angler characteristics and behavior and evaluating the program operational design. The studies began when the program was starting and provide useful baseline information. They addressed such issues as the need for promotion and angler training material, policies and levels of enforcement, structuring, reward amounts, and providing for convenient catch verification mechanisms. The studies also reviewed the feasibility for other alternative operations, such as the catch utilization as human food. The studies were discontinued in 1993 and comprehensive angler economic preference information has not been surveyed since then. This is unfortunate because much has changed in the last 10 years. The general economic conditions, smolt passage programs, NPMP awareness, and even the pikeminnow population has changed. Survey information related to economic considerations can provide valuable feedback that should influence the efficiency and effectiveness of NPMP operations. Certain information required to evaluate the NPMP can only be generated through user surveys. Angler motivation, response to payment structures, and identification of operational conflicts especially need user survey information. A secondary benefit of surveys is acquisition of characteristic and behavior data to provide sound economic analysis modeling results. Creel staff interviews provide important information, but can bias findings towards negative feedback from the more vocal complainers and overlook aspects of the program that are successful. The recommendations by Hankin and Richards (2000) to further study the tiered reward system would require the survey information. Also, their recommendation that promotion costs can be lowered could be dispelled with the survey information if it is shown awareness levels are very low and that advertising and training costs will increase participation. It is recommended that new surveys be conducted on a regular basis to provide the economic and operational data for the proper monitoring of the program. Surveys should be administered to those that participate and anglers that do not participate. In the case of participants, a well designed sampling plan would provide valid results and thereby lower survey administrative costs and decrease user inconvenience. Incentives could be offered for being interviewed in order to increase response rates. With this in mind, the Hanna and Pampush (1993) survey questionnaire was reviewed for content and ambiguousness. A new instrument was designed to meet several objectives. First, the content must be similar so that straightforward comparisons could be made with baseline data to show trends. Second, preference information has to be included to determine any participation barriers. The following general categories of information need to be included:
• Angler characteristics • Trip data

III-2 kco D:\Data\Documents\hr\PikeminnowRpt.doc
• Preferred fishing locale and method • Equipment used • Fishing type (northern pikeminnow targeted or incidental) • Motivations for fishing and reasons why anglers might not fish more frequently • Satisfaction with fishing experiences • Perceptions of the NPMP • Satisfaction with current NPMP operations • Suggestions for improving NPMP • Preferences for receiving information about NPMP • Payment level and structuring reactions
Third, the instrument has to be designed to remove biases from knowledge (too specific) and frustration (too long leading to respondent fatigue). A new suggested survey instrument is presented as a draft in Appendix A. There is a lot of goodwill generated by the NPMP. A survey administration plan can capitalize on this goodwill by ensuring an adequate response rate. The survey can either be administered as an exit interview or as mail-out with telephone follow-up. Controlled exit interviews are always better for accuracy and response rate reasons, so it is not recommended a mail-out questionnaire be used. A telephone follow-up will allow questions to be more detailed and assess complete trip information. Response rate should not be a problem, especially if the survey is designed to ask respondents to help improve an already popular program. However, with changes in telephone answering etiquette with surveys having to compete with telephone solicitors, the emphasis should be on getting as much behavior and belief information during the exit interview. A certain stratification of participants should have a special subset of questions. New entrants and those with that exist the fishery may have important feedback about awareness and operation problems. The list for this strata can be obtained post-survey if the survey instrument and result database is properly constructed. A non-participant market survey should also be undertaken. Non-participant lists would be from angler license databases. The survey would determine levels of awareness, perceptions about payment structures, and other program operation design in order to determine any participation barriers that need to be overcome. B. Trial Survey Results A trial telephone survey was administered using the new instrument. A list was generated using 2002 participants. The list was stratified by five levels of participation corresponding to effort, and a random sample was drawn from each strata. The effort categories were: one trip, two trips, three to five, six to 40, and greater than 40. A list of 40 households was identified. Each household on the list was called at least once. The response rate was about 30 percent. The definition for non-response includes households that did not answer or answering machine, wrong or disconnected telephone numbers, uncompleted interviews, as well as refusals.
III-3 kco D:\Data\Documents\hr\PikeminnowRpt.doc
The purpose of the trial survey was an informal test of the survey instrument. The reactions of the respondents are noted below.
• Age. The respondents ranged from a 72 year old retiree to a 16 year old girl. Most respondents were in the 25 to 50 year range.
• Location. About half of the respondents lived and fished in the lower Columbia. The others lived and fished in the middle Columbia and the Snake River system.
• Traveled. The range of travel to fishing site ranged from a couple of miles to over 100 miles. For most participants, it is a daily outing close to home. Retirees tend to make the experience an outing where they will stay over several nights on the banks of the river in their RV.
• Party size. Very few fished by themselves. Young people and females took part in the experience as a group or family outing. The participants that harvested a number of fish on the upper end of the scale tended to fish by themselves.
• Fishing method. Most respondents fished off the bank. The type of bait or tackle varied. However, worms were mentioned as the bait of choice. Other bait mentioned was chicken livers, chicken skin, and/or cut up fish of any type. Some used "plastic stuff," spinners or spoons.
• Number of fish caught. The contacted respondents' effort, catch, and payoff ranged as follows: - Effort 1 to 61 trips - Catch 1 to 1,442 pikeminnows turned in - Reward paid $4 to $8,152 reward This information was known to the interviewer from program records, but was asked as a test for memory bias.
• Expenditure per trip range. The expenditure per day ranged from $7.50 to $40.00. Other information of respondents:
• Ages of those participating range from the low teens to those in their 70's. A majority of the participants were concentrated in the 31 to 50 age range.
• Most participants are concentrated in the lower Columbia. • Most participants travel less than 20 miles and spend about five to seven hours fishing
per trip. For most fishermen, it is a one day experience with no out of area overnight stay.
• The average party size was about two people. • The most common method reported was fishing from shore. • The most common type of bait or tackle was worms, followed by a variety of spinners
and plastic plugs, etc. • The catch ranged from none to several hundred per day. The average is about five fish
per day. Every participant responded favorably to this trial survey.

III-4 kco D:\Data\Documents\hr\PikeminnowRpt.doc
The major reason for participating in the NPMP is the recreational experience (alone and with friends or family) and knowing that they are participating in a salmon enhancement program. The added incentive is to cover costs and bring in a few dollars. Payment for catches was rated "not important" by two respondents. Generally, the reaction is that they are having a good time, they are convinced they are doing something good for the environment, and they have a chance to cover expenses and maybe even make some extra spending money. Most are very pleased about the program but have some suggestions to make it a better program. 1) Education and Information. Most felt that not enough is known about the program.
More information about the program is needed in local news media and local sporting stores. Also, some respondents suggested a training program for beginners and even for those who have participated in the past. One suggestion was made to start a "master pikeminnow catcher" program, patterned after the master hunter or master gardener programs. Along these lines, suggestions were made for a certification program for pikeminnow anglers. This certification would include not only techniques, but also ethics. Such a program could then be used to loosen the rules about participation, and check-in.
2) Check-in and Check-out System. A common complaint was the daily check-in and the
driving that this sometimes involves. A suggestion was to allow a two to three day check-in or an advance check-in so that anglers who fish and stay overnight on the banks do not have to drive back and forth. Such a program could be implemented with numerical "cut offs" to discourage fraud. A suggestion was also made to make the payoff more responsive (quicker) and reduce the size limit, perhaps to seven inches.
3) Reward System. For most people, the reward system is the main criteria for their
participation. Not knowing anything about the limited amount of total funds available, all respondents thought it to be a good idea to increase the per fish reward and to loosen the tier system. The weekly or monthly awards received a cold or lukewarm response. Almost everyone agreed that an increase in tagged fish rewards would generate more of the "casino" effect. Increase the number of $1,000 tags and perhaps decrease the $5,000 tags. Knowing that a $1,000 fish was caught in an area would get them to go to those areas more often.
C. Angler Demand While there may be some opportunities to increase angler participation and therefore up the exploitation rate, more market information is needed to identify the factors that will affect angler demand. It could be that only training and promotion is needed. It could also be that the tiered reward system needs changing. However, controlled market response information is lacking at the present. Past information relating effort to changes in the reward amount has also been accompanied by changed fishing conditions. This clouds inferences that can be made about angler participation and program accomplishments.

III-5 kco D:\Data\Documents\hr\PikeminnowRpt.doc
The potential effects on angler participation with an increase in special-reward tagged fish are conceptually illustrated in Figure III.1. In Figure III.1a, T0 angler trips are taken annually under the current reward structure. When the number of special-reward tagged fish is increased, and the level of the reward is increased, the demand for fishing trips is expected to shift out. Under the new reward structure, T1 trips will be taken. It is expected that the number of northern pikeminnow harvested would also increase. On the other hand, if the cost of taking an angler trip increases, perhaps as a result of a large increase in the cost of gasoline, we would anticipate the possibility of a decrease in the number of annual trips taken by sport reward anglers. In Figure III.1b, T0 angler trips are taken annually under the current reward structure. When the cost of taking an angler trip increases, the supply of fishing trips shifts up. At the new, higher cost level, T1 trips will be taken. In this case the number of trips taken by sport reward anglers decreases. This would probably result in fewer northern pikeminnow being harvested. Finally, we may encounter circumstances where costs per angler trip are increasing at the same time a new, more generous reward structure is implemented. Figure III.1c shows this situation.
Figure III.1a Angler Demand Curve for Reward Changes and Trip Cost Assumptions
Source: Study.
Demand0 for trips Current Program
Demand1 for trips with Increase in special tags
Cost0 per angler trip = $19.75
$ Cost per trip
Numbers of trips taken per year
T0 T1
Increase in trips taken per year due to increase in the number of special tags.

III-6 kco D:\Data\Documents\hr\PikeminnowRpt.doc
Figure III.1b Angler Demand Curve for Reward Changes and Trip Cost Assumptions
Source: Study. In Figure III.1c, T0 angler trips are taken annually under the current reward structure and cost per trip. When the number of special-reward tagged fish is increased, and the level of the reward is increased, the demand for fishing trips shifts out, but the increased cost of participation shifts up the line designating cost per trip. The net effect is for a new level of trips, T1, to be taken. T1 in this figure is greater than the number of angler trips shown in Figure III.1b, but less than the number of trips taken in the situation depicted in Figure III.1c. Ultimately, that is why program managers will have to be flexible in setting reward levels and the structure of rewards to achieve desired levels of angler effort and pikeminnow harvest.
Demand0 for trips Current Program
Cost0 per angler trip = $19.75
$ Cost per trip
Numbers of trips taken per year
T0
Cost1 per angler trip = $21.75
T1
Reduction in trips taken per year due to increased costs of participation (e.g., due to increased cost of gasoline).

III-7 kco D:\Data\Documents\hr\PikeminnowRpt.doc
Figure III.1c Angler Demand Curve for Reward Changes and Trip Cost Assumptions
Source: Study.
Demand0 for trips Current Program
Cost0 per angler trip = $19.75
$ Cost per trip
Numbers of trips taken per year
T0
Cost1 per angler trip = $21.75
Demand1 for trips with increase in special tags
T1
Net increase in number of trips per year with cost/trip increase and increase in number of special tags.

IV-1 kco D:\Data\Documents\hr\PikeminnowRpt.doc
IV. SUMMARY AND DISCUSSION A. Previous Economic Studies' Recommendations Two previous groups have reviewed the economic considerations of the NPMP. The NPCC sponsored a biological and economic evaluation of the NPMP in 2000 (Hankin and Richards 2000) and Hanna and Pampush reviewed the economic, social and legal feasibility of the NPMP from 1990 through 1993. Some of the economic recommendations of the review by Hankin and Richards (2000) are:
• A modest $2.50 per fish reward be provided also for smaller fish so as to encourage their capture and removal from the northern pikeminnow population.
• The relative cost-effectiveness of tribal fisheries, as compared to the sport-reward fishery,
is poor.
• A reduction of the number of agencies involved in the NPMP should be considered in order to further reduce costs.
• Further study of the tired reward system is needed. Such a study can only be made
through questionnaires sent to current and past participants.
• The NPMP suffers from a very large turnover even among the core group of highly successful fishers. It may be possible to promote both participation and retention of anglers by changing the reward system.
• Promotion costs should be reduced.
The Hankin and Richards study also noted that, "... due to concerns about the accuracy of the estimated number of smolts saved by the program and the many other causes or mortality, benefits have not been quantified using monetary values of adult salmon and steelhead." They continue, "The use of adult predators removed is appropriate to measure the internal cost-effectiveness of the NPMP, but it provides no information to compare the NPMP with other programs that are aimed at improving smolt survival. For example, flow augmentation, smolt transportation, spill, fish-friendly turbine designs, and bypass systems all share the goal of improved smolt survival. Although the cost per smolt saved may be less for the NPMP than for some of these other Columbia River programs that are intended to reduce losses of smolts during their downstream migration, comparing the cost-effectiveness of the NPMP to other projects was beyond the scope of our review. Therefore, we remind readers that the analysis ... is intended only to indicate internal cost-effectiveness of NPMP and its components. Even the least cost-effective components of the NPMP may have favorable cost-efficiency when compared to other Columbia Basin projects, but this analysis cannot confirm or deny this." Hanna and Pampush (1990) concluded, "On the basis of the survey data, the sport-reward fishery was popular with its participants. The sport-reward fishery was the most cost effective fishery on all counts: monitoring costs per fish removed, monitoring costs per unit effort, monitoring

IV-2 kco D:\Data\Documents\hr\PikeminnowRpt.doc
costs per smolt saved, total direct cost per fish removed, total direct costs per unit effort, and total direct costs per smolt saved." These researchers found little market potential for commercial use of northern pikeminnow carcasses. Hanna and Pampush in various years' publications identified the stakeholders in the NPMP as did other researchers.
• Agencies that are part of the NPMP by showing that they are tangibly doing something for salmon recovery - many recovery projects are not as public.
• Hydropower supporters because removing pikeminnows is simpler than changing dams
or dam operation to decrease the vulnerability of juvenile salmonids to predators.
• Hatchery advocates because removing pikeminnows is easier than changing hatchery practices and because attention is shifted to pikeminnows, instead of problems with hatchery fish that make them vulnerable to predators.
• Fishers because they can fish, be paid to do so, and also have a sense of power that they
are helping salmon recovery.
• Native Americans by providing revenue and involvement in salmon recovery management (e.g. Hanna and Pampush (1993), Hankin and Richards (2000)).
Beamesderfer (2000) stated: "Nobody would be willing to pay millions of dollars for pikeminnow bounties unless it was a substitute for more costly or politically unpalatable measures." The present study address the admonition by providing measures for the economic contribution using NEV, REI, and CEA economic analysis approaches. B. Summary of the Present Study Economic Analysis The above mentioned economic studies pointed to the difficulties in obtaining data and using relationships to accomplish an economic analysis. While the economic evaluation of the program itself is relatively straightforward, defining the relationship between northern pikeminnow predation, juvenile salmonid downstream survival, and increased harvestable adults is problematic. The present study makes some progress in showing these relationships using existing information and models. The present study shows the basic economic information that may be used to evaluate the NPMP in terms of net economic value (NEV), regional economic impacts (REI), and cost-effectiveness analysis (CEA) as compared to other external programs having similar objectives. Table IV.1 summarizes the results.
• The program's NEV creates an estimated $1.8 million in wealth to the nation because of the northern pikeminnow fishery and another $1.8 to $6.8 million from anadromous fish fishing. This does not include any measurement of passive use value for the increased

IV-3 kco D:\Data\Documents\hr\PikeminnowRpt.doc
Table IV.1 Northern Pikeminnow Management Program Economic Evaluation in 2002
Net Economic
Value
Regional Economic Impacts Cost-Effectiveness
NPMP budget $2.8 Northern pikeminnow fishery $1.8 $1.4 NPMP administration $2.1 Subtotal NPMP
$3.5
Anadromous fish fishing $1.8 to $6.8 $2.7 to $9.9 NPMP at existing program level $3.6 to $8.6 $6.2 to $13.4 $2.9 for one percent
increase in survival Notes: 1. Table values are in millions. Source: Study.
salmonid adult returns or negative passive value associated with the exploitation of the northern pikeminnow.
• A program budget of $2.8 million will generate about $2.1 million in REI's and about $1.4 million in the regional economies where northern pikeminnow fishing takes place. Fishing for salmon and steelhead resulting from increased adults surviving to harvest will generate another from $2.7 million to $9.9 million in economies from Alaska to California on the West Coast and inland in the Columbia River Basin. In total, the act of fishing for northern pikeminnow and anadromous fish may create up to $13.4 million in REI. In terms of full time equivalent jobs at $30,000 each, this is equal to the employment of about 446 people. Since many of these jobs will be seasonal, the actual number of positions may be much higher than the stated full time equivalent job estimates.
• In terms of cost-effectiveness, NPMP budget and accomplishments during the 1991 to
1996 period costs an estimated $2.9 million per year per one percent increase in survival for juvenile salmonids. This compares favorably with other selected passage actions, such as improved screening at specific inriver sites.
C. Present Study's Recommendations 1. Findings 1. The sport fishing reward component of the NPMP, in general, has a very favorable
reputation among anglers that participate in the program. Participants appreciate participating in a salmon enhancement program. The competitiveness and compensation incentive generates significant effort. Increasing effort needs to play off these motivation factors.

IV-4 kco D:\Data\Documents\hr\PikeminnowRpt.doc
2. There are a limited number of methods to cull or displace this species to decrease predation rates. There have been extensive investigations and pilot programs to determine the cost-effectiveness of these methods during the evolution of the NPMP. The sport fishing reward program has been the most cost effective.
3. The existing program contributes to the Pacific Northwest economy. While some of
these contributions may be considered "transfers" from one economic sector and geographic region to another, the NPMP does bring income and employment to rural areas.
4. The existing NPMP is cost-effective when compared to alternative external programs for
increasing downstream migration survival. Any expansion of the program should be evaluated on the marginal effects of an expanded program.
5. The existing program evaluation depends on the biological evaluation of exploitation on
the problem size class and the effects on salmonid survival rates. More research should be made on discovering stock differential increased survival rates so that the evaluation can be extended to stocks of concern.
6. It was a very revealing discovery that almost 15 percent of the predation was on dead
juveniles. Increased knowledge and certainty of these biological/environmental data will lead to more accurate evaluation of economic considerations.
7. Research has shown there is recruitment to the offending size class at a predictable rate,
therefore not having a payment on fish less than 200 mm fork length is not justified. Consideration should be given to rewarding for a reduced length size class. This would be more of a social incentive, since the smaller size classes are more difficult to catch. This would also introduce accounting problems because there are no existing methods for payments based on size classes.
8. Information about catch and effort before and after changes to payments cannot be used
to infer angler response relationships. Past information relating effort to changes in the reward amount has also been accompanied by changed fishing conditions. This clouds inferences that can be made about angler participation and program accomplishments.
2. Conclusions The conclusion of the present study research is that:
1. An effective northern pikeminnow removal program is needed to mitigate for the increased predation brought about from the dams' generated slack water, i.e. the development of the existing hydrosystem has made this program necessary. The NPMP addresses this need without a parallel concern for eradicating the species by only targeting the larger offending size class.

IV-5 kco D:\Data\Documents\hr\PikeminnowRpt.doc
2. The existing NPMP is as cost-effective as other example physical and operational hydrosystem alteration programs being considered for increasing downstream migration survival. Based on available data, the present NPMP compares favorably with other selected passage actions, such as improved screening at specific inriver sites.
3. Except for the highliner anglers, participants will spend far more money than they realize
in rewards. This greatly multiplies the economic impacts per NPMP reward dollar. From a local economic development perspective, it is much better to have participation by low catch anglers than it is to have highliner type anglers. From a program cost-effectiveness perspective, it is better to encourage highliner participation.
4. There are biological and management limits to how much the NPMP can accomplish.
This latest research concludes that reduction in predation on juvenile salmon will most likely not be able to be reduced below the present 25 percent level.
5. Due to the uncertainty in predation modeling and lack of information about angler's propensities to participate in the northern pikeminnow fishery, it is not clear that an increased budget for prompting more northern pikeminnow effort will calculate linearly to the CEA measure. Much more information is necessary to accurately model the angler response to payment levels and the relationship between increased effort, higher exploitation rates, and reduced predation levels.
6. To be useful in comparing the economic analysis to other programs with similar goals
and for use in ESA-listing program analysis, it is important that smolt origin differential mortality is known. It could be that wild production suffers more or less predation than hatchery origin smolts. It could be that some species released in some hatcheries could have different predation rates. Additional PIT tag system research would be needed for such studies.1
7. The following are suggested ways to improve the sport fishing reward program
operations that were garnered from an informal survey of 2002 participants.
a. Increase number of "lottery" type tags and raise the prize amount. b. Make the "check in - check out" system easier to use by allowing multi-day
validation periods. c. Encourage new entrants and improve skills of past participants through training
programs. Perhaps a master angler program patterned after the master gardener or master hunter would work. These could also be the voluntary "eyes and ears" of the program. There seems to be a high level of awareness of the NPMP and generic advertising can probably be minimized. While Hankin and Richards (2000) advised against promotion costs, awareness and education should be viewed as necessary to expand the program.
1. The Passive Integrated Transponder (PIT) information system database contains species and location specific
data for the following: tagging, release, monitored release, recapture, mortality. It is available for researchers studying downstream survival.

IV-6 kco D:\Data\Documents\hr\PikeminnowRpt.doc
d. Reduce the emphasis on discovering "cheaters." They are a small in number and, after all, they do reduce the northern pikeminnow population, even if it's from non-targeted stocks. There should be enforcement mechanisms, but if other fisheries serve as an example, the best information about fraud comes from other anglers.
8. It appears the NPMP suffers from a very large turnover even among the core group of
highly successful fishers. Initial angler demand can probably be related to the financial rewards, but there is rapid attrition after discovering the work needed to catch even modest amounts of the larger size class. The trends show the highliner category is catching an increasing share. It is important to keep recruiting new anglers into this role.
9. There is insufficient market information to predict the effort response from changing the
tiered reward system and payment levels. Periodic participant economic preference surveys and non-participant market surveys should be reinstituted.
10. It is recommended that decision makers consider more than the short-term financial
values captured in the present study analysis. There are stakeholders and non-participants that hold social interests and non-economic values in the program.
V-1 kco D:\Data\Documents\hr\PikeminnowRpt.doc
V. BIBLIOGRAPHY Artificial Production Review and Evaluation (APRE). Draft Basin-Level Report. Northwest
Power and Conservation Council. Council Document 2003-17. Available online at: http://www.nwcouncil.org/library/2003/2003-17.htm. October 7, 2003.
Barclay, J.C. and R.W. Morley. Estimation of Commercial Fishery Benefits and Associated Costs For the National Income Account. Department of Fisheries and Oceans, Vancouver, B.C. 1977.
Beamesderfer, R.C.P. "Managing Fish Predators and Competitors: Deciding When Intervention is Effective and Appropriate." Fisheries 25(6): 18-23. 2000.
Beamesderfer, R.C., and B.E. Rieman. "Abundance and Distribution of Northern Squawfish, Walleyes, and Smallmouth Bass in John Day Reservoir, Columbia River." Transactions of the American Fisheries Society 120:439-447. 1991.
Beamesderfer, R. C. P., D. L. Ward, and A. A. Nigro. "Evaluation of the Biological Basis for a Predator Control Program on Northern Squawfish (Ptychocheilus Oregonensis) in the Columbia and Snake Rivers." Canadian Journal of Fisheries and Aquatic Sciences 53:2898-2908. 1996.
Bowler, Bert. Idaho Department of Fish and Game. Personal communication. July 30, 1999.
Brown, L.R., and P.B. Moyle. "The Impact of Squawfish on Salmonid Populations: A Review." North American Journal of Fisheries Management 1:104-111. 1981.
Buchanan, D.V., R.M. Hooton, and J.R. Moring. Northern Squawfish (Ptychocheilus Oregonensis) Predation on Juvenile Salmonids in Sections of the Willamette River Basin, Oregon. Canadian Journal of Fisheries and Aquatic Sciences 38:360-364. 1981.
Carter, Chris. Coastal Salmonid and Willamette Trout Hatchery Program Review. Appendix C - Economic Considerations. Oregon Department of Fish and Wildlife. Draft. March 15, 1999.
Friesen, T. A., and D. L. Ward. Biological Characteristics of Columbia River Walleye in Relation to Northern Pikeminnow Management. Oregon Department of Fish and Wildlife, Information Report 2000-05. Clackamas, Oregon. 2000.
Friesen, T. A., and D. L. Ward. "Management of Northern Pikeminnow and Implications for Juvenile Salmon Survival in the Lower Columbia and Snake Rivers." North American Journal of Fisheries Management 19:406-420. 1999.
Fuss, Howard J., Ross Fuller, Mark A. Kimbel, Andrew E. Appleby, and Stanley A. Hammer. Annual Coded Wire Tag Program (Washington), Missing Production Groups, Annual Report 1993. Washington Department of Fisheries. Prepared for U.S. Department of Energy, Bonneville Power Administration, Division of Fish and Wildlife, Portland. Project no. 89-66. March 1994.
Gadomski, D. M., and J. A. Hall-Griswold. "Predation by Northern Squawfish on Live and Dead Juvenile Chinook Salmon." Transactions of the American Fisheries Society 121: 680-685. 1992.

V-2 kco D:\Data\Documents\hr\PikeminnowRpt.doc
Garrison, Robert L., Christine Mallette, Mark A. Lewis, and William M. Murry. Annual Coded Wire Tag Program, Oregon, Missing Production Groups, 1995 Annual Report. Oregon Department of Fish and Wildlife. Prepared for U.S. Department of Energy, Bonneville Power Administration, Environment, Fish and Wildlife, Portland. Project no. 89-069. December 1995.
Goulder, L.H. and D. Kennedy. "Valuing Ecosystem Services: Philosophical Bases and Empirical Methods." Pages 23-47 in G.C. Daily ed. Nature's Services: Societal Dependence on Natural Ecosystems. Island Press, Washington, D.C. 1997.
Hankin, David G. and Jack Richards. The Northern Pikeminnow Management Program. An Independent Review of Program Justification, Performance, and Cost-Effectiveness. Northwest Power Planning Council. April 4, 2000.
Hanley, N. and C.L. Spash. Cost-Benefit Analysis and the Environment. Edward Elgar, Hants, England, 278 pp. 1993.
Hanna, Susan and Jon Pampush. Economic, Social, and Legal Feasibility of the 1993 Northern Squawfish Removal Fisheries and Fish Distribution System. Report I. Department of Agricultural and Resource Economics, Oregon State University. 1993.
Hanna, Susan and Jon Pampush. "Economic, Social, and Legal Feasibility of Commercial, Sport and Bounty Fisheries on Northern Squawfish." Oregon State University. Report B in: Nigro, Anthony A. Development of a System-wide Predator Control Program: Stepwise Implementation of a Predation Index Predator Control Fisheries and Evaluation Plan in the Columbia River Basin. Prepared for U.S. Dept. of Energy, Bonneville Power Administration, Environment, Fish and Wildlife Division, Portland, Oregon. 1990.
Huppert, Daniel D. and David Fluharty. Economics of Snake River Salmon Recovery: A Report to the National Marine Fisheries Service. School of Marine Affairs, College of Ocean and Fisheries Service, University of Washington. October 1996.
Independent Economic Analysis Board (IEAB). Juvenile Passage Cost Effectiveness Analysis for the Columbia River Basin: Description and Preliminary Analysis. Northwest Power and Conservation Council. Document IEAB 2004-01. January 2004.
Knutsen, C. J., and D. L. Ward. "Biological Characteristics of Northern Pikeminnow in the Lower Columbia and Snake Rivers Before and After Sustained Exploitation." Transactions of the American Fisheries Society 128:1008-1019. 1999.
Layton, David F., Gardner M. Brown, Jr., and Mark L. Plummer. Valuing Multiple Programs to improve Fish Populations. Unpublished manuscript, prepared for the Washington Department of Ecology, Olympia, Washington. Available from Cathy Caruthers at WDOE. 1999.
Meyer, Philip A. et al. Elwha River Restoration Project: Economic Analysis, Final Technical Report. A report to the U.S. Bureau of Reclamation, the National Park Service, and the Lower Elwha S'Klallam Tribe. April 1995.
National Marine Fisheries Service (NOAA Fisheries), Office of Sustainable Fisheries. Guidelines for Economic Analysis of Fishery Management Actions. Silver Spring, Maryland. Revised August 16, 2000.

V-3 kco D:\Data\Documents\hr\PikeminnowRpt.doc
Northern Pikeminnow Management Program (NPMP). Online brochure. http://www.pikeminnow.org/directions.html. 2004.
Northwest Fisheries Science Center, National Marine Fisheries Service, NOAA. Predation on Salmonids Relative to the Federal Columbia River Power System. White paper. Seattle, Washington. http://www.nwfsc.noaa.gov/publications/whitepapers/Predation.PDF. March 2000.
Olsen, Darryll, Jack Richards, and R. Douglas Scott. "Existence and Sport Values for Doubling the Size of Columbia River Basin Salmon and Steelhead Runs." Rivers 2(1):44-56. 1991.
Olson, D., et al. Micro IMPLAN User's Guide: Version 91-F. Minnesota IMPLAN Group Inc., St. Paul, Minnesota. 1993.
Pacific Fishery Management Council (PFMC). Review of 2003 Ocean Salmon Fisheries. Pacific Fishery Management Council. February 2004.
Panayotou, T. Green Markets: The Economics of Sustainable Development. ICS Press for the International Center for Economic Growth, San Francisco, CA. 169 pp. 1992.
Parker, R.M., M.P. Zimmerman, and D.L. Ward. "Variability in Biological Characteristics of Northern Squawfish in the Lower Columbia and Snake Rivers." Transactions of the American Fisheries Society 124:335-346. 1995.
Pastor, Stephen M. Annual Coded Wire Program, Missing Production Groups, Annual Reports 1995 and 1996. U.S. Fish and Wildlife Service. Prepared for U.S. Department of Energy, Bonneville Power Administration, Portland. Project no. 89-065.
Pearce, D.W. The MIT Dictionary of Modern Economics, Fourth Edition. The MIT Press. Cambridge, MA. 1992.
Petersen, J. H. Compensatory Feeding Following a Predator Removal Program: Detection and Mechanisms. Report submitted to Bonneville Power Administration. 2001.
Petersen, J. H. "Importance of Spatial Pattern in Estimating Predation on Juvenile Salmonids in the Columbia River." Transactions of the American Fisheries Society 123:924-930. 1994.
Petersen, J. H., D. M. Gadomski, and T. P. Poe. "Differential Predation by Northern Pikeminnow (Ptychocheilus Oregonensis) on Live and Dead Juvenile Salmonids in the Bonneville Dam Tailrace (Columbia River)." Canadian Journal of Fisheries and Aquatic Sciences 51:1197-1204. 1994.
Radtke, Hans D., Shannon W. Davis, and Rebecca L. Johnson. Lower Snake River Juvenile Salmon Migration Feasibility Study: Anadromous Fish Economic Analysis. Prepared for Foster Wheeler Environmental Corporation and U.S. Army Corps of Engineers. October 1999.
The Research Group. Oregon Angler Survey and Economic Study. Prepared for Oregon Department of Fish and Wildlife. Portland, Oregon. 1991.
Rettig, Bruce and Bruce McCarl. Potential and Actual Benefits from Commercial Fishing Activities. National Oceanic and Atmospheric Administration Technical Memorandum.

V-4 kco D:\Data\Documents\hr\PikeminnowRpt.doc
National Marine Fisheries Service. F/FWR-8, July 24-26 workshop, Seattle, Washington and also cited in Appendix IV in PFMC 1985 - Review of 1985 Ocean Salmon Fisheries as a guideline for the PFMC measure of economic value of commercial fisheries. 1984.
Rieman, B.E., and R.C. Beamesderfer. "Dynamics of a Northern Squawfish Population and the Potential to Reduce Predation on Juvenile Salmonids in a Columbia River Reservoir." North American Journal of Fisheries Management 10:228-241. 1990.
Sando, Rod, Executive Director, Columbia Basin Fish and Wildlife Authority. Letter to Mark Walker, Northwest Power and Conservation Council. December 8, 2003.
Smith, Steve. National Marine Fisheries Service, Portland, Oregon. Personal communication. August 5, 1998.
State, Federal and Tribal Fisheries Agencies Joint Technical Staff. Agencies and tribes review comments – Bonneville Power Administration Summer Spill Analysis. Columbia River Inter-tribal Fish Commission, Idaho Department of Fish and Game, Nez Perce Tribe, Oregon Department of Fish and Wildlife, Shoshone Bannock Tribe, US Fish and Wildlife Service, Washington Department of Fish and Wildlife. 2004.
Takata, Howard K. and David L. Ward. Development of a System-Wide Predator Control Program: Fisheries Evaluation. Report E. Oregon Department of Fish and Wildlife. January 2002.
Tietenberg, T. Environmental and Natural Resource Economics. Harper Collins, New York, 614 pp. 1996.
Vigg, S., T. P. Poe, L.A. Prendergast, and H.C. Hansel. "Rates of Consumption of Juvenile Salmonids and Alternative Prey Fish by Northern Squawfish, Walleyes, Smallmouth Bass, and Channel Catfish in John Day Reservoir, Columbia River." Transactions of the American Fisheries Society 120:421-438. 1991.
Ward, David L., Ken Collis, James H. Petersen, Daniel D. Roby, Susan P. Barnes. Predator Control Program (Mainstem/Systemwide Province) Program Summary. Draft. Prepared for the Northwest Power Planning Council. Available online at http://www.cbfwa.org/files/province/systemwide/subsum/021024Predation.pdf. October 24, 2002.
Ward, D.L., J.H. Petersen, and J.J. Loch. "Index of Predation on Juvenile Salmonids by Northern Squawfish in the Lower and Middle Columbia River and in the Lower Snake River." Transactions of the American Fisheries Society 24:321-334. 1995.
Ward, D. L., and M. P. Zimmerman. "Response of Smallmouth Bass to Sustained Removals of Northern Pikeminnow in the Lower Columbia and Snake Rivers." Transactions of the American Fisheries Society 128:1020-1035. 1999.
Water Resources Council. Procedures for Evaluation of National Economic Benefits and Costs in Water Resources Planning. Final Rule Benefits and Costs Published in the FEDERAL REGISTER on December 4, 1979.
Zimmerman, M. P., and D. L. Ward. "Index of Predation on Juvenile Salmonids by Northern Pikeminnow in the Lower Columbia River Basin From 1994-96." Transactions of the American Fisheries Society 128:995-1007. 1999.

APPENDIX A Questionnaire
1 kco D:\Data\Documents\hr\PikeminnowRpt.doc
PIKEMINNOW SPORT REWARD PROGRAM PERSONAL INTERVIEW
SURVEY QUESTIONNAIRE
Precode Information Telephone: Name and residence address: Qualifying pikeminnow catch in 2002: Effort in 2002: Location code for majority of trips: Interview Information Interview date: ____________ Interviewee gender (do not ask): Male _____ Female _____ Interview Results (circle code):
01 No answer 02 Busy 03 Answering machine 04 Respondent not available
05 Business phone 06 Disconnect 07 Language barrier 08 Refused
09 Terminate survey 10 Other [specify] ___________________ 20 Complete
Interview duration: ____________ minutes
INTRODUCTION DIALOG Hello, this is _______________ with The Research Group in Corvallis, Oregon. We have been asked by the Pikeminnow Sport Reward Program sponsors to find more information about fishing participants. To do this, we are calling randomly selected households to ask a few questions of those that submitted for voucher awards. The survey will take about five minutes and I think you will find it interesting. We are not selling anything, we just want to hear your views about the Program.
TERMINATE DIALOG This completes the interview. If you want, you can tell me any comments you might have about the survey or Program. Otherwise, thank you very much for your time. We really appreciate your cooperation. Goodbye.
CALL BACK DIALOG
Your response is really valuable for statistical reasons. Would there be a better time I could call you or another member of your household to complete the interview? ___________ Other person to call and telephone number if given ___________ Call back time and date ___________ Other disposition code (see interview results codes)

2 kco D:\Data\Documents\hr\PikeminnowRpt.doc
I. Screening Question Did you participate in the Pikeminnow Sport Reward Program in 2003?
1. Yes --> Go to Question II.A. 2. No, or DK, NA, R --> Speak Termination Dialog.
II. Participation and Evaluation Questions A. Please answer the following questions as they pertain to the 2003 season. All responses
will be held in the strictest of confidence. A1. How many fishing trips do you usually make per year? The number would include all
trips and not just ones when pikeminnow are caught. 1. 0 4. 11-15 7. >25 2. l-5 5. 16-20 8. DK, NA, R 3. 6-10 6. 21-25
A2. Years you have been a sport fisherman: 1. <1 4. 6-7 7. DK, NA, R 2. 1-3 5. 8-9 3. 4-5 6. 10 or more
A3. Do you plan to participate in the 2004 Pikeminnow Sport Reward Program? 1. Yes 2. No --> Go to Question A5 3. DK, NA, R --> Go to Question A5
A4. Will you be targeting pikeminnow or just participate in the Program if you happen to catch a pikeminnow? 1. Target 2. Not-target 3. DK, NA, R
A5. How did you generally hear about the Program? 1. Newspaper 4. Word of mouth 7. DK, NA, R 2. Radio 5. State fishery agency 3. TV 6. Other (please specify) ___________________________
A6. How important are the following factors in your participation in the Program? I will read you the factors, and you tell me whether it is "very important," "of some importance," or "not important." Very
importantOf some
importanceNot
important DK,
NA, R1. Payment for pikeminnow catches ____ ____ ____ ____ 2. Recreational opportunity ____ ____ ____ ____ 3. Covering expenses for fishing
other targeted species ____ ____ ____ ____
4. Participating in a salmon enhancement program
____ ____ ____ ____

3 kco D:\Data\Documents\hr\PikeminnowRpt.doc
A7. This is an important question. Would a different reward system motivate you to fish
more or less for pikeminnow? I will read you a list of system changes, and when I am done, you tell me which one of these would motivate you to fish the most and which the least. [Read list in random order.] 1. Increase per fish reward $1? 2. Relax the annual tiers by 100 fish? 3. Have $1,000 awards for most caught in weekly tournaments? 4. Have monthly random drawings with $1,000 prizes for those that fished during that
month? 5. Increase number of specially tagged fish, but keep $5,000 prize the same? 6. Increase $5,000 prize for specially tagged fish, but keep the same number of tags?
B. Please answer the following questions as they pertain to a typical trip in 2003. B1. Usual number of anglers in your party:
1. ____________ people 2. DK, NA, R
B2. Average age of people usually in your fishing trip:
1. 14-20 4. 41-50 7. >70 2. 21-30 5. 51-60 8. Varies too much to avg. 3. 31-40 6. 61-70 9. DK, NA, R
B3. Usual number of hours per trip spent fishing for pikeminnow: 1. ____________ hours per trip 2. DK, NA, R
B4. Usual miles traveled (one way) to fish:
1. <20 4. 60-79 7. DK, NA, R 2. 20-39 5. 80-99 3. 40-59 6. 100 or more
B5. If staying away from home, usual number of overnight days you stay in the area: 1. < 1 --> Go to Question B7 4. 3 7. >5 2. 1 5. 4 8. DK, NA, R 3. 2 6. 5
B6. Type of accommodation when you stay overnight: 1. Motel 4. Private campground 7. DK, NA, R 2. State park 5. Friend or relative 3. National park campground 6. Other (please specify) _______________
B7. Usual primary reason for the fishing trips when pikeminnow are caught: 1. Pikeminnow 4. Nonfishing activity 2. Other fish 5. Other (please specify) _________ 3. Combination of other fish and pikeminnow 6. DK, NA, R

4 kco D:\Data\Documents\hr\PikeminnowRpt.doc
B8. Approximate amount spent on a typical trip by all party members in the following
categories: 1. Restaurants: $ ____________ 2. Grocery store: $ ____________ 3. Accommodations: $ ____________ 4. Gas: $ ____________ 5. Fishing supplies: $ ____________ 6. Bait: $ ____________ 7. Other (please specify): _______________________________ $ ____________ 8. DK, NA, R
B9. Primary fishing method your party used: 1. Boat, anchored 2. Boat, drifting 3. Boat, trolling 4. Shore 5. Angling, surface 6. Angling, bottom 7. Other (please specify): _______________________________ 8. DK, NA, R
B10. Primary bait or tackle your party used: 1. Worms 2. Cut fish bait 3. Spinners 4. Spoons 5. Flatfish 6. Surface plugs 7. Hook and line with 1 hook 8. Hook and line with >l hook 9. Other (please specify): _______________________________ 10. DK, NA, R
C. Please provide me some evaluation information about the Program. C1. Were the 2003 check stations conveniently located for you?
1. _____ Yes --> Go to Question C3 2. _____ No 3. DK, NA, R --> Go to Question C3
C2. What new locations would you propose? 1. ___________________________ 2. DK, NA, R

5 kco D:\Data\Documents\hr\PikeminnowRpt.doc
C3. Please tell us how many complaints in the following categories you heard from anglers. As I read you a list, you tell me "many complaints," "some," "few," or "none."
Many Some Few None
DK, NA,
R 1. Boat Ramps a. Overcrowding on boat ramps ____ ____ ____ ____ ____ b. Size of boat ramps ____ ____ ____ ____ ____ c. Time waiting to launch ____ ____ ____ ____ ____ d. Other (specify) _____________ ____ ____ ____ ____ ____ ____________________________ 2. Fishing a. Crowding with other anglers ____ ____ ____ ____ ____ b. Crowding with commercial
fishermen ____ ____ ____ ____ ____
c. Gear damage from crowding with anglers
____ ____ ____ ____ ____
d. Gear damage from crowding with commercial fishermen
____ ____ ____ ____ ____
e. Boats passing too fast ____ ____ ____ ____ ____ f. Jet skiers ____ ____ ____ ____ ____ g. Water skiers ____ ____ ____ ____ ____ h. Litter in water ____ ____ ____ ____ ____ i. Litter on banks ____ ____ ____ ____ ____ j. Other (specify) _____________ ____ ____ ____ ____ ____ ____________________________ 3. Registration and Check-In a. Registration processing time ____ ____ ____ ____ ____ b. Registration processing
paperwork ____ ____ ____ ____ ____
c. Problems with other anglers ____ ____ ____ ____ ____ d. Check-in time ____ ____ ____ ____ ____ e. Check-in paperwork ____ ____ ____ ____ ____ f. Fish quality requirements ____ ____ ____ ____ ____ g. Other (specify) _____________ ____ ____ ____ ____ ____ ____________________________
C4. Did you or your party hear compliments about the operation of the Program?
1. _____ Yes 2. _____ No --> Go to Question C6 3. DK, NA, R --> Go to Question C6
C5. Please specify the compliment: 1. ________________________________________________________ 2. DK, NA, R
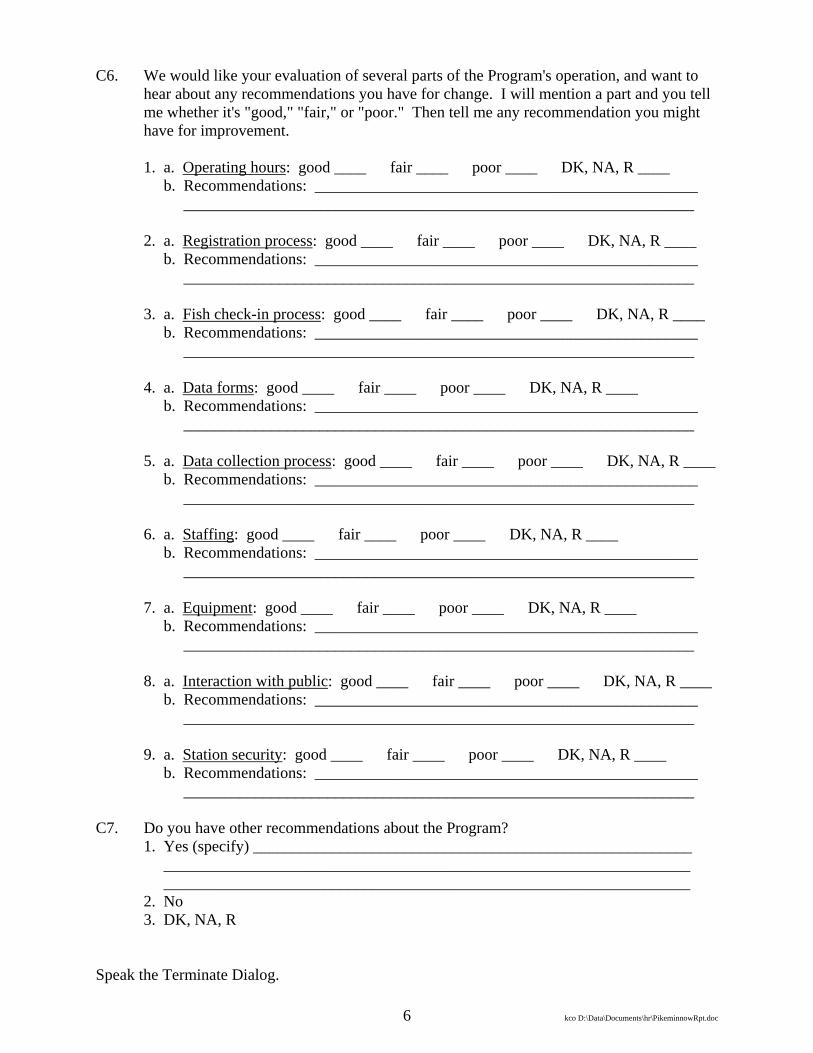
6 kco D:\Data\Documents\hr\PikeminnowRpt.doc
C6. We would like your evaluation of several parts of the Program's operation, and want to hear about any recommendations you have for change. I will mention a part and you tell me whether it's "good," "fair," or "poor." Then tell me any recommendation you might have for improvement.
1. a. Operating hours: good ____ fair ____ poor ____ DK, NA, R ____ b. Recommendations: ________________________________________________ ________________________________________________________________ 2. a. Registration process: good ____ fair ____ poor ____ DK, NA, R ____ b. Recommendations: ________________________________________________ ________________________________________________________________ 3. a. Fish check-in process: good ____ fair ____ poor ____ DK, NA, R ____ b. Recommendations: ________________________________________________ ________________________________________________________________ 4. a. Data forms: good ____ fair ____ poor ____ DK, NA, R ____ b. Recommendations: ________________________________________________ ________________________________________________________________ 5. a. Data collection process: good ____ fair ____ poor ____ DK, NA, R ____ b. Recommendations: ________________________________________________ ________________________________________________________________ 6. a. Staffing: good ____ fair ____ poor ____ DK, NA, R ____ b. Recommendations: ________________________________________________ ________________________________________________________________ 7. a. Equipment: good ____ fair ____ poor ____ DK, NA, R ____ b. Recommendations: ________________________________________________ ________________________________________________________________ 8. a. Interaction with public: good ____ fair ____ poor ____ DK, NA, R ____ b. Recommendations: ________________________________________________ ________________________________________________________________ 9. a. Station security: good ____ fair ____ poor ____ DK, NA, R ____ b. Recommendations: ________________________________________________ ________________________________________________________________
C7. Do you have other recommendations about the Program? 1. Yes (specify) _______________________________________________________ __________________________________________________________________ __________________________________________________________________ 2. No 3. DK, NA, R
Speak the Terminate Dialog.

APPENDIX B Increase in Harvestable Adults, Regional Economic Impacts, and Net Economic Values of Anadromous Fishing Due to Increased Salmonid Juvenile Survival of the Northern Pikeminnow Management Program

kco D:\Data\Documents\hr\PikeminnowRpt.doc
APPENDIX B
Increase in Harvestable Adults, Regional Economic Impacts, and Net Economic Values of Anadromous Fishing Due to Increased Salmonid Juvenile Survival of the Northern Pikeminnow Management Program
Contents:
Summary Table: Regional Economic Impact and Net Economic Value Results by Alternatives for Ocean, Inland, and Hatchery Harvests
Tables 1a-1c: Calculations to Estimate Number of Surviving Adults by Species
and Geographic Sub-Areas of the Columbia Basin - Three Alternative Scenarios of Total Smolt Releases and Changes in Overall Survival Rates
Tables 2a.1-2c.4: Estimated Columbia River Basin Salmon/Steelhead Production in
Terms of Surviving Adults (Hatchery and Wild) by Geographic Region
Tables 3a.1-3c.4: Estimated Regional Economic Impacts and Net Economic Values
by Geographic Region of Columbia River Basin Salmon/Steelhead Smolt Releases (See Table II.4 for per fish and per day factors.)
Tables 4a-4b: Regional Economic Impacts (REI) and Net Economic Values
(NEV) of Columbia River Basin Produced Salmon/Steelhead by Geographic Areas

Summary TableRegional Economic Impact and Net Economic Value Results
by Alternatives for Ocean, Inland, and Hatchery Harvests
Spring/Summer Fall Summer/Winter Coho Chinook Chinook Steelhead Total
Regional Economic ImpactAlternative I
Ocean 560,089 71% 122,937 34% 883,590 68% 1,496 1% 1,568,112 58%Inland 199,446 25% 133,961 37% 384,969 29% 207,392 91% 925,768 34%Hatchery 33,012 4% 103,352 29% 38,940 3% 20,057 9% 195,360 7%Total 792,546 100% 360,249 100% 1,307,499 100% 228,945 100% 2,689,240 100%
Alternative IIOcean 814,689 71% 178,820 34% 1,285,244 68% 2,176 1% 2,280,929 58%Inland 290,108 25% 194,855 37% 559,965 29% 301,666 91% 1,346,594 34%Hatchery 48,018 4% 150,332 29% 56,640 3% 29,174 9% 284,165 7%Total 1,152,815 100% 524,008 100% 1,901,849 100% 333,017 100% 3,911,689 100%
Alternative IIIOcean 1,897,002 71% 376,288 34% 3,098,545 68% 9,671 1% 5,381,506 55%Inland 675,798 25% 409,400 37% 1,351,061 29% 1,340,807 91% 3,777,066 38%Hatchery 112,029 4% 317,584 29% 136,516 3% 129,643 9% 695,772 7%Total 2,684,829 100% 1,103,272 100% 4,586,122 100% 1,480,120 100% 9,854,343 100%
Net Economic ValueAlternative I
Ocean 447,716 74% 65,376 30% 497,317 65% 845 0% 1,011,253 56%Inland 139,336 23% 92,095 43% 244,054 32% 197,204 94% 672,688 37%Hatchery 20,166 3% 56,953 27% 23,910 3% 12,325 6% 113,354 6%Total 607,218 100% 214,424 100% 765,280 100% 210,373 100% 1,797,295 100%
Alternative IIOcean 651,234 74% 95,093 30% 723,383 65% 1,229 0% 1,470,939 56%Inland 202,674 23% 133,958 43% 354,993 32% 286,846 94% 978,472 37%Hatchery 29,333 3% 82,843 27% 34,778 3% 17,928 6% 164,881 6%Total 883,241 100% 311,894 100% 1,113,154 100% 306,003 100% 2,614,292 100%
Alternative IIIOcean 1,516,487 74% 200,122 30% 1,743,763 65% 5,460 0% 3,465,832 51%Inland 471,879 23% 281,375 43% 856,340 32% 1,274,899 94% 2,884,494 43%Hatchery 68,435 3% 175,010 27% 83,823 3% 79,665 6% 406,934 6%Total 2,056,802 100% 656,508 100% 2,683,927 100% 1,360,023 100% 6,757,260 100%
kco D:\Data\Excel\pikeminnowFromFW.xls summary
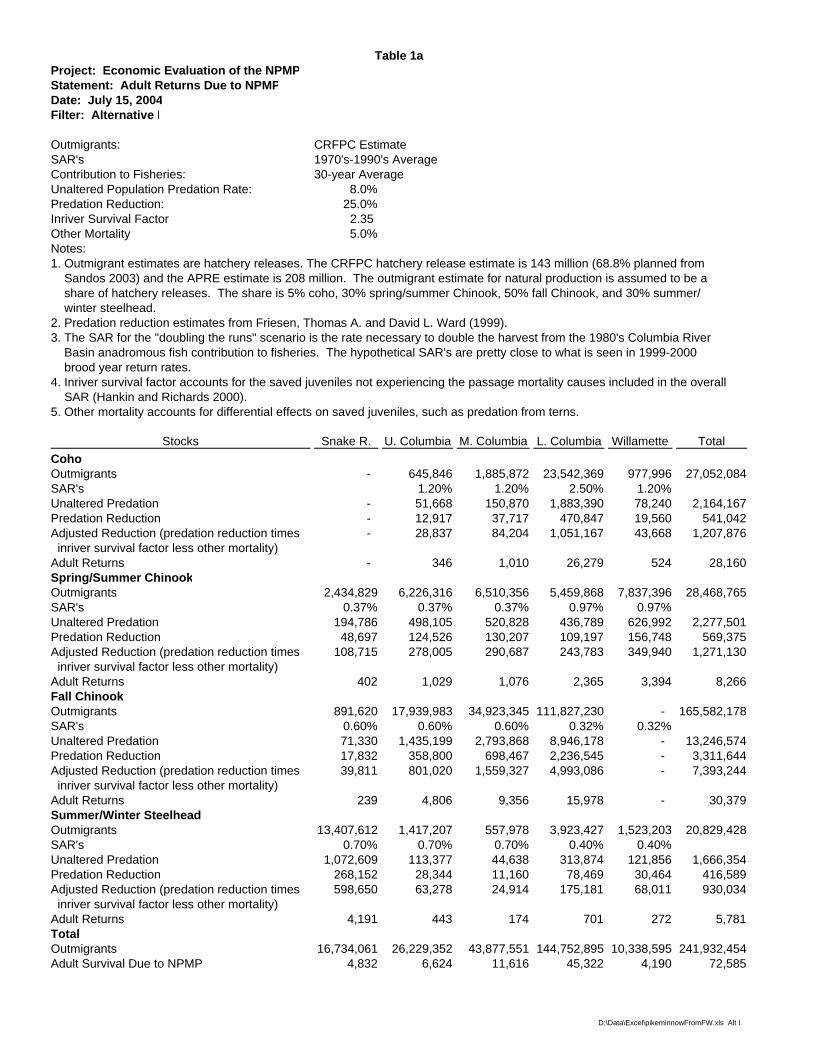
Table 1aProject: Economic Evaluation of the NPMPStatement: Adult Returns Due to NPMPDate: July 15, 2004Filter: Alternative I
Outmigrants: CRFPC EstimateSAR's 1970's-1990's AverageContribution to Fisheries: 30-year AverageUnaltered Population Predation Rate: 8.0%Predation Reduction: 25.0%Inriver Survival Factor 2.35 Other Mortality 5.0%Notes:1. Outmigrant estimates are hatchery releases. The CRFPC hatchery release estimate is 143 million (68.8% planned from Sandos 2003) and the APRE estimate is 208 million. The outmigrant estimate for natural production is assumed to be a share of hatchery releases. The share is 5% coho, 30% spring/summer Chinook, 50% fall Chinook, and 30% summer/ winter steelhead.2. Predation reduction estimates from Friesen, Thomas A. and David L. Ward (1999).3. The SAR for the "doubling the runs" scenario is the rate necessary to double the harvest from the 1980's Columbia River Basin anadromous fish contribution to fisheries. The hypothetical SAR's are pretty close to what is seen in 1999-2000 brood year return rates.4. Inriver survival factor accounts for the saved juveniles not experiencing the passage mortality causes included in the overall SAR (Hankin and Richards 2000). 5. Other mortality accounts for differential effects on saved juveniles, such as predation from terns.
Stocks Snake R. U. Columbia M. Columbia L. Columbia Willamette TotalCohoOutmigrants - 645,846 1,885,872 23,542,369 977,996 27,052,084SAR's 1.20% 1.20% 2.50% 1.20%Unaltered Predation - 51,668 150,870 1,883,390 78,240 2,164,167Predation Reduction - 12,917 37,717 470,847 19,560 541,042Adjusted Reduction (predation reduction times - 28,837 84,204 1,051,167 43,668 1,207,876 inriver survival factor less other mortality)Adult Returns - 346 1,010 26,279 524 28,160Spring/Summer ChinookOutmigrants 2,434,829 6,226,316 6,510,356 5,459,868 7,837,396 28,468,765SAR's 0.37% 0.37% 0.37% 0.97% 0.97%Unaltered Predation 194,786 498,105 520,828 436,789 626,992 2,277,501Predation Reduction 48,697 124,526 130,207 109,197 156,748 569,375Adjusted Reduction (predation reduction times 108,715 278,005 290,687 243,783 349,940 1,271,130 inriver survival factor less other mortality)Adult Returns 402 1,029 1,076 2,365 3,394 8,266Fall ChinookOutmigrants 891,620 17,939,983 34,923,345 111,827,230 - 165,582,178SAR's 0.60% 0.60% 0.60% 0.32% 0.32%Unaltered Predation 71,330 1,435,199 2,793,868 8,946,178 - 13,246,574Predation Reduction 17,832 358,800 698,467 2,236,545 - 3,311,644Adjusted Reduction (predation reduction times 39,811 801,020 1,559,327 4,993,086 - 7,393,244 inriver survival factor less other mortality)Adult Returns 239 4,806 9,356 15,978 - 30,379Summer/Winter SteelheadOutmigrants 13,407,612 1,417,207 557,978 3,923,427 1,523,203 20,829,428SAR's 0.70% 0.70% 0.70% 0.40% 0.40%Unaltered Predation 1,072,609 113,377 44,638 313,874 121,856 1,666,354Predation Reduction 268,152 28,344 11,160 78,469 30,464 416,589Adjusted Reduction (predation reduction times 598,650 63,278 24,914 175,181 68,011 930,034 inriver survival factor less other mortality)Adult Returns 4,191 443 174 701 272 5,781TotalOutmigrants 16,734,061 26,229,352 43,877,551 144,752,895 10,338,595 241,932,454Adult Survival Due to NPMP 4,832 6,624 11,616 45,322 4,190 72,585
D:\Data\Excel\pikeminnowFromFW.xls Alt I

Table 1bProject: Economic Evaluation of the NPMPStatement: Adult Returns Due to NPMPDate: July 15, 2004Filter: Alternative II
Outmigrants: APRE EstimateSAR's 1970's-1990's AverageContribution to Fisheries: 1980's AverageUnaltered Population Predation Rate: 8.0%Predation Reduction: 25.0%Inriver Survival Factor 2.35 Other Mortality 5.0%Notes:1. Outmigrant estimates are hatchery releases. The CRFPC hatchery release estimate is 143 million (68.8% planned from Sandos 2003) and the APRE estimate is 208 million. The outmigrant estimate for natural production is assumed to be a share of hatchery releases. The share is 5% coho, 30% spring/summer Chinook, 50% fall Chinook, and 30% summer/ winter steelhead.2. Predation reduction estimates from Friesen, Thomas A. and David L. Ward (1999).3. The SAR for the "doubling the runs" scenario is the rate necessary to double the harvest from the 1980's Columbia River Basin anadromous fish contribution to fisheries. The hypothetical SAR's are pretty close to what is seen in 1999-2000 brood year return rates.4. Inriver survival factor accounts for the saved juveniles not experiencing the passage mortality causes included in the overall SAR (Hankin and Richards 2000). 5. Other mortality accounts for differential effects on saved juveniles, such as predation from terns.
Stocks Snake R. U. Columbia M. Columbia L. Columbia Willamette TotalCohoOutmigrants - 939,429 2,743,134 34,244,035 1,422,564 39,349,161SAR's 1.20% 1.20% 2.50% 1.20%Unaltered Predation - 75,154 219,451 2,739,523 113,805 3,147,933Predation Reduction - 18,789 54,863 684,881 28,451 786,983Adjusted Reduction (predation reduction times - 41,945 122,481 1,528,996 63,517 1,756,940 inriver survival factor less other mortality)Adult Returns - 503 1,470 38,225 762 40,960Spring/Summer ChinookOutmigrants 3,541,631 9,056,615 9,469,771 7,941,762 11,400,045 41,409,824SAR's 0.37% 0.37% 0.37% 0.97% 0.97%Unaltered Predation 283,330 724,529 757,582 635,341 912,004 3,312,786Predation Reduction 70,833 181,132 189,395 158,835 228,001 828,196Adjusted Reduction (predation reduction times 158,134 404,378 422,825 354,600 509,012 1,848,949 inriver survival factor less other mortality)Adult Returns 585 1,496 1,564 3,440 4,937 12,023Fall ChinookOutmigrants 1,296,924 26,094,969 50,798,466 162,660,584 - 240,850,942SAR's 0.60% 0.60% 0.60% 0.32% 0.32%Unaltered Predation 103,754 2,087,597 4,063,877 13,012,847 - 19,268,075Predation Reduction 25,938 521,899 1,015,969 3,253,212 - 4,817,019Adjusted Reduction (predation reduction times 57,908 1,165,140 2,268,151 7,262,795 - 10,753,995 inriver survival factor less other mortality)Adult Returns 347 6,991 13,609 23,241 - 44,188Summer/Winter SteelheadOutmigrants 19,502,316 2,061,428 811,618 5,706,901 2,215,606 30,297,870SAR's 0.70% 0.70% 0.70% 0.40% 0.40%Unaltered Predation 1,560,185 164,914 64,929 456,552 177,249 2,423,830Predation Reduction 390,046 41,229 16,232 114,138 44,312 605,957Adjusted Reduction (predation reduction times 870,778 92,043 36,239 254,813 98,927 1,352,800 inriver survival factor less other mortality)Adult Returns 6,095 644 254 1,019 396 8,408TotalOutmigrants 24,340,870 38,152,441 63,822,989 210,553,283 15,038,215 351,907,798Adult Survival Due to NPMP 7,028 9,635 16,897 65,925 6,095 105,580
D:\Data\Excel\pikeminnowFromFW.xls Alt II

Table 1cProject: Economic Evaluation of the NPMPStatement: Adult Returns Due to NPMPDate: July 15, 2004Filter: Alternative III
Outmigrants: APRE EstimateSAR's Doubling the Runs ObjectiveContribution to Fisheries: Double 1980's AverageUnaltered Population Predation Rate: 8.0%Predation Reduction: 25.0%Inriver Survival Factor 2.35 Other Mortality 5.0%Notes:1. Outmigrant estimates are hatchery releases. The CRFPC hatchery release estimate is 143 million (68.8% planned from Sandos 2003) and the APRE estimate is 208 million. The outmigrant estimate for natural production is assumed to be a share of hatchery releases. The share is 5% coho, 30% spring/summer Chinook, 50% fall Chinook, and 30% summer/ winter steelhead.2. Predation reduction estimates from Friesen, Thomas A. and David L. Ward (1999).3. The SAR for the "doubling the runs" scenario is the rate necessary to double the harvest from the 1980's Columbia River Basin anadromous fish contribution to fisheries. The hypothetical SAR's are pretty close to what is seen in 1999-2000 brood year return rates.4. Inriver survival factor accounts for the saved juveniles not experiencing the passage mortality causes included in the overall SAR (Hankin and Richards 2000). 5. Other mortality accounts for differential effects on saved juveniles, such as predation from terns.
Stocks Snake R. U. Columbia M. Columbia L. Columbia Willamette TotalCohoOutmigrants - 939,429 2,743,134 34,244,035 1,422,564 39,349,161SAR's 2.98% 2.98% 5.80% 2.98%Unaltered Predation - 75,154 219,451 2,739,523 113,805 3,147,933Predation Reduction - 18,789 54,863 684,881 28,451 786,983Adjusted Reduction (predation reduction times - 41,945 122,481 1,528,996 63,517 1,756,940 inriver survival factor less other mortality)Adult Returns - 1,250 3,650 88,682 1,893 95,475Spring/Summer ChinookOutmigrants 3,541,631 9,056,615 9,469,771 7,941,762 11,400,045 41,409,824SAR's 0.79% 0.79% 0.79% 2.03% 2.04%Unaltered Predation 283,330 724,529 757,582 635,341 912,004 3,312,786Predation Reduction 70,833 181,132 189,395 158,835 228,001 828,196Adjusted Reduction (predation reduction times 158,134 404,378 422,825 354,600 509,012 1,848,949 inriver survival factor less other mortality)Adult Returns 1,249 3,195 3,340 7,198 10,384 25,366Fall ChinookOutmigrants 1,296,924 26,094,969 50,798,466 162,660,584 - 240,850,942SAR's 1.45% 1.45% 1.45% 0.77% 0.77%Unaltered Predation 103,754 2,087,597 4,063,877 13,012,847 - 19,268,075Predation Reduction 25,938 521,899 1,015,969 3,253,212 - 4,817,019Adjusted Reduction (predation reduction times 57,908 1,165,140 2,268,151 7,262,795 - 10,753,995 inriver survival factor less other mortality)Adult Returns 840 16,895 32,888 55,924 - 106,546Summer/Winter SteelheadOutmigrants 19,502,316 2,061,428 811,618 5,706,901 2,215,606 30,297,870SAR's 3.11% 3.11% 3.11% 1.78% 1.78%Unaltered Predation 1,560,185 164,914 64,929 456,552 177,249 2,423,830Predation Reduction 390,046 41,229 16,232 114,138 44,312 605,957Adjusted Reduction (predation reduction times 870,778 92,043 36,239 254,813 98,927 1,352,800 inriver survival factor less other mortality)Adult Returns 27,081 2,863 1,127 4,536 1,761 37,367TotalOutmigrants 24,340,870 38,152,441 63,822,989 210,553,283 15,038,215 351,907,798Adult Survival Due to NPMP 29,170 24,202 41,005 156,339 14,038 264,754
D:\Data\Excel\pikeminnowFromFW.xls Alt III

Table 2a.1Estimated Columbia River Basin Salmon/Steelhead Production in Terms of Surviving Adults (Hatchery and Wild)
by Geographic Region (Alternative I, Existing Smolt Releases (Hatchery and Wild) as Estimated by Friesen and Ward and Others)
Species: Coho Number of smolts released and fish
Snake River Upper Columbia Middle Columbia Lower Columbia Willamette harvested in area
Survived adults due to NPMP NA 346 1,010 26,279 524 28,160
West Coast HarvestAlaska
a) Commercial NA -- -- 0 -- 0b) Sport NA -- -- -- -- --
British Columbiaa) Commercial NA 7 20 1,183 10 1,220b) Sport NA 1 2 131 1 135
Washington oceana) Commercial NA 2 5 527 5 539b) Sport NA 35 101 3,942 105 4,182
Washington Puget Sounda) Commercial NA -- -- 13 -- 13b) Sport NA -- -- 13 -- 13
Oregona) Commercial NA 17 51 3,154 52 3,274b) Sport NA 22 66 3,154 68 3,310
Californiaa) Commercial NA 5 15 263 16 299b) Sport NA 3 10 131 10 155
Columbia Basin inlanda) Freshwater sport
Mainstem NA 2 5 1,314 5 1,326 Tributary NA -- -- -- -- --
b) Gillnet NA 17 51 7,198 52 7,318c) Tribal C & S NA 152 444 -- -- 596
Other NA 1 4 -- 4 10Hatchery
Hatchery requirement NA 35 101 1,261 52 1,449Hatchery surplus market NA 23 68 1,998 71 2,160Hatchery surplus carcass NA 23 68 1,998 71 2,160
kco D:\DATA\EXCEL\pikeminnowFromFW.xls CohoCapI

Table 2a.2Estimated Columbia River Basin Salmon/Steelhead Production in Terms of Surviving Adults (Hatchery and Wild)
by Geographic Region (Alternative I, Existing Smolt Releases (Hatchery and Wild) as Estimated by Friesen and Ward and Others)
Species: Spring/Summer Chinook Number of smolts released and fish
Snake River Upper Columbia Middle Columbia Lower Columbia Willamette harvested in area
Survived adults due to NPMP 402 1,029 1,076 2,365 3,394 8,266
West Coast HarvestAlaska
a) Commercial 10 26 27 213 305 581b) Sport -- -- -- 2 3 6
British Columbiaa) Commercial 20 51 54 260 373 759b) Sport 2 5 5 24 34 70
Washington oceana) Commercial 4 10 11 95 136 255b) Sport 4 10 11 24 34 83
Washington Puget Sounda) Commercial 2 5 5 0 0 13b) Sport -- -- -- 1 1 2
Oregona) Commercial 2 5 5 24 34 70b) Sport 2 5 5 24 34 70
Californiaa) Commercial -- -- -- -- -- --b) Sport -- -- -- -- -- --
Columbia Basin inlanda) Freshwater sport
Mainstem -- -- -- 236 339 576 Tributary -- -- -- -- -- --
b) Gillnet -- -- -- 236 339 576c) Tribal C & S 13 34 35 -- -- 82
Other 12 31 32 -- -- 75Hatchery
Hatchery requirement 93 238 249 209 300 1,090Hatchery surplus market 119 304 318 509 730 1,979Hatchery surplus carcass 119 304 318 509 730 1,979
kco D:\DATA\EXCEL\pikeminnowFromFW.xls SChinookCapI

Table 2a.3Estimated Columbia River Basin Salmon/Steelhead Production in Terms of Surviving Adults (Hatchery and Wild)
by Geographic Region (Alternative I, Existing Smolt Releases (Hatchery and Wild) as Estimated by Friesen and Ward and Others)
Species: Fall Chinook Number of smolts released and fish
Snake River Upper Columbia Middle Columbia Lower Columbia Willamette harvested in area
Survived adults due to NPMP 239 4,806 9,356 15,978 NA 30,379
West Coast HarvestAlaska
a) Commercial 14 288 561 240 NA 1,104b) Sport 0 0 1 -- NA 1
British Columbiaa) Commercial 60 1,202 2,339 3,196 NA 6,796b) Sport 5 96 187 479 NA 767
Washington oceana) Commercial 11 216 421 1,917 NA 2,565b) Sport 5 96 187 1,598 NA 1,886
Washington Puget Sounda) Commercial 0 0 0 -- NA 0b) Sport 0 0 0 -- NA 0
Oregona) Commercial 4 72 140 479 NA 695b) Sport 1 24 47 160 NA 232
Californiaa) Commercial 0 0 0 80 NA 80b) Sport 0 0 0 16 NA 16
Columbia Basin inlanda) Freshwater sport
Mainstem 2 48 94 799 NA 943 Tributary -- -- -- -- NA --
b) Gillnet 29 577 1,123 1,758 NA 3,486c) Tribal C & S 63 1,267 2,465 -- NA 3,795
Other 0 7 14 -- NA 21Hatchery
Hatchery requirement 34 687 1,337 4,280 NA 6,337Hatchery surplus market 6 113 220 488 NA 827Hatchery surplus carcass 6 113 220 488 NA 827
kco D:\DATA\EXCEL\pikeminnowFromFW.xls FChinookCapI

Table 2a.4Estimated Columbia River Basin Salmon/Steelhead Production in Terms of Surviving Adults (Hatchery and Wild)
by Geographic Region (Alternative I, Existing Smolt Releases (Hatchery and Wild) as Estimated by Friesen and Ward and Others)
Species: Summer/Winter Steelhead Number of smolts released and fish
Snake River Upper Columbia Middle Columbia Lower Columbia Willamette harvested in area
Survived adults due to NPMP 4,191 443 174 701 272 5,781
West Coast HarvestAlaska
a) Commercial -- -- -- -- -- --b) Sport 1 0 0 0 0 2
British Columbiaa) Commercial 42 4 2 7 3 58b) Sport -- -- -- -- -- --
Washington oceana) Commercial -- -- -- -- -- --b) Sport -- -- -- -- -- --
Washington Puget Sounda) Commercial -- -- -- -- -- --b) Sport -- -- -- -- -- --
Oregona) Commercial -- -- -- -- -- --b) Sport 1 0 0 0 0 2
Californiaa) Commercial -- -- -- -- -- --b) Sport -- -- -- -- -- --
Columbia Basin inlanda) Freshwater sport
Mainstem 257 27 11 315 122 733 Tributary 771 82 32 -- -- 885
b) Gillnet -- -- -- -- -- --c) Tribal C & S 686 72 29 -- -- 787
Other -- -- -- -- -- --Hatchery
Hatchery requirement 718 76 30 210 82 1,116Hatchery surplus market 857 91 36 84 33 1,100Hatchery surplus carcass 857 91 36 84 33 1,100
kco D:\DATA\EXCEL\pikeminnowFromFW.xls SteelhCapI

Table 2b.1Estimated Columbia River Basin Salmon/Steelhead Production in Terms of Surviving Adults (Hatchery and Wild)
by Geographic Region (Alternative II, NMFS Cap and 1970's and 1990's Actual Survival Rates)
Species: Coho Number of smolts released and fish
Snake River Upper Columbia Middle Columbia Lower Columbia Willamette harvested in area
Survived adults due to NPMP NA 503 1,470 38,225 762 40,960
West Coast HarvestAlaska
a) Commercial NA -- -- 0 -- 0b) Sport NA -- -- -- -- --
British Columbiaa) Commercial NA 10 29 1,720 15 1,775b) Sport NA 1 3 191 2 197
Washington oceana) Commercial NA 3 7 766 8 784b) Sport NA 50 147 5,734 152 6,083
Washington Puget Sounda) Commercial NA -- -- 19 -- 19b) Sport NA -- -- 19 -- 19
Oregona) Commercial NA 25 73 4,587 76 4,762b) Sport NA 33 96 4,587 99 4,814
Californiaa) Commercial NA 8 22 382 23 435b) Sport NA 5 15 191 15 226
Columbia Basin inlanda) Freshwater sport
Mainstem NA 3 7 1,911 8 1,929 Tributary NA -- -- -- -- --
b) Gillnet NA 25 73 10,469 76 10,644c) Tribal C & S NA 221 645 -- -- 866
Other NA 2 6 -- 6 14Hatchery
Hatchery requirement NA 50 147 1,835 76 2,108Hatchery surplus market NA 34 99 2,906 103 3,142Hatchery surplus carcass NA 34 99 2,906 103 3,142
kco D:\DATA\EXCEL\pikeminnowFromFW.xls CohoCapII

Table 2b.2Estimated Columbia River Basin Salmon/Steelhead Production in Terms of Surviving Adults (Hatchery and Wild)
by Geographic Region (Alternative II, NMFS Cap and 1970's and 1990's Actual Survival Rates)
Species: Spring/Summer Chinook Number of smolts released and fish
Snake River Upper Columbia Middle Columbia Lower Columbia Willamette harvested in area
Survived adults due to NPMP 585 1,496 1,564 3,440 4,937 12,023
West Coast HarvestAlaska
a) Commercial 15 37 39 310 444 845b) Sport -- -- -- 3 5 8
British Columbiaa) Commercial 29 75 78 378 543 1,104b) Sport 3 7 8 34 49 102
Washington oceana) Commercial 6 15 16 138 197 372b) Sport 6 15 16 34 49 120
Washington Puget Sounda) Commercial 3 7 8 0 0 19b) Sport -- -- -- 1 1 3
Oregona) Commercial 3 7 8 34 49 102b) Sport 3 7 8 34 49 102
Californiaa) Commercial -- -- -- -- -- --b) Sport -- -- -- -- -- --
Columbia Basin inlanda) Freshwater sport
Mainstem -- -- -- 344 494 838 Tributary -- -- -- -- -- --
b) Gillnet -- -- -- 344 494 838c) Tribal C & S 19 49 51 -- -- 119
Other 18 45 47 -- -- 109Hatchery
Hatchery requirement 136 347 362 304 436 1,585Hatchery surplus market 173 442 462 740 1,062 2,879Hatchery surplus carcass 173 442 462 740 1,062 2,879
kco D:\DATA\EXCEL\pikeminnowFromFW.xls SChinookCapII

Table 2b.3Estimated Columbia River Basin Salmon/Steelhead Production in Terms of Surviving Adults (Hatchery and Wild)
by Geographic Region (Alternative II, NMFS Cap and 1970's and 1990's Actual Survival Rates)
Species: Fall Chinook Number of smolts released and fish
Snake River Upper Columbia Middle Columbia Lower Columbia Willamette harvested in area
Survived adults due to NPMP 347 6,991 13,609 23,241 NA 44,188
West Coast HarvestAlaska
a) Commercial 21 419 817 349 NA 1,605b) Sport 0 1 1 -- NA 2
British Columbiaa) Commercial 87 1,748 3,402 4,648 NA 9,885b) Sport 7 140 272 697 NA 1,116
Washington oceana) Commercial 16 315 612 2,789 NA 3,732b) Sport 7 140 272 2,324 NA 2,743
Washington Puget Sounda) Commercial 0 0 0 -- NA 0b) Sport 0 0 0 -- NA 0
Oregona) Commercial 5 105 204 697 NA 1,011b) Sport 2 35 68 232 NA 337
Californiaa) Commercial 0 0 0 116 NA 116b) Sport 0 0 0 23 NA 23
Columbia Basin inlanda) Freshwater sport
Mainstem 3 70 136 1,162 NA 1,372 Tributary -- -- -- -- NA --
b) Gillnet 42 839 1,633 2,557 NA 5,070c) Tribal C & S 92 1,842 3,586 -- NA 5,520
Other 1 10 20 -- NA 30Hatchery
Hatchery requirement 50 999 1,944 6,225 NA 9,218Hatchery surplus market 8 164 320 711 NA 1,203Hatchery surplus carcass 8 164 320 711 NA 1,203
kco D:\DATA\EXCEL\pikeminnowFromFW.xls FChinookCapII

Table 2b.4Estimated Columbia River Basin Salmon/Steelhead Production in Terms of Surviving Adults (Hatchery and Wild)
by Geographic Region (Alternative II, NMFS Cap and 1970's and 1990's Actual Survival Rates)
Species: Summer/Winter Steelhead Number of smolts released and fish
Snake River Upper Columbia Middle Columbia Lower Columbia Willamette harvested in area
Survived adults due to NPMP 6,095 644 254 1,019 396 8,408
West Coast HarvestAlaska
a) Commercial -- -- -- -- -- --b) Sport 2 0 0 0 0 3
British Columbiaa) Commercial 61 6 3 10 4 84b) Sport -- -- -- -- -- --
Washington oceana) Commercial -- -- -- -- -- --b) Sport -- -- -- -- -- --
Washington Puget Sounda) Commercial -- -- -- -- -- --b) Sport -- -- -- -- -- --
Oregona) Commercial -- -- -- -- -- --b) Sport 2 0 0 0 0 3
Californiaa) Commercial -- -- -- -- -- --b) Sport -- -- -- -- -- --
Columbia Basin inlanda) Freshwater sport
Mainstem 374 40 16 459 178 1,066 Tributary 1,122 119 47 -- -- 1,287
b) Gillnet -- -- -- -- -- --c) Tribal C & S 997 105 41 -- -- 1,144
Other -- -- -- -- -- --Hatchery
Hatchery requirement 1,045 110 43 306 119 1,623Hatchery surplus market 1,246 132 52 122 47 1,599Hatchery surplus carcass 1,246 132 52 122 47 1,599
kco D:\DATA\EXCEL\pikeminnowFromFW.xls SteelhCapII
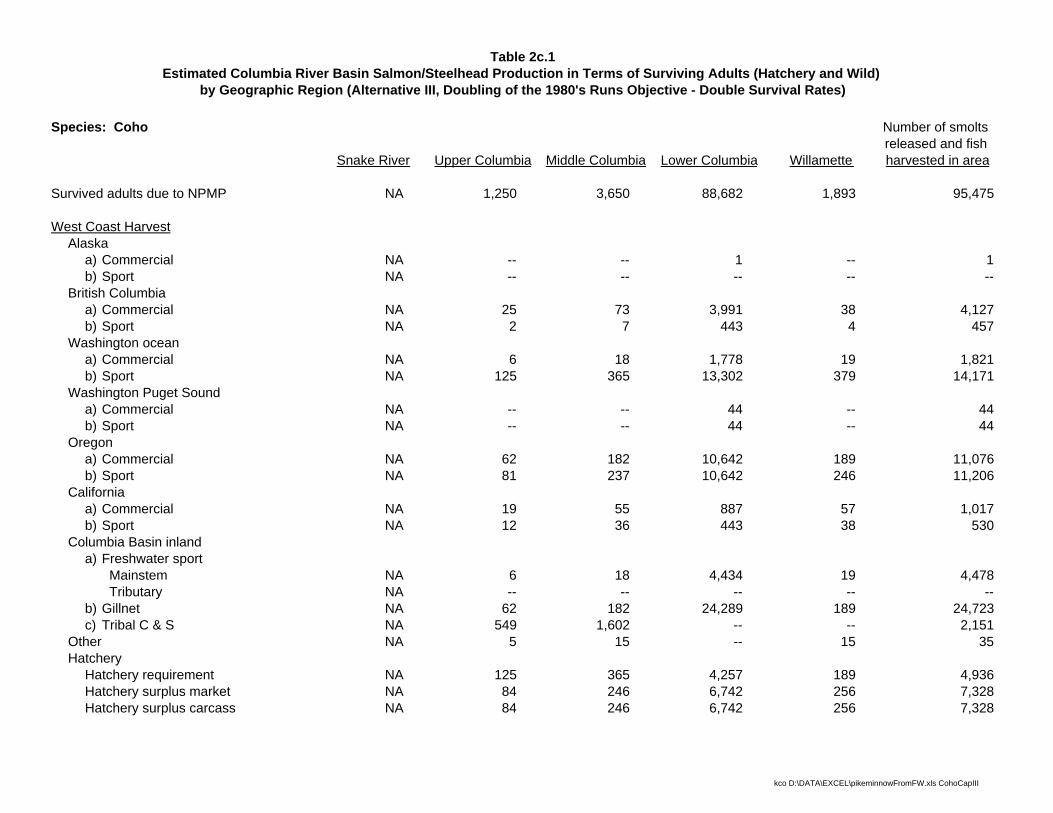
Table 2c.1Estimated Columbia River Basin Salmon/Steelhead Production in Terms of Surviving Adults (Hatchery and Wild)
by Geographic Region (Alternative III, Doubling of the 1980's Runs Objective - Double Survival Rates)
Species: Coho Number of smolts released and fish
Snake River Upper Columbia Middle Columbia Lower Columbia Willamette harvested in area
Survived adults due to NPMP NA 1,250 3,650 88,682 1,893 95,475
West Coast HarvestAlaska
a) Commercial NA -- -- 1 -- 1b) Sport NA -- -- -- -- --
British Columbiaa) Commercial NA 25 73 3,991 38 4,127b) Sport NA 2 7 443 4 457
Washington oceana) Commercial NA 6 18 1,778 19 1,821b) Sport NA 125 365 13,302 379 14,171
Washington Puget Sounda) Commercial NA -- -- 44 -- 44b) Sport NA -- -- 44 -- 44
Oregona) Commercial NA 62 182 10,642 189 11,076b) Sport NA 81 237 10,642 246 11,206
Californiaa) Commercial NA 19 55 887 57 1,017b) Sport NA 12 36 443 38 530
Columbia Basin inlanda) Freshwater sport
Mainstem NA 6 18 4,434 19 4,478 Tributary NA -- -- -- -- --
b) Gillnet NA 62 182 24,289 189 24,723c) Tribal C & S NA 549 1,602 -- -- 2,151
Other NA 5 15 -- 15 35Hatchery
Hatchery requirement NA 125 365 4,257 189 4,936Hatchery surplus market NA 84 246 6,742 256 7,328Hatchery surplus carcass NA 84 246 6,742 256 7,328
kco D:\DATA\EXCEL\pikeminnowFromFW.xls CohoCapIII

Table 2c.2Estimated Columbia River Basin Salmon/Steelhead Production in Terms of Surviving Adults (Hatchery and Wild)
by Geographic Region (Alternative III, Doubling of the 1980's Runs Objective - Double Survival Rates)
Species: Spring/Summer Chinook Number of smolts released and fish
Snake River Upper Columbia Middle Columbia Lower Columbia Willamette harvested in area
Survived adults due to NPMP 1,249 3,195 3,340 7,198 10,384 25,366
West Coast HarvestAlaska
a) Commercial 31 80 84 648 935 1,777b) Sport -- -- -- 7 10 18
British Columbiaa) Commercial 62 160 167 792 1,142 2,323b) Sport 6 16 17 72 104 215
Washington oceana) Commercial 12 32 33 288 415 781b) Sport 12 32 33 72 104 254
Washington Puget Sounda) Commercial 6 16 17 1 1 41b) Sport -- -- -- 2 3 5
Oregona) Commercial 6 16 17 72 104 215b) Sport 6 16 17 72 104 215
Californiaa) Commercial -- -- -- -- -- --b) Sport -- -- -- -- -- --
Columbia Basin inlanda) Freshwater sport
Mainstem -- -- -- 720 1,038 1,758 Tributary -- -- -- -- -- --
b) Gillnet -- -- -- 720 1,038 1,758c) Tribal C & S 41 104 109 -- -- 254
Other 37 96 100 -- -- 234Hatchery
Hatchery requirement 289 740 774 636 918 3,357Hatchery surplus market 369 943 987 1,548 2,234 6,081Hatchery surplus carcass 369 943 987 1,548 2,234 6,081
kco D:\DATA\EXCEL\pikeminnowFromFW.xls SChinookCapIII
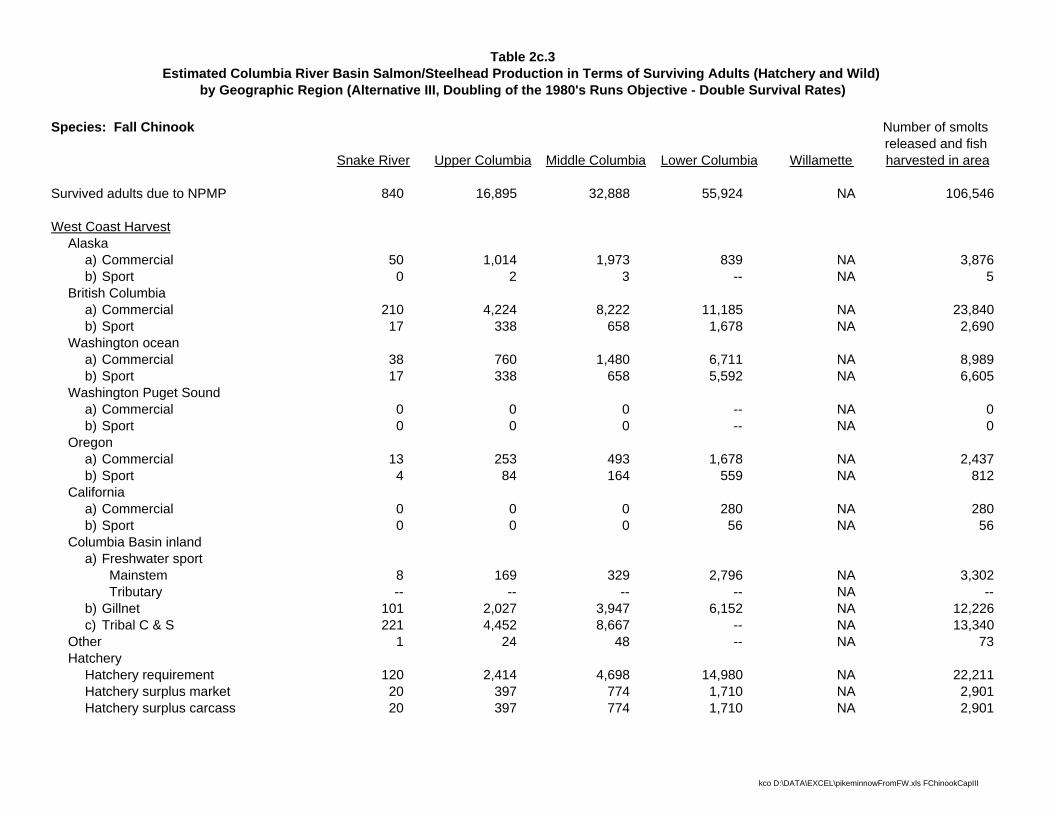
Table 2c.3Estimated Columbia River Basin Salmon/Steelhead Production in Terms of Surviving Adults (Hatchery and Wild)
by Geographic Region (Alternative III, Doubling of the 1980's Runs Objective - Double Survival Rates)
Species: Fall Chinook Number of smolts released and fish
Snake River Upper Columbia Middle Columbia Lower Columbia Willamette harvested in area
Survived adults due to NPMP 840 16,895 32,888 55,924 NA 106,546
West Coast HarvestAlaska
a) Commercial 50 1,014 1,973 839 NA 3,876b) Sport 0 2 3 -- NA 5
British Columbiaa) Commercial 210 4,224 8,222 11,185 NA 23,840b) Sport 17 338 658 1,678 NA 2,690
Washington oceana) Commercial 38 760 1,480 6,711 NA 8,989b) Sport 17 338 658 5,592 NA 6,605
Washington Puget Sounda) Commercial 0 0 0 -- NA 0b) Sport 0 0 0 -- NA 0
Oregona) Commercial 13 253 493 1,678 NA 2,437b) Sport 4 84 164 559 NA 812
Californiaa) Commercial 0 0 0 280 NA 280b) Sport 0 0 0 56 NA 56
Columbia Basin inlanda) Freshwater sport
Mainstem 8 169 329 2,796 NA 3,302 Tributary -- -- -- -- NA --
b) Gillnet 101 2,027 3,947 6,152 NA 12,226c) Tribal C & S 221 4,452 8,667 -- NA 13,340
Other 1 24 48 -- NA 73Hatchery
Hatchery requirement 120 2,414 4,698 14,980 NA 22,211Hatchery surplus market 20 397 774 1,710 NA 2,901Hatchery surplus carcass 20 397 774 1,710 NA 2,901
kco D:\DATA\EXCEL\pikeminnowFromFW.xls FChinookCapIII

Table 2c.4Estimated Columbia River Basin Salmon/Steelhead Production in Terms of Surviving Adults (Hatchery and Wild)
by Geographic Region (Alternative III, Doubling of the 1980's Runs Objective - Double Survival Rates)
Species: Summer/Winter Steelhead Number of smolts released and fish
Snake River Upper Columbia Middle Columbia Lower Columbia Willamette harvested in area
Survived adults due to NPMP 27,081 2,863 1,127 4,536 1,761 37,367
West Coast HarvestAlaska
a) Commercial -- -- -- -- -- --b) Sport 8 1 0 1 1 11
British Columbiaa) Commercial 271 29 11 45 18 374b) Sport -- -- -- -- -- --
Washington oceana) Commercial -- -- -- -- -- --b) Sport -- -- -- -- -- --
Washington Puget Sounda) Commercial -- -- -- -- -- --b) Sport -- -- -- -- -- --
Oregona) Commercial -- -- -- -- -- --b) Sport 8 1 0 1 1 11
Californiaa) Commercial -- -- -- -- -- --b) Sport -- -- -- -- -- --
Columbia Basin inlanda) Freshwater sport
Mainstem 1,661 176 69 2,041 792 4,740 Tributary 4,984 527 207 -- -- 5,718
b) Gillnet -- -- -- -- -- --c) Tribal C & S 4,430 468 184 -- -- 5,083
Other -- -- -- -- -- --Hatchery
Hatchery requirement 4,642 491 193 1,361 528 7,215Hatchery surplus market 5,538 585 230 543 211 7,107Hatchery surplus carcass 5,538 585 230 543 211 7,107
kco D:\DATA\EXCEL\pikeminnowFromFW.xls SteelhCapIII

Table 3a.1Estimated Regional Economic Impacts and Net Economic Values by Geographic Region of Columbia River Basin Salmon/Steel-head Smolt Releases (Alternative I, Existing Smolt Releases (Hatchery and Wild) as Estimated by Friesen and Ward and Others)
Species: Total State Total Total Coho Level Average Total Recreational Recreational Total Total
REI NEV REI NEV REI % NEV %Snake River
Alaska NA NA NA NA NA NA NA NABritish Columbia NA NA NA NA NA NA NA NAWashington ocean NA NA NA NA NA NA NA NAWashington Puget Sound NA NA NA NA NA NA NA NAOregon NA NA NA NA NA NA NA NACalifornia NA NA NA NA NA NA NA NAColumbia Basin inland
Freshwater sportMainstem NA NA NA NA NA NA NA NATributary NA NA NA NA NA NA NA NA
Gillnet NA NA NA NA NA NA NA NATribal NA NA NA NA NA NA NA NA
Other NA NA NA NA NA NA NA NAHatchery
Hatchery surplus market NA NA NA NA NA NA NA NAHatchery carcass NA NA NA NA NA NA NA NA
Total with hatchery surplus utilization NA NA NA NATotal without hatchery surplus utilization NA NA
Upper ColumbiaAlaska 0 0 0 0 0 0% 0 0%British Columbia 126 60 42 36 167 2% 96 2%Washington ocean 22 10 2,076 1,780 2,098 29% 1,790 34%Washington Puget Sound 0 0 0 0 0 0% 0 0%Oregon 302 159 1,350 1,157 1,651 23% 1,315 25%California 107 49 208 178 315 4% 227 4%Columbia Basin inland
Freshwater sportMainstem 0 0 104 89 104 1% 89 2%Tributary 0 0 0 0 0 0% 0 0%
Gillnet 262 156 0 0 262 4% 156 3%Tribal 2,301 1,366 0 0 2,301 32% 1,366 26%
Other 0 0 0 0 0 0% 0 0%Hatchery
Hatchery surplus market 279 170 0 0 279 4% 170 3%Hatchery carcass 116 71 0 0 116 2% 71 1%
Total with hatchery surplus utilization 7,293 100% 5,279 100%Total without hatchery surplus utilization 6,898 5,038
Middle ColumbiaAlaska 0 0 0 0 0 0% 0 0%British Columbia 367 176 121 104 488 2% 280 2%Washington ocean 63 30 6,063 5,197 6,126 29% 5,227 34%Washington Puget Sound 0 0 0 0 0 0% 0 0%Oregon 881 463 3,941 3,378 4,821 23% 3,841 25%California 313 142 606 520 919 4% 661 4%Columbia Basin inland
Freshwater sportMainstem 0 0 303 260 303 1% 260 2%Tributary 0 0 0 0 0 0% 0 0%
Gillnet 765 454 0 0 765 4% 454 3%Tribal 6,720 3,988 0 0 6,720 32% 3,988 26%
Other 0 0 0 0 0 0% 0 0%Hatchery
Hatchery surplus market 814 497 0 0 814 4% 497 3%Hatchery carcass 339 208 0 0 339 2% 208 1%
Total with hatchery surplus utilization 21,296 100% 15,416 100%Total without hatchery surplus utilization 20,143 14,711
kco D:\DATA\EXCEL\pikeminnowFromFW.xls CohoCapWatI

Species: Total State Total Total Coho Level Average Total Recreational Recreational Total Total
REI NEV REI NEV REI % NEV %
Lower ColumbiaAlaska 6 3 0 0 6 0% 3 0%British Columbia 21,464 10,288 7,884 6,758 29,347 4% 17,046 3%Washington ocean 6,581 3,156 236,513 202,731 243,093 32% 205,887 36%Washington Puget Sound 222 114 788 676 1,010 0% 790 0%Oregon 54,966 28,918 189,210 162,185 244,176 33% 191,102 33%California 5,427 2,457 7,884 6,758 13,310 2% 9,215 2%Columbia Basin inland
Freshwater sportMainstem 0 0 78,838 67,577 78,838 11% 67,577 12%Tributary 0 0 0 0 0 0% 0 0%
Gillnet 109,044 64,706 0 0 109,044 15% 64,706 11%Tribal 0 0 0 0 0 0% 0 0%
Other 0 0 0 0 0 0% 0 0%Hatchery
Hatchery surplus market 23,855 14,545 0 0 23,855 3% 14,545 3%Hatchery carcass 6,519 4,009 0 0 6,519 1% 4,009 1%
Total with hatchery surplus utilization 749,197 100% 574,879 100%Total without hatchery surplus utilization 718,824 556,325
WillametteAlaska 0 0 0 0 0 0% 0 0%British Columbia 190 91 63 54 253 2% 145 1%Washington ocean 65 31 6,288 5,390 6,354 43% 5,421 47%Washington Puget Sound 0 0 0 0 0 0% 0 0%Oregon 913 481 4,087 3,503 5,001 34% 3,984 34%California 325 147 629 539 953 6% 686 6%Columbia Basin inland
Freshwater sportMainstem 0 0 314 269 314 2% 269 2%Tributary 0 0 0 0 0 0% 0 0%
Gillnet 794 471 0 0 794 5% 471 4%Tribal 0 0 0 0 0 0% 0 0%
Other 0 0 0 0 0 0% 0 0%Hatchery
Hatchery surplus market 845 515 0 0 845 6% 515 4%Hatchery carcass 246 151 0 0 246 2% 151 1%
Total with hatchery surplus utilization 14,760 100% 11,643 100%Total without hatchery surplus utilization 13,669 10,977
TotalAlaska 6 3 0 0 6 0% 3 0%British Columbia 22,146 10,616 8,109 6,951 30,256 4% 17,567 3%Washington ocean 6,731 3,228 250,940 215,097 257,671 33% 218,325 36%Washington Puget Sound 222 114 788 676 1,010 0% 790 0%Oregon 57,061 30,020 198,588 170,223 255,649 32% 200,243 33%California 6,171 2,794 9,326 7,994 15,498 2% 10,789 2%Columbia Basin inland
Freshwater sportMainstem 0 0 79,559 68,195 79,559 10% 68,195 11%Tributary 0 0 0 0 0 0% 0 0%
Gillnet 110,865 65,787 0 0 110,865 14% 65,787 11%Tribal 9,022 5,354 0 0 9,022 1% 5,354 1%
Other 0 0 0 0 0 0% 0 0%Hatchery
Hatchery surplus market 25,793 15,726 0 0 25,793 3% 15,726 3%Hatchery carcass 7,219 4,440 0 0 7,219 1% 4,440 1%
Total with hatchery surplus utilization 792,546 100% 607,218 100%Total without hatchery surplus utilization 759,535 587,052
kco D:\DATA\EXCEL\pikeminnowFromFW.xls CohoCapWatI

Table 3a.2Estimated Regional Economic Impacts and Net Economic Values by Geographic Region of Columbia River Basin Salmon/Steel-head Smolt Releases (Alternative I, Existing Smolt Releases (Hatchery and Wild) as Estimated by Friesen and Ward and Others)
Species: Total State Total Total Spring/Summer Chinook Level Average Total Recreational Recreational Total Total
REI NEV REI NEV REI % NEV %Snake River
Alaska 695 340 0 0 695 7% 340 6%British Columbia 1,408 690 121 103 1,528 15% 793 14%Washington ocean 194 95 241 207 436 4% 302 5%Washington Puget Sound 83 43 0 0 83 1% 43 1%Oregon 85 44 121 103 205 2% 147 3%California 0 0 0 0 0 0% 0 0%Columbia Basin inland
Freshwater sportMainstem 0 0 0 0 0 0% 0 0%Tributary 0 0 0 0 0 0% 0 0%
Gillnet 0 0 0 0 0 0% 0 0%Tribal 1,295 656 0 0 1,295 12% 656 11%
Other 0 0 0 0 0 0% 0 0%Hatchery
Hatchery surplus market 5,835 3,192 0 0 5,835 56% 3,192 56%Hatchery carcass 424 261 0 0 424 4% 261 5%
Total with hatchery surplus utilization 10,502 100% 5,734 100%Total without hatchery surplus utilization 4,243 2,282
Upper ColumbiaAlaska 1,778 870 0 0 1,778 7% 870 6%British Columbia 3,600 1,764 309 265 3,908 15% 2,029 14%Washington ocean 497 244 617 529 1,114 4% 773 5%Washington Puget Sound 212 109 0 0 212 1% 109 1%Oregon 216 111 309 265 525 2% 376 3%California 0 0 0 0 0 0% 0 0%Columbia Basin inland
Freshwater sportMainstem 0 0 0 0 0 0% 0 0%Tributary 0 0 0 0 0 0% 0 0%
Gillnet 0 0 0 0 0 0% 0 0%Tribal 3,313 1,678 0 0 3,313 12% 1,678 11%
Other 0 0 0 0 0 0% 0 0%Hatchery
Hatchery surplus market 14,922 8,163 0 0 14,922 56% 8,163 56%Hatchery carcass 1,084 667 0 0 1,084 4% 667 5%
Total with hatchery surplus utilization 26,856 100% 14,664 100%Total without hatchery surplus utilization 10,850 5,834
Middle ColumbiaAlaska 1,859 910 0 0 1,859 7% 910 6%British Columbia 3,764 1,845 323 277 4,087 15% 2,121 14%Washington ocean 520 255 645 553 1,165 4% 808 5%Washington Puget Sound 222 114 0 0 222 1% 114 1%Oregon 226 116 323 277 549 2% 393 3%California 0 0 0 0 0 0% 0 0%Columbia Basin inland
Freshwater sportMainstem 0 0 0 0 0 0% 0 0%Tributary 0 0 0 0 0 0% 0 0%
Gillnet 0 0 0 0 0 0% 0 0%Tribal 3,464 1,755 0 0 3,464 12% 1,755 11%
Other 0 0 0 0 0 0% 0 0%Hatchery
Hatchery surplus market 15,603 8,535 0 0 15,603 56% 8,535 56%Hatchery carcass 1,134 697 0 0 1,134 4% 697 5%
Total with hatchery surplus utilization 28,082 100% 15,333 100%Total without hatchery surplus utilization 11,345 6,101
kco D:\DATA\EXCEL\pikeminnowFromFW.xls SChnkCapWatI

Species: Total State Total Total Spring/Summer Chinook Level Average Total Recreational Recreational Total Total
REI NEV REI NEV REI % NEV %
Lower ColumbiaAlaska 14,717 7,200 142 122 14,859 12% 7,321 10%British Columbia 18,206 8,922 1,419 1,216 19,624 16% 10,138 14%Washington ocean 4,570 2,240 1,419 1,216 5,988 5% 3,456 5%Washington Puget Sound 10 5 43 36 52 0% 41 0%Oregon 994 512 1,419 1,216 2,413 2% 1,728 2%California 0 0 0 0 0 0% 0 0%Columbia Basin inland
Freshwater sportMainstem 0 0 28,376 24,323 28,376 23% 24,323 33%Tributary 0 0 0 0 0 0% 0 0%
Gillnet 23,314 11,812 0 0 23,314 19% 11,812 16%Tribal 0 0 0 0 0 0% 0 0%
Other 0 0 0 0 0 0% 0 0%Hatchery
Hatchery surplus market 24,987 13,668 0 0 24,987 21% 13,668 19%Hatchery carcass 1,435 883 0 0 1,435 1% 883 1%
Total with hatchery surplus utilization 121,049 100% 73,371 100%Total without hatchery surplus utilization 94,627 58,820
WillametteAlaska 21,125 10,335 204 175 21,329 12% 10,510 10%British Columbia 26,133 12,807 2,037 1,746 28,170 16% 14,553 14%Washington ocean 6,559 3,215 2,037 1,746 8,596 5% 4,961 5%Washington Puget Sound 14 7 61 52 75 0% 60 0%Oregon 1,427 735 2,037 1,746 3,464 2% 2,481 2%California 0 0 0 0 0 0% 0 0%Columbia Basin inland
Freshwater sportMainstem 0 0 40,733 34,915 40,733 23% 34,915 33%Tributary 0 0 0 0 0 0% 0 0%
Gillnet 33,466 16,955 0 0 33,466 19% 16,955 16%Tribal 0 0 0 0 0 0% 0 0%
Other 0 0 0 0 0 0% 0 0%Hatchery
Hatchery surplus market 35,867 19,620 0 0 35,867 21% 19,620 19%Hatchery carcass 2,060 1,267 0 0 2,060 1% 1,267 1%
Total with hatchery surplus utilization 173,760 100% 105,321 100%Total without hatchery surplus utilization 135,832 84,434
TotalAlaska 40,175 19,655 346 296 40,520 11% 19,951 9%British Columbia 53,110 26,028 4,207 3,606 57,317 16% 29,634 14%Washington ocean 12,340 6,049 4,959 4,251 17,299 5% 10,300 5%Washington Puget Sound 540 278 104 89 644 0% 367 0%Oregon 2,949 1,518 4,207 3,606 7,156 2% 5,125 2%California 0 0 0 0 0 0% 0 0%Columbia Basin inland
Freshwater sportMainstem 0 0 69,109 59,238 69,109 19% 59,238 28%Tributary 0 0 0 0 0 0% 0 0%
Gillnet 56,779 28,767 0 0 56,779 16% 28,767 13%Tribal 8,072 4,090 0 0 8,072 2% 4,090 2%
Other 0 0 0 0 0 0% 0 0%Hatchery
Hatchery surplus market 97,214 53,179 0 0 97,214 27% 53,179 25%Hatchery carcass 6,137 3,774 0 0 6,137 2% 3,774 2%
Total with hatchery surplus utilization 360,249 100% 214,424 100%Total without hatchery surplus utilization 256,897 157,470
kco D:\DATA\EXCEL\pikeminnowFromFW.xls SChnkCapWatI

Table 3a.3Estimated Regional Economic Impacts and Net Economic Values by Geographic Region of Columbia River Basin Salmon/Steel-head Smolt Releases (Alternative I, Existing Smolt Releases (Hatchery and Wild) as Estimated by Friesen and Ward and Others)
Species: Total State Total Total Fall Chinook Level Average Total Recreational Recreational Total Total
REI NEV REI NEV REI % NEV %Snake River
Alaska 991 485 1 1 992 9% 486 8%British Columbia 4,180 2,048 287 246 4,466 42% 2,294 39%Washington ocean 519 255 287 246 806 8% 500 8%Washington Puget Sound 0 0 0 0 0 0% 0 0%Oregon 151 78 72 61 222 2% 139 2%California 0 0 0 0 0 0% 0 0%Columbia Basin inland
Freshwater sportMainstem 0 0 215 184 215 2% 184 3%Tributary 0 0 0 0 0 0% 0 0%
Gillnet 1,182 674 0 0 1,182 11% 674 11%Tribal 2,595 1,481 0 0 2,595 24% 1,481 25%
Other 0 0 0 0 0 0% 0 0%Hatchery
Hatchery surplus market 167 103 0 0 167 2% 103 2%Hatchery carcass 79 49 0 0 79 1% 49 1%
Total with hatchery surplus utilization 10,725 100% 5,911 100%Total without hatchery surplus utilization 10,478 5,759
Upper ColumbiaAlaska 19,941 9,755 29 25 19,969 9% 9,780 8%British Columbia 84,095 41,212 5,767 4,944 89,862 42% 46,156 39%Washington ocean 10,448 5,121 5,767 4,944 16,216 8% 10,065 8%Washington Puget Sound 1 1 1 1 2 0% 2 0%Oregon 3,031 1,561 1,442 1,236 4,473 2% 2,797 2%California 1 1 1 1 3 0% 2 0%Columbia Basin inland
Freshwater sportMainstem 0 0 4,326 3,708 4,326 2% 3,708 3%Tributary 0 0 0 0 0 0% 0 0%
Gillnet 23,773 13,571 0 0 23,773 11% 13,571 11%Tribal 52,206 29,801 0 0 52,206 24% 29,801 25%
Other 0 0 0 0 0 0% 0 0%Hatchery
Hatchery surplus market 3,364 2,063 0 0 3,364 2% 2,063 2%Hatchery carcass 1,599 984 0 0 1,599 1% 984 1%
Total with hatchery surplus utilization 215,793 100% 118,928 100%Total without hatchery surplus utilization 210,830 115,881
Middle ColumbiaAlaska 38,818 18,991 56 48 38,874 9% 19,039 8%British Columbia 163,706 80,227 11,227 9,624 174,933 42% 89,851 39%Washington ocean 20,339 9,970 11,227 9,624 31,567 8% 19,593 8%Washington Puget Sound 2 1 3 2 5 0% 3 0%Oregon 5,901 3,038 2,807 2,406 8,708 2% 5,444 2%California 3 1 3 2 5 0% 3 0%Columbia Basin inland
Freshwater sportMainstem 0 0 8,420 7,218 8,420 2% 7,218 3%Tributary 0 0 0 0 0 0% 0 0%
Gillnet 46,278 26,418 0 0 46,278 11% 26,418 11%Tribal 101,628 58,013 0 0 101,628 24% 58,013 25%
Other 0 0 0 0 0 0% 0 0%Hatchery
Hatchery surplus market 6,548 4,017 0 0 6,548 2% 4,017 2%Hatchery carcass 3,113 1,915 0 0 3,113 1% 1,915 1%
Total with hatchery surplus utilization 420,080 100% 231,514 100%Total without hatchery surplus utilization 410,418 225,582
kco D:\DATA\EXCEL\pikeminnowFromFW.xls FChnkCapWatI
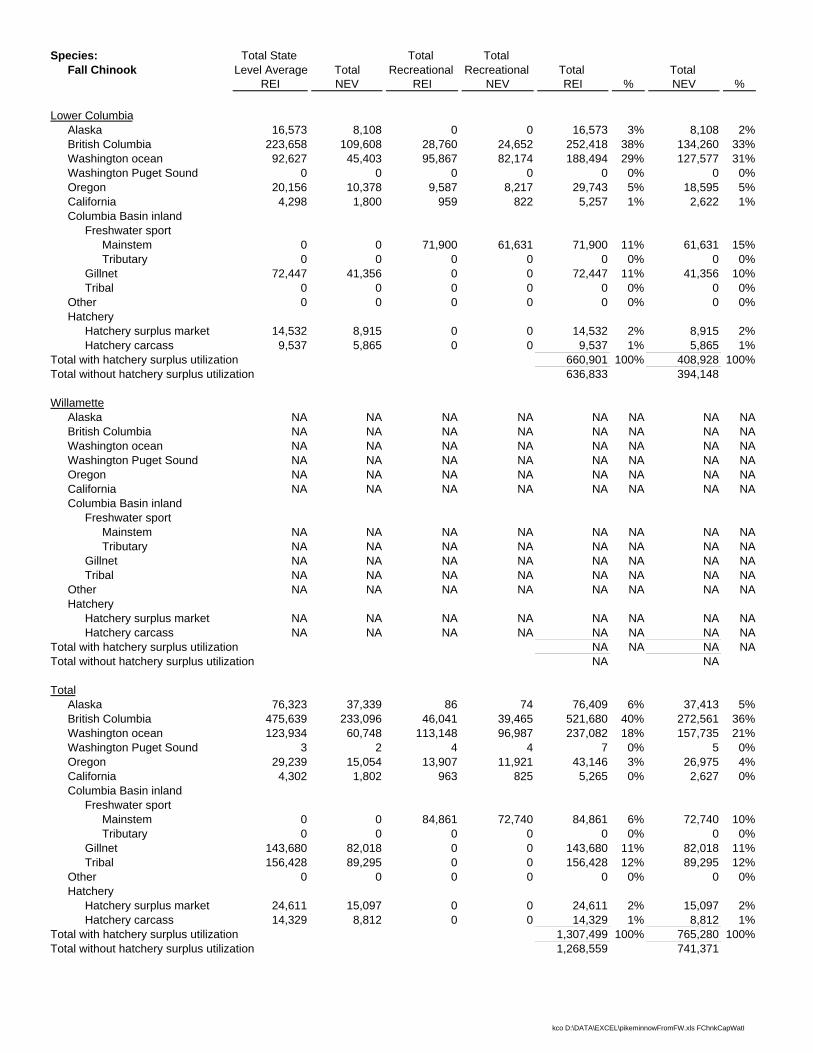
Species: Total State Total Total Fall Chinook Level Average Total Recreational Recreational Total Total
REI NEV REI NEV REI % NEV %
Lower ColumbiaAlaska 16,573 8,108 0 0 16,573 3% 8,108 2%British Columbia 223,658 109,608 28,760 24,652 252,418 38% 134,260 33%Washington ocean 92,627 45,403 95,867 82,174 188,494 29% 127,577 31%Washington Puget Sound 0 0 0 0 0 0% 0 0%Oregon 20,156 10,378 9,587 8,217 29,743 5% 18,595 5%California 4,298 1,800 959 822 5,257 1% 2,622 1%Columbia Basin inland
Freshwater sportMainstem 0 0 71,900 61,631 71,900 11% 61,631 15%Tributary 0 0 0 0 0 0% 0 0%
Gillnet 72,447 41,356 0 0 72,447 11% 41,356 10%Tribal 0 0 0 0 0 0% 0 0%
Other 0 0 0 0 0 0% 0 0%Hatchery
Hatchery surplus market 14,532 8,915 0 0 14,532 2% 8,915 2%Hatchery carcass 9,537 5,865 0 0 9,537 1% 5,865 1%
Total with hatchery surplus utilization 660,901 100% 408,928 100%Total without hatchery surplus utilization 636,833 394,148
WillametteAlaska NA NA NA NA NA NA NA NABritish Columbia NA NA NA NA NA NA NA NAWashington ocean NA NA NA NA NA NA NA NAWashington Puget Sound NA NA NA NA NA NA NA NAOregon NA NA NA NA NA NA NA NACalifornia NA NA NA NA NA NA NA NAColumbia Basin inland
Freshwater sportMainstem NA NA NA NA NA NA NA NATributary NA NA NA NA NA NA NA NA
Gillnet NA NA NA NA NA NA NA NATribal NA NA NA NA NA NA NA NA
Other NA NA NA NA NA NA NA NAHatchery
Hatchery surplus market NA NA NA NA NA NA NA NAHatchery carcass NA NA NA NA NA NA NA NA
Total with hatchery surplus utilization NA NA NA NATotal without hatchery surplus utilization NA NA
TotalAlaska 76,323 37,339 86 74 76,409 6% 37,413 5%British Columbia 475,639 233,096 46,041 39,465 521,680 40% 272,561 36%Washington ocean 123,934 60,748 113,148 96,987 237,082 18% 157,735 21%Washington Puget Sound 3 2 4 4 7 0% 5 0%Oregon 29,239 15,054 13,907 11,921 43,146 3% 26,975 4%California 4,302 1,802 963 825 5,265 0% 2,627 0%Columbia Basin inland
Freshwater sportMainstem 0 0 84,861 72,740 84,861 6% 72,740 10%Tributary 0 0 0 0 0 0% 0 0%
Gillnet 143,680 82,018 0 0 143,680 11% 82,018 11%Tribal 156,428 89,295 0 0 156,428 12% 89,295 12%
Other 0 0 0 0 0 0% 0 0%Hatchery
Hatchery surplus market 24,611 15,097 0 0 24,611 2% 15,097 2%Hatchery carcass 14,329 8,812 0 0 14,329 1% 8,812 1%
Total with hatchery surplus utilization 1,307,499 100% 765,280 100%Total without hatchery surplus utilization 1,268,559 741,371
kco D:\DATA\EXCEL\pikeminnowFromFW.xls FChnkCapWatI
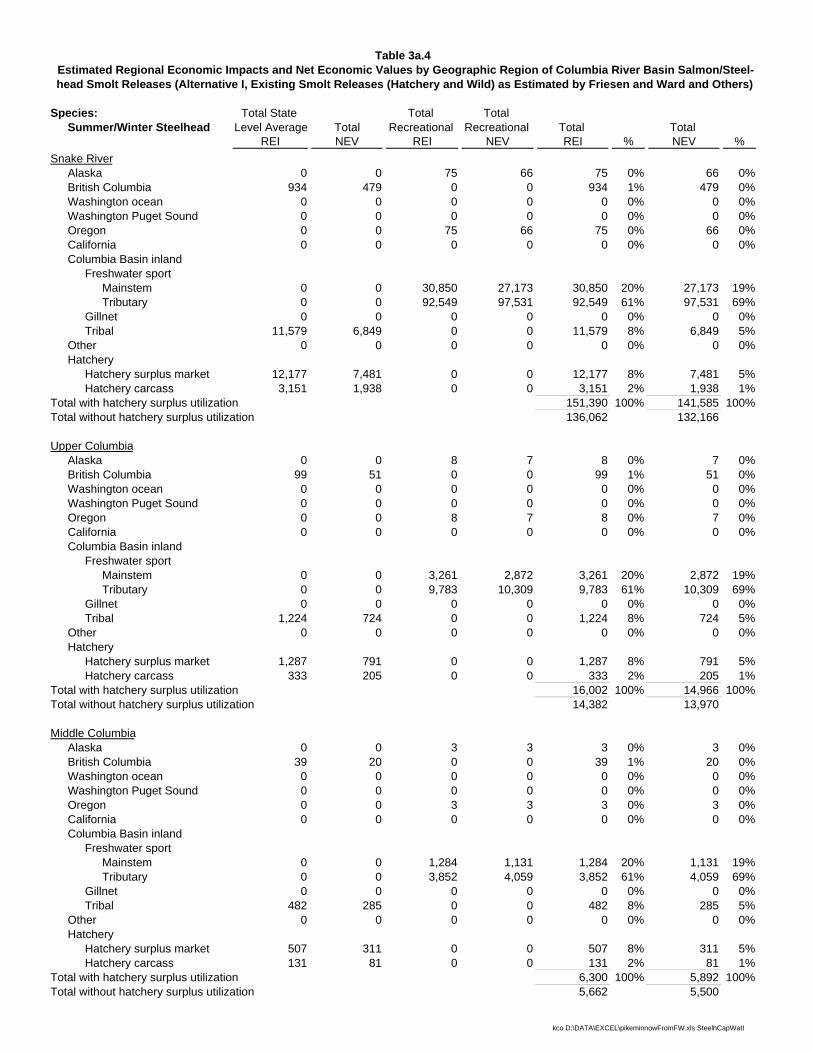
Table 3a.4Estimated Regional Economic Impacts and Net Economic Values by Geographic Region of Columbia River Basin Salmon/Steel-head Smolt Releases (Alternative I, Existing Smolt Releases (Hatchery and Wild) as Estimated by Friesen and Ward and Others)
Species: Total State Total Total Summer/Winter Steelhead Level Average Total Recreational Recreational Total Total
REI NEV REI NEV REI % NEV %Snake River
Alaska 0 0 75 66 75 0% 66 0%British Columbia 934 479 0 0 934 1% 479 0%Washington ocean 0 0 0 0 0 0% 0 0%Washington Puget Sound 0 0 0 0 0 0% 0 0%Oregon 0 0 75 66 75 0% 66 0%California 0 0 0 0 0 0% 0 0%Columbia Basin inland
Freshwater sportMainstem 0 0 30,850 27,173 30,850 20% 27,173 19%Tributary 0 0 92,549 97,531 92,549 61% 97,531 69%
Gillnet 0 0 0 0 0 0% 0 0%Tribal 11,579 6,849 0 0 11,579 8% 6,849 5%
Other 0 0 0 0 0 0% 0 0%Hatchery
Hatchery surplus market 12,177 7,481 0 0 12,177 8% 7,481 5%Hatchery carcass 3,151 1,938 0 0 3,151 2% 1,938 1%
Total with hatchery surplus utilization 151,390 100% 141,585 100%Total without hatchery surplus utilization 136,062 132,166
Upper ColumbiaAlaska 0 0 8 7 8 0% 7 0%British Columbia 99 51 0 0 99 1% 51 0%Washington ocean 0 0 0 0 0 0% 0 0%Washington Puget Sound 0 0 0 0 0 0% 0 0%Oregon 0 0 8 7 8 0% 7 0%California 0 0 0 0 0 0% 0 0%Columbia Basin inland
Freshwater sportMainstem 0 0 3,261 2,872 3,261 20% 2,872 19%Tributary 0 0 9,783 10,309 9,783 61% 10,309 69%
Gillnet 0 0 0 0 0 0% 0 0%Tribal 1,224 724 0 0 1,224 8% 724 5%
Other 0 0 0 0 0 0% 0 0%Hatchery
Hatchery surplus market 1,287 791 0 0 1,287 8% 791 5%Hatchery carcass 333 205 0 0 333 2% 205 1%
Total with hatchery surplus utilization 16,002 100% 14,966 100%Total without hatchery surplus utilization 14,382 13,970
Middle ColumbiaAlaska 0 0 3 3 3 0% 3 0%British Columbia 39 20 0 0 39 1% 20 0%Washington ocean 0 0 0 0 0 0% 0 0%Washington Puget Sound 0 0 0 0 0 0% 0 0%Oregon 0 0 3 3 3 0% 3 0%California 0 0 0 0 0 0% 0 0%Columbia Basin inland
Freshwater sportMainstem 0 0 1,284 1,131 1,284 20% 1,131 19%Tributary 0 0 3,852 4,059 3,852 61% 4,059 69%
Gillnet 0 0 0 0 0 0% 0 0%Tribal 482 285 0 0 482 8% 285 5%
Other 0 0 0 0 0 0% 0 0%Hatchery
Hatchery surplus market 507 311 0 0 507 8% 311 5%Hatchery carcass 131 81 0 0 131 2% 81 1%
Total with hatchery surplus utilization 6,300 100% 5,892 100%Total without hatchery surplus utilization 5,662 5,500
kco D:\DATA\EXCEL\pikeminnowFromFW.xls SteelhCapWatI

Species: Total State Total Total Summer/Winter Steelhead Level Average Total Recreational Recreational Total Total
REI NEV REI NEV REI % NEV %
Lower ColumbiaAlaska 0 0 13 11 13 0% 11 0%British Columbia 156 80 0 0 156 0% 80 0%Washington ocean 0 0 0 0 0 0% 0 0%Washington Puget Sound 0 0 0 0 0 0% 0 0%Oregon 0 0 13 11 13 0% 11 0%California 0 0 0 0 0 0% 0 0%Columbia Basin inland
Freshwater sportMainstem 0 0 37,839 33,330 37,839 95% 33,330 97%Tributary 0 0 0 0 0 0% 0 0%
Gillnet 0 0 0 0 0 0% 0 0%Tribal 0 0 0 0 0 0% 0 0%
Other 0 0 0 0 0 0% 0 0%Hatchery
Hatchery surplus market 1,192 732 0 0 1,192 3% 732 2%Hatchery carcass 588 362 0 0 588 1% 362 1%
Total with hatchery surplus utilization 39,801 100% 34,526 100%Total without hatchery surplus utilization 38,020 33,432
WillametteAlaska 0 0 5 4 5 0% 4 0%British Columbia 61 31 0 0 61 0% 31 0%Washington ocean 0 0 0 0 0 0% 0 0%Washington Puget Sound 0 0 0 0 0 0% 0 0%Oregon 0 0 5 4 5 0% 4 0%California 0 0 0 0 0 0% 0 0%Columbia Basin inland
Freshwater sportMainstem 0 0 14,690 12,940 14,690 95% 12,940 97%Tributary 0 0 0 0 0 0% 0 0%
Gillnet 0 0 0 0 0 0% 0 0%Tribal 0 0 0 0 0 0% 0 0%
Other 0 0 0 0 0 0% 0 0%Hatchery
Hatchery surplus market 463 284 0 0 463 3% 284 2%Hatchery carcass 228 140 0 0 228 1% 140 1%
Total with hatchery surplus utilization 15,452 100% 13,404 100%Total without hatchery surplus utilization 14,761 12,980
TotalAlaska 0 0 104 92 104 0% 92 0%British Columbia 1,288 661 0 0 1,288 1% 661 0%Washington ocean 0 0 0 0 0 0% 0 0%Washington Puget Sound 0 0 0 0 0 0% 0 0%Oregon 0 0 104 92 104 0% 92 0%California 0 0 0 0 0 0% 0 0%Columbia Basin inland
Freshwater sportMainstem 0 0 87,924 77,446 87,924 38% 77,446 37%Tributary 0 0 106,183 111,900 106,183 46% 111,900 53%
Gillnet 0 0 0 0 0 0% 0 0%Tribal 13,285 7,858 0 0 13,285 6% 7,858 4%
Other 0 0 0 0 0 0% 0 0%Hatchery
Hatchery surplus market 15,626 9,600 0 0 15,626 7% 9,600 5%Hatchery carcass 4,431 2,725 0 0 4,431 2% 2,725 1%
Total with hatchery surplus utilization 228,945 100% 210,373 100%Total without hatchery surplus utilization 208,888 198,048
kco D:\DATA\EXCEL\pikeminnowFromFW.xls SteelhCapWatI

Table 3b.1Estimated Regional Economic Impacts and Net Economic Values by Geographic Region of Columbia River Basin
Salmon/Steelhead Smolt Releases (Alternative II, NMFS Cap and 1970's and 1990's Actual Survival Rates)
Species: Total State Total Total Coho Level Average Total Recreational Recreational Total Total
REI NEV REI NEV REI % NEV %Snake River
Alaska NA NA NA NA NA NA NA NABritish Columbia NA NA NA NA NA NA NA NAWashington ocean NA NA NA NA NA NA NA NAWashington Puget Sound NA NA NA NA NA NA NA NAOregon NA NA NA NA NA NA NA NACalifornia NA NA NA NA NA NA NA NAColumbia Basin inland
Freshwater sportMainstem NA NA NA NA NA NA NA NATributary NA NA NA NA NA NA NA NA
Gillnet NA NA NA NA NA NA NA NATribal NA NA NA NA NA NA NA NA
Other NA NA NA NA NA NA NA NAHatchery
Hatchery surplus market NA NA NA NA NA NA NA NAHatchery carcass NA NA NA NA NA NA NA NA
Total with hatchery surplus utilization NA NA NA NATotal without hatchery surplus utilization NA NA
Upper ColumbiaAlaska 0 0 0 0 0 0% 0 0%British Columbia 183 88 60 52 243 2% 139 2%Washington ocean 31 15 3,020 2,589 3,052 29% 2,604 34%Washington Puget Sound 0 0 0 0 0 0% 0 0%Oregon 439 231 1,963 1,683 2,402 23% 1,913 25%California 156 71 302 259 458 4% 329 4%Columbia Basin inland
Freshwater sportMainstem 0 0 151 129 151 1% 129 2%Tributary 0 0 0 0 0 0% 0 0%
Gillnet 381 226 0 0 381 4% 226 3%Tribal 3,348 1,987 0 0 3,348 32% 1,987 26%
Other 0 0 0 0 0 0% 0 0%Hatchery
Hatchery surplus market 406 247 0 0 406 4% 247 3%Hatchery carcass 169 104 0 0 169 2% 104 1%
Total with hatchery surplus utilization 10,609 100% 7,679 100%Total without hatchery surplus utilization 10,034 7,328
Middle ColumbiaAlaska 0 0 0 0 0 0% 0 0%British Columbia 534 256 176 151 710 2% 407 2%Washington ocean 92 44 8,819 7,559 8,910 29% 7,603 34%Washington Puget Sound 0 0 0 0 0 0% 0 0%Oregon 1,281 674 5,732 4,913 7,013 23% 5,587 25%California 455 206 882 756 1,337 4% 962 4%Columbia Basin inland
Freshwater sportMainstem 0 0 441 378 441 1% 378 2%Tributary 0 0 0 0 0 0% 0 0%
Gillnet 1,113 661 0 0 1,113 4% 661 3%Tribal 9,775 5,801 0 0 9,775 32% 5,801 26%
Other 0 0 0 0 0 0% 0 0%Hatchery
Hatchery surplus market 1,185 722 0 0 1,185 4% 722 3%Hatchery carcass 492 303 0 0 492 2% 303 1%
Total with hatchery surplus utilization 30,977 100% 22,424 100%Total without hatchery surplus utilization 29,300 21,399
kco D:\DATA\EXCEL\pikeminnowFromFW.xls CohoCapWatII

Species: Total State Total Total Coho Level Average Total Recreational Recreational Total Total
REI NEV REI NEV REI % NEV %
Lower ColumbiaAlaska 8 4 0 0 8 0% 4 0%British Columbia 31,220 14,965 11,467 9,830 42,688 4% 24,795 3%Washington ocean 9,572 4,591 344,024 294,886 353,597 32% 299,477 36%Washington Puget Sound 323 166 1,147 983 1,470 0% 1,149 0%Oregon 79,951 42,063 275,219 235,909 355,171 33% 277,972 33%California 7,893 3,574 11,467 9,830 19,361 2% 13,404 2%Columbia Basin inland
Freshwater sportMainstem 0 0 114,675 98,295 114,675 11% 98,295 12%Tributary 0 0 0 0 0 0% 0 0%
Gillnet 158,612 94,120 0 0 158,612 15% 94,120 11%Tribal 0 0 0 0 0 0% 0 0%
Other 0 0 0 0 0 0% 0 0%Hatchery
Hatchery surplus market 34,698 21,156 0 0 34,698 3% 21,156 3%Hatchery carcass 9,482 5,831 0 0 9,482 1% 5,831 1%
Total with hatchery surplus utilization 1,089,760 100% 836,202 100%Total without hatchery surplus utilization 1,045,580 809,214
WillametteAlaska 0 0 0 0 0 0% 0 0%British Columbia 277 133 91 78 368 2% 211 1%Washington ocean 95 46 9,147 7,840 9,242 43% 7,886 47%Washington Puget Sound 0 0 0 0 0 0% 0 0%Oregon 1,329 699 5,945 5,096 7,274 34% 5,795 34%California 472 214 915 784 1,387 6% 998 6%Columbia Basin inland
Freshwater sportMainstem 0 0 457 392 457 2% 392 2%Tributary 0 0 0 0 0 0% 0 0%
Gillnet 1,155 685 0 0 1,155 5% 685 4%Tribal 0 0 0 0 0 0% 0 0%
Other 0 0 0 0 0 0% 0 0%Hatchery
Hatchery surplus market 1,229 749 0 0 1,229 6% 749 4%Hatchery carcass 358 220 0 0 358 2% 220 1%
Total with hatchery surplus utilization 21,469 100% 16,936 100%Total without hatchery surplus utilization 19,883 15,967
TotalAlaska 8 4 0 0 8 0% 4 0%British Columbia 32,213 15,441 11,796 10,111 44,009 4% 25,552 3%Washington ocean 9,791 4,696 365,009 312,874 374,800 33% 317,569 36%Washington Puget Sound 323 166 1,147 983 1,470 0% 1,149 0%Oregon 82,999 43,666 288,860 247,601 371,859 32% 291,267 33%California 8,977 4,065 13,566 11,628 22,543 2% 15,693 2%Columbia Basin inland
Freshwater sportMainstem 0 0 115,724 99,195 115,724 10% 99,195 11%Tributary 0 0 0 0 0 0% 0 0%
Gillnet 161,261 95,692 0 0 161,261 14% 95,692 11%Tribal 13,123 7,787 0 0 13,123 1% 7,787 1%
Other 0 0 0 0 0 0% 0 0%Hatchery
Hatchery surplus market 37,517 22,875 0 0 37,517 3% 22,875 3%Hatchery carcass 10,501 6,458 0 0 10,501 1% 6,458 1%
Total with hatchery surplus utilization 1,152,815 100% 883,241 100%Total without hatchery surplus utilization 1,104,797 853,908
kco D:\DATA\EXCEL\pikeminnowFromFW.xls CohoCapWatII

Table 3b.2Estimated Regional Economic Impacts and Net Economic Values by Geographic Region of Columbia River Basin
Salmon/Steelhead Smolt Releases (Alternative II, NMFS Cap and 1970's and 1990's Actual Survival Rates)
Species: Total State Total Total Spring/Summer Chinook Level Average Total Recreational Recreational Total Total
REI NEV REI NEV REI % NEV %Snake River
Alaska 1,011 495 0 0 1,011 7% 495 6%British Columbia 2,048 1,003 176 150 2,223 15% 1,154 14%Washington ocean 283 139 351 301 634 4% 439 5%Washington Puget Sound 121 62 0 0 121 1% 62 1%Oregon 123 63 176 150 299 2% 214 3%California 0 0 0 0 0 0% 0 0%Columbia Basin inland
Freshwater sportMainstem 0 0 0 0 0 0% 0 0%Tributary 0 0 0 0 0 0% 0 0%
Gillnet 0 0 0 0 0 0% 0 0%Tribal 1,884 955 0 0 1,884 12% 955 11%
Other 0 0 0 0 0 0% 0 0%Hatchery
Hatchery surplus market 8,488 4,643 0 0 8,488 56% 4,643 56%Hatchery carcass 617 379 0 0 617 4% 379 5%
Total with hatchery surplus utilization 15,276 100% 8,341 100%Total without hatchery surplus utilization 6,172 3,319
Upper ColumbiaAlaska 2,587 1,265 0 0 2,587 7% 1,265 6%British Columbia 5,236 2,566 449 385 5,685 15% 2,951 14%Washington ocean 723 354 898 769 1,621 4% 1,124 5%Washington Puget Sound 308 159 0 0 308 1% 159 1%Oregon 315 162 449 385 763 2% 547 3%California 0 0 0 0 0 0% 0 0%Columbia Basin inland
Freshwater sportMainstem 0 0 0 0 0 0% 0 0%Tributary 0 0 0 0 0 0% 0 0%
Gillnet 0 0 0 0 0 0% 0 0%Tribal 4,819 2,441 0 0 4,819 12% 2,441 11%
Other 0 0 0 0 0 0% 0 0%Hatchery
Hatchery surplus market 21,705 11,873 0 0 21,705 56% 11,873 56%Hatchery carcass 1,577 970 0 0 1,577 4% 970 5%
Total with hatchery surplus utilization 39,065 100% 21,330 100%Total without hatchery surplus utilization 15,782 8,487
Middle ColumbiaAlaska 2,705 1,323 0 0 2,705 7% 1,323 6%British Columbia 5,475 2,683 469 402 5,944 15% 3,085 14%Washington ocean 756 370 939 805 1,694 4% 1,175 5%Washington Puget Sound 322 166 0 0 322 1% 166 1%Oregon 329 169 469 402 798 2% 572 3%California 0 0 0 0 0 0% 0 0%Columbia Basin inland
Freshwater sportMainstem 0 0 0 0 0 0% 0 0%Tributary 0 0 0 0 0 0% 0 0%
Gillnet 0 0 0 0 0 0% 0 0%Tribal 5,039 2,553 0 0 5,039 12% 2,553 11%
Other 0 0 0 0 0 0% 0 0%Hatchery
Hatchery surplus market 22,695 12,415 0 0 22,695 56% 12,415 56%Hatchery carcass 1,649 1,014 0 0 1,649 4% 1,014 5%
Total with hatchery surplus utilization 40,847 100% 22,303 100%Total without hatchery surplus utilization 16,502 8,874
kco D:\DATA\EXCEL\pikeminnowFromFW.xls SChnkCapWatII
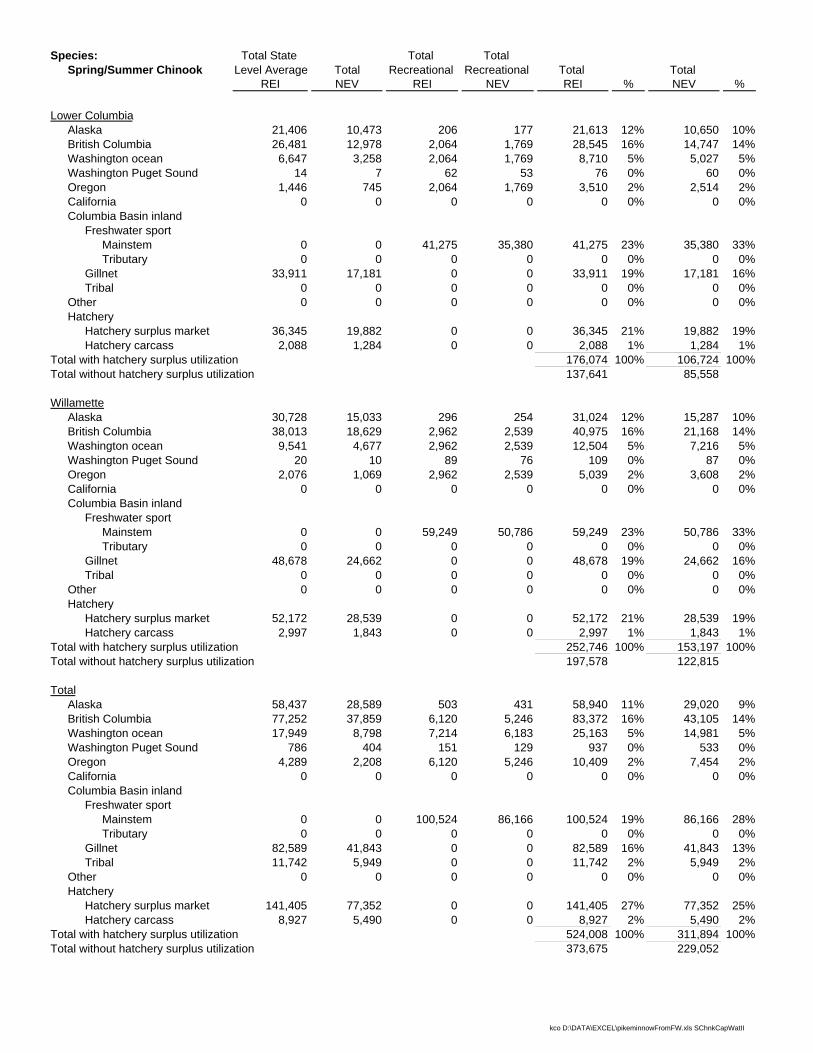
Species: Total State Total Total Spring/Summer Chinook Level Average Total Recreational Recreational Total Total
REI NEV REI NEV REI % NEV %
Lower ColumbiaAlaska 21,406 10,473 206 177 21,613 12% 10,650 10%British Columbia 26,481 12,978 2,064 1,769 28,545 16% 14,747 14%Washington ocean 6,647 3,258 2,064 1,769 8,710 5% 5,027 5%Washington Puget Sound 14 7 62 53 76 0% 60 0%Oregon 1,446 745 2,064 1,769 3,510 2% 2,514 2%California 0 0 0 0 0 0% 0 0%Columbia Basin inland
Freshwater sportMainstem 0 0 41,275 35,380 41,275 23% 35,380 33%Tributary 0 0 0 0 0 0% 0 0%
Gillnet 33,911 17,181 0 0 33,911 19% 17,181 16%Tribal 0 0 0 0 0 0% 0 0%
Other 0 0 0 0 0 0% 0 0%Hatchery
Hatchery surplus market 36,345 19,882 0 0 36,345 21% 19,882 19%Hatchery carcass 2,088 1,284 0 0 2,088 1% 1,284 1%
Total with hatchery surplus utilization 176,074 100% 106,724 100%Total without hatchery surplus utilization 137,641 85,558
WillametteAlaska 30,728 15,033 296 254 31,024 12% 15,287 10%British Columbia 38,013 18,629 2,962 2,539 40,975 16% 21,168 14%Washington ocean 9,541 4,677 2,962 2,539 12,504 5% 7,216 5%Washington Puget Sound 20 10 89 76 109 0% 87 0%Oregon 2,076 1,069 2,962 2,539 5,039 2% 3,608 2%California 0 0 0 0 0 0% 0 0%Columbia Basin inland
Freshwater sportMainstem 0 0 59,249 50,786 59,249 23% 50,786 33%Tributary 0 0 0 0 0 0% 0 0%
Gillnet 48,678 24,662 0 0 48,678 19% 24,662 16%Tribal 0 0 0 0 0 0% 0 0%
Other 0 0 0 0 0 0% 0 0%Hatchery
Hatchery surplus market 52,172 28,539 0 0 52,172 21% 28,539 19%Hatchery carcass 2,997 1,843 0 0 2,997 1% 1,843 1%
Total with hatchery surplus utilization 252,746 100% 153,197 100%Total without hatchery surplus utilization 197,578 122,815
TotalAlaska 58,437 28,589 503 431 58,940 11% 29,020 9%British Columbia 77,252 37,859 6,120 5,246 83,372 16% 43,105 14%Washington ocean 17,949 8,798 7,214 6,183 25,163 5% 14,981 5%Washington Puget Sound 786 404 151 129 937 0% 533 0%Oregon 4,289 2,208 6,120 5,246 10,409 2% 7,454 2%California 0 0 0 0 0 0% 0 0%Columbia Basin inland
Freshwater sportMainstem 0 0 100,524 86,166 100,524 19% 86,166 28%Tributary 0 0 0 0 0 0% 0 0%
Gillnet 82,589 41,843 0 0 82,589 16% 41,843 13%Tribal 11,742 5,949 0 0 11,742 2% 5,949 2%
Other 0 0 0 0 0 0% 0 0%Hatchery
Hatchery surplus market 141,405 77,352 0 0 141,405 27% 77,352 25%Hatchery carcass 8,927 5,490 0 0 8,927 2% 5,490 2%
Total with hatchery surplus utilization 524,008 100% 311,894 100%Total without hatchery surplus utilization 373,675 229,052
kco D:\DATA\EXCEL\pikeminnowFromFW.xls SChnkCapWatII
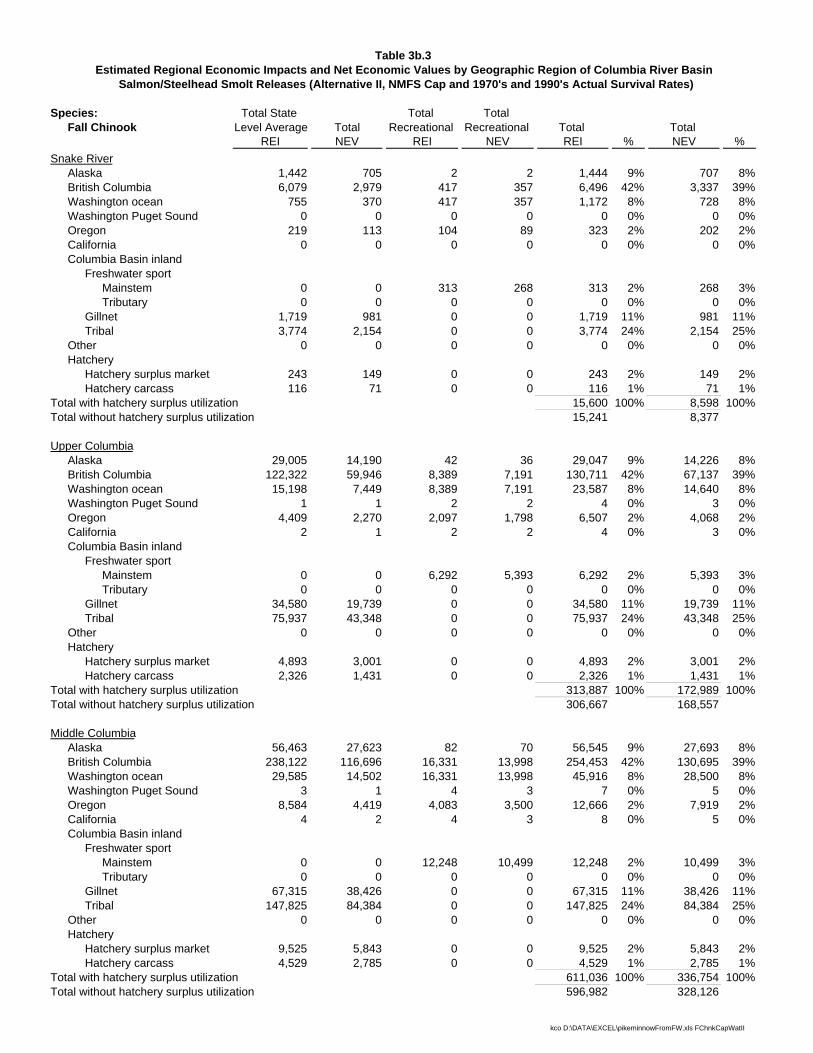
Table 3b.3Estimated Regional Economic Impacts and Net Economic Values by Geographic Region of Columbia River Basin
Salmon/Steelhead Smolt Releases (Alternative II, NMFS Cap and 1970's and 1990's Actual Survival Rates)
Species: Total State Total Total Fall Chinook Level Average Total Recreational Recreational Total Total
REI NEV REI NEV REI % NEV %Snake River
Alaska 1,442 705 2 2 1,444 9% 707 8%British Columbia 6,079 2,979 417 357 6,496 42% 3,337 39%Washington ocean 755 370 417 357 1,172 8% 728 8%Washington Puget Sound 0 0 0 0 0 0% 0 0%Oregon 219 113 104 89 323 2% 202 2%California 0 0 0 0 0 0% 0 0%Columbia Basin inland
Freshwater sportMainstem 0 0 313 268 313 2% 268 3%Tributary 0 0 0 0 0 0% 0 0%
Gillnet 1,719 981 0 0 1,719 11% 981 11%Tribal 3,774 2,154 0 0 3,774 24% 2,154 25%
Other 0 0 0 0 0 0% 0 0%Hatchery
Hatchery surplus market 243 149 0 0 243 2% 149 2%Hatchery carcass 116 71 0 0 116 1% 71 1%
Total with hatchery surplus utilization 15,600 100% 8,598 100%Total without hatchery surplus utilization 15,241 8,377
Upper ColumbiaAlaska 29,005 14,190 42 36 29,047 9% 14,226 8%British Columbia 122,322 59,946 8,389 7,191 130,711 42% 67,137 39%Washington ocean 15,198 7,449 8,389 7,191 23,587 8% 14,640 8%Washington Puget Sound 1 1 2 2 4 0% 3 0%Oregon 4,409 2,270 2,097 1,798 6,507 2% 4,068 2%California 2 1 2 2 4 0% 3 0%Columbia Basin inland
Freshwater sportMainstem 0 0 6,292 5,393 6,292 2% 5,393 3%Tributary 0 0 0 0 0 0% 0 0%
Gillnet 34,580 19,739 0 0 34,580 11% 19,739 11%Tribal 75,937 43,348 0 0 75,937 24% 43,348 25%
Other 0 0 0 0 0 0% 0 0%Hatchery
Hatchery surplus market 4,893 3,001 0 0 4,893 2% 3,001 2%Hatchery carcass 2,326 1,431 0 0 2,326 1% 1,431 1%
Total with hatchery surplus utilization 313,887 100% 172,989 100%Total without hatchery surplus utilization 306,667 168,557
Middle ColumbiaAlaska 56,463 27,623 82 70 56,545 9% 27,693 8%British Columbia 238,122 116,696 16,331 13,998 254,453 42% 130,695 39%Washington ocean 29,585 14,502 16,331 13,998 45,916 8% 28,500 8%Washington Puget Sound 3 1 4 3 7 0% 5 0%Oregon 8,584 4,419 4,083 3,500 12,666 2% 7,919 2%California 4 2 4 3 8 0% 5 0%Columbia Basin inland
Freshwater sportMainstem 0 0 12,248 10,499 12,248 2% 10,499 3%Tributary 0 0 0 0 0 0% 0 0%
Gillnet 67,315 38,426 0 0 67,315 11% 38,426 11%Tribal 147,825 84,384 0 0 147,825 24% 84,384 25%
Other 0 0 0 0 0 0% 0 0%Hatchery
Hatchery surplus market 9,525 5,843 0 0 9,525 2% 5,843 2%Hatchery carcass 4,529 2,785 0 0 4,529 1% 2,785 1%
Total with hatchery surplus utilization 611,036 100% 336,754 100%Total without hatchery surplus utilization 596,982 328,126
kco D:\DATA\EXCEL\pikeminnowFromFW.xls FChnkCapWatII

Species: Total State Total Total Fall Chinook Level Average Total Recreational Recreational Total Total
REI NEV REI NEV REI % NEV %
Lower ColumbiaAlaska 24,107 11,794 0 0 24,107 3% 11,794 2%British Columbia 325,327 159,433 41,834 35,858 367,160 38% 195,291 33%Washington ocean 134,732 66,041 139,446 119,528 274,178 29% 185,570 31%Washington Puget Sound 0 0 0 0 0 0% 0 0%Oregon 29,318 15,095 13,945 11,953 43,263 5% 27,048 5%California 6,252 2,618 1,394 1,195 7,646 1% 3,813 1%Columbia Basin inland
Freshwater sportMainstem 0 0 104,584 89,646 104,584 11% 89,646 15%Tributary 0 0 0 0 0 0% 0 0%
Gillnet 105,379 60,155 0 0 105,379 11% 60,155 10%Tribal 0 0 0 0 0 0% 0 0%
Other 0 0 0 0 0 0% 0 0%Hatchery
Hatchery surplus market 21,138 12,967 0 0 21,138 2% 12,967 2%Hatchery carcass 13,872 8,531 0 0 13,872 1% 8,531 1%
Total with hatchery surplus utilization 961,327 100% 594,814 100%Total without hatchery surplus utilization 926,318 573,316
WillametteAlaska NA NA NA NA NA NA NA NABritish Columbia NA NA NA NA NA NA NA NAWashington ocean NA NA NA NA NA NA NA NAWashington Puget Sound NA NA NA NA NA NA NA NAOregon NA NA NA NA NA NA NA NACalifornia NA NA NA NA NA NA NA NAColumbia Basin inland
Freshwater sportMainstem NA NA NA NA NA NA NA NATributary NA NA NA NA NA NA NA NA
Gillnet NA NA NA NA NA NA NA NATribal NA NA NA NA NA NA NA NA
Other NA NA NA NA NA NA NA NAHatchery
Hatchery surplus market NA NA NA NA NA NA NA NAHatchery carcass NA NA NA NA NA NA NA NA
Total with hatchery surplus utilization NA NA NA NATotal without hatchery surplus utilization NA NA
TotalAlaska 111,017 54,312 126 108 111,142 6% 54,420 5%British Columbia 691,850 339,055 66,970 57,405 758,821 40% 396,460 36%Washington ocean 180,271 88,363 164,582 141,074 344,853 18% 229,437 21%Washington Puget Sound 4 2 6 5 11 0% 8 0%Oregon 42,531 21,898 20,229 17,339 62,760 3% 39,237 4%California 6,257 2,620 1,401 1,201 7,658 0% 3,821 0%Columbia Basin inland
Freshwater sportMainstem 0 0 123,437 105,806 123,437 6% 105,806 10%Tributary 0 0 0 0 0 0% 0 0%
Gillnet 208,992 119,301 0 0 208,992 11% 119,301 11%Tribal 227,536 129,886 0 0 227,536 12% 129,886 12%
Other 0 0 0 0 0 0% 0 0%Hatchery
Hatchery surplus market 35,798 21,960 0 0 35,798 2% 21,960 2%Hatchery carcass 20,842 12,818 0 0 20,842 1% 12,818 1%
Total with hatchery surplus utilization 1,901,849 100% 1,113,154 100%Total without hatchery surplus utilization 1,845,209 1,078,376
kco D:\DATA\EXCEL\pikeminnowFromFW.xls FChnkCapWatII
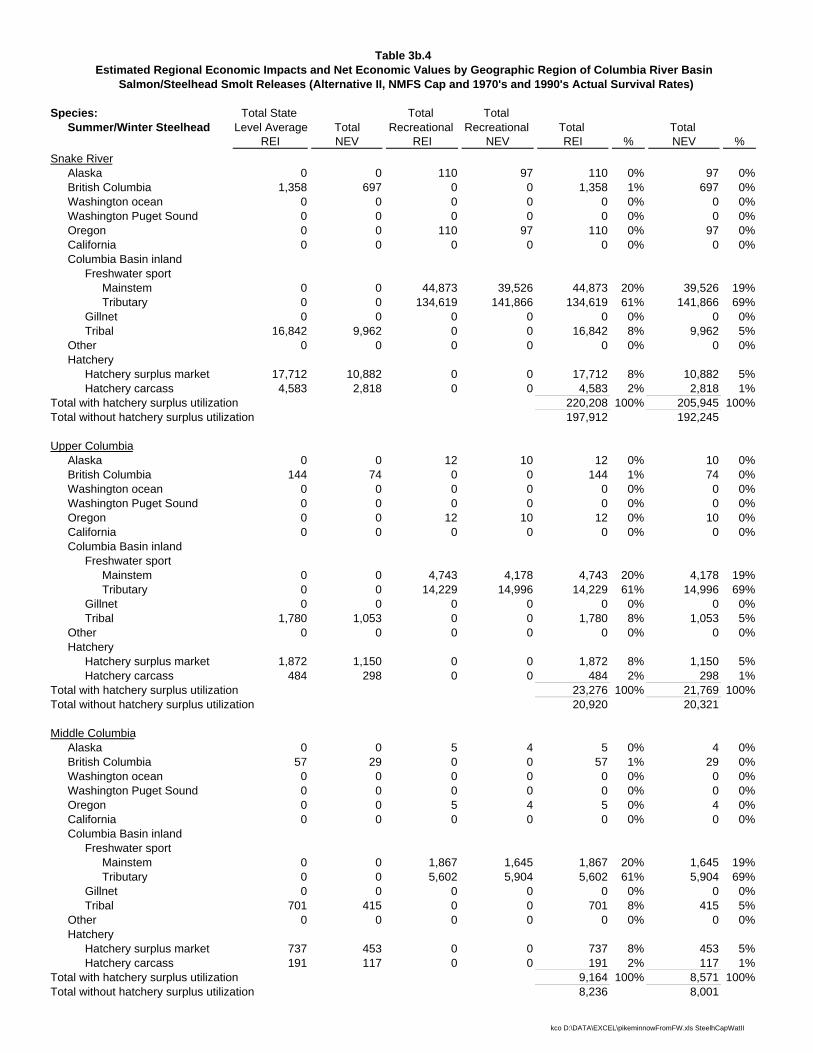
Table 3b.4Estimated Regional Economic Impacts and Net Economic Values by Geographic Region of Columbia River Basin
Salmon/Steelhead Smolt Releases (Alternative II, NMFS Cap and 1970's and 1990's Actual Survival Rates)
Species: Total State Total Total Summer/Winter Steelhead Level Average Total Recreational Recreational Total Total
REI NEV REI NEV REI % NEV %Snake River
Alaska 0 0 110 97 110 0% 97 0%British Columbia 1,358 697 0 0 1,358 1% 697 0%Washington ocean 0 0 0 0 0 0% 0 0%Washington Puget Sound 0 0 0 0 0 0% 0 0%Oregon 0 0 110 97 110 0% 97 0%California 0 0 0 0 0 0% 0 0%Columbia Basin inland
Freshwater sportMainstem 0 0 44,873 39,526 44,873 20% 39,526 19%Tributary 0 0 134,619 141,866 134,619 61% 141,866 69%
Gillnet 0 0 0 0 0 0% 0 0%Tribal 16,842 9,962 0 0 16,842 8% 9,962 5%
Other 0 0 0 0 0 0% 0 0%Hatchery
Hatchery surplus market 17,712 10,882 0 0 17,712 8% 10,882 5%Hatchery carcass 4,583 2,818 0 0 4,583 2% 2,818 1%
Total with hatchery surplus utilization 220,208 100% 205,945 100%Total without hatchery surplus utilization 197,912 192,245
Upper ColumbiaAlaska 0 0 12 10 12 0% 10 0%British Columbia 144 74 0 0 144 1% 74 0%Washington ocean 0 0 0 0 0 0% 0 0%Washington Puget Sound 0 0 0 0 0 0% 0 0%Oregon 0 0 12 10 12 0% 10 0%California 0 0 0 0 0 0% 0 0%Columbia Basin inland
Freshwater sportMainstem 0 0 4,743 4,178 4,743 20% 4,178 19%Tributary 0 0 14,229 14,996 14,229 61% 14,996 69%
Gillnet 0 0 0 0 0 0% 0 0%Tribal 1,780 1,053 0 0 1,780 8% 1,053 5%
Other 0 0 0 0 0 0% 0 0%Hatchery
Hatchery surplus market 1,872 1,150 0 0 1,872 8% 1,150 5%Hatchery carcass 484 298 0 0 484 2% 298 1%
Total with hatchery surplus utilization 23,276 100% 21,769 100%Total without hatchery surplus utilization 20,920 20,321
Middle ColumbiaAlaska 0 0 5 4 5 0% 4 0%British Columbia 57 29 0 0 57 1% 29 0%Washington ocean 0 0 0 0 0 0% 0 0%Washington Puget Sound 0 0 0 0 0 0% 0 0%Oregon 0 0 5 4 5 0% 4 0%California 0 0 0 0 0 0% 0 0%Columbia Basin inland
Freshwater sportMainstem 0 0 1,867 1,645 1,867 20% 1,645 19%Tributary 0 0 5,602 5,904 5,602 61% 5,904 69%
Gillnet 0 0 0 0 0 0% 0 0%Tribal 701 415 0 0 701 8% 415 5%
Other 0 0 0 0 0 0% 0 0%Hatchery
Hatchery surplus market 737 453 0 0 737 8% 453 5%Hatchery carcass 191 117 0 0 191 2% 117 1%
Total with hatchery surplus utilization 9,164 100% 8,571 100%Total without hatchery surplus utilization 8,236 8,001
kco D:\DATA\EXCEL\pikeminnowFromFW.xls SteelhCapWatII
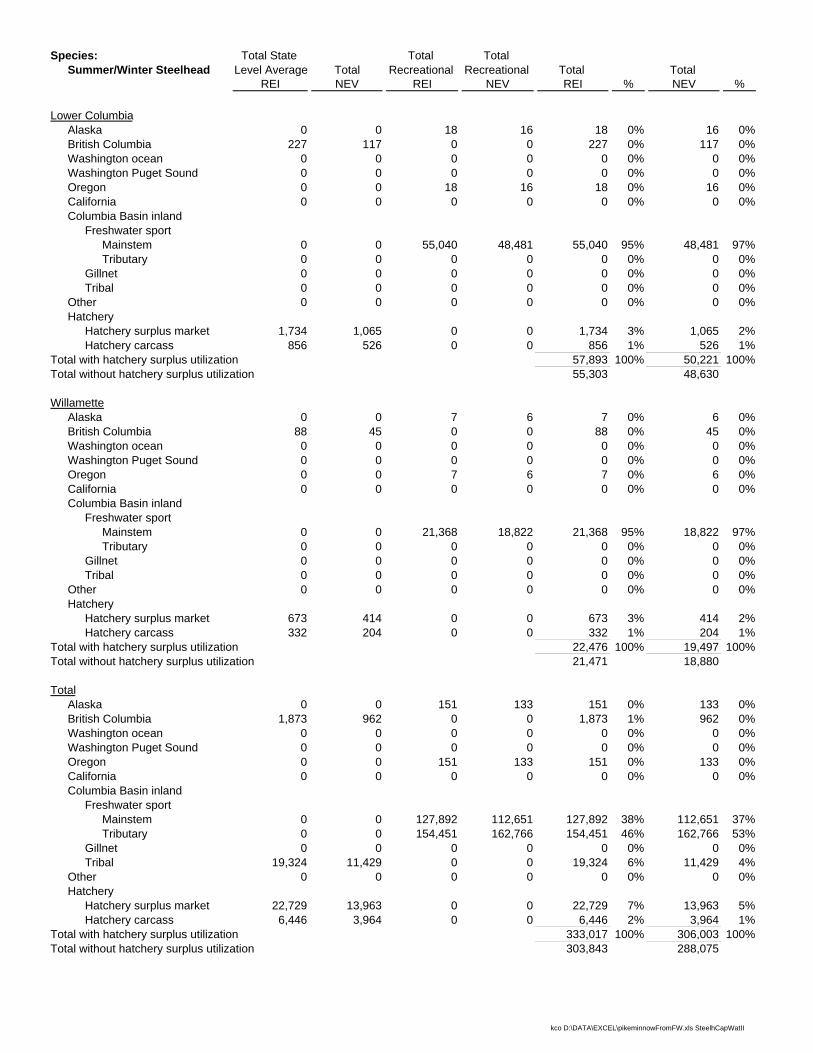
Species: Total State Total Total Summer/Winter Steelhead Level Average Total Recreational Recreational Total Total
REI NEV REI NEV REI % NEV %
Lower ColumbiaAlaska 0 0 18 16 18 0% 16 0%British Columbia 227 117 0 0 227 0% 117 0%Washington ocean 0 0 0 0 0 0% 0 0%Washington Puget Sound 0 0 0 0 0 0% 0 0%Oregon 0 0 18 16 18 0% 16 0%California 0 0 0 0 0 0% 0 0%Columbia Basin inland
Freshwater sportMainstem 0 0 55,040 48,481 55,040 95% 48,481 97%Tributary 0 0 0 0 0 0% 0 0%
Gillnet 0 0 0 0 0 0% 0 0%Tribal 0 0 0 0 0 0% 0 0%
Other 0 0 0 0 0 0% 0 0%Hatchery
Hatchery surplus market 1,734 1,065 0 0 1,734 3% 1,065 2%Hatchery carcass 856 526 0 0 856 1% 526 1%
Total with hatchery surplus utilization 57,893 100% 50,221 100%Total without hatchery surplus utilization 55,303 48,630
WillametteAlaska 0 0 7 6 7 0% 6 0%British Columbia 88 45 0 0 88 0% 45 0%Washington ocean 0 0 0 0 0 0% 0 0%Washington Puget Sound 0 0 0 0 0 0% 0 0%Oregon 0 0 7 6 7 0% 6 0%California 0 0 0 0 0 0% 0 0%Columbia Basin inland
Freshwater sportMainstem 0 0 21,368 18,822 21,368 95% 18,822 97%Tributary 0 0 0 0 0 0% 0 0%
Gillnet 0 0 0 0 0 0% 0 0%Tribal 0 0 0 0 0 0% 0 0%
Other 0 0 0 0 0 0% 0 0%Hatchery
Hatchery surplus market 673 414 0 0 673 3% 414 2%Hatchery carcass 332 204 0 0 332 1% 204 1%
Total with hatchery surplus utilization 22,476 100% 19,497 100%Total without hatchery surplus utilization 21,471 18,880
TotalAlaska 0 0 151 133 151 0% 133 0%British Columbia 1,873 962 0 0 1,873 1% 962 0%Washington ocean 0 0 0 0 0 0% 0 0%Washington Puget Sound 0 0 0 0 0 0% 0 0%Oregon 0 0 151 133 151 0% 133 0%California 0 0 0 0 0 0% 0 0%Columbia Basin inland
Freshwater sportMainstem 0 0 127,892 112,651 127,892 38% 112,651 37%Tributary 0 0 154,451 162,766 154,451 46% 162,766 53%
Gillnet 0 0 0 0 0 0% 0 0%Tribal 19,324 11,429 0 0 19,324 6% 11,429 4%
Other 0 0 0 0 0 0% 0 0%Hatchery
Hatchery surplus market 22,729 13,963 0 0 22,729 7% 13,963 5%Hatchery carcass 6,446 3,964 0 0 6,446 2% 3,964 1%
Total with hatchery surplus utilization 333,017 100% 306,003 100%Total without hatchery surplus utilization 303,843 288,075
kco D:\DATA\EXCEL\pikeminnowFromFW.xls SteelhCapWatII

Table 3c.1Estimated Regional Economic Impacts and Net Economic Values by Geographic Region of Columbia River Basin Salmon/Steelhead Smolt Releases (Alternative III, Doubling of the 1980's Runs Objective - Double Survival Rates)
Species: Total State Total Total Coho Level Average Total Recreational Recreational Total Total
REI NEV REI NEV REI % NEV %Snake River
Alaska NA NA NA NA NA NA NA NABritish Columbia NA NA NA NA NA NA NA NAWashington ocean NA NA NA NA NA NA NA NAWashington Puget Sound NA NA NA NA NA NA NA NAOregon NA NA NA NA NA NA NA NACalifornia NA NA NA NA NA NA NA NAColumbia Basin inland
Freshwater sportMainstem NA NA NA NA NA NA NA NATributary NA NA NA NA NA NA NA NA
Gillnet NA NA NA NA NA NA NA NATribal NA NA NA NA NA NA NA NA
Other NA NA NA NA NA NA NA NAHatchery
Hatchery surplus market NA NA NA NA NA NA NA NAHatchery carcass NA NA NA NA NA NA NA NA
Total with hatchery surplus utilization NA NA NA NATotal without hatchery surplus utilization NA NA
Upper ColumbiaAlaska 0 0 0 0 0 0% 0 0%British Columbia 454 217 150 129 604 2% 346 2%Washington ocean 78 37 7,500 6,429 7,578 29% 6,466 34%Washington Puget Sound 0 0 0 0 0 0% 0 0%Oregon 1,089 573 4,875 4,179 5,964 23% 4,752 25%California 387 175 750 643 1,137 4% 818 4%Columbia Basin inland
Freshwater sportMainstem 0 0 375 321 375 1% 321 2%Tributary 0 0 0 0 0 0% 0 0%
Gillnet 947 562 0 0 947 4% 562 3%Tribal 8,313 4,933 0 0 8,313 32% 4,933 26%
Other 0 0 0 0 0 0% 0 0%Hatchery
Hatchery surplus market 1,007 614 0 0 1,007 4% 614 3%Hatchery carcass 419 258 0 0 419 2% 258 1%
Total with hatchery surplus utilization 26,344 100% 19,070 100%Total without hatchery surplus utilization 24,918 18,198
Middle ColumbiaAlaska 0 0 0 0 0 0% 0 0%British Columbia 1,325 635 438 375 1,763 2% 1,011 2%Washington ocean 228 109 21,900 18,772 22,128 29% 18,881 34%Washington Puget Sound 0 0 0 0 0 0% 0 0%Oregon 3,181 1,673 14,235 12,202 17,416 23% 13,875 25%California 1,131 512 2,190 1,877 3,321 4% 2,389 4%Columbia Basin inland
Freshwater sportMainstem 0 0 1,095 939 1,095 1% 939 2%Tributary 0 0 0 0 0 0% 0 0%
Gillnet 2,765 1,641 0 0 2,765 4% 1,641 3%Tribal 24,275 14,405 0 0 24,275 32% 14,405 26%
Other 0 0 0 0 0 0% 0 0%Hatchery
Hatchery surplus market 2,942 1,794 0 0 2,942 4% 1,794 3%Hatchery carcass 1,223 752 0 0 1,223 2% 752 1%
Total with hatchery surplus utilization 76,926 100% 55,685 100%Total without hatchery surplus utilization 72,762 53,140
kco D:\DATA\EXCEL\pikeminnowFromFW.xls CohoCapWatIII

Species: Total State Total Total Coho Level Average Total Recreational Recreational Total Total
REI NEV REI NEV REI % NEV %
Lower ColumbiaAlaska 19 9 0 0 19 0% 9 0%British Columbia 72,431 34,719 26,605 22,805 99,035 4% 57,523 3%Washington ocean 22,208 10,651 798,136 684,136 820,344 32% 694,786 36%Washington Puget Sound 749 384 2,660 2,280 3,410 0% 2,665 0%Oregon 185,487 97,585 638,509 547,308 823,996 33% 644,894 33%California 18,313 8,292 26,605 22,805 44,917 2% 31,096 2%Columbia Basin inland
Freshwater sportMainstem 0 0 266,045 228,045 266,045 11% 228,045 12%Tributary 0 0 0 0 0 0% 0 0%
Gillnet 367,979 218,359 0 0 367,979 15% 218,359 11%Tribal 0 0 0 0 0 0% 0 0%
Other 0 0 0 0 0 0% 0 0%Hatchery
Hatchery surplus market 80,500 49,082 0 0 80,500 3% 49,082 3%Hatchery carcass 21,998 13,528 0 0 21,998 1% 13,528 1%
Total with hatchery surplus utilization 2,528,243 100% 1,939,988 100%Total without hatchery surplus utilization 2,425,746 1,877,377
WillametteAlaska 0 0 0 0 0 0% 0 0%British Columbia 687 329 227 195 914 2% 524 1%Washington ocean 236 113 22,714 19,470 22,950 43% 19,583 47%Washington Puget Sound 0 0 0 0 0 0% 0 0%Oregon 3,299 1,736 14,764 12,655 18,063 34% 14,391 34%California 1,173 531 2,271 1,947 3,444 6% 2,478 6%Columbia Basin inland
Freshwater sportMainstem 0 0 1,136 973 1,136 2% 973 2%Tributary 0 0 0 0 0 0% 0 0%
Gillnet 2,868 1,702 0 0 2,868 5% 1,702 4%Tribal 0 0 0 0 0 0% 0 0%
Other 0 0 0 0 0 0% 0 0%Hatchery
Hatchery surplus market 3,051 1,860 0 0 3,051 6% 1,860 4%Hatchery carcass 890 547 0 0 890 2% 547 1%
Total with hatchery surplus utilization 53,316 100% 42,058 100%Total without hatchery surplus utilization 49,375 39,651
TotalAlaska 19 9 0 0 19 0% 9 0%British Columbia 74,897 35,901 27,420 23,503 102,316 4% 59,404 3%Washington ocean 22,751 10,911 850,249 728,805 873,000 33% 739,716 36%Washington Puget Sound 749 384 2,660 2,280 3,410 0% 2,665 0%Oregon 193,056 101,568 672,382 576,344 865,439 32% 677,912 33%California 21,003 9,510 31,816 27,271 52,819 2% 36,781 2%Columbia Basin inland
Freshwater sportMainstem 0 0 268,651 230,279 268,651 10% 230,279 11%Tributary 0 0 0 0 0 0% 0 0%
Gillnet 374,558 222,263 0 0 374,558 14% 222,263 11%Tribal 32,589 19,338 0 0 32,589 1% 19,338 1%
Other 0 0 0 0 0 0% 0 0%Hatchery
Hatchery surplus market 87,500 53,350 0 0 87,500 3% 53,350 3%Hatchery carcass 24,529 15,085 0 0 24,529 1% 15,085 1%
Total with hatchery surplus utilization 2,684,829 100% 2,056,802 100%Total without hatchery surplus utilization 2,572,800 1,988,367
kco D:\DATA\EXCEL\pikeminnowFromFW.xls CohoCapWatIII

Table 3c.2Estimated Regional Economic Impacts and Net Economic Values by Geographic Region of Columbia River Basin Salmon/Steelhead Smolt Releases (Alternative III, Doubling of the 1980's Runs Objective - Double Survival Rates)
Species: Total State Total Total Spring/Summer Chinook Level Average Total Recreational Recreational Total Total
REI NEV REI NEV REI % NEV %Snake River
Alaska 2,160 1,057 0 0 2,160 7% 1,057 6%British Columbia 4,372 2,142 375 321 4,747 15% 2,464 14%Washington ocean 604 296 750 642 1,353 4% 938 5%Washington Puget Sound 257 132 0 0 257 1% 132 1%Oregon 263 135 375 321 637 2% 456 3%California 0 0 0 0 0 0% 0 0%Columbia Basin inland
Freshwater sportMainstem 0 0 0 0 0 0% 0 0%Tributary 0 0 0 0 0 0% 0 0%
Gillnet 0 0 0 0 0 0% 0 0%Tribal 4,023 2,038 0 0 4,023 12% 2,038 11%
Other 0 0 0 0 0 0% 0 0%Hatchery
Hatchery surplus market 18,123 9,914 0 0 18,123 56% 9,914 56%Hatchery carcass 1,317 810 0 0 1,317 4% 810 5%
Total with hatchery surplus utilization 32,617 100% 17,809 100%Total without hatchery surplus utilization 13,178 7,086
Upper ColumbiaAlaska 5,523 2,702 0 0 5,523 7% 2,702 6%British Columbia 11,179 5,479 958 821 12,138 15% 6,300 14%Washington ocean 1,543 756 1,917 1,643 3,460 4% 2,399 5%Washington Puget Sound 658 338 0 0 658 1% 338 1%Oregon 672 346 958 821 1,630 2% 1,167 3%California 0 0 0 0 0 0% 0 0%Columbia Basin inland
Freshwater sportMainstem 0 0 0 0 0 0% 0 0%Tributary 0 0 0 0 0 0% 0 0%
Gillnet 0 0 0 0 0 0% 0 0%Tribal 10,289 5,213 0 0 10,289 12% 5,213 11%
Other 0 0 0 0 0 0% 0 0%Hatchery
Hatchery surplus market 46,344 25,351 0 0 46,344 56% 25,351 56%Hatchery carcass 3,367 2,071 0 0 3,367 4% 2,071 5%
Total with hatchery surplus utilization 83,408 100% 45,542 100%Total without hatchery surplus utilization 33,698 18,120
Middle ColumbiaAlaska 5,775 2,825 0 0 5,775 7% 2,825 6%British Columbia 11,689 5,729 1,002 859 12,692 15% 6,588 14%Washington ocean 1,614 791 2,004 1,718 3,618 4% 2,509 5%Washington Puget Sound 688 354 0 0 688 1% 354 1%Oregon 702 362 1,002 859 1,704 2% 1,221 3%California 0 0 0 0 0 0% 0 0%Columbia Basin inland
Freshwater sportMainstem 0 0 0 0 0 0% 0 0%Tributary 0 0 0 0 0 0% 0 0%
Gillnet 0 0 0 0 0 0% 0 0%Tribal 10,758 5,450 0 0 10,758 12% 5,450 11%
Other 0 0 0 0 0 0% 0 0%Hatchery
Hatchery surplus market 48,458 26,508 0 0 48,458 56% 26,508 56%Hatchery carcass 3,521 2,165 0 0 3,521 4% 2,165 5%
Total with hatchery surplus utilization 87,213 100% 47,619 100%Total without hatchery surplus utilization 35,235 18,947
kco D:\DATA\EXCEL\pikeminnowFromFW.xls SChnkCapWatIII

Species: Total State Total Total Spring/Summer Chinook Level Average Total Recreational Recreational Total Total
REI NEV REI NEV REI % NEV %
Lower ColumbiaAlaska 44,799 21,917 432 370 45,231 12% 22,287 10%British Columbia 55,420 27,159 4,319 3,702 59,739 16% 30,862 14%Washington ocean 13,910 6,818 4,319 3,702 18,229 5% 10,520 5%Washington Puget Sound 30 15 130 111 159 0% 126 0%Oregon 3,027 1,558 4,319 3,702 7,346 2% 5,261 2%California 0 0 0 0 0 0% 0 0%Columbia Basin inland
Freshwater sportMainstem 0 0 86,380 74,042 86,380 23% 74,042 33%Tributary 0 0 0 0 0 0% 0 0%
Gillnet 70,969 35,956 0 0 70,969 19% 35,956 16%Tribal 0 0 0 0 0 0% 0 0%
Other 0 0 0 0 0 0% 0 0%Hatchery
Hatchery surplus market 76,062 41,608 0 0 76,062 21% 41,608 19%Hatchery carcass 4,369 2,687 0 0 4,369 1% 2,687 1%
Total with hatchery surplus utilization 368,484 100% 223,349 100%Total without hatchery surplus utilization 288,053 179,054
WillametteAlaska 64,624 31,616 623 534 65,247 12% 32,150 10%British Columbia 79,944 39,178 6,230 5,340 86,174 16% 44,519 14%Washington ocean 20,066 9,836 6,230 5,340 26,296 5% 15,176 5%Washington Puget Sound 43 22 187 160 230 0% 182 0%Oregon 4,366 2,248 6,230 5,340 10,597 2% 7,589 2%California 0 0 0 0 0 0% 0 0%Columbia Basin inland
Freshwater sportMainstem 0 0 124,606 106,808 124,606 23% 106,808 33%Tributary 0 0 0 0 0 0% 0 0%
Gillnet 102,374 51,867 0 0 102,374 19% 51,867 16%Tribal 0 0 0 0 0 0% 0 0%
Other 0 0 0 0 0 0% 0 0%Hatchery
Hatchery surplus market 109,722 60,021 0 0 109,722 21% 60,021 19%Hatchery carcass 6,303 3,876 0 0 6,303 1% 3,876 1%
Total with hatchery surplus utilization 531,549 100% 322,187 100%Total without hatchery surplus utilization 415,524 258,291
TotalAlaska 122,880 60,116 1,055 904 123,935 11% 61,020 9%British Columbia 162,604 79,688 12,885 11,044 175,489 16% 90,732 14%Washington ocean 37,736 18,497 15,220 13,046 52,956 5% 31,543 5%Washington Puget Sound 1,677 862 316 271 1,993 0% 1,133 0%Oregon 9,030 4,649 12,885 11,044 21,915 2% 15,693 2%California 0 0 0 0 0 0% 0 0%Columbia Basin inland
Freshwater sportMainstem 0 0 210,987 180,851 210,987 19% 180,851 28%Tributary 0 0 0 0 0 0% 0 0%
Gillnet 173,343 87,823 0 0 173,343 16% 87,823 13%Tribal 25,070 12,702 0 0 25,070 2% 12,702 2%
Other 0 0 0 0 0 0% 0 0%Hatchery
Hatchery surplus market 298,708 163,401 0 0 298,708 27% 163,401 25%Hatchery carcass 18,876 11,609 0 0 18,876 2% 11,609 2%
Total with hatchery surplus utilization 1,103,272 100% 656,508 100%Total without hatchery surplus utilization 785,687 481,497
kco D:\DATA\EXCEL\pikeminnowFromFW.xls SChnkCapWatIII

Table 3c.3Estimated Regional Economic Impacts and Net Economic Values by Geographic Region of Columbia River Basin Salmon/Steelhead Smolt Releases (Alternative III, Doubling of the 1980's Runs Objective - Double Survival Rates)
Species: Total State Total Total Fall Chinook Level Average Total Recreational Recreational Total Total
REI NEV REI NEV REI % NEV %Snake River
Alaska 3,484 1,704 5 4 3,489 9% 1,709 8%British Columbia 14,692 7,200 1,008 864 15,700 42% 8,064 39%Washington ocean 1,825 895 1,008 864 2,833 8% 1,758 8%Washington Puget Sound 0 0 0 0 0 0% 0 0%Oregon 530 273 252 216 782 2% 489 2%California 0 0 0 0 0 0% 0 0%Columbia Basin inland
Freshwater sportMainstem 0 0 756 648 756 2% 648 3%Tributary 0 0 0 0 0 0% 0 0%
Gillnet 4,153 2,371 0 0 4,153 11% 2,371 11%Tribal 9,121 5,206 0 0 9,121 24% 5,206 25%
Other 0 0 0 0 0 0% 0 0%Hatchery
Hatchery surplus market 588 361 0 0 588 2% 361 2%Hatchery carcass 279 172 0 0 279 1% 172 1%
Total with hatchery surplus utilization 37,701 100% 20,777 100%Total without hatchery surplus utilization 36,833 20,245
Upper ColumbiaAlaska 70,095 34,293 101 87 70,197 9% 34,379 8%British Columbia 295,612 144,871 20,273 17,378 315,886 42% 162,248 39%Washington ocean 36,728 18,003 20,273 17,378 57,001 8% 35,381 8%Washington Puget Sound 3 2 5 4 9 0% 6 0%Oregon 10,656 5,487 5,068 4,344 15,725 2% 9,831 2%California 5 2 5 4 10 0% 6 0%Columbia Basin inland
Freshwater sportMainstem 0 0 15,205 13,033 15,205 2% 13,033 3%Tributary 0 0 0 0 0 0% 0 0%
Gillnet 83,567 47,703 0 0 83,567 11% 47,703 11%Tribal 183,514 104,757 0 0 183,514 24% 104,757 25%
Other 0 0 0 0 0 0% 0 0%Hatchery
Hatchery surplus market 11,824 7,254 0 0 11,824 2% 7,254 2%Hatchery carcass 5,622 3,457 0 0 5,622 1% 3,457 1%
Total with hatchery surplus utilization 758,559 100% 418,057 100%Total without hatchery surplus utilization 741,113 407,346
Middle ColumbiaAlaska 136,453 66,756 197 169 136,650 9% 66,926 8%British Columbia 575,461 282,016 39,466 33,829 614,927 42% 315,845 39%Washington ocean 71,497 35,046 39,466 33,829 110,963 8% 68,874 8%Washington Puget Sound 7 3 10 8 17 0% 12 0%Oregon 20,744 10,680 9,866 8,457 30,611 2% 19,138 2%California 9 4 10 8 19 0% 12 0%Columbia Basin inland
Freshwater sportMainstem 0 0 29,599 25,372 29,599 2% 25,372 3%Tributary 0 0 0 0 0 0% 0 0%
Gillnet 162,678 92,863 0 0 162,678 11% 92,863 11%Tribal 357,243 203,928 0 0 357,243 24% 203,928 25%
Other 0 0 0 0 0 0% 0 0%Hatchery
Hatchery surplus market 23,018 14,120 0 0 23,018 2% 14,120 2%Hatchery carcass 10,944 6,731 0 0 10,944 1% 6,731 1%
Total with hatchery surplus utilization 1,476,670 100% 813,821 100%Total without hatchery surplus utilization 1,442,707 792,970
kco D:\DATA\EXCEL\pikeminnowFromFW.xls FChnkCapWatIII

Species: Total State Total Total Fall Chinook Level Average Total Recreational Recreational Total Total
REI NEV REI NEV REI % NEV %
Lower ColumbiaAlaska 58,007 28,378 0 0 58,007 3% 28,378 2%British Columbia 782,817 383,635 100,662 86,284 883,480 38% 469,920 33%Washington ocean 324,200 158,912 335,541 287,615 659,741 29% 446,527 31%Washington Puget Sound 0 0 0 0 0 0% 0 0%Oregon 70,548 36,322 33,554 28,761 104,102 5% 65,084 5%California 15,043 6,300 3,355 2,876 18,399 1% 9,176 1%Columbia Basin inland
Freshwater sportMainstem 0 0 251,656 215,711 251,656 11% 215,711 15%Tributary 0 0 0 0 0 0% 0 0%
Gillnet 253,568 144,747 0 0 253,568 11% 144,747 10%Tribal 0 0 0 0 0 0% 0 0%
Other 0 0 0 0 0 0% 0 0%Hatchery
Hatchery surplus market 50,862 31,201 0 0 50,862 2% 31,201 2%Hatchery carcass 33,378 20,528 0 0 33,378 1% 20,528 1%
Total with hatchery surplus utilization 2,313,193 100% 1,431,272 100%Total without hatchery surplus utilization 2,228,952 1,379,543
WillametteAlaska NA NA NA NA NA NA NA NABritish Columbia NA NA NA NA NA NA NA NAWashington ocean NA NA NA NA NA NA NA NAWashington Puget Sound NA NA NA NA NA NA NA NAOregon NA NA NA NA NA NA NA NACalifornia NA NA NA NA NA NA NA NAColumbia Basin inland
Freshwater sportMainstem NA NA NA NA NA NA NA NATributary NA NA NA NA NA NA NA NA
Gillnet NA NA NA NA NA NA NA NATribal NA NA NA NA NA NA NA NA
Other NA NA NA NA NA NA NA NAHatchery
Hatchery surplus market NA NA NA NA NA NA NA NAHatchery carcass NA NA NA NA NA NA NA NA
Total with hatchery surplus utilization NA NA NA NATotal without hatchery surplus utilization NA NA
TotalAlaska 268,039 131,132 304 260 268,343 6% 131,392 5%British Columbia 1,668,583 817,722 161,409 138,355 1,829,992 40% 956,077 36%Washington ocean 434,250 212,856 396,288 339,685 830,538 18% 552,540 21%Washington Puget Sound 10 5 15 13 26 0% 18 0%Oregon 102,478 52,762 48,741 41,779 151,218 3% 94,541 4%California 15,057 6,305 3,371 2,889 18,428 0% 9,195 0%Columbia Basin inland
Freshwater sportMainstem 0 0 297,216 254,764 297,216 6% 254,764 9%Tributary 0 0 0 0 0 0% 0 0%
Gillnet 503,967 287,684 0 0 503,967 11% 287,684 11%Tribal 549,878 313,892 0 0 549,878 12% 313,892 12%
Other 0 0 0 0 0 0% 0 0%Hatchery
Hatchery surplus market 86,293 52,936 0 0 86,293 2% 52,936 2%Hatchery carcass 50,224 30,888 0 0 50,224 1% 30,888 1%
Total with hatchery surplus utilization 4,586,122 100% 2,683,927 100%Total without hatchery surplus utilization 4,449,606 2,600,104
kco D:\DATA\EXCEL\pikeminnowFromFW.xls FChnkCapWatIII

Table 3c.4Estimated Regional Economic Impacts and Net Economic Values by Geographic Region of Columbia River Basin Salmon/Steelhead Smolt Releases (Alternative III, Doubling of the 1980's Runs Objective - Double Survival Rates)
Species: Total State Total Total Summer/Winter Steelhead Level Average Total Recreational Recreational Total Total
REI NEV REI NEV REI % NEV %Snake River
Alaska 0 0 487 429 487 0% 429 0%British Columbia 6,034 3,098 0 0 6,034 1% 3,098 0%Washington ocean 0 0 0 0 0 0% 0 0%Washington Puget Sound 0 0 0 0 0 0% 0 0%Oregon 0 0 487 429 487 0% 429 0%California 0 0 0 0 0 0% 0 0%Columbia Basin inland
Freshwater sportMainstem 0 0 199,365 175,607 199,365 20% 175,607 19%Tributary 0 0 598,095 630,292 598,095 61% 630,292 69%
Gillnet 0 0 0 0 0 0% 0 0%Tribal 74,828 44,259 0 0 74,828 8% 44,259 5%
Other 0 0 0 0 0 0% 0 0%Hatchery
Hatchery surplus market 78,694 48,346 0 0 78,694 8% 48,346 5%Hatchery carcass 20,361 12,522 0 0 20,361 2% 12,522 1%
Total with hatchery surplus utilization 978,351 100% 914,983 100%Total without hatchery surplus utilization 879,296 854,115
Upper ColumbiaAlaska 0 0 52 45 52 0% 45 0%British Columbia 638 327 0 0 638 1% 327 0%Washington ocean 0 0 0 0 0 0% 0 0%Washington Puget Sound 0 0 0 0 0 0% 0 0%Oregon 0 0 52 45 52 0% 45 0%California 0 0 0 0 0 0% 0 0%Columbia Basin inland
Freshwater sportMainstem 0 0 21,073 18,562 21,073 20% 18,562 19%Tributary 0 0 63,220 66,623 63,220 61% 66,623 69%
Gillnet 0 0 0 0 0 0% 0 0%Tribal 7,909 4,678 0 0 7,909 8% 4,678 5%
Other 0 0 0 0 0 0% 0 0%Hatchery
Hatchery surplus market 8,318 5,110 0 0 8,318 8% 5,110 5%Hatchery carcass 2,152 1,324 0 0 2,152 2% 1,324 1%
Total with hatchery surplus utilization 103,413 100% 96,715 100%Total without hatchery surplus utilization 92,943 90,281
Middle ColumbiaAlaska 0 0 20 18 20 0% 18 0%British Columbia 251 129 0 0 251 1% 129 0%Washington ocean 0 0 0 0 0 0% 0 0%Washington Puget Sound 0 0 0 0 0 0% 0 0%Oregon 0 0 20 18 20 0% 18 0%California 0 0 0 0 0 0% 0 0%Columbia Basin inland
Freshwater sportMainstem 0 0 8,297 7,308 8,297 20% 7,308 19%Tributary 0 0 24,891 26,231 24,891 61% 26,231 69%
Gillnet 0 0 0 0 0 0% 0 0%Tribal 3,114 1,842 0 0 3,114 8% 1,842 5%
Other 0 0 0 0 0 0% 0 0%Hatchery
Hatchery surplus market 3,275 2,012 0 0 3,275 8% 2,012 5%Hatchery carcass 847 521 0 0 847 2% 521 1%
Total with hatchery surplus utilization 40,716 100% 38,078 100%Total without hatchery surplus utilization 36,593 35,545
kco D:\DATA\EXCEL\pikeminnowFromFW.xls SteelhCapWatIII

Species: Total State Total Total Summer/Winter Steelhead Level Average Total Recreational Recreational Total Total
REI NEV REI NEV REI % NEV %
Lower ColumbiaAlaska 0 0 82 72 82 0% 72 0%British Columbia 1,011 519 0 0 1,011 0% 519 0%Washington ocean 0 0 0 0 0 0% 0 0%Washington Puget Sound 0 0 0 0 0 0% 0 0%Oregon 0 0 82 72 82 0% 72 0%California 0 0 0 0 0 0% 0 0%Columbia Basin inland
Freshwater sportMainstem 0 0 244,926 215,739 244,926 95% 215,739 97%Tributary 0 0 0 0 0 0% 0 0%
Gillnet 0 0 0 0 0 0% 0 0%Tribal 0 0 0 0 0 0% 0 0%
Other 0 0 0 0 0 0% 0 0%Hatchery
Hatchery surplus market 7,715 4,740 0 0 7,715 3% 4,740 2%Hatchery carcass 3,807 2,341 0 0 3,807 1% 2,341 1%
Total with hatchery surplus utilization 257,622 100% 223,483 100%Total without hatchery surplus utilization 246,100 216,402
WillametteAlaska 0 0 32 28 32 0% 28 0%British Columbia 392 201 0 0 392 0% 201 0%Washington ocean 0 0 0 0 0 0% 0 0%Washington Puget Sound 0 0 0 0 0 0% 0 0%Oregon 0 0 32 28 32 0% 28 0%California 0 0 0 0 0 0% 0 0%Columbia Basin inland
Freshwater sportMainstem 0 0 95,088 83,757 95,088 95% 83,757 97%Tributary 0 0 0 0 0 0% 0 0%
Gillnet 0 0 0 0 0 0% 0 0%Tribal 0 0 0 0 0 0% 0 0%
Other 0 0 0 0 0 0% 0 0%Hatchery
Hatchery surplus market 2,995 1,840 0 0 2,995 3% 1,840 2%Hatchery carcass 1,478 909 0 0 1,478 1% 909 1%
Total with hatchery surplus utilization 100,017 100% 86,764 100%Total without hatchery surplus utilization 95,544 84,014
TotalAlaska 0 0 673 592 673 0% 592 0%British Columbia 8,325 4,275 0 0 8,325 1% 4,275 0%Washington ocean 0 0 0 0 0 0% 0 0%Washington Puget Sound 0 0 0 0 0 0% 0 0%Oregon 0 0 673 592 673 0% 592 0%California 0 0 0 0 0 0% 0 0%Columbia Basin inland
Freshwater sportMainstem 0 0 568,750 500,974 568,750 38% 500,974 37%Tributary 0 0 686,205 723,146 686,205 46% 723,146 53%
Gillnet 0 0 0 0 0 0% 0 0%Tribal 85,852 50,779 0 0 85,852 6% 50,779 4%
Other 0 0 0 0 0 0% 0 0%Hatchery
Hatchery surplus market 100,997 62,048 0 0 100,997 7% 62,048 5%Hatchery carcass 28,646 17,617 0 0 28,646 2% 17,617 1%
Total with hatchery surplus utilization 1,480,120 100% 1,360,023 100%Total without hatchery surplus utilization 1,350,477 1,280,358
kco D:\DATA\EXCEL\pikeminnowFromFW.xls SteelhCapWatIII
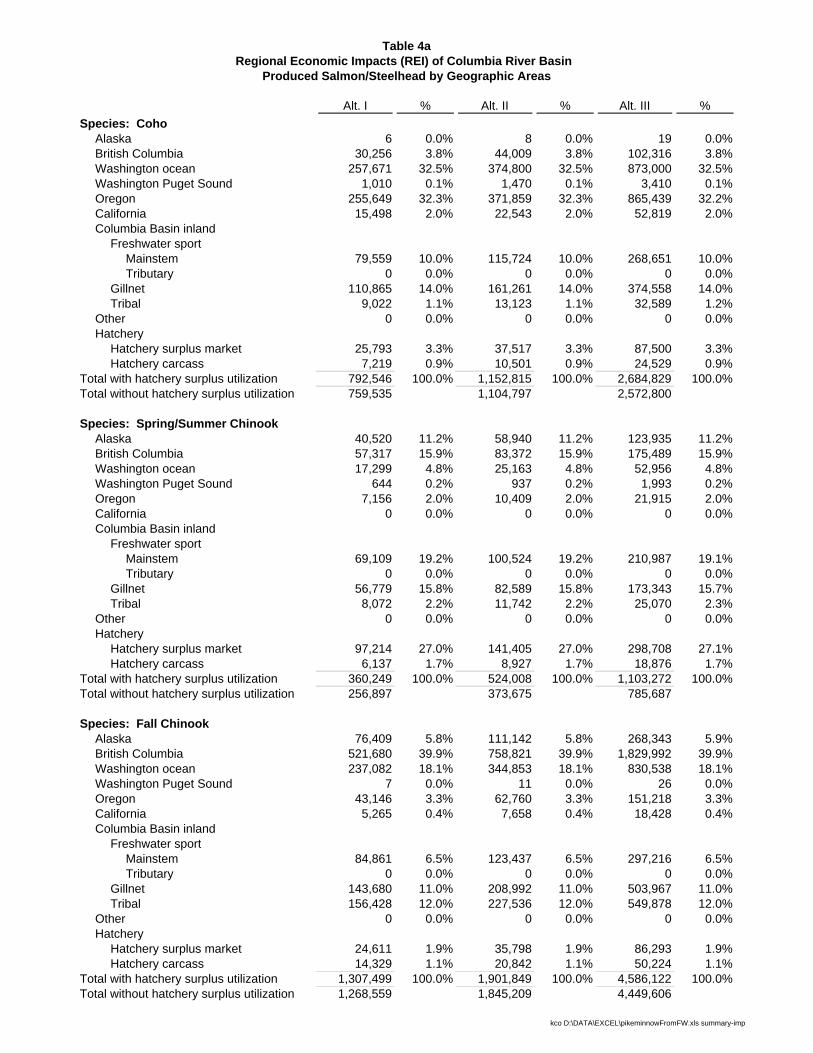
Table 4aRegional Economic Impacts (REI) of Columbia River Basin
Produced Salmon/Steelhead by Geographic Areas
Alt. I % Alt. II % Alt. III %Species: Coho
Alaska 6 0.0% 8 0.0% 19 0.0%British Columbia 30,256 3.8% 44,009 3.8% 102,316 3.8%Washington ocean 257,671 32.5% 374,800 32.5% 873,000 32.5%Washington Puget Sound 1,010 0.1% 1,470 0.1% 3,410 0.1%Oregon 255,649 32.3% 371,859 32.3% 865,439 32.2%California 15,498 2.0% 22,543 2.0% 52,819 2.0%Columbia Basin inland
Freshwater sportMainstem 79,559 10.0% 115,724 10.0% 268,651 10.0%Tributary 0 0.0% 0 0.0% 0 0.0%
Gillnet 110,865 14.0% 161,261 14.0% 374,558 14.0%Tribal 9,022 1.1% 13,123 1.1% 32,589 1.2%
Other 0 0.0% 0 0.0% 0 0.0%Hatchery
Hatchery surplus market 25,793 3.3% 37,517 3.3% 87,500 3.3%Hatchery carcass 7,219 0.9% 10,501 0.9% 24,529 0.9%
Total with hatchery surplus utilization 792,546 100.0% 1,152,815 100.0% 2,684,829 100.0%Total without hatchery surplus utilization 759,535 1,104,797 2,572,800
Species: Spring/Summer ChinookAlaska 40,520 11.2% 58,940 11.2% 123,935 11.2%British Columbia 57,317 15.9% 83,372 15.9% 175,489 15.9%Washington ocean 17,299 4.8% 25,163 4.8% 52,956 4.8%Washington Puget Sound 644 0.2% 937 0.2% 1,993 0.2%Oregon 7,156 2.0% 10,409 2.0% 21,915 2.0%California 0 0.0% 0 0.0% 0 0.0%Columbia Basin inland
Freshwater sportMainstem 69,109 19.2% 100,524 19.2% 210,987 19.1%Tributary 0 0.0% 0 0.0% 0 0.0%
Gillnet 56,779 15.8% 82,589 15.8% 173,343 15.7%Tribal 8,072 2.2% 11,742 2.2% 25,070 2.3%
Other 0 0.0% 0 0.0% 0 0.0%Hatchery
Hatchery surplus market 97,214 27.0% 141,405 27.0% 298,708 27.1%Hatchery carcass 6,137 1.7% 8,927 1.7% 18,876 1.7%
Total with hatchery surplus utilization 360,249 100.0% 524,008 100.0% 1,103,272 100.0%Total without hatchery surplus utilization 256,897 373,675 785,687
Species: Fall ChinookAlaska 76,409 5.8% 111,142 5.8% 268,343 5.9%British Columbia 521,680 39.9% 758,821 39.9% 1,829,992 39.9%Washington ocean 237,082 18.1% 344,853 18.1% 830,538 18.1%Washington Puget Sound 7 0.0% 11 0.0% 26 0.0%Oregon 43,146 3.3% 62,760 3.3% 151,218 3.3%California 5,265 0.4% 7,658 0.4% 18,428 0.4%Columbia Basin inland
Freshwater sportMainstem 84,861 6.5% 123,437 6.5% 297,216 6.5%Tributary 0 0.0% 0 0.0% 0 0.0%
Gillnet 143,680 11.0% 208,992 11.0% 503,967 11.0%Tribal 156,428 12.0% 227,536 12.0% 549,878 12.0%
Other 0 0.0% 0 0.0% 0 0.0%Hatchery
Hatchery surplus market 24,611 1.9% 35,798 1.9% 86,293 1.9%Hatchery carcass 14,329 1.1% 20,842 1.1% 50,224 1.1%
Total with hatchery surplus utilization 1,307,499 100.0% 1,901,849 100.0% 4,586,122 100.0%Total without hatchery surplus utilization 1,268,559 1,845,209 4,449,606
kco D:\DATA\EXCEL\pikeminnowFromFW.xls summary-imp

Table 4a (continued)
Alt. I % Alt. II % Alt. III %
Species: Summer/Winter SteelheadAlaska 104 0.0% 151 0.0% 673 0.0%British Columbia 1,288 0.6% 1,873 0.6% 8,325 0.6%Washington ocean 0 0.0% 0 0.0% 0 0.0%Washington Puget Sound 0 0.0% 0 0.0% 0 0.0%Oregon 104 0.0% 151 0.0% 673 0.0%California 0 0.0% 0 0.0% 0 0.0%Columbia Basin inland
Freshwater sportMainstem 87,924 38.4% 127,892 38.4% 568,750 38.4%Tributary 106,183 46.4% 154,451 46.4% 686,205 46.4%
Gillnet 0 0.0% 0 0.0% 0 0.0%Tribal 13,285 5.8% 19,324 5.8% 85,852 5.8%
Other 0 0.0% 0 0.0% 0 0.0%Hatchery
Hatchery surplus market 15,626 6.8% 22,729 6.8% 100,997 6.8%Hatchery carcass 4,431 1.9% 6,446 1.9% 28,646 1.9%
Total with hatchery surplus utilization 228,945 100.0% 333,017 100.0% 1,480,120 100.0%Total without hatchery surplus utilization 208,888 303,843 1,350,477
Species: TotalAlaska 117,039 4.4% 170,241 4.4% 392,969 4.0%British Columbia 610,541 22.7% 888,075 22.7% 2,116,123 21.5%Washington ocean 512,052 19.0% 744,816 19.0% 1,756,494 17.8%Washington Puget Sound 1,662 0.1% 2,417 0.1% 5,429 0.1%Oregon 306,055 11.4% 445,179 11.4% 1,039,244 10.5%California 20,763 0.8% 30,201 0.8% 71,247 0.7%Columbia Basin inland
Freshwater sportMainstem 321,453 12.0% 467,577 12.0% 1,345,603 13.7%Tributary 106,183 3.9% 154,451 3.9% 686,205 7.0%
Gillnet 311,324 11.6% 452,843 11.6% 1,051,869 10.7%Tribal 186,807 6.9% 271,724 6.9% 693,389 7.0%
Other 0 0.0% 0 0.0% 0 0.0%Hatchery
Hatchery surplus market 163,243 6.1% 237,449 6.1% 573,497 5.8%Hatchery carcass 32,117 1.2% 46,716 1.2% 122,274 1.2%
Total with hatchery surplus utilization 2,689,240 100.0% 3,911,689 100.0% 9,854,343 100.0%Total without hatchery surplus utilization 2,493,880 3,627,524 9,158,571
kco D:\DATA\EXCEL\pikeminnowFromFW.xls summary-imp

Table 4bNet Economic Values (NEV) of Columbia River Basin
Produced Salmon/Steelhead by Geographic Areas
Alt. I % Alt. II % Alt. III %Species: Coho
Alaska 3 0.0% 4 0.0% 9 0.0%British Columbia 17,567 2.9% 25,552 2.9% 59,404 2.9%Washington ocean 218,325 36.0% 317,569 36.0% 739,716 36.0%Washington Puget Sound 790 0.1% 1,149 0.1% 2,665 0.1%Oregon 200,243 33.0% 291,267 33.0% 677,912 33.0%California 10,789 1.8% 15,693 1.8% 36,781 1.8%Columbia Basin inland
Freshwater sportMainstem 68,195 11.2% 99,195 11.2% 230,279 11.2%Tributary 0 0.0% 0 0.0% 0 0.0%
Gillnet 65,787 10.8% 95,692 10.8% 222,263 10.8%Tribal 5,354 0.9% 7,787 0.9% 19,338 0.9%
Other 0 0.0% 0 0.0% 0 0.0%Hatchery
Hatchery surplus market 15,726 2.6% 22,875 2.6% 53,350 2.6%Hatchery carcass 4,440 0.7% 6,458 0.7% 15,085 0.7%
Total with hatchery surplus utilization 607,218 100.0% 883,241 100.0% 2,056,802 100.0%Total without hatchery surplus utilization 587,052 853,908 1,988,367
Species: Spring/Summer ChinookAlaska 19,951 9.3% 29,020 9.3% 61,020 9.3%British Columbia 29,634 13.8% 43,105 13.8% 90,732 13.8%Washington ocean 10,300 4.8% 14,981 4.8% 31,543 4.8%Washington Puget Sound 367 0.2% 533 0.2% 1,133 0.2%Oregon 5,125 2.4% 7,454 2.4% 15,693 2.4%California 0 0.0% 0 0.0% 0 0.0%Columbia Basin inland
Freshwater sportMainstem 59,238 27.6% 86,166 27.6% 180,851 27.5%Tributary 0 0.0% 0 0.0% 0 0.0%
Gillnet 28,767 13.4% 41,843 13.4% 87,823 13.4%Tribal 4,090 1.9% 5,949 1.9% 12,702 1.9%
Other 0 0.0% 0 0.0% 0 0.0%Hatchery
Hatchery surplus market 53,179 24.8% 77,352 24.8% 163,401 24.9%Hatchery carcass 3,774 1.8% 5,490 1.8% 11,609 1.8%
Total with hatchery surplus utilization 214,424 100.0% 311,894 100.0% 656,508 100.0%Total without hatchery surplus utilization 157,470 229,052 481,497
Species: Fall ChinookAlaska 37,413 4.9% 54,420 4.9% 131,392 4.9%British Columbia 272,561 35.6% 396,460 35.6% 956,077 35.6%Washington ocean 157,735 20.6% 229,437 20.6% 552,540 20.6%Washington Puget Sound 5 0.0% 8 0.0% 18 0.0%Oregon 26,975 3.5% 39,237 3.5% 94,541 3.5%California 2,627 0.3% 3,821 0.3% 9,195 0.3%Columbia Basin inland
Freshwater sportMainstem 72,740 9.5% 105,806 9.5% 254,764 9.5%Tributary 0 0.0% 0 0.0% 0 0.0%
Gillnet 82,018 10.7% 119,301 10.7% 287,684 10.7%Tribal 89,295 11.7% 129,886 11.7% 313,892 11.7%
Other 0 0.0% 0 0.0% 0 0.0%Hatchery
Hatchery surplus market 15,097 2.0% 21,960 2.0% 52,936 2.0%Hatchery carcass 8,812 1.2% 12,818 1.2% 30,888 1.2%
Total with hatchery surplus utilization 765,280 100.0% 1,113,154 100.0% 2,683,927 100.0%Total without hatchery surplus utilization 741,371 1,078,376 2,600,104
kco D:\DATA\EXCEL\pikeminnowFromFW.xls summary-val

Table 4b (continued)
Alt. I % Alt. II % Alt. III %
Species: Summer/Winter SteelheadAlaska 92 0.0% 133 0.0% 592 0.0%British Columbia 661 0.3% 962 0.3% 4,275 0.3%Washington ocean 0 0.0% 0 0.0% 0 0.0%Washington Puget Sound 0 0.0% 0 0.0% 0 0.0%Oregon 92 0.0% 133 0.0% 592 0.0%California 0 0.0% 0 0.0% 0 0.0%Columbia Basin inland
Freshwater sportMainstem 77,446 36.8% 112,651 36.8% 500,974 36.8%Tributary 111,900 53.2% 162,766 53.2% 723,146 53.2%
Gillnet 0 0.0% 0 0.0% 0 0.0%Tribal 7,858 3.7% 11,429 3.7% 50,779 3.7%
Other 0 0.0% 0 0.0% 0 0.0%Hatchery
Hatchery surplus market 9,600 4.6% 13,963 4.6% 62,048 4.6%Hatchery carcass 2,725 1.3% 3,964 1.3% 17,617 1.3%
Total with hatchery surplus utilization 210,373 100.0% 306,003 100.0% 1,360,023 100.0%Total without hatchery surplus utilization 198,048 288,075 1,280,358
Species: TotalAlaska 57,458 3.2% 83,577 3.2% 193,014 2.9%British Columbia 320,423 17.8% 466,078 17.8% 1,110,488 16.4%Washington ocean 386,360 21.5% 561,988 21.5% 1,323,800 19.6%Washington Puget Sound 1,162 0.1% 1,690 0.1% 3,817 0.1%Oregon 232,434 12.9% 338,092 12.9% 788,738 11.7%California 13,416 0.7% 19,514 0.7% 45,976 0.7%Columbia Basin inland
Freshwater sportMainstem 277,620 15.4% 403,818 15.4% 1,166,867 17.3%Tributary 111,900 6.2% 162,766 6.2% 723,146 10.7%
Gillnet 176,572 9.8% 256,837 9.8% 597,770 8.8%Tribal 106,596 5.9% 155,052 5.9% 396,711 5.9%
Other 0 0.0% 0 0.0% 0 0.0%Hatchery
Hatchery surplus market 93,602 5.2% 136,151 5.2% 331,735 4.9%Hatchery carcass 19,752 1.1% 28,730 1.1% 75,199 1.1%
Total with hatchery surplus utilization 1,797,295 100.0% 2,614,292 100.0% 6,757,260 100.0%Total without hatchery surplus utilization 1,683,941 2,449,411 6,350,326
kco D:\DATA\EXCEL\pikeminnowFromFW.xls summary-val