Embed Size (px)
Citation preview

EDC_Strategic Plan 2017 October 6, 2017 Page 1
ECONOMIC DEVELOPMENT
STRATEGIC PLAN 2017

EDC_Strategic Plan 2017 October 6, 2017 Page 2
TABLE OF CONTENTS
Preamble………….………………………………………………………………..… Page 3
Economic Summary……………………………………………………………….… Page 4 & 5
SWOT Analysis……………………………………………………………………… Page 6 - 8
Critical Sector Analysis……………………..………………………..…………....... Page 9 - 10
Target Industries…………………………………………………………….………. Page 11
Goals……………………………………………………………………….…...…… Page 12
Themes, Strategies, and Metrics…………………………………………………….. Page 12 – 17
Appendix
I. Economy Overview 2016
II. Age Cohort Demographics 2016
III. Educational Attainment 2016
IV. Average Earnings by Industry 2016
V. Gross Regional Product (GRP) 2016
VI. Region Exports 2016
VII. Region Imports 2016
VIII. Industry Group Jobs and Earnings Comparison 2015 & 2016
IX. Industry Group Growth Comparison 2015 & 2016
X. Public High School, Graduation Rate 2010-2015
XI. Public School Post Graduation, Decisions 2011-2016
XII. Kent County Public Schools, College Selections
EDC_Strategic Plan 2017 October 6, 2017 Page 3
FIVE YEAR STRATEGIC PLAN
The Economic Development Plan for Kent County, Maryland is a guideline for near (1-2 years) and longer term (3-5 years) goals, with strategies and objectives, based on research and data for the area. Economic development growth will be enhanced when the goals, strategies, and objectives are met.
MISSION STATEMENT
Kent County Economic Development promotes activities that seek to enhance the business community, the services and income opportunities available to residents, as well as the social well-being and quality of life for all members of the county.
VISION
Leverage the County’s new digital infrastructure to help retain and expand existing businesses and increase their competitiveness, as well as to attract desirable new businesses. Advocate for upgrading infrastructure and developing a work-force to meet the needs of current and future employers.
OVERVIEW
Kent County is a predominantly rural county on the Eastern Shore of the State of Maryland. It is the smallest county in population, but has some of the best agricultural land on the Atlantic seaboard, is surrounded on 3 sides by water, and offers high quality environments and an appealing rural character. Kent County evolved from an agrarian economy, through the industrial revolution, to the current information industry, it continues to rely heavily on its existing agriculture and manufacturing base. The county benefits from a modern digital infrastructure and high-quality public and private schools, including the 8th oldest private college in the United States and it has an industrial base that includes leading-edge global-scale manufacturing companies. Despite these advantages, Kent County faces challenges in expanding its population, attracting new businesses, providing a workforce trained for the 21st century, and upgrading its infrastructure.

EDC_Strategic Plan 2017 October 6, 2017 Page 4
ECONOMIC SUMMARY Kent County had an economy of $829.7 million in Gross Regional Product (GRP), $1.2 billion in Exports, and $1.5 billion in Imports in 2016. The top five industry sectors based on GRP:
● Other Non-Industries 15% ● Manufacturing 12% ● Government 9% ● Health Care and Social Services 7% ● Real Estate and Rental and Leasing 7%
The top five industry sectors based on Imports:
● Government 25.5% ● Manufacturing 17.7% ● Finance and Insurance 6.7% ● Retail Trade 5.8% ● Real Estate and Rental and Leasing 5.2%
The top five industry sectors based on Exports:
● Manufacturing 22.5% ● Government 13.4% ● Real Estate and Rental and Leasing 9.6% ● Crop and Animal Production 7.4% ● Retail Trade 6.2%
The top five industry sectors based on the number of jobs:
● Educational Services 10.8% ● Health Care & Social Services 10.5% ● Retail Trade 9.7% ● Government 8.7% ● Real Estate and Rental and Leasing 8.0%
The top five industry sectors based on wages in 2015:
• Manufacturing 25.8% • Health Care & Social Assistance 16.6% • Educational Services 13% • Retail Trade 8.9% • Construction 8.4%
Source: Quarterly Census of Employment and Wages (QCEW)
EDC_Strategic Plan 2017 October 6, 2017 Page 5
Agriculture accounted for 91.2% of the land use and 13.6% of the real property taxable assessable base in 2016. According to the Small Business Administration, all Kent County business are classified as small businesses, https://www.sba.gov/contracting/getting-started-contractor/make-sure-you-meet-sba-size-standards/guide-size-standards Gross Regional Product
Measures the final market value of all goods and services produced in a region.
Source: Emsi data based primarily on data from the Bureau of Economic Analysis (BEA) and the Quarterly Census of Employment and Wages (QCEW) from the Bureau of Labor Statistics (BLS).
Exports
Money received in the region through foreign and external domestic sources.
Source: Emsi's model, incorporating data from the Bureau of Economic Analysis (BEA).
Imports
The amount of money leaving the region to foreign and external domestic sources.
Source: Emsi's model, incorporating data from the Bureau of Economic Analysis (BEA).
EDC_Strategic Plan 2017 October 6, 2017 Page 6
SWOT ANALYSIS The county has many STRENGTHS that impact the local economy that can be built upon.
● Washington College and its cultural and educational influence.
● World class agricultural land, the best on the eastern seaboard.
● Bordered on three sides by water, 265 miles of tidal shoreline.
● Manufacturing base at 26% of annual wages.
● Quality of life; beautiful, peaceful, rural landscape with highly desirable natural
resources, both marine and terrestrial.
● A robust, active, and growing arts community.
● Very high-speed broadband internet infrastructure, available in all corners of the county
at a reasonable cost.
● Marinas to attract the boating community and the upgraded Chestertown Marina.
● Strong business ecosystem provides mentoring services to existing and new businesses.
● Convenient location to suburban and urban centers in DE, NJ, PA, and the Western
Shore.
● Many historic sites and buildings on a state supported visitor’s trail.
● Vineyards on a state supported wine trail.
● Location on the Atlantic Flyway that attracts waterfowl during the hunting season and
migrant birds during the spring and fall.
● Regional hospital.
● Recreational charter boat fishing and outfitter hunting.
● Growing influx of retirees that contribute to the economy with retirement incomes and
require few social services.
● Availability of low cost loans from the re-established County Revolving Loan Fund.
Like all jurisdictions, the county must deal with several WEAKNESSES.
● Lack of public transportation.
● Limited opportunities for business park development.
● Limited availability of affordable housing. The senior population has limited options
when they must leave their residence

EDC_Strategic Plan 2017 October 6, 2017 Page 7
● Negative perceptions of the public-school system.
● Small size and lack of growth in the number of households that comprise the local
market.
● Perceptions of being unfriendly to businesses at the State and local levels
● Limited medical professionals requiring residents to travel outside the area for some
services.
● As the result of improving efficiencies in farming, a declining number of agricultural
workers.
● Limited work force with the skills required to attract and sustain small to mid-sized
businesses reflected by the fact that the county is only one of five counties in the state
that has an influx of workers.
● Decreasing number of middle-aged, middle-income families residing in the county
resulting in a declining population of school aged children.
● Limited tax resources coupled with the high cost of government services owing to the
population density and large amount of land in agriculture.
● As with other counties on the Eastern Shore, limited influence in Annapolis.
● Perception of youth and students that there’s nothing to do here (jobs and social life).
The County has many OPPORTUNITIES that can contribute to the future enhancement and
sustainability of the county’s economy.
● Natural gas availability.
● Growth in Middletown, DE extending into MD
● Collaboration with other jurisdictions on mutually beneficial solutions to common
problems.
● Increased availability of affordable/workforce housing.
● The recent successes of the public-school system.
● Extending the impact of tourism, hunting, and fishing to year-round activities.
● The county’s wildlife management areas for the birding community.
● The development of new businesses that require very high-speed internet infrastructure.
● The relationship with Washington College to encourage entrepreneurship.

EDC_Strategic Plan 2017 October 6, 2017 Page 8
● Eastern Shore Entrepreneurship Center’s F3 program promoting innovation in the
Aquaculture, Agricultural, and Environmental sectors.
● A business park on the 301 corridor.
● Labor pool within a 45 minute from Chestertown (90,000) or Millington (268,000).
● The increase of senior citizens by encouraging 55+ developments.
● The development of a transit system to allow visitors from the Chestertown Marina and
others to visit other parts of the county.
● Communicating the county’s economy and steps being taken to improve it.
● Water and sewer service to Chesapeake Landing to increase workforce housing.
● Third Chesapeake Bay Bridge into Kent County.
The County must also be prepared to deal with THREATS that may arise in the future.
• Federal and State legislative actions.
• The potential for future rising sea levels.
• The loss of a major employer.
• Public opposition or support of projects and development without adequate facts.
• High property taxes.
• Social issues that impact workforce.
• Continued loss of hospital services; in-patient beds, pediatrics, obstetrics, etc.
• Rising healthcare costs.
• Increased business regulations; ACA, minimum wage increase.
• Declining number of boaters.
• Declining volunteers for emergency services.
• Water pollution.
• Volatile global economy and political climate.
• Third Chesapeake Bay Bridge into Kent County.

EDC_Strategic Plan 2017 October 6, 2017 Page 9
CRITICAL SECTOR ANALYSIS Successful economic development depends on the success of several critical sectors and on
marketing that increases external and internal awareness of these successes. The critical sectors
include:
• Digital Infrastructure. Ensure completion of the gigabit fiber buildout and conduct
internal/external marketing to build awareness. This is critical to the targeted businesses
we seek to retain and attract.
• Educational Excellence. Support the continuing progress of the Kent County Public
School system and its digital learning platform and conduct internal/external marketing to
build awareness. This is critical to attract the new residents we need, especially young
families.
• Workforce Development. The County has no training facility or service to provide a
workforce trained for 21st century jobs, especially those in sectors targeted for economic
development. Work with and support the continued excellence of Washington College
and Chesapeake College to develop/support skills training and higher education
opportunities and conduct internal/external marketing to build awareness. This is critical
to provide the quality workforce we need for business retention, expansion and attraction.
• High Quality Healthcare Services. Advocate for retention of in-patient services and
support upgrading the Chesterton Hospital, as well as support development of additional
health and wellness services for the County and conduct internal/external marketing to
build awareness. This is critical to attracting new residents, of all ages, and to support our
employers.
• Housing. Attracting new residents to the County requires the availability of appropriate
housing, including apartments or affordable houses for young families. The County is an
attractive retirement destination, and would be more so if there were additional
retirement/assisted living facilities.

EDC_Strategic Plan 2017 October 6, 2017 Page 10
• Transportation. The County lacks public or on-call private transportation services (i.e.
Lyft and Uber) both within Chestertown and within the County Transportation enables
residents without cars (or who cannot drive) access to external medical or commercial
facilities. Consider possible executive limousine or helicopter transport to international
airports.
• Recreation and Leisure. Despite excellent boating and fishing opportunities and an
active arts community, the County lacks a wide variety of recreation and leisure
activities, especially for teenagers and young adults.
• Energy. A natural gas pipeline would reduce the manufacturing costs and home heating
costs; consider incentives to encourage solar homes; explore federal support for creation
of a distributed generation smart grid demonstration project. In addition, small-scale
solar energy for local use and sharing in the power from off-shore wind generators could
play a significant role in the future.
• Infrastructure. Expanding water and sewer services, roads, etc. to areas designated for
commercial and business development, or to enlarge municipal areas through residential
growth is an important factor in retention, expansion, and attraction. In the short-term a
feasibility would allow the County to plan for future desired growth.

EDC_Strategic Plan 2017 October 6, 2017 Page 11
TARGET INDUSTRIES Economic development activities are designed to attract businesses and residents to the County while preserving the environmental quality. Kent County will prioritize high paying jobs with low environmental impact.
• Information Technology Enabled Businesses
o Data Centers
o Call Centers
o Cyber Security
• Health Care and Wellness Care
• Training and Education Centers
o Information Technology
o Advanced Manufacturing
o Healthcare
• Artists, Creators, and Graphic Designers
• Environmental Services
• Transportation and Warehousing (301 Corridor)
• Professional Services
o Engineers
o Architects
o GIS & Mapping
o Home Services
• Retirement and Assisted Living Facilities
• Day Care/Early Childhood Development Centers
• Providers of Youth and Family Entertainment
Based on these analyses and priorities, this report sets forth three broad goals for economic development. Recognizing that there are many ways to achieve these goals, and that given finite resources and staff, not all will be possible to undertake, this report lays out potential organizing themes for economic development, possible strategies aligned with those themes to accomplish the goals, and some tentative metrics that would represent success.
EDC_Strategic Plan 2017 October 6, 2017 Page 12
GOALS
#1 ~ FOCUS ON BUSINESS RETENTION, EXPANSION & ATTRACTION #2 ~ PROMOTE WORKFORCE DEVELOPMENT & EDUCATION #3 ~ ENHANCE INFRASTRUCTURE
THEMES AND STRATEGIES NEAR TERM (years 1 and 2) Themes Strategies Metrics
1. Create a welcoming entrepreneurial environment. • Market and support business incubators and co-working spaces. • Encourage the development of remote workers and home-based
businesses reliant on a high-speed internet connection. • Implement tax incentives programs for businesses, start-ups and
entrepreneurs. • Develop, identify, and promote programs to support and encourage
business ownership. • Identify Customer Service training for government employees, like
efforts on state level.
2. Promote business retention and expansion. • Maintain communication with businesses to understand their needs
and let them know they are appreciated. • Streamline the paperwork processes and minimize the time
required for gaining approval for development projects and assist businesses navigate government programs and requirements.
• Support local and regional organizations that promote economic development.
• Assist businesses ready to transition from home based business and cottage industries into the larger business community.
• Develop a Business Appreciation Week.
3. Attract businesses in targeted industries. • Promote the attractiveness of living and working in Kent County,
through all available media.

EDC_Strategic Plan 2017 October 6, 2017 Page 13
• Promote the availability of the high-speed fiber optic network. • Emphasize the relatively low cost of leasing or purchasing
commercial property. • Advertise incentives, i.e., tax credits, loan programs. • Capitalize on the availability of a large regional labor pool. • Seek out targeted businesses.
2 new major businesses locate facilities – 20+ employees • Work with and market the Chestertown Business Campus in
business attraction, expansion, and job growth. • Encourage the development of cottage and home-based businesses.
4 new small businesses – up to 5 employees • Attract agricultural related industries that provide job opportunities
for County residents, and support the diversification of the agricultural industry and use raw materials from area farms.
• Identify infrastructure improvements needed for businesses to locate in Kent County.
• Perform analysis to determine the cost/benefits of providing funding for infrastructure (water, sewer, electric supply, etc.) improvements in areas designated for growth.
4. Develop a marketing and communication plan. • Engage current residents and businesses in conversations about
their challenges and successes. Residents are our best ambassadors.
• Familiarize residents on the need to support intelligent, planned economic development in the County.
• Target potential residents and businesses to locate in the County and market to those sectors though multiple media and channels.
• marketing activities. • Establish communication channels with the towns, business
associations, non-profits, and other community organizations. • Be aggressive in being transparent to improve communication in
the community about the ongoing efforts of economic development.
• Understand the community’s needs by conducting periodic surveys and community meetings to bring different constituencies together to identify common goals and approaches and communicate the results of the efforts.

EDC_Strategic Plan 2017 October 6, 2017 Page 14
5. Ensure adequate staffing and funding for economic development. • Advocate for increased funding and staffing to support economic
development objectives and strategies. Add an economic development support staff member.
• Actively seek grants to support the economic development objectives strategies.
6. Develop an educated work force with the skills and training required to meet the needs of current and future employers.
• Promote the strength of public and private schools through marketing efforts focusing on the experiences of high school graduates that are academically skilled and successful in being accepted at high quality colleges and universities and/or who work in local businesses.
• Retain young people by making private and public, school students aware of the careers with local employers.
• Foster a cooperative relationship among the Board of Education, private employers, community colleges, and training facilities to nurture vocational training programs.
• Work with Washington College and Chesapeake College to strengthen career opportunities.
• Support the development of marine trade programs. • Collaborate with regional work-force partners. • Assist businesses in recruiting talent. • Ensure the viability of the school system and potential investment
in infrastructure by performing financial analysis to evaluate the impact of increasing the tax rate at various levels on agricultural land. Identify a long-term solution to the school system budget challenges. Investigate all options available.
7. Support Kent Forward’s initiative to make the Kent County Public School (KCPS) system one of the top five in the State.
• Work with organizations, i.e., KCPS, Kent Forward, Save Our Schools (SOS) to ensure the success of the public-school system.
• Market the accomplishments and awards achieved by KCPS.
EDC_Strategic Plan 2017 October 6, 2017 Page 15
LONGER TERM (years 3-5) Themes Strategies Metrics
1. Develop a plan to address housing concerns in the County; i.e. workforce, senior, and market rate; and encourage homeownership.
• Work with the County and towns on the extension of public water and sewer systems, where service is planned, to developments such as Chesapeake Landing and Still Pond.
• Work with developers who specialize in 55+ projects. • Build support systems with lenders and realtors for first time
homeowners. • Support Maryland Rural Development Corporation’s housing
office and programs. • Help develop and support a Smart Growth strategy for affordable
and workforce housing that clusters multi-family developments where the necessary infrastructure already exists or is planned.
• Seek and support public policies that provide financial incentives for affordable and workforce housing, i.e. Public Private Partnerships and Tax Increment Financing (TIF) for Moderately-Priced Dwelling Units (MPDU).
2. Utilization of existing infrastructure.
• Identify and promote the availability of pad sites for small to medium size businesses.
• Identify and promote the availability of sites for the development of co-packing centers to leverage the availability of products from Eastern Shore Entrepreneurship Center’s F3, Farm-Fish-Food, program.
• Advocate for electric and hydrogen charging stations for the convenience of non-resident vehicle owners.
3. Support tourism development.
• Promote Kent County as a boating center, relating to marinas, sailmakers, yacht design, yacht building, boat repair, boat sales, and boat charters.
• Promote the county as a destination for the arts. • Promote the development of a program focused on the agricultural
and maritime heritage with displays, activities and tours on a year-round basis using the Sultana, QA County’s Museum of Eastern Shore Life, and the Crow Farm as models.

EDC_Strategic Plan 2017 October 6, 2017 Page 16
• Promote tourism and outdoor activities as economic development assets, by leveraging the quality of the County’s natural resources to attract businesses and residents.
• Collaborate with the tourism development efforts.
4. Support the Chestertown Boulevard/Bypass. • Research and disseminate information regarding the construction
of the Chestertown Boulevard/Bypass. • Work with the bridge task force, State Highway Administration,
and local governments to secure best location.
5. Support the planned development on Maryland Route 291. • Assist the Town of Chestertown with the annexation of properties
on Maryland Route 291 (Clark Farm) and with the expansion of the infrastructure systems.
6. Investigate the viability of a public transportation system.
• Determine the need by developing a community survey to gage ridership.
• Develop a “pro forma” for cost of a system. • Ensure the availability of parking areas for self-driving vehicles.
7. Increase population to 25,000 by 2025.
• Expanded and new businesses of a diversified nature. • Help the county maintain a superior public-school system. • Support the continuing efforts to maintain, train, and attract a
diverse workforce. • Study the feasibility of incorporating the Queen Anne’s County
communities that front the Chester River near Chestertown and the Queen Anne’s County residents in the Town of Millington into Kent County. (Increased tax base, increased student population, and facilitate the creation of the bypass (one county issue))
8. Be proactive in the development of areas designated for growth. • Mobilize external resources (federal, state, and philanthropic) to
support the infrastructure development. • Identify potential developers and users.
EDC_Strategic Plan 2017 October 6, 2017 Page 17
9. Support the health care industry. • Support existing health care businesses and encourage the
development of new health-related businesses. • Coordinate with Queen Anne’s County for service to the northern
areas of the county.
10. Identify the town growth areas for economic development. • Use the growth area maps to promote commercial and
manufacturing development using “Smart Growth” around the towns.
11. Support development on US Route 301 Corridor and the Worton Industrial Area.
• Assist the Town of Millington with the annexation of properties on US Route 301 and with the expansion of the Millington sewer and water systems.
• Investigate other potential sites for business parks and assess the options available to provide funding for infrastructure improvements.
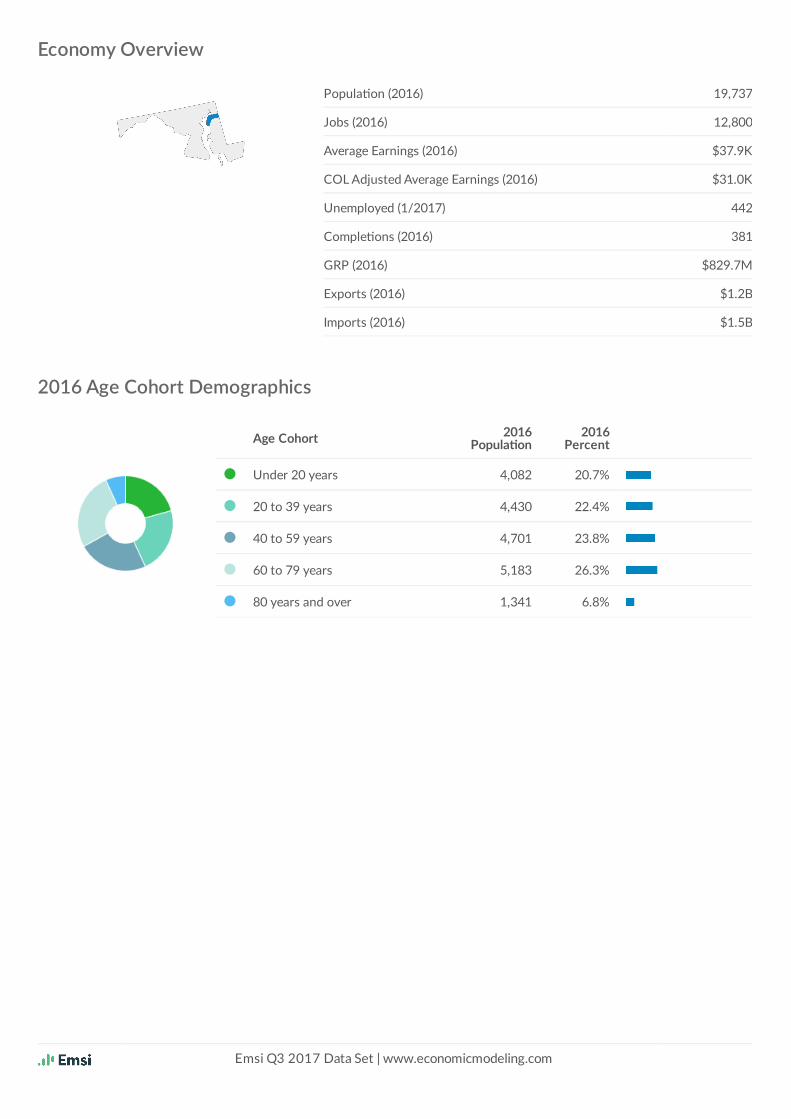
Economy Overview
2016 Age Cohort Demographics
Popula on (2016) 19,737
Jobs (2016) 12,800
Average Earnings (2016) $37.9K
COL Adjusted Average Earnings (2016) $31.0K
Unemployed (1/2017) 442
Comple ons (2016) 381
GRP (2016) $829.7M
Exports (2016) $1.2B
Imports (2016) $1.5B
Age Cohort 2016Popula on
2016Percent
A Under 20 years 4,082 20.7%
A 20 to 39 years 4,430 22.4%
A 40 to 59 years 4,701 23.8%
A 60 to 79 years 5,183 26.3%
A 80 years and over 1,341 6.8%
Emsi Q3 2017 Data Set | www.economicmodeling.com
2016 Educa onal A ainment
Educa on Level 2016Popula on
2016Percent
A Less Than 9th Grade 494 3.5%
A 9th Grade to 12th Grade 1,423 10.0%
A High School Diploma 4,578 32.3%
A Some College 2,523 17.8%
A Associate's Degree 808 5.7%
A Bachelor's Degree 2,461 17.4%
A Graduate Degree and Higher 1,882 13.3%
Emsi Q3 2017 Data Set | www.economicmodeling.com
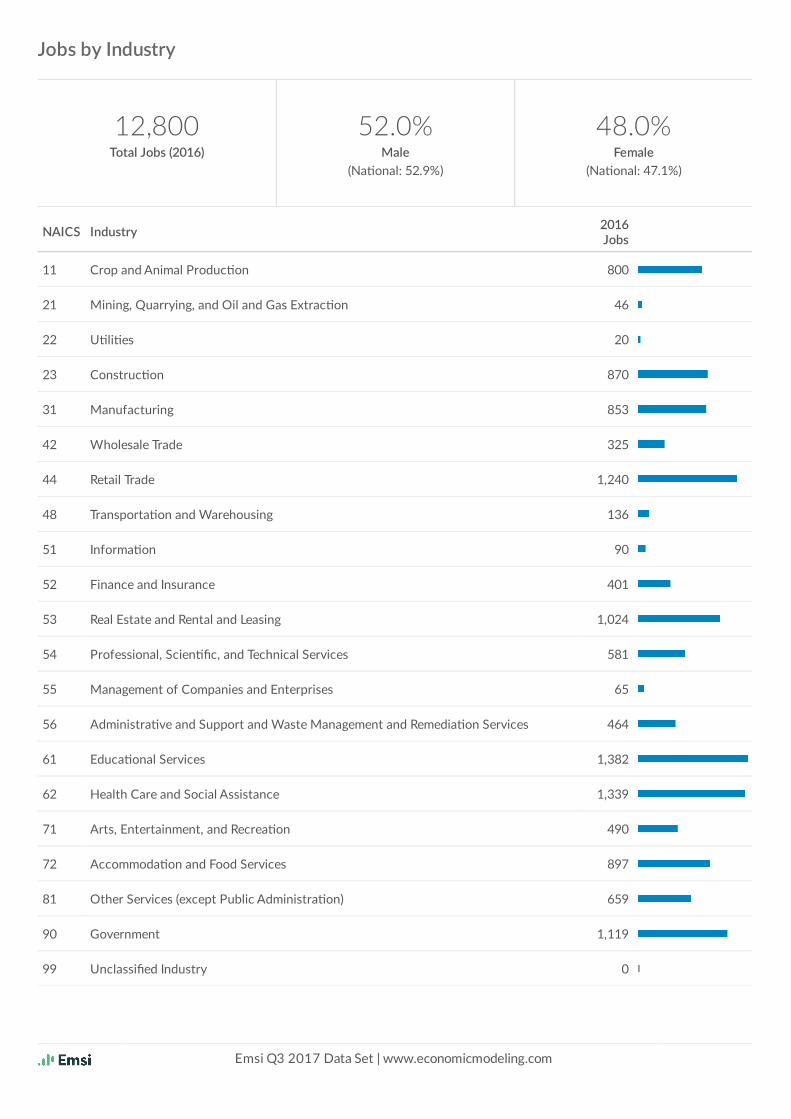
Jobs by Industry
12,800 52.0% 48.0%Total Jobs (2016) Male Female
(Na onal: 52.9%) (Na onal: 47.1%)
NAICS Industry 2016Jobs
11 Crop and Animal Produc on 800
21 Mining, Quarrying, and Oil and Gas Extrac on 46
22 U li es 20
23 Construc on 870
31 Manufacturing 853
42 Wholesale Trade 325
44 Retail Trade 1,240
48 Transporta on and Warehousing 136
51 Informa on 90
52 Finance and Insurance 401
53 Real Estate and Rental and Leasing 1,024
54 Professional, Scien fic, and Technical Services 581
55 Management of Companies and Enterprises 65
56 Administra ve and Support and Waste Management and Remedia on Services 464
61 Educa onal Services 1,382
62 Health Care and Social Assistance 1,339
71 Arts, Entertainment, and Recrea on 490
72 Accommoda on and Food Services 897
81 Other Services (except Public Administra on) 659
90 Government 1,119
99 Unclassified Industry 0
Emsi Q3 2017 Data Set | www.economicmodeling.com

Average Earnings by Industry
$37.9KAvg. Earnings (2016)68% of Na on Avg.
NAICS IndustryAvg.
Earnings(2016)
11 Crop and Animal Produc on $31,856
21 Mining, Quarrying, and Oil and Gas Extrac on $4,595
22 U li es $91,401
23 Construc on $43,604
31 Manufacturing $60,138
42 Wholesale Trade $63,373
44 Retail Trade $26,158
48 Transporta on and Warehousing $42,034
51 Informa on $36,034
52 Finance and Insurance $43,950
53 Real Estate and Rental and Leasing $27,221
54 Professional, Scien fic, and Technical Services $46,046
55 Management of Companies and Enterprises $172,687
56 Administra ve and Support and Waste Management and Remedia on Services $27,817
61 Educa onal Services $32,571
62 Health Care and Social Assistance $40,866
71 Arts, Entertainment, and Recrea on $25,854
72 Accommoda on and Food Services $19,813
81 Other Services (except Public Administra on) $23,200
90 Government $57,246
99 Unclassified Industry $0
Emsi Q3 2017 Data Set | www.economicmodeling.com
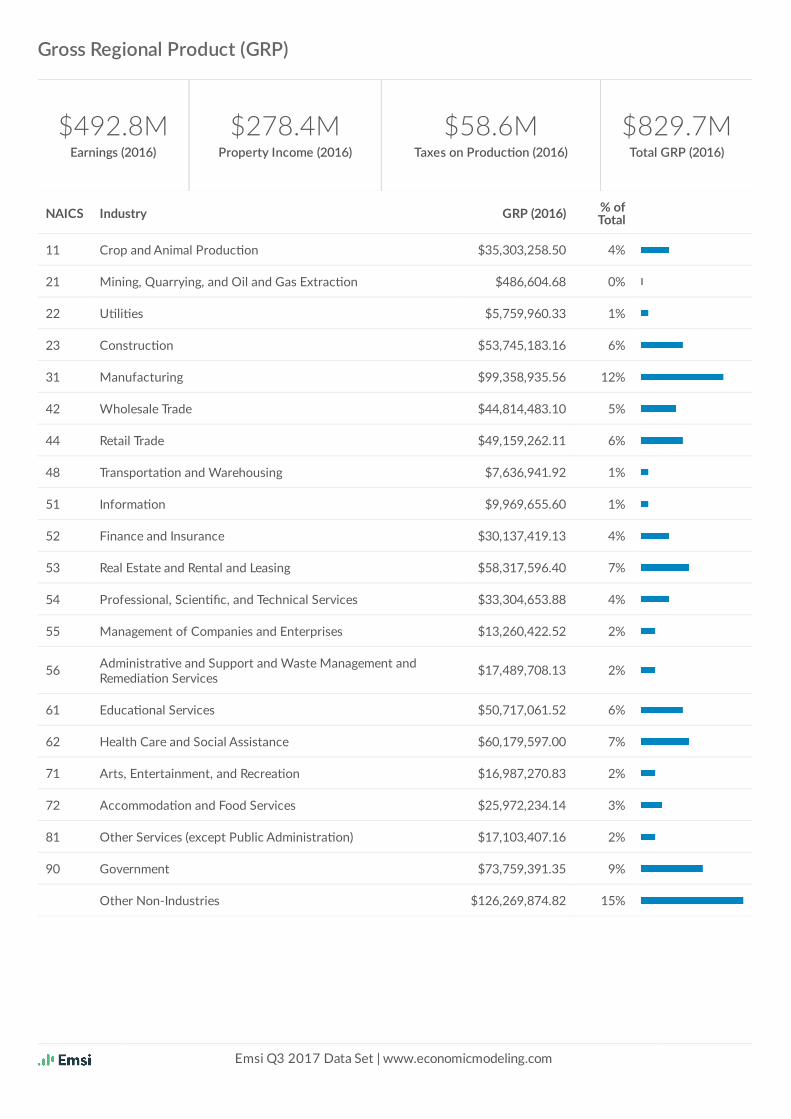
Gross Regional Product (GRP)
$492.8MEarnings (2016)
$278.4MProperty Income (2016)
$58.6MTaxes on Produc on (2016)
$829.7MTotal GRP (2016)
NAICS Industry GRP (2016) % ofTotal
11 Crop and Animal Produc on $35,303,258.50 4%
21 Mining, Quarrying, and Oil and Gas Extrac on $486,604.68 0%
22 U li es $5,759,960.33 1%
23 Construc on $53,745,183.16 6%
31 Manufacturing $99,358,935.56 12%
42 Wholesale Trade $44,814,483.10 5%
44 Retail Trade $49,159,262.11 6%
48 Transporta on and Warehousing $7,636,941.92 1%
51 Informa on $9,969,655.60 1%
52 Finance and Insurance $30,137,419.13 4%
53 Real Estate and Rental and Leasing $58,317,596.40 7%
54 Professional, Scien fic, and Technical Services $33,304,653.88 4%
55 Management of Companies and Enterprises $13,260,422.52 2%
56 Administra ve and Support and Waste Management andRemedia on Services $17,489,708.13 2%
61 Educa onal Services $50,717,061.52 6%
62 Health Care and Social Assistance $60,179,597.00 7%
71 Arts, Entertainment, and Recrea on $16,987,270.83 2%
72 Accommoda on and Food Services $25,972,234.14 3%
81 Other Services (except Public Administra on) $17,103,407.16 2%
90 Government $73,759,391.35 9%
Other Non-Industries $126,269,874.82 15%
Emsi Q3 2017 Data Set | www.economicmodeling.com
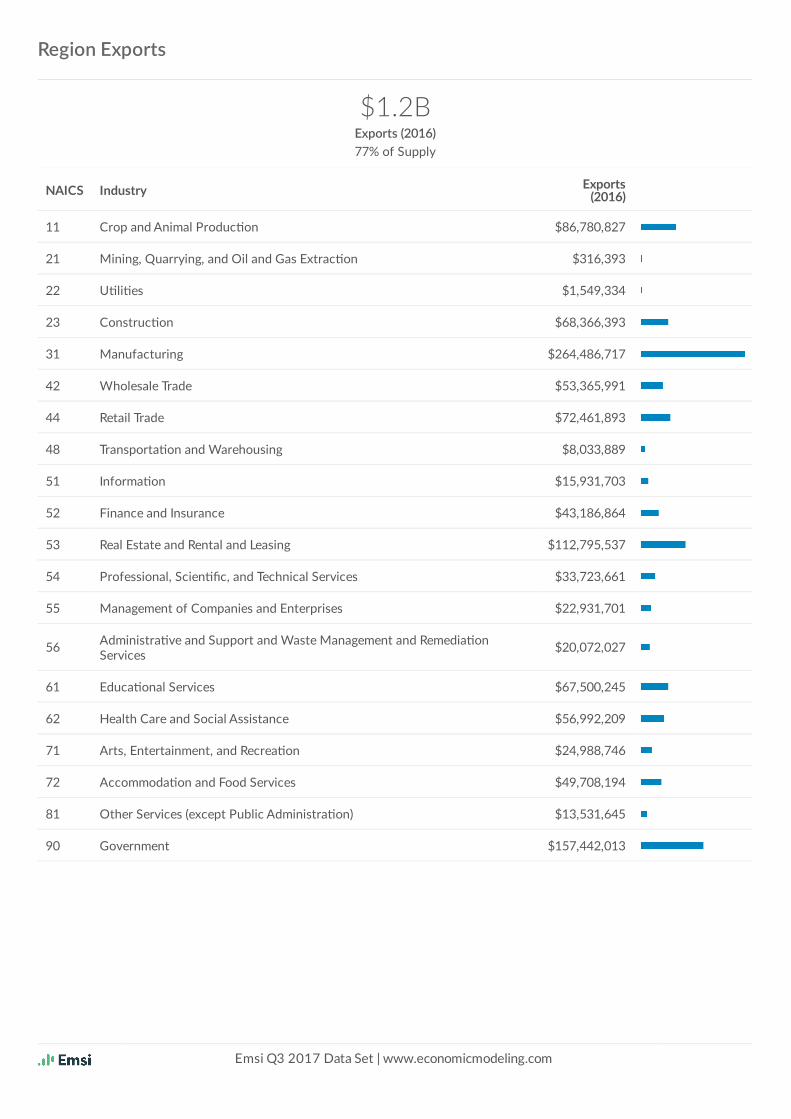
Region Exports
$1.2BExports (2016)77% of Supply
NAICS Industry Exports(2016)
11 Crop and Animal Produc on $86,780,827
21 Mining, Quarrying, and Oil and Gas Extrac on $316,393
22 U li es $1,549,334
23 Construc on $68,366,393
31 Manufacturing $264,486,717
42 Wholesale Trade $53,365,991
44 Retail Trade $72,461,893
48 Transporta on and Warehousing $8,033,889
51 Informa on $15,931,703
52 Finance and Insurance $43,186,864
53 Real Estate and Rental and Leasing $112,795,537
54 Professional, Scien fic, and Technical Services $33,723,661
55 Management of Companies and Enterprises $22,931,701
56 Administra ve and Support and Waste Management and Remedia onServices $20,072,027
61 Educa onal Services $67,500,245
62 Health Care and Social Assistance $56,992,209
71 Arts, Entertainment, and Recrea on $24,988,746
72 Accommoda on and Food Services $49,708,194
81 Other Services (except Public Administra on) $13,531,645
90 Government $157,442,013
Emsi Q3 2017 Data Set | www.economicmodeling.com
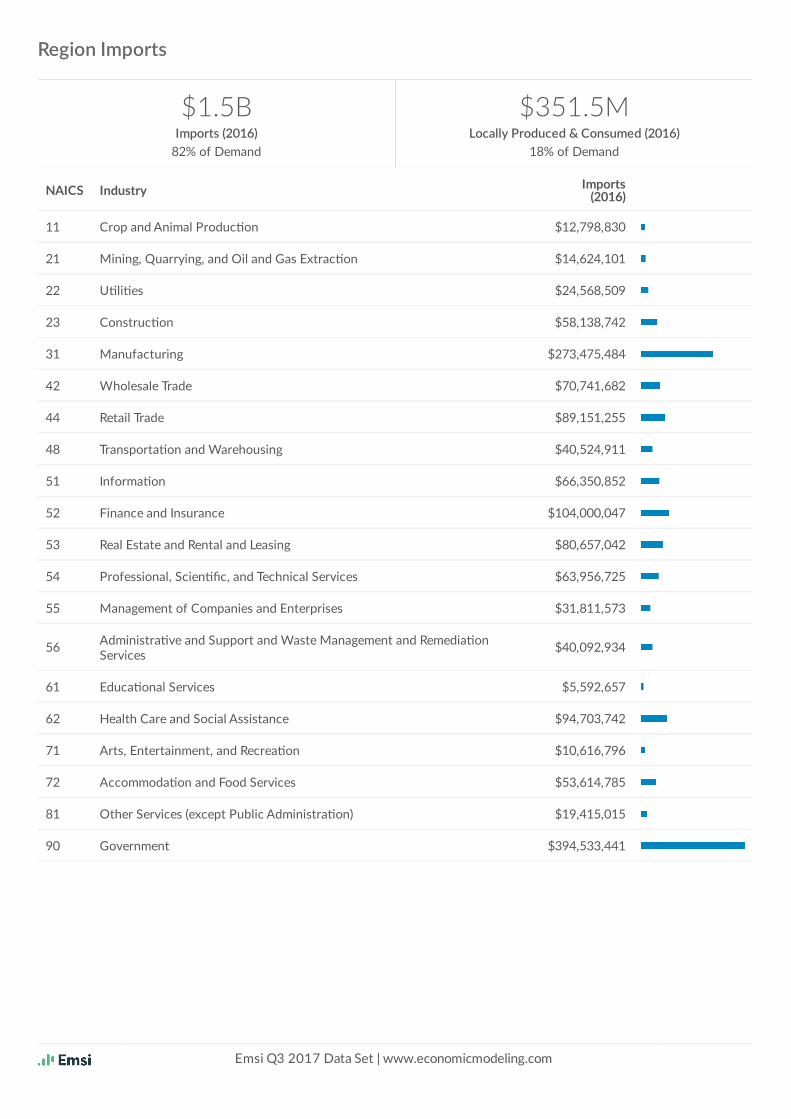
Region Imports
$1.5BImports (2016)
82% of Demand
$351.5MLocally Produced & Consumed (2016)
18% of Demand
NAICS Industry Imports(2016)
11 Crop and Animal Produc on $12,798,830
21 Mining, Quarrying, and Oil and Gas Extrac on $14,624,101
22 U li es $24,568,509
23 Construc on $58,138,742
31 Manufacturing $273,475,484
42 Wholesale Trade $70,741,682
44 Retail Trade $89,151,255
48 Transporta on and Warehousing $40,524,911
51 Informa on $66,350,852
52 Finance and Insurance $104,000,047
53 Real Estate and Rental and Leasing $80,657,042
54 Professional, Scien fic, and Technical Services $63,956,725
55 Management of Companies and Enterprises $31,811,573
56 Administra ve and Support and Waste Management and Remedia onServices $40,092,934
61 Educa onal Services $5,592,657
62 Health Care and Social Assistance $94,703,742
71 Arts, Entertainment, and Recrea on $10,616,796
72 Accommoda on and Food Services $53,614,785
81 Other Services (except Public Administra on) $19,415,015
90 Government $394,533,441
Emsi Q3 2017 Data Set | www.economicmodeling.com

Industry Group Jobs and Earnings Comparison
Group 2015 Jobs 2016 Jobs Earnings PerWorker
Payrolled BusinessLoca ons
Health Care and Social Assistance 1,437 1,339 $40,866 79
Educa onal Services 1,368 1,382 $32,571 14
Retail Trade 1,279 1,240 $26,158 85
Government 1,093 1,119 $57,246 37
Accommoda on and Food Services 905 897 $19,813 72
Manufacturing 857 853 $60,138 24
Construc on 857 870 $43,604 76
Crop and Animal Produc on 808 800 $31,856 32
Wholesale Trade 351 325 $63,373 37
Emsi Q3 2017 Data Set | www.economicmodeling.com

Industry Group Growth Comparison
Group 2015 Jobs 2016 Jobs Change % Change
Government 1,093 1,119 25 2%
Construc on 857 870 13 1%
Educa onal Services 1,368 1,382 13 1%
Manufacturing 857 853 -5 -1%
Accommoda on and Food Services 905 897 -8 -1%
Crop and Animal Produc on 808 800 -8 -1%
Retail Trade 1,279 1,240 -39 -3%
Health Care and Social Assistance 1,437 1,339 -98 -7%
Wholesale Trade 351 325 -26 -7%
Emsi Q3 2017 Data Set | www.economicmodeling.com