Embed Size (px)
Citation preview

Economic Development PrograraItalian ProjectC/55-8
(Rome, 24 February 1955)
ON THE ISTHODS OF INVESTIGATION OFFACTOR PROPORTIONS
Richard S. Eckaus
Center for International StudiesMassachusetts Institute of Technology
Cambridge, MassachusettsApril 12, 1955
ON THE METHODS OF INVESTIGATION OF FACTOR PROPORTIONS
For the comparison of technologies it is necessary to measure the
proportions in which productive factors are used. Although it is possible
to make use of the ideas of both process analysis and input-output analysis
in this task of measurement, neither of these approaches would be adequate
in themselves. Process analysis though more general than input-output
techniques has, as yet, a range of interests which are too limited, not
considering, for example, all factor inputs or alternative time patterns
of depreciation and maintenance. The input-output approach on the other
hand may be quite uninformative about factor inputs as it measures inter-
industry flows which are a function of both the cyclical and secular move-
ments in an economy and the organization of industry. For example, in the
Italian input-output table for 1950 it appears that the only sectors which
use industrial machinery (motors, power equipment, machine tools, paper and
textile machinery, pumps, ovens, etc.) are the wood, metallurgy and mechani-
cal products industries.
FPr the study of factor proportions three techniques of research seem
to be available and will be elaborated here. The first, which may be
called for brevity the "plant analysis" method, involves abstracting from
plans for new investment the amounts of each type of factor of production
necessary for the expansion of output. The second method, based on clas-
sifications provided by process analysis, requires sampling of firms to

2
determine the combinations of factors actually used to perform certain
standardized "tasks." The third approach, "factor inventories;" would
attempt to provide for existing plants the information which the invest-
ment analysis provides for new expansions.
These approaches to the factor proportions study are not necessarily
logically separate, nor should they always be completely different in
application. The great advantage of process analysis in precise identi-
fication of outputs can compensate for the weakness of plant analysis
where multi-product plants are involved. The advantage of plant analysis
in inclusion of all contributing inputs can be important when using the
process analysis approach where it is difficult to isolate the contributions
of all inputs. Thus, it may be important in particular cases to have in
mind a method combining both plant and process analysis. These points
may be seen more easily, perhaps, after a discussion of the separate
methods.
I . Plant Analysis
To my knowledge, the best examples of the application of this method
are the estimates of capital coefficients by the Office of the Chief Econo-
mist of the Bureau of Mines. The information on new investments used by
this group was taken from records of plants built directly with Government
funds or with Government loans or applying for accelerated amortization
privileges. The research was centered on mineral extraction and processing
and some metal processing industries.
For each "product" the amounts of each type of input necessary to ex-
pand capacity by one unit were computed in the Bureau of Mines studies.
The capital coefficients resulting from this approach are only one of the

3
items of information desired for the factor proportions study. A brief
review of the problems involved in the approach will be helpful, however,
as the same problems would arise in a factor proportions study and the
procedures may be evaluated in terms of the requirements of the factor
proportions study.
1. Definition of Product
Products were defined in the Bureau of Mines studies as the
output of plants. This was feasible for the particular groups
of industries in which the Bureau of Mines was interested since,
with some exceptions, each plant produces a single product or a
group of products very closely related in terms of their end
uses and productive requirements .
In those cases where the individual plant produced more than
one product the simple plant analysis approach required modifi-
cation. The economists of the Bureau of Mines were often able
to use a technique for mak ng produced outputs physically iden-
tical by means of an empirically derived relation. This was done
for nonferrous metal rolling in which the major differences in roll-
ing copper and aluminum on the same equipment is in speed of rolling
and thus the time requirements of output of each product . Similar
situations arise in more varied manufactures. For example, it is
comaon to find the same plant producing electrical motors, genera-
tors and transformers using for each product the same stamping and
winding machines, assembly space, stock room and shipping facilities,
etc. It might be possible to derive relations which permit one to

4
compute all outputs in terms of one product (e.g., 1 generator .
(1.1) motor and I transformer w .9 motor) but such relations, if
they could be dirived empirically, would require a process analysis.
Such analysis would determine the proportions in which jointly used
processes were employed for each product.
The plant analysis approach may conceal differences in technology
between plants, especially when several products are produced in the
same plant, unless the factors of production are assigned to each
product in some way. It is possible, for example, for the same total
amounts of factors to be organized differently in two plants which
produce the same set of outputs in equal amounts. It may be very
difficult, however, to allocate specific machines to particular pro-
ducts from the data given in a plan of investment, and, thus, for
example, to be able to tell what proportion of an overhead crane is
necessary for moving motor parts or generator parts. This is again
a case where it would be desirable to combine the ideas of process
analysis with analysis of investment plans.
2. Measurement of the Expansion of Capacity
The ideal case for the use of the plant analysis approach is that
in which all branches of a plant are each expanded in proportions
just adequate for the same over!ll increase in capacity, i .e., the case
of a "balanced expansion." The Bureau of Mines found a number of cases
which seemed to them to represent balanced expansions and for the most
part limited their analyses to these instances. This was necessary be-
cause they did not intend to look into the separate technical processes

5
embodied in a plant and thus would have no way of measuring the in-
creased component of capacity which an "unbalance' expansion created.
In several instances, however, when using the data of unbalanced ex-
pansions and in investigating the sources of variability in capital
coefficients, the Bureau of Mines analyst did investigate the separate
productive processes contained in a plant.
Adjoining the ideas of process analysis to plant analysis can
holp, therefore, in utilizing information on unbalanced expansions.
The information that a single additional press costing so much money,
needing so much labor to install and operate, etc., should be utilized,
if possible, in an area where data is so scarce, even if this additional
press represents breaking a bottleneck in total output so that it is
impossible to ascribe the component of increased final capacity. This
type information can only be used if a process classification is used
in the analysis of new investments.
It is difficult to define empirically as well as theoretically
the capacity ceiling of a plant. Various conventions were used by
the economists of the Bureau of Mines regarding the number of shifts,
supply of labor, materials and so on, but these were only devices,
perhaps necessary, for dodging the problem.
3. Derivation of Capital Coefficients
The objective of the Bureau of Mines studies was to find a set
of capital coefficients which could be used in an input-output model,
which meant that economies of scale, itwough investigated briefly,
were not given much attention. The major emphasis was on determining

6
a "representative" capital coefficient. From descriptions of
the analyses it seems that a kind of process classification
was often used as a basis for arriving at a final judgment as
to a representative figure.
The form which summarizes the approach of the Bureau of Mines to
estimating capital coefficients is shown in Table I, although in some
cases this form was elaborated by allocating equipment to particular
processes.
Table I
Plant No. I Plant No. 2 IndustryCapacity: x tons Capacity: y tons ..... Coefficients
Dollars perDollar Dollars tonAmounts Per ton
Equipment Expenditure- Total
Type 1" 2"f 3
Construction Materiale
Labor - Total
Construction laborEquipment InstallationlaborLand Improvement aniscellaneous
A capital-coefficients analysis for an input-output table is oriented
differently from a factor proportions study which requires more information
and operates differently with the data. The purpose of a factor proportions

7
inquiry, rather than being the derivation of a "representative" coef-
ficient, is to establish the range of variations in the coefficients and
the sources of these variations. Thus, any variations with respect to
scale of output, for example, rather than being averaged out of existence,
would be shown explicitly in the results of a factor proportions study.
The factor proportions study is also interested in the amo"2ts of
other factors, each type of labor, material and energy, which are needed
for a particular output, as well as the amount of capital required to
create the capacity. If the proportions of these additional inputs can
be varied with, or independently of, capital, such variation will be
important for a factor proportions inquiry.
Table II represents the form which would, I believe, be close to
the ideal achievement in using records of investment plans as a basis for
the factor proportions study.

PLMN
I. Plant - Total
A. Equipment - Total
1.2.
Type No. 1Type No. 2
B. Construction Materials
1.2.
C. Labor - Total
1.2.
Construction LaborInstallation LaborLeadu Tnpvewntw
Table II
Process No. 1 Pizless No.2 Product
z tons -y Uns No. 1
No. of Phys-ical Units
moneyValue
Installation +Construction Tine
I. U U -~ 9
ForeseeableLife andDepreciation
per Year
II. Labor - Total Man-Hours Wae Training PeriodBill _ _ _ _ _ _ _ _ _ _ _ _ _ _
A. Directly Involved in Processes- Total1. Skill No. 12. Skill No. 2
B. Indirect Labor - Total
1.2.3.4.
MaintenanceMaterials HandlingWarehousingManagerial
Go
i U I

Table II (continued)
iATERIALS
Process No. 1- x tons
Volume Cost
III. Materials - Total
A. Directly Used in Processes - Total
1. Type No. 1
2. Type No. 2
B. indirectly Used - Total
1. Type No. 12. Type No. 2
ENERGY Units Value
IV. Energy
A. Directly Weed
1. Equipment Type No. 12.
B. Indirectly Used
1. Equipment Type No. 12.
Process No 2- y tons
ProdueNo
I I
10
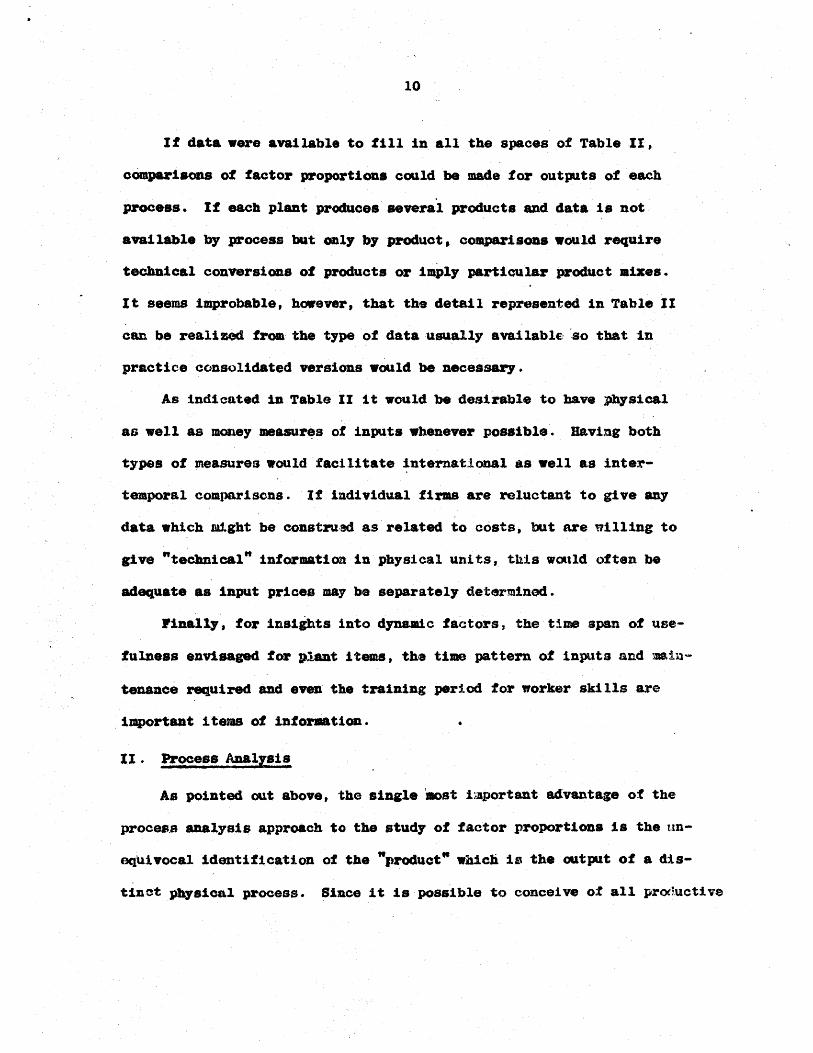
If data were available to fill in all the spaces of Table 11,
comparisons of factor proportions could be made for outputs of each
process. If each plant produces several products and data is not
available by process but only by product, comparisons would require
technical conversions of products or imply particular product mizes.
It seems improbable, however, that the detail represented in Table 1
can be realized from the type of data usually available so that in
practice consolidated versions would be necessary.
As indicated in Table II it would be desirable to have physical
as well as money measures of inputs whenever possible. Having both
types of measures would facilitate internatlonal as well as inter-
temporal comparisons. If individual firms are reluctant to give any
data which might be construed as related to costs, but are willing to
give "technical" information in physical units, this would often be
adequate as input prices may be separately determined.
Finally, for insights into dynamic factors, the time span of use-
fulness envisaged for plant items, the time pattern of inputs and main-
tenance required and even the training period for worker skills are
important items of information.
II. Process Analysis
As pointed out above, the single most iaportant advantage of the
process analysis approach to the study of factor proportions is the tin-
eqpUivocal identification of the "product" which is the output of a dis-
tinct physical process. Since it is possible to conceive of all productive
11
activity as divided into separate activities whose inputs could be
identified and compared, the process analysis approach is logically
the most satisfactory.
The process analysis approach could provide moreover the basis
for a comparison of factor proportions by final products and, thus,
for an independent check of factor proportions computed by the plant
analysis method. This could be achieved by determining the appro-
priate physical processes and levels of activity necessary for the
output of a particular final product and aggregating their factor inputs.
The procedure just described is, in fact, that actually used in modern
engineering practice in plant and equipment design and layout. The en-
gineering studies made in following the procedure form the basis for
the investment plan described in the previous section, which illustrates
again the close logical connection of the plant analysis approach and
the process analysis approach to measuring factor proportions.
The disadvantage of the process analysis approach, however, stem-
ming from the kinds of information which would be generally available,
I believe, occurs precisely where the plant analysis method is strong.
The information for the process analysis approach must come from the
records of inputs to particular processes and these records, because of
the purposes for which they are kept, will seldom be sufficiently de-
tailed and comprehensive of the inputs involved in a process. This
point may be seen more clearly, I believe, from a concrete example.
In Table III is shown the form which illustrates for a single process
the use of the process analysis classification in the metalworking
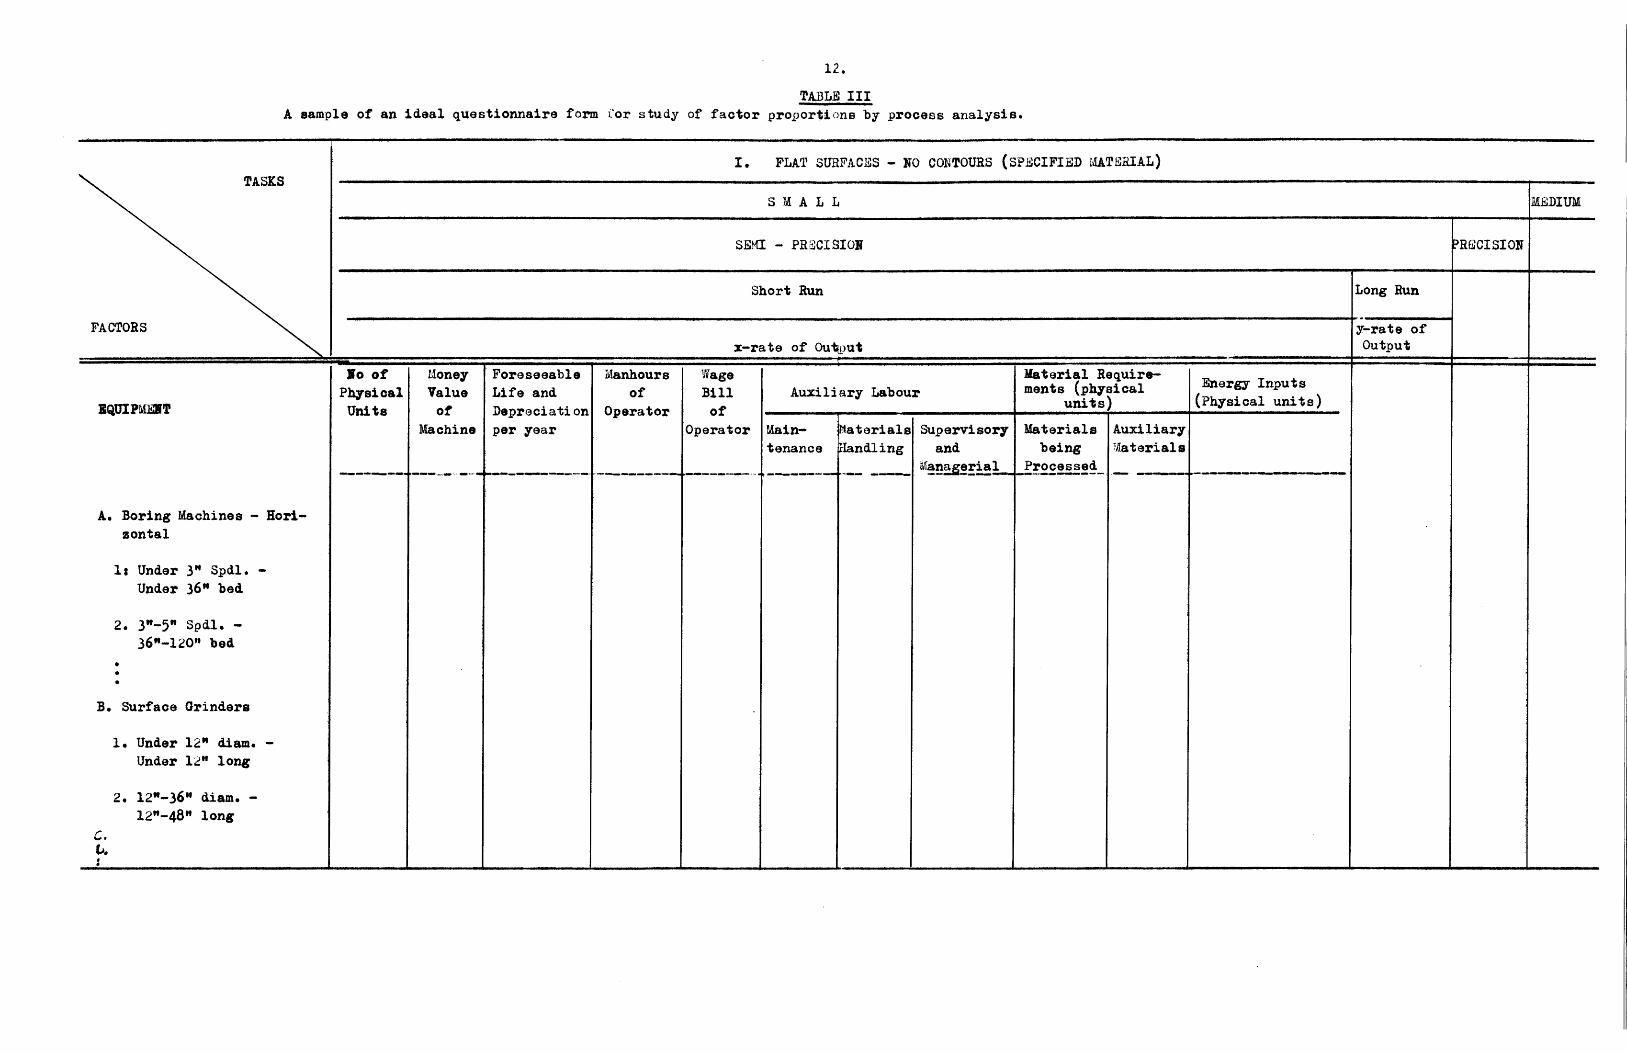
12.
TABLE III
A sample of an ideal questionnaire form for study of factor proportions by process analysis.
TI. FLAT SURFACES - No CONTOURS (SPECIFIED MATSRIAL)TASKS
FACTORS
S M A L L MDIUM
SEMI - PR@CISION RSCISION
Short Run
x-rate of Output
Long Run
y-rate ofOutput
EQUIPMENT
A. Boring Machines -
zontal
1: Under 3" Spdl.Under 36" bed
2. 3"-5" Spdl. -
36"-120" bed
B. Surface Grinders
1. Under 12" diam.
Under 12" long
2. 12"-36" diam. -12"-48" long
Hori-
so ofPhysicalUnits
MoneyValueof
Machine
Foreseeable
Life and
Depreciati on
per year
Manhoursof
Operator
WageBill
ofOperator
Auxiliary Labour I
Main-tenance
MaterialsHandling
Supervisory
andManagerial
Material Require-ments (physical
units)
Materialsbeing
Processed
Energy Inputs(Physical units)
AuxiliaryUfaterials
C. _ _ _ _ _ _ _ _ _ _ _ _ _ _ _ _ _ __ _ _ _ I_ _ _ _ _ _ _ _ _ _ _ _ _ _ _ _ _ _ _ _ _ _ _ _ _ _ _ _ _ _ _ I___
------ --,---I- ----------- ---------------- _ -j-

I IV
industry. A complete study would require a number of such tables for
the different processes intended to be representative of a sample of
metalworking technology.
The data required in Table III, however, is much more detailed
than that which would generally be available, I believe. It is nite
common in the States and, I have been told, in Italy for firms to have
information to fill in Sections I and IV, but ordinarily only part of
Sections II and III could be completed. When complete flow charts of
production and estimates of overhead costs exist, almost the entire
chart could be completed. Knowledge of the time patterns of capital
inputs, maintenance and depreciation would, ordinarily, still be lacking.
Many firms, however, do not attempt to make allocations to indivi-
dual processes of auxiliary labor, materials and overhead costs, although
they do record in detail the man-hours of labor on each machine tool and
the material requirements for each process for payroll and stock control
purposes. Lack of data on indirect inputs can easily make it impossible
to determine factor inputs accurately. For example, suppose that one
firm requires its machine operators to do more material transporting than
another firm which has a highly organized materials handling organization.
In the first firm it would appear that more man-hours of machines and
machine operators were used for the specified output than in the second
firm. Thus, the absence of separate information on the materials-
handling labor attributable to the process, would inv&lidate comparisons
of "direct" labor inputs. There are other and more difficult problems
14
which could be cited. Suppose that an essential difference between pro-
ceases is the amount of floor space required. This difference may be
difficult to isolate when a single factory houses a number of processes
and it Is necessary to attribute overhead costs of space to each pre-
cisely.
Table III can be consolidated, of course, and with the data avil-
able, say, for the total number of materials-handling personnel in a plant,
still permit some observations about the sources of whatever differences
emerge in the data.
Price and wage data would be necessary to supplement the information
in Table III to provide insight into the sources of whatever variations
might be discovered. Machine tool catalogues and equipment dealers would
be a convenient source of information. Wage data is generally available,
as are quotations for standardized commodities. If prices are often
modified by secret rebates and commissions, the price information may be-
come a major difficulty.
III. Factor Inventories
The method of inventorying a plant to determine the amounts and types
of factors available would attempt to provide for an existing establishment
the information provided by the analysis of new investment plans. This
technique would, I believe, often require actually going through a plant
and listing equipment because the equipment inventories kept by firms may not
indicate what units are active or inactive. Employment and other factor data
could, if firms were willing, generally be supplied from central sources in
the firm. Prices of equipment and wage data would also be required as in

the other methods. No other new problems would arise, I believe.
IV. Further Problems in Factor Proportions Studies
A The Dynamic Aspects of Particular Technologies
Although the paper, "Notes on Optimal Allocation of Invest-
ment in Alternative Processes," only broached the subject of
dynamic problems, it has been suggestive of the additional types
of information necessary in order .to more fully understand the
factor proportions problem. It seems clear that the time pattern
of maintenance and depreciation of plant and equipment is es-
sential knowledge, and, also, the time pattern of inputs to pro-
duce capital (and train labor). These are very difficult kinds
of information to obtain, I believe. The accounting conventions
for depreciation will often be useless and the maintenance re-
quirements difficult to isolate.
It might be possible to make useful inferences for the economy
as a whole, however, from the data on the age distribution of plant
and equipment by industry and type and information on maintenance
practices so this type of data is certainly worth collecting when
possible.
B Noneconomic Influences on Technological Choice
This type of influence may certainly be important and its in-
vestigation should not be neglected though it may be necessary to
approach circumspectly and without attempt at quantification. Cer-
tainly managers should be asked if they would explain the background
for their choice of a particular technology. It would also be

IG
useful to list the machines by country of origin and to compare
prices of domestic and imported equipment.
C The Price of Capital
Thus far, only the purchasing price of plant and equipment
has been mertioned in connection with the price of capital. The
cost of fuds which can be used to buy plant, equipment and in-
ventory is the effective rate of interest. The effective rate of
interest in an elusive fact, however, which even the actual terms
of a !oan contract may not make explicit wren undistributed pro-
fiti are the sources of investment funds.
Data on the various market rates of interect and information
ei the availab ity of capital would have some limited usefulness,
I believe. One way of seeing the effects of different rates of in-
terest would be by means of comparisons between facto.- proportions
in enterprises in which the effective rate of interest tvight be
inferred with some accuracy, e.g., plants built with loan funds
from Government or semi-public agencies with fixed rates of t.nterest
and factor proportions in enterprises built with funds from pri-yate
sources.
V Conclusions
The analysis of investment plans or factor inventories and the use
of process analysis classifications provide two different approaches to
the measurement of factor proportions. Although logically closely re-
lated these methods are practically different because of the nature of
tba data on which they are based. It would be most desirable if both
17
methods could be used in a number of cases .in the manrer uggsted in
Section TI it is inevitable tbit errors arIse in usng eaci method
whose significance cannot be appr-eciated if it is neesay to rely
on only oie of the approaches. Use of both methada, howevar, il..
provide, analogously to the two measure -of nationial. i ,n im-
portant check on results.