Embed Size (px)
Citation preview
NIST Special Publication 1260
Economic Decision Guide Software (EDGe$) Online Tutorial:
Wildland-Urban Interface (WUI)
Case Study
Jennifer F. Helgeson Peter J. Zhang
This publication is available free of charge from: https://doi.org/10.6028/NIST.SP.1260
NIST Special Publication 1260
Economic Decision Guide Software (EDGe$) Online Tutorial:
Wildland-Urban Interface (WUI)
Case Study
Jennifer F. Helgeson Applied Economics Office
Engineering Laboratory
Peter J. Zhang College of Letters and Sciences
University of California, Berkeley
This publication is available free of charge from: https://doi.org/10.6028/NIST.SP.1260
September 2020
U.S. Department of Commerce Wilbur L. Ross, Jr., Secretary
National Institute of Standards and Technology
Walter Copan, NIST Director and Undersecretary of Commerce for Standards and Technology
Certain commercial entities, equipment, or materials may be identified in this
document in order to describe an experimental procedure or concept adequately. Such identification is not intended to imply recommendation or endorsement by the National Institute of Standards and Technology, nor is it intended to imply that the entities, materials, or equipment are necessarily the best available for the purpose.
National Institute of Standards and Technology Special Publication 1260 Natl. Inst. Stand. Technol. Spec. Publ. 1260, 44 pages (September 2020)
CODEN: NSPUE2
This publication is available free of charge from: https://doi.org/10.6028/NIST.SP.1260
i
This publication is available free of charge from: https://doi.org/10.6028/N
IST.SP.1260
Abstract
This report introduces features of the Economic Decision Guide Software (EDGe$) Online Tool V 1.0 and presents a fictitious case study of wildfire planning in the wildland-urban interface (WUI) based on publicly available real-world data. The case study highlights the competing interests of two neighboring communities by evaluating the same project alternatives from the point of view of each community. The WUI case study also demonstrates the importance of considering co-benefits and approaches to incorporating non-market valuation. The report presents a walkthrough of EDGe$ Online and closes with a discussion of implications from the presented case study and potential future research.
Key words
Benefit-cost analysis; community resilience; economic analysis; economic decision tool; online application; online app; resilience; resilience dividend; valuation; wildland-urban interface.
ii
This publication is available free of charge from: https://doi.org/10.6028/N
IST.SP.1260
Acknowledgements
The authors wish to thank all those who contributed ideas and suggestions for this report and the survey presented herein. Many thanks to Angelique Bosse (Montgomery Blair High School) and Shariar Vaez-Ghaemi (Montgomery Blair High School) for connecting Peter to the AEO for internship experience. Special appreciation is extended to David Webb (NIST) and Priya Lavappa (NIST) for their continued support of the EDGe$ Online development. Thanks to David Butry (NIST), Shane Crawford (NIST), and Alfredo Roa-Henriquez (NIST/Johns Hopkins) for time spent reviewing this document. Author Information Jennifer F. Helgeson, Ph.D. Research Economist Applied Economics Office Engineering Laboratory National Institute of Standards and Technology 100 Bureau Drive, Mailstop 8603 Gaithersburg, MD 20899-8603 Tel.: 301-975-6133 Email: [email protected] Peter J. Zhang College of Letters and Sciences University of California, Berkeley 120 Sproul Hall, Berkeley, CA 94720-5404 Tel: 240-994-2204 Email: [email protected]
A Note
The fictious case study developed herein is meant to be used to demonstrate the EDGe$ Online Tool capabilities. All data used is publicly available and implies no actual proposals considered by the named parties nor are advocated resilience plan alternatives by the authors of this report.
iii
This publication is available free of charge from: https://doi.org/10.6028/N
IST.SP.1260
Table of Contents
Abstract ............................................................................................................................... i Key words ............................................................................................................................ i Acknowledgements ............................................................................................................. ii A Note ................................................................................................................................. ii
Introduction and Background .....................................................................................1
1.1. EDGe$ Online Case Study .......................................................................................1 1.2. Economic Decision Guide Software (EDGe$) Online Tool.......................................1 Presidential Library WUI Case Study Overview ........................................................2
Alternatives: Descriptions ............................................................................................3 3.1. Option 1: Upgrade the Current Library .....................................................................3 3.2. Option 2: Construct a New Library ...........................................................................3
Assumptions .................................................................................................................4 Data Inputs ...................................................................................................................4 5.1. Cost Data .................................................................................................................4 5.2. Benefit Data .............................................................................................................6 5.3. Externalities .............................................................................................................9 Analysis and EDGe$ Output ........................................................................................9 6.1. POV 1 – Simi Valley ................................................................................................9 6.2. POV 2 – Oxnard ..................................................................................................... 11 6.3. Implications ........................................................................................................... 13
EDGe$ Tool Online Walkthrough .............................................................................. 14 7.1. Registration and Login ........................................................................................... 14 7.2. Start and Open Projects .......................................................................................... 15
7.3. Project Information Page ........................................................................................ 17 7.4. Project Navigation .................................................................................................. 18 7.5. Alternatives Page ................................................................................................... 19
7.6. Page Layout ........................................................................................................... 20 7.6.1. Costs Page ........................................................................................................ 22 7.6.2. Externalities Page ............................................................................................. 23
7.6.3. Benefits Page .................................................................................................... 24 7.6.4. Non-Disaster Related Benefits Page ................................................................. 25
7.7. Fatalities Averted Page ........................................................................................... 26 7.8. Analysis Parameters Page ....................................................................................... 27
iv
This publication is available free of charge from: https://doi.org/10.6028/N
IST.SP.1260
Discussion and Future Research ................................................................................ 28 8.1. Case Study Summary ............................................................................................. 28
8.2. A Note: Benefit Cost Analysis in Context ............................................................... 29 References .......................................................................................................................... 31 Appendix A: Historical Building Evaluation ................................................................... 34
v
This publication is available free of charge from: https://doi.org/10.6028/N
IST.SP.1260
List of Tables
Table 1. Losses to Simi Valley from wildfire damage to the RRPL .......................................2 Table 2. Losses to Oxnard from wildfire damage to the RRPL ..............................................2 Table 3. Costs associated with retrofit for Simi Valley ..........................................................5 Table 4. Oxnard costs associated with new library ................................................................5 Table 5. Simi Valley costs associated with new library .........................................................6 Table 6. Reductions in wildfire losses for retrofit ..................................................................6 Table 7. Simi Valley non-disaster related benefits for retrofit................................................7 Table 8. Reductions in wildfire losses for retrofit ..................................................................7 Table 9. Oxnard non-disaster related benefits for new library ................................................8 Table 10. Simi Valley non-disaster related benefits for new library .......................................9 Table 11. Externalities for Simi Valley and Oxnard ..............................................................9 Table 12. Cost input values for EDGe$ for Simi Valley ........................................................9 Table 13. Wildfire related loss reduction input for EDGe$ for Simi Valley ......................... 10 Table 14. Non-disaster related benefit input for EDGe$ for Simi Valley ............................. 10 Table 15. Externality input for Simi Valley ......................................................................... 10 Table 16. EDGe$ output for Simi Valley ............................................................................ 10 Table 17. Cost input values for EDGe$ for Oxnard ............................................................. 11 Table 18. Wildfire related loss reduction input for EDGe$ for Oxnard ................................ 12 Table 19. Non-disaster related benefit input for EDGe$ for Oxnard .................................... 12 Table 20. Externality input for Oxnard ................................................................................ 12 Table 21. EDGe$ output for Oxnard ................................................................................... 12 Table 22. Assessment of historical value ............................................................................. 34
vi
This publication is available free of charge from: https://doi.org/10.6028/N
IST.SP.1260
List of Figures
Figure 1. EDGe$ home screen, logged out .......................................................................... 14 Figure 2. The Register page ................................................................................................ 15 Figure 3. The Login page .................................................................................................... 15 Figure 4. The EDGe$ home page, logged in ....................................................................... 16 Figure 5. The Open Saved Analysis page ............................................................................ 16 Figure 6. The Open Example Analysis page ........................................................................ 17 Figure 7. The Delete Analysis page ..................................................................................... 17 Figure 8. The Project Information page .............................................................................. 17 Figure 9. An example of the Project Information page ........................................................ 17 Figure 10. An example of a more information button from the Project Information page .... 18 Figure 11. An example of the header .................................................................................. 18 Figure 12. An example of the sidebar ................................................................................. 19 Figure 13. A new Alternatives page .................................................................................... 19 Figure 14. An example of the Alternatives page .................................................................. 19 Figure 15. Returning to an existing alternative .................................................................... 20 Figure 16. A new Costs page as an example ....................................................................... 20 Figure 17. The cost description component from the Costs page ......................................... 21 Figure 18. The associated alternative component from the Costs page ................................ 21 Figure 19. The footer of a new Costs page .......................................................................... 21 Figure 20. The footer of an existing Costs page .................................................................. 21 Figure 21. An example of the Costs page ............................................................................ 22 Figure 22. An example with recurring occurrence of the Costs page ................................... 22 Figure 23. A new Externalities page ................................................................................... 23 Figure 24. An example for the Externalities page ............................................................... 24 Figure 25. A new Benefits page .......................................................................................... 24 Figure 26. An example of the Benefits page ........................................................................ 24 Figure 27. A new Non-Disaster Related Benefits page ........................................................ 25 Figure 28. An example of the Non-Disaster Related Benefits page ...................................... 25 Figure 29. An example of co-costs for the Non-Disaster Related Benefits page ................... 26 Figure 30. The Fatalities Averted page ............................................................................... 26 Figure 31. An example for the Fatalities Averted page ....................................................... 27 Figure 32. The Analysis Parameters page ........................................................................... 27 Figure 33. An example output of the analysis ..................................................................... 27 Figure 34. An example CSV download of the analysis ........................................................ 28
vii
This publication is available free of charge from: https://doi.org/10.6028/N
IST.SP.1260
Glossary
BCA benefit-cost analysis CEA cost-effectiveness analysis CSV comma-separated values EDGe$ Economic Decision Guide Software EIA economic impact analysis FIA financial impact analysis LEED Leadership in Energy and Environmental Design MCA multiple criteria analysis NDRB non-disaster related benefit OMR Operation, Management, and Repair POV point of view RRPL Ronald Reagan Presidential Library RRPFI Ronald Reagan Presidential Foundation and Institute R&R response and recovery WUI wildland-urban interface
1
This publication is available free of charge from: https://doi.org/10.6028/N
IST.SP.1260
Introduction and Background
1.1. EDGe$ Online Case Study
The Economic Decision Guide Software (EDGe$) Online Tool addresses the need for a benefit-cost analysis (BCA) tool that is easily accessible to communities by implementing a systemic methodology for selecting among potential community resilience planning strategies. The software enables community decision-makers to compare relevant costs and benefits of competing investment options versus the status quo. It is designed for practical use in a variety of resilience planning contexts.
This report introduces features of the new EDGe$ Online Tool V 1.0 and presents a fictious case study of two communities’ wildland-urban interface (WUI) resilience planning. The case study highlights the competing interests of two neighboring communities by evaluating the same project alternatives from the point of view of each community. The WUI case study also demonstrates the importance of considering co-benefits and approaches to incorporating non-market valuation. The report presents a walkthrough of using the online tool and closes with a discussion of implications and future research.
1.2. Economic Decision Guide Software (EDGe$) Online Tool The EDGe$ Online Tool V 1.0 provides a standard, economic methodology for comparing investment decision aimed at disaster adaptation, mitigation, and recovery. It supersedes the original EDGe$ Tool, which was an executable software (Helgeson et al., 2017).
The process used in EDGe$ Online is based on NIST’s “Community Resilience Economic Decision Guide for Buildings and Infrastructure Systems” (EDG). The EDG outlines best practices in the economics of community resilience planning (Gilbert et al., 2016). This process has been developed into an ASTM standard practice (ASTM, 2018), which is consistent with the process used in the EDGe$ Online Tool.
The EDGe$ process is meant to be practical, flexible, and transparent. It enables community decision-makers to identify and compare present and future costs and benefits associated with new capital investment versus maintaining the status quo. The tool regards co-benefits as non-disaster related benefits (NDRB) because enhancing resilience on a community scale can create value even if a hazard event does not occur. EDGe$ also encourages consideration of potential co-costs and externalities on other bearers. The approach is adaptable to a wide variety of communities and projects.
The EDGe$ Online Tool is platform-independent and available at https://edges.nist.gov. The web-based app is easy to use and provides a set of built-in case studies. Users can create accounts, save projects, and return to them later to continue working. The tool guides users through each input page and automates the underlying calculation. The analysis results in a clear economic indicator report that can be downloaded and saved by the user.
A walkthrough of the EDGe$ Online Tool is provided in Section 8 of this publication.
2
This publication is available free of charge from: https://doi.org/10.6028/N
IST.SP.1260
Presidential Library WUI Case Study Overview
The fictious case study developed herein is meant to be used to demonstrate the EDGe$ Online Tool capabilities. All data used is publicly available and implies no actual proposals considered by the named parties nor are advocated resilience plan alternatives by the authors of this report.
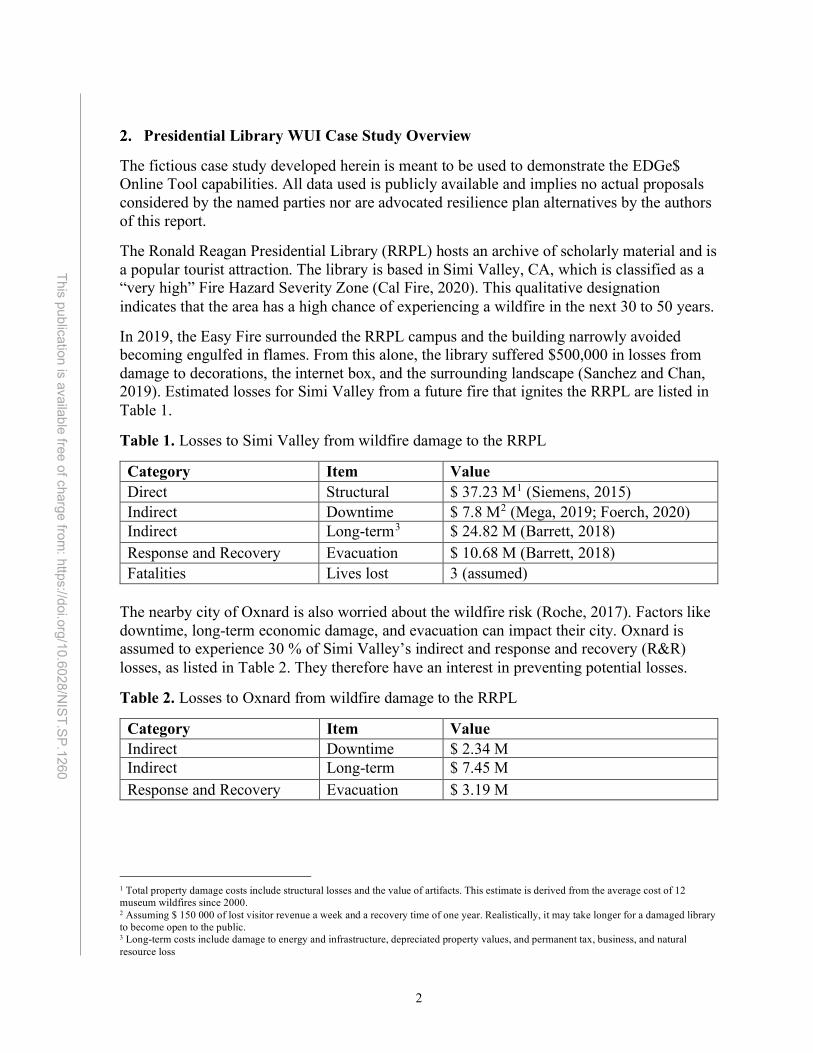
The Ronald Reagan Presidential Library (RRPL) hosts an archive of scholarly material and is a popular tourist attraction. The library is based in Simi Valley, CA, which is classified as a “very high” Fire Hazard Severity Zone (Cal Fire, 2020). This qualitative designation indicates that the area has a high chance of experiencing a wildfire in the next 30 to 50 years.
In 2019, the Easy Fire surrounded the RRPL campus and the building narrowly avoided becoming engulfed in flames. From this alone, the library suffered $500,000 in losses from damage to decorations, the internet box, and the surrounding landscape (Sanchez and Chan, 2019). Estimated losses for Simi Valley from a future fire that ignites the RRPL are listed in Table 1.
Table 1. Losses to Simi Valley from wildfire damage to the RRPL
Category Item Value Direct Structural $ 37.23 M1 (Siemens, 2015) Indirect Downtime $ 7.8 M2 (Mega, 2019; Foerch, 2020) Indirect Long-term3 $ 24.82 M (Barrett, 2018) Response and Recovery Evacuation $ 10.68 M (Barrett, 2018) Fatalities Lives lost 3 (assumed)
The nearby city of Oxnard is also worried about the wildfire risk (Roche, 2017). Factors like downtime, long-term economic damage, and evacuation can impact their city. Oxnard is assumed to experience 30 % of Simi Valley’s indirect and response and recovery (R&R) losses, as listed in Table 2. They therefore have an interest in preventing potential losses.
Table 2. Losses to Oxnard from wildfire damage to the RRPL
Category Item Value Indirect Downtime $ 2.34 M Indirect Long-term $ 7.45 M Response and Recovery Evacuation $ 3.19 M
1 Total property damage costs include structural losses and the value of artifacts. This estimate is derived from the average cost of 12 museum wildfires since 2000. 2 Assuming $ 150 000 of lost visitor revenue a week and a recovery time of one year. Realistically, it may take longer for a damaged library to become open to the public. 3 Long-term costs include damage to energy and infrastructure, depreciated property values, and permanent tax, business, and natural resource loss
3
This publication is available free of charge from: https://doi.org/10.6028/N
IST.SP.1260
After the close call experienced in 2019, Simi Valley and Oxnard drafted plans for mitigating future fire risk. Although they recognized the value of retrofitting the existing building with fire-resistant materials, studies have also shown that the location of a structure may be a more important factor in ignition risk (Syphard et al., 2012). The Ventura County board worked with the Ronald Reagan Presidential Foundation and Institute (RRPFI) to develop two proposals to make the RRPL, and thus the community at-large, more resilient to WUI: 1. Conduct a thorough retrofit with wildfire-resistant materials and green building design; 2. Construct a new, green library in the nearby city of Oxnard.
Simi Valley and Oxnard are each considering the two options mentioned above. Although both benefit from mitigating wildfire losses, the options have significant implications for each community beyond the risk reduction. Considering both points of view can reveal asymmetric benefits and costs, resulting in conflicts of interest. This analysis evaluates the two options from the point of view of each community.
Alternatives: Descriptions
3.1. Option 1: Upgrade the Current Library The Retrofit option would be funded by the city of Simi Valley. The 100-acre (404 686 sq/m) RRPL campus hosts the Reagan Museum and Air Force One Pavilion, spanning 243 000 sq/ft (22 575 sq/m) of building space (Enriquez, 1987). A LEED-certified4 green retrofit would include improved insulation, natural ventilation, waste management, and energy efficient lighting. The wildfire retrofit involves renovations to the rooftop, roof edge, exterior walls, and nearby landscape to make all building elements less vulnerable to ignition. The new rooftop would include wood siding and clay tiles with fiber cement. The roof edge includes replacement vents, gutters, and trim. The doors, windows, siding, and frame of the exterior wall would be replaced. Gravel and bark mulch would be added to the nearby landscape. The plan would be applied to 112 292 sq/ft (10 432 sq/m) of rooftop area, 3 118 feet (950 meters) of roof perimeter, 40 534 sq/ft (3 766 sq/m) of exterior wall area, and 2 178 000 sq/ft (202 343 sq/m) of landscape.5
3.2. Option 2: Construct a New Library The city of Oxnard has offered to fund the New Library option. The planned location in Oxnard is close to the ocean and out of the WUI zone. The new, LEED-certified RRPL would be built with fire-resistant materials and use a green design. The campus would span 100 acres and would house a museum and pavilion, similar to the current library campus. The current library campus in Simi Valley would be sold to a local university to serve as a new facility site.
4 LEED is a rating system for green buildings based on different aspects of sustainability. We assume that the new library would be built according to Level 3 Gold standards. 5 Estimates are derived from satellite imagery of the facility from Google Maps (Google, n.d.).
4
This publication is available free of charge from: https://doi.org/10.6028/N
IST.SP.1260
Assumptions
The following values are assumed for both alternative plans under consideration:
Planning horizon – 50 years
Wildfire recurrence – 40 years6
Real discount rate – 7 % (Congressional Research Service, 2016)
Value of a statistical life – 7 900 000 USD (Richmond, 2011)
Other key assumptions have been made to simplify this example and to help make it applicable to other similar locations and infrastructure. Please note that the values indicated below are illustrative and are not necessarily realistic and should not be considered prescriptive for any actual analysis.
• All one-time costs occur in year zero. Operation, Management, and Repair (OMR) costs repeat annually starting one year after beginning the retrofit and three years after beginning the new library construction.
• The effects of smaller wildfires that do not ignite the library itself are ignored in this analysis. The Easy Fire is not as significant because it did not have the potential to ignite the library itself. In more serious wildfires, the majority of buildings that ignite are completely destroyed (Quarrels and Pohl, 2018). Therefore, the wildfire events in which ignition occurs are the subject of this analysis.
• The analysis compares all proposed plans relative to the implicit option of doing nothing and maintaining the status quo.
• The RRPL in its initial state (status quo) is assumed to lack fire-resistant construction materials. Although some new measures are in place,7 the building was constructed in 1988, well before the stringent wildfire building codes adopted in 2008. The loss mitigation estimate is also greatly simplified by this assumption.
Data Inputs
5.1. Cost Data Direct costs of the retrofit plan include the materials and labor required to retrofit each part of the library. The per-unit costs, including the raw materials, demolition, and installation, are extrapolated from a case study presented by Headwaters Economics (Quarrels and Pohl, 2018). The wildfire retrofit will be applied to 112 292 sq/ft (10 432 sq/m) of rooftop area, 3 118 feet (950 meters) of roof perimeter, 40 534 sq/ft (3 766 sq/m) of exterior walls, and one-sixth of the 100 acre campus (67 448 sq/m).8 Meanwhile, the green retrofit will be applied to
6 Based on high risk of fire in the next 30 to 50 years (Cal Fire, 2020). 7 For example, one mitigating factor during the Easy Fire was that the library had recently cleared out dangerous brush around the campus. 8 The dimensions of the RRPL are estimated from satellite imagery.
5
This publication is available free of charge from: https://doi.org/10.6028/N
IST.SP.1260
all 243 000 sq/ft (22 575 sq/m) of building space at a cost of $ 7 per sq/ft (0.09 sq/m) (Lockwood, 2009).9 Simi Valley would assume the direct retrofit costs.
The indirect cost is the loss of admissions revenue during the renovation period. The library would be closed for about 30 weeks during renovation (Willer-Allred, 2009). Since the residents of Oxnard also benefit from access to the library, it is assumed that Oxnard will also experience 30 % of the indirect cost of downtime. These costs are listed in Table 3.
Table 3. Costs associated with retrofit for Simi Valley
Category Item Calculation Cost Direct Rooftop $ 15.88 / sq ft (0.09 sq/m) $ 1 727 514 Direct Roof Lining $ 45.55 / ft (0.30 m) $ 138 899 Direct Exterior Wall $ 30.18 / sq ft (0.09 sq/m) $ 1 223 478 Direct Landscaping $ 2.07 / sq ft (0.09 sq/m) $ 1 502 417 Direct Green Retrofit $ 7 / sq ft (0.09 sq/m) $ 1 701 000 Indirect Downtime $ 150 000 / week $ 4 500 000
The direct costs of the new library include the cost of constructing the buildings and the cost of purchasing the land. Since the new campus would host roughly the same infrastructure footprint as the current campus, the construction cost of the current library is used as a benchmark. Quarrels and Pohl (2018) estimate that a building with fire-resistant materials costs 2.35 % less than a building with typical materials. However, Katz (2013) finds that the median construction cost of a green building is 1.4 % greater than conventional buildings. Both costs adjustments are factored into the estimate. Meanwhile, Ocean-side land in Oxnard is estimated to cost about $100 000 per acre (Land Watch, n.d.). In addition, Oxnard would be partially responsible for sharing the operation costs of the new library. According to the RRPFI (2019), these costs amount to just over $2.5 M annually. The new green design would reduce these OMR costs by 14 % (Jones et al., 2018). Table 4 documents the costs imposed on Oxnard associated with the new library.
Table 4. Oxnard costs associated with new library
Category Item Calculation Cost Direct Building 99.01 % of original construction cost $ 100 003 219 Direct Land $ 100 000 / acre $ 10 000 000 OMR Operations 86 % of original OMR $ 2 173 991 per year
From the perspective of Simi Valley, there would be additional historical significance cost. The community takes great pride the library as they regularly receive prominent political figures and host the burial site of President Ronald Reagan and Nancy Reagan. Using Melchor’s (1985) historical value evaluation method, the private quarters of the library, which has a replacement value of about $ 6.7 million, are assigned a multiplication factor of 15 (RRPFI, 2019) The historical building assessment is presented in Appendix A.
9 Estimates range from $ 2 per sq/ft (0.09 sq/m) to $ 7 per sq/ft (0.09 sq/m). The higher estimate is adopted.
6
This publication is available free of charge from: https://doi.org/10.6028/N
IST.SP.1260
Meanwhile, Simi Valley would no longer be burdened with the library’s operation costs Simi Valley will also reduce costs by selling the current library’s campus. In line with similar sales in the past, a local university seeking to acquire new facilities would pay approximately $56 M for the current library (Newell, 2018). Table 5 outlines the costs associated with a new library for Simi Valley.
Table 5. Simi Valley costs associated with new library
Category Item Calculation Cost Direct Historical Value 15 x base valuation $ 100 982 814 Indirect Resale assumed ($ 56 500 000) OMR Operations full original cost ($ 2 527 897)
5.2. Benefit Data Retrofit
Event-Related Benefits (Benefits screen in EDGe$)
The retrofit plan would partially mitigate the losses incurred by a wildfire. Similar building codes have been estimated to reduce event-related losses by about 60 %, so this rate is assumed for direct and indirect losses (Reese, 2019). The plan is expected to only mitigate 20 % of response and recovery costs since the costs of evacuation, suppression, and aid are not as dependent on fire resistance. The retrofit is also expected to prevent one fatality. Table 6 lists these reductions.
Table 6. Reductions in wildfire losses for retrofit
Loss Category Loss Reduction Direct 60 % Indirect 60 % R&R 20 % Fatalities 1 life
Non-Disaster Related Benefits (Net Co-benefits / Resilience Dividend)
Fung and Helgeson (2017) define the resilience dividend as the net co-benefit (or co-cost) of investing in enhanced resilience, in the absence of a disruptive incident which accrues on the “day-to-day.”
Several non-wildfire benefits were determined to be co-benefits of planning for WUI; these accrue on the day-to-day, even in the absence of a wildfire. Studies show homeowners can recoup a substantial portion of retrofit costs through property values (Dumm, 2011). The premium is assumed to be about 25 % of the direct costs. Moreover, green retrofits have been shown to increase asset value by a conservative estimate of 6 % (Jones, 2018). In addition, the improved insulation would reduce environmental noise by 67.5 % (Booth, 2018). Each decibel reduction is associated with a one-time 0.1 % increase in overall property value (Becker and Doron, 2010).
7
This publication is available free of charge from: https://doi.org/10.6028/N
IST.SP.1260
The retrofit alternative will produce three distinct recurring co-benefits. First, the green retrofit and improved insulation for exterior windows and walls would improve energy efficiency, reducing operation costs by 14 % (Jones, 2018). Second, the materials used in the retrofit are more robust and would reduce the need for maintenance, further reducing operation costs by an assumed 10 % (Quarles and Pohl, 2018). Third, green buildings have improved thermal conditions and light which boost worker productivity by an average of $ 5.76 per sq/ft ($ 0.535 per sq/m) (Katz, 2003).
Finally, the retrofit project would create new jobs for Simi Valley’s economy. Approximately 82.57 % of project costs would be spent on local construction businesses (Horwitz, 2014). The California regional input output multiplier suggests that for each dollar spent on construction, 70 cents would be returned as earnings for workers10 (Baird et al., 2017). For local workers, approximately 57.8 % of construction spending is returned as earnings. Table 7 documents the NDRBs for Simi Valley.
Table 7. Simi Valley non-disaster related benefits for retrofit
Item Calculation Benefit Asset Value 50 % of wildfire retrofit cost, 6 %
overall asset value increase $ 6 463 709
Noise Reduction 0.1 % property value per decibel $ 1 298 550 Energy Savings 14 % of OMR $ 353 906 per year Maintenance Costs 10 % of OMR $ 252 790 per year Productivity $ 0.535 per meter2 ($ 0.050 per
ft.2) $ 1 399 680 per year
Construction Earnings 57.8 % of construction spending $ 5 374 805 For simplicity, Oxnard is assumed to not receive NDRBs from the retrofit plan. However, it would likely benefit from increased tourism and economic activity.
New Library
Event-Related Benefits (Benefits screen in EDGe$)
Oxnard has a marginal risk of wildfire because of flat terrain and limited vegetation (Roche, 2017). Relocating the library is assumed to fully mitigate the risk of damage inflicted by a wildfire. Realistically, the relocated library would still be subject to a risk of wildfires of lower frequency and magnitude, but there would be no risk of damage. These reductions are listed in Table 8.
Table 8. Reductions in wildfire losses for retrofit
Loss Category Loss Reduction Direct 100 % Indirect 100 %
10 Note that the full economic impact of construction can be estimated with a RIMs multiplier of 2.12, yielding a value of $175 M. Moreover, new workers would also pay property taxes to the city. For this analysis, we only considered earnings, which is a conservative estimate.
8
This publication is available free of charge from: https://doi.org/10.6028/N
IST.SP.1260
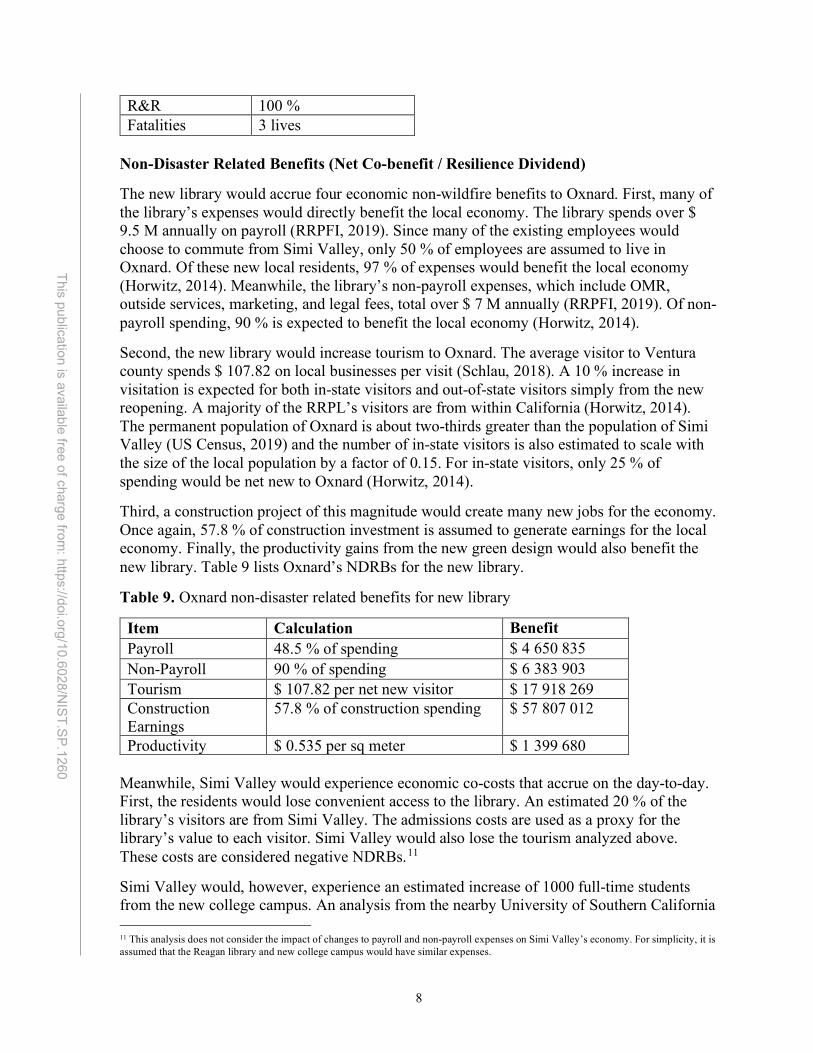
R&R 100 % Fatalities 3 lives
Non-Disaster Related Benefits (Net Co-benefit / Resilience Dividend)
The new library would accrue four economic non-wildfire benefits to Oxnard. First, many of the library’s expenses would directly benefit the local economy. The library spends over $ 9.5 M annually on payroll (RRPFI, 2019). Since many of the existing employees would choose to commute from Simi Valley, only 50 % of employees are assumed to live in Oxnard. Of these new local residents, 97 % of expenses would benefit the local economy (Horwitz, 2014). Meanwhile, the library’s non-payroll expenses, which include OMR, outside services, marketing, and legal fees, total over $ 7 M annually (RRPFI, 2019). Of non-payroll spending, 90 % is expected to benefit the local economy (Horwitz, 2014).
Second, the new library would increase tourism to Oxnard. The average visitor to Ventura county spends $ 107.82 on local businesses per visit (Schlau, 2018). A 10 % increase in visitation is expected for both in-state visitors and out-of-state visitors simply from the new reopening. A majority of the RRPL’s visitors are from within California (Horwitz, 2014). The permanent population of Oxnard is about two-thirds greater than the population of Simi Valley (US Census, 2019) and the number of in-state visitors is also estimated to scale with the size of the local population by a factor of 0.15. For in-state visitors, only 25 % of spending would be net new to Oxnard (Horwitz, 2014).
Third, a construction project of this magnitude would create many new jobs for the economy. Once again, 57.8 % of construction investment is assumed to generate earnings for the local economy. Finally, the productivity gains from the new green design would also benefit the new library. Table 9 lists Oxnard’s NDRBs for the new library.
Table 9. Oxnard non-disaster related benefits for new library
Item Calculation Benefit Payroll 48.5 % of spending $ 4 650 835 Non-Payroll 90 % of spending $ 6 383 903 Tourism $ 107.82 per net new visitor $ 17 918 269 Construction Earnings
57.8 % of construction spending $ 57 807 012
Productivity $ 0.535 per sq meter $ 1 399 680 Meanwhile, Simi Valley would experience economic co-costs that accrue on the day-to-day. First, the residents would lose convenient access to the library. An estimated 20 % of the library’s visitors are from Simi Valley. The admissions costs are used as a proxy for the library’s value to each visitor. Simi Valley would also lose the tourism analyzed above. These costs are considered negative NDRBs.11
Simi Valley would, however, experience an estimated increase of 1000 full-time students from the new college campus. An analysis from the nearby University of Southern California
11 This analysis does not consider the impact of changes to payroll and non-payroll expenses on Simi Valley’s economy. For simplicity, it is assumed that the Reagan library and new college campus would have similar expenses.
9
This publication is available free of charge from: https://doi.org/10.6028/N
IST.SP.1260
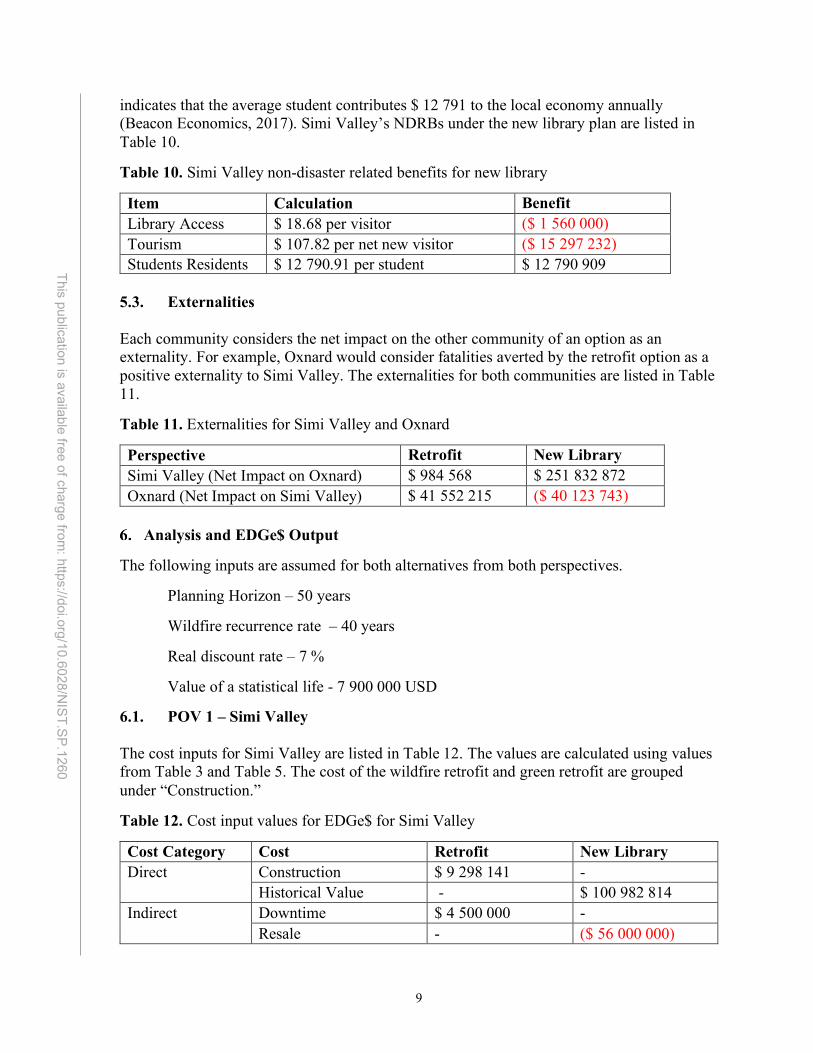
indicates that the average student contributes $ 12 791 to the local economy annually (Beacon Economics, 2017). Simi Valley’s NDRBs under the new library plan are listed in Table 10.
Table 10. Simi Valley non-disaster related benefits for new library
Item Calculation Benefit Library Access $ 18.68 per visitor ($ 1 560 000) Tourism $ 107.82 per net new visitor ($ 15 297 232) Students Residents $ 12 790.91 per student $ 12 790 909
5.3. Externalities Each community considers the net impact on the other community of an option as an externality. For example, Oxnard would consider fatalities averted by the retrofit option as a positive externality to Simi Valley. The externalities for both communities are listed in Table 11.
Table 11. Externalities for Simi Valley and Oxnard
Perspective Retrofit New Library Simi Valley (Net Impact on Oxnard) $ 984 568 $ 251 832 872 Oxnard (Net Impact on Simi Valley) $ 41 552 215 ($ 40 123 743)
Analysis and EDGe$ Output
The following inputs are assumed for both alternatives from both perspectives.
Planning Horizon – 50 years
Wildfire recurrence rate – 40 years
Real discount rate – 7 %
Value of a statistical life - 7 900 000 USD
6.1. POV 1 – Simi Valley The cost inputs for Simi Valley are listed in Table 12. The values are calculated using values from Table 3 and Table 5. The cost of the wildfire retrofit and green retrofit are grouped under “Construction.”
Table 12. Cost input values for EDGe$ for Simi Valley
Cost Category Cost Retrofit New Library Direct Construction $ 9 298 141 -
Historical Value - $ 100 982 814 Indirect Downtime $ 4 500 000 -
Resale - ($ 56 000 000)
10
This publication is available free of charge from: https://doi.org/10.6028/N
IST.SP.1260
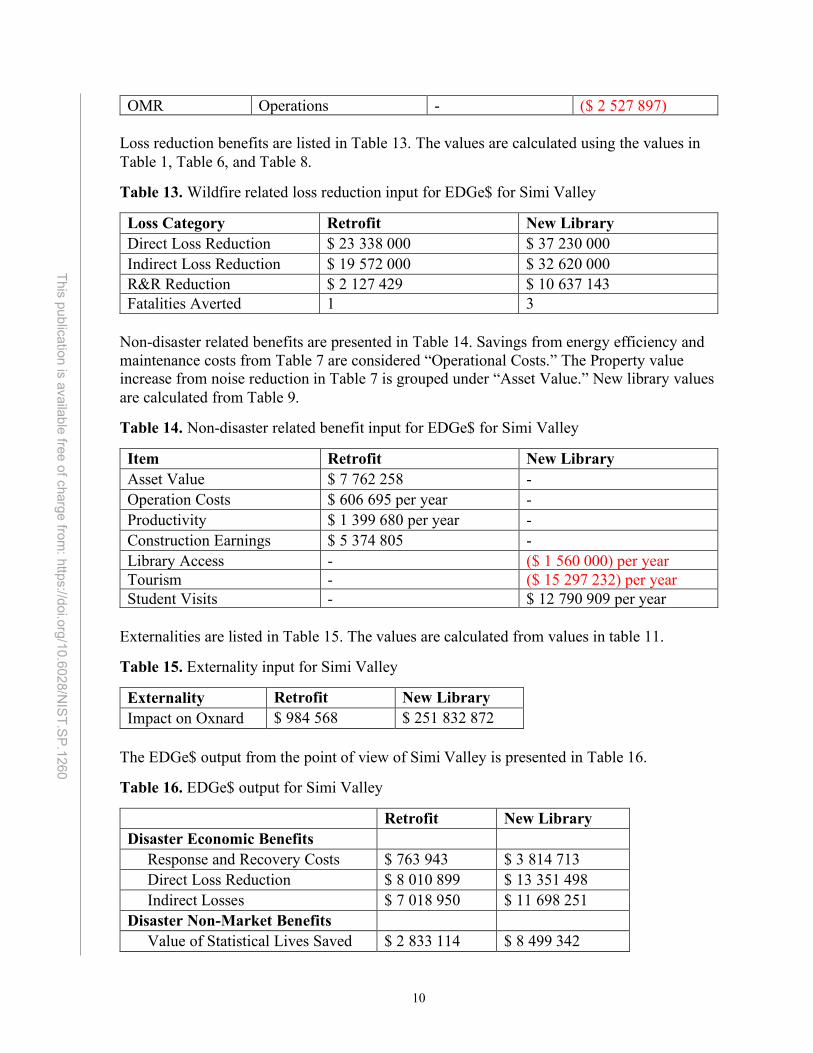
OMR Operations - ($ 2 527 897) Loss reduction benefits are listed in Table 13. The values are calculated using the values in Table 1, Table 6, and Table 8.
Table 13. Wildfire related loss reduction input for EDGe$ for Simi Valley
Loss Category Retrofit New Library Direct Loss Reduction $ 23 338 000 $ 37 230 000 Indirect Loss Reduction $ 19 572 000 $ 32 620 000 R&R Reduction $ 2 127 429 $ 10 637 143 Fatalities Averted 1 3
Non-disaster related benefits are presented in Table 14. Savings from energy efficiency and maintenance costs from Table 7 are considered “Operational Costs.” The Property value increase from noise reduction in Table 7 is grouped under “Asset Value.” New library values are calculated from Table 9.
Table 14. Non-disaster related benefit input for EDGe$ for Simi Valley
Item Retrofit New Library Asset Value $ 7 762 258 - Operation Costs $ 606 695 per year - Productivity $ 1 399 680 per year - Construction Earnings $ 5 374 805 - Library Access - ($ 1 560 000) per year Tourism - ($ 15 297 232) per year Student Visits - $ 12 790 909 per year
Externalities are listed in Table 15. The values are calculated from values in table 11.
Table 15. Externality input for Simi Valley
Externality Retrofit New Library Impact on Oxnard $ 984 568 $ 251 832 872
The EDGe$ output from the point of view of Simi Valley is presented in Table 16.
Table 16. EDGe$ output for Simi Valley
Retrofit New Library Disaster Economic Benefits
Response and Recovery Costs $ 763 943 $ 3 814 713 Direct Loss Reduction $ 8 010 899 $ 13 351 498 Indirect Losses $ 7 018 950 $ 11 698 251 Disaster Non-Market Benefits Value of Statistical Lives Saved $ 2 833 114 $ 8 499 342
11
This publication is available free of charge from: https://doi.org/10.6028/N
IST.SP.1260
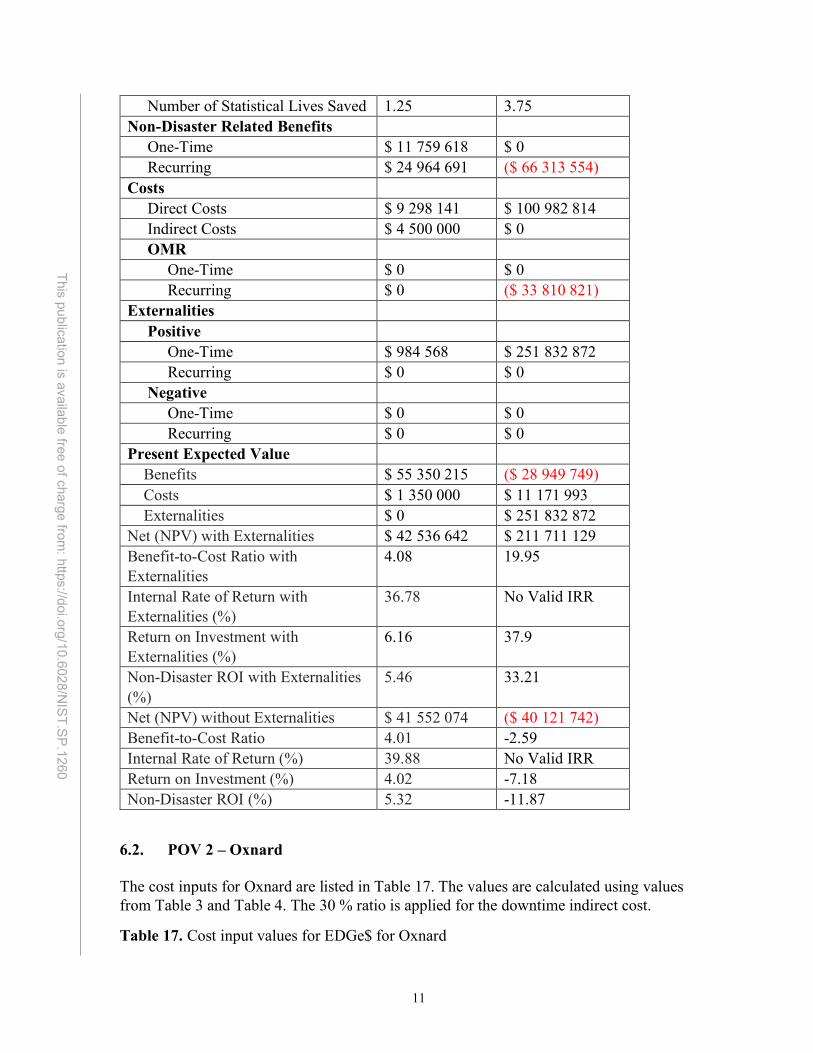
Number of Statistical Lives Saved 1.25 3.75 Non-Disaster Related Benefits One-Time $ 11 759 618 $ 0 Recurring $ 24 964 691 ($ 66 313 554) Costs Direct Costs $ 9 298 141 $ 100 982 814 Indirect Costs $ 4 500 000 $ 0 OMR One-Time $ 0 $ 0 Recurring $ 0 ($ 33 810 821) Externalities Positive One-Time $ 984 568 $ 251 832 872 Recurring $ 0 $ 0 Negative One-Time $ 0 $ 0 Recurring $ 0 $ 0 Present Expected Value Benefits $ 55 350 215 ($ 28 949 749) Costs $ 1 350 000 $ 11 171 993 Externalities $ 0 $ 251 832 872 Net (NPV) with Externalities $ 42 536 642 $ 211 711 129 Benefit-to-Cost Ratio with Externalities
4.08 19.95
Internal Rate of Return with Externalities (%)
36.78 No Valid IRR
Return on Investment with Externalities (%)
6.16 37.9
Non-Disaster ROI with Externalities (%)
5.46 33.21
Net (NPV) without Externalities $ 41 552 074 ($ 40 121 742) Benefit-to-Cost Ratio 4.01 -2.59 Internal Rate of Return (%) 39.88 No Valid IRR Return on Investment (%) 4.02 -7.18 Non-Disaster ROI (%) 5.32 -11.87
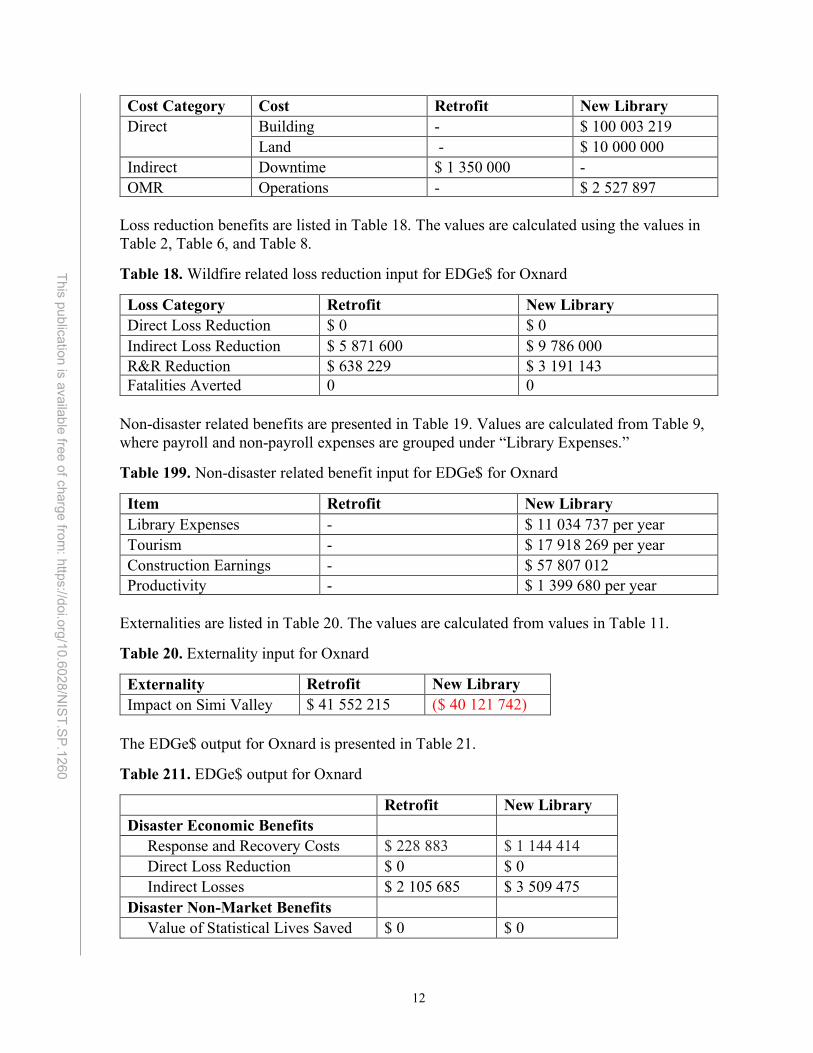
6.2. POV 2 – Oxnard The cost inputs for Oxnard are listed in Table 17. The values are calculated using values from Table 3 and Table 4. The 30 % ratio is applied for the downtime indirect cost.
Table 17. Cost input values for EDGe$ for Oxnard
12
This publication is available free of charge from: https://doi.org/10.6028/N
IST.SP.1260
Cost Category Cost Retrofit New Library Direct Building - $ 100 003 219
Land - $ 10 000 000 Indirect Downtime $ 1 350 000 - OMR Operations - $ 2 527 897
Loss reduction benefits are listed in Table 18. The values are calculated using the values in Table 2, Table 6, and Table 8.
Table 18. Wildfire related loss reduction input for EDGe$ for Oxnard
Loss Category Retrofit New Library Direct Loss Reduction $ 0 $ 0 Indirect Loss Reduction $ 5 871 600 $ 9 786 000 R&R Reduction $ 638 229 $ 3 191 143 Fatalities Averted 0 0
Non-disaster related benefits are presented in Table 19. Values are calculated from Table 9, where payroll and non-payroll expenses are grouped under “Library Expenses.”
Table 199. Non-disaster related benefit input for EDGe$ for Oxnard
Item Retrofit New Library Library Expenses - $ 11 034 737 per year Tourism - $ 17 918 269 per year Construction Earnings - $ 57 807 012 Productivity - $ 1 399 680 per year
Externalities are listed in Table 20. The values are calculated from values in Table 11.
Table 20. Externality input for Oxnard
Externality Retrofit New Library Impact on Simi Valley $ 41 552 215 ($ 40 121 742)
The EDGe$ output for Oxnard is presented in Table 21.
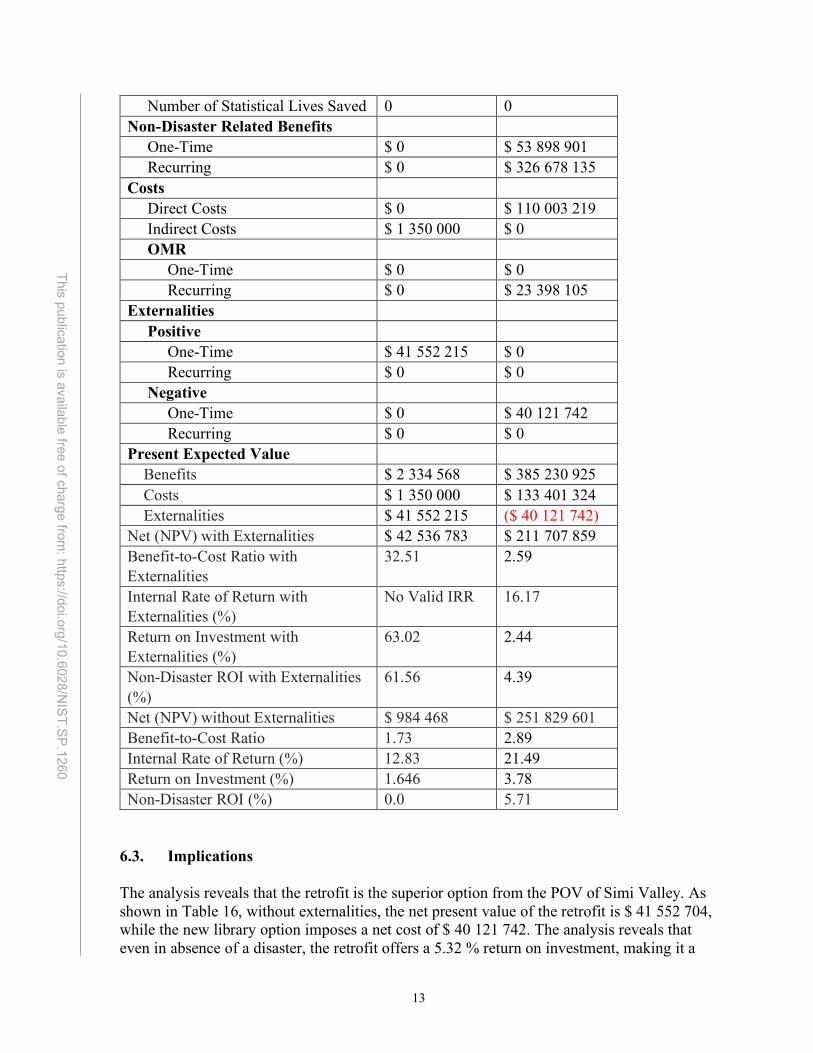
Table 211. EDGe$ output for Oxnard
Retrofit New Library Disaster Economic Benefits
Response and Recovery Costs $ 228 883 $ 1 144 414 Direct Loss Reduction $ 0 $ 0 Indirect Losses $ 2 105 685 $ 3 509 475 Disaster Non-Market Benefits Value of Statistical Lives Saved $ 0 $ 0
13
This publication is available free of charge from: https://doi.org/10.6028/N
IST.SP.1260
Number of Statistical Lives Saved 0 0 Non-Disaster Related Benefits One-Time $ 0 $ 53 898 901 Recurring $ 0 $ 326 678 135 Costs Direct Costs $ 0 $ 110 003 219 Indirect Costs $ 1 350 000 $ 0 OMR One-Time $ 0 $ 0 Recurring $ 0 $ 23 398 105 Externalities Positive One-Time $ 41 552 215 $ 0 Recurring $ 0 $ 0 Negative One-Time $ 0 $ 40 121 742 Recurring $ 0 $ 0 Present Expected Value Benefits $ 2 334 568 $ 385 230 925 Costs $ 1 350 000 $ 133 401 324 Externalities $ 41 552 215 ($ 40 121 742) Net (NPV) with Externalities $ 42 536 783 $ 211 707 859 Benefit-to-Cost Ratio with Externalities
32.51 2.59
Internal Rate of Return with Externalities (%)
No Valid IRR 16.17
Return on Investment with Externalities (%)
63.02 2.44
Non-Disaster ROI with Externalities (%)
61.56 4.39
Net (NPV) without Externalities $ 984 468 $ 251 829 601 Benefit-to-Cost Ratio 1.73 2.89 Internal Rate of Return (%) 12.83 21.49 Return on Investment (%) 1.646 3.78 Non-Disaster ROI (%) 0.0 5.71
6.3. Implications The analysis reveals that the retrofit is the superior option from the POV of Simi Valley. As shown in Table 16, without externalities, the net present value of the retrofit is $ 41 552 704, while the new library option imposes a net cost of $ 40 121 742. The analysis reveals that even in absence of a disaster, the retrofit offers a 5.32 % return on investment, making it a
14
This publication is available free of charge from: https://doi.org/10.6028/N
IST.SP.1260
safe investment. Meanwhile, even if the new library incurred no costs, the tourism and lost access co-costs independently offset the benefit.
For Oxnard, the preferred option hinges on whether externalities are considered. Without externalities, the net present value of the retrofit is only $ 984 468 and the net present value of the library is over $ 251 M, as shown in Table 21. The new library would also produce a higher benefit-to-cost ratio of 2.89 versus the 1.73 benefit-to-cost ratio of the retrofit. Relocating the library would therefore be the preferred option.
However, if both communities consider externalities, then they reach the same assessment of net present value. The retrofit has a net present value of $ 42 536 783, while the new library has a net present value of $ 211 707 859. When externalities are considered, the retrofit is also the preferred option for Oxnard, since the benefit-to-cost ratio is a 32.51.
For county decision makers, these results suggest that the retrofit plan would be the better option. The new library would be difficult to justify for Simi Valley because it imposes a serious net cost, whereas the retrofit yields a favorable benefit-to-cost ratio for both communities, especially when externalities are considered.
EDGe$ Tool Online Walkthrough
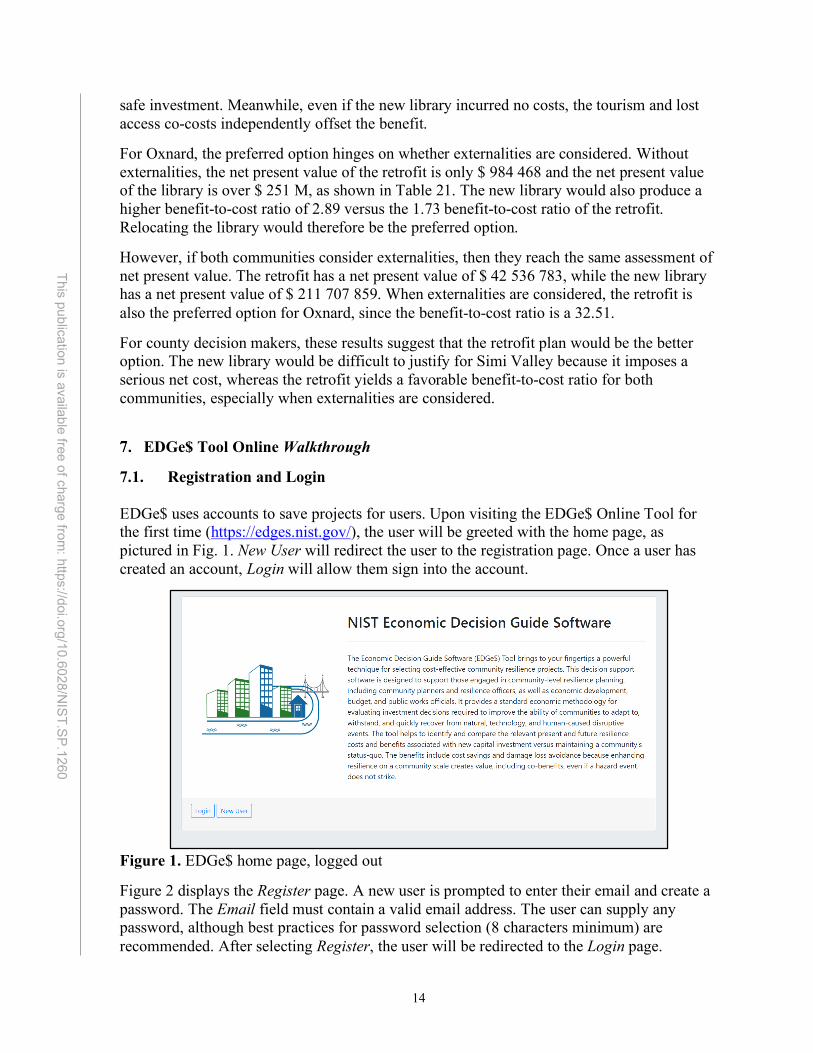
7.1. Registration and Login EDGe$ uses accounts to save projects for users. Upon visiting the EDGe$ Online Tool for the first time (https://edges.nist.gov/), the user will be greeted with the home page, as pictured in Fig. 1. New User will redirect the user to the registration page. Once a user has created an account, Login will allow them sign into the account.
Figure 1. EDGe$ home page, logged out
Figure 2 displays the Register page. A new user is prompted to enter their email and create a password. The Email field must contain a valid email address. The user can supply any password, although best practices for password selection (8 characters minimum) are recommended. After selecting Register, the user will be redirected to the Login page.
15
This publication is available free of charge from: https://doi.org/10.6028/N
IST.SP.1260
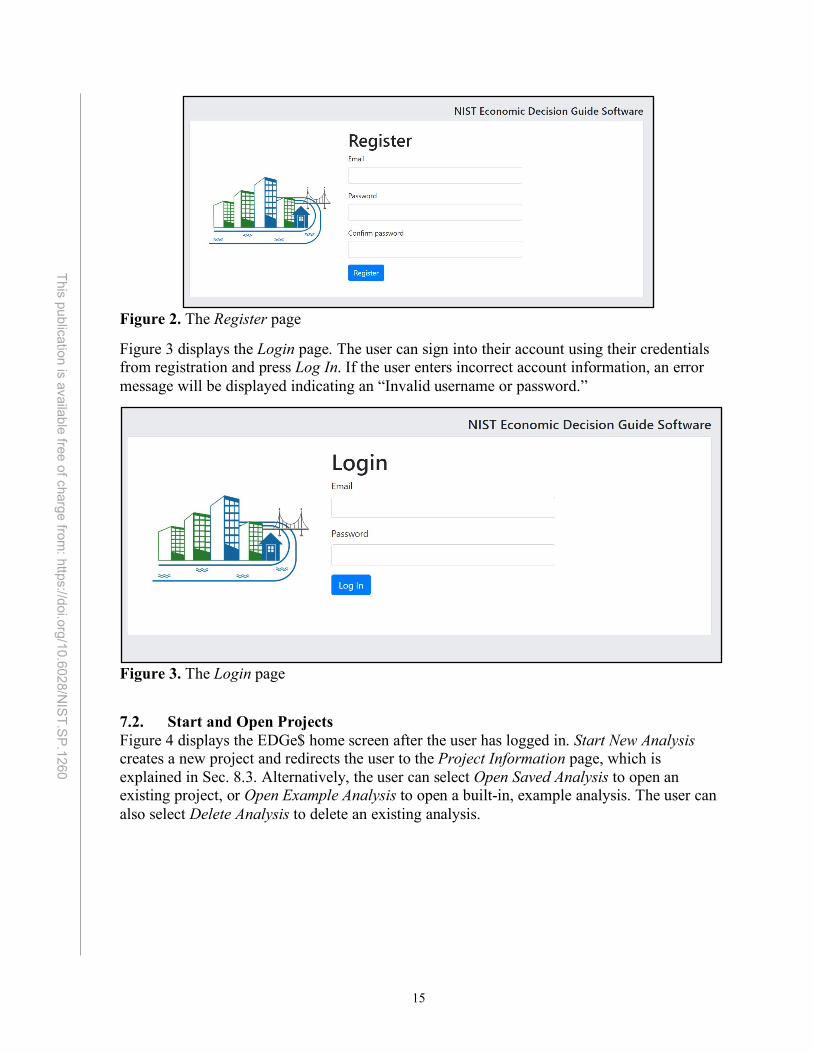
Figure 2. The Register page
Figure 3 displays the Login page. The user can sign into their account using their credentials from registration and press Log In. If the user enters incorrect account information, an error message will be displayed indicating an “Invalid username or password.”
Figure 3. The Login page
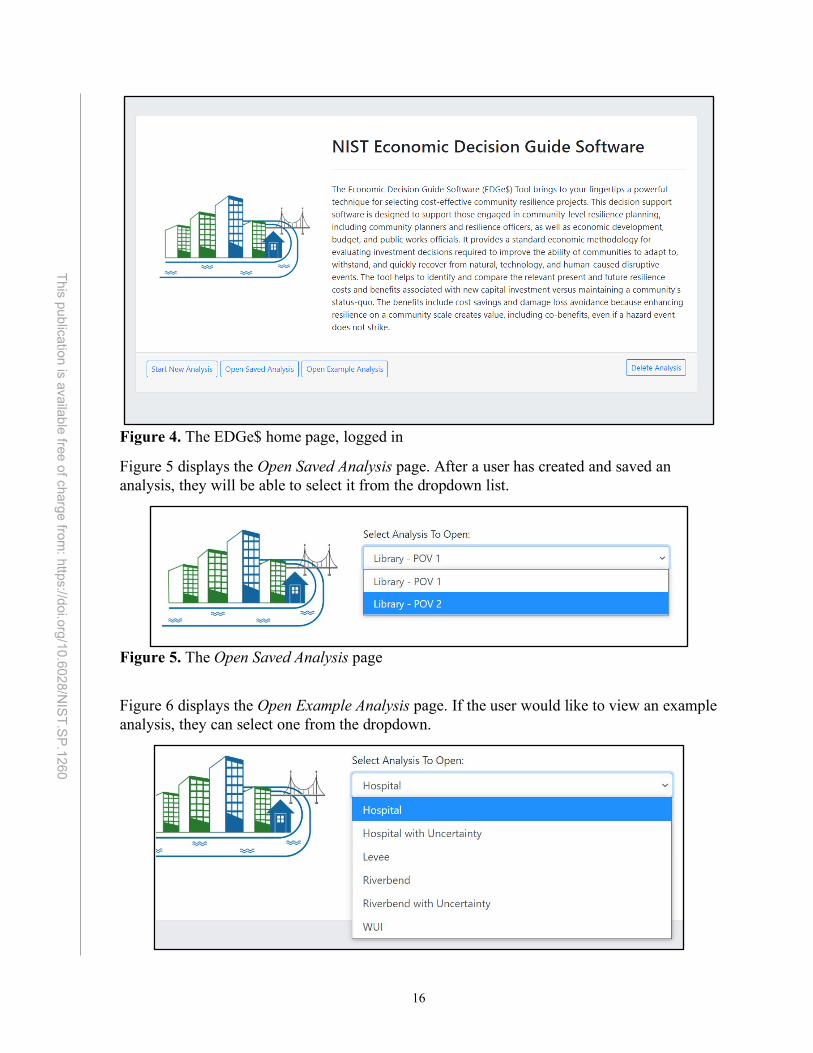
7.2. Start and Open Projects Figure 4 displays the EDGe$ home screen after the user has logged in. Start New Analysis creates a new project and redirects the user to the Project Information page, which is explained in Sec. 8.3. Alternatively, the user can select Open Saved Analysis to open an existing project, or Open Example Analysis to open a built-in, example analysis. The user can also select Delete Analysis to delete an existing analysis.
16
This publication is available free of charge from: https://doi.org/10.6028/N
IST.SP.1260
Figure 4. The EDGe$ home page, logged in
Figure 5 displays the Open Saved Analysis page. After a user has created and saved an analysis, they will be able to select it from the dropdown list.
Figure 5. The Open Saved Analysis page
Figure 6 displays the Open Example Analysis page. If the user would like to view an example analysis, they can select one from the dropdown.
17
This publication is available free of charge from: https://doi.org/10.6028/N
IST.SP.1260
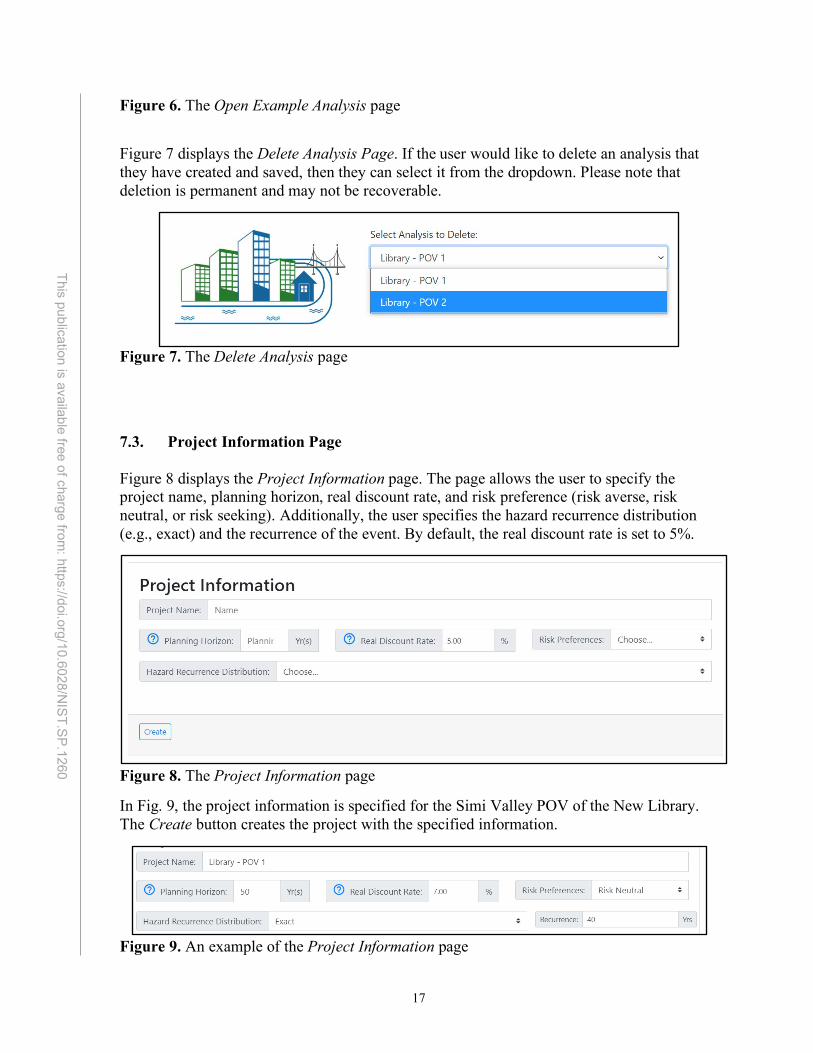
Figure 6. The Open Example Analysis page
Figure 7 displays the Delete Analysis Page. If the user would like to delete an analysis that they have created and saved, then they can select it from the dropdown. Please note that deletion is permanent and may not be recoverable.
Figure 7. The Delete Analysis page
7.3. Project Information Page Figure 8 displays the Project Information page. The page allows the user to specify the project name, planning horizon, real discount rate, and risk preference (risk averse, risk neutral, or risk seeking). Additionally, the user specifies the hazard recurrence distribution (e.g., exact) and the recurrence of the event. By default, the real discount rate is set to 5%.
Figure 8. The Project Information page
In Fig. 9, the project information is specified for the Simi Valley POV of the New Library. The Create button creates the project with the specified information.
Figure 9. An example of the Project Information page
18
This publication is available free of charge from: https://doi.org/10.6028/N
IST.SP.1260
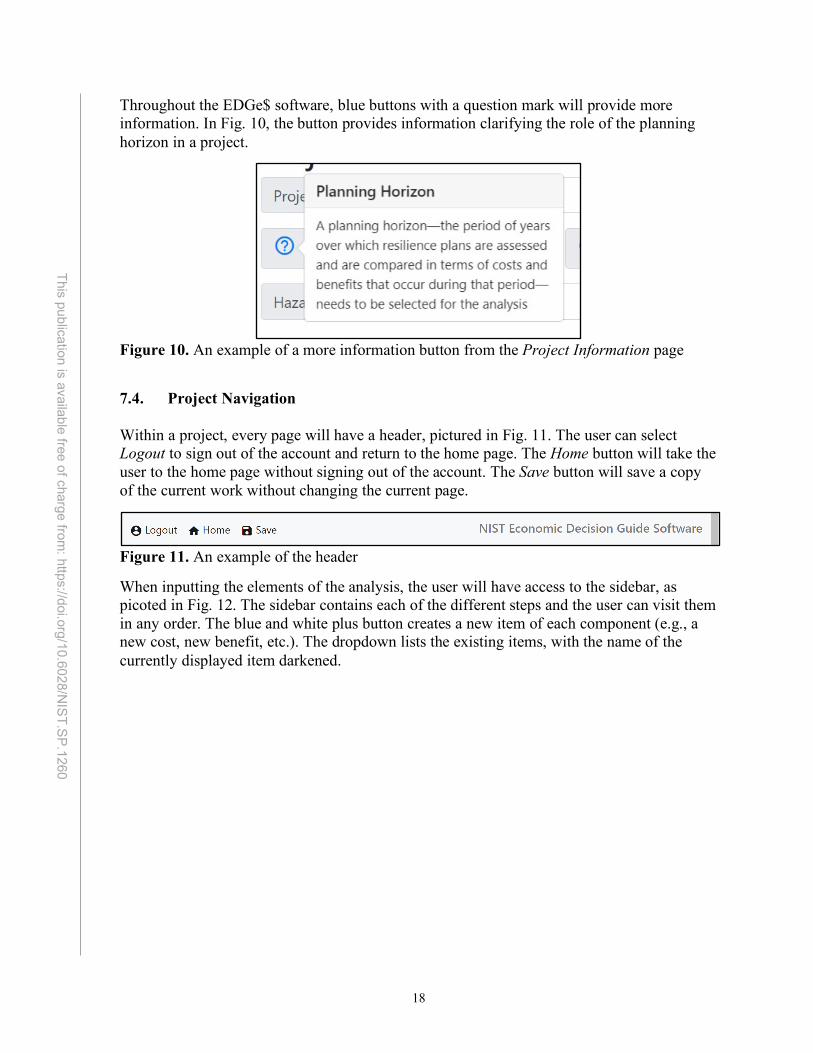
Throughout the EDGe$ software, blue buttons with a question mark will provide more information. In Fig. 10, the button provides information clarifying the role of the planning horizon in a project.
Figure 10. An example of a more information button from the Project Information page
7.4. Project Navigation Within a project, every page will have a header, pictured in Fig. 11. The user can select Logout to sign out of the account and return to the home page. The Home button will take the user to the home page without signing out of the account. The Save button will save a copy of the current work without changing the current page.
Figure 11. An example of the header
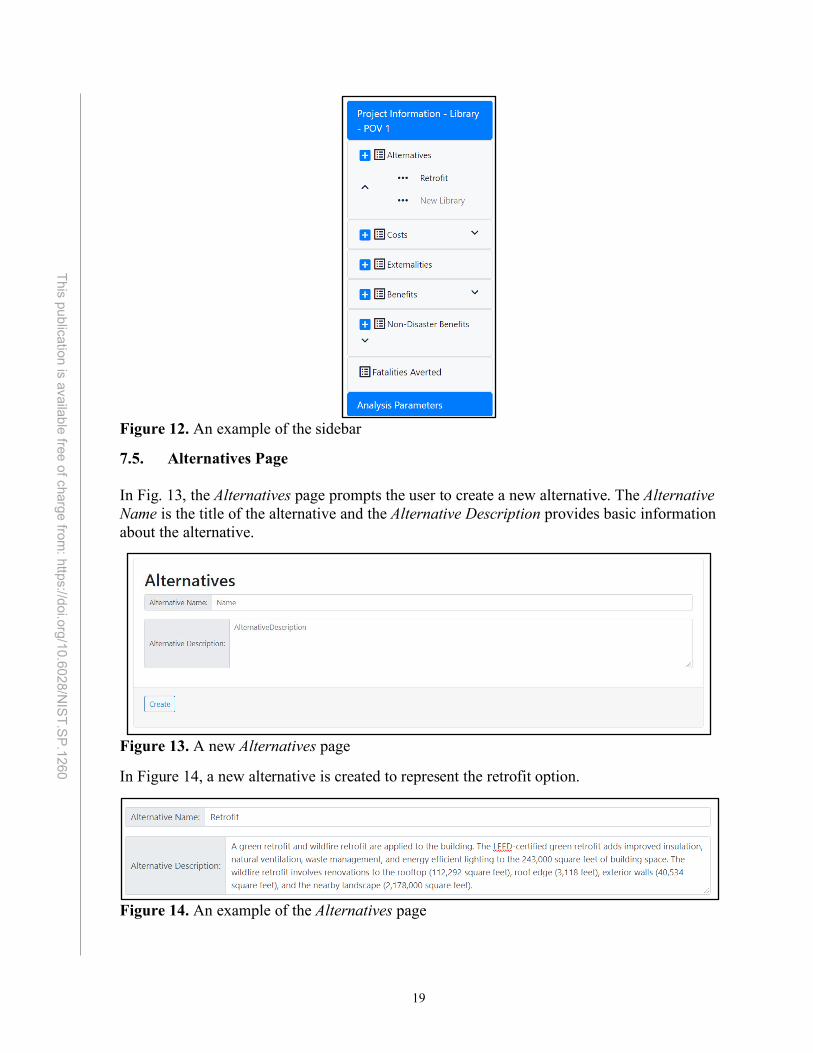
When inputting the elements of the analysis, the user will have access to the sidebar, as picoted in Fig. 12. The sidebar contains each of the different steps and the user can visit them in any order. The blue and white plus button creates a new item of each component (e.g., a new cost, new benefit, etc.). The dropdown lists the existing items, with the name of the currently displayed item darkened.
19
This publication is available free of charge from: https://doi.org/10.6028/N
IST.SP.1260
Figure 12. An example of the sidebar
7.5. Alternatives Page In Fig. 13, the Alternatives page prompts the user to create a new alternative. The Alternative Name is the title of the alternative and the Alternative Description provides basic information about the alternative.
Figure 13. A new Alternatives page
In Figure 14, a new alternative is created to represent the retrofit option.
Figure 14. An example of the Alternatives page
20
This publication is available free of charge from: https://doi.org/10.6028/N
IST.SP.1260
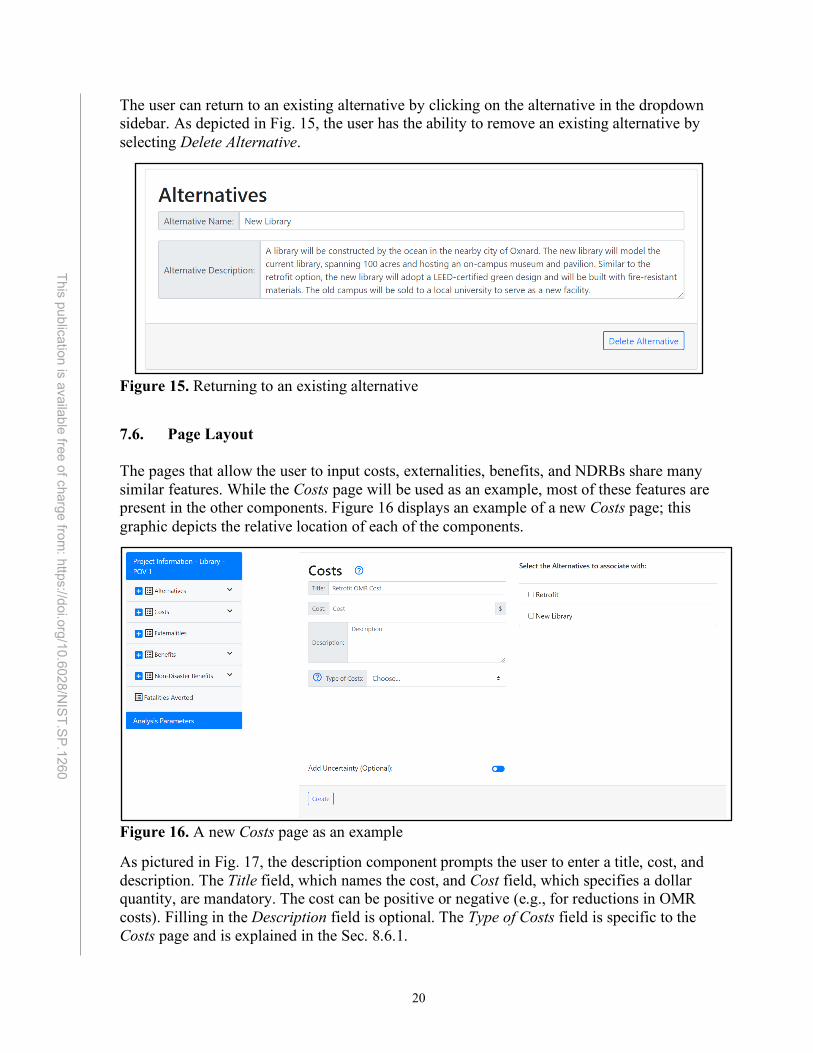
The user can return to an existing alternative by clicking on the alternative in the dropdown sidebar. As depicted in Fig. 15, the user has the ability to remove an existing alternative by selecting Delete Alternative.
Figure 15. Returning to an existing alternative
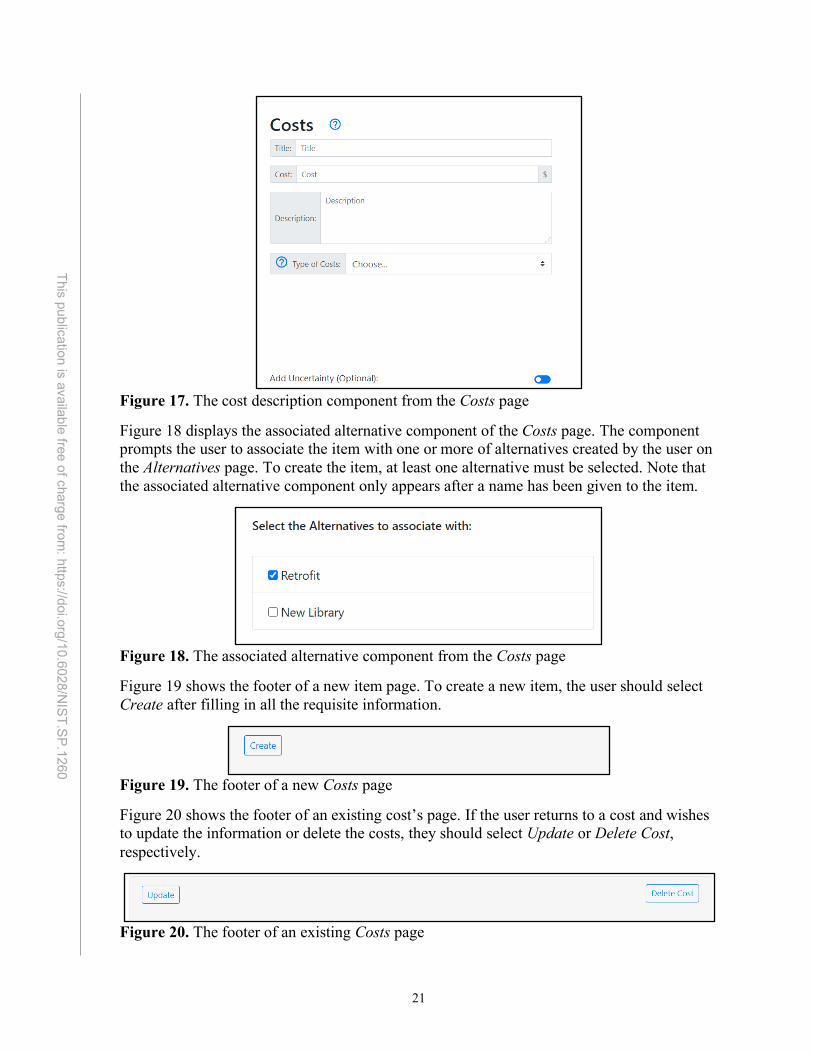
7.6. Page Layout The pages that allow the user to input costs, externalities, benefits, and NDRBs share many similar features. While the Costs page will be used as an example, most of these features are present in the other components. Figure 16 displays an example of a new Costs page; this graphic depicts the relative location of each of the components.
Figure 16. A new Costs page as an example
As pictured in Fig. 17, the description component prompts the user to enter a title, cost, and description. The Title field, which names the cost, and Cost field, which specifies a dollar quantity, are mandatory. The cost can be positive or negative (e.g., for reductions in OMR costs). Filling in the Description field is optional. The Type of Costs field is specific to the Costs page and is explained in the Sec. 8.6.1.
21
This publication is available free of charge from: https://doi.org/10.6028/N
IST.SP.1260
Figure 17. The cost description component from the Costs page
Figure 18 displays the associated alternative component of the Costs page. The component prompts the user to associate the item with one or more of alternatives created by the user on the Alternatives page. To create the item, at least one alternative must be selected. Note that the associated alternative component only appears after a name has been given to the item.
Figure 18. The associated alternative component from the Costs page
Figure 19 shows the footer of a new item page. To create a new item, the user should select Create after filling in all the requisite information.
Figure 19. The footer of a new Costs page
Figure 20 shows the footer of an existing cost’s page. If the user returns to a cost and wishes to update the information or delete the costs, they should select Update or Delete Cost, respectively.
Figure 20. The footer of an existing Costs page
22
This publication is available free of charge from: https://doi.org/10.6028/N
IST.SP.1260
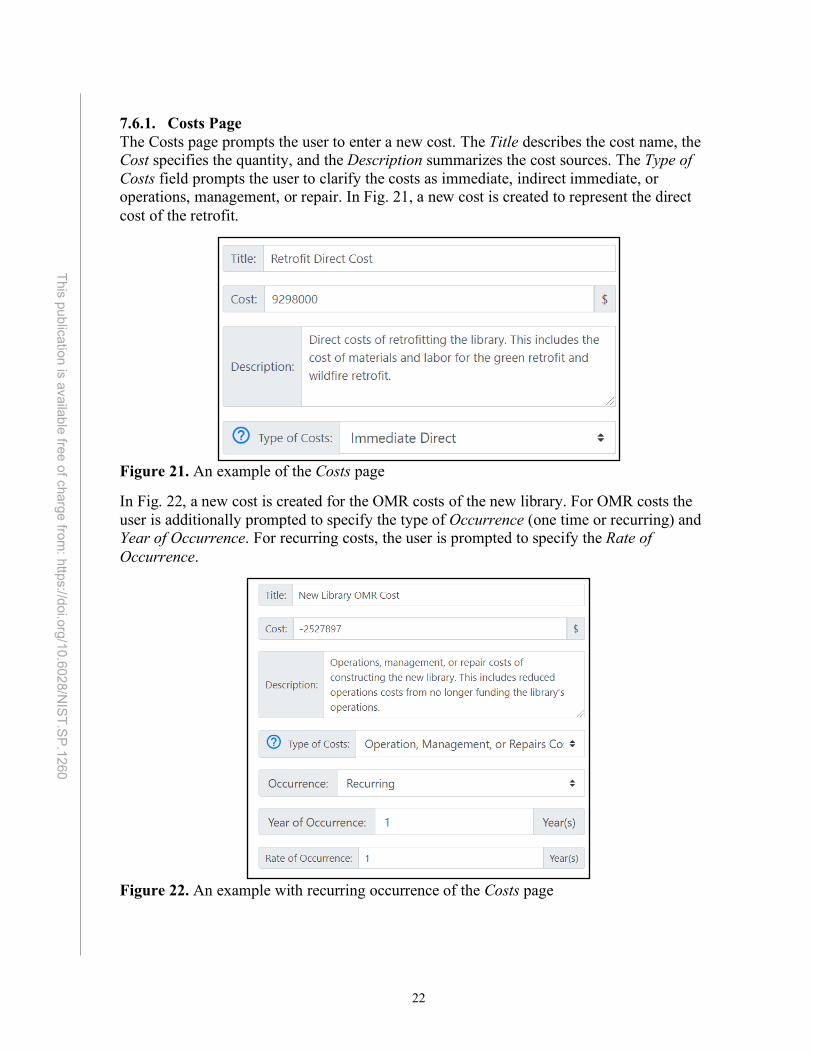
7.6.1. Costs Page The Costs page prompts the user to enter a new cost. The Title describes the cost name, the Cost specifies the quantity, and the Description summarizes the cost sources. The Type of Costs field prompts the user to clarify the costs as immediate, indirect immediate, or operations, management, or repair. In Fig. 21, a new cost is created to represent the direct cost of the retrofit.
Figure 21. An example of the Costs page
In Fig. 22, a new cost is created for the OMR costs of the new library. For OMR costs the user is additionally prompted to specify the type of Occurrence (one time or recurring) and Year of Occurrence. For recurring costs, the user is prompted to specify the Rate of Occurrence.
Figure 22. An example with recurring occurrence of the Costs page
23
This publication is available free of charge from: https://doi.org/10.6028/N
IST.SP.1260
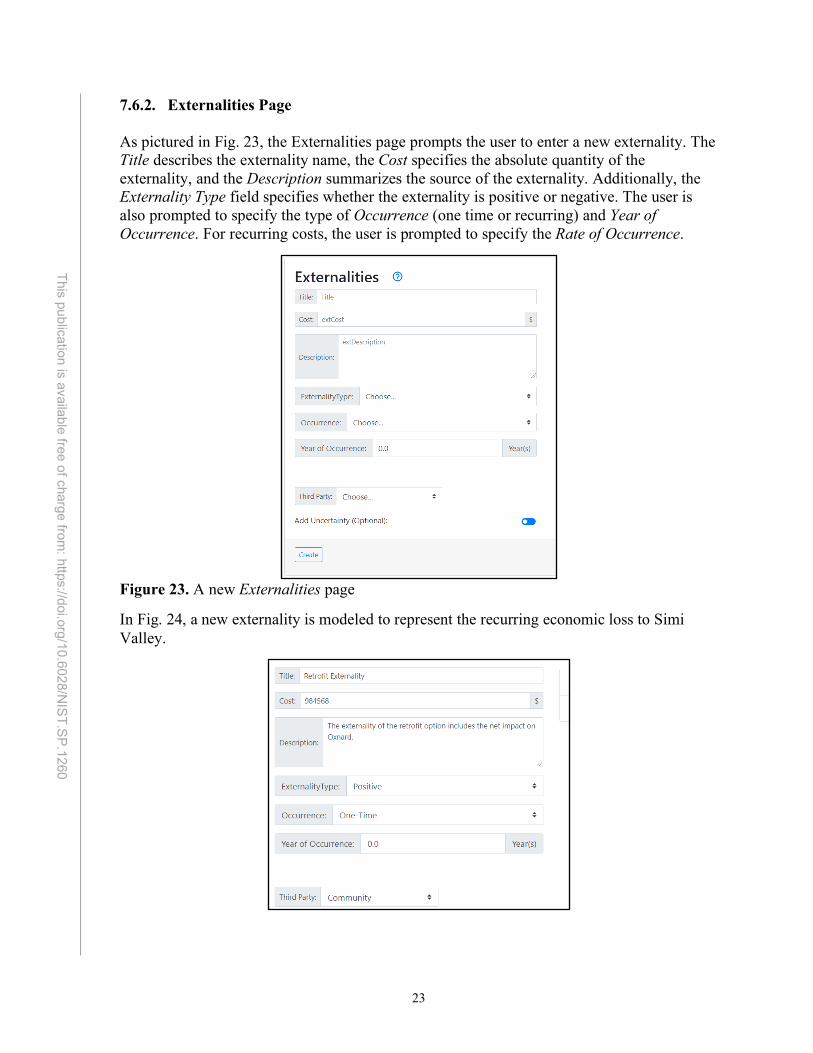
7.6.2. Externalities Page As pictured in Fig. 23, the Externalities page prompts the user to enter a new externality. The Title describes the externality name, the Cost specifies the absolute quantity of the externality, and the Description summarizes the source of the externality. Additionally, the Externality Type field specifies whether the externality is positive or negative. The user is also prompted to specify the type of Occurrence (one time or recurring) and Year of Occurrence. For recurring costs, the user is prompted to specify the Rate of Occurrence.
Figure 23. A new Externalities page
In Fig. 24, a new externality is modeled to represent the recurring economic loss to Simi Valley.
24
This publication is available free of charge from: https://doi.org/10.6028/N
IST.SP.1260
Figure 24. An example for the Externalities page
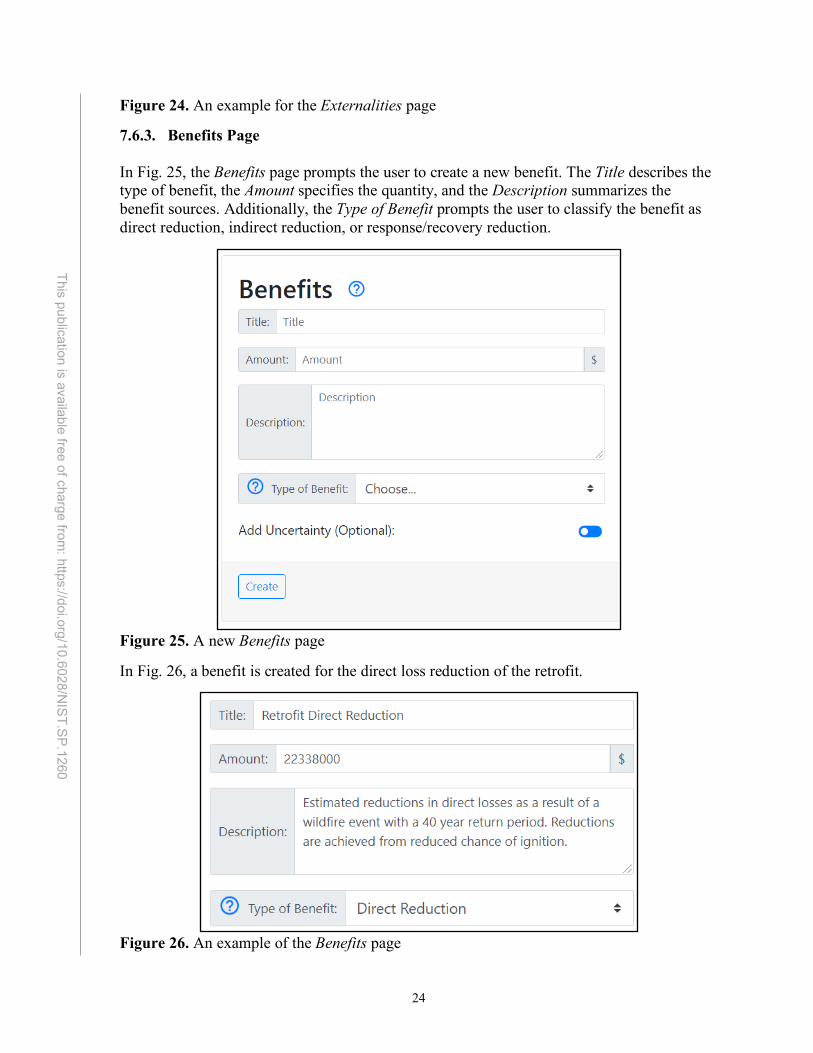
7.6.3. Benefits Page In Fig. 25, the Benefits page prompts the user to create a new benefit. The Title describes the type of benefit, the Amount specifies the quantity, and the Description summarizes the benefit sources. Additionally, the Type of Benefit prompts the user to classify the benefit as direct reduction, indirect reduction, or response/recovery reduction.
Figure 25. A new Benefits page
In Fig. 26, a benefit is created for the direct loss reduction of the retrofit.
Figure 26. An example of the Benefits page
25
This publication is available free of charge from: https://doi.org/10.6028/N
IST.SP.1260
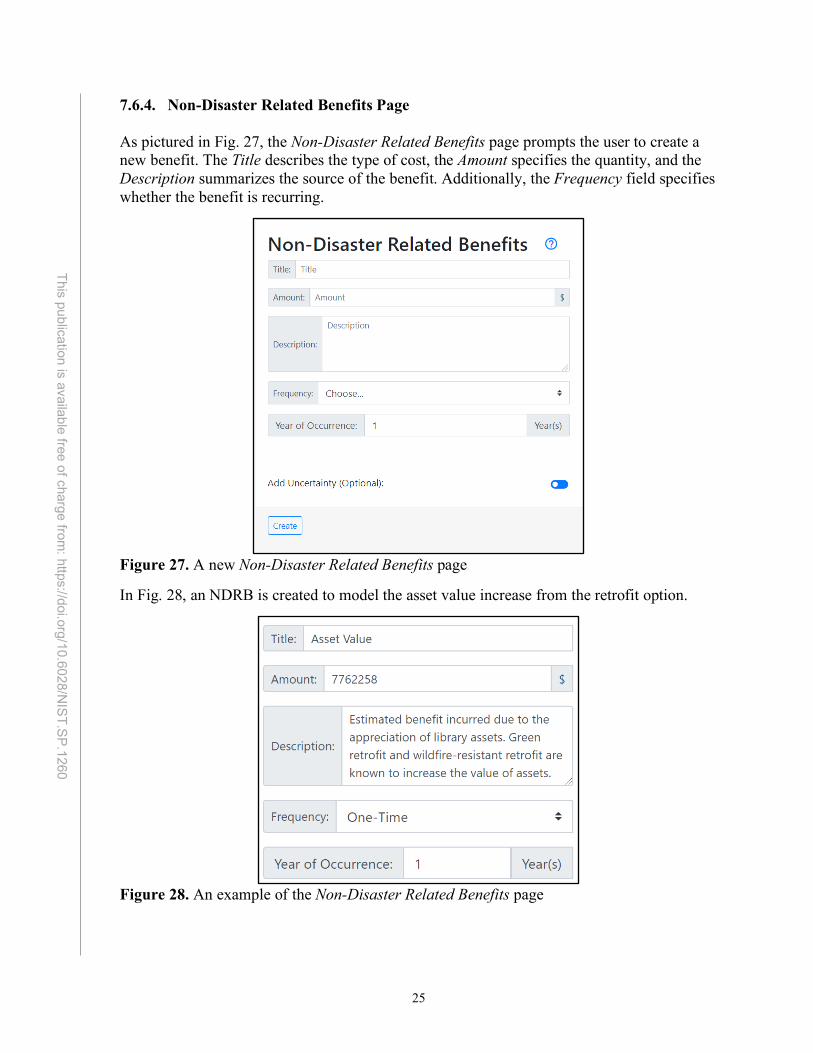
7.6.4. Non-Disaster Related Benefits Page As pictured in Fig. 27, the Non-Disaster Related Benefits page prompts the user to create a new benefit. The Title describes the type of cost, the Amount specifies the quantity, and the Description summarizes the source of the benefit. Additionally, the Frequency field specifies whether the benefit is recurring.
Figure 27. A new Non-Disaster Related Benefits page
In Fig. 28, an NDRB is created to model the asset value increase from the retrofit option.
Figure 28. An example of the Non-Disaster Related Benefits page
26
This publication is available free of charge from: https://doi.org/10.6028/N
IST.SP.1260
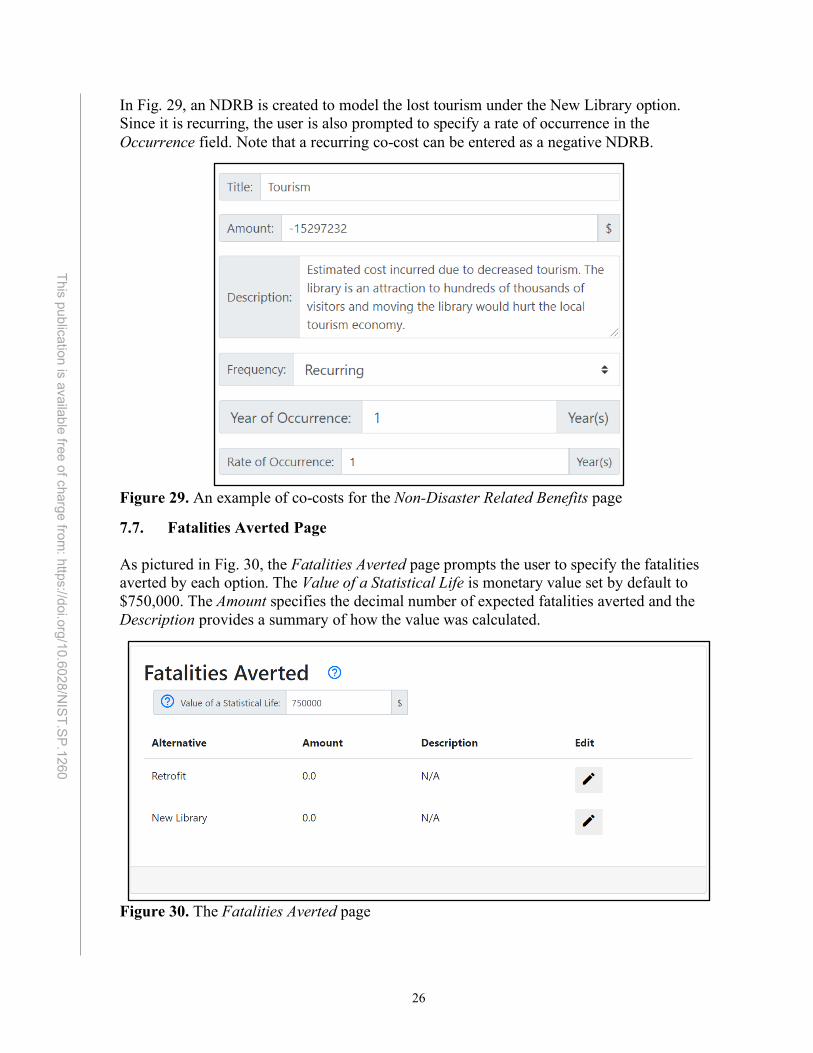
In Fig. 29, an NDRB is created to model the lost tourism under the New Library option. Since it is recurring, the user is also prompted to specify a rate of occurrence in the Occurrence field. Note that a recurring co-cost can be entered as a negative NDRB.
Figure 29. An example of co-costs for the Non-Disaster Related Benefits page
7.7. Fatalities Averted Page As pictured in Fig. 30, the Fatalities Averted page prompts the user to specify the fatalities averted by each option. The Value of a Statistical Life is monetary value set by default to $750,000. The Amount specifies the decimal number of expected fatalities averted and the Description provides a summary of how the value was calculated.
Figure 30. The Fatalities Averted page
27
This publication is available free of charge from: https://doi.org/10.6028/N
IST.SP.1260
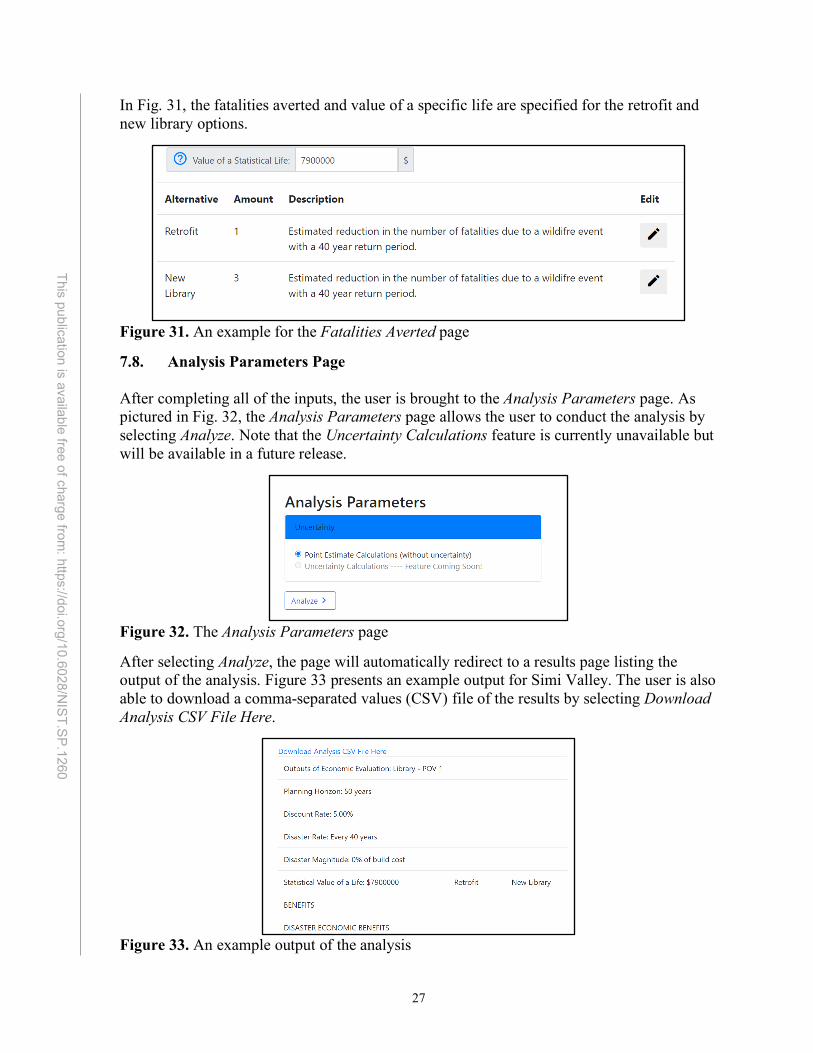
In Fig. 31, the fatalities averted and value of a specific life are specified for the retrofit and new library options.
Figure 31. An example for the Fatalities Averted page
7.8. Analysis Parameters Page After completing all of the inputs, the user is brought to the Analysis Parameters page. As pictured in Fig. 32, the Analysis Parameters page allows the user to conduct the analysis by selecting Analyze. Note that the Uncertainty Calculations feature is currently unavailable but will be available in a future release.
Figure 32. The Analysis Parameters page
After selecting Analyze, the page will automatically redirect to a results page listing the output of the analysis. Figure 33 presents an example output for Simi Valley. The user is also able to download a comma-separated values (CSV) file of the results by selecting Download Analysis CSV File Here.
Figure 33. An example output of the analysis
28
This publication is available free of charge from: https://doi.org/10.6028/N
IST.SP.1260
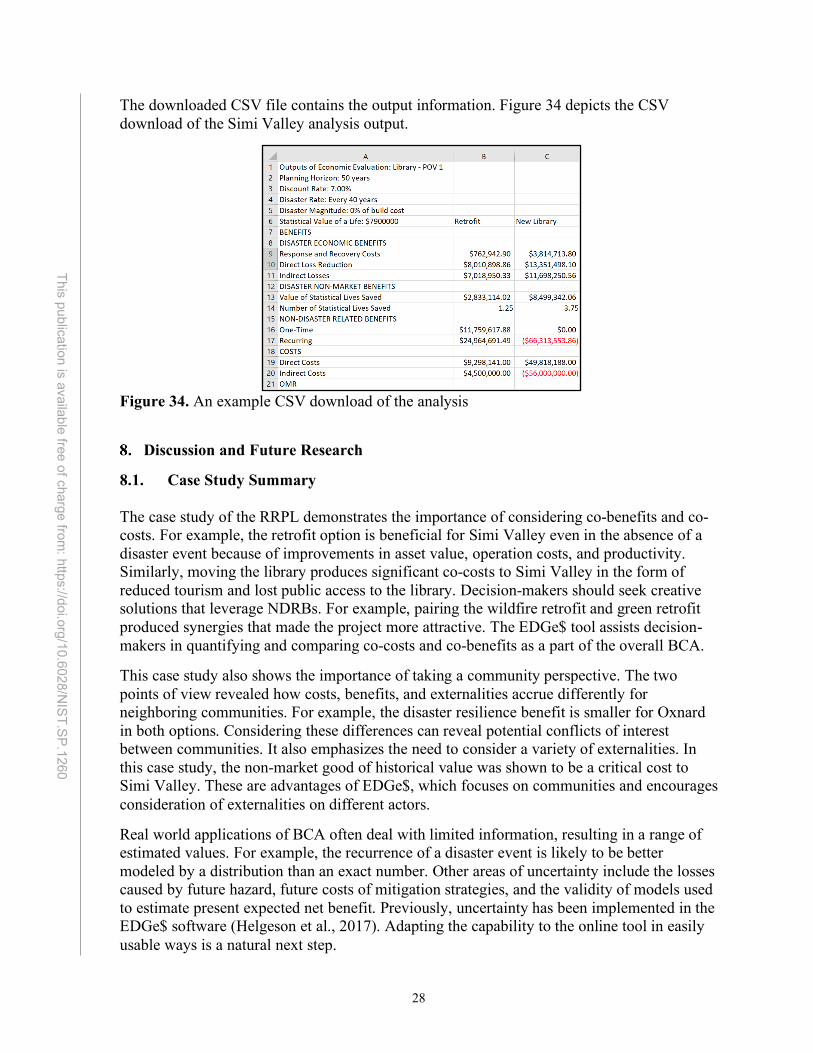
The downloaded CSV file contains the output information. Figure 34 depicts the CSV download of the Simi Valley analysis output.
Figure 34. An example CSV download of the analysis
Discussion and Future Research
8.1. Case Study Summary The case study of the RRPL demonstrates the importance of considering co-benefits and co-costs. For example, the retrofit option is beneficial for Simi Valley even in the absence of a disaster event because of improvements in asset value, operation costs, and productivity. Similarly, moving the library produces significant co-costs to Simi Valley in the form of reduced tourism and lost public access to the library. Decision-makers should seek creative solutions that leverage NDRBs. For example, pairing the wildfire retrofit and green retrofit produced synergies that made the project more attractive. The EDGe$ tool assists decision-makers in quantifying and comparing co-costs and co-benefits as a part of the overall BCA.
This case study also shows the importance of taking a community perspective. The two points of view revealed how costs, benefits, and externalities accrue differently for neighboring communities. For example, the disaster resilience benefit is smaller for Oxnard in both options. Considering these differences can reveal potential conflicts of interest between communities. It also emphasizes the need to consider a variety of externalities. In this case study, the non-market good of historical value was shown to be a critical cost to Simi Valley. These are advantages of EDGe$, which focuses on communities and encourages consideration of externalities on different actors.
Real world applications of BCA often deal with limited information, resulting in a range of estimated values. For example, the recurrence of a disaster event is likely to be better modeled by a distribution than an exact number. Other areas of uncertainty include the losses caused by future hazard, future costs of mitigation strategies, and the validity of models used to estimate present expected net benefit. Previously, uncertainty has been implemented in the EDGe$ software (Helgeson et al., 2017). Adapting the capability to the online tool in easily usable ways is a natural next step.
29
This publication is available free of charge from: https://doi.org/10.6028/N
IST.SP.1260
8.2. A Note: Benefit Cost Analysis in Context Benefit cost analysis evaluates the strengths and weaknesses of alternatives by comparing the benefits against the cost of each alternative. In conducting a BCA, the objective is to identify the option which maximizes public welfare. As a result, BCA often involves non-market goods, such as health, environmental quality, and social values. In resilience planning, these non-market goods take the form of leisure time, ecosystem services, and amenities.
Two related accounting frameworks are economic impact analysis (EIA) and financial impact analysis (FIA). EIA and FIA differ from BCA because they have limited impact scope. EIA assesses future economic growth within a distinct region, while FIA assesses the expenditures and revenue projections for key stakeholders. While these frameworks are useful for finding differential impacts, BCA is more fit for resilience planning, where a range of benefits and externalities are relevant. Another distinction is that a BCA discounts future benefits and costs, reflecting the greater productivity of a current dollar.
Another framework is cost-effectiveness analysis (CEA). CEA identifies the least-cost option for achieving a specific output level (e.g., 10 % reduction in flood risk). CEA is common in resilience planning, where decision-makers are often instructed to focus exclusively on mitigating disaster risk.
However, because CEA is constrained in scope, it is unable to reach an optimal decision when the specific output level does not include all factors relevant to public welfare (Zerbe and Scott, 2015). In resilience planning, CEA often fails to account for various co-benefits unrelated to the primary objective, leading to the undervaluation of resilience projects (Fung and Helgeson, 2017).
Recently, multiple criteria analysis (MCA) has been introduced as an alternative to BCA that better accounts for co-benefits. MCA explicitly considers multiple, possibly conflicting objectives and encourages the involvement of stakeholders. Qualitative frameworks for MCA have been introduced for seismic resilience projects (Azadi et al., 2019), urban flood planning (Alves et al., 2018), wildfire planning (Miller, 2017), sustainable land use (Li et al., 2019), and climate mitigation and development (Cohen et al., 2019).
More recently, “fuzzy” MCA frameworks have been introduced. Giordano et al. (2020) use fuzzy cognitive maps to detect and analyze tradeoffs between co-benefits. Pagano et al. (2019) use these maps to build system dynamics models, which can evaluate the ways in which different elements simultaneously influence one another.
Ellen et al. (2016) argues that, compared to BCA, these MCA approaches are “more participatory, transparent, comprehensive, rigorous, and scenario-driven.” In practice, however, MCA frameworks tend to provide little guidance to decision-makers beyond limited case studies (Fung and Helgeson, 2017). Moreover, since few ex ante tools are available to decisionmakers, MCA remains mostly academic (Bhardwaj et al., 2019). While system dynamics can yield important insights, it is still only semi-quantitative and useful mainly for identifying relative importance. Overall, MCA is useful for identifying opportunities and values but lacks replicability and rigor.
30
This publication is available free of charge from: https://doi.org/10.6028/N
IST.SP.1260
BCA remains essential to the selection stage of a resilience project. Unfortunately, BCA is limited in prevalence and is often relegated to ex-post evaluation (World Bank, 2010). Part of this is due to the absence of a simple, flexible framework for BCA in resilience planning. For small-scale communities, full-scale BCA can be costly and confusing. Thus, tools such as EDGe$ Online help to fill this gap.
31
This publication is available free of charge from: https://doi.org/10.6028/N
IST.SP.1260
References
Alves A, et al (2018) Multi-criteria approach for selection of green and grey infrastructure to reduce flood risk and increase co-benefits. Water Resources Management 32(7):2505–2522. ASTM International. E3130-18 Standard Guide for Developing Cost-Effective Community Resilience Strategies. West Conshohocken, PA; ASTM International, 2018. doi: https://doi.org/10.1520/E3130-18 Azadi E (2019) "Multi-Criteria Decision-Making for Seismic 2 Resilience and Sustainability Assessment of 3 Diagrid Buildings." Journal of Structural Engineering 191:229–246. Bhardwaj A, et al (2019) More priorities, more problems? Decision-making with multiple energy, development and climate objectives. Energy Research & Social Science 49:143–157. Baird MD, Keating EG, Bogdan O, Resnick AC (2017) The Effects of Travel and Tourism on California’s Economy. RAND Corporation. Beacon Economics (2017) Economic and Social Impact Analysis. Available at https://about.usc.edu/files/2017/03/USC_EIR_FINAL.pdf Cal Fire (2020) California Fire Hazard Severity Zone Viewer. California State Geoportal. Available at https://gis.data.ca.gov/datasets/789d5286736248f69c4515c04f58f414 Cohen B et al (2019) Multi-criteria decision analysis in policy-making for climate mitigation and development. Climate and Development, 11(3): 212–222. Congressional Research Service (2016) Discount Rates in the Economic Evaluation of U.S. Army Corps of Engineers Projects. 44594. Available at https://crsreports.congress.gov/product/pdf/R/R44594/4 Dumm RE, Sirmans GS, Smersh G (2011) The Capitalization of Building Codes in House Prices. J Real Estate Finan Econ 42:30–50. Ellen IG, et al (2016) Planning For An Uncertain Future: Can Multi-Criteria Analysis Support Better Decision-Making In Climate Planning? Journal of Planning Education and Research. Fung J.F, J.F. Helgeson (2017) Defining the Resilience Dividend: Accounting for Co-benefits of Resilience Planning. NIST Technical Note 1959. Enriquez S (1987) Ventura County Site Picked for Reagan Library. Los Angeles Times. Foerch A. (2020) Shutdown Costs Reagan Library $150,000 a Week in Lost Revenue. San Fernand Valley Business Journal. Available at:
32
This publication is available free of charge from: https://doi.org/10.6028/N
IST.SP.1260
https://www.sfvbj.com/news/2020/mar/31/shutdown-costs-reagan-library-150000-week-lost-rev/ Gilbert WS, D.T. Butry, J.F. Helgeson, R.E. Chapman. Community Resilience Economic Decision Guide for Buildings and Infrastructure Systems. NIST Special Publication 1197. Giordano R, Pluchinotta I, Pagano A, Scrieciu A, Nanu F. (2020). Enhancing nature-based solutions acceptance through stakeholders' engagement in co-benefits identification and trade-offs analysis. Science of The Total Environment 136552 Google (n.d.-b). Ronald Reagan Presidential Library. Available at https://goo.gl/maps/Q8cS1aGYn5GFD8WA8 Helgeson, J.F., D.H. Webb, and S.A. Grubb SA (2017) The Economic Decision Guide Software (EDGeS) Tool. NIST Special Publication 1214. Horwitz J (2014) The Economic Impact of the Barack Obama Presidential Library in Chicago. Anderson Economic Group. Available at https://www.andersoneconomicgroup.com/Portals/0/UofC_PresLibrary_FINAL.pdf Jones SA et al. (2018) World Green Building Trends 2018. SmartMarket Report. Available at: https://www.worldgbc.org/sites/default/files/World%20Green%20Building%20Trends%202018%20SMR%20FINAL%2010-11.pdf Katz GH (2003) Green Building Costs and Financial Benefits. Capital E. Available at http://staging.community-wealth.org/sites/clone.community-wealth.org/files/downloads/paper-kats.pdf Kats GH (2013) Greening our built world: costs, benefits, and strategies, (IslandPress). Land Watch (n.d.) Oxnard, CA Land for Sale. Available at https://www.landwatch.com/California_land_for_sale/Oxnard Li Q et al (2019) Multifactor-based environmental risk assessment for sustainable land-use planning in Shenzhen, China. Science of the Total Environment 657. Lockwood C (2009) Building Retro. Urban Land. Available at https://www.esbnyc.com/sites/default/files/uli_building_retro_fits.pdf Mega ER (2019) The battle to rebuild centuries of science after an epic inferno. Nature. Available at https://www.nature.com/articles/d41586-019-02141-2 Melchor MS (1985) Evaluation Method for Historic Buildings: The Chesopiean. A Journal of North American Archaeology 23(2).
33
This publication is available free of charge from: https://doi.org/10.6028/N
IST.SP.1260
Miller SR (2017). Planning for Wildfire in the Wildland-Urban Interface: A Guide for Western Communities. Urban Lawyer 49:207–215.
Newell S (2018) Mt. San Jacinto College buys two Temecula buildings for $56 M. The Press Enterprise. Available at https://www.pe.com/2018/03/20/mt-san-jacinto-college-buys-two-temecula-buildings-for-56-M/ Quarles S, Pohl K (2018) Building a Wildfire-Resistant Home: Codes and Costs. Headwater Economics. Available at https://headwaterseconomics.org/wp-content/uploads/building-costs-codes-report.pdf Reese P (2019) Dissecting data: Pinpointing houses threatened by wildfire. Associated Press. Available at https://apnews.com/e688e34240bb4217a13d9ddbe5062ffe Richmond H (2011) EPA: A human life is worth $7.9 M. Grist. Ronald Reagan Presidential Foundation and Institute (2019) Financial Statements. Available at https://www.reaganfoundation.org/media/355497/financial-statements-rrpfi-9-30-19.pdf Roche KM (2017) Community Risk Assessment & Standards of Cover Report of the Oxnard Fire Department. FACETS Consulting. Sanchez R, Chan S. (2019) “Wildfire caused $500,000 in damage at Reagan Presidential Library.” CNN. Available at https://www.cnn.com/2019/11/19/us/california-easy-fire-reagan-library-damage/index.html Schlau L (2018) Visitor Profile and Economic and Fiscal Impacts of Ventura Tourism in 2017 for California Ventura. Lauren Schlau Consulting. Available at https://www.cityofventura.ca.gov/DocumentCenter/View/13670/VVCB-2017-Econ-Fiscal-Impact-Study Siemens (2015) Fire protection in historical buildings and museums. Available at https://www.downloads.siemens.com/download-center/Download.aspx?pos=download&fct=getasset&id1=A6V10562738 Syphard AD, Keeley JE, Massada AB, Brennan TJ, Radeloff, VC (2012) Housing arrangement and location determine the likelihood of housing loss due to wildfire. PloS one 7(3). Willer-Allred M (2009) Reagan Library exhibits to close for renovations. Ventura County Star. Available at http://archive.vcstar.com/news/reagan-library-exhibits-to-close-for-renovations-ep-371413185-350692131.html/ US Census (2019) Quickfacts. Available at https://www.census.gov/quickfacts Zerbe RO, Scott T (2015) A Primer for Understanding Benefit-Cost Analysis. (Edward Elgar Publishing Inc).
34
This publication is available free of charge from: https://doi.org/10.6028/N
IST.SP.1260
Appendix A: Historical Building Evaluation
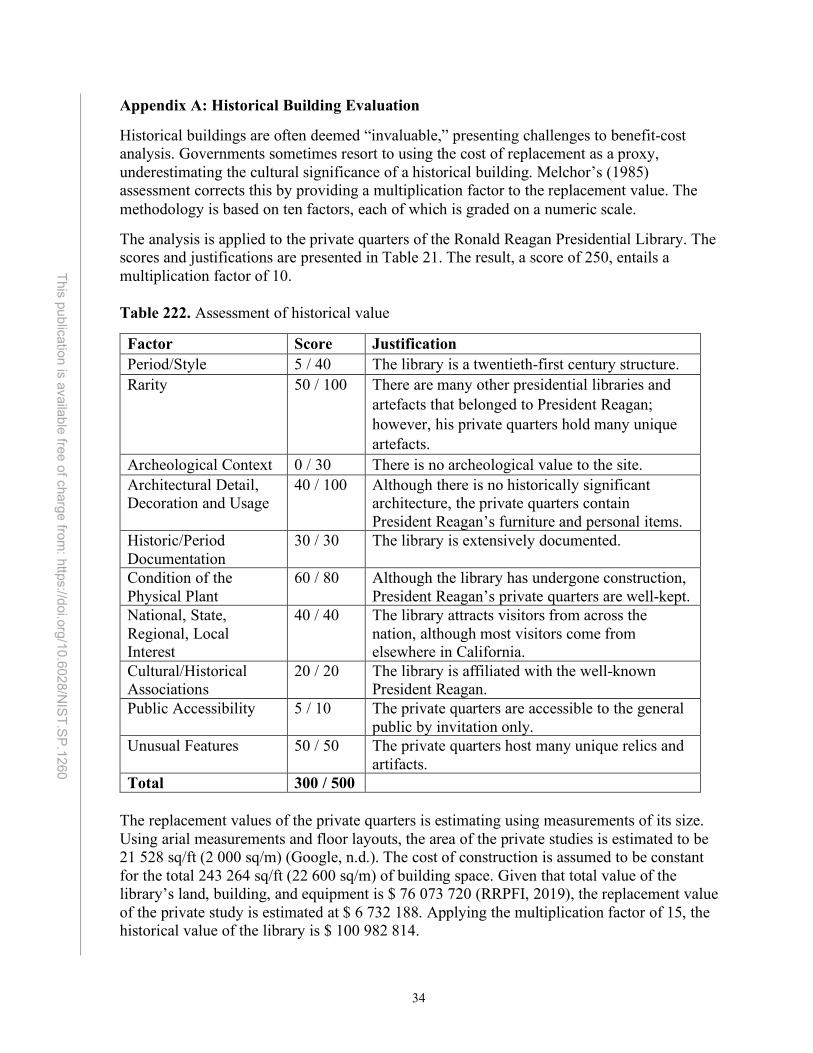
Historical buildings are often deemed “invaluable,” presenting challenges to benefit-cost analysis. Governments sometimes resort to using the cost of replacement as a proxy, underestimating the cultural significance of a historical building. Melchor’s (1985) assessment corrects this by providing a multiplication factor to the replacement value. The methodology is based on ten factors, each of which is graded on a numeric scale.
The analysis is applied to the private quarters of the Ronald Reagan Presidential Library. The scores and justifications are presented in Table 21. The result, a score of 250, entails a multiplication factor of 10. Table 222. Assessment of historical value
Factor Score Justification Period/Style 5 / 40 The library is a twentieth-first century structure. Rarity 50 / 100 There are many other presidential libraries and
artefacts that belonged to President Reagan; however, his private quarters hold many unique artefacts.
Archeological Context 0 / 30 There is no archeological value to the site. Architectural Detail, Decoration and Usage
40 / 100 Although there is no historically significant architecture, the private quarters contain President Reagan’s furniture and personal items.
Historic/Period Documentation
30 / 30 The library is extensively documented.
Condition of the Physical Plant
60 / 80 Although the library has undergone construction, President Reagan’s private quarters are well-kept.
National, State, Regional, Local Interest
40 / 40 The library attracts visitors from across the nation, although most visitors come from elsewhere in California.
Cultural/Historical Associations
20 / 20 The library is affiliated with the well-known President Reagan.
Public Accessibility 5 / 10 The private quarters are accessible to the general public by invitation only.
Unusual Features 50 / 50 The private quarters host many unique relics and artifacts.
Total 300 / 500 The replacement values of the private quarters is estimating using measurements of its size. Using arial measurements and floor layouts, the area of the private studies is estimated to be 21 528 sq/ft (2 000 sq/m) (Google, n.d.). The cost of construction is assumed to be constant for the total 243 264 sq/ft (22 600 sq/m) of building space. Given that total value of the library’s land, building, and equipment is $ 76 073 720 (RRPFI, 2019), the replacement value of the private study is estimated at $ 6 732 188. Applying the multiplication factor of 15, the historical value of the library is $ 100 982 814.